impact of the global food crisis on the poor: what is the … · 2013-04-16 · impact of the...
TRANSCRIPT

Impact of the global food crisis on the poor: what is the evidence?
Julia Compton, Steve Wiggins and Sharada Keats
* Disclaimer: The views presented in this paper are those of the authors
and do not necessarily represent the views of DFID
Overseas Development Institute
111 Westminster Bridge Road
London SE1 7JD
UK
Tel: +44 (0)20 7922 0300
Fax: +44 (0)20 7922 0399
www.odi.org.uk

i
Acknowledgements
The authors are very grateful to Issa Sanogo and Joyce Luma of WFP for all their help at various
stages with this paper. Also thanks to David Dawe from FAO, as well as to everyone who attended
the January 2010 workshop at ODI on country responses to the food price crisis, for extremely
productive discussions. We also thank Derek Headey of IFPRI and those others who kindly shared
advance copies of their works in progress. Thanks also go to John Farrington for helpful comments
on an earlier version, and to Emily Darko for valuable editorial assistance. All errors remain with the
authors.

ii
Abstract
This review draws together evidence from field studies on the effects of high food prices and
compares this evidence with the predictions made at the beginning of the 2007–08 price spike. As
predicted, high food prices increased malnutrition (especially in young children) and poverty. Some
findings however were less obvious, including the depth of the impact in rural areas, the increase in
inequality; the increase in indebtedness due to the widespread use of credit to buy food, and that
most poverty impact came from increasing depth of poverty in the already‐poor, rather than
increased poverty headcount. Studies on how poor people coped with food price rises highlight
some areas of policy that merit further support, including education, health and most especially
finance for the poor.

iii
Summary
When international food prices were soaring in early 2008, there was a rush of publications
predicting the impact of such price hikes on poor people and suggesting policy solutions. What hard
evidence has been collected about the impact on poor and vulnerable people in developing
countries? Does this support or change previous policy recommendations? This review draws
together evidence from studies on the effects of the 2007–08 price spike, as well as from some other
economic crises that resulted in high food prices.
As predicted, high food prices increased malnutrition (especially in young children) and poverty.
Some findings were less obvious. These included: the depth of the impact in rural areas, the increase
in inequality; the widespread use of credit to buy food, and the fact that most poverty impact came
from increasing depth of poverty in the already‐poor, rather than increased ‘poverty headcount’.
Who was worst‐affected? As widely expected, poor net food importing countries (e.g. island nations such as Haiti, rice‐
importing areas of West Africa, and countries in conflict) were among the first to feel the effects of
rising world food prices, and international assistance focused initially on these. However, high food
prices were also recorded as having a serious impact on poor consumers in net food exporting areas
such as Thailand, Uganda and northern Mozambique. The highest price rises were recorded from
countries where there were exacerbating local or regional supply and demand pressures; these
included conflict, drought or in a few cases, for example Benin, rapid regional economic growth
leading to rising consumer demand.
The poorest households — including many female‐headed households and those with a large
proportion of dependents — were worst hit everywhere. These households spend a higher
proportion of their income on food and have less access to credit and savings. The main impact of
rising food prices was therefore from increasing depth of poverty in those already poor (the so‐
called poverty gap) rather than the numbers of people newly pushed over the poverty line (the
poverty headcount).
The worst‐affected groups were casual wage labourers (both rural and urban), land‐poor farmers,
petty traders, and producers of commodities whose terms of trade declined against food grains: for
example pastoralists in Kenya, cotton farmers in Benin and tea workers in Bangladesh. Salaried
workers in the formal sector generally fared better than others.
While most of the high‐profile protests about food prices came from urban areas, many of the
poorest and worst‐affected people live in rural areas. Existing social protection and financial systems
often do not reach this group. The structure of land ownership and production patterns in most
poor countries meant that only a minority of farmers and agribusinesses were able to benefit from
rapidly‐rising prices.
Inequality is likely to have increased, although quantitative data is thin. One model estimated an
increase in a country’s Gini (inequality) index of 1% for a 20% nominal food price rise, while actual
price rises were often four times this level. Within countries, regional inequality is also likely to have
increased, with marginal and dry agricultural areas coming off worst. The regressive effect of rising

iv
food prices contrasts with studies on rising fuel prices and the global financial crisis, which have
generally found that urban and richer areas are the worst hit in the short term.
Children appear to have suffered most. Studies from Bangladesh, Cambodia and Mauritania
reported increases to the order of 50% in levels of acute malnutrition of poor under‐fives, with
plausible links to rising food prices. In some areas, children also lost out on education: a few studies
reported very high (> 50%) school drop‐out rates of children from the poorest households, and many
school drop‐outs never return.
Data on gender impacts, in contrast, was very limited, and it was not possible to confirm predictions
that women would shoulder most of the burden of high food prices. The exception was Bangladesh,
where several studies reported greater weight losses and school absences in young girls than boys.
In surprising contrast to previous crises, no studies were located which reported significant weight
loss in adult women.
How did poor people cope with price rises? Most poor households were left to cope on their own with high price rises. Community support
reportedly declined in many areas, as price rises affected everyone. Very few of those surveyed in
early‐mid 2008 reported having received any assistance from the state or NGOs. External assistance
was also slow to arrive.
Nearly all households surveyed reported cutting back on a wide range of expenditure items and
eating cheaper, often less nutritious, food. Many urban households consumed more street food,
which was often cheaper than home cooking due to economies of scale. Households normally chose
to protect their productive assets and human capital, for example by taking on extra work to make
ends meet. However priorities varied, and there was no standard sequence of ‘coping strategies’.
A notable finding was the widespread use of savings and credit, including pawning valuables to buy
food – confirmed by reports from microfinance institutions. The importance of finance for
consumption smoothing has hardly been mentioned in the international literature on the food price
spike, although some authors have drawn attention to the importance of credit for increasing
smallholder food production. Financial systems were also important in transferring remittances from
migrants, which were an important source of extra support in some countries, such as Nepal,
Bangladesh and Swaziland.
The table below summarises the published evidence for the prevalence and severity of different
effects of the 2007‐09 international food price spike. Strength of the impacts is indicated by colours,
from green (weak) to red (strong), while the stars represent the quality of evidence.

v
Summary of evidence on the impact of the 2007‐8 food price rises on the poor (see Conclusions)
TYPE OF IMPACT PREVALENCE (across countries)
SEVERITY (in affected
areas/groups)
HEALTH AND NUTRITION
Micronutrient malnutrition increased ** *
Undernourishment of young children increased (anthropometric measures, e. g. low weight for height) ** ***
Weight loss in women * ***
Reduced spending on healthcare ** *
POVERTY AND LIVELIHOODS
Loss of purchasing power ** *
Increased workloads ** *
Increased household indebtedness ** *
Reduced spending on children’s’ education / pulling children out of school ** *
Sales of household assets to buy food ** *
Increased migration for work ** **
EQUALITY AND COMMUNITY
Economic inequality increased ** *
Family and community stress: Giving less help to neighbours and friends, stress and conflict in the family, increase in begging, thieving, prostitution, spin‐off risks (e. g. of increased HIV from migration or prostitution) * *
Gender inequality and disempowerment increased * *
Notes: The colour represents the authors’ overall judgement on impact, triangulating different data sources. Intensity increases from light green (no significant effect reported) to light yellow (not widespread/low severity) through orange to red (very widespread /severe for those affected). Grey indicates insufficient evidence. The asterisks represent our judgement of the quality of evidence: * = poor, ** = moderate *** good (at least some rigorous individual studies).
Policy implications The effects of the 2007‐09 food price spike are still being felt. Food prices still remain high and
volatile in many countries, and the effects are compounded by the fall‐out from the global economic
crisis. There are fears of new global price increases in some commodities. What does this review
imply for policy responses in a new crisis?

vi
Identifying those in need
When an economic crisis strikes, public agencies and their international partners need reliable
methods for the rapid identification of countries, areas and households in need of assistance.
Experience in 2008 was mixed. To their credit, international agencies put considerable effort into
developing fair, consistent and technically sound predictions of the countries and areas most likely
to be affected by rising food prices. However, coordination between international agencies was poor
and this led to variation in predictions and some inconsistent treatment of countries. More joint
work would be useful to further calibrate and harmonise criteria and indicators. There have been
some inter‐agency meetings to improve harmonisation of assessments, but there is still some way to
go.
What evidence there is suggests that the bulk of the poverty impact of rising food prices comes from
increasing depth of poverty in the group of people already under the poverty line, rather than
increasing numbers of ‘new poor’. These worst‐affected households are not always easy to locate as
many live in rural areas — some in areas of food surplus — and the majority work in the informal
sector.
Tailoring policies to mitigate the impact on the poor
The international response to soaring food prices focused largely on support to agriculture and social
protection (including food aid). Support for nutrition also received a political boost, with new
nutrition policies published by some international agencies and increased interest in areas such as
micronutrients, fortification and Ready‐to‐Use Food supplements for small children. This review
broadly confirms these priorities.
However, much of the assistance directed at the rural poor has treated them largely as producers,
not consumers. In many countries only a small fraction of poor and vulnerable people are assisted
by any type of safety net programme, and the task of broadening coverage is urgent. Where the
right conditions exist, helping people increase their food production is a sensible policy response.
But assistance to producers — unless very carefully targeted — is likely to benefit larger farmers
with better access to land and markets. Many of the rural poor face constraints on land, labour or
water which make it difficult for them to produce a surplus.
This review has also highlighted some areas that deserve increased policy attention, including
finance, education and health. Financial systems that provide credit and savings at reasonable cost,
as well as transferring remitted funds, can be a vital support for the poor to cope with economic
crises as well as other shocks. Well‐designed education and health services may also help mitigate
the effects of an economic crisis. For example, some countries (e. g. Colombia) have set up flexible
education systems that enable children who drop out of school to rejoin their studies without major
penalties once household finances are back on an even keel.
Further research
Overall, the quality of the evidence available on impacts of the 2007–08 food price spike was judged
moderate for prevalence, but only poor for severity (see table above). Although — thanks to some
quick‐thinking agencies — a few rigorous studies exist on nutritional effects of the high food prices,
there is little high quality qualitative or quantitative evidence available about such important areas

vii
as the degree of indebtedness, sale of assets or impacts on gender equality. Two important
conceptual areas which need more field research are: the effect of short‐term food price spikes on
long‐term poverty and inequality (building on previous work on chronic poverty and seasonal
hunger); and effects within the household, particularly on gender equality. Further policy research is
recommended on: the use and design of finance, health and education systems to cope with food
price shocks; the design and effectiveness of nutrition education and other nutritional interventions
during a food price crisis; and the further refinement and calibration of rapid indicators for
identifying households and individuals at risk.

viii
Contents
1. Introduction .................................................................................................................................... 1
2. How should impact on the poor be measured? ............................................................................. 2
3. By how much did food prices rise in developing countries? .......................................................... 4
4. What countries were most affected? ............................................................................................. 8
What was predicted? .......................................................................................................................... 8
Criteria and indicators ..................................................................................................................... 8
Predicted countries ....................................................................................................................... 11
Which countries were worst affected in practice? ........................................................................... 11
What are the lessons? ....................................................................................................................... 14
5. What were the effects on poverty and inequality? ...................................................................... 15
What was predicted? ........................................................................................................................ 15
Within households ........................................................................................................................ 17
What is the evidence? ....................................................................................................................... 17
Livelihoods groups ........................................................................................................................ 17
Gender differences ....................................................................................................................... 21
Quantitative results ...................................................................................................................... 21
What are the lessons? ....................................................................................................................... 23
The use of models ......................................................................................................................... 23
6. How did poor consumers change their behaviour in response to high food prices? ................... 27
Why is understanding behaviour change important? ...................................................................... 27
What was predicted regarding behaviour changes? ........................................................................ 28
What is the evidence? ....................................................................................................................... 29
Food related behaviour changes .................................................................................................. 33
Livelihoods‐related behaviour changes ........................................................................................ 35
Stress and conflict ......................................................................................................................... 39
Interpreting behavioural change data .......................................................................................... 39
What are the lessons? ....................................................................................................................... 41
7. What were the effects on nutrition? ............................................................................................ 43
What was predicted on nutrition? .................................................................................................... 43
What is the evidence on nutritional impact? ................................................................................... 45
What are the lessons? ....................................................................................................................... 49

ix
Areas for further investigation ...................................................................................................... 50
8. How important was the international food price spike in the context of other international
crises and economic shocks? ................................................................................................................ 53
9. Conclusions ................................................................................................................................... 55
Key findings and policy implications ................................................................................................. 55
Quality of evidence ........................................................................................................................... 58
Recommendations for further research ........................................................................................... 58
Concluding remarks .......................................................................................................................... 59
10. References ................................................................................................................................ 60
List of Figures
Figure 1 Transmission of high food prices from world to individual child level, showing underlying
conditions & (in boxes) possible changes ............................................................................................... 3
Figure 2 Nominal food prices of main dietary staples in late 2008‐ mid 2009 compared to the
previous five‐year average, weighted by their contribution to the national diet (WFP data). .............. 5
Figure 3 The difference in nominal and real (deflated) food price rises: an example. Retail prices of
wheat in Karachi, 2006‐8. ....................................................................................................................... 6
Figure 4 National consumption diversity score, 2002 data ................................................................... 9
Figure 5 WFP’s April 2008 predictions of countries most vulnerable to Increases in Food Commodity
and Fuel Prices ...................................................................................................................................... 10
Figure 6 Example of a model prediction: effect on household welfare on rural populations of a 10%
rise in the price of the main three tradable staples for each country (Zezza et al 2008) ..................... 15
Figure 7 Schematic presentation of vulnerability and resilience to food insecurity (Devereux 2006) 25
Figure 8 Stages of household food insecurity ....................................................................................... 29
Figure 9 Percentage of urban (grey) and rural (purple) households who reported a particular
behaviour change in the previous three months (n=611 rural HH and 216 urban HH) ....................... 31
Figure 10: Percent of rural and urban poor reporting different ‘coping’ behaviours from a survey in
the Philippines: There is no standard sequence of behavioural changes. ........................................... 33
Figure 11 An example of increased food production as a result of rising food prices: Income
activities reported by a female group of palm oil producers in Liberia ................................................ 37
Figure 12 Recall periods affect ‘coping’ survey results: an example from Cambodia ........................ 40
Figure 13 Potential speed of rising malnutrition when prices rise: an example from the 2005 Niger
drought ................................................................................................................................................. 44
Table 1 Main livelihoods groups affected by high food prices: evidence from six country studies ..... 18
Table 2 Summary of evidence on behaviour changes from 20 surveys in 14 countries ...................... 30
Table 3 Summary of evidence on the impact of the 2007‐8 food price spike on the poor ................. 55

x
Box 1 Attribution of rising domestic food prices to world prices is difficult: two country examples .. 13
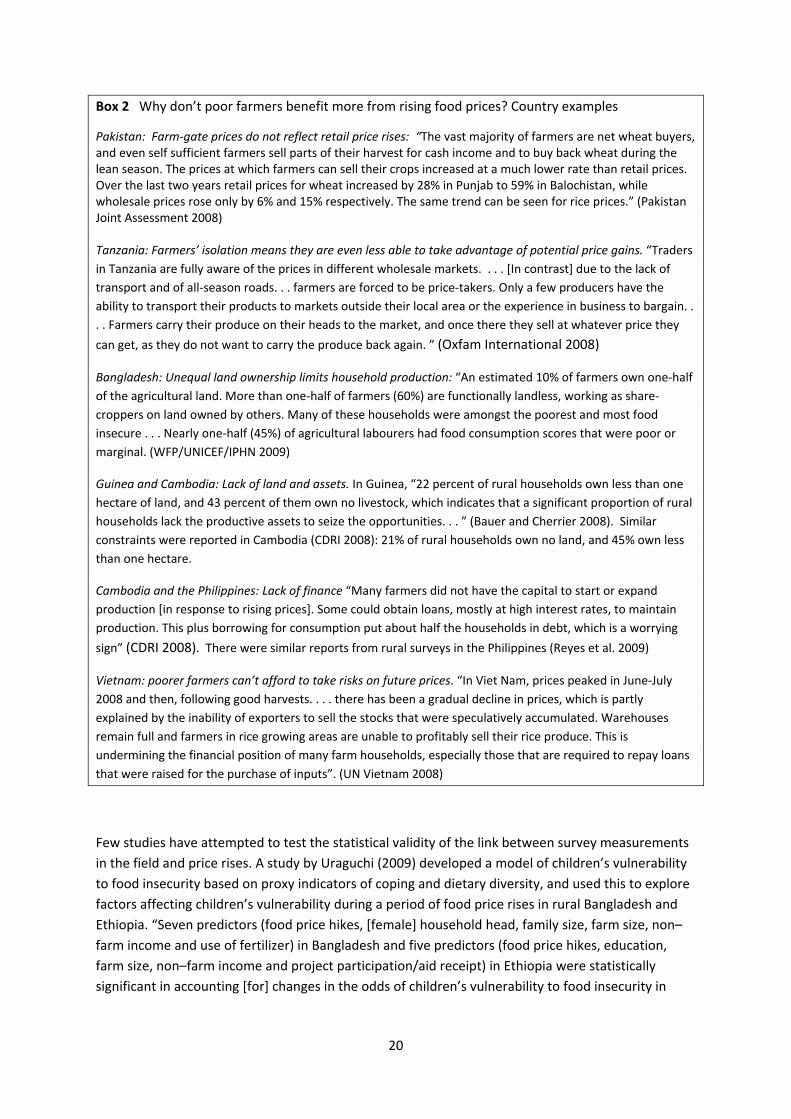
Box 2. Why don’t poor farmers benefit more from rising food prices? Country examples ............... 20
Box 3 Coping Strategies can be a reliable indicator of the seriousness of a food crisis – but they need
to be calibrated and used properly ....................................................................................................... 28
Box 4: Unbalancing the diet .................................................................................................................. 48
Box 5 How important did high food prices feel to poor households in the context of other shocks?
Country examples. ................................................................................................................................ 53
Tables in Annex 1
Table A Criteria and indicators used by international agencies for predicting the countries
and areas most vulnerable to rising food prices
Table B Most vulnerable countries to high world food prices, according to different
predictions, and the international aid response
Table C Predicting the effect of rising food prices on poverty: summary of 10 papers
Table D Summary results from studies on behaviour changes following food price rises in 13
countries
Table E Summary findings from studies on diet and nutrition following food price rises
Table F Quality of evidence on impact from studies reviewed

1
1. Introduction
In early to mid 2008, when international food prices were soaring, there was a rush of international
publications predicting the impact of such price hikes on poor people and suggesting policy
solutions. Now that the international price spike is over, what hard evidence has been collected
about its impact on poor and vulnerable people in developing countries? Does this evidence support
or change previous policy recommendations?
The ODI High and Volatile Food Prices Project was commissioned by the UK Department for
International Development to draw practical policy lessons from the world food price spike of 2007‐
8. This review covered over 60 publications directly addressing the 2007/8 food price spike, of which
around two thirds were ‘grey literature’, as well as over 100 related publications.
This paper is directed mainly to international aid agencies which are trying to decide how best to
support developing countries in their own responses to this and future price crises. The purpose is
to:
- Critically review what has been learned; - Compare the predicted impacts to available evidence, using information from other relevant
crises where available; - Make some practical recommendations for policy and research
The following sections look at each of these questions in turn:
How can one measure the impact of the food spike on the poor – and why does
measurement matter?
By how much did food prices rise?
What countries and areas were most affected?
What were the effects on poverty and equality?
How did poor people change their behaviour in response to high food prices?
What was the effect on nutrition?
What was the relative importance of the international food price spike in the context of
other international crises and seasonal poverty?
What are the main lessons and policy implications?

2
2. How should impact on the poor be measured?
Measuring and understanding impact has four main practical objectives, and these affect the types
of measures that are useful. These are:
1. To come up with an overall estimate of the poverty impact of the international food price
shock. The main uses for such an estimate are: to measure the potential impact of high food
prices on international targets such as Millennium Development Goal 1; to put food prices in
the context of other shocks; and to justify the resources invested in mitigation and
preventing future food price shocks.
2. To identify the areas, households and people who are worst affected, in order to target
and design appropriate assistance and policy responses.
3. To estimate the resources needed for mitigating the impact of food prices, to inform
budgetary allocations in country governments and for international assistance.
4. To understand the nature of impacts, in order to develop appropriate policy measures for
mitigating future shocks. For example, do the urban poor deserve more attention than they
were getting, as argued by some authors (e. g. Marc J. Cohen and Garrett 2009)? Should
increased social transfers be the main policy response, or are there complementary areas
such as nutrition which also need support?
For the first three objectives, speed is important, so quick standardised proxy measures and models
are useful. Some progress has been made on developing and harmonising such measures, but there
is still much to be done (see section 6). For the fourth objective, an in‐depth understanding of
impacts is needed, with qualitative research being as important as quantitative. However few of the
studies reviewed here had the resources to do in‐depth qualitative analysis. Some areas where
further work would be useful are specified in later sections of this paper.
Attributing changes in people’s lives to changes in world food prices is extremely challenging. Figure
1 sets out the main linkages from rising food prices to changes at the level of world, country,
household and the individual child, mediated by the underlying factors at each level. Most changes
have multiple causes which cannot be definitively disentangled without years of rigorous
experimental research. Furthermore, there are many feedback loops not shown in Figure 1 — for
example consumers quickly react to high prices by switching to cheaper food, and this puts some
downward pressure on prices. Rigorous comparisons are almost non‐existent in the literature;
instead authors rely on identifying ‘plausible linkages’ between food prices and impact, for example
timing (i.e. observed changes happened after local food prices went up); and triangulation of
different data sources. Table 3 in the conclusions section of this paper (and the long version in
Annex Table F) sums up our judgements on the quality of the available evidence.

3
Figure 1 Transmission of high food prices from world to individual child level, showing underlying conditions & (in boxes) possible changes
WORLD COUNTRY HOUSEHOLD INDIVIDUAL GIRL OR BOY
Underlying conditions
Changes — at border
Underlying conditions
Changes — domestic Underlying conditions Changes (women/men) Changes
Food system: trade, transport, processing
BORDER FOOD PRICES
Food system: trade, transport, processing
COST OF FOOD AT HOUSEHOLD LEVEL
Food consumption & substitution patterns
DIETARY DIVERSITY QUANTITY & QUALITY OF
FOOD INTAKE
TRADE
RESTRICTIONS, TARIFFS & TAXES
Food policies (e.g. subsidies and taxes) and their history
FOOD SUBSIDIES & TAXES
DIVISION OF FOOD IN FAMILY (including special foods for
children) NUTRITIONAL LEVELS
Exchange rates Other factor markets:
land, inputs
AVAILABILITY & COST OF FOOD PRODUCTION
INPUTS
Food production experience, land, access
to inputs
FOOD PRODUCTION FOR OWN CONSUMPTION & SALE
Supply & demand for
non‐food goods COST OF OTHER GOODS
SPENDING ON NON‐FOOD, including health & education
ACCESS TO HEALTH CARE ACCESS TO EDUCATION
Other world markets e. g, fuel,
commodities, labour
Labour markets/formal & informal employment
INCOME GENERATION OPPORTUNITIES
Income generation patterns
EMPLOYMENT, WAGES & CONDITIONS
CHILD LABOUR
Investment for future: health, education,
childcare
TIME FOR NON‐INCOME GENERATING ACTIVITIES including breastfeeding &
childcare
PARENTAL CARE EXPOSURE TO STRESS &
VIOLENCE
Financial services LEVELS OF SAVINGS, LOANS, REMITTANCES
Use of finance to manage shocks
SAVINGS & DEBTS
Patterns of migration & remittances
Political pressures &
where from
Family, social & community relationships
(social capital)
INTER‐HOUSEHOLD TRANSFERS & LOANS. SOCIAL CAPITAL & RELATIONSHIPS
LIVING & EATING AT HOME OR ELSEWHERE
GOVERNMENT FISCAL POSITION
Government services & budget
HEALTH , EDUCATION, WATER SERVICES
TIME AND EXPENDITURE ON WATER AND SANITATION
HEALTH (AND NUTRITION)
Social transfer
programmes & history SOCIAL TRANSFERS INCOME FROM TRANSFERS
Previous levels of
wealth & assets; equity
Household assets including land / natural
resources, goods
HOUSEHOLD & INDIVIDUAL ASSETS.
FUTURE HEALTH & LIVELIHOODS PROSPECTS. SOCIAL EMPOWERMENT. SENSE OF WELL‐BEING.
Note: This figure draws on livelihoods frameworks by CARE, DFID and others depicted in (FAO/DFID 2000), UNICEF’s nutrition framework (UNICEF 1998) and its
modification by Ruel et al. (2010), Mendoza’s framework for international economic shocks (Mendoza 2009a; Mendoza 2009b) and Heady and Fan’s (forthcoming)
framework for transmission of food prices, as well as insights from economic models such as that employed by Ivanic and Martin (2008) in predicting the impact of food
prices, and observations from studies reviewed elsewhere in this paper. Causal linkages have been arranged roughly horizontally where possible; however most changes
have multiple causes — for example nutrition is affected by quality and quantity or food intake, health and hygiene, breastfeeding and other caring practices (UNICEF
1998) — and it was not always possible to group these together.

4
3. By how much did food prices rise in developing countries?
Domestic food prices rose in many countries following world food price rises. The speed and degree
of transmission from world prices to domestic prices varied: see review by Keats et al. (2010).
Widely‐traded commodities like wheat and rice were normally the quickest to respond to world
price changes, leading to rapid and dramatic price rises in many countries in 2008. Transmission of
world prices was slower and more muted in white maize in Africa, particularly in landlocked
countries. The price of predominantly‐local staples such as cassava and cooking bananas rose later,
after hard‐pressed consumers started to substitute them for more expensive cereals. High domestic
food prices have persisted in many countries long after world food prices started to come down.
Figure 2 shows nominal price rises recorded by WFP in 37 developing countries in 2008/09 for major
dietary staples, weighted by their contribution to the diet in each country (the food basket). In 22 of
the 37 countries, price rises in staple foods were over 20%. In nine countries (nearly a quarter of the
group) price rises were over 50%1. These follow earlier domestic food price rises varying from
around 25 to 80% in developing countries over the period 2005–07 (Ivanic and Martin 2008).
1 However, some of the highest price rises recorded – over 100% in Somalia and Zimbabwe for example — were influenced by conflict and general inflation more than world food price rises.

5
Not visible:
Haiti
El Salvador
Figure 2 Nominal food prices of main dietary staples in late 2008‐ mid 2009 compared to the previous five‐year average, weighted by their contribution to the national diet (WFP data).
Notes: In 2008, WFP started reporting prices of key starchy staples for each country for a set of markets, weighted by their
average caloric contribution to the national diet. The map shows countries where recorded prices exceeded the five‐year
average for the same quarter (3 monthly period) by the amount shown for at least two quarters in the period September
2008 – June 2009. All prices are nominal (see text). Data for Nigeria is for the north only. Source: data from WFP 2008,
2009ab
Researchers and agencies vary in their methodology for interpretation and presentation of price
rises, which makes comparing studies tricky (see discussion by de Janvry and Sadoulet (2008). First,
many publications on the ‘world food crisis’ only look at price rises in early‐mid 2008, which
underestimates effects in some countries (e. g. much of Africa) where prices rose later and/or stayed
high for longer. Secondly, many publications only record price changes for a few internationally‐
traded cereals (this is not unreasonable in some areas, for example rice‐consuming areas of Asia).
Thirdly, some publications record international dollar prices and assume a constant degree of
transmission to local prices. In practice a host of factors including exchange rates, border measures,
transport costs, and domestic food policies affected local prices (Keats et al. 2010). Fourthly, there is
the question of how to denominate the price: some publications present nominal prices in local
currencies; others present nominal dollar prices and others use ‘real’ prices (deflated, normally by
the Consumer Price Index, CPI). While the use of real prices is important in economic analysis, in
order to be able to attribute effects to food price rises rather than to general inflation, it should not
be forgotten that a 10% ‘real’ price rise does not feel anything like 10% to the consumer, and that to
look at overall welfare effects it is useful to use nominal prices (de Janvry and Sadoulet 2008). See
for example Figure 3, which shows nominal and real prices of wheat in Karachi from 2006‐8; over
this period wheat prices doubled in nominal terms, but rose considerably less – although still a
frightening 140% — in real terms, since other prices were also rising at the same time. Wages, in

6
contrast, rose only about 10% over the same period (Pakistan Joint Assessment 2008), citing national
household surveys). This dramatic decline in purchasing power is not atypical: there is evidence both
from surveys in this crisis (see section 5) and from previous research (e. g. Ravallion 1990; Lasco,
Myers, and Bernsten 2008) that wages of the poor rise only very slowly in most cases in response to
price rises. Another problem with using the official CPI to deflate food prices is that the “poor
person’s CPI” normally differs significantly from the official CPI, as the poor spend much higher
proportions of their budget on food and other essentials; for this reason some studies (e.g. World
Bank LACR 2008; Arndt et al. 2008; Raihan 2009) have calculated separate indices of inflation for the
poor.
Figure 3 The difference in nominal and real (deflated) food price rises: an example. Retail prices of wheat in Karachi, 2006‐8.
Source: constructed by the authors from FAO‐GIEWS data http://www.fao.org/giews/pricetool/
Furthermore, the price paid by poor consumers often differs in practice from publicly recorded
domestic prices. On one hand, many poor people may pay a higher price as they buy in small
quantities by the bowl or cup. This is not a trivial point: for example Liberia Joint Assessment (2008)
recorded in Monrovia that “rice purchased by cup is 32% more expensive than by bag”. On the
other hand, they may buy a cheaper quality than the standard quality for which prices are recorded.
The poorest consumers also tend to buy less‐processed food, for example a woman may buy maize
grain instead of maize flour, and pound it into flour at home. This often means that international
price changes in the staple grain affect the poorest most (although this does depend on what millers
and traders decide to charge for their services as food prices rise).
0
5
10
15
20
25
Retail price (Pakistan rupees/kg)
Month and year
Nominal
Real (deflated)

7
For all these reasons, measuring by how much domestic food prices rose, and how much of that rise
is attributable to world price changes, is the first major challenge of trying to attribute impact.

8
4. What countries were most affected?
What was predicted?
Accurate prediction of the countries most affected by a food‐related shock is very important for
international agencies in designing and targeting any support. As explained by Maxwell et al. (2008),
in a review of good practice in humanitarian food security interventions, “. . . aid agencies should
first focus on getting geographic targeting right before turning to the question of more localised
targeting if necessary”.
Speed of prediction is as important as accuracy. Maxwell et al. (2008) make two important points
regarding the need for speed:
- “when the objective is to prevent impoverishment2, the intervention should arrive before the
household has already sold assets or taken other [irreversible] measures to obtain food.”
- “although timing is often not thought of as a targeting issue, there is clear evidence that the
late arrival of assistance is in fact a significant source of exclusion error”
For this reason, rapid indicators are needed to make an initial identification of vulnerable countries
and areas.
Criteria and indicators Which criteria and indicators were used for predicting the countries most vulnerable to rising food
prices, and were they all equally useful? The full range of criteria and indicators used is detailed in
Table A, Annex 1. Quite a variety of individual assessment methods were developed by different
agencies. The main points were (for full details, see Table A, Annex 1):
All the assessments included the criteria country poverty levels and dependence on cereal imports.
However a variety of other criteria were also used by individual assessments, including:
current levels of hunger and/or malnutrition,
contribution of cereals to the diet,
agricultural production,
foreign exchange reserves,
degree of urbanisation,
prevalence of particular vulnerable groups,
quality of fiscal policy, and
actual price inflation.
The indicators used to measure these criteria also varied considerably. For example, hunger was
variously measured with IFRPI’s hunger index (which includes under‐5 mortality rates), FAO’s
undernourishment index, and in one of the WFP assessments, adult and child undernourishment
were combined into a composite indicator with other measures including HIV prevalence.
2 This applies equally to other damaging changes such as malnutrition

9
Most of the assessments reviewed took place in early 2008. The only assessment which pre‐dated
these world food price rises was a study on food price risks in the context of market liberalisation,
put together by the World Bank with DFID support (World Bank 2005). This paper presents a
typology of countries at risk of high international and domestic food prices, which included some
interesting indicators not used by other agencies. One of these indicators was whether a country is
landlocked, and thus more exposed to domestic than to world price swings. Another indicator was
the concentration in the national diet of the main staple: see examples in Figure 4. This gives an
indication of the degree to which substitution is likely to be used as a strategy to moderate
fluctuations in price3. They predicted that countries with a very high dependence on a single staple
— e. g. rice in much of Southeast Asia, maize in Mexico and southern Africa, wheat in Pakistan or
Yemen — would be the worst affected by price rises.
Figure 4 National consumption diversity score, 2002 data
Source: regraphed from data in World Bank (2005) for 22 countries. Consumption diversity is measured by the
Herfindahl‐Hirschman Index = ∑(Si )2, where Si is the share of calories from different starchy food staples. A
score of 0 would indicate an ‘infinitely diverse’ consumption while a score of 1 would indicate a single main
starchy staple providing the entire diet. Note that this is different than the similarly‐titled ‘Food Consumption
Score’ and ‘Dietary Diversity Score’ mentioned later in this review.
3 A more direct measure would be the elasticity of substitution (an example is(McKenzie 2002) but reliable data is not available for the majority of locations, and average elasticity of substitution may differ in a crisis as people become poorer.
Bangladesh
Burkina_Faso
Cambodia
CameroonCôte d’Ivoire
Egypt
EthiopiaGhana
India
Indonesia
KenyaMadagascarMalawi
Mali
Mexico
Morocco
Mozambique Nepal
Niger
Nigeria
Pakistan
SenegalSouth_Africa
Sudan
Tanzania
Uganda
Vietnam
Yemen
ZambiaZimbabwe
0
0.1
0.2
0.3
0.4
0.5
0.6
0.7
0.8
0.9
Consumption diversity score (see note below)
Principal staple (this may be one of two or more main staples in some countries)

10
The most complex assessment method was used by WFP (WFP 2009, 100), which divided countries
into vulnerability quintiles as shown in Figure 5 (published in April 2008)4. WFP combined two
indices (a Global Vulnerability Index and High Price Risk Index) which were in their turn compiled
from over 30 sub‐indicators (listed in Table A, Annex 1). WFP also included some indicators on
inequality and the status of children, not used by other agencies. WFP’s experience is of particular
interest in two ways. First, did its rather complex index predict the countries at risk better than
simpler proxies? Were all the sub‐indicators useful in practice, or could some have been dropped
without significant loss in predictive value? It is worth noting in this context that the already‐existing
FAO list of Low Income Food Deficit Countries (LIFDCs) provided a fairly similar prediction for low‐
income countries (90% of WFP’s most vulnerable three categories and 83% of the most vulnerable
two categories were LIFDCs). Secondly, WFP’s move from five categories to six in the course of 2008
(see Footnote 4) meant that at least five countries were moved out of the highest‐vulnerability
category to the second‐highest category. Did this have any effect on country targeting in practice,
and was the additional category useful? More work would be useful to clarify these issues.
Figure 5 WFP’s April 2008 predictions of countries most vulnerable to Increases in Food Commodity and Fuel Prices
Source: presentations by WFP; downloaded from http://vam. wfp. org/geonetwork/srv/en/main. home
4 WFP’s later revision of its map into six sextiles (WFP 2009) had the effect of downgrading the assigned vulnerability level in at least 14 countries, for example Chad, Congo, Madagascar, Mali and Mozambique all appear in the ‘extremely vulnerable’ (worst‐off) quintile but then fall into the ‘second most vulnerable’ sextile. This raises interesting questions about how many categories are useful.

11
Predicted countries Twenty‐nine countries were rated vulnerable by at least 3 out of the 7 assessments examined:
Afghanistan, Bangladesh, Cambodia, Cameroon, Central African Republic, DR Congo, Eritrea,
Ethiopia, the Gambia, Guinea, Guinea‐Bissau, Haiti, Kenya, Liberia, Madagascar, Malawi, Mongolia,
Mozambique, Niger, Senegal, Sierra Leone, Somalia, Tajikistan, Tanzania, Timor‐Leste, Yemen,
Zambia and Zimbabwe. An additional 61 countries were rated vulnerable in at least one of the
assessments:5 a full list of agency assessments appears in Table B of Annex 16.
A quick comparison of the three most comprehensive predictions (WFP June 2008, de Janvry and
Sadoulet 2008 and EC Food Facility 2009) shows that while 88 countries appear on at least one of
these three lists, only 31 appear on all three, and only 6— DR Congo, Eritrea, Guinea‐Bissau, Haiti,
Liberia and Tajikistan — are rated ‘extremely’ or ‘most’ vulnerable to high international food prices
by all three7. If the analysis is restricted to low‐income countries (the main focus for most
international agencies), then while 43 low‐income countries appear on at least one of the three lists,
only 27 appear on all three, and only (the same) six are rated ‘extremely’ or ‘most’ vulnerable by all
three8. This implies, at minimum, that further investigation and harmonisation of methods would be
useful.
Which countries were worst affected in practice?
The short answer is that we can’t be certain: insufficient data is available to make a robust
comparison. Some of the factors which complicate the assessment include a general lack of reliable
quantitative data, for example on numbers of people affected, and the different methodologies used
by different country studies. A few proxy indicators are currently being developed (for example the
reduced Coping Strategies Index, see Box 3) that may allow more systematic comparisons across
countries in future, but these were hardly used in 20089.
Field reports from WFP and other agencies, for example. WFP Burundi (2008); WFP Cote D'Ivoire
(2008); WFP Nepal/NDRI (2008a); WFP Yemen (2008); Action Contre La Faim (2008a); Bauer and
5 Angola, Azerbaijan, Benin, Bhutan, Bolivia, Botswana, Burkina Faso, Burundi, Chad, Chile, Colombia, Comoros, Congo, Rep. , Côte d'Ivoire, Cuba, Djibouti, Dominican Republic, Ecuador, Egypt, El Salvador, Ghana, Guatemala, Honduras, India, Indonesia, Iraq, Jamaica, Jordan, Korea PDR, Kyrgyz Republic, Lao PDR, Lesotho, Mali, Mauritania, Mexico, Morocco, Myanmar, Namibia, Nepal, Nicaragua, Nigeria, Pakistan, OPT (Palestine), Papua New Guinea, Peru, Philippines, Rwanda, Sao Tome e Principe, Solomon Islands, South Africa, Sri Lanka, Sudan, Suriname, Swaziland, Syrian Arab Republic, Togo, Tunisia, Turkmenistan, Uganda, Uzbekistan and Vietnam 6 An additional assessment not covered in the table is that of (Ng and M. Ataman Aksoy 2008), taking a food trade balance approach, who predict that the worst‐affected countries will be small island states; low income conflict countries, and a few other food importers, including Senegal, the Gambia and Mauritania. 7 The 28 countries prioritised by the EU Food Facility for its first financing decision were scored 1 and the other approved countries for this fund (see Table B Annex 1) were scored 2. This reflects the press release http://europa. eu/rapid/pressReleasesAction. do?reference=IP/09/490, which says that “the package adopted today targets the 23 countries worst hit” — but other factors, such as the ability to put together fundable programmes, may have influenced the package and thus the country score. 8 It is interesting however that some of these countries are not even listed at all by some other assessments. 9 In fact, some sort of Coping Strategies Index was very commonly used, but in very few cases was it correctly calibrated and applied according to the instructions, which might have permitted comparisons.

12
Cherrier (2008) confirmed predictions that poor net food importing countries — island nations such
as Haiti, countries in conflict, and rice‐importing areas of West Africa — were among the first to feel
the effects of rising world food prices. However, high food prices were also recorded as having a
serious impact on poor consumers in net food exporting areas such as Thailand, Uganda and
northern Mozambique (Sanogo 2009; Simler 2010; Warr 2008). The highest price rises were
recorded from countries where there were exacerbating local or regional supply and demand
pressures. These included conflict (e.g. Somalia, Holleman and Moloney (2009) and Zimbabwe
(Gillespie et al. 2009), drought (e.g. Ethiopia, Action Contre La Faim 2009) or in a few cases, such as
Benin (Joint Assessment Benin, Niger and Nigeria 2008), rapid regional economic growth leading to
rising demand.
It is worth mentioning some of the challenges with the predictions, and a few differences which
were noted between the countries predicted to be most vulnerable and those that were judged
most vulnerable in assessments on the ground.
First, some factors were not considered in the prediction criteria. One group of countries which
received relatively little attention in international predictions were non‐food deficit countries and
food exporters such as Vietnam. There is evidence that although a significant fraction of farmers
benefited in such countries, many poor consumers, including landless rural labourers and small‐scale
farmers, suffered from price increases (Warr 2008). Another factor was exchange rates. An example
of this is Madagascar, which was included in the ‘most vulnerable’ category in most international
predictions. Appreciation of Madagascar’s currency against the dollar meant that domestic price
rises were much lower than expected, about 10% in nominal terms from 2007‐2009, and in ‘real
terms’ rice actually decreased in price. The result was that only 37% of households surveyed by WFP
in 2008 cited high food prices as a major shock – a much lower percentage than in other surveyed
countries. Future work on proxy indicators could usefully take these factors into account (Liberia
Joint Assessment 2008).
Second (a related point), all the assessments treated whole countries as geographical units, and used
national average data to calculate their indicators. This is likely to lead to misrepresentation in many
countries containing distinct geographical regions with different dietary habits, poverty levels etc.
For example, some parts of India and Pakistan are heavily dependent on rice and others on wheat,
with very low substitution rates10, which would be misrepresented by the use of national
Consumption Diversity Scores as in Figure 4. WFP is now starting to pilot identifying food system
sub‐regions (J Luma and I Sanogo, personal communication), and this approach merits further
support.
Third, although the predictions focused on areas vulnerable to world price rises, as opposed to
domestic and region‐driven price rises, in practice it is difficult to distinguish the origin of high
domestic food prices (Box 1) — and for humanitarian and operational purposes it is doubtful
whether making such a distinction is even necessary.
10 In Pakistan, the cross price elasticity of rice price ‐wheat consumption is 0. 05 and cross price elasticity of wheat price – rice consumption: 0. 09, compared to wheat own price elasticity of — 0. 31 and rice own price elasticity of — 0. 53. (Pakistan Joint Assessment 2008)

13
Fourth, many countries made major policy interventions to protect the domestic market from price
rises, for example by introducing price controls or cutting tariffs and taxes (Demeke, Pangrazio, and
Maetz 2009; Wiggins et al. 2010). These interventions reduced the immediate impact on poor
consumers, complicating the task of assessing which countries were worst affected. However they
were extremely costly for governments (IMF 2008), which could lead to adverse longer term impacts
on social transfers and services for the poor.
Box 1 Attribution of rising domestic food prices to world prices is difficult: two country examples
Benin was predicted to be ‘extremely vulnerable’ or ‘highly vulnerable’ to high world food prices in
international assessments (Table B, Annex 1). Benin did indeed experience high food inflation in
2008. However, according to the Joint Assessment Benin, Niger and Nigeria (2008), “the impact of
high international wheat, maize and rice prices on the domestic markets of these [three] countries is
limited”. The main driving force behind regional food inflation was reportedly the Nigerian market.
Rising consumer demand (including for meat and animal feed) and poor production in Nigeria in
2007–08, caused by patchy rainfall, low fertiliser use due to high world prices and poor producer
prices in the previous two years, combined to raise regional prices.
Ethiopia, with a history of famine, was predicted to be ‘extremely vulnerable’ to rising world food
prices by nearly all international assessments. Food prices did rise sharply in Ethiopia in 2008.
However, UN Joint Assessments (FAO/WFP 2008) found that the main factor in rising food prices
from 2004 onwards was “strong demand pull factors from economic growth, preceding the soaring
of international food prices”. Then widespread drought in early 2008 led to cereal prices shooting
up, and some areas registered high levels of hunger. Ulimwengu, Workneh, and Paulos (2009) also
found few significant linkages between Ethiopian and world grain markets. However according to
the joint assessment, prices did not reach levels which would make imports economically
worthwhile (import parity), and price rises were “much less than surrounding countries”. An influx of
refugees and extensive local purchases by WFP may also reportedly have contributed to keeping
food prices high in some areas.
A simpler question to tackle is: Did the countries that received international assistance specifically
aimed at tackling high food prices match the predicted vulnerable countries? The answer is very
broadly ‘yes’, but with some inconsistencies. The five biggest aid programmes set up to tackle the
food crisis were: the High‐Level Task Force Priority List of 23 Countries; the country programmes
reported by WFP in September 2008 as its main response to the food price crisis11; the 50 countries
prioritised by the EC Food Facility; the 70 countries FAO Soaring Food Prices Programme; and the
World Bank Global Food Crisis Response Fund12. A quick tally was made of the relationship between
‘predicted vulnerability ’ (defined as at least 3 out of the 7 assessments mentioned earlier rating the
country as vulnerable to high food prices) and ‘action’ (at least one of the above aid programmes
11 However, WFP is active in over 70 countries and many of its programmes were adapted to take into account rising food prices. 12 The IMF also provided additional finance to some countries, e.g. Burkina Faso, the Kyrgyz Republic, Mali, and Niger, but food prices were only one of the reasons adduced.

14
supported the country in 2008/09). The affected countries are listed in Table B, Annex 1. Of a sample
restricted to the 83 low and middle‐income countries, 25 (less than a third) showed both ‘prediction
and action’, while 22 had ‘action without prediction’ and three (Cameroon, Mongolia and Timor‐
Leste) had ‘prediction without action’. In a related analysis, from the 55 countries identified as being
‘most highly’ or ‘extremely’ vulnerable to rising food prices in at least one of the seven assessments,
the following countries were not reported as receiving the first tranche of support from any of these
programme in 08/09: Azerbaijan, Chad, Republic of Congo, Egypt, Mongolia, Morocco, Papua New
Guinea, Swaziland, Timor‐Leste and Tunisia.
These observations are not meant as a criticism of the international assistance programmes — most
of which faced formidable obstacles in scaling up across the world in response to the crisis — and in
any case these agencies already had other programmes active in many of the above countries. But
they do demonstrate that early programming did not strictly follow the predictions.
What are the lessons?
For the variety of reasons explained above, robust evidence to compare the severity of impact in
different countries is not available. A review of field assessments did broadly confirm predictions
that island states, poor food‐importing countries and conflict countries would be badly affected.
However it also highlighted the need for predictions to take variation within countries into account,
for example it should not be assumed (implicitly) that most rural people in food exporting countries
will benefit from high food prices.
The review has also highlighted the need to improve the indicators used both for quick targeting of
countries and areas and for assessing the seriousness of impacts. To their credit, international
agencies put considerable efforts into developing fair, consistent and technically sound assessments.
However, coordination between agencies was poor13 and this led to variation in predictions and
some inconsistent treatment of countries. More joint work would be useful to further calibrate and
harmonise criteria and indicators. This should consider the utility of the indicators already developed
(see discussion above) as well as additional possible factors such as exchange rates. Emphasis should
be put on simplicity and speed of use. There have been some inter‐agency meetings to improve
harmonisation of assessments (e.g. WFP/FAO 2008a), but there is still some way to go.
13 As a meeting of agencies in February 2008 (WFP‐SENAC 2008) minuted rather plaintively: “concerns were expressed about the proliferation of ongoing assessment‐related initiatives. . . donors need clear and simple information.” Another international meeting discussing nutritional surveillance made a similar point (Haytmanek and McClure 2009)

15
5. What were the effects on poverty and inequality?
What kinds of people have been affected by high food prices, how many and how badly? Who
benefited from rising prices?
What was predicted?
Models of varying degrees of complexity were used to predict the impact of rising food prices on
poverty. One example is shown in Figure 6, taken from Zezza et al. (2008), which shows a predicted
loss in welfare for rural households in 10 countries (in the main, worse for the poorest) contrasting
with a gain in welfare for rural households in Vietnam (a major rice grower).
Figure 6 Example of a model prediction: effect on household welfare on rural populations of a 10% rise in the price of the main three tradable staples for each country (Zezza et al 2008)
14
Note: For urban populations in the same countries, the predicted effect is negative across the board.
Ten models with broad country coverage were reviewed (details in Table C, Annex 1). The main
findings were:
- Most models predict an overall increase in poverty: both the percentage of people below
the poverty line and the degree of poverty (usually expressed as distance below the poverty
line).
- Some models are more optimistic. For example, De Hoyos and Medvedev (2009) — among
the few to use ‘real’ food prices — predict little or no effect in two thirds of their modelled

16
countries, and a decrease in poverty headcount in seven countries including Benin, Kenya,
Madagascar and Mali14. Ivanic and Martin (2008) predict that poverty will decrease by 2% in
Vietnam and by a small amount in Peru. Aksoy and Isik‐Dikmelik (2008) go further, calculating that “. . . Average incomes of net food buyers are higher than the average
incomes of net food sellers in eight of nine countries. Thus, higher food prices will, on
average, transfer income from rich buyers to poorer sellers, and thus be pro poor” (however
they do not develop a full model). Arndt et al. (2008),using a CGE model for Mozambique,
estimate that medium to large farmers in the north and centre of the country will benefit
from higher food prices; although those in urban areas and in the food‐deficit rural south
will lose out.
- Variation between countries is large— for example a 50% nominal food price increase is
predicted by Wodon et al. (2008) to increase poverty headcount by between 2% in DRC and
31% in Senegal.
- Models also vary in their predictions for individual countries, depending on the assumptions
used; in some cases one model may predict that poverty will rise and another that it will fall
(for example compare predictions for Peru and Madagascar by Ivanic and Martin (2008) in
Table C Annex 1 with those made by De Hoyos and Medvedev (2009) and Cuesta and
Jaramillo (2009).
- It is difficult to give an overall average prediction with any confidence. It can however be
said that the widely‐quoted figure published by Ivanic and Martin (2008) of 105 million
(equivalent to an average increase of 4. 5% in poverty headcount) is in the middle range of
the estimates given.
- In most models, the main increase in overall poverty is predicted to come from the existing
poor getting poorer, rather than an increase in numbers of ‘new poor’.
- The main increase in headcount of new poor is predicted to mainly come from urban areas
(although there are exceptions, for example Wodon et al. (2008) predict that in Liberia,
Ghana and Senegal the poverty headcount will increase most in rural areas). However the
main overall increase in depth of poverty is mainly predicted to come from the poorest
(many of whom are in rural areas) getting poorer.
- Some of the studies modelled impacts on different population groups. In general, these
predicted that the poorest consumers would lose most, while benefits would accrue mainly
to larger farmers. Sadiq Ahmed (2008) predicted the worst impacts on households headed
by labourers and least effects for salaried workers. Zezza et al. (2008) predicted that female‐
headed households would generally be worse off than male‐headed households.
- The unequal impact on different groups is predicted to lead to increased inequality. One
model (ADB 2008) estimated an increase in the Gini (inequality) index of 1% for a 20%
nominal food price rise (actual price rises were often more than four times this level).
- The predictions are challenging to compare, because “the models use different methods,
poverty lines and assumptions about price increases, pass‐through [from international] to
domestic prices, substitution effects, and wage effects. Also, some include net [food] sellers
while others do not” (Lustig 2009). Some methodological issues are discussed below.
14 They do however predict >3% increase in poverty headcount in 5 countries: Indonesia, Yemen, Ethiopia, Pakistan and Bangladesh.

17
Within households Many publications looked only at the household level. However some authors did predict differential
responses to high food prices within the household. From evidence in previous economic crises, it
was predicted that much of the burden would fall on women and girls (Quisumbing, Meinzen‐Dick,
and Bassett 2008; Holmes, Jones, and Marsden 2009):
- Women are normally responsible for meal preparation, so rising prices can put additional
pressure on their time — both by forcing them to search further to get lower prices and by
preparing cheaper, but more time‐intensive foods (such as cassava instead of rice).
- Women’s assets such as jewellery or small livestock are often the first to be disposed of to maintain household consumption.
- When food is short, women often reduce their own consumption to leave more food for
other household members (see next section). It has also been suggested that when food is
scarce and expensive, girls may be less well‐nourished than boys; however the international
evidence for this is mixed (see Webb 2002).
- If households decide to save money on education, girls may be pulled out of school earlier
than boys
- Rising food prices can have an impact on government budgets. Reduced government expenditure for example on education and health can shift the burden of service provision to households and communities, adding to demands on women’s time.
- Female‐headed households are often among the poorest and therefore a larger proportion
of their expenditure is devoted to food.
- Women have sometimes been poorly informed about how to receive food aid (or other assistance programmes such as cash for work) and restricted from registering for it, especially in areas where male‐female interaction is restricted or where women lack necessary identity papers.
- Increased food prices may not lead to higher production by female farmers, because they often have less access to cash and basic production inputs—such as land, seeds, fertilizer, credit, and technological training.
What is the evidence?
Livelihoods groups The worst‐affected groups reported from the surveys carried out in 2008–09, of which some
examples are presented in Table 1, were casual wage labourers (both rural and urban), land‐poor
farmers who produce no or a very small surplus for sale, petty food traders and brewers, and
producers of commodities whose terms of trade declined significantly against food grains (e.g.
pastoralists in Kenya, cotton farmers in Benin, tea workers in Bangladesh and fishermen in
Cambodia). This broadly bears out model predictions.
Salaried workers in the formal sector generally fared better than others in the studies reviewed.
However an economic study in southern/eastern Africa found that food‐buying power among urban
formal sector workers declined by 20–40% in 2008, reversing ten years or so of steady improvement
(Nicole Mason et al. 2009). In Liberia, a post‐war boom meant that at least some rural labourers
were able to command wages which kept pace with prices (Liberia Joint Assessment 2008).

18
Table 1 Main livelihoods groups affected by high food prices: evidence from six country studies
Study location
Main groups affected Reference and notes
Bangladesh (national)
Agricultural labourers and casual labourers consistently scored lowest for key food security indicators. 56% of households that reported casual labour as their main income source had low and borderline food consumption scores, compared to a national average of 25%. 38% of female headed households had poor or marginal food consumption vs. a significantly lower 23% for male headed households
(WFP/UNICEF/IPHN 2009), (Sulaiman, Parveen, and Das 2009) National surveys and panel data
Cambodia (national)
Impacts are mainly rural and concentrated in two regions (1. 5 million rural people and 150 thousand urban people are food‐insecure). Landless rural poor and farmers in marginal regions especially Plains and Tonle Sap that could not produce a surplus. (Only about 1/3 of all farmers produce a surplus for sale.) Also fishing communities who saw the fish price rise only about half that of rice and inputs; HH with higher dependency ratios (mostly in rural areas) and Female Headed Households.
(CDRI 2008) National household survey data
Guinea (urban and rural, rapid survey)
In urban areas, casual labourers (such as cart pushers and shoe shiners) and petty traders were among the most affected, with the wage: rice price ratio declining by half or more over a few months. Less affected groups included civil servants, salaried workers and transport workers, whose income rose to reflect price increases. In rural areas, cash crop producers and subsistence farmers without a surplus were most affected. Palm oil producers were affected by low seasonal prices and poor terms of trade.
(Bauer and Cherrier 2008) Secondary data (food security studies) and key informant interviews
Kenya (national)
Most vulnerable households included: urban households (mainly wage labour and petty business); the rural poor who do not own enough land for subsistence (especially in marginal farming and agropastoral areas); people living with HIV/AIDS; pastoralists, whose terms of trade are deteriorating; IDPs, refugees and drought‐affected families receiving food assistance.
(Kenya Food Security Steering Group 2008). Based on Integrated Household Budget Survey 2007
Lesotho (urban)
97% of households interviewed reported food prices as a major shock. 12 livelihoods groups were distinguished; poverty levels and dependence on assistance were high in all groups. Households dependent on brewing, pensions and transfers and agricultural wage labour reported the highest proportions of household expenditure on food. Food consumption scores were also lowest in these groups and also in the petty trade group.
(Lesotho Disaster Management Authority (DMA), Lesotho Vulnerability Assessment Committee (LVAC) and the UN World Food Programme, Lesotho Vulnerability Assessment Committee, and WFP 2008). Surveyed 1,278 HH, 10 districts — 57% ‘supported’ (due to AIDS/AIDS orphans )
Swaziland (urban)
82% of households interviewed reported food prices as a major shock. 10 livelihoods groups were distinguished. For the most part, the poorest groups (in which female or elderly headed households, often hosting orphans, were over‐represented) had the lowest food consumption scores and were worst affected by the price rises. These included petty traders, brewers, wage labourers and households dependent on pensions or remittances. 92% of cash crop producers interviewed also reported food prices as a major shock; however in Swaziland this is one of the better off groups with relatively good food security. Less affected groups included food crop producers and salaried workers.
(Swaziland VAC/WFP 2008). Surveyed 450 households in 15 enumeration areas.

19
There is less evidence available on who benefited from high food prices, perhaps in part because
surveyed households were reluctant to admit they were doing well in the midst of an economic
crisis. However, several surveys (e. g. Swaziland, Cambodia) reported that around 20–30% of
households reported having a higher income in 2007/08 in comparison to the previous year — a
similar percentage to those who reported having a lower income (no figures were given, so it is
difficult to know what this means in purchasing power terms). Many microfinance clients
interviewed in a 2008 survey in Pakistan said that they had benefited from (general) inflation;
although this may have been mainly because most were repaying loans taken out earlier and their
repayments were effectively cheaper (Zaidi, Farooqi, and Naseem 2009). The use of credit to buy
farming inputs and expand businesses was also cited by around a third of respondents in a national
survey in Cambodia (CDRI 2008), and this investment could be a sign of doing well. It was noticeable
that the highest fraction of those taking loans to expand their businesses in the capital city (42%)
was more than double that elsewhere in the country. However another possible explanation is that
this reflects expectations of future rises in prices rather than profits; and the Cambodian study does
raise concerns about the risk of increased indebtedness.
A number of surveys supported model predictions that only the larger farmers were able to benefit
significantly from rising food prices. In Cambodia for example, this was only around a third of
farmers (CDRI 2008). Key constraints reported by small‐scale farmers included landlessness or land
poverty, the high price of inputs, and inability to access credit (Box 2). Producers of some individual
cash crops benefited from price booms in 2007/8, such as sugar growers in Swaziland.
Observations at village level (e g. by Save the Children UK (2009) in Bangladesh) confirmed
predictions of increased inequality. They noted that the gains made by wealthier landowners from
increased food prices did not translate into comparable increases of wages for rural labourers. The
World Bank (2008) also reported increased inequality from Vietnam, Latin America and Bangladesh
with rises in food prices reportedly raising the Gini index in Bangladesh by 5% (no details given).
Other studies also noted that wage increases did not keep pace with price increases. For example, a
survey in Pakistan noted that “wages rose by 0% (Quetta) to 18% (Peshawar) while wheat prices rose
between 30–115% over the same period (July 2008‐July 2009)” (Pakistan Joint Assessment 2008).
There were similar findings in other countries (e g. Forsén and Subran 2008; CDRI 2008; Sulaiman,
Parveen, and Das 2009; WFP Nepal/NDRI 2008a)
Large agribusinesses are also thought to have benefited from rising food prices, although there is
less information about this. Oxfam International (2008) notes that “many others in the food business
appear to be cashing in on the crisis. Thailand’s Charoen Pokphand Foods, a major player in Asia, is
forecasting revenue growth of 237 % this year;
Nestlé’s global sales grew 8. 9 %in the first half of
2008; Monsanto, the world’s largest seed company, reported a 26 %increase in revenues from
March to May 2008. UK supermarket Tesco has reported a record 10 per cent jump in profits from
last year. ” The agribusiness surge did not finish in 2008: the Financial Times reported recently that
two new funds investing in agribusinesses have debuted on the London Stock Exchange with a view
to further world food price rises (Kelleher 2010).
20
Box 2 Why don’t poor farmers benefit more from rising food prices? Country examples
Pakistan: Farm‐gate prices do not reflect retail price rises: “The vast majority of farmers are net wheat buyers, and even self sufficient farmers sell parts of their harvest for cash income and to buy back wheat during the lean season. The prices at which farmers can sell their crops increased at a much lower rate than retail prices. Over the last two years retail prices for wheat increased by 28% in Punjab to 59% in Balochistan, while wholesale prices rose only by 6% and 15% respectively. The same trend can be seen for rice prices.” (Pakistan Joint Assessment 2008) Tanzania: Farmers’ isolation means they are even less able to take advantage of potential price gains. “Traders
in Tanzania are fully aware of the prices in different wholesale markets. . . . [In contrast] due to the lack of
transport and of all‐season roads. . . farmers are forced to be price‐takers. Only a few producers have the
ability to transport their products to markets outside their local area or the experience in business to bargain. .
. . Farmers carry their produce on their heads to the market, and once there they sell at whatever price they
can get, as they do not want to carry the produce back again. ” (Oxfam International 2008)
Bangladesh: Unequal land ownership limits household production: “An estimated 10% of farmers own one‐half
of the agricultural land. More than one‐half of farmers (60%) are functionally landless, working as share‐
croppers on land owned by others. Many of these households were amongst the poorest and most food
insecure . . . Nearly one‐half (45%) of agricultural labourers had food consumption scores that were poor or
marginal. (WFP/UNICEF/IPHN 2009)
Guinea and Cambodia: Lack of land and assets. In Guinea, “22 percent of rural households own less than one
hectare of land, and 43 percent of them own no livestock, which indicates that a significant proportion of rural
households lack the productive assets to seize the opportunities. . . ” (Bauer and Cherrier 2008). Similar
constraints were reported in Cambodia (CDRI 2008): 21% of rural households own no land, and 45% own less
than one hectare.
Cambodia and the Philippines: Lack of finance “Many farmers did not have the capital to start or expand
production [in response to rising prices]. Some could obtain loans, mostly at high interest rates, to maintain
production. This plus borrowing for consumption put about half the households in debt, which is a worrying
sign” (CDRI 2008). There were similar reports from rural surveys in the Philippines (Reyes et al. 2009)
Vietnam: poorer farmers can’t afford to take risks on future prices. “In Viet Nam, prices peaked in June‐July
2008 and then, following good harvests. . . . there has been a gradual decline in prices, which is partly
explained by the inability of exporters to sell the stocks that were speculatively accumulated. Warehouses
remain full and farmers in rice growing areas are unable to profitably sell their rice produce. This is
undermining the financial position of many farm households, especially those that are required to repay loans
that were raised for the purchase of inputs”. (UN Vietnam 2008)
Few studies have attempted to test the statistical validity of the link between survey measurements
in the field and price rises. A study by Uraguchi (2009) developed a model of children’s vulnerability
to food insecurity based on proxy indicators of coping and dietary diversity, and used this to explore
factors affecting children’s vulnerability during a period of food price rises in rural Bangladesh and
Ethiopia. “Seven predictors (food price hikes, [female] household head, family size, farm size, non–
farm income and use of fertilizer) in Bangladesh and five predictors (food price hikes, education,
farm size, non–farm income and project participation/aid receipt) in Ethiopia were statistically
significant in accounting [for] changes in the odds of children’s vulnerability to food insecurity in

21
households. ” These results largely confirm the predictions of who would benefit and lose made by
Zezza et al. (2008).
Gender differences More work is needed in this area. Although the predictions made above are plausible, and the
concerns are shared by many groups in country (e.g. Pakistan Joint Assessment 2008), little
published evidence could be found to substantiate them. Evidence on differential impacts within the
household is thin and much of the reporting from the food price crisis has been blind to gender and
other differences. For example, most of the behavioural change information in the following section
is collected for an entire ‘household’ on the basis of interviews with a ‘household head’, which often
leads to poor information on other members of the household.
However, several studies from Bangladesh did record gender‐specific impacts: Raihan (2009)
reported a higher proportion of girls dropping out of school than boys, and Sulaiman, Parveen, and
Das (2009) reported slightly higher increases in wasting in girls than in boys (although in their urban
sample, this was from a lower baseline than boys). A national survey by WFP/UNICEF/IPHN (2009)
reported that female headed households were over represented amongst food insecure households
. . with 38% of them falling into the poor or marginal food consumption groups vs. a significantly
lower 23% for male headed households”. They noted that female rural day labour rates were often
under half those of men, and that “female‐headed households sought more alternative jobs (17%)
and borrowed less from financial institutions (18%) than male‐headed households (15% and 34%,
respectively). This could have been related to negative discrimination in lending practices.”
Quantitative results We have not found robust figures from field studies to be able to verify the numerical predictions on
poverty headcount and poverty gap from the multi‐country models discussed above. New household
consumption and expenditure surveys are still not available for most poor countries since the food
price rises (also see proposals by Benson et al. 2008). The best estimates we have are from country‐
specific models using recent in‐country household data and local prices; these are broadly
supportive of international predictions (however both cover a fairly broad range). These include:
Kenya: Kenya Food Security Steering Group (2008) calculated that the price rises over late 2007‐mid
2008 would raise the population of the ‘food poor category’ in urban areas by 11%, for northwestern
pastoralists by 19%, for agropastoralists (e g. southern Maasai) by 22% and for marginal agricultural
producers (dry areas) by 20% (these are conservative estimates allowing for cutbacks in non‐food
expenditure). High‐potential mixed farmers were also expected to have reduced food security due
to limited scope for expansion or change of crops, and high input prices. The main beneficiaries from
high prices were expected to be farmers in the grain basket areas of the country who had a surplus
in stock to sell at the high prices.
Uganda: Simler (2010) calculated that the national poverty headcount increased by 2.6% and the
poverty gap by 2.2% following price rises in 2008–09. “Approximately 72% of the increase in the
aggregate poverty deficit stems from welfare losses among those who were below the poverty line
both before and after the food price increase, with the remaining 28% accounted for by net changes
among those who moved into or out of poverty. ” Northern Uganda, the poorest region in Uganda,
was calculated to have the highest increase in poverty.

22
Bangladesh: Save the Children UK (2009) calculated that while the poorest third of the rural
population had a lower income in 2008 than in 2004, the richest quarter of the rural population had
more than doubled its income over the same period. This was mainly accounted for by an increase in
rice prices. In a related analysis, the percentage of rural households unable to afford the most basic
‘energy‐only’ diet was calculated to have doubled, from 15% in 2005/06 to about 30% in 2008.
Nepal: WFP Nepal/NDRI (2008a) calculated a vulnerability index for rural households, based on land
ownership, proportion of household expenditure on food, and proportion of income from
agricultural sales. Based on this index, combined with price and household data from a national
Food Security Monitoring and Analysis System, they calculated that 42 percent of the rural
population would be ‘significant losers’, 41% would be marginal losers, 14% would be marginal
winners and only 2% would be significant winners.
Pakistan: Haq, Nazli, and Meilke (2008) calculated the effect of domestic food price rises on poverty
using household survey data and cross‐price elasticities (‘almost ideal demand system’). Poverty
was calculated to have increased by 35%, in this case more in urban (a 45% rise in poverty
headcount) than in rural areas (a 32% rise). “The estimates show that 2.3 million people are unable
to reach even one‐half of poverty line expenditures while another 13.7 million are just below and
23.9 million are just above the poverty line.”
Latin America: The World Bank Latin American and Caribbean Dept calculated a ‘poor person’s price
index’ (PPPI) for 2007: “In most countries in the region poor people face an effective inflation rate
nearly 3 percentage points higher than the overall rate, because food is a greater part of the
household budget for poor people and food prices have risen faster than overall inflation.... Certain
groups of poor people will face higher effective inflation rates. For example, in Nicaragua the
difference in the overall consumer price index and the poor person’s price index is greater for the
rural poor (3.1 percent) than the urban poor (1.9 percent). The groups most affected by the increase
in food prices are the rural extreme poor and the poorest 10 percent of total population.” The PPPI
predicted increases in poverty headcount ranging from 3.4% in Jamaica to no change in the
Dominican Republic in 2007. World Bank LACR (2008). This probably understates later increases.
Ghana: Cudjoe et al. (2010) calculated that at the national level, total staple consumption (including
both own production and purchased staples) fell by 7.1% for rural and 9.3% for urban households.
The worst affected were urban households followed by rural households in the northern (savannah)
zone.
Additionally, surveys of nutrition and of behaviour changes reviewed in the following two sections
give supporting evidence for an increase in poverty although they do not provide robust quantitative
data that can be compared with the models. For example, around 5% of households reported selling
off assets in order to buy food.

23
What are the lessons?
Broadly speaking, international predictions about who would suffer most from the food price crisis
appear to have been correct. The worst affected were the poorest households, who spend the
highest proportion of their budget on food. Many of these were in rural areas. Many small‐scale
farmers were unable to benefit significantly from higher food prices, due to constraints on land,
finance or labour or inability to afford risks. Larger farmers and agribusinesses did benefit, but were
in the minority. Rural labouring wages did not rise in proportion to food prices, and households
headed by rural day labourers were reported to be among the worst affected in many countries. The
poorest urban groups – particularly households headed by casual labourers, petty traders and others
in the informal sector – were also badly affected. Finally, households with large numbers of
dependents and female‐headed households were predictably among the worst affected.
Within households, children were often the worst affected (see following sections for details).
However, little published evidence was found to support the plausible predictions that women
would also bear the brunt of high food prices. More work is needed in this area.
One of the questions of practical importance for policy‐makers in charge of social transfers is the
relative balance between the impact on those already below the poverty line (the ‘existing poor’)
and the number of people who are newly pushed below the poverty line (the ‘new poor’). Most
models have calculated that the impact on the existing poor getting poorer far outweighs the
number of new poor. Where the existing poor are already registered in safety net programmes, this
is a comforting conclusion as it implies that efforts can reasonably be concentrated on improving
current safety nets rather than the much more difficult task of identifying the new poor. However, in
many countries only a small fraction of poor and vulnerable people are assisted by government
safety nets (Grosh et al. 2008; McCord 2009) so the task of broadening coverage is urgent.
Rising inequality is a disturbing finding. In rural areas, the rich and medium farmers had a chance to
get richer, while the poor got poorer. Furthermore, regional inequities have increased: for example
rural regions which are in food deficit are likely to have become poorer. At the same time, a high
proportion of the numbers of ‘new poor’ are from urban areas. This may raise classic political
economy dilemmas regarding the best use of resources: should they be focused on the short‐term
crisis of the more visible and vocal poor or the less‐visible long‐term crisis of the poorest?
The use of models Models were widely employed to predict numbers in poverty. It is still too early to be able to verify
most of the numerical predictions. However, it is worth discussing some of the main questions
arising from the use of predictive models. As pointed out above, different models gave quite
different estimates, and sometimes predictions for individual countries were contradictory.
All models need to make simplifying assumptions. Several previous reviews (in particular de Janvry
and Sadoulet 2008; also Lustig 2009; Headey, Malaiyandi, and Fan 2009; Headey and Fan 2009) have
critically discussed some of the main models and their methodology. Aksoy and Isik‐Dikmelik (2008)
also raise important questions about the assumptions made, for example they state that some ‘net
buyers’ buy only a small part of their food and could easily decide to become ‘net sellers’ if the price
rises.

24
Some additional comments on methodology used in the predictive models are:
Most models do not consider poor people’s behavioural responses to high food prices;
implicitly they assume that diets are unchanged (food substitution is termed a ‘second‐
round’ effect by some authors). This may be a reasonable assumption in some areas as parts
of rural Bangladesh where extreme poverty, together with strong and inelastic demand for a
single staple food which accounts for a large part of household expenditure, means that the
overall family food budget is strongly affected by the price of the staple (Torlesse, Lynnda
Kiess, and Martin W. Bloem 2003). However in many areas, substitution of expensive
imported grains by cheaper local alternatives partially mitigates the impact on the
household budget. In this case the models probably overstate the immediate poverty
impact (Simler 2010).
Most models assume that the increase in the producer price is the same as the increase in the consumer price. In practice, benefits for producers may be lower due to transport costs, producers’ lack of information on current prices and higher margins for middlemen (see Box 3).
Most models do not differentiate between general agricultural producers and food
producers when calculating numbers of ‘net sellers’, and this may lead to an overestimation
of numbers of producers benefiting from food price rises. One recent study calculated that
less than 2% of farm households accounted for more than half of all sales of maize (the
national staple) in four countries in southeastern Africa (Jayne et al. 2008). Few non‐food
agricultural commodity prices rose in line with food prices, so cash crop producers suffered:
cotton farmers in Benin, for example, were among the worst affected groups (Joint
Assessment Benin, Niger and Nigeria 2008).
As pointed out by Dawe and Maltsoglou (2009), assumptions about constant marketing
margins may be unwarranted, and may affect not only average model predictions but also
the predicted effects on different groups: “failure to explicitly consider marketing margins
could lead one to conclude that the poor are hurt relatively more than the rich by a price
increase when in fact the opposite is true, or vice‐versa”.
Most models take no account of timing, seasonality, and other constraints on production
responses. There are two important points here. First, in countries with only one main
growing season, many farmers may not be able to plant until the start of the next rains,
when prices may fall (or may be expected to fall). Second, other constraints may limit
production: these include high farming input costs (which coincided with the period of high
food prices), distance from markets, inclement weather during the season, pests and
limitations on land use. For all these reasons, many models are likely to overestimate the
benefits to ‘net sellers’.
On the other hand, if they ignore seasonality, models may possibly overstate the impact of
international food price rises. Normal seasonal price changes can have a massive impact on
hunger and poverty in poor countries (Devereux, Vaitla, and Hauenstein Swan 2008; Action
Contre La Faim 2009). “Afghanistan’s sensitivity to food prices can be gauged from the fact
that Afghanistan’s poverty estimates range from a low of 33 percent in the normal food
season to 42 percent in the lean season”(Sadiq Ahmed 2008)
Most of the models which calculate numbers in poverty implicitly assume that the price rises
are permanent (this was unknown when they were designed). This is a particularly tricky

25
assumption when it comes to modelling supply and wage responses, which normally take
months and depend on future price expectations as well as current prices. Matovu and
Twimukye (2009) using a CGE model for Uganda, are among the few who model permanent
and temporary price increases; not surprisingly, they find a much smaller supply response to
temporary increases.
An important conceptual issue is that poverty is not a static state — most poor households have to
cope with a series of shocks, including seasonal shocks in prices, food availability and health, and the
ability of households to buffer these shocks affects their long‐term prosperity. Figure 7, taken from
Devereux (2006) shows this in schematic form: it differentiates the ‘resilient households’ on the
right, who have access to credit, land (Green, Richard King, and Miller‐Dawkins 2010) and other
assets which allow them to recover from shocks, from the ‘vulnerable households’ on the left, which
who have no such mechanisms and who risk being plunged into long‐term poverty by a shock such
as food price inflation. There is no firm agreement on how the length and depth of episodes of
poverty caused by temporary shocks should be incorporated into an overall measure of long‐term
poverty (Calvo and Dercon 2007). One proposal is a measure of vulnerability (Christiaensen and
Boisvert 2000) defined as the probability of falling below the poverty line, multiplied by a
probability‐weighted function of the shortfall below the poverty line. More work is still underway in
this area.
Figure 7 Schematic presentation of vulnerability and resilience to food insecurity (Devereux 2006)
The final question to ask about the models is whether they are useful in answering policy‐relevant questions (as discussed in section 1 of this paper). The answer with regard to high food prices appears to be: ‘yes’, in part, but they could be more useful if they were designed more deliberately to answer specific policy questions. One important reason for using a model is simply for advocacy: to quickly produce and publicise a large number that will get the attention of international decision‐makers. The estimate of ‘105 million more people in poverty’ published by Ivanic and Martin (2008) was widely quoted and very successful in this context.

26
However, there is much more that models could potentially do. Another important question which models can help with is to identify the numbers in different vulnerable groups so that resources can be parcelled out appropriately, for example to get an appropriate balance between support to urban and rural areas ( Cohen and Garrett 2009). It is not clear that any of the economic models reviewed above were used for this purpose, and meanwhile national and international agencies came up with their own measures , for example a composite vulnerability index based on food expenditure, income sources and land access (WFP Nepal/NDRI 2008a) and comparing food expenditure and gifts to a national poverty line (Kenya Food Security Steering Group 2008); and an Individual Household Model approach (Save the Children UK 2009). A third potential use is to identify and model policy responses. De Janvry and Sadoulet (2008) review
many of these models and make a plea for models to have a greater focus on ‘country and
household heterogeneity to identify policy entry points’. Aksoy and Isik‐Dikmelik (2008) also raise
some interesting questions about the homogenizing assumptions of the principal international
models15. Simler (2010) recently presented work in progress by the World Bank to develop models
that can be used for predicting the poverty effect of policy interventions such as cash transfers in the
context of food and fuel price rises.
To sum up, considerable effort has been put into modelling the impacts of the food price crisis,
giving somewhat variable answers due to the different methods and datasets used. However, little
policy use appears to have been made of many of the models, apart from international advocacy for
the importance of high food prices impact on poverty. Furthermore, many of the models have not
been designed in a way that can give credible answers to key policy questions, because they do not
include ‘second‐round effects’ such as behaviour changes. This is an area where more work would
be useful.
15 (Lustig 2009) also appears to criticise the lack of practical focus of some models: “This contradictory impact of food prices on the poor has been known as the “food price dilemma.” This dilemma has been the source of a futile debate regarding when the poor are better off: when food prices go up or when they go down. Policymakers should simply accept that if food prices rise (fall) poor net buyers (net sellers) will need help and poor net sellers (net buyers) will be better off. In either case, safety net programs will have to be expanded in coverage and size to compensate the group of the poor who are negatively affected…”

27
6. How did poor consumers change their behaviour in response to high food prices?
“. . . the middling poor, those on around $2 a day, are pulling children from school and cutting
back on vegetables so they can still afford rice. Those on $1 a day are cutting back on the
number of meals. The desperate—those on 50 cents a day—face disaster” (Raihan 2009)
Why is understanding behaviour change important?
There are four main reasons for asking people about behaviour changes (normally called ‘coping
strategies’, although this is hardly a fair description of some behaviours):
a) People are not passive — so understanding how they react to rising food prices is important
for understanding the real impacts. Models which do not take into account such behaviour
change are likely to over‐ or underestimate the impacts, as discussed in section 5.
b) Behaviour changes can help external agencies measure the seriousness of an acute crisis.
c) Understanding behaviour change is important for designing and targeting policy measures to
help poor people, as further discussed below.
d) Behaviour changes may also be a good indicator of what people think will happen to prices
in future, so can be a useful part of an Early Warning System (Maxwell and Caldwell 2008)16
The poverty and nutritional impacts of behaviour changes are further discussed in sections 5 and 7.
16 However in some country studies (WFP/FAO 2008b) behaviour changes only preceded drops in food consumption by a short time or not at all, which raises questions about their usefulness for early warning.

28
Box 3 Coping Strategies can be a reliable indicator of the seriousness of a food crisis – but they need to be calibrated and used properly
Maxwell and Caldwell (2008) review international experience with measuring coping strategies and make
practical recommendations for developing a coping strategy index (CSI) which can reliably gauge the
seriousness of food insecurity. Some key points are:
‐ A ’broad CSI’ – which can include location‐specific behaviours such as migration — is very useful for
understanding potential livelihood impacts in a particular location and the effects of interventions. However it
cannot be used to compare severity across locations.
‐ To be reliable, any CSI must be carefully constructed following some basic guidelines for interviewing,
including recall periods (7 days are recommended).
‐ The frequency and severity of each ‘coping strategy’ should also be recorded. Severity will normally be
location‐specific (“some coping strategies would be looked on as perfectly normal behaviour in some places—
and as great sources of shame in others”) so weightings should be developed with local focus groups. (This is a
key step, often ignored in the studies reviewed here).
‐ The severity weighting for each strategy is then multiplied by the number of times in 7 days that the strategy
is reported to come up with an overall CSI Score.
Maxwell and Caldwell (2008) have also developed a Reduced Coping Strategies Index (RCSI) to enable
comparison of food security across different contexts. It uses a standard set of five standard coping strategies.
These are (with standardised severity weightings in parentheses):
• eating less‐preferred foods (x 1)
• borrowing food/money from friends and relatives (x 2)
• limiting portions at mealtime (x 1),
• limiting adult intake (x 3), and
• reducing the number of meals per day (x1),
However, the Reduced CSI has not been calibrated for all countries and contexts; further work is underway.
What was predicted regarding behaviour changes?
Based on experience with seasonal hunger and other crises, many authors predicted broadly similar
responses by poor households to an increase in world food prices – as outlined in Figure 8.
Responses have generally been categorised into two broad groups:
- food‐related ‐ this can vary from cutting out expensive and ‘luxury’ foods to — in the worst
cases — skipping meals or even whole days of eating, and eating types of food that would
normally be rejected. Internationally‐adopted measures for this area include a Dietary
Diversity Score DDS (Swindale and Bilinsky 2006) and some of the questions on the Coping
Strategies Index CSI (Maxwell and Caldwell 2008) and Household Food Insecurity Access
Scale HFIAS (Coates, Swindale, and Bilinsky 2007).

29
- livelihoods related – in poor households where 50%‐80% of the household income goes to
food, a rise in food prices can represent a significant rise in the overall cost of living.
Responses to inflation can vary from what economists call ‘consumption smoothing’ i.e.
tiding things over, mainly by drawing down savings and taking loans in cash or kind – to
responses with long‐term and possibly irreversible effects such as withdrawing children from
school or selling off household assets. The main international measure for these is the
Coping Strategies Index (Maxwell and Caldwell 2008): see Box 3 above.
Figure 8 Stages of household food insecurity
Source: Klotz et al. 2008; World Bank HDN/PREM 2008 – based on Maxwell and Caldwell 2008
What is the evidence?
We reviewed 20 surveys from 14 countries undertaken in 2008 (this excluded purposive surveys of
areas and groups predicted to be especially vulnerable). All surveys reported very significant changes
in behaviour following the food price rises. The results are summarised in Table 2 below; full details
and references are given in Table D, Annex 1.
1. The most common categories of behaviour change reported, in broad terms, were (Table 2):
Eating less preferred food (reported from all countries)
Eating less food at meals.
Use of credit to buy food, or buying food on credit;
Working harder or seeking additional work; and
Reducing non‐food expenditure

30
Table 2 Summary of evidence on behaviour changes from 20 surveys in 14 countries■
Behaviour change Number of countries reporting
# Frequency of households responding
FOOD‐RELATED CHANGES
$ Eat less preferred food ‐ overall (CSI severity weight x1) 14 ****
$ Eat less food in the meal (x1) 11 ****
$ Reducing number of meals or in some cases going whole day without eating (x1)
9 ***
$ Borrow/ gifts from family and friends (x2) 9 ***
$ Adults (usually mothers/ elder sisters) eat less (x3) 9 ***
Infant and young children's diet suffers ◊ 2 **
Eat more street food instead of home‐cooked ◊ (not indexed)
2 ***
LIVELIHOODS‐RELATED CHANGES
Credit (not from family) in cash or kind 12 ****
Reduce any non‐food expenditure 12 ****
Reduce health or education expenditure 10 **
Work harder/ more family members work/ seek more work
13 **
Use savings 4 ***
Sell consumer (non‐productive) assets 9 *
Increased migration 7 *
Sell productive assets (this includes consuming seed stocks)
6 *
Mortgage or pawn productive assets 1 *
Plant more or new crops (for food) ◊ 2 **
Reduced help to others in the community ◊ 3 *
Socially unacceptable livelihoods activities ◊ 3 *
EXTERNAL ASSISTANCE
External assistance (subsidised government food sales / social protection/NGOs) ◊
5 *
COUNTRY TOTAL 14
NOTES: ■ ‐ More details are given in Table D, Annex 1
$ ‐ These five indicators comprise the reduced CSI index: severity weighting is given (see Box 3 for details). However the
reduced CSI index was rarely applied correctly in these surveys so comparisons are difficult.
# ‐ * Very low ** Low *** Medium **** High. Numbers cannot be given as this is an overall judgement made on a number
of surveys containing data that cannot be averaged (see Table C Annex 1) The frequency data is indicative and should be
interpreted with great caution – see text.
◊These behaviours are the most likely to be underreported in this type of rapid survey, either because they are very
sensitive (underfeeding children, less help to neighbours, socially unacceptable activities), because the question was not
asked directly and no‐one thought to mention it (planting more crops, eating out more) or because respondents may
underplay them in hopes of getting help (external assistance)

31
In contrast, only a very small minority of households (less than 5%) reported the most potentially
damaging behaviour changes, such as distress migration, selling or pawning productive assets or
taking up socially unacceptable activities (begging, prostitution and theft).
This gives a picture of a crisis which however had not yet taken on the dimensions of a famine. It is
worth noting however that most of the surveys reviewed took place in 2008, before the full effects
of the global financial crisis were added to high food prices.
The behavioural surveys generally support the thesis that the rural poor were worse hit than the
urban poor (although the impact in urban areas was also serious, see Marc J. Cohen and Garrett
(2009); Ruel et al. (2010). This is not because the relative effect of rising prices was higher in rural
than urban areas, but because rural areas were poorer to start with, with more limited food and
livelihoods options. Error! Reference source not found. shows an example from Nepal (WFP
Nepal/NDRI 2008a)17. Much higher percentages of households in rural areas reported change in all
categories of behaviour than households in urban areas, with one exception (‘skipping whole days
without eating’). The difference is particularly noticeable for some potentially‐damaging behaviours
such as increased migration for work (reported by nearly a third of rural households and less than a
tenth of urban households), pulling children out of school to work (reported by a fifth of rural and a
tenth of urban households) and sales of household assets (nearly double the proportion for rural
households). A statistical analysis showed a significant relationship (p<0.05) between a coping
intensity index and food prices for the extreme poor, poor and lower middle in the rural group, but
not for other wealth categories (urban and rural). Similar results were reported from Cambodia
(CDRI 2008).
Figure 9 Percentage of urban (grey) and rural (purple) households who reported a particular
behaviour change in the previous three months (n=611 rural HH and 216 urban HH)
17 Note that rural Nepal is likely to be particularly badly hit, as most rural landholdings are tiny (<0.3 ha) and only a small proportion of farmers produce a marketable surplus.

32
2. Source: WFP Nepal/NDRI 2008aFigure 10, taken from a study in the Philippines (Reyes et
al. 2009), also shows higher proportions of poor households in rural areas making more damaging
behavioural changes than in poor urban areas. In this example, the rural poor overwhelmingly
reported borrowing money to buy food, both directly (76%) and via pawn (14%). They also cut back
on food consumption (34%) and healthcare (23%). The better‐off urban poor, in contrast, most
frequently reported cutting back on leisure activities (65%), borrowing (42%) and decreasing their
use of cell phones (33%). In Pakistan, where it had been predicted that the rise in food prices would
result in much greater increases in poverty headcount in urban (45%) than in rural (32%) areas (Haq, Nazli, and Meilke 2008), behavioural change surveys carried out by Pakistan Joint Assessment (2008)
showed similar levels of response in urban and rural areas for most indicators, with however some
key indicators of food insecurity (e.g. adults eating less to save food for children, and sale of
productive assets) being more frequently reported in rural areas.
External assistance to increase consumption was— at least in some instances— reportedly lower in
rural than in urban areas: for example more than a quarter of poor urban labourers surveyed by
(Sulaiman, Parveen, and Das (2009) reported benefiting from subsidised sales of food by the
government, compared to only a couple of percent of households in the poorest rural quintile18. It is
true that agricultural projects dedicated to increasing food production were directed largely at rural
areas, but due to the highly skewed land ownership in many areas, and the fact that many rural
people do not earn their main living from food production, this may not have had a very broad effect
on rural food insecurity — see e.g. concerns raised by Save the Children UK (2009) in rural
Bangladesh.
3. Despite many commonalities of experience, there was no standard sequence or universal
pathway of increasingly damaging behavioural changes, as might be inferred from Figure 8 above.
People’s specific circumstances and the perceived costs and opportunity costs of different
behaviours dictated individual responses. For example, pulling children out of school was recorded
much more frequently (and at an apparently lower level of food stress) in some locations than
others – presumably because the perceived short‐ and long‐term opportunity cost of education
varies. Figure 10 shows the variety in responses observed in a single household survey in the
Philippines (Reyes et al. 2009). Within these broad categories, specific changes vary even more: for
example see discussion on ‘health seeking behaviour’ below (4i). This variety in response supports
the analysis and recommendations of Maxwell and Caldwell (2008) regarding the correct use of
coping strategy indices (CSI). That is: using behaviour changes or a CSI to compare the degree of
food insecurity for households and locations can be quick and easy, but it can be misleading if not
done correctly. Within a particular area, it is important to understand the patterns and severity of
particular behaviours to be able to compare households effectively. This can be done by calibrating
the severity of different behaviours using focus groups, but this was rarely carried out in the surveys
examined. Comparing areas with different cultures and economic circumstances is even more
difficult, and this is what makes the development and calibration of a universal index such as
Maxwell and Caldwell’s Reduced CSI (Box 3) very important, but challenging.
18 However the opposite was true in the Philippines: see (Reyes et al. 2009)

33
Figure 10: Percent of rural and urban poor reporting different ‘coping’ behaviours from a survey in the Philippines: There is no standard sequence of behavioural changes.
Source: adapted from Reyes et al. (2009)
4. The types of behaviour changes reported are discussed further below.
Food related behaviour changes a) Eating less‐preferred food This was the most commonly reported response overall,
reported in all countries and by more than a quarter of households in 18 of the 21 surveys reviewed19. This included responses such as reducing dietary diversity, reducing meat/fish/milk consumption, reducing fruit/vegetable consumption, substituting the main staple (e. g. cassava for rice), buying lower quality main staple (e.g. old or broken rice) and consuming more wild foods (‘weed’ leaves, hunting). Some households also reported cutting back on special weaning or children’s foods and children joining the family pot. Section 7 below discusses the serious effects that many of these changes are likely to have on malnutrition, particularly micronutrients. The relationship between price rises and dietary/nutritional changes was not always constant, as the elasticity of demand for staples was different in different areas, as predicted. For example, in parts of China, a rise in the price of rice and wheat led to lower consumption of these cereals and increased consumption of (nutritious) pulses (Jensen and Miller 2008b). In contrast, in areas such as rural Indonesia, Cambodia and Bangladesh, demand for rice, the main staple, is very high and less sensitive to its price. An example is given by Raihan (2009), where over two thirds of households in rural Bangladesh reported maintaining their consumption levels of rice despite price increases of 60%, while 8% actually ate more rice when its price was higher, cutting back on more expensive and
19 This number is only used here to give a very general indication of prevalence, as the groups are clustered – for example four were in Bangladesh and two in Nepal – and are not comparable.
0
10
20
30
40
50
60
70
80
rural poor (339 HH)
urban poor (524 HH)

34
nutritious dietary items in order to do so20. This has previously been documented for rice in Bangladesh by Torlesse, Lynnda Kiess, and Martin W. Bloem (2003), who discuss the damaging nutritional implications (see following section).
b) Cutting back quantities of food eaten at each meal. This was also a very commonly‐
reported response (more than a quarter of households in 14 surveys), and overwhelming in some areas: for example, 96% of Yemeni households interviewed (n= 600 HH) reported cutting back on the quantities of food eaten and even more worryingly, 23 % of households in the poorest group reported that children had gone a day without food (Haq, Nazli, and Meilke 2008) Traders in some locations (e.g. urban Haiti) also reported that customers were buying food in smaller quantities.
c) Reducing the number of home‐cooked meals, or going a whole day without food. This was recorded by more than a quarter of households in 10 of the surveys. Reduction in number of meals has at least in some settings been shown to be well correlated with the total food intake (WFP/FAO 2008a). However this information is not always easy to interpret for a number of reasons. First, in some (mainly rural) situations, increased intake of wild or seasonal fruits and vegetables may partially offset cuts in consumption of main staples at mealtimes (WFP/FAO 2008a). Second, in many urban settings one response to rising food prices is to increase the amount of street food eaten outside the home (see point e) – and this consumption is often poorly recorded in surveys (Tinker 1997).
d) Adults — in particular ‘mothers and older sisters’ — eating less. This was recorded by more than a quarter of households in 8 of the surveys. This behaviour may have been under‐reported in some locations where this behaviour has been reported in previous economic crises, such as rural Bangladesh (respondents may simply forget to mention certain behaviours). On the other hand, the frequency of this behaviour may sometimes be inadvertently over‐reported – see methodological discussion and Figure 12 below.
e) Increased consumption of street food. In urban Africa and Asia, up to 20% of household food expenditure is commonly on street food; and this proportion generally increases when time and money are short, because street food is generally cheaper than home cooked food due to economies of scale for both food and fuel (Tinker 1997). In the studies reviewed here, respondents in Burkina Faso and Haiti mentioned increased consumption of street food as a response to rising prices. In urban Haiti, 43% of the most‐food insecure group recorded eating more street food and 40% of this group said this was mainly because it is cheaper (Haiti CNSA 2008). This echoes studies in earlier economic crises, for example (Akindès 1999) working in urban Cote D’Ivoire, who recorded that among the poor nearly two‐thirds of households ate out once a day during the crisis due to cheaper prices, spending nearly half their food budget on this (other examples are given in Table E Annex 1). Concerns have been expressed by some authors (e.g. Ruel et al. 2010) that increased consumption of street food due to high food prices might lead to health problems when foods are prepared in insanitary conditions, as well as worsening nutrition, as street foods often contain high levels of fat and carbohydrate.
f) Borrowing or receiving gifts of either food or cash from family and friends. This was reported from more than half of households in some locations (e. g. Cambodia, Yemen) and
20 The cases where rice consumption rises as its price rises are of academic interest to economists as a record of a ‘Giffen good’.

35
The importance of credit: an example
In a Cambodia national survey in 2008, 53% of
households were in debt, and 32% had taken out a
loan in the last 6 months. More than a third of
households gave ‘buying food’ as their first (20%) or
second (38%) reason for contracting the most recent
loan. Agricultural workers represented the highest
percentage of households seeking loans to buy food
(48%), followed by fishermen (34%) and forest
product sellers (27%).
Source: (CDRI 2008)
much less commonly from other locations (e. g. Bangladesh, Nepal, Pakistan). In some studies however (e. g. Reyes et al. 2009; Haiti CNSA 2008), poor people reported that they received less help than before food prices went up. See also point (n) below regarding reduced community solidarity.
Livelihoodsrelated behaviour changes
Buying food on credit — or getting credit in cash
to buy food — was one of the two most widely–
reported livelihoods responses to rising prices,
with more than a quarter of households reporting
using credit in 12 of the surveys. In some areas (e.
g. Burundi, Cambodia, rural Nepal, the Philippines
and Yemen) more than half of surveyed
households cited using credit as a response to
rising food prices. Pawn was reported widely
from some surveys, including urban Haiti and the
Philippines. More than a quarter of households in
Nepal, Haiti and the Philippines also reported
using savings to buy food. Some surveys (e. g.
Afghanistan) reported failure to repay existing debts and (in urban areas) rent as a common
response to rising prices. A survey in Cambodia noted that “The less land owned, the higher was the
percentage of borrowing to buy food. ” Unfortunately, none of these surveys reported the level of
debts incurred, or attempted to relate them to income levels or normal/seasonal levels of debt and
repayment, so it is difficult to gauge how much increased indebtedness resulted. However, many
studies reported indebtedness as a concern.
The importance of savings and credit in consumption smoothing for poor households is well known
to policy makers, but has hardly been mentioned in the international literature on high food prices.
However, credit is very important when food prices are rising, because (where it is in place) it can be
accessed very quickly, unlike many social transfers. This can give households more flexibility for
managing consumption expenses — for example quick credit may allow a family the chance to buy a
bigger and cheaper bag of rice before prices rise further. Furthermore, where credit has not been
available, many poor farmers have had to reduce or eliminate the use of purchased farm inputs like
fertiliser– thus missing an opportunity to maintain or increase their food production and profit from
the higher prices (Rapsomanikis 2009).
Microfinance Institutions (MFIs) have grown rapidly over the past decade and now serve about 80
million people, of whom about three quarters are women (http://www.themix.org/). Many MFIs
reported the increased use of credit and drawing‐down of savings for both consumption and
investment as a result of higher food prices (Duflos and Gähwiler 2008; Ahmed and Nestor 2009).
Over a third of the 45 MFIs surveyed by Duflos and Gähwiler (2008) reported that the default rate
had decreased. In the majority of cases, rising food prices were reported as creating problems for
both clients and their MFIs. However a survey in Pakistan (Zaidi, Farooqi, and Naseem 2009)

36
reported conversely that MFI clients did not see food and fuel inflation as a problem – because
inflation effectively reduced the interest on their loans, they were able to pass higher costs onto
their customers, and in some cases able to use their loans to increase agricultural production and
sales. It is impossible to say how widespread this effect was, as the survey was small and did not
provide information on wealth levels of clients. Another survey (Ahmed and Nestor 2009) reported
that MFI loan sizes had diminished in some countries (e.g. the Philippines) and increased significantly
in others (Nigeria): the authors offer no explanation, but this may have been due to differing
expectations of future inflation. What is clear however is that access to credit at reasonable cost has
been a vital buffer when prices rise, as previously confirmed for other economic shocks (Cohen and
Sebstad 2001).
g) Reducing non‐food expenditure was the other most common livelihoods response reported
(more than a quarter of households in 12 of the 14 countries). Surveys variously reported cutbacks and savings on clothing, transport, electricity and fuel, leisure activities, housing and farm inputs.
h) A particular area of concern is cutbacks in health and education expenditure (reported by more than a quarter of households in five surveys), since these may affect future health and lifetime job prospects. Understanding more how economic shocks affect uptake of health care services, and what impact this has on health outcomes, requires more in‐depth research. Not all behaviour changes have equally damaging implications. For example Yap, Reyes, and Cuenca (2009), working in the Philippines, recorded 10 specific actions under the broad category ‘changing health seeking behaviour’, including ‘discontinuing intake of prescribed medicine’, ‘moving from private to government health centres’ and ‘using more generic medicines’: clearly, these different actions could have quite different levels of impact. Improving health outcomes is complex, often requiring improvement of quality of healthcare suppliers as well as tackling demand‐side issues (O'Donnell 2007). Additional income such as through cash transfers may improve uptake of healthcare services but does not in itself guarantee better health and nutrition outcomes (Bassett 2008; Gaarder, Glassman, and Todd 2010). ‘Reduction of education expenditure’ similarly — in the minority of reports that gave details —covered a wide range of actions, from buying second‐hand school uniforms to pulling children out of school for a few days or for the whole school year. The effect on a child’s education will vary accordingly. Information on ‘pulling children out of school’ is often hard to interpret, and the variation in some answers is puzzling. For example in Bangladesh one survey of poor urban and rural households carried out in mid‐2008 found respectively that more than half of all households (and over 80% of female‐headed households) had ‘children dropped out of school’ due to the price rises21 (Raihan 2009). In contrast, another survey at about the same time found that this was comparatively rare, reported from only a few percent of households (Sulaiman, Parveen, and Das 2009). The reality can be complex and hard to score in a single indicator. For example in urban Haiti, where the surveyors asked more detailed questions, 27% of the poorest households reported having children who had missed more than a month of school, and half of these gave the main reason as food prices (another 14% cited fuel prices), while many more families had children who missed school for shorter periods. In Bangladesh, it was more common for secondary students to be pulled out of school than primary students, both because school fees are more expensive in
21 This was confirmed by a search of school records for a few locations.
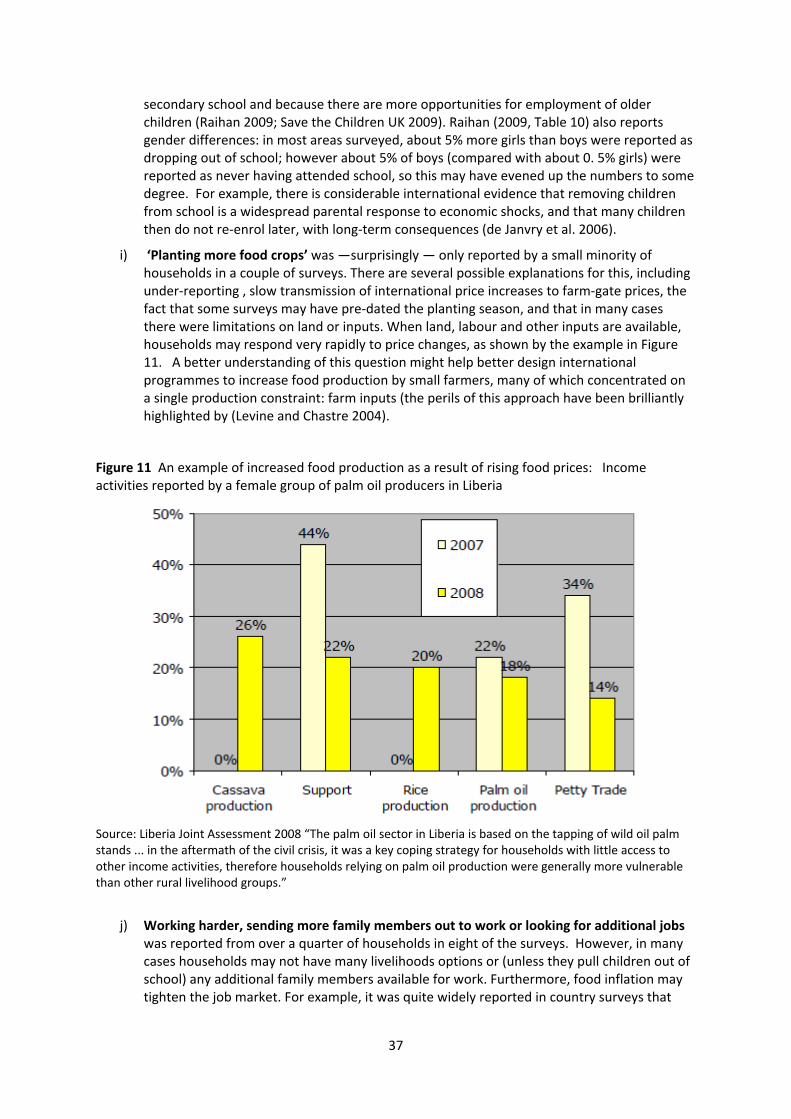
37
secondary school and because there are more opportunities for employment of older children (Raihan 2009; Save the Children UK 2009). Raihan (2009, Table 10) also reports gender differences: in most areas surveyed, about 5% more girls than boys were reported as dropping out of school; however about 5% of boys (compared with about 0. 5% girls) were reported as never having attended school, so this may have evened up the numbers to some degree. For example, there is considerable international evidence that removing children from school is a widespread parental response to economic shocks, and that many children then do not re‐enrol later, with long‐term consequences (de Janvry et al. 2006).
i) ‘Planting more food crops’ was —surprisingly — only reported by a small minority of households in a couple of surveys. There are several possible explanations for this, including under‐reporting , slow transmission of international price increases to farm‐gate prices, the fact that some surveys may have pre‐dated the planting season, and that in many cases there were limitations on land or inputs. When land, labour and other inputs are available, households may respond very rapidly to price changes, as shown by the example in Figure 11. A better understanding of this question might help better design international programmes to increase food production by small farmers, many of which concentrated on a single production constraint: farm inputs (the perils of this approach have been brilliantly highlighted by (Levine and Chastre 2004).
Figure 11 An example of increased food production as a result of rising food prices: Income activities reported by a female group of palm oil producers in Liberia
Source: Liberia Joint Assessment 2008 “The palm oil sector in Liberia is based on the tapping of wild oil palm stands ... in the aftermath of the civil crisis, it was a key coping strategy for households with little access to other income activities, therefore households relying on palm oil production were generally more vulnerable than other rural livelihood groups.”
j) Working harder, sending more family members out to work or looking for additional jobs was reported from over a quarter of households in eight of the surveys. However, in many cases households may not have many livelihoods options or (unless they pull children out of school) any additional family members available for work. Furthermore, food inflation may tighten the job market. For example, it was quite widely reported in country surveys that

38
small food traders22 were increasingly closing down or reducing their turnover; reasons included the credit squeeze caused by rising food prices and customers buying smaller quantities and looking for cheaper options. Faced with limited livelihoods options, some poor people turned to the hard and poorly‐paid tasks of cutting firewood, making charcoal, breaking stones or carrying sand: these were reported from countries as diverse as Burkina Faso, Nepal and Cambodia.
k) Increased migration was reported from 7 countries but generally only by very small percentages of households. Migration for work was most commonly reported from Nepal and Yemen (both around 10% of households) with much smaller numbers from other countries. Migration is a regular strategy used in some areas to combat frequent economic and other shocks, although it can also pose serious social and health risks (WFP Nepal/NDRI 2008b). Under this heading we also included the (infrequent) reports from West Africa and Haiti of some family members being sent from city households to the countryside due to better access to food. Mousseau (2010) has highlighted the importance of international remittances in helping families cope with high food prices.
l) Selling non‐productive household assets to get money to buy food was also widely reported (16 surveys), but by a relatively low proportion of households (mostly under 10%). Specific assets sold were mentioned in only a few surveys: these included jewellery (Cambodia) and radios and furniture (Yemen). As mentioned in Section 5, different assets may be owned by different family members and their sale may have gender implications. However this was not explored in any of the studies reviewed.
m) Selling land or productive assets23 clearly has very serious implications for both poverty and equality. This was only reported by a small minority (1–4% of households in 8 studies) but this still represents many thousands of people. Again, more detail than was given in most studies would be useful to understand both the poverty and policy implications.
n) Reduced community solidarity – “traditional risk‐sharing arrangements may well break down, and at particularly bad times for the poor (Coate and Ravallion 1993). Respondents in some surveys (Burkina Faso, Haiti, Swaziland and Sierra Leone) reported giving less food and money to, and/or receiving less from, neighbours and friends than normally. This has also been recorded in previous economic crises (e. g. Fouere et al. 2000).
o) Socially unacceptable livelihoods activities were not widely reported by households themselves in these studies. Yemen was an exception, with over 30% of households reporting family members ‘turned to begging and garbage collection’. However, focus groups in several countries mentioned that “some community members” had turned (or were likely to turn) to begging, theft and prostitution. It is not thought that this was very widespread, but evidence is thin. An earlier study (Weiser et al. 2007) documented major increases in high‐risk sexual behaviour in women who were food‐insecure24. Understandably, these highly sensitive issues do not always get mentioned in a quick food security survey.
22 A common occupation for poor women, with few barriers to entry 23 In this review, ‘eating seed stocks’ and ‘selling more animals than normal’ were included in this category. These are temporary rather than permanent assets, but nevertheless can be crucial for income generation in a very poor family. 24 “Among 1,050 women [in Botswana and Swaziland], after controlling for respondent characteristics including income and education, HIV knowledge, and alcohol use, food insufficiency was associated with inconsistent condom use with a non‐primary partner (adjusted odds ratio [AOR] 1. 73, 95% confidence interval [CI] 1. 27–2. 36), sex exchange (AOR 1. 84, 95% CI 1. 74–1. 93), intergenerational sexual relationships (AOR 1. 46, 95% CI 1. 03–2. 08), and lack of control in sexual relationships (AOR 1. 68, 95% CI 1. 24–2. 28). Associations between food insufficiency and risky sex were much attenuated among men. ”

39
p) Help from government or NGOs. Only a tiny percentage of households in these surveys reported accessing any government or NGOs support. Only urban households in Bangladesh and rural households in the Philippines reported being able to buy low ‐ cost grain from government sales in any numbers (i.e. more than a quarter of households). Most of these surveys were conducted in the second or third quarter of 2008, so it is possible that more assistance was available later. Or external aid may have been under‐reported, for example if respondents did not want to discourage interviewers from giving them any further assistance. Nevertheless, it gives the impression that most direct assistance to households came little and late. This confirms some field observations, e.g. Save the Children UK (2009). Things are likely to get worse as the international financial crisis hits government budgets (Kyrili and Martin 2010).
Stress and conflict A final important area of behaviour change is an increase of stress and conflict within and between
households. This is of course a sensitive area, and likely to be under‐reported.
Focus groups in a few studies reviewed here (Yemen, Liberia and Burkina Faso) reported stress and
family tension, including increased divorce, early marriage of daughters and “wives returning to their
parents’ homes because the husbands cannot afford to feed them”25. Worries and stress about
insufficient food quantity, inadequate food quality and concerns about social unacceptability have
been previously reported from many countries (Coates et al. 2006), and the international Household
Food Insecurity Access Scale (HFIAS) includes a standard question on anxiety over food security
(Coates, Swindale, and Bilinsky 2007). A scientific study by Hadley and Patil (2008) also found that
“food insecurity is a strong predictor of symptoms of anxiety and depression, that changes in food
insecurity across the seasons predict changes in symptoms of anxiety and depression, and that this
[relationship] is robust to the inclusion of covariates for material assets and household production”.
Poor self‐esteem, disempowerment, social exclusion and loss of aspirations may also be a longer‐
term consequence of child under‐feeding (Dercon 2008).
Interpreting behavioural change data The above results should be interpreted with great caution; especially as regards comparing the
severity of the price shock between different countries. A variety of methods were used, and many
studies did not give details.
A common methodological problem is that many of the studies reviewed recorded the percentage of
households reporting particular behaviour changes, but not the frequency of this behaviour or the
‘recall period’ over which information was requested. Figure 12, depicting one of the few examples
where recall periods were specified, demonstrates why using different recall periods might give
quite different percentages of households responding positively about a particular behaviour. In this
example (first column) 71% of respondents reported that they had eaten less or a worse diet at least
once in the last 30 days, whereas only 29% reported doing this “often”. Furthermore, some types of
potentially damaging but infrequent behaviour (e. g. pulling children out of school, selling productive
25 DRC urban country focus groups went even further: “when parents are no longer capable of feeding, clothing or paying for their children’s education, they will abandon them in the street accusing them of, witchcraft and of being responsible for the misery of the family. . . ” (WFP high urban food price assessment 2008). However the problems faced by families in DRC obviously go well beyond high food prices.

40
assets) are ‘one‐offs’ that may not be picked up at all in a survey that asks about recent or regular
events. On the other hand, using a long recall period (such as 3 months, see Error! Reference source
not found.) may not only strain respondents’ memories but may – if the recall period is not specified
in the report – potentially over‐represent the importance of some behaviours. For example, in the
Cambodian surveys depicted in Figure 12, 44% of households reported that women ate less to save
food for other family members at least once in the last 30 days, but only 10% reported doing this
“often”.
Figure 12 Recall periods affect ‘coping’ survey results: an example from Cambodia
Sources: constructed by authors using data from CDRI 2008; Cambodia Anthropometrics Survey 2009 (studies
based on the same dataset) CDRI N=2235 households
Another methodological challenge is that a snapshot of behaviours taken after an economic shock
with no previous comparative data is difficult to interpret, as some of the behaviours reported may
be regular adaptations to seasonal price changes (Devereux, Vaitla, and Hauenstein Swan 2008;
Action Contre La Faim 2009) and other shocks.
There have been few attempts at statistical analysis of the link between behaviour changes and price
rises. The Nepal study mentioned under point 1 above (WFP Nepal/NDRI 2008a) found a
statistically significant relationship for poor rural households between price changes in the local
market and a constructed coping index measuring intensity of behaviour changes. The study by
Uraguchi (2009) mentioned in the section above found a significant link between price rises and a
composite indicator of children’s vulnerability to food insecurity based on a coping strategy index
combined with an index of dietary diversity.
0
10
20
30
40
50
60
70
80
Percent households reporting chan
ge
at least once in last 30 dayssometimesoften

41
What are the lessons?
1. As predicted, the overall picture is of a serious situation with potentially severe impacts on
many poor families and in particular young children. The behavioural surveys reviewed, while
imprecise, give an impression of the scale of the shock and the potential impact on poverty. Of
the order of a tenth to a third of households reported increased indebtedness, cutbacks in
health and education expenditure, pulling children out of school and reduced nourishment,
including of small children. All these affect future poverty, including future health and lifetime
earnings prospects.
However at the time of the surveys, the situation had not reached the dimensions of a famine,
where you might expect widespread sales of assets, distress migration, begging and prostitution
(reported from only a few per cent of households in these surveys). It should be noted that the
surveys took place in 2008, before the full effects of the global economic crisis were felt.
Another potentially mitigating factor was the measures taken by both country governments and
international agencies to minimise price rises and help the worst affected —although few
households in these surveys reported receiving any direct assistance.
Many of the areas surveyed were subject to other shocks during 2007 and 2008 – so not all the
behaviour changes can be attributed to the food crisis26.
2. The behaviour change studies support predictions that the poorest would be worst affected.
Many of them were in rural areas.
3. The behavioural surveys highlighted some areas for policy support which have generally been
underplayed in the food crisis.
The most important of these is finance for the poor. Very large numbers of poor people
reported taking credit to buy food. Where microfinance provision was strong, such as in
Bangladesh, poor people could access credit at reasonable rates. Elsewhere, they used
moneylenders, pawn brokers and other sources of expensive credit, and many survey
reports raised concerns about increased indebtedness. Finance was also reported as a
constraint to increased agricultural production. Although finance for the poor is an
important area of international assistance, and it is well known that finance can help
poor households cope with shocks, this area of policy was hardly mentioned in this crisis.
Existing microfinance institutions were stretched and some reported liquidity problems.
More attention should be paid to this area in future, in the context of food price
volatility.
The second area is education. The behavioural surveys highlighted the large numbers of
children being removed from school in some locations when food prices rose. In other
26 For example, in many of the poorest countries, the food price shock was one more shock in a long line of natural disasters, political instability and inflationary episodes. The Haiti assessment team (Haiti CNSA 2008) laconically recorded that three cyclones hit the island while they were carrying out the food price shock survey.

42
locations, parents cut back on other expenses to keep their children in school. Even
short‐term removal from school may lead to permanent drop‐out and irreversible
changes in children’s life chances. Understanding what factors help keep children in
school during a food crisis (for example flexible schooling and payment systems, social
transfers and/or school feeding) is important and requires more in‐depth qualitative
analysis than has been located in this review.
The third area is healthcare. The behavioural surveys highlighted cutbacks in use of
healthcare as one area of savings made in response to high food prices. However, some
cutbacks may have little impact on health outcomes (e.g. switching to generic
medicines) while others may be very damaging. Further research is needed to
understand the impact of economic shocks on health seeking behaviour and how best to
improve health outcomes.
4. Further support should be given to both developing and training users in international
methods for assessing behaviour change to enable robust comparisons between locations. Many of
the assessments reviewed did not use a standardised international method in the correct manner
(for example they may have used a Coping Strategies Index, but did not calibrate it for local
conditions, or weight different types of responses). The Reduced CSI developed by Maxwell and
Caldwell (2008) has potential for making much better comparisons of severity between countries
than are possible with full CSIs (which are location‐specific). However the reduced CSI has not been
fully calibrated outside Sub‐Saharan Africa and further support is needed for this.
5. Further support should also be given for in‐depth studies on specific areas of behaviour
change. Key examples are finance, health and education (see above). In general, more in‐depth
qualitative information would be useful to supplement standardised assessments. As an example,
many reports include a general statement such as ‘x% of households reported selling non‐productive
assets’. Such behaviour varies a lot from place to place, so this statement alone does not help
distinguish ‘consumption smoothing’ from a major crisis. On the other hand, there is not enough
detail to understand the gender and policy implications (e.g. was the asset sold a bangle or a
bicycle?). A better understanding of who and what is changing and why would produce better
targeted policies.

43
7. What were the effects on nutrition?
What was predicted on nutrition?
“The bad luck of being 2 years old when [a shock leading to malnutrition] occurs can affect a
child's lifetime earnings whether or not the household's income recovers from the shock”
(Alderman 2010).
Even before the food price rises of 2007–08, malnutrition was already widespread. UNICEF (2009)
estimated that ‘an estimated 129 million children under 5 years old in the developing world are
underweight – nearly one in four’ – and that stunting27 is even more common.
The effects of rising food prices on nutrition are normally visible within a few months in the poorest
populations where nutritional status is already precarious. Figure 13 provides a dramatic illustration
of this, showing that numbers of children admitted to feeding centres with acute malnutrition28
followed within 5 weeks of steeply rising millet prices in Niger in 200529. Devereux (2009) presents
similar data, showing acute malnutrition closely following seasonal food price rises in Ghana and
Malawi. In all these studies, baseline malnutrition was already very high30.
27 Stunting, an indicator of chronic undernutrition, is defined as height for age below minus two standard deviations from the median height for age of the standard reference population. Stunting is an important predictor of child development [and] associated with reduced school outcomes (UNICEF 2009). Underweight is defined as weight for age below minus two standard deviations from the median weight for age of the standard reference population. 28 Severe acute malnutrition is defined as weight for height below minus three standard deviations from the median weight for height of the standard reference population, mid‐upper arm circumference (MUAC) less than 115 mm, visible severe thinness, or the presence of nutritional oedema. (UNICEF 2009) 29 In Niger this pattern of seasonal admissions did not change significantly in 2008, implying that in this case international prices were not a major factor (ACF‐IN/MSF 2009). However it is still a useful demonstration of how quickly acute malnutrition can follow a lack of food access. 30 For example it was over 40% in Devereux’ Ghana example (definition of malnutrition not specified).

44
Figure 13 Potential speed of rising malnutrition when prices rise: an example from the 2005 Niger drought
Source: Drouhin and Defourny 2006
Even a short‐term rise in malnutrition due to high food prices is of potentially very great concern. The long‐lasting negative effects of malnutrition on the life‐time health, education and income prospects of individuals, their children and whole economies have been well documented (Horton and Ross 2003; Victora et al. 2008). It was predicted that high food prices would principally affect mother and child health31, through a combination of macro and micronutrient deficiencies. Three key papers were:
‐ A paper for the UN Standing Committee on Nutrition (2008) predicted that: “Rapid increases
in food prices will cause maternal and child undernutrition levels to rise relatively rapidly,
with the first effects more likely to be seen in the pregnant mother, leading to irreversible
damage to the foetus that will persist across the course of life. . . . . ” The document tabled
17 ‘essential interventions to ensure food and nutrition security outcomes during the food
prices crisis across the life course’. Although none of these recommendations can be faulted,
the comprehensiveness of the list makes it difficult to see where short‐term priorities lie in
the context of high food prices. Moreover, none of the main 17 recommendations directly
addresses health‐related causes of malnutrition — although interventions such as
deworming are listed as ‘other considerations’.
‐ Bhutta et al. (2009), based on a thorough synthesis of the literature including the nutritional
effects of previous crises in the region, predicted for East Asia and the Pacific that “if
31 However, as pointed out by (Webb 2002), many nutritional studies focus exclusively on these population groups so may miss negative impacts on others. For example, adolescent growth was affected in the Indonesian economic crisis (De Pee et al. 2000).

45
unaddressed the recent crisis could increase rates of maternal anaemia by 10–20% and
prevalence of low birth weight by 5–10%. In addition rates of childhood stunting could
increase by 3–7% and wasting by 8–16%. . . . overall under 5 child mortality in severely
affected countries . . . could increase by 3–11%. ”
‐ Klotz et al. (2008) focus mainly on the risk of micronutrient deficiencies which result from
households trying to protect their staple food intake at the cost of making savings on
comparatively‐expensive micronutrient‐rich foods. In poor populations, they predict the
following sequence: Depletion of body micronutrient stores and lowered immunity;
Appearance of clinical symptoms of micronutrient deficiencies, such as night blindness
(vitamin A), anaemia and increased morbidity; Weight loss and wasting in mothers and
young children; and Increase in early child mortality. Previous research had shown that
clinical symptoms of micronutrient malnutrition such as anaemia, vitamin A deficiency and
increased levels of illness can appear within 2–3 months, before symptoms such as wasting32
are evident (Linnda Kiess et al. 2000; Block et al. 2004; Klotz et al. 2008). This has important
implications for surveillance. Klotz et al. (2008) recommend tracking four main indicators:
vitamin A status and thinness in mothers, and anthropometry (wasting and stunting) and
haemoglobin levels in young children to identify populations at risk and target short‐term
interventions. Christian (2010) suggests that zinc levels are also important.
What is the evidence on nutritional impact?
Only a few nutritional surveys related to rising food prices were available at the time of writing33 and
only one (Suleiman et al 2009) contained a rigorous panel study. However a combination of these
with information on food consumption and decreased dietary diversity from rapid field studies34
together with the documented linkage between nutrition outcomes and diet gives us confidence
that the predictions above were broadly correct.
Some key points were (see Table E, Annex 1 for details): 1. Young children appeared to be the hardest hit in nearly all cases, as predicted. Under‐twos were often the worst affected, but not in every case. The Cambodia Anthropometrics Survey (2009) pointed out that the 2–5 age group was also badly affected, and that “the improvements for [younger] groups … will be erased if we do not react to the worsening nutrition status of older children”.
2. Several studies showed large increases in levels of percent wasting in young children. For example, Sulaiman, Parveen, and Das (2009) documented a statistically significant increase from 13.5% to 21% wasting in urban children and from 17% to 26% in rural children. ‘Children who suffer from wasting face a markedly increased risk of death. ’ (UNICEF 2009). However, some studies failed to show significant effects on child weight 6–9 months after price rises (e.g. Action Contre La Faim
32 Wasting is an indicator of severe acute malnutrition. It is defined as weight for height below minus two standard deviations from the median weight for height of the standard reference population (UNICEF 2009) 33 Many national nutrition surveys are due to report next year, see for example http://www. reliefweb. int/rw/rwb. nsf/db900SID/MDCS‐82DKLT?OpenDocument. The table is also missing some UNICEF nutrition surveys, which we were not able to locate. 34 For references see point 5 below.

46
2008a; Action Contre La Faim 2008b). This could have been for a variety of reasons, including the fact that mothers may reduce their own diet to maintain children’s consumption (Action Contre La Faim 2009; Bhutta et al. 2009) and dependence on a variety of staple foods in some countries under study. 3. Increased stunting was not recorded as frequently as wasting. Two studies reviewed (Sulaiman, Parveen, and Das 2009; Uraguchi 2009) did record stunting increasing in small children, as did a study from an earlier economic crisis in West Africa (Martin‐Prevel et al. 2000). The biological factors underlying stunting are still poorly understood, with zinc deficiency (Bhutta et al. 2008), multiple micronutrient deficiency (Rosado 1999) and poor food absorption due to serious gut infections (Humphrey 2009) all implicated. Stunting can also result from poor maternal nutrition following price rises, as shown by Gitau et al (2005) in Zambia. In this study, infants born to middle‐class urban mothers pregnant during the times of highest maize prices were stunted, leading the authors to conclude that ‘cheap multiple‐micronutrient supplements [should be provided] even to people, especially pregnant women, not receiving bulk food aid’. 4. Evidence from previous crises is that a rise in micronutrient deficiencies can be widespread, with the long‐term effects often going undetected. Following the earlier Indonesian economic crisis, for example, mean child haemoglobin declined by 7%, and anaemia rose from 52% to 70% over 1.5 years. ‘The largest declines were for cohorts born or conceived during the crisis’ (Block et al. 2002, Block et al. 2004b). It is very likely that micronutrient deficiencies also increased in this crisis, as predicted. However, we were not able to locate robust measurements on changes in micronutrient levels following price rises in 2007/8, despite calls for such evidence to be collected (Klotz et al. 2008). There is some indirect evidence of increased micronutrient malnutrition from the declines in Dietary Diversity Scores recorded following food price rises (e.g. Sanogo 2009; Holleman and Moloney 2009; WFP/UNICEF/IPHN 2009). Dietary diversity measures count (and sometimes weigh) different foods or food categories to give a measure of the diversity of the diet35. Positive correlation has been recorded between individual Dietary Diversity Scores and micronutrient intake in both young children (Kennedy et al. 2007; Moursi et al. 2008) and women (Mirmiran, Azadbakht, and Azizi 2006) although more work to refine scores is needed (Ruel 2003).
5. In contrast to studies from previous economic crises, e.g. in West Africa and Indonesia, no significant increase in weight loss was reported in women. In fact two studies (Cambodia Anthropometrics Survey 2009; Sulaiman, Parveen, and Das 2009) reported a significant decrease in the prevalence of underweight women, even in the poorest groups. This is quite a surprising finding, as weight loss in women has been an early consequence of earlier economic crises and for this reason maternal Body Mass Index (BMI) has been suggested as one of the leading indicators for under‐nutrition in a community, as mentioned above (Bloem, Pee, and Darnton‐Hill 2005; Klotz et al. 2008). However thinness in women36 was still at unacceptably high levels in poor regions, for example 31% in rural Cambodia. The prevalence of underweight women has been decreasing in most countries over the past few years and it is possible that higher food prices slowed down this improving trend. Moreover, decreased dietary diversity resulting from higher food prices can have serious effects on micronutrition (see above) that are not picked up in a simple weight indicator. Having said this, it is worth noting that changing diets throughout the developing world are also
35 Dietary Diversity Scores (DDS) have been defined and used in different ways. (Swindale and Bilinsky 2006) provide a guide to the use of Household DDS as a measure of access to food, while (Ruel 2003) discusses the evidence to date and challenges for both individual and household DDS. 36 In these studies thinness was defined as Body Mass Index (BMI) below 18.5 kg/m2
47
leading to a ‘dual crisis of malnutrition and obesity’ in all but the very poorest developing countries, and that in many countries “a surprisingly large percentage of households have both obese and underweight members” (Popkin 2001; Monteiro et al. 2004). For example, 70% of women aged 20‐49 in Mexico are now either overweight37 or obese (Teruel Belismelis 2010), while in a recent survey in Lesotho, about half the women were obese (Lesotho VAC 2009). A typical pattern in richer countries, where obesity is much more prevalent, is that food price rises lead to weight gain and micronutrient loss as people move to cheaper, filling foods. This is likely to have happened in some developing countries during 2007‐8, particularly wealthier urban areas (Rosen and Shapouri 2008), but very little data was found on this. See further discussion below.
Care must be taken in interpreting nutrition data. “Part of the reason for the popularity of nutritional
indicators is that they are standardised. . . comparable across different locations, easily interpreted
and relatively straightforward and inexpensive to gather. However ‘malnutrition’ … may or may not
indicate food insecurity, and ... poor methodological procedures have sometimes rendered
nutritional assessment results questionable” (Maxwell et al. 2008).
37An adult who has a “body mass index” (BMI ) between 25 and 29.9 is considered overweight, and an adult who has a BMI of 30 or higher is considered obese. (Rosen and Shapouri 2008), citing the World Health Organisation).

48
Box 4: Unbalancing the diet
When the price of the shopping basket goes up, households cut back on more expensive foods. In
poor households this can mean cutting out vital micronutrients. The studies reviewed here noted the
effects on nutrition of the balance between different food groups consumed:
‐ Vegetables and fruit “. . . [in rural Bangladesh] the key food group with respect to micronutrient
consumption is vegetables, providing nearly 95 percent of vitamin A intake, 75 percent of vitamin C
intake, and 25 percent of iron intake. Vegetables are the least expensive sources of all of these
nutrients ” (Bouis and Novenario‐Reese 1997). Campbell et al. (2010) also found for rural Indonesia
that expenditure on ‘plant (non‐ grain) foods’ was very strongly (P<0.00001) associated with reduced
odds of under‐5 mortality.
In previous crises, high food prices have frequently led to reduced fruit and vegetable consumption.
Evidence in this crisis was mixed. While some surveys (e. g. Cambodia, Sierra Leone) reported
declining consumption, especially among children, others (rural Bangladesh, Gansu in China)
reported steady or increased vegetable consumption. In the case of Gansu this was due to cabbage
and other vegetable prices remaining low in comparison to cereal prices, while in Bangladesh many
poor families collected wild green leaves to supplement their diet. (WFP/FAO 2008b; S de Pee et al.
1998)
‐ Oils and fats In small quantities these are vital for health, including for absorption of some key
vitamins. Some studies (e.g. Bangladesh and Hunan, China) reported reduced household oil
consumption in 2008, and studies from previous crises, e.g. Block et al (2002), have also documented
significant drops in consumption.
‐ Products of animal origin including eggs, milk and meat. These expensive and nutrition‐rich foods
were cut back in nearly every case examined, being substituted by increased consumption of lower‐
cost vegetables, pulses, or sometimes cheaper varieties of fish (see also West and Mehra 2010).
Whether this makes a major difference to the nutrition of the most vulnerable family members,
however, depends on the nutritional value of the chosen substitutes, plus the distribution of food
within the household (Campbell et al. 2008). In some earlier studies (e.g. Frongillo and Begin 1993)
(Bouis and Novenario‐Reese 1997), men and older boys, not the nutritionally most‐vulnerable, were
found to consume the lion’s share of animal‐origin foods. It is very unlikely that subsidising meat
prices, as suggested for example by Valero‐Gil and Valero (2008) for Mexico, would be a cost‐
effective way of improving nutrition.
‐ Starchy staples are normally the last part of the diet to be cut back. However in some parts of the
world, cheaper local staples such as millet or cassava were substituted for imported rice following
price rises (e.g. Akindès 1999). The nutritional impact of such substitution varies: while local grains
may have a higher nutritional value than white rice, cassava normally has a lower nutritional value,
and can pose a risk to the nutrition of small children if it is used as a substitute for grain (Okigbo
1980).
49
Key changes leading to malnutrition
The three most important factors likely to explain increased malnutrition in the studies examined were:
Cutting back complementary (transition or weaning) foods for infants, and other special foods for young children. Young children were fed from the family pot instead of being given special nourishing foods such as milk, meat, eggs and fruit. Many households in urban areas stopped purchasing high‐energy and fortified commercially‐purchased complementary foods and switched to home‐prepared foods (Table E Annex 1). This is likely to have a serious effect on micronutrients as well as the energy density of the diet, which is critical for infants (Bhutta et al. 2008; Dewey and Adu‐Afarwuah 2008) 38. ‘…Complementary feeding is the most effective intervention that can significantly reduce stunting during the first two years of life’ (UNICEF 2009). One area of nutrition work which has grown significantly since the food price spike is the provision of high‐nutrition Ready‐To‐Use Foods (RUFs) for small children at high risk of under‐nutrition (formerly such foods were used mainly in treatment of severely malnourished children), although the production and circumstances in which commercial RUFs should be used have been enthusiastically debated (Enserink 2008).
Switching to a poorer quality family diet (see Box 4).
Hygiene, caring and healthcare: Two of the studies in Table E (Annex) noted increased diarrhoeal episodes among young children; these can be both a cause and consequence of malnutrition (UNICEF 1998, Black et al 2008). Several studies (see Section 6) reported savings made by cutting purchases of soap and detergent, and increased workloads for mothers and older children, leading to less caring time for small children. A study in Kenya also raised concerns about cut‐backs in water use by the urban poor, many of whom purchase water (Kenya Food Security Steering Group 2008). Worsening care and hygiene potentially has a serious impact on malnutrition (UNICEF 1998; Humphrey 2009). A decrease in access to healthcare may also increase malnutrition levels (UNICEF 1998), although the very low quality of healthcare often available to the poor in practice means that this is far from certain; this area requires further investigation.
What are the lessons?
1. The limited evidence available supports predictions that nutrition would suffer when food prices
rose. The most important area for policy focus is maintaining dietary diversity, especially in
complementary (weaning) foods for young children.
2. The most notable difference from similar studies in previous economic crises was that there was
no evidence of weight decline (on average) in women, indeed two studies reported a decline in
the proportion of thin women between 2005/6 (before major price rises) and 2008. However it
is likely that micronutrient malnutrition increased in women due to declining dietary diversity.
38 However, the nutritional impact of family sharing depends on the family and the context. For example a study in Nepal showed that ‘plate‐sharing’ can lead to young children getting a more diverse and high‐nutrition diet or a more deficient diet, depending on whether they share with adult females or males (Shankar et al. 1998)

50
Areas for further investigation There are a number of important areas where more evidence would be useful to inform policy.
These include:
Improved nutritional surveillance, especially for micronutrients
The most important area where more information would be useful is more frequent and sustained
nutritional surveillance, particularly on micronutrient status, to provide decision‐makers with timely
information on both onset and recovery (Linnda Kiess et al. 2000; Klotz et al. 2008; John Mason
2009). Most current surveillance systems do not cover micronutrients: one exception is the regular
surveillance carried out by Action Contre le Faim in Malawi (Hauenstein Swan 2009). Another
difficulty with many of the indicators currently used is that they collect information at the level of
the household rather than the most vulnerable individuals within in it (Aiga and Dhur 2006).
Substantial work has however been carried out to develop indicators of dietary quality of young
children (Arimond, Daelmans, and Dewey 2008).
Monitoring a wider variety of food prices.
While world monitoring systems have concentrated mainly on rising grain prices, prices of other
foods have been quite variable and have often not been published. Relative prices of other foods
are important as they may affect dietary diversity. For example, a few cases have been recorded
where nutritional outcomes have actually improved when prices of complementary foods such as
pulses or fish have risen significantly less than the price of the main staple, e.g. at the end of the
‘hungry season’ in Burkina Faso (Savy et al. 2006) as well as during the recent period of high grain
prices in parts of China (Jensen and Miller 2008b). However, this is not thought to be common.
Monitoring prices of key pulses, fish and vegetables (for example) on a more systematic basis might
be helpful in some areas.
Timescales for onset and recovery from malnutrition
We found little information, even from earlier studies, on changes over longer timescales and
recovery from malnutrition. Recovery of children from severe malnutrition can take several months
even with intensive feeding (Webb 2002; Navarro‐Colorado, Mason, and Shoham 2008). Three years
after the Indonesian economic crisis, ‘early childhood weight for age had not yet returned to its [pre‐
crisis] level, whereas haemoglobin concentrations in mothers and children and the maternal BMI had
recovered. The period of nutritional recovery was slow, possibly due to losses in wealth. . . ’ (West
and Mehra 2010, based on Block et al. 2004). Stunting may also be a permanent consequence of a
food crisis (Hoddinott and Kinsey 2001); catch‐up growth is possible, but mainly for the youngest age
group (Martorell, Khan, and Schroeder 1994).
Effect on the dual crisis of malnutrition and obesity:
As mentioned above, obesity and related health problems are rapidly becoming a second nutritional
crisis in all but the very poorest developing countries (Popkin 2001). Rapid urbanisation for example
has contributed to dietary and other changes that have promoted obesity (Rosen and Shapouri
2008). Many well‐intentioned policy responses to high food prices, for example poorly‐targeted
subsidies on staples, may inadvertently increase obesity through encouraging diets relatively high in
energy and poor in nutrients (see Asfaw 2006 for evidence from Egypt). In the USA, Food Stamp
Program participation was found to be positively related to obesity in low income women (Gibson

51
2003), while both in China (Guo et al. 1999; Jensen and Miller 2008a) and Russia (Dore, Adair, and
Popkin 2003) lower food prices resulted in higher fat consumption39. Research in rural Mexico
(Fernald, Gertler, and Hou 2008) showed that a doubling of cash transfers led to higher prevalence
of overweight and obesity (e.g. for overweight, odds ratio = 1.41, P < 0.0001). Recent research in
Israel showed that sensitivity to food prices when shopping— not wealth per se — was the most
important predictive factor in obesity levels (Gandal and Shabelansky 2010). Further research would
therefore be useful on the design and nutritional impact of such policy responses.
Effectiveness of nutritional education as an additional policy response
The Lancet nutrition review (Bhutta et al. 2008) found that nutritional education about
complementary feeding was an effective intervention when combined with help to acquire food
where needed. Foods of similar cost may vary greatly in their nutritive value (Maillot et al. 2008),
and individual and cultural factors are well‐known to influence selection of food (Joel Gittelsohn and
Vastine 2003). Torlesse, Lynnda Kiess, and Martin W. Bloem (2003); Campbell et al. (2008); and
Mayang Sari et al. (2010) found that households which allocated a higher proportion of their food
budget to more nutritious (non‐grain) foods had a lower prevalence of underweight children and
under‐5 mortality. Poor infant and young child feeding practices are major factors for the nutritional
situation Block et al (2002) noted during the Indonesian economic crisis that ‘a subset of mothers
seemed aware of the importance of micronutrient‐rich foods, and their children were better
protected from the crisis than others’. In follow‐up studies, Block (2004, 2007) found that mothers’
knowledge of nutrition issues was important in dietary diversification and nutritional outcomes
following the Indonesian economic crisis, and that this was mainly accounted for by exposure to
nutrition education at schools and clinics. Together, these findings suggest a possible role for
nutrition education alongside other support to households when food prices rise. This is supported
by WFP/UNICEF/IPHN (2009), who recommend that nutrition education, especially for infant and
child feeding practices, ‘deserves priority attention’ within the context of the food price spike.
Hoffman (2009) has noted however that the demand for more nutritious food is often limited by the
time and effort needed to acquire and prepare it, and the fact that poor consumers may not feel any
benefits from improved micronutrition due to the great variety of other factors affecting individual
health. More information is needed about the cost‐effectiveness of nutrition education alongside
social transfers and provision of food aid.
Food safety
The quality of food consumed was not examined in any of the studies reviewed, but could also have
a negative impact on health and nutrition (WHO 2009). Insect‐damaged or mouldy grain is cheaper
(Compton et al. 1998) and is frequently purchased and consumed when food is scarce or expensive.
Poor‐quality, especially mouldy, food is a well‐known health hazard (Henson 2003; Bhat 2008).
Increased consumption of street food as a response to rising food prices, particularly in urban areas
(Haiti CNSA 2008; Burkina Faso Joint Assessment 2008) may also raise food safety issues (Akindès
1999; Fouere et al. 2000; Ruel et al. 2010). However we have not found any attention being given to
this issue in policy responses. Tinker (1997) discusses food safety issues in street food in detail,
39 However (Jensen and Miller 2008a) also found that in one province (Hunan) subsidies on rice led households to consume less rice and pulses and more fish. So the nutritional picture can be complex.

52
concluding that training vendors and providing more sanitary conditions near vending sites would
have the most positive impact.
Breast and bottle feeding
The UN Standing Committee on Nutrition (2008) raised concerns about health risks if mothers
started to dilute formula milks following price rises. Concerns have also been raised (Coutsoudis and
King 2009; Gupta 2009) about commercial promotion of formula milk in economic crises, in
particular through donations of formula. Mothers may also reduce breastfeeding under pressure to
take on additional income‐generating activities to make ends meet when prices rise (UN Vietnam
2008). Where water is contaminated, an early end to exclusive breastfeeding may carry major health
and nutritional risks. However we could not locate much evidence on changed practices in this area
following food price rises. Delpeuch et al. (1996) reported little or no change in early breastfeeding
practices and age of introduction of complementary (weaning) foods in Senegal and Congo‐
Brazzaville following a 50% devaluation of the CFA franc. Martin‐Preval et al (2000) recorded longer
breast feeding periods40 in Congo in the same crisis.
40 Prolonged breastfeeding is a frequent reaction by mothers to poor growth in infants, and has been found to decrease stunting (Simondon et al 2001) and early symptoms of vitamin A deficiency (Keith P. West and Mehra 2010)

53
8. How important was the international food price spike in the context of other international crises and economic shocks?
Poor households are vulnerable to economic shocks from many sources, including ill health,
insecurity of employment, and price variability which affects both producers and consumers. Food
prices vary seasonally in most countries, and in some inland locations such annual (nominal) price
variation can be more than 100%. Furthermore, the world food price spike took place in a rapidly‐
changing international context of increasing world fuel prices, the falling dollar and the world
financial crisis. Given this complex context, how important really were high food prices to poor
people in 2007–09?
Two strands of work have been carried out: qualitative interviews, i.e. asking the poor their opinions
on food prices and other shocks affecting them, and quantitative modelling.
In 2008, in surveys in countries as diverse as Haiti, Nepal, Swaziland and Ethiopia, the vast majority
of people interviewed rated food prices as the highest or second highest shock to the household (
Box 5). Surveys of the global economic crisis in 2009 and 2010 (Yap, Reyes, and Cuenca 2009;
Hossain et al. 2010) found that high food prices were still a top concern for many households.
Box 5 How important did high food prices feel to poor households in the context of other shocks? Country examples
In Swaziland, “households were asked to name the three main shocks that affected their ability to access food
or other basic needs in the past six months. Most (82%) households reported being affected by unusually high
food prices, followed by unusually high fuel prices (51%), loss or reduced employment of a household member
(17%), serious illness or accident of a household member (12%), reduced income of a household member
(11%), electricity or gas cuts (10%), drought/irregular rains (9%), and the death of a working household
member (8%). Food prices were most important for brewers, cash crop producers and households dependent
on pensions or remittances, while food crop producers were most affected by fuel price increases, and for
households dependent on wage labour, loss of or reduction in employment was the main shock (experienced
by 35% of households)” (Swaziland VAC/WFP 2008) .
In urban Ethiopia, Alem and Söderbom (2010) interviewed 709 households in a panel study about shocks
between 2004 and 2008. Over this period, 96% of the households reported some type of shock, ranging from
increase in food (94%) and fuel (74%) prices, to sickness, death or loss of employment of a family member (all
under 10%). When asked to rate the most influential shocks, 87% of the households rated food prices as most
important, with no other shock rated as the most important by more than a small fraction of households.
In Haiti (Haiti CNSA 2008) the households reported suffering an average of four shocks in the previous 12
months. Food price rises were classed as most important by nearly 4 out of 10 households and as second most
important by a third. Fuel price rises were the second most important shock reported.
In Nepal, the top four shocks reported in the last three months were food prices followed by loss of employment, disease and drought/bad weather (rural) or conflict/crime (urban). (WFP Nepal/NDRI 2008a)
Models, meanwhile, came to variable conclusions. While direct effects (those felt by consumers)
were nearly always estimated to be much greater for food prices, the world fuel price increase was

54
estimated to have a greater poverty effect than the food price increase in some countries when
accounting for indirect effects such as transport costs and input prices. Arndt et al. (2008) using a
CGE model for Mozambique estimate that “the fuel price shock dominates rising food prices from
both macroeconomic and poverty perspectives....” Similar results were calculated for neighbouring
countries characterised by large rural sectors and high transport costs: Dessus (2008) for Tanzania
and Conforti, Ferrari, and Sarris (2009) for Malawi. In Ghana, Parra and Wodon (2008) find using a
Social Accounting Matrix that “both the direct impacts of food prices and the indirect impacts of oil
prices are potentially large, so that both should be dealt with by authorities when considering
compensatory measures...”.41 At the national level, fuel prices are overwhelmingly important for the
balance of payments: the IMF (2008) calculated that “The oil price increase would severely weaken
the external position of 81 countries, while the food price increase would have a severe negative
effect for 16 countries.”
Models have also calculated an important difference between food price rises and other economic
crises in their effect on poverty and equality. While high food prices disproportionately affect the
poorest, in many countries high fuel prices disproportionately affect the richest, urban populations,
and fuel subsidies have been estimated (through leakage) to benefit the rich more than the poor
(Coady et al. 2006; IMF 2008; Kpodar and Djiofack 2010). Global financial crises also typically have
most impact on the urban middle class (those with incomes of $2‐$3 a day, often working in the
formal sector, rather than the poorest, who typically work in the informal sector (Ravallion 2009;
Habib et al. 2010)
Both approaches have strengths and weaknesses. Modelling covers a limited number of factors and
scenarios. Asking people about factors affecting their lives can give a richer and more complex
picture, but people aren’t always aware of causality: for example, they may underestimate the
importance of high fuel prices as a driver of high food prices. There is also a risk that survey
respondents are saying what they think interviewers would like to hear, especially if they think the
interviewers are from a food aid programme. Finally, both approaches may potentially represent a
snapshot of current conditions, ignoring seasonal and other long‐term variations.
What is clear is that poor people feel food inflation very directly, and this is a key indicator of well‐
being. As Hossain et al. (2010) headline in a follow‐up report on the global economic crises: “the
affordability of food remains a key concern”.
41 “Passa Orio and Wodon (2008) estimate the longer term impact of specific commodity price spikes on the price of other commodities through a social accounting matrix multiplier approach, finding that indirect effects are significantly larger for oil than they are for food in three of eight countries sampled” (Headey and Fan 2008). We did not see the original reference, which is given as a World Bank mimeo, May 2008.

55
9. Conclusions
Key findings and policy implications
Table 3 below summarises the published evidence for the prevalence and severity of different
effects of food price rises.
Table 3 Summary of evidence on the impact of the 2007‐8 food price spike on the poor
TYPE OF IMPACT PREVALENCE (across countries)
SEVERITY (in affected
areas/groups)
HEALTH AND NUTRITION
Micronutrient malnutrition increased ** *
Undernourishment of young children increased (anthropometric measures, e. g. low weight for height) ** ***
Weight loss in women * ***
Reduced spending on healthcare ** *
POVERTY AND LIVELIHOODS
Loss of purchasing power ** *
Increased workloads ** *
Increased household indebtedness ** *
Reduced spending on children’s’ education / pulling children out of school ** *
Sales of household assets to buy food ** *
Increased migration for work ** **
EQUALITY AND COMMUNITY
Economic inequality increased ** *
Family and community stress: Giving less help to neighbours and friends, stress and conflict in the family, increase in begging, thieving, prostitution, spin‐off risks (e. g. of increased HIV from migration or prostitution) * *
Gender inequality and disempowerment increased * * Notes: The colour represents the authors’ overall judgement on impact, triangulating different data sources. Intensity increases from light green (no significant effect) to light yellow (not widespread/low severity) through orange to red (very widespread /severe for those affected). No numbers are given as the data are not strong enough to average. Some numerical data from individual studies e.g. nutrition are given in the tables in Annex. Grey indicates insufficient evidence – in some cases there are plausible predictions (e.g. of impacts on gender equality) but very little evidence. The asterisks represent our judgement of the quality of evidence: * = poor, ** = moderate *** good (at least some rigorous individual studies).

56
Major impacts were recorded in:
Nutrition: The prevalence of underweight and wasting in young children went up by about
half in surveys in Bangladesh, Cambodia and Mauritania following food price rises (e.g. from
17% to 26% wasting in rural Bangladesh). Among the factors responsible were cut‐backs on
special complementary (weaning) foods, as well as reduced consumption of more expensive
and nutritious foods. Food price rises led to a widespread reduction in dietary diversity,
which is a predictor of micronutrient malnutrition (for example deficiencies in vitamin A and
iron).
Livelihoods and poverty: The rise in food prices had a major effect on purchasing power,
with the poorest households – who can spend up to 70% of their budget on food — being
hardest hit. In the vast majority of countries, wages did not rise to match prices. The worst
affected groups were people in the informal sector, such as day labourers and petty traders,
and small‐scale famers without enough land to produce a food surplus. Only a small minority
of households (1‐5% of those surveyed) reported very damaging, potentially irreversible
livelihoods changes, such as selling productive assets to buy food, but this still represents
many thousands of people. One unexpected finding was that credit was very widely used to
buy food, raising concerns about increased indebtedness (see below).
Equality: Rising inequality is another disturbing finding which has not been given much
prominence in the literature. The bulk of the poverty impact of rising food prices is
estimated to have come from increasing depth of poverty in the group of people already
under the poverty line — many of whom live in rural areas (see below) —rather than
increasing numbers of ‘new poor’. Regional inequities also increased: for example dry, food‐
deficit rural regions became poorer. The regressive effect of rising food prices stands in
contrast to some other types of economic crises. For example the international financial
crisis and high fuel prices are estimated to have had most effect on the urban middle class
and those working in the formal sector (with some exceptions).
Children. While households may be able to bounce back from a short term economic shock,
the effect on individual children may last a lifetime. The effect of malnutrition on lifetime
health and earnings prospects has been well documented. Children also suffered from the
drop in money available for education, healthcare and other benefits, and in the worst cases
they were pulled out of school and sent to work. More subtle impacts reported included
decreased attention from parents working harder to make ends meet, and increased
stresses in families and communities. Research by the Young Lives Project (Dercon 2008)
has highlighted that the physical and psychological scars of a period of poverty and hunger
can blight aspirations, promote social exclusion and heighten inter‐generational
transmission of poverty.
This review also highlighted some findings which may be surprising to some and have been
frequently neglected in policy responses to rising food prices.
1. Rural consumers: The greatest impact was on the poorest consumers, and in the majority of
developing countries, the greatest number of them live in rural areas. Although the urban poor were
sometimes worse affected by high food prices in relative terms, they generally started from a higher
standard of living than the rural poor. The most damaging behavioural responses to rising prices

57
(such as selling off productive assets to buy food) and the highest levels of malnutrition were
generally (although not invariably) reported from rural areas.
Most of the initial policy responses (such as food subsidies) focused on the urban poor. This is
understandable as the urban poor were themselves badly affected, are easier to reach and have a
stronger political voice. However, there is a risk that the deepening poverty among rural consumers
may not be addressed.
Much of the assistance directed at the rural poor has treated them largely as producers, not
consumers. Where the conditions exist, helping people increase their food production is a sensible
policy response. However, assistance to producers — unless very carefully targeted — is likely to
disproportionately benefit larger farmers with better access to land and markets. Many of the rural
poor face ‘hard’ constraints on land, labour or water which make it difficult for them to produce a
surplus. In many countries only a small fraction of poor and vulnerable people are assisted by any
type of safety net programme, and the task of broadening coverage is urgent.
2. Finance for the poor. A high proportion of poor people reported taking credit to buy food.
In countries where microfinance provision was strong, such as Bangladesh, many poor people could
access credit at reasonable rates. Elsewhere, they used moneylenders, pawn brokers and other
sources of expensive credit, and concerns were raised about increased indebtedness. Finance was
also reported as a major constraint to increased food production by smallholders in many areas.
Although finance for the poor is an important area of international assistance, and it is well known
that finance can help poor households cope with shocks, this area of policy was hardly mentioned in
this crisis. Existing microfinance institutions were stretched and some reported liquidity problems.
More attention should be paid to this area in future, in the context of food price volatility.
3. Education and school feeding policy. The behavioural surveys highlighted the large numbers
of children being removed from school in some locations when food prices rose. Even short‐term
removal from school may lead to permanent drop‐out and irreversible changes in children’s life
chances. However, in other locations, parents cut back on other expenses to keep their children in
school. Understanding what factors help keep children in school during a food crisis (for example
flexible schooling and payment systems, social transfers and/or school feeding) is important and
requires more in‐depth qualitative analysis than has been located in this review.
4. Access to healthcare and health outcomes. The behavioural surveys highlighted cutbacks
in use of healthcare as one area of savings made in response to high food prices. However, some
cutbacks may have little impact on health outcomes (e.g. switching to generic medicines) while
others may be very damaging. Further research is needed to understand the impact of economic
shocks on health seeking behaviour and how best to improve health outcomes.
5. Women: It was plausibly predicted that the greatest impacts of the food crisis would be on
women, including on nutrition, workloads and female‐owned assets. However, little data was found
to substantiate these predictions, with the exception of Bangladesh where several studies reported
slightly greater weight loss and school absences in young girls than boys (sections 6 and 7). More
research is needed in this area. However several studies did report poorer food consumption and
58
lower dietary diversity in female‐headed than male‐headed households, as predicted.
One surprising finding was that little weight loss was documented in women, in sharp contrast to
earlier economic crises where weight loss in women was an early effect of rising prices (and indeed
had been suggested as a leading indicator). On the contrary, the prevalence of women’s thinness
(Body Mass Index below 18.5 kg/m2) decreased during the period of high food prices in two studies
of very poor women from Bangladesh and Cambodia. Having said this, thinness in women was still
at unacceptably high levels, for example 31% in rural Cambodia. The prevalence of underweight
women has been decreasing in most countries over the past few years and it is probable that higher
food prices slowed down this improving trend. Nevertheless, it would be worth exploring this
question further.
Quality of evidence
Table 3 also summarises our judgement on the available evidence (a detailed version can be found in
the Annex as Table F). The general conclusion is that the evidence base is moderate as regards
prevalence and weak, except in a few instances, for severity. There were very few rigorous studies
available on the severity of nutritional impacts42 , and no studies were found to provide robust data
on some other key impacts such as the degree of household indebtedness and sales of household
assets.
Even when there is good documentation on changes in poverty or nutrition, attributing observed
changes to food price rises is very challenging. This is because many local and international factors
affect insecurity and poverty. Internationally, high food prices were accompanied by high fuel and
farm input prices, and swiftly followed by a global financial crisis. Within countries, many other
factors, including regular seasonal price changes, can potentially be confused with the effects of
externally‐induced food price rises. Two main approaches were used to try to link cause and effect:
(a) comparing the situation before and after food price rises, and (b) statistical modelling. Very few
researchers had access to good‐quality data collected immediately before prices rose. Many field
studies asked people directly what had changed in their lives, and how important food prices were
compared to other causes. This has common sense appeal, and does help to capture the complexity
of how people experience and react to high food prices and other external changes; however it is
open to error due to limits on respondents’ memory and understanding (see discussion on food vs.
fuel prices in previous section). Modelling offers a statistical tool for disentangling different linkages,
but cannot prove causality, and it is often not possible to get the quality of data required.
Recommendations for further research
To recap the introduction to this paper, measuring and understanding impact has four main practical
objectives. These are:
a) To come up with an overall estimate of the poverty impact of the international food price
shock, mainly for advocacy purposes (to encourage international assistance).
42 Quick‐moving agencies and funders such as BRAC and DFID’s office in Bangladesh are to be commended for investing in some of the very few rigorous studies available.

59
b) To identify the areas, households and people who are worst affected, in order to target and
design appropriate assistance and policy responses.
c) To estimate the resources needed for mitigating the impact of food prices, to inform
budgetary allocations in country governments and for international assistance.
d) To understand the nature of impacts, in order to develop appropriate policy measures for
mitigating future shocks.
Of these objectives, we would argue that only (a) was fully attained in the context of the recent
world price spike. Quick responsive modelling by the Bank, FAO and other agencies produced
credible estimates of people in need, and these were successful (in combination with media and
political pressures) in mobilising substantial international funding to tackle the ‘food price crisis’.
There was also some success with objectives (b) and (c). However, as discussed in Section 3 of this
review, there was still considerable duplication and lack of harmonisation of international efforts to
address the food price spike, with some inconsistent results regarding which countries and areas
should be prioritised for assistance. One specific problem is that there are few well‐established
international standardised measures for food insecurity, and even where such methods exist, field
studies do not always use comparable methods, making comparisons between countries and areas
unreliable. In a crisis, rapid, proxy and relatively non‐intrusive measures are needed, so the ongoing
work to further calibrate and standardise international indices such as Dietary Diversity Scores and
the Reduced Coping Strategy Index (Section 6) deserves support. Field staff also need to be trained
to use such indices in a standardised and comparable way. Although progress has been made in
agencies working together to further develop and harmonise their methods, there is still much to be
done.
As regards objective (d), we would argue that further research is needed. Understanding how poor
people react to shocks is critical in designing appropriate policy measures, but few of the studies
reviewed here had the resources to do any in‐depth analysis. Some of the most important areas
which could benefit from further research are listed above; other topics are listed at the end of each
chapter.
Concluding remarks
The effects of the 2007/8 food price spike are still being felt. Food prices still remain high and
volatile in many countries, and the effects are compounded by the fall‐out from the global economic
crisis. Many predict that world food prices will rise again soon, with increasing global demand and
poor harvests in some areas (e.g. Russia, Pakistan) in 2010. When an economic crisis strikes,
governments and international agencies need tools and methods both to rapidly identify areas,
households and individuals in need of external assistance and to design cost‐effective policies to
mitigate impacts. An in‐depth understanding of impacts of high prices on the poor, in particular how
poor people cope with high prices, is vital for these objectives.
This paper is part of a series by ODI on high and volatile world food prices. Other papers in the series
deal with the causes of the price spike, country policy responses, and policy options for mitigating
the impact of future high food prices. See
http://www.odi.org.uk/work/projects/details.asp?id=1131&title=high‐world‐food‐prices

60
10. References
ACF-IN/MSF. 2009. One Crisis May Hide Another Food Price Crisis Masked Deadly Child Malnutrition. A Briefing Paper by Action Contre la Faim and Medicins sans Frontieres on the occasion of the UN High Level Meeting on Food Security for All. http://www.docstoc.com/docs/19848232/One-Crisis-May-Hide-Another-Food-Price-Crisis-Masked-Deadly-Child.
Action Contre La Faim. 2008a. Freetown Nutrition Assessment: “Rising food prices and nutritional status of children” Sierra Leone 1 October- 11 November 2008. Action Contre La Faim (ACF), unpublished report by Sophie Laurence.
———. 2008b. Evaluation de la situation nutritionnelle dans la ville de Bangui; quel impact de la crise alimentaire mondiale dans la capitale centrafricaine? Action Contre La Faim (ACF), unpublished report by B. Bauge and M. Broquet. September 2008.
———. 2009. Feeding hunger & insecurity: Field analysis of volatile global commodity food prices, food security, & childhood malnutrition. ACF/Hunger Watch, February 10. http://www.reliefweb.int/rw/RWFiles2009.nsf/FilesByRWDocUnidFilename/CJAL-7P5RSF-full_report.pdf/$File/full_report.pdf.
ADB. 2008. Food Prices and Inflation in Developing Asia: Is Poverty Reduction Coming to an End? Special Report. http://www.adb.org/Documents/reports/food-prices-inflation/Food-Prices-Inflation.pdf.
Ahmed, Sadiq. 2008. Global Food Price Inflation: Implications for South Asia, Policy Reactions, and Future Challenges. Policy Research Working Paper 4796. World Bank South Asia Region, December. http://www-wds.worldbank.org/external/default/WDSContentServer/IW3P/IB/2008/12/18/000158349_20081218084218/Rendered/PDF/WPS4796.pdf.
Ahmed, Zaved, and Camilla Nestor. 2009. Elevated Food Prices — Impact on Microfinance Clients. MICROBANKING BULLETIN, ISSUE 18, SPRING 2009: 6-8.
Aiga, Hirotsugu, and Agnes Dhur. 2006. Measuring household food insecurity in emergencies: WFP's Household Food Consumption Approach. Humanitarian Exchange Magazine 36 (Dec 2006). http://www.odihpn.org/report.asp?id=2852.
Akindès, Francis. 1999. Food strategies of urban households in Côte d'Ivoire following the 1994 CFA franc devaluation*1. Food Policy 24, no. 5 (October): 479-493. doi:10.1016/S0306-9192(99)00054-8.
Aksoy, Ataman, and Aylin Isik-Dikmelik. 2008. Are Low Food Prices Pro-Poor? Net Food Buyers and Sellers in Low-Income Countries. World Bank Policy Research Working Paper No. 4642, June 1. SSRN. http://www-wds.worldbank.org/external/default/WDSContentServer/IW3P/IB/2008/06/03/000158349_20080603171459/Rendered/PDF/wps4642.pdf.
Alderman, Harold. 2010. Safety Nets Can Help Address the Risks to Nutrition from Increasing Climate Variability. Journal of Nutrition 140, no. 1 (January 1): 148S-152. doi:10.3945/jn.109.110825.
Alem, Yonas, and Måns Söderbom. 2010. Household-Level Consumption in Urban Ethiopia: The Impact of Food Price Inflation and Idiosyncratic Shocks. March. http://www.soderbom.net/alem_soderbom_march10.pdf.

61
Arimond, Mary, Bernadette Daelmans, and Kathryn Dewey. 2008. Indicators for feeding practices in children. Lancet 371, no. 9612 (February 16): 541-542. doi:10.1016/S0140-6736(08)60250-0.
Arndt, Channing, Rui Benfica, Nelson Maximiano, Antonio M. D. Nucifora, and James T. Thurlow. 2008. Higher fuel and food prices: impacts and responses for Mozambique. Agricultural Economics 39, no. 1: 497-511. doi:10.1111/j.1574-0862.2008.00355.x.
Asfaw, Abay. 2006. The Role of Food Price Policy in Determining the Prevalence of Obesity: Evidence from Egypt. Review of Agricultural Economics 28, no. 3: 305-312. doi:10.1111/j.1467-9353.2006.00291.x.
Bassett, Lucy. 2008. Can Conditional Cash Transfer Programs Play a Greater Role in Reducing Child Undernutrition? Social Protection Discussion Paper no. 0835. The World Bank. http://siteresources.worldbank.org/SOCIALPROTECTION/Resources/SP-Discussion-papers/Safety-Nets-DP/0835.pdf.
Bauer, Jean-Martin, and Cecile Cherrier. 2008. GUINEA: RAPID ASSESSMENT REPORT ‘IMPACT OF HIGH PRICES ON FOOD SECURITY AND NUTRITION’. May. http://documents.wfp.org/stellent/groups/public/documents/ena/wfp181117.pdf.
Benson, Todd, Nicholas Minot, John Pender, Miguel Robles, and Joachim von Braun. 2008. Global food crises: Monitoring and assessing impact to inform policy responses. International Food Policy Research Institute (IFPRI). RePEc. http://www.ifpri.org/sites/default/files/publications/pr19.pdf.
Bhat, Ramesh V. 2008. Human health problems associated with current agricultural food production. Asia Pacific Journal of Clinical Nutrition 17 Suppl 1: 91-94.
Bhutta, Zulfiqar A, Tahmeed Ahmed, Robert E Black, Simon Cousens, Kathryn Dewey, Elsa Giugliani, Batool A Haider, et al. 2008. What works? Interventions for maternal and child undernutrition and survival. The Lancet 371, no. 9610 (February): 417-440.
Bhutta, Zulfiqar A., Fauzia Ahmad Bawany, Asher Feroze, and Arjumand Rizvi. 2009. THE IMPACT OF THE FOOD AND ECONOMIC CRISIS ON CHILD HEALTH AND NUTRITION. In DRAFT WORKING PAPER PREPARED FOR UNICEF CONFERENCE EAST ASIA AND THE PACIFIC ISLANDS, 6-7 JANUARY 2009, SINGAPORE. http://www.unicef.org/eapro/Crisis_and_Child_Health_Nutrition_ZB.pdf.
Block, Steven A, Lynnda Kiess, Patrick Webb, Soewarta Kosen, Regina Moench-Pfanner, Martin W Bloem, and C Peter Timmer. 2004. Macro shocks and micro outcomes: child nutrition during Indonesia's crisis. Economics and Human Biology 2, no. 1 (March): 21-44. doi:10.1016/j.ehb.2003.12.007.
Bloem, Martin W., Saskia de Pee, and Ian Darnton-Hill. 2005. Micronutrient Deficiencies and Maternal Thinness: First Chain in the Sequence of Nutritional and Health Events in Economic Crises. In Preventive Nutrition, ed. Adrianne Bendich and Richard K Decklebaum, 689-. 2nd ed. Totowa, NJ: Humana Press. http://www.springerlink.com/content/w662823287j83879/.
Bouis, Howarth E, and Mary Jane G. Novenario-Reese. 1997. The determinants of demand for micronutrients: an analysis of rural households in Bangladesh. http://www.ifpri.org/divs/fcnd/dp/papers/dp32.pdf.
Burkina Faso Joint Assessment. 2008. IMPACT DE LA HAUSSE DES PRIX SUR LES CONDITIONS DE VIE DES MENAGES ET LES MARCHES DE OUAGADOUGOU ET DE BOBO-DIOULASSO. Government of Burkina Faso with UN agencies and SCF UK, July. http://documents.wfp.org/stellent/groups/public/documents/ena/wfp187786.pdf.
Calvo, Cesar, and Stefan Dercon. 2007. Chronic Poverty and All That: The Measurement of

62
Poverty Over Time. Chronic Poverty Research Centre Working Paper No. 89 (August 1). http://www.chronicpoverty.org/uploads/publication_files/WP89_Calvo_Dercon.pdf.
Cambodia Anthropometrics Survey. 2009. Cambodia Anthropometrics Survey 2008: Initial findings of national survey. http://www.foodsecurity.gov.kh/otherdocs/CAS_INITIAL_FINDINGS_16_FEB.pdf.
Campbell, Ashley A., Saskia de Pee, Kai Sun, Klaus Kraemer, Andrew Thorne-Lyman, Regina Moench-Pfanner, Mayang Sari, Nasima Akhter, Martin W. Bloem, and Richard D. Semba. 2010. Household Rice Expenditure and Maternal and Child Nutritional Status in Bangladesh. Journal of Nutrition 140, no. 1 (January 1): 189S-194. doi:10.3945/jn.109.110718.
Campbell, Ashley A., Andrew Thorne-Lyman, Kai Sun, Saskia de Pee, Klaus Kraemer, Regina Moench-Pfanner, Mayang Sari, Nasima Akhter, Martin W. Bloem, and Richard D. Semba. 2008. Greater Household Expenditures on Fruits and Vegetables but Not Animal Source Foods Are Associated with Decreased Risk of Under-Five Child Mortality among Families in Rural Indonesia. J. Nutr. 138, no. 11 (November 1): 2244-2249.
CDRI. 2008. Impact of High Food Prices in Cambodia: Survey Report. Cambodia Development Resource Institute and others, October. http://documents.wfp.org/stellent/groups/public/documents/ena/wfp189739.pdf.
Christiaensen, Luc J, and Richard N. Boisvert. 2000. On measuring household food vulnerability : case evidence from northern Mali. Working Paper. Department of Agricultural, Resource, and Managerial Economics, Ithaca, New York: Cornell University. (February). http://www.csae.ox.ac.uk/conferences/2000-OiA/pdfpapers/christiaensen.PDF.
Christian, Parul. 2010. Impact of the Economic Crisis and Increase in Food Prices on Child Mortality: Exploring Nutritional Pathways. J. Nutr. 140, no. 1 (January 1): 177S-181. doi:10.3945/jn.109.111708.
Coady, David P., Moataz El Said, Robert Gillingham, Kangni Kpodar, Paulo A. Medas, and David Locke Newhouse. 2006. The Magnitude and Distribution of Fuel Subsidies: Evidence from Bolivia, Ghana, Jordan, Mali, and Sri Lanka. SSRN eLibrary (November). http://papers.ssrn.com/sol3/papers.cfm?abstract_id=944085.
Coate, Stephen, and Martin Ravallion. 1993. Reciprocity without commitment : Characterization and performance of informal insurance arrangements. Journal of Development Economics 40, no. 1 (February): 1-24. doi:10.1016/0304-3878(93)90102-S.
Coates, Jennifer, Edward A. Frongillo, Beatrice Lorge Rogers, Patrick Webb, Parke E. Wilde, and Robert Houser. 2006. Commonalities in the Experience of Household Food Insecurity across Cultures: What Are Measures Missing? J. Nutr. 136, no. 5 (May 1): 1438S-1448.
Coates, Jennifer, Anne Swindale, and Paula Bilinsky. 2007. Household Food Insecurity Access Scale (HFIAS) for Measurement of Food Access: Indicator Guide. August. http://www.foodsec.org/tr/nut/hfias.pdf.
Cohen, Marc J., and James L. Garrett. 2009. The food price crisis and urban food (in)security. Human Settlements Working Paper Series Urbanization and emerging population issues - 2. IIED UK / UNFPA. http://www.database.ruaf.org/ruaf_bieb/upload/3135.pdf.
Cohen, Monique, and Jennefer Sebstad. 2001. CAN MICROFINANCE REDUCE THE VULNERABILITY OF CLIENTS AND THEIR HOUSEHOLDS? Paper prepared for World Bank Summer Research Workshop Poverty and Development July 6-8, 1999.

63
Background paper for World Development Report 2001. World Bank. http://siteresources.worldbank.org/INTPOVERTY/Resources/WDR/stiglitz/Cohen.pdf.
Compton, J. A. F., S. Floyd, P. A. Magrath, S. Addo, S. R. Gbedevi, B. Agbo, G. Bokor, et al. 1998. Involving grain traders in determining the effect of post-harvest insect damage on the price of maize in African markets. Crop Protection 17, no. 6 (August): 483-489. doi:10.1016/S0261-2194(98)00041-6.
Conforti, Piero, Emanuele Ferrari, and Alexander Sarris. 2009. Impacts and Policy Responses to a Commodity Price Boom: The Case of Malawi. FAO Commodity and Trade Policy Research Working paper 27. Rome: Food and Agriculture Organisation, April. http://www.fao.org/es/esc/common/ecg/589/en/Working_paper_no._27_Malawi.pdf.
Coutsoudis, Anna, Hoosen M Coovadia, and Judith King. 2009. The breastmilk brand: promotion of child survival in the face of formula-milk marketing. The Lancet 374, no. 9687: 423-425.
Cudjoe, Godsway, Clemens Breisinger, Xinshen Diao, and Clemens Breisinger and Xinshen Diao Godsway Cudjoe. 2010. Local impacts of a global crisis: Food price transmission, consumer welfare and poverty in Ghana. Text. http://econpapers.repec.org/article/eeejfpoli/v_3a35_3ay_3a2010_3ai_3a4_3ap_3a294-302.htm.
Cuesta, José, and Fidel Jaramillo. 2009. Taxonomy of Causes, Impacts and Policy Responses to the Food Price Crisis in the Andean Region. http://idbdocs.iadb.org/wsdocs/getdocument.aspx?docnum=1936582.
Dawe, David, and Irini Maltsoglou. 2009. Analyzing the Impact of Food Price Increases: Assumptions about Marketing Margins can be Crucial. ESA Working Paper No. 09-02. Rome: Food and Agriculture Organisation. ftp://ftp.fao.org/docrep/fao/011/aj990e/aj990e.pdf.
De Hoyos, Rafael E., and Denis Medvedev. 2009. Poverty effects of higher food prices : a global perspective. The World Bank, March. RePEc. http://www-wds.worldbank.org/servlet/WDSContentServer/WDSP/IB/2009/03/30/000158349_20090330112537/Rendered/PDF/WPS4887.pdf.
De Janvry, Alain, and Elisabeth Sadoulet. 2008. Methodological Note: Estimating the Effects of the Food Price Surge on the Welfare of the Poor. California: UC Berkeley, December. http://are.berkeley.edu/~sadoulet/papers/FoodPriceMethodologyDec08.pdf.
De Pee, S., M. W Bloem, M. Sari, D. D Soekarjo, R. Tjiong, S. Kosen, and S. Muhilal. 2000. Indonesia’s crisis causes considerable weight loss among mothers and adolescents. Mal J Nutr 6: 203–14.
Delpeuch, F, Y Martin-Prével, T Fouéré, P Traissac, F Mbemba, C Ly, A Sy, S Trèche, and B Maire. 1996. [Complementary nutrition for the young child following the devaluation of the CFA franc (African Financial Community): 2 case studies in the Congo and Senegal urban environment]. Bulletin of the World Health Organization 74, no. 1: 67-75.
Demeke, Mulat, Guendalina Pangrazio, and Materne Maetz. 2009. Country responses to the food security crisis: Nature and preliminary implications of the policies pursued. Food and Agriculture Organisation of the United Nations. http://www.fao.org/fileadmin/user_upload/ISFP/pdf_for_site_Country_Response_to_the_Food_Security.pdf.
Dercon, Stefan. 2008. Children and the Food Price Crisis: YOUNG LIVES POLICY BRIEF 5. September.

64
http://www.younglives.org.uk/pdf/publication-section-pdfs/policy-briefs/YL-PB5-Children_and_the_food_price-crisis.pdf.
Dessus, Sebastien. 2008. The Short and Longer Term Potential Welfare Impact of Global Commodity Inflation in Tanzania. World Bank Policy Research Working Paper No. 4760 (October 1). http://papers.ssrn.com/sol3/Delivery.cfm/4760.pdf?abstractid=1293173&mirid=3.
Devereux, Stephen. 2006. Distinguishing between chronic and transitory food insecurity in emergency needs assessments. World Food Programme, Emergency Needs Assessment Branch (ODAN)/Strengthening Emergency Needs Assessment Capacity (SENAC)/ Institute of Development Studies, January. http://documents.wfp.org/stellent/groups/public/documents/ena/wfp085331.pdf.
———. 2009. Seasonality and social protection in Africa. In . Institute of Development Studies, University of Sussex , UK. http://event.future-agricultures.org/index.php?option=com_docman&task=doc_download&gid=3&Itemid=44.
Devereux, Stephen, Bapu Vaitla, and Samuel Hauenstein Swan. 2008. Seasons of Hunger: Fighting Cycles of Starvation Among the World's Poor. Pluto Press, September 20.
Dewey, Kathryn G., and Seth Adu-Afarwuah. 2008. Systematic review of the efficacy and effectiveness of complementary feeding interventions in developing countries. Maternal & Child Nutrition 4, no. 1: 24-85.
Dore, Anna R., Linda S. Adair, and Barry M. Popkin. 2003. Low Income Russian Families Adopt Effective Behavioral Strategies to Maintain Dietary Stability in Times of Economic Crisis. J. Nutr. 133, no. 11 (November 1): 3469-3475.
Duflos, Eric, and Barbara Gähwiler. 2008. Impact and Implications of the Food Crisis on Microfinance: CGAP Survey of 45 Leading MFIs. CGAP. http://www.microfinancegateway.org/gm/document-1.9.31226/55897.pdf.
Enserink, Martin. 2008. NUTRITION SCIENCE: The Peanut Butter Debate. Science 322, no. 5898 (October 3): 36-38. doi:10.1126/science.322.5898.36.
FAO/DFID. 2000. Proceedings of Forum on Operationalizing Participatory Ways of Applying Sustainable Livelihoods Approaches. Food and Agriculture Organisation. ftp://ftp.fao.org/docrep/fao/003/X9371E/X9371E00.pdf.
FAO/WFP. 2008. CROP AND FOOD SECURITY ASSESSMENT MISSION TO ETHIOPIA (Phase 2) 20 March 2008. March. ftp://ftp.fao.org/docrep/fao/010/ah883e/ah883e00.pdf.
Fernald, Lia C. H., Paul J. Gertler, and Xiaohui Hou. 2008. Cash Component of Conditional Cash Transfer Program Is Associated with Higher Body Mass Index and Blood Pressure in Adults. J. Nutr. 138, no. 11 (November 1): 2250-2257. doi:10.3945/jn.108.090506.
Forsén, Yvonne, and Ludovic Subran. 2008. Wheat price increase and urban programming in Afghanistan, January 2008: Rapid assessment mission report for WFP. World Food Programme Afghanistan, January. http://documents.wfp.org/stellent/groups/public/documents/ena/wfp179713.pdf.
Fouere, Thierry, Bernard Maire, Francis Delpeuch, Yves Martin-Prevel, Felicite Tchibindat, and Guy Adoua-Oyila. 2000. Dietary Changes in African Urban Households in Response to Currency Devaluation: Foreseeable Risks for Health and Nutrition. Public Health Nutrition 3, no. 03: 293-301. doi:10.1017/S1368980000000331.
Frongillo, Edward A., and France Begin. 1993. Gender Bias in Food Intake Favors Male Preschool Guatemalan Children. J. Nutr. 123, no. 2 (February 1): 189-196.

65
Gaarder, Marie M., Amanda Glassman, and Jessica E. Todd. 2010. Conditional cash transfers and health: unpacking the causal chain. Journal of Development Effectiveness 2, no. 1: 6. doi:10.1080/19439341003646188.
Gandal, Neil, and Anastasia Shabelansky. 2010. Obesity and Price Sensitivity at the Supermarket. Forum for Health Economics & Policy 13, no. 2: Article 9.
Gibson, Diane. 2003. Food Stamp Program Participation is Positively Related to Obesity in Low Income Women. J. Nutr. 133, no. 7 (July 1): 2225-2231.
Gillespie, Stuart, Paul Jere, John Msuya, and Scott Drimie. 2009. Food prices and the HIV response: findings from rapid regional assessments in eastern and southern Africa in 2008. Food Security 1, no. 3: 261-269. doi:10.1007/s12571-009-0027-x.
Gittelsohn, Joel, and Amy E. Vastine. 2003. Sociocultural and Household Factors Impacting on the Selection, Allocation and Consumption of Animal Source Foods: Current Knowledge and Application. J. Nutr. 133, no. 11 (November 1): 4036S-4041.
Green, Duncan, Richard King, and May Miller-Dawkins. 2010. The Global Economic Crisis and Developing Countries. OXFAM RESEARCH REPORT. Oxfam International, May 28. http://www.oxfam.org.uk/resources/policy/economic_crisis/downloads/rr_gec_and_developing_countries_full_en_260510.pdf.
Grosh, Margaret, Carlo Del Ninno, Emil Tesliuc, and Azedine Ouerghi. 2008. For Protection and Promotion: The Design and Implementation of Effective Safety Nets. illustrated edition. World Bank Publications, August 25.
Guo, Xuguang, Barry M. Popkin, Thomas A. Mroz, and Fengying Zhai. 1999. Food Price Policy Can Favorably Alter Macronutrient Intake in China. J. Nutr. 129, no. 5 (May 1): 994-1001.
Gupta, Arun. 2009. Commercialising Young Child Feeding in the Globalised World: Time to call for an end! pp 27-29 In: Right to Food and Nutrition Watch: Governance of the World Food System. http://www.waba.org.my/pdf/watch2009_en.pdf.
Habib, Bilal, Ambar Narayan, Sergio Olivieri, and Carolina Sanchez-Paramo. 2010. The impact of the financial crisis on poverty and income distributions: Insights from simulations in selected countries. Vox - Research-based policy analysis and commentary from leading economists, April 19. http://www.voxeu.org/index.php?q=node/4905.
Hadley, Craig, and Crystal L. Patil. 2008. Seasonal changes in household food insecurity and symptoms of anxiety and depression. American Journal of Physical Anthropology 135, no. 2: 225-232. doi:10.1002/ajpa.20724.
Haiti CNSA. 2008. Haiti: Impact de la crise alimentaire sur les populations urbaines de Port-au-Prince. Coordination Nationale de la Securite Alimentaire and World Food Programme: VAM Food Security Analysis, November. http://documents.wfp.org/stellent/groups/public/documents/ena/wfp201129.pdf.
Haq, Zahoor ul, Hina Nazli, and Karl Meilke. 2008. Implications of high food prices for poverty in Pakistan. Agricultural Economics 39, no. 1: 477-484. doi:10.1111/j.1574-0862.2008.00353.x.
Haytmanek, Elizabeth, and Katherine McClure, eds. 2009. A Role for Nutrition Surveillance in Addressing the Global Food Crisis: Chapter 5. In Mitigating the Nutritional Impacts of the Global Food Price Crisis: Workshop Summary. Washington DC Institute of Medicine: National Academy of Sciences.
Headey, Derek, and Shenggen Fan. 2008. Anatomy of a crisis: the causes and consequences of surging food prices. IFPRI Discussion Paper 00831. International Food Policy Research Institute (IFPRI), December.
———. 2009. REFLECTIONS ON THE GLOBAL FOOD CRISIS: HOW DID IT HAPPEN?

66
HOW HAS IT HURT? AND HOW CAN WE PREVENT THE NEXT ONE? IFPRI, forthcoming.
Headey, Derek, Sangeetha Malaiyandi, and Shenggen Fan. 2009. Navigating the perfect storm: Reflections on the food, energy, and financial crises. International Food Policy Research Institute (IFPRI). RePEc. http://ideas.repec.org/p/fpr/ifprid/889.html.
Henson, Spencer. 2003. The Economics of Food Safety in Developing Countries. Agricultural and Development Economics Division of the Food and Agriculture Organization of the United Nations (FAO - ESA). RePEc. http://ideas.repec.org/p/fao/wpaper/0319.html.
Hoddinott, John, and Bill Kinsey. 2001. Child Growth in the Time of Drought. Oxford Bulletin of Economics and Statistics 63 (September): 409-436. doi:10.1111/1468-0084.t01-1-00227.
Holleman, Cindy, and Grainne Moloney. 2009. Somalia’s growing urban food security crisis. Humanitaire: La Corne de l’Afrique sous surveillance internationale 22 (July). http://humanitaire.revues.org/pdf/412.
Holmes, Rebecca, Nicola Jones, and Hannah Marsden. 2009. Gender vulnerabilities, food price shocks and social protection responses. London: Overseas Development Institute Working Paper 311, August. http://www.odi.org.uk/resources/download/3285.pdf.
Horton, S., and J. Ross. 2003. The economics of iron deficiency. Food Policy 28, no. 1. Food Policy: 51-75.
Hossain, Naomi, Rizki Fillaili, Grace Lubaale, Mwila Mulumbi, Mamunur Rashid, and Mariz Tadros. 2010. The Social Impacts of Crisis: Findings from community-level research in five developing countries. Brighton UK Institute of Development Studies et al., May. http://www.ids.ac.uk/download.cfm?downloadfile=B6EE3A47-FC3A-4897-FA0C5153BED99C2C&typename=dmFile&fieldname=filename.
Humphrey, Jean H. 2009. Child undernutrition, tropical enteropathy, toilets, and handwashing. Lancet 374: 1032-35.
IMF. 2008. Food and Fuel Prices—Recent Developments, Macroeconomic Impact, and Policy Responses. International Monetary Fund.
Ivanic, Maros, and Will Martin. 2008. Implications of higher global food prices for poverty in low-income countries. The World Bank, April. RePEc. http://www-wds.worldbank.org/external/default/WDSContentServer/IW3P/IB/2008/04/16/000158349_20080416103709/Rendered/PDF/wps4594.pdf.
de Janvry, Alain, Frederico Finan, Elisabeth Sadoulet, and Renos Vakis. 2006. Can conditional cash transfer programs serve as safety nets in keeping children at school and from working when exposed to shocks? Journal of Development Economics 79, no. 2 (April): 349-373. doi:10.1016/j.jdeveco.2006.01.013.
Jayne, T.S., Antony Chapoto, Isaac Minde, and Cynthia Donovan. 2008. The 2008/09 Food Price and Food Security Situation in Eastern and Southern Africa: Implications for Immediate and Longer Run Responses. Michigan State University, Department of Agricultural, Food, and Resource Economics. RePEc. http://ageconsearch.umn.edu/bitstream/54556/2/idwp97.pdf.
Jensen, Robert T., and Nolan H. Miller. 2008a. Do Consumer Price Subsidies Really Improve Nutrition? Harvard University Center for International Development Working Paper 160 (April). http://www.cid.harvard.edu/cidwp/pdf/160.pdf.
———. 2008b. The Impact of the World Food Price Crisis on Nutrition in China. SSRN eLibrary (August). http://web.hks.harvard.edu/publications/getFile.aspx?Id=441.
Joint Assessment Benin, Niger and Nigeria. 2008. MARKETS, PRICES, FOOD SITUATION

67
AND PROSPECTS FOR BENIN, NIGER AND NIGERIA: 9 April 2008. FAO GIEWS Special Report, April. http://www.fao.org/docrep/010/ai464e/ai464e00.htm.
Keats, Sharada, Marcella Vignieri, Steve Wiggins, and Julia Compton. 2010. Price transmission? A review of domestic price experiences over the 2007/08 global food crisis. Mimeo. London: Overseas Development Institute UK, March.
Kelleher, Ellen. 2010. FT.com / Investments - Bullish food forecasts whet investors’ appetite. FT.com Financial Times investments. July 16. http://www.ft.com/cms/s/2/7c34b312-9103-11df-b297-00144feab49a.html.
Kennedy, Gina L., Maria Regina Pedro, Chiara Seghieri, Guy Nantel, and Inge Brouwer. 2007. Dietary Diversity Score Is a Useful Indicator of Micronutrient Intake in Non-Breast-Feeding Filipino Children. J. Nutr. 137, no. 2 (February 1): 472-477.
Kenya Food Security Steering Group. 2008. THE IMPACT OF RISING FOOD PRICES ON DISPARATE LIVELIHOODS GROUPS IN KENYA. July. http://documents.wfp.org/stellent/groups/public/documents/ena/wfp182903.pdf.
Kiess, Linnda, Regina Moench-Phanner, Martin W Bloem, Saskia de Pee, Mayang Sari, and Soewarta Kosen. 2000. New Conceptual Thinking about Surveillance: Using Micronutrient Status to Assess the Impact of Economic Crisis on Health and Nutrition. Malaysian Journal of Nutrition 6, no. 2: 223-232.
Klotz, Christine, Saskia de Pee, Andrew Thorne-Lyman, Klaus Kraemer, and Martin Bloem. 2008. Nutrition in the Perfect Storm: Why Micronutrient Malnutrition will be a Widespread Health Consequence of High Food Prices. Sight and Life, no. 2: 6-13.
Kpodar, Kangni, and Calvin Djiofack. 2010. The Distributional Effects of Oil Price Changes on Household Income: Evidence from Mali. J Afr Econ 19, no. 2 (March 1): 205-236. doi:10.1093/jae/ejp023.
Kyrili, Katerina, and Matthew Martin. 2010. The Impact of the Global Economic Crisis on the Budgets of Low-Income Countries. Research Report for Oxfam. Oxfam International, July. http://www.oxfam.org.uk/resources/policy/economic_crisis/downloads/rr_gec_impact_budget_lics_200710.pdf.
Lasco, Christine D., Robert J. Myers, and Richard H. Bernsten. 2008. Dynamics of rice prices and agricultural wages in the Philippines. Agricultural Economics 38, no. 3: 339-348. doi:10.1111/j.1574-0862.2008.00304.x.
Lesotho Disaster Management Authority (DMA), Lesotho Vulnerability Assessment Committee (LVAC) and the UN World Food Programme, Lesotho Vulnerability Assessment Committee, and WFP. 2008. Vulnerability and Food Insecurity in Urban Areas of Lesotho: An assessment of the impact of high prices on vulnerable households in ten major cities. August. http://documents.wfp.org/stellent/groups/public/documents/ena/wfp191105.pdf.
Lesotho VAC. 2009. Lesotho Food Security Monitoring System Quarterly Bulletin: 4th Quarter 2009. Lesotho Vulnerability Assessment Committee, December. http://documents.wfp.org/stellent/groups/public/documents/ena/wfp216296.pdf.
Levine, Simon, and Claire Chastre. 2004. Missing the point: An analysis of food security interventions in the Great Lakes. Humanitarian Practice Network Network Paper 47: July 2004. London: Overseas Development Institute, July. http://www.odihpn.org/documents%5Cnetworkpaper047.pdf.
Liberia Joint Assessment. 2008. THE IMPACT OF HIGH PRICES ON FOOD SECURITY IN LIBERIA. July. http://documents.wfp.org/stellent/groups/public/documents/ena/wfp190461.pdf.
Lustig, Nora. 2009. Coping with Rising Food Prices: Policy Dilemmas in the Developing World. Tulane University, Department of Economics, May. RePEc.

68
http://www.cgdev.org/files/1421334_file_LUSTIG_FOOD_PRICES_final.pdf. Maillot, Matthieu, Elaine L. Ferguson, Adam Drewnowski, and Nicole Darmon. 2008.
Nutrient Profiling Can Help Identify Foods of Good Nutritional Quality for Their Price: a Validation Study with Linear Programming. J. Nutr. 138, no. 6 (June 1): 1107-1113.
Martorell, R, L K Khan, and D G Schroeder. 1994. Reversibility of stunting: epidemiological findings in children from developing countries. European Journal of Clinical Nutrition 48 Suppl 1 (February): S45-57.
Mason, John. 2009. Nutrition surveillance: Making decisions to improve and protect nutrition. In Haytmanek E and McClure K Mitigating the Nutritional Impacts of the Global Food Price Crisis: Workshop Summary, 67-72. pre-publication copy on line. Washington DC: Institute of Medicine. http://www.nap.edu/openbook.php?record_id=12698&page=67.
Mason, Nicole, T.S. Jayne, Cynthia Donovan, and Antony Chapoto. 2009. Are Staple Foods Becoming More Expensive for Urban Consumers in Eastern and Southern Africa? Trends in Food Prices, Marketing Margins, and Wage Rates in Kenya, Malawi, Mozambique, and Zambia. Department of Agricultural Economics, Michigan State University, June. RePEc. http://aec.msu.edu/fs2/papers/idwp98.pdf.
Matovu, John M., and Evarist P. Twimukye. 2009. Increasing World Food Prices: Blessing or Curse? Research Series No. 61. Kampala, Uganda: Economic Policy Research Centre (EPRC), May. http://www.eprc.or.ug/pdf_files/series61.pdf.
Maxwell, Daniel, and Richard Caldwell. 2008. The Coping Strategies Index: A tool for rapid measurement of household food security and the impact of food aid programs in humanitarian emergencies. CSI Field Methods Manual, CARE and World Food Programme. 2nd Edition, January. http://documents.wfp.org/stellent/groups/public/documents/manual_guide_proced/wfp211058.pdf.
Maxwell, Daniel, Kate Sadler, Amanda Sim, Mercy Mutonyi, Rebecca Egan, and Mackinnon Webster. 2008. Good Practice Review: Emergency food security interventions. Commissioned and published by the Humanitarian Practice Network at ODI. Number 10. HPN, Overseas Development Institute, London UK, December. http://www.odihpn.org/documents%2Fgpr10.pdf.
McCord, Anna. 2009. Cash transfers: affordability and sustainability. ODI Project Briefing No. 30. Overseas Development Institute UK, November. http://www.odi.org.uk/resources/download/3508.pdf.
McKenzie, David. 2002. Are tortillas a Giffen Good in Mexico? Economics Bulletin 15, no. 1. Economics Bulletin. http://www.accessecon.com/pubs/EB/2002/Volume15/EB-01O10003A.pdf.
Mendoza, Ronald U. 2009a. Aggregate Shocks, Poor Households and Children: Transmission Channels and Policy Responses. Global Social Policy, no. 9: 55.
———. 2009b. AGGREGATE SHOCKS, POOR HOUSEHOLDS AND CHILDREN: TRANSMISSION CHANNELS AND POLICY RESPONSES. UNICEF UNICEF Social Policy Working Paper Series, New York, February. http://www.unicef.org/policyanalysis/files/Postscript_Formatted_AGGREGATE_SHOCKS_AND_CHILDREN_3.04.09.pdf.
Mirmiran, Parvin, Leila Azadbakht, and Fereidoun Azizi. 2006. Dietary Diversity within

69
Food Groups: An Indicator of Specific Nutrient Adequacy in Tehranian Women. J Am Coll Nutr 25, no. 4 (August 1): 354-361.
Monteiro, Carlos A, Erly C Moura, Wolney L Conde, and Barry M Popkin. 2004. Socioeconomic status and obesity in adult populations of developing countries: a review. Bulletin of the World Health Organization 82, no. 12 (December): 940-946. doi:/S0042-96862004001200011.
Moursi, Mourad M., Mary Arimond, Kathryn G. Dewey, Serge Treche, Marie T. Ruel, and Francis Delpeuch. 2008. Dietary Diversity Is a Good Predictor of the Micronutrient Density of the Diet of 6- to 23-Month-Old Children in Madagascar. J. Nutr. 138, no. 12 (December 1): 2448-2453. doi:10.3945/jn.108.093971.
Mousseau, Frederic. 2010. The High Food Price Challenge: A Review of Responses to Combat Hunger. The Oakland Institute & the UK Hunger Alliance, July. http://www.oaklandinstitute.org/pdfs/high_food_prices_web_final.pdf.
Navarro-Colorado, Carlos, Frances Mason, and Jeremy Shoham. 2008. Measuring the Effectiveness of Supplementary Feeding Programmes in Emergencies. Humanitarian Network Paper (ODI), no. 63 (September). http://www.odi.org.uk/resources/download/2496.pdf.
Ng, Francis, and M. Ataman Aksoy. 2008. Food price increases and net food importing countries: lessons from the recent past. Agricultural Economics 39 (11): 443-452. doi:10.1111/j.1574-0862.2008.00350.x.
O'Donnell, Owen. 2007. Access to health care in developing countries: breaking down demand side barriers. Cadernos de Saúde Pública 23, no. 12 (12). doi:10.1590/S0102-311X2007001200003. http://www.scielo.br/scielo.php?pid=S0102-311X2007001200003&script=sci_arttext.
Okigbo, B. N. 1980. Nutritional implications of projects giving high priority to the production of staples of low nutritive quality: The Case for Cassava (Manihot esculenta, Crantz) in the Humid Tropics of West Africa. Food and Nutrition Bulletin, United Nations University 2: 1–10.
Oxfam International. 2008. Double-Edged Prices: Lessons from the food price crisis: 10 actions developing countries should take. October. http://www.oxfam.org.uk/generationwhy/cgi/process_comp/photos/2008/10/bp121_double-edged-prices_-final_-13oct08.pdf.
Pakistan Joint Assessment. 2008. High Food Prices in Pakistan: Imact Assessment and the Way Forward. UN InterAgency Assessment Mission for Government of Pakistan, July. http://documents.wfp.org/stellent/groups/public/documents/ena/wfp185204.pdf.
Parra, Juan Carlos, and Quentin Wodon. 2008. Comparing the Impact of Food and Energy Price Shocks on Consumers: A Social Accounting Matrix Analysis for Ghana. Policy Research Working Paper 4741. World Bank Human Development Network, October. http://www-wds.worldbank.org/external/default/WDSContentServer/IW3P/IB/2008/10/01/000158349_20081001124010/Rendered/PDF/WPS4741.pdf.
de Pee, S, CE West, D Permaesih, S Martuti, and JG Hautvast. 1998. Orange fruit is more effective than are dark-green, leafy vegetables in increasing serum concentrations of retinol and beta-carotene in schoolchildren in Indonesia. Am J Clin Nutr 68, no. 5 (November 1): 1058-1067.
Popkin, Barry M. 2001. The Nutrition Transition and Obesity in the Developing World. J. Nutr. 131, no. 3 (March 1): 871S-873.
Quisumbing, Agnes, Ruth Meinzen-Dick, and Lucy Bassett. 2008. Helping Women Respond to the Global Food Price Crisis. IFPRI Policy Brief 7 • October 2008.

70
http://www.ifpri.cgiar.org/sites/default/files/publications/bp007.pdf. Raihan, Selim. 2009. Impact of Food Price Rise on School
Enrolment and Dropout in the Poor and Vulnerable Households in Selected Areas of Bangladesh. Published by UK Dept for International Development (DFID), March. http://www.bracresearch.org/publications/monograph_dfid1.pdf.
Rapsomanikis, George. 2009. The 2007–2008 food price episode: Impact and policies in Eastern and Southern Africa. FAO COMMODITIES AND TRADE TECHNICAL PAPER 12, ftp://ftp.fao.org/docrep/fao/012/i0984e/i0984e00.pdf.
Ravallion, Martin. 1990. Rural Welfare Effects of Food Price Changes under Induced Wage Responses: Theory and Evidence for Bangladesh. Oxford Economic Papers 42, no. 3. Oxford Economic Papers: 574-85.
———. 2009. The Developing World’s Bulging (but Vulnerable) “Middle Class”. Policy Research Working Paper 4816. Washington DC: The World Bank, January. http://www-wds.worldbank.org/external/default/WDSContentServer/IW3P/IB/2009/01/12/000158349_20090112143046/Rendered/PDF/WPS4816.pdf.
Reyes, Celia M., Alellie B. Sobrevinas, Joel Bancolita, and Jeremy de Jesus. 2009. Impact of changes in the prices of rice and fuel on poverty in the Philippines. PEP/CMBS Network Updates Vol. VI, No. 2, March 2009. http://www.pep-net.org/fileadmin/medias/pdf/promotionnal_material/CBMS/March2009.pdf.
Rosado, Jorge L. 1999. Separate and Joint Effects of Micronutrient Deficiencies on Linear Growth. J. Nutr. 129, no. 2 (February 1): 531.
Rosen, Stacey, and Shahla Shapouri. 2008. Obesity in the Midst of Unyielding Food Insecurity in Developing Countries Food Insecurity in Developing Countries - Amber Waves September 2008. Amber Waves. http://www.ers.usda.gov/AmberWaves/September08/Features/ObesityCountries.htm.
Ruel, Marie T. 2003. Operationalizing Dietary Diversity: A Review of Measurement Issues and Research Priorities. J. Nutr. 133, no. 11 (November 1): 3911S-3926.
Ruel, Marie T., James L. Garrett, Corinna Hawkes, and Marc J. Cohen. 2010. The Food, Fuel, and Financial Crises Affect the Urban and Rural Poor Disproportionately: A Review of the Evidence. J. Nutr. 140, no. 1 (January 1): 170S-176. doi:10.3945/jn.109.110791.
Sanogo, Issa. 2009. The global food price crisis and household hunger: a review of recent food security assessments. Humanitarian Exchange Magazine, March. http://www.odihpn.org/report.asp?id=2988.
Sari, Mayang, Saskia de Pee, Martin W. Bloem, Kai Sun, Andrew L. Thorne-Lyman, Regina Moench-Pfanner, Nasima Akhter, Klaus Kraemer, and Richard D. Semba. 2010. Higher Household Expenditure on Animal-Source and Nongrain Foods Lowers the Risk of Stunting among Children 0-59 Months Old in Indonesia: Implications of Rising Food Prices. Journal of Nutrition 140, no. 1 (January 1): 195S-200. doi:10.3945/jn.109.110858.
Save the Children UK. 2009. How the Global Food Crisis is Hurting Children: The impact of the food price hike on a rural community in northern Bangladesh. http://www.savethechildren.org.uk/en/docs/How_the_Global_Food_Prices_is_Hurting_children.pdf.

71
Savy, Mathilde, Yves Martin-Prevel, Pierre Traissac, Sabrina Eymard-Duvernay, and Francis Delpeuch. 2006. Dietary Diversity Scores and Nutritional Status of Women Change during the Seasonal Food Shortage in Rural Burkina Faso. J. Nutr. 136, no. 10 (October 1): 2625-2632.
Shankar, A. V., J. Gittelsohn, K.P. West Jr., R. Stallings, T. Gnywali, and F. Faruque. 1998. Eating from a Shared Plate Affects Food Consumption in Vitamin A-Deficient Nepali Children. J. Nutr. 128, no. 7 (July 1): 1127-1133.
Simler, Ken. 2010. Assessing the Welfare Impact of Food and Fuel Price Shocks: Presentation slides April, World Bank ECA PREM. http://siteresources.worldbank.org/INTPOVERTY/Resources/WelfareImpact_PriceShocks.pdf.
Simler, Kenneth R. 2010. The Short-Term Impact of Higher Food Prices on Poverty in Uganda. World Bank Policy Research Working Paper No. 5210 (February). http://www.csae.ox.ac.uk/conferences/2009-EDiA/papers/262-Simler.pdf.
Sulaiman, M., M. Parveen, and N. C Das. 2009. Impact of the Food Price Hike on Nutritional Status of Women and Children. Dakar: BRAC Research and Evaluation Division. http://wwww.bracresearch.org/monographs/Monograph_38.pdf.
Swaziland VAC/WFP. 2008. Vulnerability and Food Insecurity in Urban Areas of Swaziland: An assessment of the impact of high prices on households in four regions. Swaziland Vulnerability Assessment Committee and the UN World Food Programme, December. http://documents.wfp.org/stellent/groups/public/documents/ena/wfp197699.pdf.
Swindale, Anne, and Paula Bilinsky. 2006. Household Dietary Diversity Score (HDDS) for Measurement of Household Food Access: Indicator Guide. Food and Nutrition Technical Assistance (FANTA) Project, September. http://www.fantaproject.org/downloads/pdfs/HDDS_v2_Sep06.pdf.
Teruel Belismelis, Graciela. 2010. The Case of Mexico. In , 55-57. Washington DC Institute of Medicine: US Board on Global Health. http://www.nap.edu/openbook.php?record_id=12698&page=55.
Tinker, Irene. 1997. Street Foods: Urban Food and Employment in Developing Countries. First Softcover. Oxford University Press, USA, March 27. http://books.google.com/books?hl=en&lr=&id=w0hkheGJyfcC&oi=fnd&pg=PA3&ots=sZDXzjY7Qu&sig=cMeL0ALRhQE9yIZHpC0gRc-2njg#v=onepage&q=&f=false.
Torlesse, Harriet, Lynnda Kiess, and Martin W. Bloem. 2003. Association of Household Rice Expenditure with Child Nutritional Status Indicates a Role for Macroeconomic Food Policy in Combating Malnutrition. Journal of Nutrition 133, no. 5 (May 1): 1320-1325.
Ulimwengu, John M., Sindu Workneh, and Zelekawork Paulos. 2009. Impact of Soaring Food Price in Ethiopia: Does Location Matter? IFPRI Discussion Paper 00846, February. http://www.ifpri.org/sites/default/files/publications/ifpridp00846.pdf.
UN Standing Committee on Nutrition. 2008. The impact of high food prices on maternal and child nutrition. Background paper for the SCN Side Event at the 34th Session of the Committee on World Food Security. Rome, 14-17 October 2008.
UN Vietnam. 2008. Food Prices , Vulnerability and Food Security in Viet Nam: A UN Perspective. Hanoi, October. http://www.reliefweb.int/rw/RWFiles2008.nsf/FilesByRWDocUnidFilename/MUMA-7L48G6-full_report.pdf/$File/full_report.pdf.
UNICEF. 1998. The State of The World's Children 1998: Focus on Nutrition. http://www.unicef.org/sowc98/sowc98.pdf.
Uraguchi, Zenebe Bashaw. 2009. FOOD PRICE HIKES AND FOOD SECURITY IN

72
AGRARIAN SOCIETIES: ASSESSING CHILDREN’S VULNERABILITY IN HOUSEHOLDS, CASES FROM BANGLADESH AND ETHIOPIA. In . November. http://www.unicef.org/socialpolicy/files/Food_Price_Hikes_and_Household_Food_Security_in_Agrarian_Societies_Zenebe_B._Uraguchi(1).doc.
Valero-Gil, Jorge, and Magali Valero. 2008. The effects of rising food prices on poverty in Mexico. University Library of Munich, Germany, August. RePEc. http://mpra.ub.uni-muenchen.de/10221/1/MPRA_paper_10221.pdf.
Victora, Cesar G, Linda Adair, Caroline Fall, Pedro C Hallal, Reynaldo Martorell, Linda Richter, and Harshpal Singh Sachdev. 2008. Maternal and child undernutrition: consequences for adult health and human capital. Lancet 371, no. 9609 (January 26): 340-357. doi:10.1016/S0140-6736(07)61692-4.
Warr, Peter. 2008. World food prices and poverty incidence in a food exporting country: a multihousehold general equilibrium analysis for Thailand. Agricultural Economics 39, no. 1: 525-537. doi:10.1111/j.1574-0862.2008.00357.x.
Webb, Patrick. 2002. Intrahousehold Dimensions of Micronutrient Deficiencies: A Review of the Evidence. Discussion Paper number 4. Tufts University Friedman School of Nutrition Science and Policy, March. RePEc. http://nutrition.tufts.edu/docs/pdf/fpan/wp04-intrahousehold_dimensions.pdf.
Weiser, Sheri D, Karen Leiter, David R Bangsberg, Lisa M Butler, Fiona Percy-de Korte, Zakhe Hlanze, Nthabiseng Phaladze, Vincent Iacopino, and Michele Heisler. 2007. Food Insufficiency Is Associated with High-Risk Sexual Behavior among Women in Botswana and Swaziland. PLoS Med 4, no. 10 (October 23): e260. doi:10.1371/journal.pmed.0040260.
West, Keith P., and Sucheta Mehra. 2010. Vitamin A Intake and Status in Populations Facing Economic Stress. J. Nutr. 140, no. 1 (January 1): 201S-207. doi:10.3945/jn.109.112730.
WFP. 2009. Hunger and Markets: World Hunger Series. World Food Programme and Earthscan, UK and USA. http://home.wfp.org/stellent/groups/public/documents/communications/wfp200279.pdf.
WFP Burundi. 2008. Vulnerability and Food Insecurity in Three Urban Areas of Burundi: An Assessment of the Impact of High Prices on Households in Bujumbura Mairie, Ngozi and Gitega Cities. July. http://documents.wfp.org/stellent/groups/public/documents/ena/wfp187700.pdf.
WFP Cote D'Ivoire. 2008. BUDGET REVISION TO PROTRACTED RELIEF AND RECOVERY OPERATION PROJECT: PRRO 10672.0 – Assistance to Populations Affected by the Protracted Côte d’Ivoire Crisis. http://one.wfp.org/operations/current_operations/BR/106720_0902.pdf.
WFP Nepal/NDRI. 2008a. Market and Price Impact Assessment Nepal. July. http://documents.wfp.org/stellent/groups/public/documents/ena/wfp185782.pdf.
———. 2008b. PASSAGE TO INDIA: Migration as a Coping Strategy in Times of Crisis in Nepal. World Food Programme Nepal and Nepal Development Research Institute, December. http://documents.wfp.org/stellent/groups/public/documents/ena/wfp194034.pdf.
WFP Yemen. 2008. Impact of rising food prices on household food security in Yemen. World Food Programme, August. http://documents.wfp.org/stellent/groups/public/documents/ena/wfp192161.pdf.
WFP/FAO. 2008a. Interagency Workshop Report: Measures of Food Consumption, Harmonising Methodologies. April.

73
http://documents.wfp.org/stellent/groups/public/documents/ena/wfp196629.pdf. ———. 2008b. Powerpoint presentations from Interagency Workshop Report WFP - FAO
Measures of Food Consumption - Harmonizing Methodologies Rome, 9 - 10 April 2008. April 9. http://home.wfp.org/stellent/groups/public/documents/ena/wfp196627.pdf.
WFP/UNICEF/IPHN. 2009. Bangladesh Household Food Security and Nutrition Assessment 2009 Report. Government of Bangladesh’s Institute of Public Health Nutrition (IHPN), World Food Programme and United Nations Children's Programme. http://www.unicef.org/bangladesh/HFSNA--FINAL--20100608.pdf.
WFP-SENAC. 2008. 5th SENAC Advisory Group Meeting Report: Summary of Meeting on Strengthening Emergency Needs Assessment Capacity in WFP, Rome, 11-12 February 2008. World Food Programme Project: Strengthening Emergency Needs Assessment Capacity (SENAC). http://documents.wfp.org/stellent/groups/public/documents/ena/wfp175610.pdf.
Wiggins, Steve, Julia Compton, Sharada Keats, and Mark Davies. 2010. Country responses to the food price crisis 2007/2008. London: Overseas Development Institute UK.
Wodon, Quentin T., Clarence Tsimpo, Prospere Backiny-Yetna, George Joseph, Franck Adoho, and Harold Coulombe. 2008. Potential Impact of Higher Food Prices on Poverty: Summary Estimates for a Dozen West and Central African Countries. World Bank Policy Research Working Paper No. 4745. http://papers.ssrn.com/sol3/papers.cfm?abstract_id=1277064.
World Bank. 2005. Managing Food Price Risks and Instability in an Environment of Market Liberalization. Washington DC: World Bank Agriculture and Rural Development Department REPORT NO. 32727-GLB. http://siteresources.worldbank.org/INTARD/Resources/ManagingFoodPriceRisks.pdf.
———. 2008. Double Jeopardy: Responding to High Food and Fuel Prices. G8 Hokkaido-Toyako Summit. July 2. http://web.worldbank.org/WBSITE/EXTERNAL/NEWS/0,,contentMDK:21827681~pagePK:64257043~piPK:437376~theSitePK:4607,00.html.
World Bank HDN/PREM. 2008. Rising food and fuel prices: Addressing the risks to future generations. World Bank Human Development (HDN) and Poverty Reduction and Economic Management (PREM) Networks, October. http://siteresources.worldbank.org/DEVCOMMEXT/Resources/Food-Fuel.pdf.
World Bank LACR. 2008. Latin America and Caribbean - A Poor Person’s Price Index. http://web.worldbank.org/WBSITE/EXTERNAL/COUNTRIES/LACEXT/0,,contentMDK:21783154~pagePK:146736~piPK:146830~theSitePK:258554,00.html.
Yap, Josef T., Celia M. Reyes, and Janet S. Cuenca. 2009. Impact_of_the_Global_Finanical_and_Economic_Crisis_on_the_Philippines. Philippine Institute for Development Studies, DISCUSSION PAPER SERIES NO. 2009-30, October. http://www.unicef.org/socialpolicy/files/Impact_of_the_Global_Finanical_and_Economic_Crisis_on_the_Philippines.pdf.
Zaidi, S Akbar, Maheen Saleem Farooqi, and Aleena Naseem. 2009. The Impact of Inflation on Microfinance Clients and its Implications for Microfinance. MICROBANKING BULLETIN, ISSUE 18, SPRING 2009. http://www.themix.org/sites/default/files/MBB%2018%20-%20Impact%20of%20Inflation.pdf.
Zezza, Alberto, Benjamin Davis, Carlo Azzarri, Katia Covarrubias, Luca Tasciotti, and Gustavo Anriquez. 2008. The Impact of Rising Food Prices on the Poor. Food and Agriculture Organization of the United Nations (FAO - ESA) Working paper 08-07,

74
August. ftp://ftp.fao.org/docrep/fao/011/aj284e/aj284e00.pdf. http://ageconsearch.umn.edu/bitstream/51696/2/Zezza%20et%20al%20IAAE-2.pdf.

75
1. Annex 1
Table A: Criteria and indicators used by international agencies for predicting the countries and areas most vulnerable to rising food prices
Indicators (see notes below)
Criteria WFP 1 WFP 2 EC Food Facility Asian Development Bank
FAO 1 FAO 2 University of California
World Bank 2005
Poverty levels
populations who spent a significant proportion of their incomes on food
(V) Income poverty and distribution ‐ percent of population on <$1/day, percent below national poverty line, share of poorest 10%, and Gini coefficient. (V) Socio‐economic situation ‐ 'similar to Human Development Index'. Includes GDP per capita, health status, education and life expectancy (R) Household ability to respond: GDP per capita in 2008 purchasing power parity
(A) GNI per capita ‐ WDR 2008. This criterion received a double weighting as the EC also counted it as contributing to 'national capacity to respond' (see below).
Population below national poverty line (different for each country)
Developing countries'
Relative levels of poverty'
Low or lower‐middle income (GNI per capita, 2006). “With low income comes weaker capacities to respond to a crisis.”
A sample of 25 low‐income countries with population > 10 million was used together with 4 lower‐middle‐income and 2 upper‐middle‐income countries.
Hunger & dietary diversity
high levels of food insecurity even before the food and fuel price hikes'
(V) Dietary consumption: total energy as a function of average per capita cereal and non cereal consumption (also see next indicator)
(B) IFPRI Hunger Index: composed of % undernourished in population, under 5 mortality rate and, under 5 underweight
Percent population undernourished FAO data
'the prevalence of undernourishment'
Diversity index of food consumption (runs from 1 ‐ single staple to 0 ‐ many staples)

76
Vulnerable groups
relatively large urban populations
(V) Child vulnerability ‐ percent population under 15, percent underweight children, percent adults undernourished, prevalence of HIV/AIDS
Reliance on food imports
country relied heavily on imported food and fuel commodities
(R) Household dependence on imported staples: "combines imports contribution to net cereal availability and cereal energetic contribution" (R) Food and fuel import bill as a percent of total imports
(C) Caloric intake from imported cereals = % calories obtained from cereals x dependence on cereals imports (data from World Bank 2008)
Cereal imports as percentage of total domestic production and imports
Percent of major grains imported Percent of petroleum imported
the extent to which countries are net importers of energy products and of cereals (weighted by the proportion of cereals in dietary energy intake)'
High food dependency as measured by the share of cereal imports in total cereal consumption High food import burdens as measured by the share of cereal imports in total imports.
Number of years in 10 as net importer or exporter (of main staple) Net imports (exports) of main staple as percent of utilisation Food aid as a share of cereal utilisation
Balance of payment impact
(V) National response capacity: " a country classified as low income food deficit and severely indebted and receiving no debt relief.. will get the lowest index value"
GNI per capita ‐ see note under (A) above. (D) Balance of payment impact from IMF report 2008 (G) Foreign exchange reserves (months of import coverage)
Average cereal imports to foreign reserves, previous 10 years Net imports of main staple as percent of total exports
Agricultural production
(E) Economic Importance of Agriculture (FAO data)
Index of agricultural production variability

77
(F)Agricultural Production Index (FAO data)
Quality of government fiscal policy
Quality of fiscal policy as judged by CPA ratings
Food price inflation
high inflationary pressures
(R) Headline inflation rates between 2005 and 2008 (IMF)
Food CPI increase from March (Jan) 2007 to March (Jan) 2008
Notes These indicators were combined into V‐ Global Vulnerability Index, R ‐ High Price Risk Index. The two were combined into a single index by weighting V 60% and R 40%
E, F, G and GNI were grouped as 'national capacity to respond'. All indicators were scored from 1 (low poverty, little effect, high capacity to respond) to 4. Then overall index calculated as (2A+B+C+D+E+F+0.5G)/7. Final country score was modified with complementary qualitative assessments.
This is a list of '22 developing countries at risk'. Low country income is therefore implied but not defined here.
This was taken from a publication (SOFI) intended for a wide audience so indicators were not defined in detail. However there appears to be at least one additional indicator used here: the importance of cereals in consumption.
This index was not developed specifically for the 2007‐8 food price crisis but as a more general index of vulnerability to high world and domestic prices.
Source Sanogo 2008 WFP 2009 p.100 EC DG Development 2009
ADB 2008 FAO June 2008 (presented at food & climate conference)
FAO Dec 2008 (SOFI)
De Janvry and Sadoulet 2008
World Bank 2005

78
Table B: Most vulnerable countries to high world food prices, according to different predictions, and international aid response
Pred‐iction
Analysis in early 2008 Retrospective analysis
from lit review Response (international assistance)
A B C D E F G H I J K L M N O P Q R
Country Region
Income group
FAO LIFDC 2008
World Ban
k 2005
ADB
WFP1
WFP2
FAO 1
FAO 2
dJ&
S
Price increases
(WFP
2008)
WFP
March 2009
Impact on govt
budget
UN HLTF priority
countries
WFP
EC Food Facility
FAO Soaring Food
Prices
World Ban
k GFR
P
Afghanistan SA LI x 1 2 1 2 1 1 1 1 1 1 1
Angola SSA LMI x 1 1 3 1
Antigua and Barbuda LAC HI 2 2
Armenia ECA LMI x 2 2
Azerbaijan ECA LMI x 1 2
Bahamas, The LAC HI 2 2
Bangladesh SA LI x 1 1 2 2 1 1 1 1 1 2
Barbados LAC HI 2 2
Belize LAC LMI + 2
Benin SSA LI x 1 2 2 1 1 1 1 2 1 2
Bhutan SA LMI x 2 2 2
Bolivia LAC LMI 3 2 + 2 2
Botswana SSA UMI 3 1 ‐
Burkina Faso SSA LI x 2 2 1 1 1
Burundi SSA LI x 2 1 2 1* 1 1 1 1
Cambodia EAP LI x 2 1 2 1 1 + 1 2 1 3
Cameroon SSA LMI x 2 2 2 2 2 2
Cape Verde SSA LMI x 2 2
Central African Republic SSA LI x 1 1 1 2 1 1 1 1 1

79
Chad SSA LI x 1 1 2
Chile LAC UMI 2 +
Colombia LAC UMI 3 + 2
Comoros SSA LI x 1 2 1 1 2 3
Congo, Dem. Rep. SSA LI x 1 1 1 1 1 1 1
Congo, Rep. SSA LMI x 1
Côte d'Ivoire SSA LMI x 2 1 1 + 1
Cuba LAC UMI 3 3 1
Djibouti MENA LMI x 3 2 1 1 1 1 1
Dominica LAC UMI 1 2
Dominican Republic LAC UMI 3 2 2
Ecuador LAC LMI 3 +
Egypt, Arab Rep. MENA LMI x 1 1*
El Salvador LAC LMI 3 2 2
Eritrea SSA LI x 1 1 1 1 1 1 1 1 1
Ethiopia SSA LI x 2 1 1 1 2 1 + 1 1 1 1 2
Gambia, The SSA LI x 1 2 2 1 2 1 1
Ghana SSA LI x 2 3 2 + 1 1 2
Grenada LAC UMI 2* 2
Guatemala LAC LMI 3 3 + 2 1
Guinea SSA LI x 1 1 1 2 1 1 1 1 2 2
Guinea‐Bissau SSA LI x 2 1 1 1 1 + 1 1 1 2
Guyana LAC LMI 2* 2
Haiti LAC LI x 2 1 1 1 1 1 1 1 1 1 1
Honduras LAC LMI x 3 3 + 1 1 1 1
India SA LMI x 3 +
Indonesia EAP LMI x 2 3 ‐
Iran, Islamic Rep. MENA LMI + 2

80
Iraq MENA LMI x 2 2
Jamaica LAC UMI 1 2 2 1
Jordan MENA LMI 3 1*
Kenya SSA LI x 1 1 2 1 1 2 2 1 1 1 1 3
Korea, Dem. Rep. EAP LI x 3 1 1
Kyrgyz Republic ECA LI x 1 2 2 2 2 1 1
Lao PDR EAP LI x 2 2 1 2 2 3
Lesotho SSA LMI x 2 1 2 1
Liberia SSA LI x 1 1 1 1 1 1 1 1 1 1
Madagascar SSA LI x 1 1 1 1 2 2 + 1 2 1 1
Malawi SSA LI x 1 1 1 1 2 1 1 1 1
Mali SSA LI x 1 2 1 1 2
Mauritania SSA LI x 2 2 1 1 1 1 1 1
Mexico LAC UMI 2 ‐
Moldova ECA LMI x 2 1
Mongolia EAP LMI x 1 3 2 1 2 2
Morocco MENA LMI x 2 1 1*
Mozambique SSA LI x 1 1 1 2 2 2 1 1 1 1 1 2
Myanmar EAP LI 1 1 1
Namibia SSA UMI 3 3 2
Nepal SA LI x 1 1 2 2 1 1 2 1 2
Nicaragua LAC LMI x 3 2 + 2 1 3
Niger SSA LI x 2 2 1 1 2 2 2* 1 2 1 1
Nigeria SSA LMI x 2 2 2 (north) 2 2
Pakistan SA LMI x 2 1 2 2 1 1 1 1 1
Palestine (OPT) MENA LMI 2 2 2 1 1 1 2
Papua New Guinea EAP LMI x 2 1 +
Peru LAC UMI 1 ‐ 2
Philippines EAP LMI x 3 ‐ 1 1 2

81
Rwanda SSA LI x 1 2 2 2 1 3 2 1
Sao Tome e Principe SSA x 1 1 3
Senegal SSA LI x 2 2 3 2 1 2 1 1 2 1 3
Seychelles SSA UMI 2 2
Sierra Leone SSA LI x 2 1 1 1 2 1 1 1 1
Solomon Islands EAP LMI x 2 2
Somalia SSA LI x 2 1 1 3 1 1 2 1 2
South Africa SSA UMI 4 +
Sri Lanka SA LMI x 1 2 1 1 2 1
Southern Sudan SSA 2
Sudan SSA LMI x 2 2 2 1 2
Suriname LAC UMI 2 ‐
Swaziland SSA LMI x 2 1 1 + 2
Syrian Arab Republic MENA LMI x 3 2 +
Tajikistan ECA LI x 1 2 1 1 1 1 1 1 1 1 1
Tanzania SSA LI x 2 1 2 2 2 1 1 2 3
Thailand EAP LMI +
Timor‐Leste EAP LMI x 2 1 1 3 1 2
Togo SSA LI x 2 2 2 + 1 2 1 2
Tunisia MENA LMI 1 ‐
Turkmenistan ECA LMI x 3 ‐
Uganda SSA LI x 2 2 + 1
Uzbekistan ECA LI x 2 2 +
Vietnam EAP LI 2 3 +
Yemen, Rep. MENA LI x 1 2 1 2 2 1 1 1 2 1 1
Zambia SSA LI x 1 2 1 1 2 2 2 2 1
Zimbabwe SSA LI x 1 1 1 1 1 2 1 1 1 1 Notes (by column):

82
A: EAP = East Asia & Pacific. ECA = Europe & Central Asia. LAC = Latin America & the Caribbean. MENA = Middle‐East & North Africa. SA = South Asia. SSA = Sub‐Saharan Africa. B: Sources given in main list of references. LI = Low income. LMI = Lower middle income. UMI = Upper middle income. HI = High Income (Non OECD) D: World Bank 2005. The table clearly marks countries at highest risk (1). Score 2 is author's interpretation of the table and explanatory text. E: ADB 2008. List only includes Asia and may not be comprehensive F: Sanogo 2008. Table listed in order of vulnerability; divided at half‐way mark into 1 and 2. G: WFP 2008. Based on Jun 08 map ‐ 3 worst quintiles recorded out of 5. (1 ‐'extremely vulnerable'). A later (Dec 08) map by WFP had 6 sextiles. H: List may not be comprehensive. I: 1‐ 'in food crisis' 2‐ 'at high risk'. List may not be comprehensive. J: 1‐ 'most', 2‐'highly', and 3‐ 'somewhat' vulnerable K – WFP cost of food basket 2008 L – WFP cumulative average to March 2009 M ‐ IMF estimate. Source: IMF 2008. 1 ‐ drop in reserves > 0.5 months imports, or drop > 0.1 month if reserves previously below 3 months imports 2 ‐ drop > 0.1 month imports +/‐ small impact *high GDP impact from food subsidies and/or import tax cuts N: Source: HLTF progress report 2009 O ‐ WFP’s specific programs for food prices, Sept 2008. Source: UN Response to Food Crisis, September 2008. WFP is active in 70 countries so this only lists programmes identified by WFP as being in response to high food prices.. P: Score 1 if in first tranche and 2 if in second tranche financing. Funded countries closely linked to analytical score as per criteria table. Q: 1‐ website covers response 2‐ on list of countries on website, but with no programmes recorded http://www.fao.org/isfp/country‐information/en/ accessed Mar 2010 R: Scored according to financing approval dates: 1 ‐ May‐Aug 2008, 2‐ Aug‐Dec 2009, 3‐2009 It should be noted that this was quicker than the other programmes reviewed .

83
Table C: Predicting the effect of rising food prices on poverty: summary of 10 papers
Paper Price shock simulated Model prediction Points of interest
ADB 2008 20% increase in overall nominal food prices in 2 Asian example countries (also models 10% and 30% price increases with roughly proportionate predictions.)
Numbers below national poverty lines increase by 15M (c. 44%) in Pakistan and 6M (c. 25%) in the Philippines (percentages not given in original paper; estimates based on 2006 population data). Authors state that much lower poverty headcount would be predicted using dollar‐a‐day line. Average 'standard of living' will decline by 4‐5%, and by about 6% for the poorest quintiles. Increase in inequality (Gini) index around 1%.
The use of national poverty lines rather than the dollar a day line means that predicted headcount affected may vary from international standard poverty lines. Figures are not given in the paper but as an example, UNDP gives figures for people living below the poverty line in Pakistan (2000‐7) of 22.6% ($1.25/day line) 60.3% ($2/day line) and 32.6% (national poverty line)
Ahmed 2008 Selected observed nominal price rises in 2007‐8 in 3 Asian countries
Food price increases of 73% lead to a ~3% increase in numbers of poor in Pakistan. In Bangladesh, rice price increases of 40% lead to ~5% increase in numbers of poor (3% with wage adjustment). In Sri Lanka, 80% increase in rice price is predicted to result in 5% increase in numbers of poor.
Only farmers with more than 1.5 acres are predicted to benefit; poor farmers lose out. The effects are worst for households headed by labourers and least for salaried workers.
Cuesta and Jaramillo 2009
Nominal price increases observed in each country for the food basket between January 2006 and March 2008.
Both incidence and severity of poverty increase in four Andean countries, mostly around 2.5‐3.5% (Ecuador, Colombia and Peru) and much more in Bolivia (7.5‐8%).
"A considerable proportion of poor households (numbers not given) enter the ranks of the extremely poor. These households outnumber the initially non‐poor who become poor after the food price increase."
De Hoyos and Medvedev 2008
Actual cumulative observed food price rises (food CPI for total food basket) relative to non‐food CPI in 2005‐2008, for 73 developing countries. These would be expected to be much lower than nominal price increases. Overall, relative prices rose ~6%, with significant regional variations.
In 60% of the country sample, higher food prices have little effect (<0.2%) on poverty headcount or poverty gap. In about a third of countries, they raise poverty headcount by >0.2%. Worst affected countries are predicted to be Indonesia, Yemen, Ethiopia, Pakistan, and Bangladesh, with >3.5% increases in headcount. In contrast, poverty headcount is expected to decrease by >2% in Dominican Republic, Sri Lanka, Madagascar, Benin, Moldova, Kenya and Mali. Overall, the models predict an additional 3% (68M) below the poverty line in urban areas with an increase of 21% in the monetary cost of alleviating total urban poverty under perfect targeting conditions. In rural areas, poverty headcount increases by 2% (87M).
Authors note that their estimate of 155M increase in poor (<$1.25/day) is very similar to the Ivanic and Martin estimate below given the differences in method and coverage.

84
Dessus et al. 2008 20% rise in food CPI relative to non‐food CPI, for 73 developing countries. (upper and lower bounds 10% and 30%), based on range of rises seen over 2005‐8. Urban only.
Average predicted increase in urban poverty headcount is 4% (range 1‐6%) over 20 most affected countries using $1/day line; for $2/day line the average is 5% (range 3‐8%) The notional cost (estimated as the change in the poverty deficit) reaches an average 0.5% (0.1‐~3%)GDP for $1/day and about 2% (1‐8%)GDP for $2/day.
Over 90% of the calculated poverty deficit (94% using $2/day line) stems from the loss in real income of those who were already poor before the price shock, rather than from the new poor. This is due to the fact that the poverty gap among the new poor is much smaller than that of the old poor after the crisis.
Ivanic and Martin 2008‐1
20% nominal price increase in all of: beef, dairy, maize, poultry, rice, sugar and wheat, in 9 developing countries. Also models 10% rise with proportionate predictions.
Poverty headcount increases by 1‐1.5% in Bolivia, Cambodia, Malawi, Pakistan and Zambia; worst predictions are for Nicaragua and Madagascar (poverty headcount up ~3%). It decreases by 0.2% in Peru and by nearly 2% in Vietnam (although increasing in urban areas). The poverty gap also increases in the countries above, by a roughly similar amount. ($/day line used.)
Assuming that unskilled wages increase to reflect prices dampens but does not eliminate the predicted changes.
Ivanic and Martin 2008‐2
Average nominal world price rises of above 7 commodities in 2005‐Q12008 (up 70‐90% in wheat, maize and dairy but only 25% in rice and 0% in sugar), with 100% transmission to domestic prices assumed
Poverty headcount increases by 8% in Nicaragua (over 10% in urban areas); by 4‐5% in Madagascar, Malawi, Pakistan and Zambia and by ~2% in Bolivia and Cambodia; as above, poverty decreases in Peru (by 0.2%) and Vietnam ( by 2%).
The widely quoted figure by these authors of 105 million more people in poverty was based on a predicted average overall increase in poverty headcount of 4.5%, based on assumptions that world prices would rise further and 2/3 price transmission with adjustments for exchange rates and inflation ‐ details not given in paper.
Robles et al. 2008, as cited by Lustig (2009) and Demombynes et al. (2008)
68% increase in nominal food prices for six commodities weighted by their share in food basket (43%)
Poverty headcount increases by a mean of 4.3% (range of 0.6% to 11.2%) in 19 Latin American countries, equivalent to 21M people (estimate by N. Lustig) using national poverty lines.

85
Wodon et al. 2008 50% increase in nominal food prices across the board in 12 W/C African countries. (25% increase also simulated)
Average poverty headcount (using 1$/day line) increased by 4.4%; or 2.5% if predicted benefits to producers are included. The predicted poverty gap increases at the national level by 2% in DRC (poorest country in sample), 6% in Togo, 7% in Burkina Faso and Ghana, 8% in Guinea, Nigeria and Sierra Leone, 13% in Mali, 14% in Niger, 16% in Liberia, 17% in Gabon, and 31% in Senegal. Urban households predicted to have greater increases in poverty headcount than rural HH in most countries in sample, with the exception of Ghana, Liberia and Senegal. The converse is true for the poverty gap, which is generally predicted to be higher in rural areas.
An "overwhelming majority" of the predicted increase in poverty gap is due to higher levels of poverty among the 'old poor' (many of whom are in rural areas) rather than the increase in numbers of 'new poor' (many in urban areas).
Zezza et al. 2008 10% rise in both consumer and producer prices of three key tradeable staples for each country (nominal).
0.5‐2% change in welfare (HH expenditure) overall, with poor and female‐headed households being worst hit (Figure **). All urban households are predicted to be worse off, with Bangladesh, Pakistan, Tajikistan and Malawi predicted worst hit; Ghana and Panama least affected; and Nepal, Guatemala, Nicaragua, Vietnam intermediate. For rural households, the picture is similar except for Vietnam where average improvements of ~1% are predicted.
Poor consumers lose more than rich from higher food prices; while poor food producers with little land gain less than richer producers. Female headed households are generally predicted to be worse off than male‐HH.
Note: "The poverty headcount measures the percentage of people falling below the poverty line and the poverty gap the average percentage of the poverty line by which the incomes of the poor fall below the poverty line relative to the poverty line". (Ivanic and Martin 2008, citing Ravallion and van der Walle 1991)

86
Table D: Summary results from studies on behaviour changes following food price rises in 13 countries
Study country and area
Food‐related Livelihoods related Exter‐nal assist‐ance
Reduced Coping Strategies Index (Maxwell and Caldwell 2008)
(weights for each indicator)
Credit and savings related
Reduce non‐food
expenditure
Grow more food
More work
Out‐migration
Selling assets Socially less acceptable activities
(1) (1) (1) (2) (3)
Eat less preferred
food ‐ overall
Infant and young children's diet
suffers
Eat less food in
the m
eal
Red
ucing meals or in some cases
going whole day without eating
Borrow/ gifts from fam
ily and
friends
Adults (usually m
others/ elder
sisters) eat less
Eat more street food instead
of
home‐cooked
Use savings
Credit (not from fam
ily) in cash or
kind
Mortgage or paw
n productive
assets
Red
uce any non‐food expen
diture
(of which:) Reduce health or
education expen
diture
Plant more or new
crops (for food)
Work harder, m
ore fam
ily m
embers
work, look for more work
Increased m
igration
Sell consumer (non‐productive)
assets
Sell productive assets (this includes
consuming seed stocks)
Red
uced community solidarity
Socially unacceptable livelihoods
activities
External assistance (governmen
t
shops/OMS/NGOs)
Bangladesh, rural 1 poorest quintile
*****
**** *** **
***
***** **
* * *
*
Bangladesh, rural poor 2
*
***
**** ****
*
Bangladesh, urban 1 rickshaw pullers
*****
*** *** *
**
**** ***
* * *
**
Bangladesh, urban 1 unskilled Labourers
*****
**** *** *
**
***** ***
* * *
***
Bangladesh, urban poor 2
***
*
****
**** ****
**
Burkina Faso, urban
y y
y y
y
y y
y y
y
Burundi, urban ***
***** y y ****
*****
y
*****
Cambodia, national
****
****
**** ***
*****
** *** ** *** ** * **

87
Central African Republic, urban
**** *** *** *** *** **
*
**** ** *** ***
* *
*
Ethiopia, urban *
***
* *
**
*
*
*
Haiti, urban ****
**** **** ** *** **** *** *** * *** ***
y y ** * *
*
Liberia, urban ****
**** **** *** ***
***
Nepal, rural ****
***
***
*** *****
*** **
* *** ** **
Nepal, urban ****
***
***
** ****
*** *
* * * *
*
Pakistan, rural ***
***
**
* *
**
* *
Pakistan, urban ***
***
*
* *
* *
Philippines urban
***
*** ***
**** *
* * *
*
Philippines rural ***
*** *****
**** *
** * **
***
Sierra Leone, urban
***
*** *
** **
** *
*
Swaziland, national
****
**** ***** *** ***
***
Yemen, national ****
***** ***** **** *****
*****
*** ***
*** ** ** **
***
surveys 20 2 16 12 10 12 2 6 17 1 19 17 2 18 12 16 8 2 3 8
countries 14 2 11 9 9 9 2 4 12 1 12 10 2 13 7 9 6 2 3 5
severity **** ** *** *** *** *** **** *** **** * **** ** ** ** * * * * * *

88
Table E: Summary findings from studies on diet and nutrition following food price rises
‐‐Study reference
Study location;
Study period
Cause of change being investigated
Sample
Anthropometric measurements on children < 5 unless otherwise stated (significant increases shown in red)
Other nutrition‐related changes (significant increases shown in red ‐ * ‐ *** indicates significance level if statistical analysis carried out) & Related behaviour changes
Mothers BMI scores / percent of thin women (BMI >18.5 kg/m2)
Weight for height (adjusted z‐score)
Height for age (adjusted z‐score)
Wasting % (adjusted Odds Ratio)
Stunting % (adjusted Odds Ratio)
NUTRITION STUDIES FROM 2008 ‐‐Sulaiman et al 2009;
Bangladesh;
Surveys Aug 08 and Jan 06
Rise of rice and other food prices: (nominal price rise 94% in rice and 106% in wheat between Jan 2006 and Aug 2008
1203 rural and 435 urban infants and children from the HKI/IPHN Nutritional Surveillance Project. Follow‐up panel survey in rural area; cross‐section survey in urban area.
Percent thin women not significantly different in urban areas (26%) and decreased from 36% to 31%** in rural areas
WHZ decreased by 0.11SD** for rural children and by 0.1SD (p<10%) for urban children
n/a Overall increase from 13.5% to 21%** wasting in urban children and from 17% to 26%** in rural children. In urban sample, wasting in boys increased from 16.6% to 23.7%* and girls from 10.0% to 18.6%*. In rural sample, wasting increased from 18.0% to 24.8%** (boys) and 16.1 to 26.5%** (girls). Note rural‐urban gender differences although may not be statistically significant.
NSD in rural sample. In urban sample, increase was significant** in boys (from 51.7% to 63.6%) but not significant in girls (from 42.7% to 47.5%)
Significant differences between districts. Wages adjusted partially to prices: effective wage decreased from 3.7 kg to 3.3 kg rice‐equivalent (agric. wage) and from 5.3 to 4.6 kg (non‐agric. wage) In 2 districts (e.g. tea area) where wages did not rise much, there was more malnutrition. An increase in wage by 10 Taka is associated with an increase in weight for height Z‐score by 0.07. In the age range 24‐59 months, wasting increased by 5.5% in the rural sample and 6.7% for the urban sample. 1. Increased consumption of rice (based on 2006 comparison survey) from 45% to 51% in rural and from 29% over 40% in urban areas. Decrease in wheat consumption in urban areas. 2. Less meals with fish and pulses, and some increased use of green leafy vegetables (mostly gathered wild) in rural areas. 3. Less use of transition foods for infants and children and cutbacks on special ingredients for these including 'Cerelac’ (TM), milk, banana and liver. Children share family main meal. 4. Cut back in health expenditure, plus other 'coping' responses Note: Female headed HH underrepresented in survey due to not meeting criteria of at least 1 child under 5.

89

90
…Table E continued Description
Mothers BMI Weight /Height
Height/ Age
Wasting Stunting Other nutrition‐related changes Related behaviour changes
‐‐Cambodian Anthropometric Survey 2008 (initial data release 2009)
Cambodia;
Dec 2008 Previous survey 2005. National data.
Relative price of food compared to CPI went up by nearly 30% during 2007‐8
7459 households
Percent thin women decreased from 19% to 16% in Nov 2008 (2007 national target was 15%)
n/a n/a Poor urban children <5 ‐ wasting 15.9% compared to 9.6% in 2005. Nationally: 8.9% (no significant difference from 2005) but on previous trends had expected 6.4%.
Stunting 39.5% no sign change
Child diarrhoea up from 22% in 2005 to 30% High acute malnutrition was specifically reported for children in older groups (24 to 59 mo). Infants may have benefited from earlier investments in maternal health and nutrition (higher birth weight and more breastfeeding). 1. Children ate significantly less expensive food items like meat, fish and vitamin rich vegetables than before. 2. Other 'coping' strategies included reduced expenditure on healthcare and family members seeking additional work
‐‐Action Contre le Faim (ACF) 2009a
Freetown, Sierra Leone ;
Oct‐Nov 08
Food and fuel price rises of more than 30% from April. Prices were starting to come down at the time of the survey.
822 children 6‐59 months from 5 clusters in different parts of Freetown. Previous ACF survey 2004.
n/a 4.3% overall were classified as moderate or at high risk of malnutrition, and 0.3% as severely malnourished, based on MUAC/oedema measurements. This is below intervention level. Where rates were higher (e.g. 7.8% in the Suzanne Bay area) this was likely due to other factors e.g. water and sanitation.
n/a Rice prices increased fastest in May‐June (hungry gap period) but were declining again by time of survey. 1. Some HH reported decreases in consumption of meat, milk products and vegetables and fruit. In area with highest levels of malnutrition (Suzanne Bay) 70% HH reported no change in diet. 2. 74% of sampled HH did not change number of meals from previous year, while 17% HH reduced by one meal/day. (It is common to eat one meal as street food and this often was not counted.) 3. Main staple is imported rice. HH reported average decrease of 10% in amount of rice cooked daily (mainly in areas of city with highest rice prices)

91
…Table E continued Description
Mothers BMI
Weight /Height
Height/ Age
Wasting Stunting Other nutrition‐related changes Related behaviour changes
‐‐Action Contre le Faim (ACF) 2009b
Bangui, Central African Republic;
Sept 2008. Comparison to previous annual nutrition surveys.
Food and fuel price rises of about 10% throughout 2007 and about 50% from April 2008.
928 children 6‐59 months (32 clusters of 29 children)
n/a 6.2% (C.I 4.5%‐7.8%) ‐ not significantly different from previous surveys
30.2% (CI 25.5%‐35.0%) ‐ nsd from previous surveys
This survey was taken during the normal hungry period (soudure)‐ Aug‐Sep, so higher malnutrition levels might have been expected compared to the previous survey in Jan 07. Moreover main staple is dried cassava so world prices likely to be a minor factor. No apparent price‐related change in overall admissions to ACF feeding clinics. 1. Reported decreases in number of family meals (1.4/day as against a 'normal' 1.66/day) 2. 61% said their diet was 'less diverse' and 81% said they 'consumed less‐preferred foods' than normal.
‐‐Jensen and Miller 2008
China urban poor in two provinces (Hunan and Gansu);
Household food consumption surveys April and Dec 2006
Price of staple grains almost stable (up 3‐5%). Meat and oil prices up c. 15‐40% over 8 months. Other prices (pulses, vegetables) variable.
1300 households locally defined as poor (<$0.82 per person per day).
n/a n/a n/a n/a n/a Calories consumed reduced by an estimated 4‐5% in Gansu. No significant change in Hunan. Nutritional effects unclear (micronutrient and biometric data not measured). 1. Hunan (a rice area where meat, most vegetables and pulses rose in price) ‐ cereal consumption up 6%, meat consumption down 14%, fats down 16%. 2. Gansu (a wheat area where pulses and some key vegetables like cabbage had stable prices), cereal consumption decreased by 7 %, increase in consumption of pulses (up 22%) and fruits and vegetables (up 15%) 3. Decline in health expenditures by about 1/3 in Gansu ‐ thought mainly to be due to increased fuel expenditures ‐ but no sign of change in Hunan.

92
…Table E continued Description
Mothers BMI
Weight /Height
Height/ Age
Wasting Stunting Other nutrition‐related changes Related behaviour changes
‐‐Government of Mauritania/ UNICEF (UNICEF Humanitarian Action Reports 2008, 2009)
Mauritania;
Min of Health/UNICEF rapid nutrition survey (original report not seen)
Country imports 70% of its food. Vegetable oil went up 70% and rice 35% in 6 months.
no information
n/a n/a n/a GAM increased from 8.5% in 2007 to 12% in 2008. This was thought to be directly related to high food prices. Previously GAM had declined from 13.5% in 2000 (DHS data)
Stunting (previously declining) up from 24% in 2007 to 27% in 2008.
A separate WFP survey showed a 30% increase in the number of rural households living in food insecurity and a 55% overall rise in food‐insecure households since July 2007.
‐‐WFP Cote D'Ivoire 2008
Cote D'Ivoire (north) ;
Nutrition surveys 2006 (multiple indicator cluster survey (MICS)) and 2008 (rapid nutrition survey of under 5s)
Several factors including insecurity, low cashew (cash crop) prices, high food prices and poor harvests. In north, maize (main staple) price rose by over 40% and rice price rose by over 20% between 2007 and 2008.
No information given.
n/a n/a n/a Increased from 12.5% in 2006 to 17.5% in 2008 with severe wasting recorded at 4%. However Abidjan rates relatively low at 4.7% wasting in 2008.
n/a Anaemia very high in small children at 80% in north and 76% in Abidjan. However not reported if this had changed since 2006. n/a

93
…Table E continued Description
Mothers BMI
Weight /Height
Height/ Age Wasting Stunting Other nutrition‐related changes Related behaviour changes
RELEVANT NUTRITION STUDIES FROM PREVIOUS ECONOMIC CRISES
‐‐Block et al 2002
Indonesia (central Java);
December 1995 through January 2001
Nominal food price inflation by 80‐200% over about 2 years caused by drought and the collapse of the national currency in late 1996.
14 3‐monthly rounds of data, 30 villages and 7200 households per round
n/a n/a n/a Doubled from 6% to 12%** between 1996 and 1998. Only partial recovery by 2001.
n/a Haemoglobin declined by average 0.68 g/dL, equivalent to 7% over 1.5 years. The largest declines were for cohorts born or conceived during the crisis, implying that maternal undernutrition was responsible. Authors explain that lower levels of malnutrition calculated by some previous studies were the result of failing to adjust for age and cohort. 1. 20% decline in consumption of green leafy vegetables**, source of large part of Vitamin A intake for children 2. Decline of egg consumption from an average of 0.54 to 0.24 eggs per person per week 3. Vegetable oil consumption per capita fell by 19% The authors suggest that oil consumption is a good proxy for quality of diet.
‐‐De Pee et al 2000
Indonesia (central/east Java);
(data sets varied) For households: mostly Dec 95 and 96 compared to Dec 98. For schools: 4‐6 month interval after crisis
As above. 'For example, by June‐Aug ’98, the price of rice had almost doubled, while the price of milk (powdered and condensed) was almost five‐fold higher.'
6 rounds of 7200 households, plus 95% of children 12‐15 in 24 junior high schools (approx 1500 children)
Mean BMI of mothers in Central Java was 0.46 kg/m2 lower than before the crisis**. Percent thin women increased from 14.9% pre‐crisis 17.7% one year after the start of the crisis.
n/a n/a n/a n/a The expected growth (increase in BMI) of adolescents did not occur**. Authors also comment that 'The decrease of the BMI among mothers was almost as large as the increase during the previous 30 years in South and Southeast Asia (Snedecor & Cochran, 1980). However, that increase was a combination of an increase of height and an increase of weight, while the decrease of BMI reported in this paper is only due to a loss of weight. Therefore, regaining the proportion of the BMI that was lost due to the crisis requires a smaller weight‐gain than the weight that was gained by women in South and Southeast Asia over the past 30 years.' No data given in this publication, but likely changes similar to previous entry.

94
…Table E continued Description
Mothers BMI
Weight/ Height
Height/ Age
Wasting Stunting Other nutrition‐related changes Related behaviour changes
‐‐Martin‐Prevel et al 2000
Brazzaville, Congo B.;
1993 compared to 1996
Food price rises and general inflation due to devaluation of CFA franc by 50% in Jan 1994. Nominal food expenditure nearly doubled over two years.
4206 households with a child 4‐26 months
Average BMI down by 1.28 kg/m2 *** Thin women increased from 11.3% to 15.6%. Overweight women decreased from 30% to 20%.
down by 0.20*** (raw averages changed from ‐0.50 to ‐0.71)
down by 0.19 (raw averages changed from ‐.74 to ‐.95)***
Odds Ratio 1.45*** (raw averages up from 6.0% to 8.8%)
Odds Ratio 1.26*** (raw averages up from 12.1% to 15.5%)
Mean birth weight lower by 71g*** Child diarrhoea in previous 24hrs up from 8% to 11%** Infants breastfed until 2 years up from 3.4% to 9%** 1. Diminished feeding of special transition foods to infants*** 2. Move from imported high‐energy fortified transition foods to locally made foods with lower energy and micronutrient levels*** 3. Lower proportion in local transition foods of expensive ingredients like condensed milk*** 4. Decreased health monitoring*** and use of health services possibly reflecting lack of time for caregiving as well as finance
‐‐Fouere et al
Brazzaville, Congo B. and Dakar, Senegal;
1997 ‐ qualitative study
Food price rises and general inflation due to devaluation of CFA franc in Jan 1994 No price information.
4 focus groups and 120 interviews ‐ semi random, urban
n/a n/a n/a n/a n/a n/a 1. Reducing quality of sauces, especially reducing oil and tomato, replacement of meat and fresh fish with pulses and smoked and dried fish 2. Increased consumption of street food 3. Decreasing number of meals (Congo only) 4. Decreased sharing of food with people outside family 5. Decreased fruit consumption (orange and mango)
‐‐WFP unpublished survey cited in DFID 2008
Ouagadougou, Burkina Faso;
2008
Food price rises
300 households
n/a n/a n/a n/a n/a n/a 1. Dietary diversity decreased: consumption of dairy products fell by 21%, meat fell by 25%, fruits by 31%, vitamin‐A rich vegetables fell by 32% 2. 10% increase in households that were moderately or severely food insecure

95
…Table E continued Description
Mothers BMI
Weight/Height
Height/ Age
Wasting Stunting Other nutrition‐related changes Related behaviour changes
‐‐Ag Bendech et al 1997
Bamako, Mali;
1996 ‐ qualitative study
Food price rises and general inflation due to devaluation of CFA franc in Jan 1994 No price information.
Semistructured interviews with 64 individuals from 12 families chosen to represent rich/medium/poor).
n/a n/a n/a n/a n/a n/a 1. Substituting rice (broken rice, riz brisé) with millet and sorghum 2. Replacement of meat and fish with a little dried fish powder with local oil and vegetables 3. Increased consumption of street food
‐Akindes 1999 Abidjan and Bouake, Cote D'Ivoire; 1995 and resurvey 1997 Food price rises and general inflation due to devaluation of CFA franc in Jan 1994 No price information. 210 HH with reinterview of 120 in A, 120 HH in B.
n/a n/a n/a n/a n/a n/a 1. Poorest HH increased food budget share by 5% (from 53% to 58% (rich and medium HH had larger increases) 2. Increased consumption of street restaurants, which had lower inflation than general food prices (20% vs. 35%) with 64% of HH taking one meal a day in restaurants during the crisis years. (among the poor, 49% of the HH food budget was spent in eating out during the crisis compared to 41% post‐crisis, comparable figures for rich HH were 31% and 26%) 3. Reduction in meat and fish consumption and a shift to dried and smoked fish (and eggs, largely in restaurants) 4. Reduction of vegetable consumption from 24 to 19 kg/adult equivalent/year 5. 50% reduction in processed oil and butter consumption but no significant change with local palm oil and peanut butter 6. Imported rice maintained as primary staple, with a weak substitution toward Ivorian rice and cassava 7."In Abidjan, average household size in the sample went from 6.6 to 4.4 adult equivalents between 1995 and 1997. The figures changed from 9.2 to 7.1 in Bouake´ over the same period. Interviews with the household heads revealed that indeed they were trying to reduce the mouths to feed from the household resources by reducing the household size" (however the paper gives no explanation as to how this worked) 8. The author notes that general urbanisation/timesaving trends also influenced behaviour over the period e.g. a move towards rice, tomato paste and stock cubes

96
Table F. Quality of evidence on impact from studies reviewed
IMPACT PREVALENCE: HOW WIDESPREAD? (worldwide)
SEVERITY: HOW ACUTE? (in affected areas/households)
QUALITY OF EVIDENCE
HEALTH AND NUTRITION
Micro‐nutrient malnutrition (particularly in children and childbearing women)
CS interview evidence suggests widespread cutting back on more expensive nutritious food, especially animal foods, and a decrease in Dietary Diversity Scores, DDS.
CS surveys have reported cutting back on complementary/weaning foods for infants, reduced Dietary Diversity and cutbacks in health, hygiene and time for childcare, all of which have been shown by previous work to increase the chance of worsening malnutrition (both micro and macro).
Moderate for prevalence, moderate for severity. No direct micronutrient measurements were located that could be attributed to rising food prices, but DDS data is indicative. Previous economic crises have documented severe micronutrient malnutrition (including iron and vitamin. A). Peer‐reviewed research shows DDS to be positively correlated with micronutrient deficiencies in women and young children.
Undernourishment of young children increased (anthropometric measures, e. g. low weight for height)
Poor regions where a single starchy staple dominates, with little scope for substitution, are thought to be among the worst affected.
Bangladesh: increase from 14% to 21% wasting in urban children and from 17% to 26% in rural children recorded following price rises, with greater relative increases in girls. Cambodia: in poor urban under‐5s wasting increased from 10% (2005) to 16% after price rises. Nationally, levels of malnutrition were 2. 5% higher than expected on previous trends. Mauritania: Global Acute Malnutrition increased from 8. 5% in 2007 to 12% in 2008. This was thought to be directly related to food price rises; previously GAM had been declining.
Moderate for prevalence, good for severity (however, only a few rigorous studies). Anthropometric data from Bangladesh, Cambodia and Mauritania has plausible attribution to price increases. Indirect qualitative evidence from 20 coping strategy (CS) interview surveys in 13 countries.
Weight loss in women
Insufficient evidence. In sharp contrast to previous economic crises, no evidence of increased thinness was recorded in women. However thinness in women was still at unacceptably high levels for example 31% in rural Cambodia.
Percent underweight women decreased or were stable following food price rises in relation to previous years in the only rigorous surveys which measured this (Bangladesh and Cambodia). However thinness has been declining over recent years and it might well have declined further if prices had not risen.
As above.
Reduced spending on healthcare
Reported from more than a quarter of HH in about a quarter of CS surveys.
Insufficient evidence. As discussed in the text, there may not be a good relationship between health expenditure and health outcomes, so cutting back expenditure has unpredictable effects. However at
As above. Only the Philippines survey gives more detail of what types of expenditure have been cut : these vary from changing from branded generic drugs to potentially more serious

97
IMPACT PREVALENCE: HOW WIDESPREAD? (worldwide)
SEVERITY: HOW ACUTE? (in affected areas/households)
QUALITY OF EVIDENCE
least some of the reported cutbacks are likely to have a serious impact on future health (e. g. sanitation, some drugs, obstetric care)
cutbacks, but little detail is given.
POVERTY AND LIVELIHOODS Loss of purchasing power
CS surveys pointed to little change in overall nominal income (similar percentages of HH reported improvement and decline), indicating a loss of purchasing power. Only a minority of farmers benefited in most countries, as rising retail prices were not always transmitted to the farmgate, and many small farms were unable to access land and inputs to scale up food production quickly. Rural wage labourer incomes rose later and less. Some groups saw declines in nominal income, such as labourers in cash crops whose relative price was declining, and small‐scale food traders and brewers in Africa.
An E/S African study showed formal‐sector urban food buying power declined by around 20‐40% in the 2008‐9 season, following 10 years of gradual improvement. Other groups such as informal traders and labourers were worse off. Terms of trade between food and some cash crops (e. g. cotton, tea) declined by more than 50%. Reports of taking on additional work also indicate a loss of real HH income. However, terms of trade of producers of other commodities whose price was rising (e. g. miners, sugarcane farmers) largely kept up with rising food prices.
Moderate for prevalence, poor for severity . Some CS surveys include on‐the‐spot calculations for terms of trade between food prices and wages for day labourers as well as such groups as pastoralists and fishermen, gained mostly from focus group interviews. Little data has been collected on long term movements in wages; evidence is particularly thin for the informal and rural sector in Africa.
Increased workloads
Over a quarter of households in 8 CS surveys reported family members taking on additional work to increase HH income.
Additional workloads were not quantified. Severe impacts on households can be inferred in some surveys, e.g. parts of Bangladesh and Nepal reported pulling children out of school to put them to work, and also increased migration in some areas (see below).
As above.
Increased household indebtedness
CS surveys confirm widespread use of cash loans to buy food (more than a quarter of respondents in about half the country CS surveys and up to 80% in some surveys). Failure to repay existing loans and rent also reported.
Insufficient evidence. None of the surveys reported the level of new debts incurred, or attempted to relate them to income levels or normal/seasonal levels of debt and repayment, so it is difficult to gauge how much increased indebtedness resulted.
Moderate for prevalence, poor for severity . CS interview surveys were confirmed by surveys of MicroFinance Institutions (MFIs), which also reported failure to repay debts, loan rescheduling and significant new debt. In some cases this led to cash flow problems in the MFIs. However, none of the surveys seen collected information on loan sizes or relative levels of

98
IMPACT PREVALENCE: HOW WIDESPREAD? (worldwide)
SEVERITY: HOW ACUTE? (in affected areas/households)
QUALITY OF EVIDENCE
debt incurred.
Reduced spending on children’s education / pulling children out of school
Reported from more than a quarter of HH in about a third of CS surveys. A smaller but very variable percentage (from 3% to 80% in different surveys) reported ‘pulling children out of school’.
Survey data difficult to interpret (e. g. children may only miss a few days, or a whole year). A few surveys report what are potentially severe effects on education (e. g. one in Bangladesh reports over 50% of children dropping out for the remainder of the school year).
Moderate for prevalence, poor for severity. CS surveys are insufficiently standardised across locations and at the same time insufficiently detailed in reporting for the reader to understand the severity of impact. Only the survey cited at left (from Bangladesh) collected school records; these did broadly corroborate interview data.
Sales of household assets to buy food
Sales of assets to buy food reported from <10% of surveyed households (HH) in about a third of the CS surveys.
CS surveys report a small minority (1‐4% of HH) selling land or productive assets, with a larger minority (5‐10% of respondents) selling non‐productive assets (e. g. jewellery, furniture). This indicates serious distress among this group.
Moderate for prevalence, poor for severity. Reports lack the detail needed to understand severity better.
Increased migration for work
Reported from about half the countries surveyed, by small numbers of HH (<5%) except for Nepal and Yemen which have a long history of distress migration. In Nepal migration was reported by 10% of HH in urban areas and 30% in rural areas.
Migration has some benefits but also many risks including HIV. See for example (WFP Nepal/NDRI 2008) which discusses Nepalese distress migration.
As above.
EQUALITY AND COMMUNITY Rise in inequality
Both survey and modelling data indicate that the poorest households are worst hit everywhere, and that this accounts for most of the overall increase in poverty (more than the effect of the ‘new poor’ pushed over the poverty line by rising prices). Increased inequity is a consequence. Inequity is likely to have increased between geographic regions as well as between households.
The poorest are worst hit because they spend a higher proportion of their income on food, they buy smaller quantities of less processed food and they have less access to credit and savings. Previous research on lifetime prospects of malnourished children, and the long‐term consequences of missing school, also suggest negative impacts on future equity. Quantitative data on inequity is thin, but one ADB model estimated an increase in the Gini (inequality) index of 1% for a 20% nominal food price rise. Calculations for a rice farming area in Bangladesh
Moderate for prevalence, poor for severity. Survey evidence generally confirms modelled predictions about the worst affected groups (landless and poor farmers, poor labourers and informal traders, as well as female‐headed households and those with a high proportion of dependents). See main text.
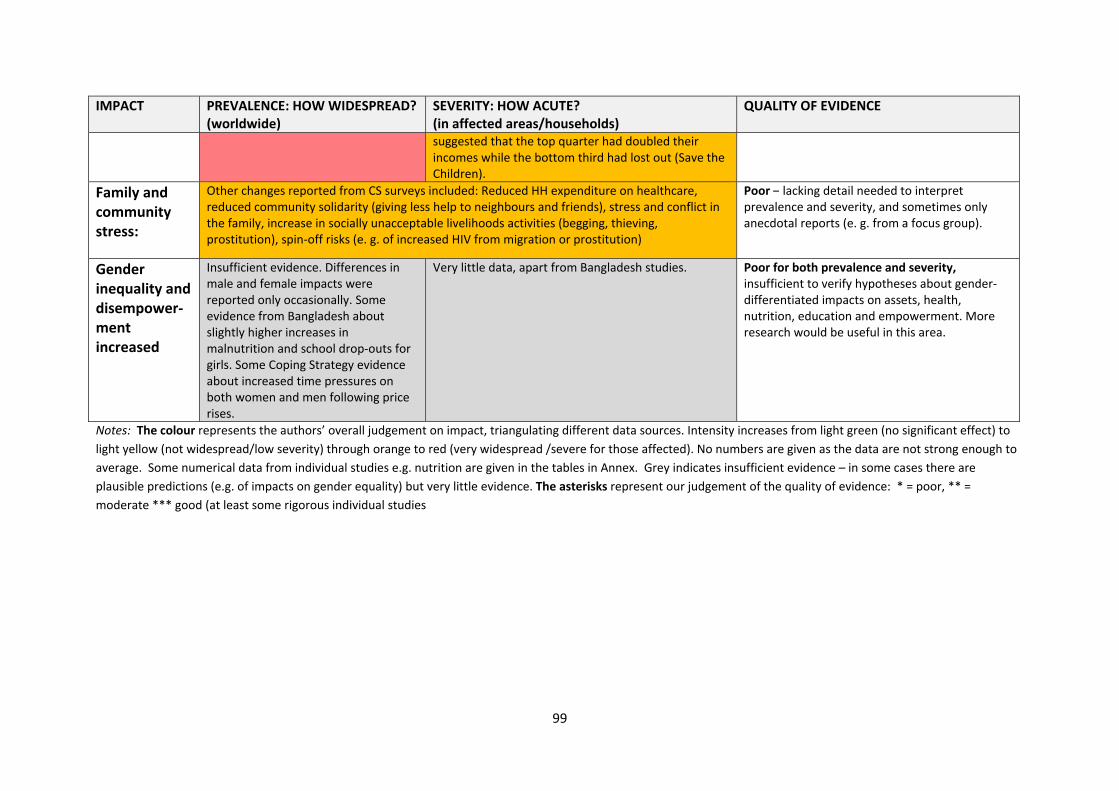
99
IMPACT PREVALENCE: HOW WIDESPREAD? (worldwide)
SEVERITY: HOW ACUTE? (in affected areas/households)
QUALITY OF EVIDENCE
suggested that the top quarter had doubled their incomes while the bottom third had lost out (Save the Children).
Family and community stress:
Other changes reported from CS surveys included: Reduced HH expenditure on healthcare, reduced community solidarity (giving less help to neighbours and friends), stress and conflict in the family, increase in socially unacceptable livelihoods activities (begging, thieving, prostitution), spin‐off risks (e. g. of increased HIV from migration or prostitution)
Poor – lacking detail needed to interpret prevalence and severity, and sometimes only anecdotal reports (e. g. from a focus group).
Gender inequality and disempower‐ment increased
Insufficient evidence. Differences in male and female impacts were reported only occasionally. Some evidence from Bangladesh about slightly higher increases in malnutrition and school drop‐outs for girls. Some Coping Strategy evidence about increased time pressures on both women and men following price rises.
Very little data, apart from Bangladesh studies. Poor for both prevalence and severity, insufficient to verify hypotheses about gender‐differentiated impacts on assets, health, nutrition, education and empowerment. More research would be useful in this area.
Notes: The colour represents the authors’ overall judgement on impact, triangulating different data sources. Intensity increases from light green (no significant effect) to
light yellow (not widespread/low severity) through orange to red (very widespread /severe for those affected). No numbers are given as the data are not strong enough to
average. Some numerical data from individual studies e.g. nutrition are given in the tables in Annex. Grey indicates insufficient evidence – in some cases there are
plausible predictions (e.g. of impacts on gender equality) but very little evidence. The asterisks represent our judgement of the quality of evidence: * = poor, ** =
moderate *** good (at least some rigorous individual studies