impact of the common agricultural policy on food price ... of the common agricultural policy on food...
TRANSCRIPT
Impact of the Common Agricultural Policy on food price
volatility for developing countries
Nicola Cantore
November 2012


Acknowledgements
This paper forms part of a wider research programme on CAP reform funded by the Bill & Melinda Gates Foundation. The findings and conclusions contained within are those of the author and do not necessarily reflect the positions or policies of the funder. The author is grateful from comments and suggestions from Dirk Willem te Velde and Sheila Page.
Author
Nicola Cantore Overseas Development Institute 203 Blackfriars Road London SE1 8NJ United Kingdom
Overseas Development Institute 203 Blackfriars Road London SE1 8NJ United Kingdom Tel: +44 (0)20 7922 0300 Fax: +44 (0)20 7922 0399 www.odi.org.uk
Disclaimer: The views presented in this paper are those of the author(s) and do not necessarily represent the views of ODI or our partners.


Impact of the Common Agricultural Policy on food price volatility for developing countries
i
Contents
Contents i Abbreviations iii Abstract v
1 Introduction 1 2 The CAP and other determinants of price volatility 2 3 Recent evidence on price volatility 5 4 Countries vulnerable to price volatility and policy responses 7 5 Impact of the CAP and of the post-2013 CAP reform proposal on price volatility 10 5.1 Impact of the CAP reform on price volatility 10 5.2 Impact of the CAP on price volatility 13 6 Conclusions 16
References 17
Impact of the Common Agricultural Policy on food price volatility for developing countries
ii
Tables & figures
Tables
Table 1: Factors contributing to spikes and volatility in food commodity prices 4 Table 2: Imports per capita in different countries ranked in descending order, 2009 (kg per habitant) 4 Table 3: Table 3: Historic volatility of grain prices, various periods 5 Table 4: Coefficient of variation of commodity prices in selected countries, 2006–10 6 Table 5: Exports from ACP countries to the EU as a share of total exports from ACP countries to the world for specific commodities, 2001 and 2010 (%) 7 Table 6: Countries highly exposed and exposed to price shocks 8 Table 7: Policies to reduce price volatility 8 Table 8: Policies to cope with price volatility 9 Table 9: Proposed post-2013 CAP reform measures 10 Table 10: Synthesis of the impact of the CAP reform proposals on price volatility 13 Table 11: Comparison between EU and world price volatility (%) 13 Table 12: Results of the co-integration analysis 14
Figures
Figure 1: The role of expectations in determining food price volatility – the cobweb model 3 Figure 2: World prices of some relevant commodities in real terms (2005 = 100), 1970–2010 5 Figure 3: Impact of the quota on price movements – stickiness in farmers’ supply reaction to market signals12 Figure 4: Transmission mechanism from EU market price to local prices in poor countries 14 Figure 5: Impact of export restrictions of food exporters and import tariff reductions on world prices 15

Impact of the Common Agricultural Policy on food price volatility for developing countries
iii
Abbreviations
ACP African, Caribbean and Pacific CAP Common Agricultural Policy DFID Department for International Development EC European Commission EU European Union FAO Food and Agricultural Organization FTA Free Trade Agreement IBRD International Bank for Reconstruction and Development IDA International Development Association IFAD International Fund for Agricultural Development IST Income Stabilisation Tool OECD Organisation for Economic Co-operation and Development PCD Policy Coherence on Development US United States WTO World Trade Organization

Impact of the Common Agricultural Policy on food price volatility for developing countries
v
Abstract
The recent discussion about the reform of the Common Agricultural Policy (CAP) should lead us to reflect on the possible consequences for developing countries, given that the European Union (EU) is committed to Policy Coherence on Development (PCD). This paper analyses the effects of the CAP (of both existing measures and proposed changes) on price volatility in developing countries, an issue of considerable importance to them. We find that existing protectionist measures may continue to exacerbate price volatility at world level. When world prices increase, mechanisms such as EU quotas in the sugar and dairy markets reduce the production of EU farmers and further increase prices. When prices are decreasing, CAP mechanisms such as export subsidies increase EU farmers’ production and further accelerate such price decreases. CAP instruments thus stabilise EU farmers’ income but accentuate price volatility at world level. We argue that the abolition of CAP instruments will help stabilise prices in world commodity markets, and therefore that the CAP reform proposal to abolish the sugar quota is a step in the right direction.


Impact of the Common Agricultural Policy on food price volatility for developing countries
1
1 Introduction The recent discussion about the reform of the Common Agricultural Policy (CAP) should lead us to reflect on the possible consequences for developing countries, given that the European Union (EU) is committed to Policy Coherence on Development (PCD). This paper analyses the effects of the CAP (of both existing measures and proposed changes) on price volatility in developing countries, an issue of considerable importance to them. Volatility is a statistical measure of the tendency of an asset’s price to fluctuate over time. Von Braun and Tadesse (2012) define it simply as the dispersion of a price series from the mean. It is usually measured in terms of standard deviations of the price change. A price spike is a popular term for one component, usually referring to a larger than normal rise in price levels over a short period of time, which may cause a short-term economic or political crisis. From a conceptual point of view, a price spike is thus different from price volatility, even though the two are strongly interconnected. However, policy discussion inevitably tends to merge the two concepts, for example in the debate about the 2006–8 food price crisis.
It is important to understand whether and how the CAP relates to price volatility, because both the level and the volatility of prices affect development and poverty. Producers are concerned about low prices: when income is too low to provide for the farm family or for the operational needs of the farm, this may threaten living standards as well as longer-term viability. Conversely, high prices represent a problem for households purchasing agricultural commodities. Ivanic and Martin (2008) analyse the impact of the food price spike in 2008 on poverty in a set of poor countries and find that, overall, it was generally adverse. Despite certain variations by commodity and by country, most of the poor are net consumers of food and, as such, the negative effects of high prices tend to be greater than those of low food prices. Urban households clearly lose out but, even though many rural households gain from higher food prices, the overall impact on poverty remains negative.
Hoyos and Medvedev (2009) assess the impact of the 2008 food price crisis on poverty. They use domestic food consumer price data from between January 2005 and December 2007 – when the relative price of food rose by an average of 5.6% – to find an implied increase in the extreme poverty headcount at the global level of 1.7 percentage points, equivalent to about 155 million new poor people.
Not all price movements are bad from a poverty perspective, for example when they follow a smooth and well-established trend reflecting market fundamentals or when they exhibit a typical and well-known seasonal pattern (FAO et al., 2011). However, variations in prices become problematic when they are large and cannot be anticipated and, as a result, create a level of uncertainty that increases risks for producers, traders, consumers and governments. For these reasons, price volatility may have negative consequences for developing countries. At an aggregate level, commodity price volatility has a negative impact on economic growth, operating mainly through lower accumulation of physical capital (Cavalcanti et al., 2011).
The aim of this paper is to analyse how the CAP reform and existing CAP instruments affect price volatility. Section 2 summarises recent evidence on fluctuations in the prices of agricultural commodities and Section 3 recent evidence on price volatility. In Section 4, we discuss which countries are vulnerable to price volatility and possible policy responses. Section 5 discusses the impact of CAP reforms and CAP existing policies on price volatility and ultimately developing countries. Section 6 draws conclusions and implications.

Impact of the Common Agricultural Policy on food price volatility for developing countries
2
2 The CAP and other determinants of price volatility
There are many causes of price volatility. The Food and Agricultural Organization (FAO) et al. (2011) mention the following determinants:
Growing populations and incomes in emerging and developing countries will add significantly to the demand for food in the coming decades.
The demand for food and feed crops for the production of biofuels is changing with changes in technology, policy and the prices of traditional fuels.
Agricultural commodity prices are becoming increasingly correlated with oil prices. Oil prices affect agricultural input prices directly (e.g. through the price of fuel and fertiliser) as well as through the impact on biofuels, which are introducing new sources of fluctuation.
The lower ratio of stocks to the new higher levels of demand and supply increases the risk that changes in demand or supply will have large price effects, and there are also uncertainties about stock levels in some parts of the world.
Climate change has increased uncertainty in terms of expectations of future prices.
Stronger demand for food crops and animal products in conjunction with slow growth in agricultural productivity and low stocks results in upward pressure on prices.
The changes that are driving price trends upward, including population growth, increased affluence (leading to more demand for animal protein), urbanisation and the move towards biofuels, are putting more pressure on finite resources such as land and water, with uncertain effects, potentially resulting in more volatility.
Currency fluctuations may be increasing, leading to more volatility in local prices.
Policy measures put in place by governments to reduce fluctuations within their own markets (e.g. import or export restrictions and taxes and increased stocks) increase price movements in the rest of the world. The stronger the attempt to isolate the domestic market from the rest of the world, the stronger the impact on world price fluctuations. The CAP is one example of this type of influence on volatility.
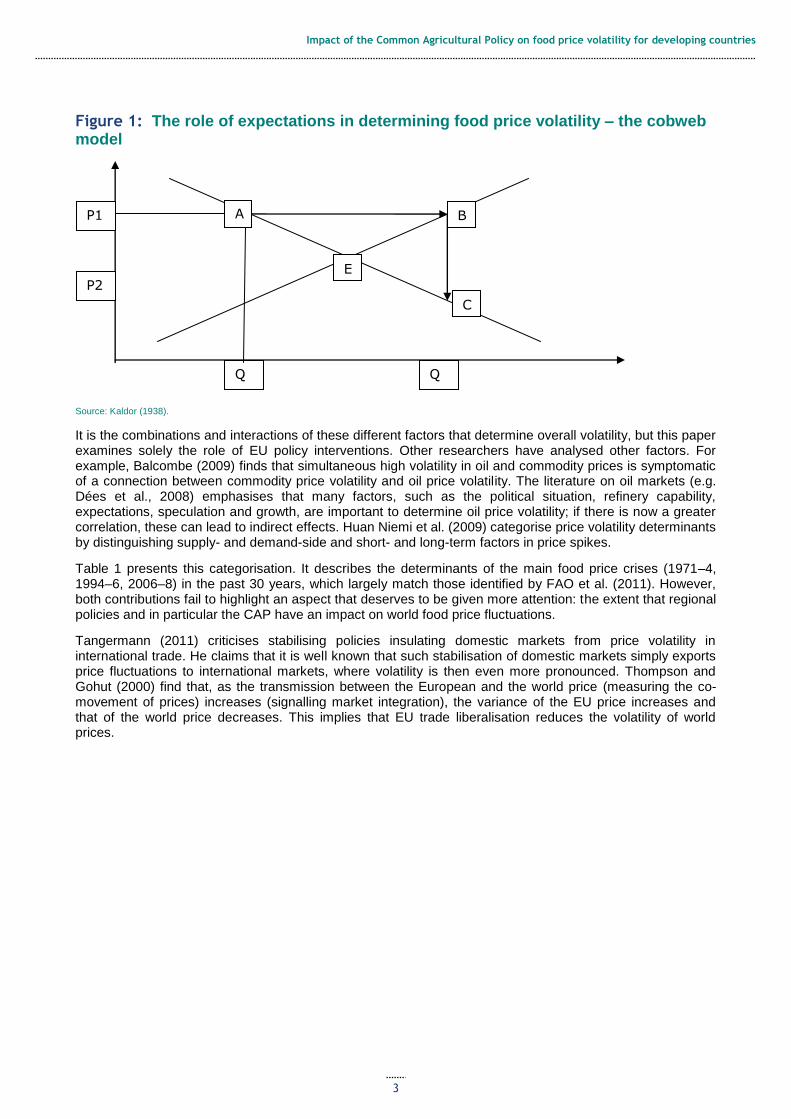
Expectations represent another important determinant of price levels and volatility. Kaldor (1938) illustrates this process using describing the ‘cobweb model’ (see Figure 1). The equilibrium price is at the intersection of the supply and demand curves (point E). A poor harvest in period 1 determined by bad weather conditions means supply falls to Q1, so that prices rise to P1. If producers plan their period 2 production under the expectation that this high price will continue, then the period 2 supply will be higher, at Q2. Prices therefore fall to P2 when they try to sell all their output. This process repeats itself and may generate a convergent case towards equilibrium E or a divergent case with an increasing magnitude of fluctuations depending on the slope of the demand and supply curve.
Impact of the Common Agricultural Policy on food price volatility for developing countries
3
Figure 1: The role of expectations in determining food price volatility – the cobweb model
Source: Kaldor (1938).
It is the combinations and interactions of these different factors that determine overall volatility, but this paper examines solely the role of EU policy interventions. Other researchers have analysed other factors. For example, Balcombe (2009) finds that simultaneous high volatility in oil and commodity prices is symptomatic of a connection between commodity price volatility and oil price volatility. The literature on oil markets (e.g. Dées et al., 2008) emphasises that many factors, such as the political situation, refinery capability, expectations, speculation and growth, are important to determine oil price volatility; if there is now a greater correlation, these can lead to indirect effects. Huan Niemi et al. (2009) categorise price volatility determinants by distinguishing supply- and demand-side and short- and long-term factors in price spikes.
Table 1 presents this categorisation. It describes the determinants of the main food price crises (1971–4, 1994–6, 2006–8) in the past 30 years, which largely match those identified by FAO et al. (2011). However, both contributions fail to highlight an aspect that deserves to be given more attention: the extent that regional policies and in particular the CAP have an impact on world food price fluctuations.
Tangermann (2011) criticises stabilising policies insulating domestic markets from price volatility in international trade. He claims that it is well known that such stabilisation of domestic markets simply exports price fluctuations to international markets, where volatility is then even more pronounced. Thompson and Gohut (2000) find that, as the transmission between the European and the world price (measuring the co-movement of prices) increases (signalling market integration), the variance of the EU price increases and that of the world price decreases. This implies that EU trade liberalisation reduces the volatility of world prices.
Q
1
P1 A
Q
2
P2
B
C
E

Impact of the Common Agricultural Policy on food price volatility for developing countries
4
Table 1: Factors contributing to spikes and volatility in food commodity prices
1971–4 1994–6 2006–8
Long term
Demand side
Export demand growth X X X
Owing to food demand growth X X
Owing to population growth X
New use/innovation: biofuels X
Supply side
Slow production growth X X X
Declining research and development investments X X
Land retirement X X
Short term
Demand side
Government food policies X X X
Supply side
Government food policies X X X
Weather-induced crops losses/failures X X X
Macroeconomic
Economic growth X X
Depreciation of the US dollar X X X
Rising crude oil and energy prices X X
Accumulation of petrodollars/foreign reserves X X
Future market/speculation X X
Inflation X X
Financial crisis X X
Reduced global stockpiles of food X X X
Source: Huan Niemi et al. (2009).
However, we must stress that high world price volatility does not automatically mean producer price volatility in poor countries. Again, this depends on the degree of isolation of the poor country from the world market. Kaspersen and Føyn (2010) analyse the transmission between the world market price and local producers’ prices in Uganda for sorghum and coffee. They find that food markets in Uganda are not integrated into world markets, and that oil prices are an important factor behind the price transmission to the country. The case is a bit different for Robusta coffee, a cash crop. In the 1990s, when coffee prices on the world market were high, prices in Uganda were strongly connected to these and did not depend on the oil price.
On the other hand, a rise in the world price of food will directly affect developing countries that import food. Table 2 shows the 10 countries with the highest levels of imports per capita for 4 commodities in the group of FAOSTAT least-developed countries in 2009. Small countries and island states are particularly vulnerable to import price raises.
Table 2: Imports per capita in different countries ranked in descending order, 2009 (kg per habitant)
Barley Wheat Rice Beef
Mauritania 0.286 Djibouti 137.600 Cape Verde 189.473 Maldives 4.331
Tanzania 0.095 Mauritania 121.129 Samoa 113.431 Djibouti 4.196
Uganda 0.048 Yemen 119.979 Gambia 89.004 Tuvalu 2.244
Yemen 0.027 Cape Verde 46.216 Maldives 84.715 Samoa 1.919
Djibouti 0.006 Sudan 41.674 Kiribati 82.498 São Tomé and Príncipe 0.935
Solomon Islands 0.006 Lesotho 34.897
São Tomé and Príncipe 64.591 Cape Verde 0.832
Maldives 0.003 Senegal 34.576 Senegal 63.676 Senegal 0.593
Sudan 0.002 Afghanistan 33.955 Vanuatu 50.293 Solomon Islands 0.326
Malawi 0.001 Bangladesh 27.576 Timor-Leste 48.240 Comoros 0.312
Sierra Leone 0.000 Haiti 24.289 Comoros 46.840 Yemen 0.210
Source: Author’s elaboration from FAOSTAT and World Development Indicators.

Impact of the Common Agricultural Policy on food price volatility for developing countries
5
3 Recent evidence on price volatility Figure 2 shows international food prices for some important commodities, indicating the occurrence of three large food price spikes, one during the 1970s, one in the 1990s and one in 2008.
Figure 2: World prices of some relevant commodities in real terms (2005 = 100), 1970–2010
Source: FAO et al. (2011).
If we observe the coefficient of variation1 of commodities, we cannot observe an unambiguous increase in
the volatility for cereals commodities.2 Figure 2 and Table 3 together suggest that the volatility debate is in
many cases identified with the debate concerning food price spikes. A warming-up of the debate on food prices may also arise when food price volatility is lower, as during the 1990s in the presence of a food price spike.
Table 3: Table 3: Historic volatility of grain prices, various periods
Maize Rice Wheat
Average 1967–9 0.088 0.154 0.104
Average 1970–9 0.194 0.183 0.208
Average 1980–9 0.185 0.157 0.123
Average 1990–9 0.089 0.121 0.096
Average 2000–9 0.135 0.116 0.112
Source: http://www.agri-outlook.org/pages/0,2987,en_36774715_36775671_1_1_1_1_1,00.html
There has been a wide diversity of experiences in terms of price volatility. International price volatility is indeed large, with domestic price volatility generally lower for the selected countries and commodities displayed in Table 4. Important exceptions relate to some developing countries, such as maize in Uganda and wheat in Sudan, for which prices have been more volatile. For markets more open to trade, volatility in prices converges with values close to those in international markets. As for the EU and countries that use
1 The coefficient of variation is an alternative measure of dispersion representing the ratio between standard deviation and the average. It is often used instead of the simple standard deviation to compare the dispersion of commodities with different averages. 2 See http://www.agri-outlook.org/pages/0,2987,en_36774715_36775671_1_1_1_1_1,00.html

Impact of the Common Agricultural Policy on food price volatility for developing countries
6
price-stabilising policies extensively, such as China, India and Japan, price volatility is substantially less than in international markets.
Table 4: Coefficient of variation of commodity prices in selected countries, 2006–10
Maize Rice Wheat
International 0.110 0.117 0.080
Argentina 0.084
Australia 0.080
Bangladesh 0.055 0.056
Brazil 0.103 0.085 0.118
Burkina Faso 0.102
Cambodia 0.107
China 0.012
Ecuador 0.046
Egypt 0.081
EU 0.061 0.096
India 0.034 0.043
Israel 0.061
Japan 0.027
Kenya 0.093
Mexico 0.042
Peru 0.026
Philippines 0.046
South Africa 0.078
Sudan 0.128
Thailand 0.117
Uganda 0.157
US 0.110 0.110 0.080
Source: http://www.agri-outlook.org/pages/0,2987,en_36774715_36775671_1_1_1_1_1,00.html

Impact of the Common Agricultural Policy on food price volatility for developing countries
7
4 Countries vulnerable to price volatility and policy responses
It is important to monitor price volatility for both producers and consumers in order to identify those most vulnerable to price shocks (negative shocks for exporters and positive shocks for consumers). According to Subervie (2008), the supply effect of world price instability is accentuated by a high rate of inflation, a low level of infrastructure and a poorly developed financial system. From this description, it is evident that low-income country exporters and producers are those most likely to suffer from world price shocks. The price volatility problem is particularly important for those least-developed countries exporting cash crops. Bourguignon et al. (2004) highlight that these countries are subject to an important risk dependent on the export of a small number of commodities with highly fluctuating world prices. The dependency of poor countries trading can also be geographical, as many countries may rely on the exports of specific countries to specific regions such as the EU, as Table 5 shows. European policies such as on import tariffs, stocks and export subsidies stabilise EU internal prices to beef up the prices and income of EU farmers but in many cases at the expenses of farmers in developing countries. An interesting finding is that exports of African, Caribbean and Pacific (ACP) countries to the EU in many cases are substantial, but over the past decade they have been reducing.
Table 5: Exports from ACP countries to the EU as a share of total exports from ACP countries to the world for specific commodities, 2001 and 2010 (%)
Total for reporting ACP countries* 2001 2010
Dairy 4.4 2.8
Meat 52.3 33.5
Vegetables 55.4 29.8
Fruits 63.7 44.2
Cereals 11.7 10.3
Note: Appendix 2 contains detailed data. * 33 reporting countries are the Bahamas, Barbados, Belize, Botswana, Burkina Faso, Cameroon, Cape Verde, Côte d’Ivoire, Dominica, the Dominican Republic, Ethiopia, Guyana, Jamaica, Kenya, Madagascar, Malawi, Mali, Mauritania, Mauritius, Mozambique, Niger, Nigeria, Rwanda, Samoa, São Tomé and Príncipe, Senegal, South Africa, St Vincent and Grenadine, Tanzania, Togo, Uganda, Zambia and Zimbabwe. Côte d’Ivoire is not included for cereals.
Source: Author’s elaboration from FAOSTAT.
Wiggins (2010) presents criteria to identify the countries most vulnerable to a price shock in the cereals market. Any country that imports a good large fraction of its cereals is seriously exposed to high food prices: countries that are reasonably well integrated into world markets are the most vulnerable, since domestic prices should rise to world market parity levels through exports when the world price is sufficiently high. Hunger levels and risks in terms of local production harvesting capability are other important characteristics for identifying vulnerable countries. According to these criteria, a group of 21 African and Asian countries is the most vulnerable in terms of food price surges (Table 6).

Impact of the Common Agricultural Policy on food price volatility for developing countries
8
Table 6: Countries highly exposed and exposed to price shocks
Highly exposed Exposed
Eritrea Sierra Leone
Afghanistan Mozambique
Haiti Togo
Comoros Sudan
Yemen Kenya
Somalia Guinea
Timor-Leste
Liberia
Djibouti
Guinea-Bissau
Democratic People’s Republic of Korea
The Gambia
Senegal
Tajikistan
Sri Lanka
Source: Wiggins (2010).
Volatility in world prices is a risk for developing countries because the policies they can take to counter it are not effective and/or are costly. FAO et al. (2011) discuss a set of policies to reduce price volatility and reduce the consequences of price volatility (see Tables 7 and 8). In the list of possible options, international food stocks, trade policies and national buffer stocks appear somewhat problematic. In conditions of food crisis, international food stocks have not proven successful at reducing prices, and trade policies such as export restrictions and import tariffs have provided only short-run stabilisation, with world price volatility coming as a cost of this. Regarding policies to cope with price volatility, national buffers are an expensive solution, especially when stocks are large.
Table 7: Policies to reduce price volatility
Policy Description
Market information, transparency and policy response
A lack of reliable and up-to-date information on crop supply, demand, stocks and export availability contributed to recent price spikes. For developing countries, enhanced market information and early warning systems would enable both governments and the private sector to plan ahead. Governments would be able to more accurately assess needs, make budgetary provision for producer and consumer safety nets and better position emergency food security reserves. Better market information and analysis could reduce uncertainties and assist producers, traders and consumers to make better decisions.
International food stocks
Historically, international buffer stock mechanisms are widely judged to have had limited success in reducing the volatility of prices. They have been more effective in moderating downward price movements than price surges. In the case of a price surge, a buffer stock agency can release in the market only what it has previously bought, and once its stock is exhausted there are no further means to curb price increases. Attempting to stabilise prices using buffer stocks is potentially very costly.
Futures markets Futures markets perform several functions: they provide the instruments to transfer price risk, they facilitate price discovery and, arguably, in recent years they have increasingly been offering commodities as an asset class for financial investors, such as fund and money managers who were previously been present in these markets. Governments should recognise the need to improve information and transparency in futures and over-the-counter markets and encourage appropriate rules to enhance their economic functions, paying attention to the need for harmonisation across exchanges in order to avoid regulatory arbitrage.
Trade Trade policies such as the reduction of import tariffs and export restrictions may stabilise prices in the short run in developing countries. However, in the medium to long term they may further increase price volatility.3
Dealing with waste
In developing countries, post-harvest and post-production losses owing to inadequate infrastructure, poor storage facilities, insufficient technical capacity and underdeveloped markets are the main causes of waste. Most losses are avoidable to some degree, and some types of waste could be almost entirely eliminated.
Source: FAO et al. (2011).
3 A more in depth discussion of trade policies is contained in Paragraph 5.

Impact of the Common Agricultural Policy on food price volatility for developing countries
9
Table 8: Policies to cope with price volatility
Policy Description
National buffer stocks
Buffer stocks are an important policy instrument in a number of emerging economies and developing countries, although developed countries have virtually abandoned them. Some rice-producing Asian countries rely on a combination of rice reserves, import or export monopolies and domestic procurement to stabilise prices within a predetermined band. The operational costs of buffer stocks are significant. Appropriate storage infrastructure is extremely costly to acquire, and buying the food stock and holding it is also very expensive.
Emergency food reserves
Relatively smaller food security emergency reserves can be used effectively and at lower cost to assist the most vulnerable. Unlike buffer stocks that attempt to offset price movements and act as universal subsidies benefiting both poor and non-poor consumers, emergency food reserves can make food available to vulnerable population groups in times of crisis. In addition, emergency reserves of relatively small quantities of staple foods will not disrupt normal private sector market development, which is needed for long-term food security.
International safety nets
In times of crisis, contingent and compensatory financing facilities are important mechanisms assisting countries to avoid major fiscal deficits and lower the cost of imported food, while maintaining key social assistance programmes. The World Bank is currently helping countries deal with the food crisis through instruments to help manage short-term impacts, including grant funding for rapid response in the poorest and most vulnerable countries and expedited use of International Development Association (IDA) and International Bank for Reconstruction and Development (IBRD) funds.
Risk management for vulnerable producers
For farmers who have access to market-based insurance tools, normal variations in production and prices do not require any policy response and they should directly manage them, as part of normal business strategy. Infrequent catastrophic events are, by definition, beyond the capacity of farmers or markets, and therefore require government involvement. In between the normal and the catastrophic risks is an intermediate risk level that can be handled through market tools, such as insurance and futures markets or cooperative/mutual arrangements among farmers themselves.
Source: FAO et al. (2011).
Chatellier (2011) argues that one of the main limitations of the system is that there is no global governance structure to coordinate the actions of different international players (often with conflicting interests) in an optimal way. The President of the French Financial Markets Authority recently proposed the setting-up of an international forum of agricultural markets (Jouyet et al., 2010). He argued that, despite the huge number of international actors, there is no broad perspective in use to govern agricultural issues. Such an informal international forum for global stability would start from the G20 but be open to all interested states and important global actors with a link to other relevant domains (e.g. financial markets) with the aim of agreeing coordinated and effective policy responses.

Impact of the Common Agricultural Policy on food price volatility for developing countries
10
5 Impact of the CAP and of the post-2013 CAP reform proposal on price volatility
The CAP contains a set of measures aimed at providing farmers with a ‘reasonable’ standard of living and consumers with ‘quality’ food at ‘fair’ prices and at preserving ‘rural heritage’. Some European Commission (EC) documents also argue specifically that it should reduce price volatility facing European farmers and consumers. It is thus intended to meet European objectives for the distribution of income between farmers and others and non-market objectives for consumption.
5.1 Impact of the CAP reform on price volatility
The CAP is now under scrutiny by policymakers and scientists because of the EC’s current reform proposal. The proposed reforms comprise a large number of measures (Table 9).
Table 9: Proposed post-2013 CAP reform measures
Direct payments Aim
General principle The aim is to reduce significantly the discrepancies between the levels of payments obtained after full implementation of the current legislation, between farmers, between regions (i.e. internally) and between Member States (i.e. externally). All Member States will be obliged to move towards a uniform payment per hectare at national or regional level by the start of 2019.
Greening In addition to the basic payment, each holding will receive a payment per hectare for respecting certain agricultural practices beneficial for the climate and the environment. Member States will use 30% of the national envelope in order to pay for this. The three measures are 1) maintaining permanent pasture; 2) crops diversification; and 3) maintaining an ecological focus area.
Young farmers The basic payment to new entrant young farmers (those under 40) should be topped up by an additional 25% for the first five years of installation.
Small farmers Any farmer claiming support in 2014 may decide by 15 October 2014 to participate in the Small Farmers Scheme and thereby receive an annual payment fixed by the Member State of between €500 and €1,000, regardless of the farm’s size.
Coupled option In order to address the potentially adverse effects of redistributing direct payments on a national basis and take account of existing conditions, Member States will have the option of providing limited amounts of ‘coupled’ payments, i.e. a payment linked to a specific product. This will be limited to 5% of the national envelope if the Member State currently provides 0–5% of coupled support, or up to 10% if the current level of coupled support is higher than 5%.
Transferring funds between pillars
Member States will have the possibility of transferring up to 10% of their national envelope for direct payments (Pillar 1) to their rural development envelope.
Cross-compliance The award of all payments from the direct payment national envelope will continue to be linked to the respect of a number of baseline requirements relating to environment, animal welfare and plant and animal health standards. However, as an exercise in simplification, the number of statutory management requirements has been reduced from 18 to 13 and rules on good agricultural & environmental condition from 15 to 8.
Capping The amount of support that any individual farm can receive from the Basic Payment Scheme will be limited to €300,000 per year.
Active farmers The EC is tightening the definition of active farmers. Aimed at excluding payments to applicants who have no real or tangible agricultural activity, the proposed definition states that payments would not be granted to applicants whose CAP direct payments are less than 5% of total receipts from all non-agricultural activities.
Market management mechanisms
Aim
Safeguard clauses Strengthening of market disturbances interventions such as in the case of e-coli.
Market Abolition of the sugar quota.
Rural development Aim
Innovation and knowledge
Support to cooperation between agriculture and research and advisory services to farms.
Restructuring/ modernisation
Grants still available.
Young farmers A combination of measures can include business start-up grants.
Small farmers Business start-up aid up to €15,000 per small farm.
Risk management toolkit
Insurance and mutual funds – for crop and weather insurance, animal disease (currently available under Article 68 in Pillar 1) – extended to include income stabilisation option.
Leader Leader start-up kit to aid setting-up leader groups and strategies; promoting flexibility for combining with other funds in local areas.
Source: EC (2011a).
The measures relevant to our discussion on prices and price volatility are:

Impact of the Common Agricultural Policy on food price volatility for developing countries
11
1 The reform of direct payments;
2 Stock management reform;
3 Sugar quota abolition; and
4 The risk management toolkit.
Direct payments Direct payments help stabilise EU farmers’ income, but they export price volatility outside the EU. Two considerations clearly emerge from Table 9:
5 The post-2013 CAP reform is intended to strengthen decoupling of direct payments by limiting coupled payments. Decoupled payments (which are treated favourable by the World Trade Organization (WTO)) are in theory less market distorting than coupled payments.
6 One of the main novelties of the reform will be the convergence of the direct payment per hectare for Member States. A recent study based on the partial equilibrium CAPRI model analyses the impact of a flat rate for direct payments at regional, Member State and EU levels, showing relatively small production and price impacts. In the EU flat rate scenario, which is the most price responsive, the maximum price increase was for cereals, by 1.5 % for the EU-15 and 2.9 % for the EU-10 (EC, 2011b).
At aggregate European level, redistribution of direct payments could affect price levels in specific sectors if the redistribution of funds generates a redistribution of production patterns across sectors (see Cantore et al., 2011), but is not strictly connected to the price volatility discussion. A reduction of coupled payments would reduce production and price levels, but in the medium to long term would allow for a better functioning of market mechanisms as, in case of large world price reductions, coupled payments would continue to encourage EU farmers’ supply and to further price decreases.
Coupled payments are distortive, but the issue of whether decoupled direct payments generate a distortive impact on production is still under debate. Whereas from a theoretical point of view they should be non-distortive, evidence shows there are channels by which they could still create effects on production and, consequently, on world prices (see Cantore et al., 2011) and produce effects on price volatility similar to those of coupled payments. An empirical analysis by Anderson and Nelgen (2010) shows that the nominal
rate of assistance4 to agricultural producers tends to be higher the higher a country’s income per capita and
the weaker the country’s agricultural comparative advantage. The findings suggest that developed countries in particular put in place mechanisms addressing price volatility.
Stock management The EC proposes a reform of the €55 billion-a-year programme from 2014, including maintaining private storage aid for commodities such as sugar, olive oil and butter, but not extending it to cereals. In an interview, Filippo Cerulli Irelli, Vice-president of EU industry association Caobisco, summarised the advantages and disadvantages of buffer stocks to control price volatility:
‘In the past certainly in Europe we were abusing the usage of (public) intervention stocks, and this was creating a lot of burden and cost [...] Nevertheless, stocks remain one of the most important risk management tools, and it is one of the few tools we have to address the extreme volatility we are observing on markets for a number of years’ (Thomson Reuters, 2011).
Under current rules, the EU automatically buys wheat into public intervention if prices fall below €101 ($130) per tonne. In principle, buffer stocks represent an instrument to control price volatility. As buffers are used for anti-cyclical purposes (to raise prices when they are reducing or to reduce prices when they are surging beyond appropriate thresholds), they may have an important stabilisation role. However, buffer stock policies have been misused in Europe in the past. During the 2006–8 food price crisis, the shortage of national buffer stocks in developing countries was one of the causes of spikes in cereal prices (Wiggins et al., 2010).
Sugar quota abolition The abolition of the sugar quota appears to be a much more important change in terms of impacts on price movements. Quota abolition in the sugar market reduces the sugar price and increases production by EU sugar producers, further reducing prices. A recent report estimates that this would lead to a world price drop of about 15% (DFID, 2011). Calì et al. (2011) find that the price reduction is much greater in percentage terms when the world market price is high because when it is low EU farmers have no incentive to increase production so there is no impact on price reduction. The estimated impact of a price reduction on poverty in
4 This is the extent to which the domestic producer price exceeds the border price, and hence is negative if farmers receive less than the price at the country’s border for a similar product.

Impact of the Common Agricultural Policy on food price volatility for developing countries
12
ACP countries deriving from a quota abolition in a high or average world sugar price scenario could be an increase of 200,000 in the number of the poor living on less than $1.25 a day in 2020 (DFID, 2011).
Therefore, quota abolition has an impact on prices, which would penalise production and export levels in poor countries and have consequences for poverty. However, it would represent a step towards well-functioning world market price formation mechanisms in the medium to long term. Figure 3 illustrates the impact of a quota on price volatility. From an initial equilibrium A, suppose there is a sudden increase in demand for the commodity at world level. This will cause an increase in the price (equilibrium B), which an increase in supply in the EU cannot accommodate, as on the right of the quota, the supply curve becomes totally inelastic. In this case, we have a measure intended to defend a floor price for EU farmers that creates a further price surge at world level (equilibrium C). Even though the CAP reform proposal incorporates the end of the sugar quota by 2015, European sugar beet growers have unanimously supported the prolongation of sugar quotas to 2020, and not 2015 as provided for under the reform. French Agriculture Minister Stéphane Le Foll has endorsed the opinion of the beet growers (Momagri, 2012).
Figure 3: Impact of the quota on price movements – stickiness in farmers’ supply reaction to market signals
Source: http://www.tcd.ie/Economics/staff/amtthews/FoodPolicy/LectureTopics/PricePolicy/Frameset11.htm
Risk management toolkit The risk management toolkit could replace other CAP measures. A strong and solid insurance scheme to stabilise the incomes of EU farmers would make it possible to abolish direct market intervention mechanisms. The EC CAP proposal incorporates three options to strengthen risk management tools:
Strengthening current tools (insurance subsidies and mutual funds): a public–private partnership can help an insurance market start working through demand incentives, institutional arrangements and information sharing and pooling. The agricultural insurance market is bound to be very narrow without public subsidies, as only few crops and risks can be insured profitably without any support.
Income stabilisation tools (ISTs): subsidising insurance and putting an IST in place would contribute substantially to reducing farmers’ income volatility. According to the Organisation for Economic Co-operation and Development (OECD), insurance indemnities reduce income variance for 77% of farmers, while some form of IST reduces variance for 80% of farmers. When the two measures are combined, then reduction occurs for 87% of farmers.
Agricultural calamity fund: a global agricultural risk management fund would ensure solidarity between Member States in major adverse events. The tool would be shaped on the basis of the EU Solidarity Fund used to respond in a rapid, efficient and flexible manner to come to the aid of any Member State in the event of a major natural disaster.
Implementing these tools is not easy, and each has some important disadvantages. Schemes such as insurance subsidies and ISTs could generate typical moral hazard troubles: farmers may not have the right
Initial demand Initial supply
Demand increase
Quota
Quantity
Price
Initial price
Price with the demand increase
A
B
C Price with the demand increase and quota
Impact of the Common Agricultural Policy on food price volatility for developing countries
13
incentives to maximise income and avoid damages. In the case of the agricultural calamity fund, the problem would be the exact definition of an extreme event to be refunded.
Such insurance mechanisms would replace ISTs such as payments, which in many cases still distort production within the EU in favour of agriculture over other activities, and thus distort markets for the rest of the world against agriculture and towards manufacturing or services, but may have fewer distorting effects among commodities and types of farmer.
Table 10: Synthesis of the impact of the CAP reform proposals on price volatility
CAP reform proposals Impact on price volatility
Strengthen decoupling of direct payments by limiting coupled payments
Decoupled payments in principle are non-distorting. However, recent evidence shows they may increase production (e.g. non competitive farmers may have not the incentive to leave the market) and accelerate price reductions.
Subsidies to private storage Buffer stocks may stabilise prices as they may help increase prices when they are low and decrease prices when they are high.
Sugar quota abolition Quotas exacerbate price increases as they limit EU farmers’ production.
Risk management toolkit Strengthening of insurance schemes decreases the need for payments to stabilise farmers’ income which may affect price volatility
5.2 Impact of the CAP on price volatility
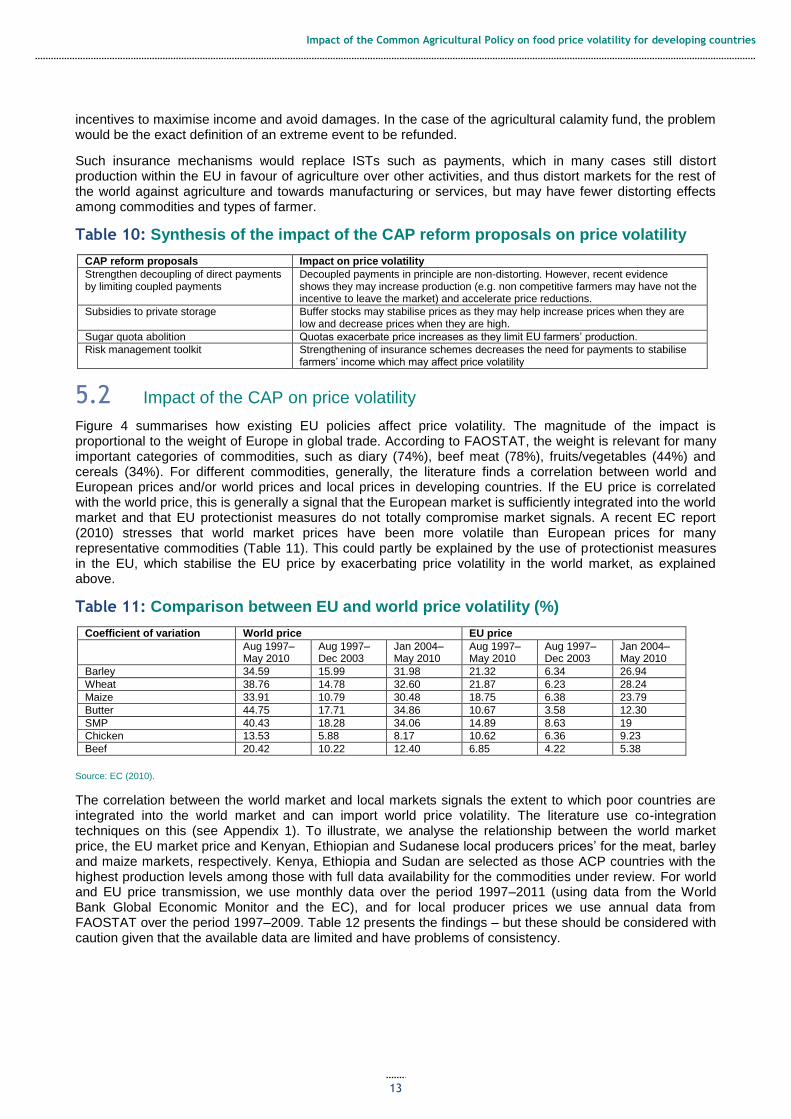
Figure 4 summarises how existing EU policies affect price volatility. The magnitude of the impact is proportional to the weight of Europe in global trade. According to FAOSTAT, the weight is relevant for many important categories of commodities, such as diary (74%), beef meat (78%), fruits/vegetables (44%) and cereals (34%). For different commodities, generally, the literature finds a correlation between world and European prices and/or world prices and local prices in developing countries. If the EU price is correlated with the world price, this is generally a signal that the European market is sufficiently integrated into the world market and that EU protectionist measures do not totally compromise market signals. A recent EC report (2010) stresses that world market prices have been more volatile than European prices for many representative commodities (Table 11). This could partly be explained by the use of protectionist measures in the EU, which stabilise the EU price by exacerbating price volatility in the world market, as explained above.
Table 11: Comparison between EU and world price volatility (%)
Coefficient of variation World price EU price
Aug 1997–May 2010
Aug 1997–Dec 2003
Jan 2004–May 2010
Aug 1997–May 2010
Aug 1997–Dec 2003
Jan 2004–May 2010
Barley 34.59 15.99 31.98 21.32 6.34 26.94
Wheat 38.76 14.78 32.60 21.87 6.23 28.24
Maize 33.91 10.79 30.48 18.75 6.38 23.79
Butter 44.75 17.71 34.86 10.67 3.58 12.30
SMP 40.43 18.28 34.06 14.89 8.63 19
Chicken 13.53 5.88 8.17 10.62 6.36 9.23
Beef 20.42 10.22 12.40 6.85 4.22 5.38
Source: EC (2010).
The correlation between the world market and local markets signals the extent to which poor countries are integrated into the world market and can import world price volatility. The literature use co-integration techniques on this (see Appendix 1). To illustrate, we analyse the relationship between the world market price, the EU market price and Kenyan, Ethiopian and Sudanese local producers prices’ for the meat, barley and maize markets, respectively. Kenya, Ethiopia and Sudan are selected as those ACP countries with the highest production levels among those with full data availability for the commodities under review. For world and EU price transmission, we use monthly data over the period 1997–2011 (using data from the World Bank Global Economic Monitor and the EC), and for local producer prices we use annual data from FAOSTAT over the period 1997–2009. Table 12 presents the findings – but these should be considered with caution given that the available data are limited and have problems of consistency.

Impact of the Common Agricultural Policy on food price volatility for developing countries
14
Figure 4: Transmission mechanism from EU market price to local prices in poor countries
Source: Author’s elaborations.
Table 12: Results of the co-integration analysis
Commodity Transmission (co-integration) EU price–world price
Transmission (co-integration) world price–local prices
Cattle meat NO (evidence that protectionist measures are compromising the functioning of market signals between the world and the EU)
NO (whatever the dynamics between world and EU price volatility, Kenyan cattle meat price volatility is not affected because the local market is isolated)
Barley PARTLY (market signals between the EU and the world are working, but protectionist measures can still continue to play a role in exporting price volatility)
NO (whatever the dynamics between the world and EU price volatility, Ethiopian barley price volatility is not affected because the local market is isolated)
Maize PARTLY (market signals between the EU and the world are working, but protectionist measures can still continue to play a role in exporting price volatility)
NO (whatever the dynamics between the world and EU price volatility, Sudanese maize price volatility is not affected because the local market is isolated)
Source: Author’s elaborations.
We find a strong transmission between the world market and the EU market only for cereal commodities, and not for meat. On cereals, this is in line with the findings of Thompson and Gohut (2000). However, we do not find robust transmission between the world market and local producer prices. In the context of our exercise, the weak integration of Kenya, Ethiopia and Sudan in the cattle meat, barley and maize world markets is supported by the fact that, in these countries, exports represent only respectively 0.05%, 0.01% and 3%, respectively, of the total production of these commodities
5. Minot (2011) finds a complementary result when
he shows that international prices have some effect on prices for African consumers, but the spike in world prices in 2007–8 was more clearly transmitted because of the simultaneous fuel price shocks and local conditions. These findings show that isolation from international markets may protect poor countries from CAP-related world prices fluctuations.
5 Calculated using 2009 FAOSTAT data with simple elaborations.
EU policies
Protectionism Free trade
More stable EU market price More EU volatile market price
More volatile world market price More stable world market price
More volatile local price in poor countries
Integration Isolation
More volatile or stable local price according to local market conditions
More volatile or stable local price according to local market conditions
More volatile or stable local price according to local market conditions
Integration Isolation

Impact of the Common Agricultural Policy on food price volatility for developing countries
15
There are many protectionist or market interventions measures that have not been incorporated into the current CAP reform debate. Many of these are discussed more in detail in Cantore et al. (2011); this paper merely summarises some important points:
Import tariffs: tariffs are not considered part of the current CAP reform debate. Their effective level depends on the EU’s complex system of preferences and free trade agreements (FTAs).
Export subsidies: the EU paid €1.0 billion in export subsidies in 2008 and €650 million in 2009. These have been used most recently for dairy products, chicken and pork; they remain a policy option. For example, Poland has recently proposed reconsidering export subsidies in the dairy market (Council of the EU, 2012). Measures such as export refunds generate an oversupply when the world price is reducing and create stickiness in the reaction of farmers as a response to world market signals.
As Martin and Anderson (2010) emphasise, trade policies such as export subsidies and import tariffs may worsen price volatility. They explain how export restrictions and import tariff reductions worsened the food price crisis in 2006–8 (Figure 5). When food prices surged, from an initial equilibrium A, many food-exporting countries tried to limit exports to guarantee domestic food availability (equilibrium B). At the same time, food-importing countries reduced import tariffs to make food cheaper for local people. The final outcome of these simultaneous policies led to a further increase in world prices without affecting trade levels (equilibrium C).
Figure 5: Impact of export restrictions of food exporters and import tariff reductions on world prices
Source: Martin and Anderson (2010).
Initial demand
Supply with export restriction
Demand with import tariff reduction
Initial supply
Quantity
Price
Initial price
Price with import and export policies
A
B
C
Price with import policies
Impact of the Common Agricultural Policy on food price volatility for developing countries
16
6 Conclusions Some important points in this discussion are relevant in relation to the link between the CAP and price volatility:
7 Price volatility depends on many demand and supply factors.
8 Food policies and in particular the CAP are important factors determining price volatility. In particular, the more protectionist the CAP, the greater the impact on volatility of world prices.
Moreover, our analysis reveals some simple policy implications concerning the relationship between the current EU CAP and price volatility:
9 What is more important from a price volatility perspective is that the set of existing protectionist trade policies (tariffs, export subsidies) that are not touched by the reform will continue to stabilise EU prices with costs in terms of world market price volatility.
10 The current CAP reform proposal may help in reducing price volatility in the sugar market by removing the quota in 2015 and in coping with price volatility by strengthening private national buffers.
11 To reduce price volatility, the EU could eliminate CAP market interventions and strengthen less distorting farmers’ income risk management tools.
12 Developing countries most affected by the markets for commodities covered by the CAP, especially those for which the EU is a major part of the world market, will suffer most.
The key issue from a policy point of view is that the CAP consists of instruments influencing market price signal mechanisms. The elimination of these instruments would lead to a questioning of the existence of the CAP itself. Thus, the policy discussion should focus on how to redirect the funds currently devoted to the CAP in order to achieve 1) food security worldwide and 2) income redistribution to rural areas of the EU (if this is, in fact, still a policy objective supported by populations in the EU), without negative effects on the rest of the world. This would be consistent with EC PCD.

Impact of the Common Agricultural Policy on food price volatility for developing countries
17
References
Anderson, K. and Nelgen, S. (2010) ‘Trade Barrier Volatility and Domestic Price Stabilization’. Policy Research Working Paper 5511. Washington, DC: World Bank.
Balcombe, K. (2009) ‘The Nature and Determinants of Volatility in Agricultural Prices’. MPRA Paper 24819. Munich: University Library of Munich,
Bourguignon, F., Lambert, S. and Eisenmann, A. (2004) ‘Trade Exposure and Income Volatility in Cash Crop Exporting Developing Countries’. European Review of Agricultural Economics 31: 369–87.
Calì, M., Nolte, S. and Cantore, N. (2010) ‘Sweet and Sour Changes of the Sugar Regime’. London: ODI.
Cantore, N., Kennan, J. and Page, S. (2009) ‘CAP Reform and Development’. London: ODI.
Cavalcanti, T., Mohaddes, K. and Raissi, M. (2011) ‘Commodity Price Volatility and the Sources of Growth’. Cambridge Working Papers in Economics 1112. Cambridge: Faculty of Economics, University of Cambridge.
Chatellier, V. (2011) ‘Price Volatility, Market Regulation and Risk Management: Challenges for the Future of the CAP’. International Agricultural Policy 33–51.
Council of the EU (European Union) (2012) ‘Situation on the Milk and Dairy Market and Necessary Measures to Be Undertaken’. Note from the Polish Delegation 11284/12, 12 June.
Dées, S, Gasteuil, A., Kaufmann, R. and Mann, M. (2008) ‘Assessing the Factors behind Oil Price Changes’. Working Paper 855. Frankfurt: ECB.
DFID (Department for International Development) (2011) ‘Impact of EU Policy Reform on Developing Countries’. Report by LMC International and ODI. London: ODI.
EC (European Commission) (2010) ‘Commodity Price Volatility: International and EU Perspective’. Brussels: EC.
EC (European Commission) (2011a) ‘CAP Reform – An Explanation of the Main Elements’. Memo/11/65, 12 October. Brussels: EC.
EC (European Commission) (2011b) ‘Impact Assessment: Common Agricultural Policy towards 2020: Annex 3’. Brussels: EC.
EC (European Commission) (2011c) ‘Impact Assessment: Common Agricultural Policy towards 2020: Annex 5’. Brussels: EC.
EC (European Commission) (2011d) ‘Impact assessment: Common Agricultural Policy towards 2020: Annex 6’. Brussels: EC.
FAO (Food and Agricultural Organization) (2011) ‘Price Volatility in Food and Agricultural Markets: Policy Responses’. Rome and Paris: FAO and OECD.
Hoyos R. and Medvedev, D. (2009) ‘Poverty Effects of Higher Food Prices: A Global Perspective’. Policy Research Working Paper 4887. Washington, DC: World Bank.
Huan Niemi, E., Kerkelä, L., Lehtonen, H. and Niemi, J. (2009) ‘Implications of Trade Liberalization and Domestic Reforms on EU Agricultural Markets’. International Food and Agribusiness Marketing Review 12: 29–60.
IFAD (International Fund for Agricultural Development) (2009) ‘Food Price Volatility: How to Help Smallholder Farmers Manage Risk and Uncertainty’. Rome: IFAD.
Ivanic, M. and Martin, W. (2011) ‘Implications of Higher Global Food Prices for Poverty in Low Income Countries’. Policy Research Working Paper 4594. Washington, DC: World Bank.
Jouyet, J.P., de Boissieu, C. and Guillon, S. (2010) ‘Prévenir et gérer l’instabilité des marches agricoles’. Paris : Government of France.
Kaldor, N. (1938) ‘“The Cobweb Theorem”’. Quarterly Journal of Economics 52(2): 255–80.
Kaspersen, L. and Føyn, T. (2010) ‘Price Transmission for Agricultural Commodities in Uganda: An Empirical Vector Regressive Analysis’. Working Paper 6. Washington, DC: IFPRI.
Martin, W. and Anderson, K. (2010) ‘Trade Distortions and Food Price Surges’. Berkeley, CA: University of California.
Minot, N. (2011) ‘Transmission of World Price Changes to Markets in Sub-Saharan Africa’. Discussion Paper 01059. Washington, DC: IFPRI.
Momagri (2012) ‘Abolishing Sugar Quotas: Assessing Impacts before Dismantling’. 25 June. http://www.momagri.org/UK/a-look-at-the-news/Abolishing-sugar-quotas-Assessing-impacts-before-dismantling_1126.html
Subervie, J. (2008) ‘The Variable Response of Agricultural Supply to World Price Instability in Developing Countries’. Journal of Agricultural Economics 59: 79–92.
Impact of the Common Agricultural Policy on food price volatility for developing countries
18
Tangermann, S. (2011) ‘Risk Management in Agriculture and the Future of the EU’s Common Agricultural Policy’. Issue Paper 34. Geneva: ICTSD.
Thompson, S. and Gohout, W. (2000) ‘CAP Reform, Wheat Price Instability and Producer Welfare’. American Economic Association
Annual Meeting, Atlanta, 30 July–2 August.
Thomson Reuters (2011) ‘Inside Agriculture’. 25 November.
Von Braun, J. and Tadesse G. (2012) ‘Global Food Price Volatilities and Spikes: An Overview of Costs, Causes and Solutions’. Discussion Paper on Development Policy 161. Bonn: ZEF.
Wiggins, S. (2010) ‘Countries Vulnerable to a Price Spike in 2011’. London: ODI.
Wiggins, S., Compton, J. and Keats, S. (2010) ‘Food Price Crisis FAQ’. London: ODI.

Impact of the Common Agricultural Policy on food price volatility for developing countries
19
Appendix 1: The co-integration technique – the Engle and Granger methodology
Co-integration theory is definitely the innovation in theoretical econometrics that has created the most interest among economists in the past decade. The definition in the simple case of two time series x t and yt, both integrated of order one (this is abbreviated I(1), and means that the process contains a unit root), is the following:
Definition:
xt and yt are said to be co-integrated if there exists a parameter α such that:
µt = yt - αxt
is a stationary process.
The procedure requires three steps:
13 Check the variables x and y are non-stationary (I(1));
14 Regress y to x;
15 Check the residual of regression in step 2 is stationary.
Points 1 and 3 are implemented through the usual Phillip–Perron tests.

Impact of the Common Agricultural Policy on food price volatility for developing countries
20
Appendix 2: Exports from ACP countries to the EU as a share of total exports from ACP countries to the world (63 ACP countries), 2000–10 (%) Cereals
2000 2001 2002 2003 2004 2005 2006 2007 2008 2009 2010
Antigua and Barbuda - - - - -
Bahamas, The - - - - - - - - - - -
Barbados - - - - - - - - - - -
Belize - - - - - - - - - - -
Benin - - - - - - -
Botswana - - - - - - - - - - -
Burkina Faso - - 0.0 0.0 - - 0.3 0.5 0.0
Burundi - - - - 0.0 - 0.0 -
Cameroon - 3.0 - 0.2 - 8.0 - 100.0 - 1.5 -
Cape Verde - - - - - - - - - -
Central African Republic - - - - - - - -
Cook Islands - - - - - - -
Côte d'Ivoire 0.1 0.1 0.2 0.0 0.2 0.5 0.1 0.0 0.1
Cuba - - 100.0 - - - -
Djibouti -
Dominica - - - - - - - - - - -
Dominican Republic 0.2 0.1 39.2 0.2 0.1 0.1 44.0 29.8 0.1 5.3
East Timor - -
Eritrea -
Ethiopia (excludes Eritrea) 0.8 0.4 0.9 1.1 1.1 1.8 1.1 0.1 - 15.8
Fiji - - - - - - - - -
Gabon - - - - - - - - - -
Gambia, The 37.9 - - 100.0 - - - - - -
Ghana 1.6 5.5 33.1 2.1 1.8 13.5 3.2 0.1
Grenada - - - - - - - - -
Guinea 3.3 4.2 0.2 - 64.1 98.0 - 0.1
Guinea-Bissau - - -
Guyana 45.4 41.0 54.7 50.3 31.4 43.7 41.8 33.6 21.6 44.0 27.8
Jamaica - - - - 1.8 - - 1.8 56.2 22.9 23.0
Kenya - 0.7 0.0 0.1 0.6 0.9 1.6 0.1 0.3 0.1 0.6
Kiribati -
Lesotho -
Madagascar 71.9 34.8 34.4 72.8 68.7 97.6 52.6 66.7 63.1 19.8 27.4
Malawi - 30.7 - 0.3 - - - 0.0 0.1 0.2 0.5
Mali - 0.2 3.9 17.7 0.0 0.3 0.1 - 0.7 4.3
Mauritania - - - - - - - - - -
Mauritius 26.6 32.0 39.3 1.8 12.6 - 74.6 21.1 10.7 15.2 -
Mozambique 1.4 - 1.0 - 0.1 - 0.0 - - -
Namibia - - - - - 0.3 0.5 0.1 1.8
Niger - 19.7 - - - - - 0.2 - - -
Nigeria - - - - - 84.3 41.2 - 57.9
Papua New Guinea - - 0.1 -
Rwanda - 100.0 - - 100.0 0.0 - - - -
Samoa - - - - - - - - - -
São Tomé and Príncipe - - - - - - - 100.0 - 100.0 -
Senegal - 61.6 1.4 0.3 0.2 0.3 1.2 1.8 2.5 0.4 7.7
Seychelles - - - - -
Solomon Islands - - - - - -
South Africa 0.7 0.8 0.7 1.3 1.3 0.2 9.5 1.0 0.1 0.6 5.8
St Kitts and Nevis - - - - - - - - -
St Lucia - - - - - - - - -
St Vincent and the Grenadines 2.1 5.6 3.3 4.2 2.7 1.8 1.6 - - - -
Sudan 41.0 87.8 25.2 66.2 53.3 72.4 58.1 5.8 0.0
Suriname 40.2 42.8
Swaziland - - - - - - - -
Tanzania 1.4 0.1 0.5 0.1 0.0 1.4 0.0 0.2 0.7 - 0.2
Togo 0.3 - 16.2 2.4 - 8.0 - -
Tonga - - -
Trinidad and Tobago - 0.1 - - 0.4 - 0.4 2.5 5.3 3.5
Uganda 18.3 - 1.7 0.0 0.2 0.3 0.2 0.1 0.0 0.4 0.0
Vanuatu - -
Zambia 0.9 - - - - - 0.3 - 0.0 - -

Impact of the Common Agricultural Policy on food price volatility for developing countries
21
Fruits and nuts 2000 2001 2002 2003 2004 2005 2006 2007 2008 2009 2010
Antigua and Barbuda - - 80.4
Bahamas, The - - - - - - - - - - -
Barbados 11.7 4.6 10.0 1.6 1.1 0.0 33.5 60.6 73.7 73.0 72.3
Belize 76.4 98.7 75.5 69.3 61.2 62.7 62.5 71.4 78.7 76.4
Benin 2.1 1.9 0.7 18.8 4.3 0.9 1.2
Botswana - - - - - - - 0.0 0.0 0.2 5.1
Burkina Faso 42.6 53.3 7.2 9.5 11.7 72.2 39.3 44.6 37.8
Burundi - - - 91.4 48.4 1.9 88.1
Cameroon 100.0 97.6 99.5 99.9 99.8 99.9 99.8 98.7 99.9 100.0 99.5
Cape Verde
Central African Republic -
Cook Islands - - - - - - -
Côte d'Ivoire 73.7 74.5 66.7 56.4 64.3 59.4 44.3 41.4 21.0
Cuba 96.1 96.3 99.0 94.9 87.5 96.6 92.8
Djibouti -
Dominica 76.3 71.4 70.7 63.7 67.8 71.2 69.3 58.7 51.6 42.7 36.8
Dominican Republic 51.2 51.2 59.4 42.4 63.2 61.5 71.7 73.7 76.3 79.1
East Timor -
Eritrea 51.4
Ethiopia (excludes Eritrea) - 0.2 2.5 1.6 1.1 5.4 3.3 5.6 3.3 7.3
Fiji - 0.9 - - 0.1 - - 0.0 -
Gabon - - - - 100.0 100.0
Gambia, The 99.5 - 90.6 100.0 98.3 88.8 91.6 98.0 23.1 37.6
Ghana 70.4 65.6 58.1 90.6 67.5 5.5 25.9 25.5
Grenada 66.4 64.9 84.8 88.0 93.5 100.0 27.4 41.4 20.5
Guinea 92.5 100.0 82.8 17.1 44.5 46.0 27.2 33.7
Guinea-Bissau 0.6 0.1 0.0
Guyana - - - 0.1 0.3 0.0 0.3 1.0 1.5 1.1 0.8
Jamaica 79.5 73.2 73.4 75.8 72.9 57.7 74.3 62.6 18.4 20.5 27.9
Kenya 37.3 38.1 29.2 15.6 26.7 43.4 38.7 46.8 44.2 44.3 33.8
Kiribati -
Lesotho -
Madagascar 98.7 93.8 91.5 90.4 90.4 94.2 93.1 91.1 84.9 90.7 91.3
Malawi 63.3 48.9 64.9 46.6 56.0 64.5 62.6 60.8 57.0 19.9 29.1
Mali 29.8 64.1 64.4 47.7 48.6 77.5 62.5 15.4 82.1 39.3
Mauritania -
Mauritius 72.3 91.4 88.0 91.8 85.0 83.2 87.2 88.6 88.9 91.0
Mozambique 2.7 0.5 2.8 3.9 18.1 28.9 23.0 26.6 29.2 8.3
Namibia 10.6 6.9 10.4 4.9 47.1 58.1 61.8 76.2 85.1
Niger - - - - - - 0.3 - - - -
Nigeria 86.2 - 13.0 13.5 7.2 49.4 19.2 21.2 1.8
Papua New Guinea 86.9 - 20.2 100.0
Rwanda 100.0 100.0 91.5 67.2 28.7 29.1 42.7 97.4
Samoa 32.8 - - - - - - - - -
São Tomé and Príncipe 0.3 4.8 2.6 1.5 0.5 2.3 - - - 2.9 12.9
Senegal 11.8 6.2 23.2 81.8 76.4 61.7 74.2 78.9 92.4 93.1 97.3
Seychelles 4.9 - 5.9 1.6 0.5
Solomon Islands - - - - - -
South Africa 69.2 66.1 60.7 61.4 65.6 64.6 55.6 61.2 59.7 56.8 51.0
St Kitts and Nevis - - 0.8 - - - - - -
St Lucia 97.3 96.7 97.7 96.7 98.8 98.6 98.3 95.7 96.5
St Vincent and the Grenadines
90.9 72.6 84.7 56.2 80.9 76.2 76.2 74.6 46.1 34.2 45.2
Sudan 4.5 1.4 0.8 1.2 0.2 1.0 2.2 - 3.7
Suriname
Swaziland 5.2 - 32.7 59.0 - - - 0.0
Tanzania 2.3 2.1 2.4 4.1 5.5 5.5 11.9 29.2 17.4 12.9 9.4
Togo 95.8 45.4 50.7 3.4 7.7 42.7 63.0 79.7
Tonga 0.0 - -
Trinidad and Tobago 27.5 17.1 9.1 8.7 5.0 3.0 11.9 7.3 12.0 0.0
Uganda 92.7 82.9 72.2 62.3 59.5 66.5 63.8 70.5 57.7 44.2 29.8
Vanuatu 0.2 -
Zambia 0.1 57.5 - - 49.3 - - - - - -

Impact of the Common Agricultural Policy on food price volatility for developing countries
22
Vegetables
2000 2001 2002 2003 2004 2005 2006 2007 2008 2009 2010
Antigua and Barbuda 83.7 13.3 100.0 - -
Bahamas, The - - - - - - - - - - -
Barbados 14.2 1.5 6.8 4.6 5.4 1.0 13.1 26.1 53.7 7.5 7.9
Belize 9.0 11.6 - 2.5 2.6 8.0 4.2 1.7 4.7 5.4 5.1
Benin 17.1 30.1 81.5 17.6 9.9 - -
Botswana 47.5 6.7 15.9 - - 1.2 - 0.0 - 0.0 0.0
Burkina Faso 63.8 37.8 21.2 21.6 16.8 17.2 31.9 25.9 7.0
Burundi - 86.4 - - 30.5 84.8 99.5 98.5
Cameroon 3.8 4.6 10.3 11.9 6.5 16.2 22.1 17.2 17.5 11.4 5.9
Cape Verde - - - - - - - - - -
Central African Republic - - - - - - - -
Cook Islands - - - - - - -
Côte d'Ivoire 47.1 43.5 17.8 35.2 79.7 58.1 42.8 4.6 6.9
Cuba - - 4.0 0.4 3.7 32.5 17.1
Djibouti -
Dominica 37.2 35.7 40.1 38.6 44.0 46.1 41.8 38.6 45.7 51.7 54.3
Dominican Republic 4.2 5.4 9.6 4.9 4.9 5.4 11.0 8.7 10.5 10.3
East Timor 100.0 -
Eritrea -
Ethiopia (excludes Eritrea) 25.6 19.1 20.5 27.1 33.3 21.2 18.0 14.5 11.5 7.9
Fiji - - - 0.0 - - - 0.1 0.1
Gabon - - - 82.9 - - - - 100.0 100.0
Gambia, The 99.6 99.6 99.5 99.8 99.9 100.0 97.8 99.9 99.9 8.9
Ghana 45.4 74.3 82.0 78.8 78.2 84.3 60.4 30.9
Grenada - - - 12.4 36.8 - 91.9 36.7 24.7
Guinea 46.5 47.9 - 25.0 2.7 - - 25.0
Guinea-Bissau 100.0 - 58.7
Guyana - 1.8 0.1 - 0.7 0.0 0.5 0.0 0.1 0.0 0.7
Jamaica 12.4 13.4 13.9 15.3 17.6 18.7 17.9 15.3 17.7 17.1 21.9
Kenya 95.4 94.8 94.4 83.2 96.2 92.6 94.8 87.8 91.7 94.2 76.8
Kiribati -
Lesotho -
Madagascar 92.1 83.9 90.2 85.6 80.1 82.5 82.8 72.7 68.3 51.5 39.7
Malawi 9.8 24.3 23.4 6.4 21.4 26.2 5.2 5.8 3.5 2.7 36.7
Mali 7.9 42.5 57.2 31.6 35.6 5.7 6.8 0.1 18.0 81.4
Mauritania - - - - - - - - - -
Mauritius 28.5 51.9 36.0 25.4 48.7 - 66.6 86.6 45.7 52.9 94.9
Mozambique 0.9 0.6 1.5 0.7 0.3 8.5 2.0 3.3 0.6 0.7
Namibia 17.1 19.0 25.7 18.4 3.4 5.5 12.5 17.4 16.8
Niger - 0.0 0.0 0.1 0.0 0.0 0.0 0.0 0.0 0.0 0.0
Nigeria - - - - 42.5 23.9 48.3 8.5 11.8
Papua New Guinea 62.6 - - -
Rwanda 100.0 - 6.6 20.2 0.6 2.4 2.1 1.5 2.1 -
Samoa - - - - - - - - - -
São Tomé and Príncipe 12.5 - - 51.3 63.1 10.3 - - - 62.6 -
Senegal 89.2 92.6 98.6 97.6 96.0 95.1 98.8 97.9 98.7 98.7 99.2
Seychelles - - - - 100.0
Solomon Islands - - - - - -
South Africa 33.1 32.9 31.0 36.7 40.4 30.3 24.2 30.6 31.1 25.3 20.6
St Kitts and Nevis 4.7 - 2.6 - - - - - -
St Lucia - - 4.4 7.7 26.9 23.9 44.0 64.1 31.9
St Vincent and the Grenadines
8.8 8.8 12.3 10.4 8.9 7.0 7.6 4.5 10.1 7.5 5.0
Sudan 27.6 54.7 29.8 51.2 92.9 - 55.6 - 7.3
Suriname 82.1 84.6
Swaziland 32.5 52.2 - - 0.4 39.5 - -
Tanzania 51.0 24.4 31.4 32.4 47.0 31.0 19.5 4.6 3.1 5.1 3.8
Togo 84.0 41.1 89.6 33.5 78.8 46.3 33.7 47.4
Tonga - - -
Trinidad and Tobago 1.5 1.4 0.2 0.7 0.6 0.8 1.2 0.6 0.2 0.0
Uganda 4.5 43.2 47.8 44.9 30.6 17.9 27.8 39.8 22.3 25.7 29.7
Vanuatu - -
Zambia 72.3 96.1 77.0 95.1 58.1 88.4 87.3 82.3 74.8 48.7 69.0

Impact of the Common Agricultural Policy on food price volatility for developing countries
23
Meat
2000 2001 2002 2003 2004 2005 2006 2007 2008 2009 2010
Antigua and Barbuda - - - - -
Bahamas, The - - - - - - - - - - -
Barbados - 50.1 - 40.8 50.4 50.9 20.2 19.7 41.9 27.9 28.0
Belize - - - - - - - - - - -
Benin 62.1 48.7 13.5 - 30.0 - -
Botswana 85.4 76.2 90.9 98.3 81.2 61.0 52.3 56.9 55.5 54.9 43.9
Burkina Faso - - - - - - - - -
Burundi - - - - - - - -
Cameroon - 1.6 - 0.6 - - - - - 3.1 8.2
Cape Verde - - - - - - - - - -
Central African Republic - - - - - - - -
Cook Islands - - - - - - -
Côte d'Ivoire 18.2 - - - - 1.7 0.0 0.0 0.1
Cuba - - - - - - -
Djibouti -
Dominica - - - - - - - - 100.0 - -
Dominican Republic - - - 0.3 - - 0.1 - - -
East Timor - -
Eritrea -
Ethiopia (excludes Eritrea) 0.0 1.0 0.3 0.0 0.3 1.4 - 0.9 - 0.8
Fiji - - - - - - - - -
Gabon 64.4 - 2.6 - - - - - - -
Gambia, The - - - - - 92.3 100.0 100.0 - -
Ghana 2.0 0.3 1.4 - 5.0 - - -
Grenada - - - - - - - - -
Guinea - 100.0 - - 100.0 - - -
Guinea-Bissau - - -
Guyana - - - - - 1.3 69.1 - - - -
Jamaica - - - - - - - - - - -
Kenya 0.1 - - - 1.2 1.3 1.4 1.5 2.2 0.6 1.0
Kiribati -
Lesotho -
Madagascar 39.5 - 31.8 - 81.0 26.0 - - - - -
Malawi - - - - - - - - - - -
Mali - 2.9 - 2.5 - - - - - -
Mauritania - - - - - - - - - 100.0
Mauritius - - 22.2 10.2 51.3 - 93.6 90.1 90.1 43.1 -
Mozambique - - - - - - - - - -
Namibia 6.1 2.6 7.6 2.4 0.6 1.7 0.0 0.7 5.1
Niger - - - - - - - - - - -
Nigeria 100.0 100.0 - - - - 61.7 - -
Papua New Guinea - - - -
Rwanda - - 100.0 - - - - - - -
Samoa - - - - - - - - - -
São Tomé and Príncipe - - - - - - - - - - -
Senegal - - - - - 0.3 9.2 4.7 5.6 5.7 3.7
Seychelles - - - - -
Solomon Islands - - - - - -
South Africa 39.2 58.2 46.2 50.6 54.1 34.3 53.6 63.7 56.8 43.6 38.7
St Kitts and Nevis 79.4 100.0 81.8 - - - - - -
St Lucia - - - - - - - - -
St Vincent and the Grenadines
- - - - - - - - - - -
Sudan 0.0 0.1 0.0 - 0.0 - 0.1 - -
Suriname 21.9 -
Swaziland 45.6 - 35.9 - - - - -
Tanzania 38.2 21.6 50.0 - 72.8 52.0 2.3 0.0 0.5 35.1 -
Togo 6.1 9.6 37.5 - 59.8 - - -
Tonga - - -
Trinidad and Tobago - 5.9 0.2 - - - - - - -
Uganda - - 74.8 - 2.5 - 3.4 - - - 2.8
Vanuatu - -
Zambia - 3.1 - - - - - 27.8 - 9.1 2.3

Impact of the Common Agricultural Policy on food price volatility for developing countries
24
Dairy
2000 2001 2002 2003 2004 2005 2006 2007 2008 2009 2010
Antigua and Barbuda - - - -
Bahamas, The - - - - - - - - - - -
Barbados 0.1 0.0 0.0 - - - 0.0 - 3.1 0.1 -
Belize - - - -
Benin 100.0 62.1 - - 2.6 - -
Botswana - - - - - - - 0.0 - - -
Burkina Faso 59.1 - 2.0 - 79.0 - - -
Burundi 21.0 92.4 - - - - -
Cameroon - - 1.0 - - - - 0.0 - 0.0 -
Cape Verde - 100.0 - - -
Central African Republic 100.0 -
Cook Islands - - - - - - -
Côte d'Ivoire 4.5 0.0 0.3 0.0 0.0 0.0 0.0 0.0 0.0
Cuba - - - 1.2 - - -
Djibouti -
Dominica - - - - - - - 4.9
Dominican Republic 0.7 0.4 2.4 0.4 0.1 0.4 - 0.0 0.1 1.4
East Timor - -
Eritrea -
Ethiopia (excludes Eritrea)
- 9.5 9.3 14.5 - - 1.1 1.2 2.5 0.2
Fiji - - 0.7 - - - - - -
Gabon - - - - - - - - 0.0 -
Gambia, The - - 100.0 100.0 69.0 12.5 - -
Ghana 3.4 1.4 2.5 1.3 1.2 6.5 0.8 0.6
Grenada - -
Guinea 5.7 100.0 - 26.2
Guinea-Bissau -
Guyana 5.0 - - - - 0.0 0.1 17.9 0.4 - -
Jamaica 1.1 0.7 1.3 1.5 - 0.2 0.1 1.7 4.6 0.8 2.7
Kenya 0.1 - 1.2 0.1 0.1 0.1 0.5 0.1 - - 0.0
Kiribati -
Lesotho -
Madagascar - 0.0 0.4 - - 0.2 - 99.8 0.1 - -
Malawi - - - - - - - - 2.4 -
Mali - 100.0 23.7 62.7 1.4 54.5
Mauritania -
Mauritius 3.3 1.4 0.2 0.4 3.1 - 1.0 1.1 15.0 2.2 0.4
Mozambique - 1.8 3.7 - - - - - - -
Namibia - 0.6 - - 0.6 2.0 0.8 0.3 4.2
Niger 47.0 14.7 11.3 - - 64.3 0.0 - - 9.3 86.1
Nigeria 65.6 - - - 49.4 6.7 12.0 4.5 10.3
Papua New Guinea 100.0 - - -
Rwanda - - - - - - - - -
Samoa - - - - - - - - - -
São Tomé and Príncipe - - 100.0 100.0 -
Senegal - - - - 0.0 - - 0.0 0.0 0.0 0.0
Seychelles 2.1 - - - -
Solomon Islands - - - - - -
South Africa 4.8 0.2 18.1 7.1 14.2 0.2 0.1 0.1 0.3 0.1 0.0
St Kitts and Nevis 96.0 - - - - - - - -
St Lucia - - - - - - - - -
St Vincent and the Grenadines
- - - - - - - 100.0
Sudan 93.7 - - - - - - - -
Suriname - -
Swaziland 2.8 - - - 9.1 - - -
Tanzania - - 0.6 5.6 57.1 - 67.2 3.8 0.0 5.4 -
Togo - - 0.6 3.5 2.7 3.6 - -
Tonga - - -
Trinidad and Tobago 2.9 0.7 0.3 - - 0.0 - 0.1 - 0.0
Uganda 1.4 11.0 - 15.0 40.6 - 1.9 0.2 0.1 0.1 -
Vanuatu -
Zambia - - 38.6 0.0 - - - - - - -