impact of the cell polarity protein scribble on liver
TRANSCRIPT

DISSERTATION
IMPACT OF THE
CELL POLARITY PROTEIN SCRIBBLE
ON LIVER CANCER FORMATION
AND PROGRESSION
submitted to the
Combined Faculties for the Natural Sciences and for Mathematics
of the Ruperto-Carola University of Heidelberg, Germany
for the degree of
Doctor of Natural Sciences
Shan Wan
2017

Dissertation
submitted to the
Combined Faculties for the Natural Sciences and for Mathematics
of the Ruperto-Carola University of Heidelberg, Germany
for the degree of
Doctor of Natural Sciences
presented by
Master of Science: Shan, Wan
born in: Mianyang, China
Oral-examination:

Referees: Prof. Dr. Peter Angel
Dr. Kai Breuhahn
IMPACT OF THE
CELL POLARITY PROTEIN SCRIBBLE
ON LIVER CANCER FORMATION
AND PROGRESSION
SUMMARY
SUMMARY
Polarization of hepatocytes is important for the liver to carry out its functions such as bile
secretion and detoxification. In this context, cell polarity complexes, which are spatially
segregated at specific membranous domains, define the 3-dimensional orientation of
hepatocytes. The disturbance of cell polarity in early phases of tumorigenesis is
associated with the activation of intracellular oncogenic signaling pathways affecting
tumor initiation and progression. However, if the disturbance of hepatocellular polarity
participates in the tumor formation and how the dysregulation of polarity factors affect
hepatocarcinogenesis is poorly understood.
In order to define relevant cell polarity factors, which may support hepatocellular
carcinoma (HCC) development, high-dimensional expression array data derived from
HCC patients were screened for significantly dysregulated cell polarity genes. A panel of
significantly dysregulated factors, including the baso-lateral complex protein Scribble
(Scrib), correlated with poor patient outcome and tumor recurrence. Scrib overexpression
in HCC tissues associated with genomics gains of the Scribble gene locus on
chromosome 8q24.3. The loss of membranous Scrib expression or its cytoplasmic
enrichment was frequently observed in HCC tissues and HCC cell lines but not in normal
liver tissues. In order to analyze the biological impact of cytoplasmic Scrib accumulation,
polarized HCC cell lines (HepG2) stably expressing wildtype Scrib (ScribWT
, with
membrane binding) and a mutated Scrib isoform (ScribP305L
, with enforced cytoplasmic

SUMMARY
enrichment) were generated. In vitro, cytoplasmic ScribP305L
reduced the formation of
canalicular structures and moderately supported cell proliferation. In vivo, hydrodynamic
gene delivery of ScribP305L
and c-MYC induced elevated liver tumor formation compared
to ScribWT
and c-MYC co-injection. Importantly, ScribP305L
stimulated HCC cell
invasiveness, reorganization of actin filaments and overexpression of Rho GTPases. A
comparative analysis of oncogenic pathways revealed an activation of AKT by ScribP305L
,
which was mediated through the destabilization of negative AKT regulators leucine rich
repeat protein phosphatase 1 (PHLPP1) and phosphatase and tensin homolog (PTEN).
Transcriptome analysis detected ScribP305L
-dependent upregulation of genes, which were
associated with cell motility, epithelial-mesenchymal transition (EMT) and extracellular
matrix (ECM) remodeling. Among these genes, secreted protein acidic and cysteine rich
(SPARC) was highly induced by cytoplasmic Scrib and facilitates cell invasion
depending on the AP-1 transcription factor subunits ATF2 and JunB. Lastly a significant
association between cytoplasmic Scrib, AKT and ATF2 activation/phosphorylation and
loss of E-cadherin was confirmed in human HCC samples and ScribP305L
-induced gene
signatures were detected in patient subgroups with worse overall survival.
Taken together, this study illustrates that the overexpression and cytoplasmic enrichment
of the cell polarity factor Scrib supports HCC development and tumor cell dissemination
through the induction of distinct molecular mechanisms. These mechanisms include
activation of the AKT signaling axis and stimulation of AP1-target genes, which are
critical for the migratory phenotype of HCC cells.

ZUSAMMENFASSUNG
ZUSAMMENFASSUNG
Die drei-dimensionale Ausrichtung bzw. Polarität von Hepatozyten ist von zentraler
Bedeutung für die Funktion der Leber (z.B. Galleproduktion und Detoxifikation).
Membranassoziierte Zellpolaritätskomplexe definieren die apikale, laterale und basale
Region einer Hepatozyte und der Verlust hepatozytärer Polarität ist ein frühes Ereignis in
der Lebertumorentstehung. Gleichzeitig deuten publizierte Ergebnisse darauf hin, dass
der Polaritätsverlust epithelialer Zellen sowohl eine tumorinitiierende als auch eine
progressionsfördernde Wirkung ausüben können. Welche Polaritätsproteine jedoch
maßgeblich an der Lebertumorentstehung beteiligt sind und wie die Dysregulation dieser
Faktoren die Tumorentstehung beeinflusst, ist bisher kaum unterricht.
Zur Identifikation relevanter Polaritätsfaktoren im hepatozellulären Karzinom (HCC)
wurden hoch-dimensionale Expressionsdaten primärer humaner HCCs und des
umgebenden gesunden Lebergewebes miteinander verglichen. Hierbei korrelierte die
Überexpression des basolateralen Proteins Scribble (Scrib) signifikant mit einem
schlechteren Überleben und frühen Tumorrezidiv von HCC-Patienten. Neben der Scrib-
Überexpression, bedingt durch die Amplifikation des Scribble Gens auf Chromosom
8q24.2, ist ebenfalls ein Verlust der membranären Lokalisation sowie eine
zytoplasmatische Anreicherung von Scrib in HCC-Geweben und Tumorzellen zu
beobachten. Um die biologische Wirkung der zytoplasmatischen Scrib-Anreicherung zu
analysieren, wurden in der HCC-Zelllinie HepG2 wildtypisches Scrib (ScribWT
mit
Membranbindung) und mutiertes Scrib (ScribP305L
mit erzwungener zytoplasmatischer
Anreicherung) stabil exprimiert. In vitro reduzierte zytoplasmatisches ScribP305L
die
Bildung des kanalikulären Netzwerks, was auf eine gestörte Zellpolarität hinweist, und

ZUSAMMENFASSUNG
reduziert Zellproliferation. In vivo induzierte die Koexpression von ScribP305L
und des
Onkogens c-MYC mittels hydrodynamischer Injektion eine erhöhte Lebertumorbildung
im Vergleich zu Mäusen mit ScribWT
/c-MYC Koexpression. Vor allem induziert
ScribP305L
die HCC-Zellinvasivität, die Reorganisation von Aktinfilamenten und die
Überexpression von motogen-wirkenden Rho-GTPasen. Vergleichende Analysen auf
zellulären Signalwegen zeigen eine Aktivierung des AKT-Signalweges in ScribP305L
-
exprimierenden Zellen, was sich durch eine erhöhte Destabilisierung der AKT-
Regulatoren Leucin-rich Repeat-Protein-Phosphatase 1 (PHLPP1) und Phosphatase and
Tensin-Homolog (PTEN) erklärt. Mit Hilfe von Transkriptomanalysen konnten
ScribP305L
-abhängige Signaturen identifiziert werden, welche mit Zellmotilität, Epithelial-
mesenchymale Transition (EMT) und dem Remodelling der Extrazellularmatrix (EZM)
assoziiert sind. Unter diesen ScribP305L
-abhängigen Genen befindet sich Secreted Protein
Acidic and Rich in Cysteine (SPARC), welches die Invasivität von HCC Zellen
signifikant erhöht und durch die AP-1 Transkriptionsfaktoruntereinheiten ATF2 und
JunB positiv reguliert wird. In humanen Geweben konnte der Zusammenhang zwischen
zytoplasmatischem Scrib, der Phosphorylierung von AKT und ATF2 als auch dem
Verlust von E-Cadherin als EMT-Marker bestätigt werden. Ferner konnte eine
signifikante Anreicherung von ScribP305L
-abhängigen Signaturgenen in HCC-Patienten
mit schlechter Prognose gezeigt werden.
Zusammenfassend zeigt diese Studie, dass die Überexpression und die zytoplasmatische
Anreicherung des Zellpolaritätsfaktors Scrib die HCC-Entwicklung und die
Tumorprogression durch die Induktion bestimmter molekularer Mechanismen unterstützt.
Diese Mechanismen umfassen die Aktivierung der AKT-Signalkaskade und die
Stimulation von AP1-Zielgenen, welche für den Migrationsphänotyp von HCC-Zellen
von zentraler Bedeutung sind.
CONTENTS
I
CONTENTS
FIGURE INDEX ................................................................................................................................. IX
TABLE INDEX................................................................................................................................... XI
1 INTRODUCTION ......................................................................................................................... 1
1.1 Liver and Hepatocellular carcinoma (HCC) .................................................................. 1
1.1.1 Physiology of the liver ............................................................................................. 1
1.1.2 Epidemiology and Etiology of HCC ....................................................................... 2
1.1.3 Pathogenesis of HCC ............................................................................................... 3
1.1.4 Treatment for HCC .................................................................................................. 4
1.2 Epithelial cell polarity ..................................................................................................... 7
1.2.1 Cell polarity is important for epithelial cell functionality ..................................... 7
1.2.2 Key players of EPP: Polarity complexes ................................................................ 8
1.2.3 Crosstalk between Rho GTPases and polarity complexes .................................... 9
1.2.4 Disturbance of cell polarity in cancer development ............................................ 10
1.2.5 Disturbance of cell polarity affects oncogenic signaling pathways .................... 11
1.3 Hepatocellular polarity and HCC development .......................................................... 14
1.3.1 Liver function depends on hepatocellular polarization ....................................... 14
1.3.2 Disturbance of hepatocellular polarity in early HCC development .................... 15
2 OBJECTIVES .............................................................................................................................. 16
3 MATERIALS ............................................................................................................................... 17
3.1 Consumables.................................................................................................................. 17
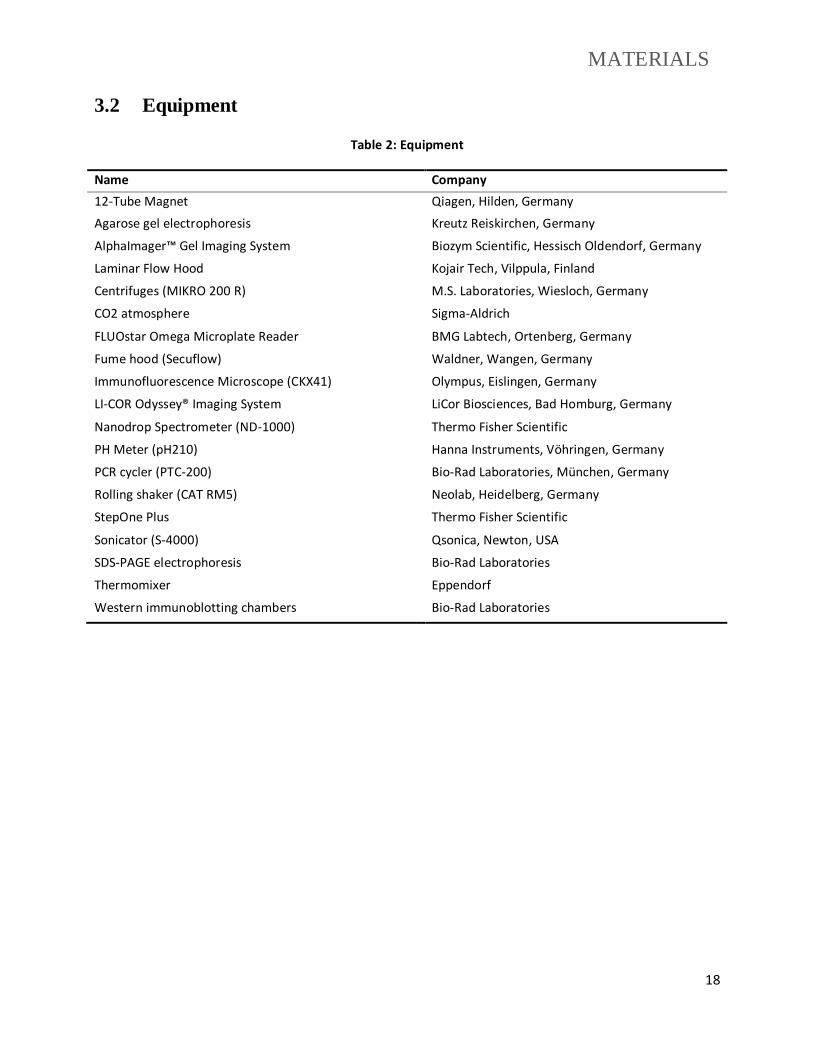
3.2 Equipment ...................................................................................................................... 18
3.3 Reagents ......................................................................................................................... 19
3.3.1 General reagents ..................................................................................................... 19

CONTENTS
II
3.3.2 Solutions and buffers ............................................................................................. 21
3.3.3 Enzymes.................................................................................................................. 22
3.4 Assays and Kits ............................................................................................................. 22
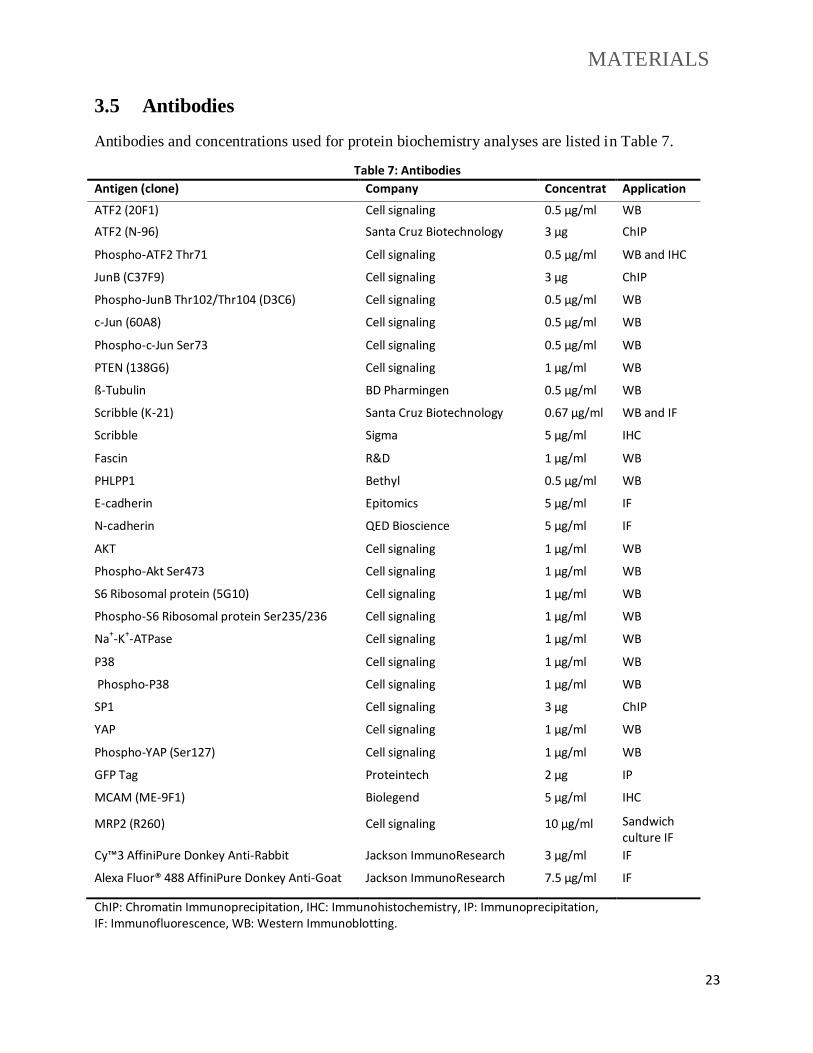
3.5 Antibodies ...................................................................................................................... 23
3.6 Oligonucleotides............................................................................................................ 24
3.6.1 Primers for qPCR ................................................................................................... 24
3.6.2 Primers for molecular cloning ............................................................................... 25
3.6.3 Primers for Chromatin Immunoprecipitation (ChIP) analysis ............................ 25
3.6.4 Small interfering RNA (siRNA) ........................................................................... 26
3.7 Cell lines ........................................................................................................................ 27
3.7.1 Liver cancer cell lines ............................................................................................ 27
3.7.2 Cell lines culture media ......................................................................................... 27
3.8 Bacterial strands ............................................................................................................ 28
3.9 Plasmid maps ................................................................................................................. 29
4 METHODS................................................................................................................................... 30
4.1 Cell culture..................................................................................................................... 30
4.1.1 Cultivation of immortalized liver cancer cell lines .............................................. 30
4.1.2 Cryconservation of liver cancer cell lines ............................................................ 31
4.1.3 Preparation of HCC cell sandwich culture ........................................................... 31
4.1.4 Generation of cell lines stably expressing ScribWT
and ScribP305L
...................... 32
4.1.5 Small-interfering (siRNA)-mediated gene inhibition .......................................... 32
4.1.6 Wortmannin treatment ........................................................................................... 33
4.1.7 Recombinant SPARC treatment............................................................................ 33
4.2 Functional assays........................................................................................................... 34
4.2.1 Cell viability assay ................................................................................................. 34

CONTENTS
III
4.2.2 Cell cytotoxicity and apoptosis assays ................................................................. 34
4.2.3 Cell invasion assay ................................................................................................. 34
4.3 Molecular cloning ......................................................................................................... 35
4.3.1 Scrib cloning for the generation of stable cell lines............................................. 35
4.3.2 Site-directed ScribP305L
mutagenesis ..................................................................... 36
4.3.3 Subcloning of ScribWT
and ScribP305L
for hydrodynamic tail-vein injection ...... 37
4.3.4 Transformation of competent bacteria .................................................................. 39
4.3.5 DNA purification (MidiPrep and EndoFree Maxiprep) ...................................... 39
4.4 Messenger RNA (mRNA) quantification .................................................................... 40
4.4.1 RNA extraction from cultured cells ...................................................................... 40
4.4.2 cDNA synthesis...................................................................................................... 41
4.4.3 Semi-quantitative real-time PCR analysis ............................................................ 41
4.4.4 Gene expression profiling...................................................................................... 42
4.5 Protein biochemistry analyses ...................................................................................... 43
4.5.1 Protein extraction from cultured cells................................................................... 43
4.5.2 SDS-Polyacrylamide gel electrophoresis (PAGE) and western immunoblotting
43
4.5.3 Fractionation of subcellular proteins .................................................................... 44
4.5.4 Enzyme-linked immunosorbent assay (ELISA) .................................................. 44
4.5.5 Protein half-life determination .............................................................................. 45
4.5.6 Immunofluorescence analysis of tissue cryosections .......................................... 45
4.5.7 Immunofluorescence analysis of sandwich cultures ............................................ 46
4.5.8 Immunohistochemistry (IHC) and histological analyses .................................... 46
4.6 Immunoprecipitation analysis ...................................................................................... 47
4.6.1 Co-Immunoprecipitation (CoIP) analysis............................................................. 47
4.6.2 Chromatin-Immunoprecipitation (ChIP) analysis................................................ 48

CONTENTS
IV
4.7 Mouse work ................................................................................................................... 49
4.7.1 Hydrodynamic tail-vein (HDTV) plasmid delivery............................................. 49
4.7.2 Isolation of mouse liver tissue............................................................................... 50
4.8 HCC Patient material .................................................................................................... 51
4.8.1 HCC patient gene expression and survival data................................................... 51
4.8.2 HCC tissue-microarray (TMA) analysis............................................................... 51
4.9 Data acquisition and statistical analysis....................................................................... 52
5 RESULTS ..................................................................................................................................... 53
5.1 Overexpression of Scrib is associated with poor survival in HCCs .......................... 53
5.2 Mislocalization of Scrib in HCC tissues and cell lines ............................................... 57
5.3 Scrib localization affects hepatocellular polarity ........................................................ 60
5.4 Cytoplasmic Scrib induces cell invasion in HCC cell lines ....................................... 63
5.5 Cytoplasmic Scrib induces tumor formation via AKT signaling ............................... 66
5.6 Cytoplasmic Scrib destabilizes the phosphatases PTEN and PHLPP1 ..................... 68
5.7 Identification of target genes induced by cytoplasmic Scrib...................................... 71
5.8 The role of AP1 family in regulating cytoplasmic Scrib-target genes....................... 77
5.9 Cytoplasmic Scrib promotes c-MYC-induced tumor formation ................................ 80
5.10 Cytoplasmic Scrib, AKT and ATF2 are associated with HCC prognosis ................. 83
6. DISCUSSION .............................................................................................................................. 89
6.1 Dysregulation of cell polarity proteins defines HCC patients with poor clinical
outcome ........................................................................................................................................ 89
6.2 The Scrib gene is frequently amplified and Scrib protein is enriched in the
cytoplasm of HCC cells .............................................................................................................. 91
6.3 Cytoplasmic Scrib activates AKT signaling pathway via the destabilization of
PHLPP1/PTEN ............................................................................................................................ 93
6.4 Cytoplasmic Scrib induces a signature associated with invasiveness in HCC.......... 95
6.5 SPARC in liver microenvironment induces HCC invasiveness................................. 96

CONTENTS
V
6.6 Mislocalization of Scrib activates the AP1 family members ATF2 and JunB .......... 97
6.7 Cytoplasmic Scrib co-operates with c-MYC in supporting liver tumor formation in
mice 100
6.8 Potential application of Scrib in HCC prognosis and therapy .................................. 102
7. REFERENCES........................................................................................................................... 104
8. ACKNOWLEDGEMENTS ...................................................................................................... 111
ABBREVIATIONS
VI
COMMON ABBREVIATIONS
ATF2 activating transcription factor 2
AP1 activator protein
AJ adherence junction
APS ammonium persulfate
AMOT Angiomotin
aPKC atypical protein kinase C
BSA bovine serum albumin
CIAP calf intestinal alkaline phosphatase
CEACAM1 carcinoembryonic antigen-related cell adhesion
molecule 1 ChIP chromatin Immunoprecipitation
CoIP Co-Immunoprecipitation
CGH comparative genomic hybridization
CTGF connective tissue growth factor
CRB Crumbs
CHX cycloheximide
CMV cytomegalovirus
DMSO dimethyl sulfoxide
Dlg discs large
EF1α elongation factor-1 alpha
ELISA enzyme-linked immunosorbent assay
EPP epithelial polarity program
EMT epithelial-mesenchymal transition
EDTA ethylenediaminetetraacetic acid
ECM extracellular matrix
FRMD6 FERM domain-containing protein 6
F-actin filamentous actin
GSEA gene set enrichment analysis
G418 Geneticin
GFP green fluorescent protein

ABBREVIATIONS
VII
GAP GTPase activating protein
GEF guanine nucleotide exchange factor
HCV hepatitis C virus
HCC hepatocellular carcinoma
HRP horseradish peroxidase
HPV human papillomavirus
HCl hydrochloric acid
HDTV hydrodynamic tail-vein
IF immunofluorescence
IHC immunohistochemistry
IRES internal ribosome entry site
IR inverted repeats
Kibra kidney and brain expressed protein
Lats1 large tumor suppressor kinase 1
Lgl lethal giant larvae
PHLPP1 leucine rich repeat protein phosphatase 1
LRR leucine-rich repeat
LB Luria-Bertani
Mst1/2 macrophage stimulating 1/2
MMPs matrix metalloproteinases
MCAM melanoma cell adhesion molecule
MRP2 multidrug resistance-associated protein 2
NF2 neurofibromin 2
NES normalized enrichment score
PATJ PALS1-associated tight junction protein
PFA paraformaldehyde
Par6 partitioning defective-6
DAB peroxidase substrate
PMSF phenylmethylsulfonyl fluoride
PTEN phosphatase and tensin homolog
PBS phosphate-buffered saline

ABBREVIATIONS
VIII
PPxY Proline-Proline-x–Tyrosine
PALS1 protein associated with Lin-7 1
PKC protein kinase C
Par3 proteins partitioning defective-3
PDK pyruvate dehydrogenase kinase
S100A10 S100 calcium binding protein A10
Scrib scribbled planar cell polarity protein
SPARC secreted protein acidic and cysteine rich
qPCR semi-quantitative polymerase chain reaction
STAT3 signal transducer and activator of transcription 3
SB sleeping beauty transposon
siRNA small interfering RNA
NaCl sodium chloride
TIAM1 T-Cell lymphoma invasion and metastasis 1
3D the three-dimension
TJ tight junction
TIMP TIMP metallopeptidase inhibitor
TGF-β transforming growth factor beta
Tris Tris-hydroxymethyl-aminomethane
WB western Immunoblotting
WWTR1, synonyms: TAZ WW domain containing transcription regulator 1
YAP yes-associated protein
ZEB zinc finger E-box binding homeobox
FIGURE INDEX
IX
FIGURE INDEX
Figure 1: Liver lobe near the central area.. .................................................................................. 2
Figure 2: HCC development and current treatment options. ...................................................... 6
Figure 3: Polarity complexes and spatial membrane organization of epithelial cells.. ............. 9
Figure 4: Known EPP regulators of Hippo/YAP pathway.. ..................................................... 12
Figure 5: Hepatocellular polarity................................................................................................ 14
Figure 6: Plasmid maps of Scrib vectors.. ................................................................................. 29
Figure 7: Transient transfection of pT3-EF1α-hScribP305L
-GFP plasmid in mouse liver.. ..... 50
Figure 8: Polarity gene expression of five candidate polarity genes correlated with HCC
patient survivals.. ................................................................................................................. 55
Figure 9: Scrib overexpression was associated with chromosome gains.. .............................. 56
Figure 10: Mislocalization of Scrib in HCC tissues. ................................................................. 57
Figure 11: Different expression and localization of Scrib in HCC cell lines. ......................... 59
Figure 12: HepG2 stable cell lines with membranous and cytoplasmic Scrib.. ...................... 61
Figure 13: Disturbance of cell polarity by overexpression of cytoplasmic ScribP305L
. ........... 62
Figure 14: Functional analyses of HepG2 cells with membranous and cytoplasmic Scrib.. .. 64
Figure 15: Effects of ScribP305L
on actin filament and Rho GTPases.. .................................... 65
Figure 16: Cytoplasmic Scrib activates the AKT/mTOR pathway.. ........................................ 67
Figure 17: Cytoplasmic Scrib destabilizes the phosphatases PTEN and PHLPP1.. ............... 70
Figure 18: Genes downregulated in ScribP305L
cells.................................................................. 72
Figure 19: Genes upregulated in ScribP305L
cells. ...................................................................... 73
Figure 20: Cytoplasmic Scrib induces HCC cell invasiveness................................................. 76
Figure 21: Scrib target genes are regulated by transcription factor AP1 subunits.. ................ 78

FIGURE INDEX
X
Figure 22: Interaction of the AP1 family member c-Jun, ATF2 and JunB with the SPARC
promoter. .............................................................................................................................. 80
Figure 23: Cytoplasmic Scrib induces tumor formation after hydrodynamic gene delivery. 82
Figure 24: Cytoplasmic Scrib correlates with AKT and ATF2 activity in human HCC tissues.
............................................................................................................................................... 84
Figure 25: Expression of Scrib target genes correlates with HCC prognosis.......................... 86
Figure 26: Overexpression of Scrib-target genes in HCC tissues. ........................................... 87
Figure 27: Overexpression of Scrib-target genes in tumor-surrounding tissues correlate with
poorer survivals. ................................................................................................................... 88
Figure 28: Cytoplasmic Scrib activates AKT signaling via the destabilization of PHLPP1 and
PTEN. ................................................................................................................................... 94
Figure 29: Summarizing scheme of how cytoplasmic Scrib induces tumor metastasis and
EMT via activation of AKT pathway and AP1 transcriptional factors. ........................... 99

TABLE INDEX
XI
TABLE INDEX
Table 1: Consumables ................................................................................................................. 17
Table 2: Equipment ..................................................................................................................... 18
Table 3: Chemicals, transfection reagents and PCR reagents .................................................. 19
Table 4: Solutions and buffers .................................................................................................... 21
Table 5: Enzymes for cloning ..................................................................................................... 22
Table 6: Assays and Kits ............................................................................................................. 22
Table 7: Antibodies ..................................................................................................................... 23
Table 8: qPCR primers ................................................................................................................ 24
Table 9: Cloning primers ............................................................................................................ 25
Table 10: ChIP primers ............................................................................................................... 25
Table 11: siRNA .......................................................................................................................... 26
Table 12: Liver cancer cell lines................................................................................................. 27
Table 13: Cell culture media and supplements .......................................................................... 27
Table 14: Bacterial strands for cloning ...................................................................................... 28
Table 15: Subculture and cell seeding of liver cancer cell lines .............................................. 30
Table 16: Sandwich culture preparation and cell plating .......................................................... 31
Table 17: Preparation of siRNA transfection solutions ............................................................ 33
Table 18: Amplification reaction of Scrib for pDONR201 ...................................................... 35
Table 19: Amplification program of Scrib for pDONR201 ..................................................... 36
Table 20: Reaction for ScribP305L
mutagenesis .......................................................................... 37
Table 21: Program for ScribP305L
mutagenesis .......................................................................... 37

TABLE INDEX
XII
Table 22: Amplification reaction of Scrib for pT3-EF1α vector .............................................. 38
Table 23: Amplification program of Scrib for pT3-EF1α vector ............................................. 38
Table 24: Reaction of cDNA synthesis ...................................................................................... 41
Table 25: Program of cDNA synthesis ...................................................................................... 41
Table 26: Reaction of real-time PCR ......................................................................................... 42
Table 27: Program of real-time PCR.......................................................................................... 42
Table 28: Analysis of 33 polarity genes in human HCC and liver tissues .............................. 54

INTRODUCTION
1
1 INTRODUCTION
1.1 Liver and Hepatocellular carcinoma (HCC)
1.1.1 Physiology of the liver
The liver has very important functions such as secretion of bile acid and salt, metabolism
(anabolic and catabolic processes) of nutrients, as well as detoxification of toxic compounds [1].
The physiological function of the liver is mediated by different cell types. The parenchymal cells
of the liver and metabolically active cells are hepatocytes (about 60% of all cells); while non-
parenchymal cells in the liver include liver sinusoidal endothelial cells (LSECs), Kupffer cells
and stellate cells. LSECs separate hepatocytes from blood stream and facilitate the so-called
porto-central blood flow [1]. Kupffer cells are localized near the LSECs in the sinusoids and act
as central regulators of immune responses in case of infections. Stellate cells are located in the
Space of Disse between hepatocytes and LSECs and represent the 'store-house' for vitamin A. In
addition, they produce extracellular matrix (ECM) material in case of liver damage [2].
The liver exhibits a specific “plate-like” spatial architecture, with layers of hepatocytes in
between sinusoidal spaces (Figure 4A). The plasma membrane of hepatocyte forms a branching
network of “bile canaliculi”, which is the place for the secretion of bile components [3]. The liver
has a unique blood vessel system, in which 75% of the liver blood supply comes from the
nutrient-rich venous arm, while hepatic arteries contribute with 25% of oxygenated blood [4].
Highly fenestrated LSECs allow a permanent contact of hepatocytes with the blood stream,
which allows a highly efficient transportation between hepatocytes and blood vessels [5].

INTRODUCTION
2
Figure 1: Liver lobe near the central area. Scheme shows the liver specific “plate-like” structure near the
central area of a hepatic lobule. Dark blue arrow illustrates the direction of blood flow from the portal triad to
the central vein. Red dots show the bile canaliculus network between two adjacent hepatocytes. Figure
modified from “The two epithelial cell types in the liver” [6].
1.1.2 Epidemiology and Etiology of HCC
Hepatocellular carcinoma (HCC) is the most common primary malignant tumor of the liver.
Worldwide, HCC is the fifth most common cancer type in men (7.9% of cancers) and seventh
most common in women (6.5% of cancers) [7]. Its incidence is highest in Africa and Eastern Asia
with more than 80% of all new HCC cases. In contrast, Northern Europe and United States have a
lower HCC incidence with less than 5.0 per 100,000 individuals. However recent studies
illustrated decreased HCC incidence in developing countries and an elevated number of cases in
developed and industrialized countries [7]. The reasons for this phenomenon are changes in the
frequency of risk factors in the respective population (e.g. viral infections and virus-independent
liver diseases; see below). Compared to other malignant tumors, HCC is the third leading cause
of cancer-related death and the 1-year overall survival rate is below 50% [8].
Hepatitis B virus (HBV)/hepatitis C virus (HCV) infections are major risk factors for HCC
development [9]. About 5% of all people worldwide (around 75% in Asia) exhibit a chronic HBV
infection. There is evidence showing the mechanistic connection between chronic HBV infection
and cancer development, and HBV is considered to be causative for more than 50% of HCCs [7].
In contrast, 30% of the global HCC cases are due to chronic HCV infection. Compared to HBV,
HCV is leading to a higher percentage of chronic hepatitis (80%) and liver cirrhosis development

INTRODUCTION
3
(20%) [10]. In countries with low HBV/HCV prevalence such as the United States and Germany,
alcohol abuse is one key etiological risk factor that may lead to alcohol-induced liver disease
(ALD) and HCC [11]. In addition, nonalcoholic fatty liver disease (NAFLD) and the
nonalcoholic steatohepatitis (NASH) represent further important risk factors for the development
of HCC. NAFLD and NASH may progress to liver cirrhosis in about 5% and eventually tumor
initiation. Although the relative numbers of HCCs derived from NAFLD is low (about 0.5%), this
etiology is getting more relevant because of the high prevalence of obesity and diabetes in
industrialized countries [12]. In addition, autoimmune disorders, cholestatic disorders, inherited
disorders (e.g. hemochromatosis) and aflatoxin exposure represent further risk factors of
hepatocarcinogenesis.
1.1.3 Pathogenesis of HCC
So far it is not yet fully understood how HCC progresses from damaged hepatocytes to advanced
tumors. However, compared to other solid cancers, HCC has some specific histomorphological
characteristics, which include the step-wise progression from normal hepatocytes to well-
differentiated and premalignant lesions to poorly differentiated and malignantly transformed
HCC cells [13]. Another important feature of hepatocarcinogenesis is the formation of multiple
tumors, which might arise from independent tumor initiating events or satellite nodules due to
intrahepatic metastasis. Especially intrahepatic metastasis is considered to be more aggressive
resulting in poor patient prognosis [14]. In addition, HCC shows aberrant vascularization, which
further supports the aggressiveness of tumors [15].
With regard to molecular pathogenesis, the accumulation of genomic alterations plays an
important role in the development and progression of HCC. Classification approaches based on
transcriptome analysis and sequencing data revealed a clear association between distinct genomic
alteration patterns with biological and clinical features of HCCs [16]. For example, a subgroup of
HCCs that was characterized by high tumor invasiveness, showed higher HBV copy numbers,
mutations of the tumor-suppressor gene TP53 mutation, phosphoinositide-3-kinase (PI3K)/AKT
activation, and rare PI3K catalytic alpha (PIK3CA) mutations. Another subgroup with
intrahepatic metastasis associated with reduced expression of E-cadherin and activation of the

INTRODUCTION
4
wingless (Wnt) signaling pathway [16]. In addition, chromosome instability and dysregulation of
DNA methylation have also been described to be involved in the pathogenesis of HCC [17, 18].
The tumor microenvironment is another important parameter affecting HCC progression. During
liver fibrosis and cirrhosis under continuous inflammation, fibrotic stromal cells (so-called
myofibroblasts) increase the production of secreted factors such as urokinase and matrix
metalloproteinases (MMPs), which directly affect ECM composition. On the other hand,
malignantly-transformed tumor cells gain properties of mesenchymal cells, with an abnormal
production of these secreted factors, which leads to a degradation of basal lamina and increased
invasion/metastasis of tumor cells [19]. In addition, cytokines and chemokines secreted by non-
parenchymal cells, such as tumor necrosis factor (TNF), interleukin-6 (IL-6), transforming
growth factor (TGF), accelerate the process of liver fibrosis and are critical for the induction of
HCC invasiveness [2].
1.1.4 Treatment for HCC
So far, surgical resection followed by liver transplantation, which improves the five-year survival
from 15.2% to 77.2%, represents the only curative treatment for HCC patients. However, the
treatment is limited to patients with early tumor stages (according to the TNM staging system)
and good residual liver function (Child-Pugh score). Surgical resection and liver transplantation
do not improve prognosis of late-stage patients with multiple nodules (>3), metastasis or severe
liver dysfunction due to cirrhosis [20]. For patients with intermediate or advanced tumor stages,
only palliative treatment can be offered. HCC must be considered as a chemoresistant tumor
since neither doxorubicin alone nor combinations of doxorubicin, cisplatin, interferon and 5-
fluorouracil or any other clinically established cytotoxic substances significantly improve
patient's survival [21].
Some other therapeutic approaches have been developed for HCC patients with un-respectable
lesions. For example, transarterial chemoembolization (TACE) treatment was established due to
the aberrant vascularization of HCC [10]. TACE combines inhibition of tumor blood supply with
regional delivery of chemotherapy, which shows promising effects on tumor regression and is
used for intermediate-stage patients and down-staging treatment for surgical resection [22]. In
addition, the small tyrosine protein kinase inhibitor Sorafenib targets multiple receptors
regulating pathway in tumor cells and endothelial cells including vascular endothelial growth

INTRODUCTION
5
factor receptor (VEGFR) and platelet-derived growth factor receptor (PDGFR). By this,
Sorafenib not only affects tumor cell biology but also inhibits angiogenesis in a multi-modal
manner. Although, first results illustrated that Sorafenib increase the overall survival of HCC
patients about 3 months [23], a recent randomized phase III study of HCC patients (n=1,114)
after surgical resection or ablation demonstrated that Sorafenib treatment did not significantly
improve patient overall and recurrence-free survivals [24]. Thus, the beneficial effects of
Sorafenib for HCC patients are controversially discussed.
Basic research and clinical trials are still ongoing to identify novel and druggable therapeutic
targets, which may improve HCC patient's situation. For example, the PI3K/AKT pathway and
mechanistic target of rapamycin (mTOR) are activated in HCC patients and mTOR inhibitors are
currently used in clinical trials for HCC patients after surgical resection or TACE treatment [25].
This pathway is of special relevance since it has been shown that a number of oncogenic
pathways and cellular mechanisms may activate the PI3K/AKT signaling axis [26]. Therefore, a
deeper understanding of the underlying molecular mechanisms may help to identify HCC patients
that may benefit from specific PI3K/AKT-directed inhibition approaches.

INTRODUCTION
6
Figure 2: HCC development and current treatment options. The scheme illustrates the process of liver
cancer development and progression. Risk factors that promote the progression from chronic liver diseases to
HCC are summarized. Most relevant risk factors and pathogenenic mechanisms are listed. Therapeutic
approaches for early/progressed HCC are mentioned next to the green arrow. Figure modified according to
“Natural history of chronic liver disease” [2].

INTRODUCTION
7
1.2 Epithelial cell polarity
1.2.1 Cell polarity is important for epithelial cell functionality
A high degree of cell polarity is a basic feature of many epithelial cells. The most important
characteristic of epithelial cell polarity is the partitioning of plasma membrane into apical, lateral
and basal domains. The apical domain refers to the membrane surface facing to cavities of
organs. The lateral domain keeps close connection and cell-cell contact between adjacent cells,
while the basal domain has direct contact with ECM or the basal lamina [27]. Cell polarity and
membrane segregation are essential for epithelial cells to carry out their biological functions such
as directional transport (absorption and secretion) of nutrients and salt between the extracellular
environment and tissues. Intracellularly, it facilitates the molecular trafficking between
organelles, e.g. from endoplasmic reticulum (ER) to the Golgi complex. In addition, cell polarity
plays an essential role in keeping cell morphology, which is essential in different biological
events, such as differentiation, migration and epithelial to mesenchymal transition (EMT) [28].
The establishment of cell polarity has been studied in a variety of cell types under different
physiological and pathological conditions. Spatial orientation was first described during
embryogenesis and tissue development, which is characterized in the following steps: a) initial
appearance of cell-cell contact, b) assembly of cell junctions and c) establishment of epithelial
cell morphology [29]. In these steps, cell junction-associated molecules are of special importance
for the formation of cell polarity. For example, tight junctions (TJs), which mediate strong cell-
cell contact between adjacent cells, are important in the initiation and maintenance of epithelial
cell polarity and define the boundary between apical and lateral domains. TJs include
transmembrane proteins (e.g. occludin and claudin), junctional adhesion molecules (JAM, e.g.
JAM-A, JAM-B) and peripheral membrane proteins (e.g. zonula occludens-1) attached to
cytoskeleton [30]. In addition to TJs, adherens junctions (AJs) have also been found to be
indispensable in the maintenance of cell polarity. The transmembrane protein E-cadherin is the
core component of AJs, which allows a tight physical interaction of neighboring cells via the
formation of homodimer and binding of extracellular domains. In addition, E-cadherin forms a
complex with intracellular catenin proteins, which on one hand mediate the interaction with the
actin cytoskeleton and on the other hand affect signal transduction [31].

INTRODUCTION
8
Establishment and maintenance of cell polarity and junctional structures are a fundamental
characteristic of epithelial cells to carry out their respective functions under various biological
conditions. However, in addition to the core proteins directly involved in the assembly of TJ and
AJ, other proteins and lipids, which are associated with cell-cell junctions, also participate in the
process of epithelial polarization. A considerable number of factors has emerged to a complex
network, which include epithelial polarity program (EPP) polarity protein complexes, Rho
GTPases and polarity lipids [28].
1.2.2 Key players of EPP: Polarity complexes
Polarity complexes refer to groups of proteins that are found in close proximity to certain polarity
domains. These protein complexes are associated with the core proteins of cell junctions, and
play a central role in EPP. So far, three polarity complexes have been described: the Crumbs
complex, the Par complex and the Scrib complex. The Crumbs complex consists of
transmembrane Crumbs (CRB), protein associated with Lin-7 1 (PALS1) and PALS1-associated
tight junction protein (PATJ). The Crumbs complex is located at apical cellular domains, which
directly affect the assembly of TJ structures [32]. The Par complex comprises the proteins
partitioning defective-3 (Par3, synonym: Baz), partitioning defective-6 (Par6) and atypical
protein kinase C (aPKC). It is located near subapical cell domains where it interacts with core
proteins of both TJ and AJ [33]. The Scrib complex is composed of scribbled planar cell polarity
protein (Scrib), discs large (Dlg) and lethal giant larvae (Lgl, LLGL1 in human). This complex
defines the basolateral domain of epithelial cells and is critically involved in the formation of AJ,
probably in an E-cadherin-dependent manner [33] (Figure 3).
Although different polarity complexes are defined by their specific localization at the plasma
membrane, they are not mechanistically separated from each other. Instead, polarity proteins
from different complexes frequently communicate with each other in terms of an active protein
exchange. These interactions result in either the recruitment of different proteins in the same
complex or the competitive integration of individual proteins in different complexes. This
mechanism of communication between polarity complexes is defined as “mutual exclusion” [33].
For example, the Par complex constituent aPKC is integrated in the apical Crumbs complex at
early stages of Drosophila embryogenesis. In later developmental stages, it is recruited by Par3 to

INTRODUCTION
9
the Par complex near the subapical domain [34]. In contrast, Par6, an adaptor protein for aPKC,
binds and mediates the inactivation of Lgl, which is a major component of Scrib complex, via the
phosphorylation by aPKC. Inactivated/Phosphorylated Lgl is then excluded from the subapical
domain [35]; see Figure 3. Thus, through interactive communication with each other, cell polarity
complexes represent highly dynamic modules that can adjust the cellular shape and functionality
according to extracellular and endogenous requirements.
Figure 3: Polarity complexes and spatial
membrane organization of epithelial cells.
The scheme shows the three main polarity
complexes in an epithelial cell. The specific
membranous domains are indicated by
different colors. The apical domain, lateral
domain and basal domain of this epithelial
cell are shown in dark red, yellow and
green, respectively. TJ and AJ are located at
the lateral domain. Integrin connects the
basal domain with the underlying
extracellular matrix. The arrows indicate the
phosphorylation of CRB (Crumbs complex)
and Lgl (Scrib complex) by aPKC (Par
complex), illustrating the dynamic
interaction of proteins with polarity
complexes.
1.2.3 Crosstalk between Rho GTPases and polarity complexes
In addition to the polarity complexes, Rho GTPases are also central regulators of the EPP system.
Rho GTPases belong to small G proteins of the Ras family, which bind to GTP or GDP and
catalyze the hydrolysis of GTP [36]. During the formation and maintenance of cell polarity, Rho
GTPases modulate epithelial morphology through the re-organization of the cellular cytoskeleton.
The Rho GTPases family consists of about 20 different GTPases, including RhoA, Rac1 and
CDC42. Importantly, different GTPases carry out their functions at specific subcellular regions
[37]. For example, RhoA interacts with actin-myosin filaments in the cytoplasm, which affects

INTRODUCTION
10
membrane retraction during different biological process, e.g. cytokinesis [38]. CDC42 and Rac1
are both found at the leading edge of migrating cells, where they regulate actin filament
polarization and induce lamellipodia formation [39]. The specific subcellular localization of Rho
GTPases suggests that they may have functional relevance in the regulation of polarity
complexes.
Indeed, Rho GTPases and cell polarity proteins are frequently interacting under different
physiological and pathological conditions. For example, in the process of EMT, CDC42 binds to
Par6 and facilitates the activity of aPKC-Par6 complex [39]. In addition, the aPKC-Par6 complex
activates Rac1 via the RAC-specific guanine nucleotide exchange factor (GEF) T-cell lymphoma
invasion and metastasis 1 (TIAM1) [40]. In addition, aPKC also activates p190A Rho GTPase
activating protein (GAP), which switches off the activity of RhoA [39]. With the help of the Par
complex, CDC42 induces the activity of Rac1 at lamellipodia, and inhibits the activity of RhoA
in the cytosol. As a result, the Par complex promotes cell motility in the process of EMT via the
modulation of different Rho GTPases [39]. Thus, cell polarity complexes communicate with Rho
GTPases in the fine adjustment of cell cytoskeleton dynamics, which is essential in the
modulation of cell morphology and motility.
1.2.4 Disturbance of cell polarity in cancer development
Loss of cell polarity is frequently found at early stages of epithelial tumor formation. For
example, disruption of epithelial sheets, aberrant multilayering and loss of physiological lumen
are typical features in early tumor development. However, disturbance of cell polarity is more
than a consequence of tumor development [27]. This conclusion is supported by the fact that
polarity proteins in different tumor types are frequently altered by genomic amplifications,
deletions and mutations. For example, Dlg, Lgl and PATJ are downregulated, while Par6 is
amplified and overexpressed in different cancer types [33]. Nevertheless, for some polarity
proteins (e.g. Scrib, aPKC and Par3) both overexpression and downregulation have been
described in several tumors suggesting that different mechanisms might be involved in the
development of cancers [33, 41, 42].
Cell division/proliferation can be affected by disturbed cell polarity. During asymmetric cell
division, some important proteins and RNAs are segregated into daughter cells, which determine

INTRODUCTION
11
the fate of daughter cells in differentiation [43]. This process of asymmetric localization is
dynamically modulated by the polarity proteins, e.g. aPKC and Par-proteins via phosphorylation
and mutual exclusion. Mutation and dysfunction of these polarity proteins lead to dysfunctional
asymmetric cell division. As a result, cells continue with symmetric divisions without cell cycle
termination, which may give rise to tumors [43]. In addition to the disturbed asymmetric division,
pathways that directly regulate mitosis such as the Hippo pathway can be activated or inactivated
by disturbed cell polarity in cancer development [33].
Cell invasion/metastasis is also affected by disturbed cell polarity during tumor progression. Loss
and reestablishment of cell polarity is necessary for tumor cells to leave the original localization
and to achieve metastatic properties. In this context, EMT, which is highly relevant during
embryogenesis, is of special importance for initial steps in tumor cell dissemination
dissemination [44]. The process of EMT is directly connected with cell polarity, since the loss of
the AJ molecule E-cadherin, as well as overexpression of N-cadherin and vimentin is regarded as
important characteristics of EMT [19]. In addition to E-cadherin, Rho GTPases also play a
central role in EMT via the interaction with cell polarity proteins. As described earlier, important
positive regulator of EMT (CDC42 and RAC) are activated by polarity protein Par6 and aPKC
(see chapter 1.2.3). Indeed, Par6 overexpression has been found to induce tumor metastasis in
breast cancer via the activation of EMT-associated signaling pathway [33, 45].
Therefore, genetic alterations as well as abnormal localization of polarity proteins are associated
with tumor progression via cell dedifferentiation, cell proliferation, EMT and early metastasis
[33].
1.2.5 Disturbance of cell polarity affects oncogenic signaling pathways
Recent studies have focused on the molecular mechanisms how dysregulation of the EPP system
affects tumorigenesis. Cell polarity proteins integrate extracellular information into intracellular
pathway responses and a dysregulation of cell polarity proteins is supposed to affect these tumor-
relevant downstream signaling pathways. Indeed, several oncogenic pathways have been
identified to be modulated by EPP components. Here, mutations of single polarity proteins or
disruptions of polarity complexes accounts for the activation of intracellular oncogenic pathways

INTRODUCTION
12
[33]. Among these, the Hippo/yes-associated protein (YAP) and Wnt pathways are two
examples, which affect tumor development and progression in different tissues.
The Hippo/YAP pathway is essential for organ size control and HCC development [46]. First
evidences already illustrated that the apical membrane protein FERM domain-containing protein
6 (FRMD6) regulates the Hippo/YAP pathway. Specifically, FRMD6 forms a complex with two
other apical membrane proteins, kidney and brain expressed protein (Kibra) and neurofibromin 2
(NF2, synonyms: Merlin). The FRMD6/NF2/Kibra complex induces the phosphorylation of
Hippo pathway component large tumor suppressor kinase 1 (Lats1), which results in the
dephosphorylation and degradation of the transcriptional co-activator YAP in the cytoplasm.
Thus, the apical complex FRMD6/NF2/Kibra acts as a tumor suppressor via the negative
regulation of oncogenic YAP activity [47, 48]. In addition, other EPP components have also been
identified as upstream modulators of the Hippo/YAP pathway. For example, Angiomotin
(AMOT), which is usually localized in close proximity to apical Crumbs complex and which
contains Proline-Proline-x–Tyrosine (PPxY) motifs, binds directly to the WW domain of YAP
and its homolog WW domain containing transcription regulator 1 (WWTR1, synonyms: TAZ).
The interaction between AMOT and YAP/TAZ fosters the localization of YAP/TAZ to TJs,
which is associated with their inactivation [49]. Besides this, independent studies have shown the
regulatory effect on YAP/TAZ by the basolateral Scrib complex, and the apical Crumbs
complexes [50, 51].
Figure 4: Known EPP regulators of Hippo/YAP pathway. Scheme shows the apical polarity
complex NF2/FERM6/Kibra that mediates the
phosphorylation of macrophage stimulating 1/2
(Mst1/2), which is a major component of Hippo
pathway. Phosphorylation of Mst1/2 turns on the
Hippo kinase cassette, including phosphorylation of
Lats1/2 and YAP. Except for the NF2/FERM6/Kibra
complex, AMOT directly binds to YAP, leading to
the cytoplasmic retention of YAP near TJs. The
interaction between AMOT and YAP may also
induce phosphorylation of YAP by the Hippo
pathway components. Phosphorylated YAP is
degraded by ubiquitination or kept in the cytoplasm
by 14-3-3 protein binding. In this case, YAP cannot
bind to its transcriptional co-activator TEAD,
leading to the repression of YAP-target genes.

INTRODUCTION
13
Wnt pathway is another example for an EPP-relevant signaling pathway, which plays an essential
role in defining cell fate determination (canonical pathway) and regulation of cell movement
(non-canonical pathway) [52]. The canonical Wnt pathway depends on the AJ-associated protein
β-catenin, which activity is inhibited after binding to a protein complex consisting of
adenomatosis polyposis coli (APC), glycogen synthase kinase 3 (GSK3) and Axin [53]. Followed
by Wnt ligand binding to the receptors Frizzled (Fz) and low density lipoprotein receptor-related
protein 5/6 (LRP5/6), the APC/GSK3/Axin complex is recruited to the plasma membrane by
LRP5/6, which induces the translocation of β-catenin into the nucleus [53]. Nuclear β-catenin
activates transcriptional factors T cell-specific transcription factor (TCF) and target genes
involved in cell fate determination and oncogenesis [53]. Interestingly, Wnt signaling also
activates a non-canonical pathway independent on β-catenin, which regulates cell morphology
and movement via Rho GTPases [52]. Wnt stimulation activates a protein complex consisting of
Dishevelled (Dsh) and Dishevelled associated activator of morphogenesis 1 (Daam1), which
further increase the activity of RhoA in the rearrangement of actin filaments [54].
It is worth mentioning that except of the Hippo/YAP and Wnt pathways, other signaling
pathways (e.g. TGF-β) are also regulated by different cell polarity components [44]. Thus, EPP
components play an important role in the transduction of extracellular signal, and regulation of
intracellular signaling pathways related to cell division, differentiation and migration; while
disruption of polarity complexes may lead to dysregulation of these pathways, which promotes
cancer development via cell proliferation, dedifferentiation and metastasis.

INTRODUCTION
14
1.3 Hepatocellular polarity and HCC development
1.3.1 Liver function depends on hepatocellular polarization
The important functions are carried out by the major liver cell type, the hepatocyte [1]. The
physiological function of the hepatocyte strictly depends on the establishment and maintenance
of hepatocellular polarity, including the formation of the well-defined apical, lateral and basal
domains comparable to other epithelial cell types such as small intestinal cells [6]. However,
hepatocytes establish a specific polarity domain composition, which is important for carrying out
their functions [6]. For example, adjacent hepatocytes orient their apical domains towards each
other to form small lumens, which further branch in 3-dimensional canalicular structures for bile
secretion (Figure 5) [3]. Similar to the apical site, hepatocytes form extensions and protrusions at
the basal domain in close proximity to the Space of Disse and LSECs, which is a requirement for
a highly efficient transportation between hepatocytes and blood vessels [5]. In this way,
maintenance of hepatocellular polarity supports the liver function under physiological conditions,
whereas the disturbance of cell polarity can lead to dysfunction of liver and disease.
Figure 5: Hepatocellular polarity. Scheme shows cell-cell junctions, which facilitate the cell-cell contact
between two adjacent hepatocytes. The red membrane indicates the apical lumen. Iron pumps and transporters,
e.g. MRP2 are expressed at this domain of hepatocyte, which are important for bile secretion. The yellow
membrane indicates the lateral domain of hepatocytes, where AJs and TJs are located. The green colored
membrane represents the basal domain in direct contact with the Space of Disse. BC: bile canaliculus.

INTRODUCTION
15
1.3.2 Disturbance of hepatocellular polarity in early HCC development
Disturbance of cell polarity is considered to be an early event in epithelial tumor development
[27]. In the liver, during liver fibrosis and cirrhosis, excessive matrix deposition reduces the cell
contact with sinusoidal blood or neighboring hepatocytes, which eventually leads to regenerative
nodules [6]. In HCC, the loss of hepatocellular polarity is detected in the early stage of
hepatocarcinogenesis such as dysplastic nodules. The “plate-like” structures with clear porto-
central architecture are replaced by pseudoglandular structures in neoplastic livers [55].
Furthermore, discontinued canaliculi formation with the mislocalization of canalicular proteins
(Na+-K
+ ATPase and alkaline phosphatase) are detectable in preneoplastic lesions [56].
Interestingly, the morphology of neoplastic hepatocytes have a high similarity with polypotent
embryonic or hepatocytes after damage, which is also mirrored by the regression of cellular
polarization during liver regeneration [6]. These observations suggest that the disturbance of
hepatocellular polarity happens at early steps in tumorigenesis, which may play a specific role in
the pathogenesis of liver cancer.
The development HCC is associated with the dysregulation of cell polarity factors and relevant
proteins such as liver kinase B1 (LKB1) and inositol polyphosphate phosphatase-like 1
(INPPL1), for which a direct impact on hepatocarcinogenesis have been discussed [57]. The
kinases LKB1 and its effector 5'-AMP-activated protein kinase (AMPK) play an important role in
the maintenance of cell polarity via direct regulation on polarity protein Par1, and modulation on
other polarity components (Scrib and Crumbs complexes) [58]. Mutations of LKB1 and AMPK
disturb hepatocellular polarity and induce tumor formation in the liver in mouse model [57]. In
addition to LKB1, the AJ protein E-cadherin also shows important function in HCC development.
Loss of membranous E-cadherin is associated with an EMT phenotype and intrahepatic
metastasis in HCC patients [16].
In summary, loss of hepatocellular polarity is an early event in liver tumor development. Several
polarity proteins and polarity-associated pathway have been connected with hepatocarcinogenesis
[57]. However, if a general loss of cell polarity or a disturbance of a certain polarity complex is
important for liver tumorigenesis remains unknown.

OBJECTIVES
16
2 OBJECTIVES
Maintenance of cell polarity is considered to facilitate tumor-suppressor functions in epithelial
cells. Disturbance of the spatial epithelial cell organization leads to a loss of function and has
been discussed to be involved in the initiation and progression of cancers. For the liver, a high
degree of hepatocellular polarization is important to fulfill its biological functions, including
deteoxification and bile production. So far, it is not fully understood if and how the spatial
disturbance of hepatocellular polarization can promote liver carcinogenesis. It is also unknown
which specific molecular mechanisms are induced by the dysregulation of cell polarity
constituents. For these reasons, the objectives of this study are:
1. Identification of cell polarity-associated genes that are significantly dysregulated in human
HCC samples in comparison to non-malignant liver tissues.
2. Defining the expression/localization of selected cell polarity proteins in HCC cells and tissues.
3. Establishment of an in vitro model for the functional und molecular characterization of the
identified polarity proteins.
4. Confirming the vivo relevance of the identified polarity gene in liver tumor formation using a
hydrodynamic gene delivery approach.
5. Identification of effector mechanisms induced by the dysregulation of the selected polarity
proteins.
6. Corroboration of findings in an independent HCC sample cohort.

MATERIALS
17
3 MATERIALS
3.1 Consumables
Consumables and plastic ware used in this study are listed in Table 1.
Table 1: Consumables
Substance Company
Cell culture plates TPP, Trasadingen, Switzerland
Coverslips and slides Engelbrecht, Edermünde, Germany
Parafilm Pechiney, Düsseldorf, Germany
Matrigel Matrix-coated Transwells Corning, Wiesbaden, Germany
PCR 96 well plate Applied Biosystems, Thermo Fisher Scientific, Langenselbold, Germany
PCR reaction tubes Life science, Brand, Wertheim, Germany
Nitrocellulose membrane 0.4 µm GE Healthcare, Freiburg, Germany
Cell scrapper Corning
Whatman paper GE Healthcare
Sterile vacuum-filter 0.22µm Corning
Mr. Frosty™ Freezing Container Thermo Fisher Scientific
Eppendorf tubes Eppendorf, Hamburg, Germany
Precellys tubes Bertin Technologies, Montigny-le-Bretonneux, France
Cryovials Sigma-Aldrich, Taufkirchen, Germany
MATERIALS
18
3.2 Equipment
Table 2: Equipment
Name Company
12-Tube Magnet Qiagen, Hilden, Germany
Agarose gel electrophoresis Kreutz Reiskirchen, Germany
AlphaImager™ Gel Imaging System Biozym Scientific, Hessisch Oldendorf, Germany
Laminar Flow Hood Kojair Tech, Vilppula, Finland
Centrifuges (MIKRO 200 R) M.S. Laboratories, Wiesloch, Germany
CO2 atmosphere Sigma-Aldrich
FLUOstar Omega Microplate Reader BMG Labtech, Ortenberg, Germany
Fume hood (Secuflow) Waldner, Wangen, Germany
Immunofluorescence Microscope (CKX41) Olympus, Eislingen, Germany
LI-COR Odyssey® Imaging System LiCor Biosciences, Bad Homburg, Germany
Nanodrop Spectrometer (ND-1000) Thermo Fisher Scientific
PH Meter (pH210) Hanna Instruments, Vöhringen, Germany
PCR cycler (PTC-200) Bio-Rad Laboratories, München, Germany
Rolling shaker (CAT RM5) Neolab, Heidelberg, Germany
StepOne Plus Thermo Fisher Scientific
Sonicator (S-4000) Qsonica, Newton, USA
SDS-PAGE electrophoresis Bio-Rad Laboratories
Thermomixer Eppendorf
Western immunoblotting chambers Bio-Rad Laboratories

MATERIALS
19
3.3 Reagents
3.3.1 General reagents
General reagents including chemicals, transfection reagents, polymerase chain reaction (PCR)
reagents etc. are listed in Table 3.
Table 3: Chemicals, transfection reagents and PCR reagents
Substance Company
2-Mercaptoethanol Roth, Karlsruhe, Germany
Acetic acid Sigma-Aldrich
Agarose Roth
Ammonium persulfate (APS) Roth
Avidin and biotin Kit Vector Laboratories, Burlingame, USA
ABsolute qPCR SYBR Green ROX Mix Thermo Fisher Scientific
Bovine Serum Albumin (BSA) Sigma-Aldrich
Bradford reagent Sigma-Aldrich
Cycloheximide (CHX) Sigma-Aldrich
10x Cell Lysis Buffer Cell Signaling/New England Biolabs, Frankfurt, Germany
Dimethyl sulfoxide (DMSO) Thermo Fisher Scientific
Dynabeads Protein G Thermo Fisher Scientific
dNTP-Mix Thermo Fisher Scientific
Peroxidase Substrate (DAB) DAKO, Hamburg, Germany
Ethanol Sigma-Aldrich
Ethylenediaminetetraacetic acid (EDTA) Serva, Heidelberg, Germany
Fugene HD transfection reagent Thermo Fisher Scientific
Formaldehyde (37%) Merck, Darmstadt, Germany
Geneticin (G418) Thermo Fisher Scientific
GeneRuler DNALadder Mix Thermo Fisher Scientific
Glycine Sigma-Aldrich
Hydrochloric acid (HCl) Merck
4-(2-hydroxyethyl)-1-piperazineethanesulfonic acid (HEPES) Roth
Horseradish peroxidase (HRP) system DAKO
Igepal CA 6 Sigma-Aldrich
Isopropanol Sigma-Aldrich
Rat-tail tendon collagen I Roche, Mannheim, Germany

MATERIALS
20
Lipofectamine® RNAiMAX Life Technologies, Darmstadt, Germany
Magnesium chloride hexahydrate Roth
Methanol Sigma-Aldrich
Na-deoxycholate Roth
Sodium chloride (NaCl) Roth
Protease inhibitor Serva, Heidelberg, Germany
Phosphotaseinhibitor PhosStop Roche
PageRuler Prestained Protein Ladder Thermo Fisher Scientific
Paraformaldehyde (PFA) Merck
Phosphate-buffered saline (PBS) GE Healthcare
Phenylmethylsulfonyl fluoride (PMSF) Merck
REAL Hematoxylin DAKO
Recombinant human SPARC R&D Systems, Wiesbaden, Germany
Salmon sperm DNA Thermo Fisher Scientific
Tetramethylethylenediamine Roth
Tris-hydroxymethyl-aminomethane (Tris) Roth
Triton x-100 Merck
Tween 20 Sigma-Aldrich
Trypsin/EDTA PAA Laboratories, Cölbe, Germany
Wortmannin Sigma-Aldrich

MATERIALS
21
3.3.2 Solutions and buffers
Table 4: Solutions and buffers
Lysis Buffer (for Co-IP) RIPA Buffer
Tris-HCl pH 7.4
Igepal CA 630 (NP40)
Na-deoxycholate
NaCl
EDTA
PMSF
50 mM
1%
0.25%
150 mM
1 mM
1 mM
NaCl
SDS
Na-deoxycholate Igepal CA 630 (NP40)
EDTA
Tris (pH8.0)
150 mM
0.1%
0.5%
1%
5 mM
50 mM
IP-Wasch Buffer TE Buffer
Tris (pH 8.5)
LiCl
NP40
Na-deoxycholate
100 mM
500 mM
1%
1%
Tris (pH 8.0)
EDTA
70 mM
1 mM
Talianides Buffer 4X SDS-PAGE loading buffer
Tris (pH 8.0)
EDTA
SDS
70 mM
1 mM
1.5%
TrisHCl (pH 6.8)
DTT
SDS
Bromophenol blue
Glycerol
200 mM
400 mM
8%
0.4%
40%
Borate buffer TBS Buffer
Boric acid NaCl Sodium tetraborate Adjust the pH to 8.4
100 mM
75 mM
25 mM
TrisHCl (pH 6.8)
NaCl
Adjust the pH to 7.6
50 mM
150 mM
Caspase Lysis Buffer Caspase Assay Buffer
TrisHCl (pH 7.4)
NaCl
Glycerin
Triton X-100
EDTA
20 mM
137 mM
10%
1%
2 mM
HEPES (pH 7.5)
NaCl
EDTA
Glycerin
50 mM
50 mM
10 mM
5%

MATERIALS
22
3.3.3 Enzymes
Restriction enzymes, DNA polymerase and transcriptase used for cloning and PCR reaction are
shown in Table 5.
Table 5: Enzymes for cloning
Name Company
DpnI restriction enzyme New England Biolabs
EcoRI restriction enzyme Thermo Fisher Scientific
Gateway® BP Clonase® II Enzyme mix Thermo Fisher Scientific
Gateway® LR Clonase® II Enzyme mix Thermo Fisher Scientific
Phusion® High-Fidelity DNA Polymerase New England Biolabs
Q5® High-Fidelity DNA Polymerase New England Biolabs
REDTaq® ReadyMix™ PCR Reaction Mix Sigma-Aldrich
RevertAid H Minus Reverse Transcriptase Thermo Fisher Scientific
T4 Polynucleotide (PNK) Kinase New England Biolabs
T4 DNA Ligase New England Biolabs
Calf intestinal alkaline phosphatase (CIAP) Thermo Fisher Scientific
3.4 Assays and Kits
Table 6: Assays and Kits
Name Company
NucleoSpin® Gel and PCR Clean-up kit Macherey-Nagel, Düren, Germany
Plasmid Miniprep kit Qiagen, Hilden, Germany
Plasmid Midprep kit Promega, Mannheim, Germany
EndoFree Plasmid Maxiprep kit Qiagen
NucleoSpin® RNA extraction kit Macherey-Nagel
NE-PER Nuclear and Cytoplasmic Extraction kit Thermo Fisher Scientific
Mem-PER Plus Membrane Protein Extraction Kit Thermo Fisher Scientific
NucleoSpin® Gel and PCR Clean-up kit Macherey-Nagel, Düren, Germany
SPARC Quantikine ELISA kit R&D Systems, Wiesbaden, Germany
CellTiter-Blue® Assay Promega
CellTox™ Green Cytotoxicity Assay Promega
AP based DCS Detection Line system DCS, Hamburg, Germany
MATERIALS
23
3.5 Antibodies
Antibodies and concentrations used for protein biochemistry analyses are listed in Table 7.
Table 7: Antibodies
Antigen (clone) Company Concentrat
ion
Application
ATF2 (20F1) Cell signaling 0.5 µg/ml WB
ATF2 (N-96) Santa Cruz Biotechnology 3 µg ChIP
Phospho-ATF2 Thr71 Cell signaling 0.5 µg/ml WB and IHC
JunB (C37F9) Cell signaling 3 µg ChIP
Phospho-JunB Thr102/Thr104 (D3C6) Cell signaling 0.5 µg/ml WB
c-Jun (60A8) Cell signaling 0.5 µg/ml WB
Phospho-c-Jun Ser73 Cell signaling 0.5 µg/ml WB
PTEN (138G6) Cell signaling 1 µg/ml WB
ß-Tubulin BD Pharmingen 0.5 µg/ml WB
Scribble (K-21) Santa Cruz Biotechnology 0.67 µg/ml WB and IF
Scribble Sigma 5 µg/ml IHC
Fascin R&D 1 µg/ml WB
PHLPP1 Bethyl 0.5 µg/ml WB
E-cadherin Epitomics 5 µg/ml IF
N-cadherin QED Bioscience 5 µg/ml IF
AKT Cell signaling 1 µg/ml WB
Phospho-Akt Ser473 Cell signaling 1 µg/ml WB
S6 Ribosomal protein (5G10) Cell signaling 1 µg/ml WB
Phospho-S6 Ribosomal protein Ser235/236 Cell signaling 1 µg/ml WB
Na+-K+-ATPase Cell signaling 1 µg/ml WB
P38 Cell signaling 1 µg/ml WB
Phospho-P38 Cell signaling 1 µg/ml WB
SP1 Cell signaling 3 µg ChIP
YAP Cell signaling 1 µg/ml WB
Phospho-YAP (Ser127) Cell signaling 1 µg/ml WB
GFP Tag Proteintech 2 µg IP
MCAM (ME-9F1) Biolegend 5 µg/ml IHC
MRP2 (R260) Cell signaling 10 µg/ml Sandwich culture IF
Cy™3 AffiniPure Donkey Anti-Rabbit Jackson ImmunoResearch 3 µg/ml IF
Alexa Fluor® 488 AffiniPure Donkey Anti-Goat Jackson ImmunoResearch 7.5 µg/ml IF
ChIP: Chromatin Immunoprecipitation, IHC: Immunohistochemistry, IP: Immunoprecipitation, IF: Immunofluorescence, WB: Western Immunoblotting.

MATERIALS
24
3.6 Oligonucleotides
Primers for semi-quantitative polymerase chain reaction (qPCR) analysis were designed to span
intronic regions of the respective genes. Primers were synthesized by Thermo Fisher Scientific
and Apara-bioscience (Denzlingen, Germany).
3.6.1 Primers for qPCR
Table 8: qPCR primers
Gene Accession Number Forward primer (5´-3´) Reverse primer (5´-3´)
SCRIB NM_015356.4 AGGAAGACGCCGAAGAGGACTA AGTGCGTCCTCTGCGAAATG
PTEN NM_000314.6 AGTGGCGGAACTTGCAATC GGTCCTGAATTGGAGGAA
PHLPP1 NM_194449.3 AATGCCCTGCGATCAGTC CTTCATGTTCTCCAACTCAG
SPARC NM_003118.3 GAAACTGTGGCAGAGGTGA GGTTTCCTCTGCACCATCAT
FSCN1 NM_003088.3 CATCAAAGACTCCACAGGCAA GAAGAAGTCCACAGGAGTGT
CEACAM1 NM_001712.4 GACCCAGTCACCTTGAATGT ACGGTAATAGGTGTCTGAAG
S100A10 NM_002966.2 CCTGAGAGTACTCATGGAA GGTCCAGGTCCTTCATTAT
TIMP1 NM_003254.2 CAATTCCGACCTCGTCATCA ACGCTGGTATAAGGTGGTCT
TIMP2 NM_003255.4 TATCTCATTGCAGGAAAGGC GAAGTCACAGAGGGTGATGT
JunB NM_002229.2 CTACCACGACGACTCATACA GCTCGGTTTCAGGAGTTTGT
ATF2 NM_001880.3 GAGGAGCCTTCTGTTGTAGA GTGCAGTTTGTGCCAATGGT
CDH2 NM_001792.4 TGGCAGCTGGACTTGATCGAG GACATCTGTCACTGTGATGACGG
MCAM NM_006500.2 TGTGAGCTCAACTACCGGCT CTCCACTTCCAGCCACACT
B2M NM_004048.2 CACGTCATCCAGCAGAGAAT TGCTGCTTACATGTCTCGAT

MATERIALS
25
3.6.2 Primers for molecular cloning
Table 9: Cloning primers
Application Name Sequence (5‘-3‘)
Amplification of hScrib for Gateway Donor vector
Scrib forward GGGGACAAGTTTGTACAAAAAAGCAGGCTCCACCATGCTCAAGTGCATCCCGCTG
Scrib reverse GGGGACCACTTTGTACAAGAAAGCTGGGTTCTAGGAGGGCACAGGGCCCAG
hScribP305L mutagenesis Scrib (mut-P305L) forward CTGCTGATGGCCCTGCTCCGCTCCCTGGGAAAGC
Scrib (mut-P305L) reverse GCTTTCCCAGGGAGCGGAGCAGGGCCATCAGCAG
Amplification of hScrib for cloning into the pT3-EF1α vector
Scrib pT3 for tacACGCGTATGCTCAAGTGCATCCCGCTGT
Scrib EcoRI pT3 rev attGAATTCCTAGGAGGGCACAGGGCCCAGG
Bold and underlined letters indicate the mutation point.
3.6.3 Primers for Chromatin Immunoprecipitation (ChIP) analysis
Primers for ChIP analysis were designed to span an amplicon between 80-120 bp containing the
transcription factor binding site. Control primers were designed to amplify downstream regions
with no binding sites.
Table 10: ChIP primers
Name Accession number Sequence (5´-3´)
SPARC binding site 1 forward ENSG00000113140 GTGGTACAAGTGGAGTTTGAGTG
SPARC binding site 1 reverse ENSG00000113140 CAGGACTTACCACTGTACAGAC
SPARC binding site 2 forward ENSG00000113140 GCCTGGAGAAGGAATCAACT
SPARC binding site 2 reverse ENSG00000113140 AAAGGTTACCGTGGCAACTC
SPARC control forward ENSG00000113140 GTCTAGCTCATGGCAGCAAATC
SPARC control reverse ENSG00000113140 AATGTGGAGCCCAGAGGCTAT

MATERIALS
26
3.6.4 Small interfering RNA (siRNA)
SiRNAs were purchased from Qiagen or Eurofins Scientific (Ebersberg, Germany). For PTEN, a
27-mer Dicer substrate siRNA method was used for the design of siRNAs [59]. For the other
genes, a traditional 19-21mer siRNA method with dTdT overhangs was applied. Sequences of
sense and antisense strands as well as concentrations for each siRNA are shown in the following
table.
Table 11: siRNA
Gene name Accession number
Sense (5´- 3´) Antisense (5´- 3´) Used concentration
PTEN#1 NM_000314.6 UAGCAGAAACAAAAGGAGAUAUCdAdA
GAUAUCUCCUUUUGUUUCUGCUAAC
20 nM
PTEN#2 NM_000314.6 GAAUCAUCUGGAUUAUAGACCAGdTdG
CUGGUCUAUAAUCCAGAUGAUUCUU
20 nM
PHLPP1#1 NM_194449.3 GAAGAGCUGAAGAGGAUUAdTdT
UAAUCCUCUUCAGCUCUUCdTdT
20 nM
PHLPP1#2 NM_194449.3 AUAACAGCCUCACAGACAAdTdT
UUGUCUGUGAGGCUGUUAUdTdT
20 nM
SCRIB#1 NM_015356.4 GGCAGCGGCTCATCCGCAAdTdT
UUGCGGAUGAGCCGCUGCCdTdT
30 nM
SCRIB#2 NM_015356.4 CAGGAUGAAGUCAUUGGAACAdTdT
UGUUCCAAUGACUUCAUCCUGdTdT
30 nM
JUN NM_002228.3 AAGAACGUGACAGAUGAGCAGdTdT
CUGCUCAUCUGUCACGUUCUUdTdT
30 nM
ATF2 NM_001880.3 CGCGGGUGACCGAAAGGAUCAdTdT
UGAUCCUUUCGGUCACCCGCGdTdT
30 nM
JUNB NM_002229.2 ACAGACUCGAUUCAUAUUGAAdTdT
UUCAAUAUGAAUCGAGUCUGUdTdT
30 nM
SPARC NM_003118.3 ACCCAAGACAUGACAUUCUUAdTdT
UAAGAAUGUCAUGUCUUGGGUdTdT
30 M

MATERIALS
27
3.7 Cell lines
3.7.1 Liver cancer cell lines
Liver cancer cell lines were purchased from the American Type Culture Collection (ATCC,
Manassas, Virginia, USA). Cell lines were routinely confirmed by short tandem repeats profiling.
Liver cancer cell lines and cell culture conditions are listed in Table 12-13. Liver cancer cell lines
were seeded in hepatocyte sandwich culture, which allowed the establishment of apical lumens of
canaliculi, and was used to analyze the extent of hepatic polarization [6]. MRP2 was used to
visualize the canaliculi structure in hepatocyte sandwich culture. Liver cancer cell lines with
different capacities of polarization were compared in Table 12.
Table 12: Liver cancer cell lines
Name Tissue Cell type Disease Cell polarity
HepG2 liver epithelial Hepatoblastoma High
HuH1 liver epithelial HCC High
HuH6 liver epithelial Hepatoblastoma High
HuH7 liver epithelial HCC Low
HLE liver epithelial HCC Low
HLF liver epithelial HCC Low
Hep3B liver epithelial HCC Low
SNU182 Liver Epithelial HCC Low
3.7.2 Cell lines culture media
Table 13: Cell culture media and supplements
Name Media Supplement
HepG2 RPMI-1640 (GE Healthcare) 10% FCS (GE Healthcare)+ 1% Penicillin/Streptomycin (P/S) (GE Healthcare)
HuH1 DMEM (GE Healthcare) 10% FCS+ 1% P/S
HuH6 DMEM 10% FCS+ 1% P/S
HuH7 DMEM 10% FCS+ 1% P/S
HLE DMEM 10% FCS+ 1% P/S
HLF DMEM 10% FCS+ 1% P/S
Hep3B MEM 10% FCS+ 1% P/S
SNU182 RPMI-1640 10% FCS+ 1% P/S

MATERIALS
28
3.8 Bacterial strands
Table 14: Bacterial strands for cloning
Name Application Company Description/Genotype
NEB® 5-alpha Competent E. coli
Gateway vectors New England Biolabs Mutations in recA1 and endonuclease I (endA1)
NEB® Stable
Competent E. coli pT3-EF1α vector New England Biolabs Eliminated activity of endA1

MATERIALS
29
3.9 Plasmid maps
Figure 6: Plasmid maps of Scrib vectors. (A) Plasmid maps for pEGFP-ScribWT
and pEGFP-ScribP305L
.
Inserts are located after a cytomegalovirus (CMV) promoter. This vector produces a fusion protein of ScribWT
or ScribP305L
with an N-terminal EGFP-tag. The attR recombination sites of Gateway system and Scrib
mutation point (P305L) are indicated. (B) Plasmid maps for pT3-EF1α-ScribWT
and pT3-EF1α-ScribP305L
vectors. Inserts are located after a human elongation factor-1 alpha (EF1α) promoter, which allows long-term
expression of genes in mouse hepatocytes. Inverted Repeats (IR) defines, which is recognition sites for the
transponase, are indicated. Internal ribosome entry site (IRES) sequence allows independent expression of
ScribWT
or ScribP305L
and green fluorescent protein (GFP).

METHODS
30
4 METHODS
4.1 Cell culture
4.1.1 Cultivation of immortalized liver cancer cell lines
Human liver cancer cell lines were cultured in DMEM or RPMI supplemented with 10% FCS
and 1% P/S at 37°C in a 5% CO2 atmosphere. Cell lines were authenticated by STR-analysis
(DSMZ, Braunschweig, Germany) and were regularly checked for mycoplasma contamination.
Cell lines and cell culture conditions are described in Chapter 3.7.1-2. All liver cancer cell lines
were split every 3 days. In brief, cells on 10 cm dish were washed with 4 ml PBS, and incubated
with 1 ml Trypsin/EDTA at 37°C for 5 minutes. After detaching, cell suspensions were seeded on
10 cm dishes with pre-warmed cell culture media. For counting cells, 8 μl of cell suspension was
added to the hemocytometer. Cells were counted in the four corners with gridded square under
10x objective using an inverted microscope. The estimated cell number per ml equals to the
average cell number multiplied by 104. Subculture of cell lines and cell numbers used in different
cell culture scales are listed in Table 15.
Table 15: Subculture and cell seeding of liver cancer cell lines
Cell line Subcultivation ratio Cell number (6-well) Cell number (6 cm) Cell number (10 cm)
HepG2 1:4 3.0x10⁵
6.6x10⁵ 1.8x10
6
HuH1 1:6 3.0x10⁵ 6.6x10⁵ 1.8x10⁶
HuH6 1:3 4.0x10⁵ 8.8x10⁵ 2.4x10⁶
HuH7 1:8 1.0x10⁵ 2.2x10
5 6.0x10
5
HLE 1:8 1.0x10⁵ 2.2x10⁵ 6.0x10⁵
HLF 1:10 1.0x10⁵ 2.2x10
5 6.0x10
5
Hep3B 1:3 3.0x10⁵ 6.6x10⁵ 1.8x10⁶
SNU182 1:6 2.0x10⁵ 4.4x10⁵ 1.2x10⁶

METHODS
31
4.1.2 Cryconservation of liver cancer cell lines
Cells were cultured on 10 cm dishes until 70-80% confluence before cryconservation. One
milliliter trypsin was added to each dish at 37°C for 5 minutes. After detaching, cells were
resuspended in 8 ml cell culture media and centrifuged at 1000x rounds per minute (RPM) for 5
minutes. After removing the supernatant, the remaining cell pellet was resuspended in 800 μl cell
culture media supplemented with 20% FCS and transferred to 2 ml cryovials. An equal volume
(800 μl) of cell culture media supplemented with 20% FCS and 20% DMSO (final concentration
10%) was added to each cryovial. Vials were transferred into a freezing container at -80°C
overnight, and stored in liquid nitrogen for long-time use.
4.1.3 Preparation of HCC cell sandwich culture
For the preparation of highly polarized 3D sandwich cultures, a collagen solution was prepared
by dissolving rat-tail collagen I lyphilisate in sterile-filtered 0.2% (v/v) acetic acid overnight.
Before use, the collagen solution was supplemented with concentrated DMEM medium (10x) and
neutralized to pH 7.4 by adding NaOH (2 M) on ice. The collagen solution was completely
dispensed on cell culture plates, which were incubated at 37°C for 1 hour to allow gelation. HCC
cells (HepG2 or HuH6) were seeded on the collagen layer for at least 4 hours. After attaching,
cells were washed once with ice-cold PBS. Additional collagen solution was dispensed on the
upper layer of adherent cells. After 1 hour of gelation, the respective cell culture medium was
added to the sandwich culture. HCC cell lines were cultured in collagen sandwich culture for 10
days before further analyses. Cell culture media were changed every 3 days. Volumes of
neutralized collagen solutions, cell culture media and numbers of cells used in different cell
culture scales are listed in Table 16.
Table 16: Sandwich culture preparation and cell plating
Cell culture scale Neutralized collagen solution (for each layer)
Number of HCC cell Media volume
12 well plate 120 µl 5.6-7.2x10⁴ 1.5 ml
6 well plate 250 µl 1.4-1.8x10⁵ 2 ml
6 cm plate 500 µl 3.0-4.0x10⁵ 6 ml

METHODS
32
4.1.4 Generation of cell lines stably expressing ScribWT
and ScribP305L
For the generation of HCC cell lines stably expressing ScribWT
or ScribP305L
, Fugene HD
transfection reagent was used for the delivery of expression vectors. HepG2 cells were seeded on
10 cm plates with 80% of confluence overnight. Transfection mixture consisting of pEGFP-
ScribWT
or pEGFP-ScribP305L
plasmids (9 µg), Fugene HD transfection reagent (42 µl) and Opti-
MEM was prepared with a total volume of 420 µl. After incubation at room temperature for 15
minutes, the transfection mixture was distributed thoroughly to the HCC cells in 8 ml of
transfection media (with 10% FCS, without antibiotics). G418 (1 mg/ml) selection was carried
out 72 hours after transfection to allow the expansion of cells with stable integration of the
vector. Single colonies started to appear 2 weeks of G418 selection. Colonies were carefully
transferred to 96-well plates. For single colony expansion, a lower concentration of G418 (400
ng/ml) was applied to the cell culture media. Cells were step-wise transferred to 24 -well plate, 6
-well plate, and 6 cm plates. The transgene expression was confirmed by both western
immunoblotting and real-time PCR (see 4.5.2 and 4.4.3). For further functional and gene
expression analysis, the stable clones were cultured with full RPMI media without G418.
Overexpression of exogenous Scrib was routinely checked by western immunoblotting every
month.
4.1.5 Small-interfering (siRNA)-mediated gene inhibition
A reverse transfection protocol using Lipofectamine®
RNAiMAX was used for the transfection
of siRNAs-mediated gene inhibition. Treatment was carried out on 6-well plates. The siRNA
solution (Table 17 solution A) and the Lipofectamine®
RNAiMAX solutions (Table 17 solution
B) were prepared separately. SiRNA concentrations and target sequences of siRNAs are listed in
Table 11. After incubation of solution A and B at room temperature for 10 minutes, solution B
was added to solution A and incubated at room temperature for another 15 minutes. During this
time, 3.5x10⁵
- 4x10⁵ cells were detached by trypsin and resuspended in 2.5 ml transfection media
(with 10% FCS, without antibiotics). SiRNA transfection mixture (500 µl) and cell suspension
(2.5 ml) were mixed well and transferred into a 6-well plate. Total RNA and proteins were
extracted 48 to 72 hours after siRNA treatment. Cells without treatment as well as cells
transfected with nonsense siRNA served as controls.
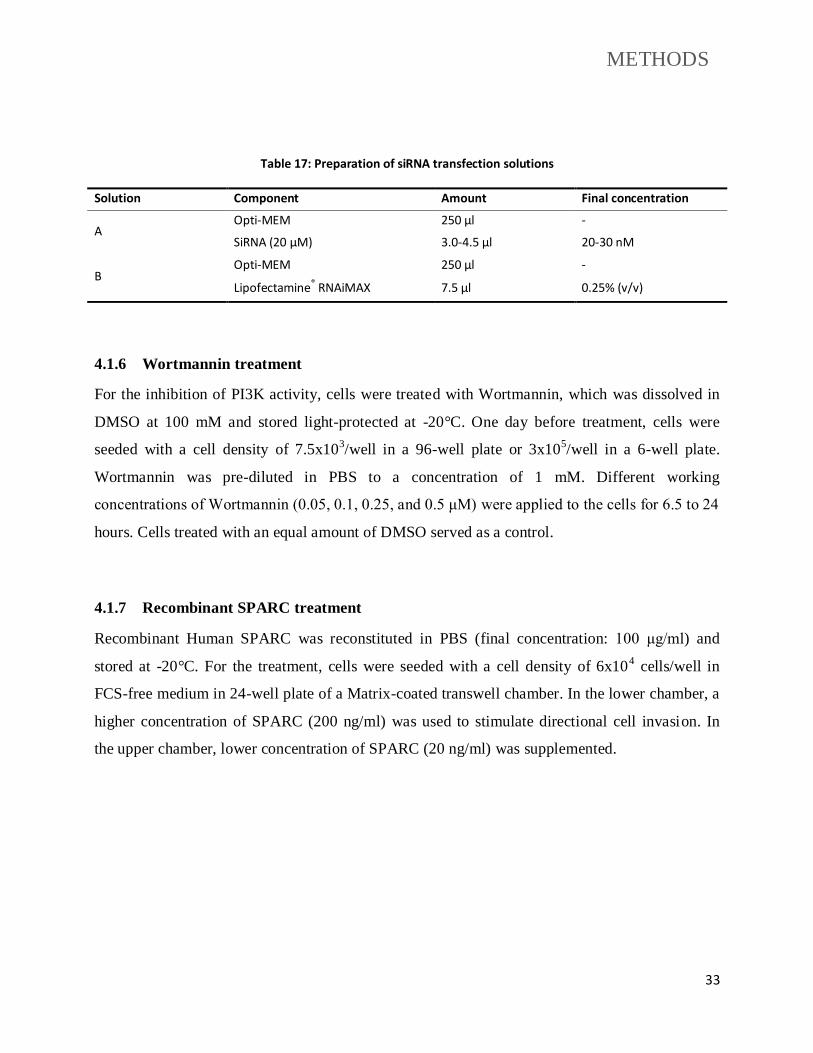
METHODS
33
Table 17: Preparation of siRNA transfection solutions
Solution Component Amount Final concentration
A Opti-MEM 250 µl -
SiRNA (20 µM) 3.0-4.5 µl 20-30 nM
B Opti-MEM 250 µl -
Lipofectamine® RNAiMAX 7.5 µl 0.25% (v/v)
4.1.6 Wortmannin treatment
For the inhibition of PI3K activity, cells were treated with Wortmannin, which was dissolved in
DMSO at 100 mM and stored light-protected at -20°C. One day before treatment, cells were
seeded with a cell density of 7.5x10³/well in a 96-well plate or 3x10
5/well in a 6-well plate.
Wortmannin was pre-diluted in PBS to a concentration of 1 mM. Different working
concentrations of Wortmannin (0.05, 0.1, 0.25, and 0.5 μM) were applied to the cells for 6.5 to 24
hours. Cells treated with an equal amount of DMSO served as a control.
4.1.7 Recombinant SPARC treatment
Recombinant Human SPARC was reconstituted in PBS (final concentration: 100 μg/ml) and
stored at -20°C. For the treatment, cells were seeded with a cell density of 6x10⁴ cells/well in
FCS-free medium in 24-well plate of a Matrix-coated transwell chamber. In the lower chamber, a
higher concentration of SPARC (200 ng/ml) was used to stimulate directional cell invasion. In
the upper chamber, lower concentration of SPARC (20 ng/ml) was supplemented.

METHODS
34
4.2 Functional assays
4.2.1 Cell viability assay
Cell viability was determined using the CellTiter-Blue reagent. Cells were seeded with a cell
density of 7.5x10³/well in a 96-well plate. The CellTiter-Blue reagent was added to cultured cells
according to the manufacturer's instructions. After 1 hour of incubation at 37°C, fluorescence was
detected by a Fluostar Omega microplate reader at an excitation wavelength of 544 nm and an
emission wavelength of 590 nm. Cell viability was detected 48 and 72 hours after respective
treatments.
4.2.2 Cell cytotoxicity and apoptosis assays
CellTox Green reagent was employed for the measurement of cell cytotoxicity. Cells were seeded
with a cell density of 7.5x10³/well in a 96-well plate overnight. Cell cytotoxicity was measured
48 and 72 hours after seeding. For the measurement, cells were incubated with CellTox Green
reagent at room temperature for 15 minutes according to the manufacturer's instructions. The
fluorescence was subsequently measured at an excitation wavelength of 485 nm and an emission
wavelength of 520 nm.
Caspase-3 activity assay was used for the measurement of cell apoptosis. Proteins were extracted
from cultured cells using the Protein Lysis buffer. Caspase-3 substrate Ac-DEVD-AFC (7-
Amino-4-trifluoromethylcoumarin, 100 µM in HEPES-Buffer) was prepared freshly according to
the manufacturer's instructions. Protein lysate (50 µg) was incubated with the Caspase-3 substrate
(50 µl) at 37°C for 4 hours. Caspase activity was detected at an excitation wavelength of 400 nm
and an emission wavelength of 505 nm. Cells treated with cell culture medium served as negative
controls, while cells treated with Doxorubicin (1 µM) were used as positive controls.
4.2.3 Cell invasion assay
Cell invasion experiments were performed using a matrigel invasion chamber with an 8 µm pore
polycarbonate membrane. Cells were seeded on top of the matrigel with a cell density of
6x10⁴/well in starvation medium. On the lower side of the invasion chamber, cell culture medium
was supplemented with 10% FCS for a cell attractant. Cells remaining on the upper matrigel were
removed by cotton tips after 48 to 96 hours, while transmigrating cells were fixed with
paraformaldehyde (PFA, 4%, w/v) for 10 minutes. A crystal violet/methanol (5%, w/v) solution

METHODS
35
was used for cell body staining on the polycarbonate membrane. After incubation with the crystal
violet solution for 1 hour, the polycarbonate membrane was washed 3x with PBS, and 1x with
distilled water. Seven different areas from each membrane were digitally documented and the
numbers of transmigrating cells were visually counted (40-fold magnification).
4.3 Molecular cloning
4.3.1 Scrib cloning for the generation of stable cell lines
Empty Gateway plasmids pDONR201 and pDEST-EGFP were kindly provided by Dr. Stefan
Pusch (DKFZ, Heidelberg, Germany). Human pDEST-EGFP-ScribWT
and pDEST-EGFP-
ScribP305L
vectors for the generation of stable cell lines were constructed using the Gateway®
system. Human Scrib complementary DNA (cDNA) was amplified from a human Scrib plasmid
(pLK45) purchased from Addgene (Cambridge, Massachusetts, USA). For this, a proofreading
Phusion®
High-Fidelity DNA Polymerase was employed for the amplification of Scrib cDNA.
The reaction and program are shown in Table 18-19.
Table 18: Amplification reaction of Scrib for pDONR201
Component Amount Final concentration
DNA template (pLK45-Scrib) 20 ng 0.4 ng/µl
dNTP (10 mM) 1 µl 200 µM
Scrib forward (10 µM) 2.5 µl 0.5 µM
Scrib reverse (10 µM) 2.5 µl 0.5 µM
5x Phusion® GC buffer 10 µl 1 x
DMSO 1.5 µl 3 %
Phusion® High-Fidelity DNA Polymerase 0.5 µl 0.02 units/µl
Nuclease free water add to 50 µl -

METHODS
36
Table 19: Amplification program of Scrib for pDONR201
PCR cycle Step Temperature Time
1 Initial denaturation 98 °C 30 seconds
30x Denaturation 98 °C 30 seconds
Combined annealing and extension 72 °C 3 minutes and 20 seconds
1 Final extension 72 °C 10 minutes
PCR product was separated on a 0.5% agarose gel, and extracted using the PCR Clean-up kit.
The integration of Scrib cDNA in the Gateway®
pDONR 201 vector was performed using the
Gateway®
BP Clonase II Enzyme Mix according to the manufacturers' instructions. In brief, 4 µl
(30 fmol) of PCR product was incubated with pDONR vector (150 ng), Gateway®
BP Clonase®
II Enzyme mix (2 µl), and filled up with TE buffer (pH 8.0) to 10 µl. The BP reaction was done
at room temperature, overnight. In order to transfer the Scrib cDNA with Gateway®
expression
vectors in other vectors, a LR reaction was performed using the Gateway®
LR Clonase II Enzyme
Mix according to the manufacturers' protocol. In brief, 5 µl pDONR-Scrib (75 ng) Gateway®
destination vector pDEST-EGFP (75 ng), Gateway®
LR Clonase®
II Enzyme mix (1 µl) and TE
buffer (pH 8.0) were incubated together. LR reaction was carried out at room temperature for 4
hours. All used constructs were confirmed by sequencing (Seqlab-Sequence Laboratories,
Göttingen, Germany).
4.3.2 Site-directed ScribP305L
mutagenesis
Site-directed mutagenesis was performed to include the P305L mutation in the wildtype form of
Scrib [60]. For the generation of pDONR-ScribP305L
, forward and reverse strands were
synthesized by PCR using complementary primers containing the desired mutation (Table 9). The
reaction and program for new strand synthesis are shown in Tables 20-21. After that, methylated
templates were digested using 1 unit of DpnI enzyme for 3 hours. The newly synthesized DNA
carrying the P305L mutation was transformed into bacteria. The pDONR-ScribP305L
vector was
confirmed by sequencing. Subsequently, both pDONR-ScribWT
and pDONR-ScribP305L
were used
to transfer ScribWT
and ScribP305L
in the pDEST-EGFP expression vector by using Gateway®
LR
Clonase®
II Enzyme mix (Table 5).

METHODS
37
Table 20: Reaction for ScribP305L mutagenesis
Component Amount Final concentration
DNA template (pDONR-Scrib) 100 ng 2 ng/µl
dNTP (10 mM) 1 µl 200 µM
Scrib (mut-P305L) forward (10 µM) 1 µl 0.2 µM
Scrib (mut-P305L) reverse (10 µM) 1 µl 0.2 µM
5x Phusion® GC buffer 10 µl 1 x
DMSO 1.5 µl 3 %
Phusion® High-Fidelity DNA Polymerase 0.5 µl 0.02 units/µl
Nuclease free water add to 50 µl -
Table 21: Program for ScribP305L mutagenesis
Cycle Step Temperature Time
1 Initial denaturation 98 °C 60 seconds
18 x Denaturation 98 °C 30 seconds
Combined annealing and extension 72 °C 4 minutes and 40 seconds
1 Final extension 72 °C 10 minutes
4.3.3 Subcloning of ScribWT
and ScribP305L
for hydrodynamic tail-vein injection
To generate the vectors for hydrodynamic tail-vein (HDTV) injection, human ScribWT
and
ScribP305L
cDNAs were amplified by using Scrib pT3 for and Scrib EcoRI pT3 rev primers (Table
9). Blunt-end cloning was employed for the transfer of the insert into the pT3-EF1α vector. PCR
reaction and program for the implication of Scrib cDNA were indicated in the following tables
(Table 22-23). Fifty microliters of PCR products were loaded on a 0.5% Agarose gel for
separation. The specific product with 4.8 kb was cut out under UV light and purified using the
PCR Clean-up kit. To phosphorylate the insert, 17 µl of purified PCR product was incubation
with 1 µl T4 Polynucleotide Kinase (PNK) and 2 µl T4 ligation buffer at 37°C for 1 hour. T4
PNK Kinase was inactivated at 65°C for 20 minutes. For the preparation of the backbone, the
empty pT3-EF1α vector (2 µg) was digested with the restriction enzyme EcoRI (1 unit) at 37°C

METHODS
38
for 3 hours. In order to generate blunt ends, Phusion®
polymerase (1 unit) and dNTPs (0.5 µl,
final concentration: 250 µM) were incubated with the digested plasmid (2 µg) at 37°C for 1 hour.
The blunt-end vector (17 µl) was dephosphorylated by CIAP (2 µl, 40 units) for 1 hour. The
resulting pT3-EF1α vector was purified by PCR clean up kit. To ligate the ScribWT
/ScribP305L
cDNAs with the pT3-EF1α vector, the phosphorylated insert (250 ng) was added to the
dephosphorylated vector (100 ng) with a molar ratio of 3:1 (insert:vector). T4 ligase (1 µl, 5
units) and T4 Buffer (supplemented with ATP, 1 µl) were added to the DNA mixture and
incubated at 16°C overnight.
Table 22: Amplification reaction of Scrib for pT3-EF1α vector
Component Amount Final concentration
DNA template (pDONR-ScribWT/pDONR-ScribP305L) 20 ng 0.4 ng/µl
dNTP (10 mM) 1 µl 200 µM
Scrib pT3 for (10 µM) 2.5 µl 0.5 µM
Scrib EcoRI pT3 rev (10 µM) 2.5 µl 0.5 µM
5x Q5 buffer 10 µl 1 x
5x High GC Enhancer 10 µl 1 x
DMSO 1.5 µl 3 %
Q5® High-Fidelity DNA Polymerase 1 µl 0.04 units/µl
Nuclease free water add to 50 µl -
Table 23: Amplification program of Scrib for pT3-EF1α vector
PCR Cycle Step Temperature Time
1 Initial denaturation 98 °C 30 seconds
38x Denaturation 98 °C 5 seconds
Combined annealing and extension 72 °C 3 minutes and 30 seconds
1 Final extension 72 °C 2 minutes

METHODS
39
4.3.4 Transformation of competent bacteria
In order to amplify plasmid DNA, different vectors were transformed into competent bacteria.
For bacterial transformation, 0.1-50 ng plasmid DNA was added to 50 µl of the respective
bacterial strain (Table 14). After incubation on ice for 30 minutes, the plasmid/bacteria mixture
was heated in a 42 °C water bath for 42 seconds, and incubated on ice for 2 minutes. For vectors
containing kanamycin resistance, transformed bacteria were growing in 900 µl pre-warmed
Luria-Bertani (LB) media at 37°C for 1 hour with shaking (250 RPM) before inoculation
Kanamycin-containing (25 µg/ml) agar plate. For vectors with Ampicillin resistance, transformed
bacteria were inoculated directly on Ampicillin-containing (50 µg/ml) agar plates. After selection
overnight, single clones were picked for further testing and amplification.
For long-term storage of transformed bacteria, single clones were picked and incubated in 2 ml
LB media with respective antibiotics. After growing overnight, 500 μl of the cultured bacteria
was added to 500 μl glycerol (50%) in a cryovial and storted at -80°C.
4.3.5 DNA purification (MidiPrep and EndoFree Maxiprep)
For in vitro experiments, midipreps were carried out for the purification of plasmid DNA. Single
bacterial clones were picked and incubated with 80 ml LB media containing Ampicillin (50
µg/ml) or Kanamycin (12.5 µg/ml) under shaking at 250 RPM. After overnight incubation,
cultured bacteria were pelleted down by centrifugation at 5,000 RPM for 10 minutes. Cell pellet
was resuspended in 3 ml Cell Resuspension Solution. Bacteria were lysed by adding 3 ml Cell
Lysis Solution and mixed via gentle mixing. After incubation at room temperature for 3 minutes,
the lysate was neutralized by adding 5 ml chilled Neutralization Solution. The neutralized lysate
was incubated on ice for 5 minutes to allow sufficient precipitation. Afterwards, cell lysate was
transferred on a PureYield Clearing Column to remove the precipitate. The clear supernatant was
added to a DNA Binding Column. The DNA Binding Column was washed 1x 5 ml Endotoxin
Removal Solution, 2x 20 ml Column Wash Solution. After drying of the DNA Binding Column,
plasmid DNA was eluted by adding 600 μl nuclease free water and centrifugation at 5,000 RPM
for 5 minutes.

METHODS
40
For the purification of plasmid DNA for in vivo experiment, an EndoFree Maxiprep kit was
applied (Table 6). Single clones were picked up and incubated in 200 ml LB media containing
the respective antibiotic overnight with shaking (250 RPM). Purification was performed
according to the manufacturer’s instructions. Compared to the Midiprep, endotoxin produced by
bacteria was removed by incubating with 2.5 ml Endotoxin Removal Buffer on ice for 30
minutes. After elution of plasmid DNA from the column, DNA was precipitated by adding 10.5
ml isopropanol and centrifuged at 5,000 RPM for 1 hour. Afterwards, the resulting DNA pellet
was washed with 5 ml of 70% endotoxin-free ethanol, and centrifuged at 5,000 RPM for 40
minutes. After drying, 600 μl endotoxin-free Buffer TE was added to dissolve the plasmid DNA.
4.4 Messenger RNA (mRNA) quantification
4.4.1 RNA extraction from cultured cells
For total RNA extraction from cultured cells, the NucleoSpin RNA II kit was applied according
to the manufacturer’s instructions. Specifically, cells grown on 6-well plate were lysed by adding
350 μl Lysis Buffer RA1 with 1% ß-mercaptoethanol. Cell lysate was filtered by loading on a
NucleoSpin®
Filter and centrifuged at 11,000x g for 1 minute. Filtered lysate was mixed with 350
μl of 70 % ethanol and loaded on a RNA-binding column. After centrifugation at 11,000x g for
30 seconds, silicon membrane was desalted by adding 350 μl Membrane Desalting Buffer. The
genomic DNA on silicon membrane was digested with 95 μl DNase reaction mixture at room
temperature for 15 minutes. Afterwards, the RNA column was sequentially washed with 200 μl
RAW2, 600 μl RA3, and 250 μl RA3. After each washing step, the column was centrifuged at
11,000x g for 30 seconds (last step for 2 minutes). RNA was eluted by adding 60 μl RNase-free
water and centrifugation at 11,000x g for 1 minute. RNA concentrations were determined by
Nanodrop and stored at -80°C.

METHODS
41
4.4.2 cDNA synthesis
Reactions and program for cDNA synthesis are listed in Table 24-25. cDNA was diluted 1:50 for
further analysis.
Table 24: Reaction of cDNA synthesis
Component Amount Final concentration
Total RNA 1 µg 50 ng/µl
dNTP (10 mM) 2 µl 1 mM
Random Hexamer primers (100 µM) 1 µl 5 µM
5x RT reaction buffer 4 µl 1x
RevertAid H Minus Reverse Transcriptase 0.9 µl 9 units/µl
Nuclease free water add to 20 µl -
Table 25: Program of cDNA synthesis
Step Temperature Time Comment
Denaturation 75 °C 5 minutes 5x RT reaction buffer was added at the end of this step
Annealing 25 °C 15 minutes Reverse Transcriptase was added after 5 minutes of this step
cDNA synthesis 42 °C 1 hour -
Enzyme inactivation 70 °C 10 minutes -
4.4.3 Semi-quantitative real-time PCR analysis
Real-time PCR reactions were set up using the ABsolute qPCR SYBR Green ROX Mix (Table
26-27). β2-Microglobulin was used for the normalization of in vitro experiments. StepOnePlus™
The standard curve method was used for quantification. Different dilutions of cDNA from
HepG2 cells (1:12.5, 1:25, 1:50, 1:100, 1:200, and 1:400) were used for generation of the
standard curves for each primer pair.

METHODS
42
Table 26: Reaction of real-time PCR
Component Amount Final concentration
cDNA (1:50) 2 µl 1:500
SYBR Green ROX Mix (2x) 5 µl 1x
Forward primer (10 µM) 0.3 µl 0.3 µM
Reverse primer (10 µM) 0.3 µl 0.3 µM
Nuclease free water 2.4 µl -
Table 27: Program of real-time PCR
PCR Cycle Step Temperature Time
1 Initial denaturation 95 °C 15 minutes
40 x Denaturation 95 °C 15 seconds
Combined annealing and extension 60 °C 60 seconds
1 Melting curve 60 °C - 95 °C Increase at 0.5 °C/minute
4.4.4 Gene expression profiling
Affymetrix Human Gene 2.0 ST Arrays were used for the expression analysis of total mRNA
derived from HepG2 cells stably expressing ScribWT
or ScribP305L
. After extraction of total RNA
from both cell lines, complementary RNA labeled with biotin was prepared according to the
Affymetrix standard labelling protocol. The complementary RNA was purified, fragmented, and
hybridized uisng the GeneChip Hybridization oven 640. The arrays were washed and stained
with the GeneChip Fluidics Station 450, and detected by using the GeneChip Scanner 3000.
Custom CDF with Entrez-based gene definitions were used for the annotation of the arrays [61].
Values from the arrays were rearranged by quantile normalization, and analyzed using the
software package SAS JMP7. Array data was uploaded in the Gene Expression Omnibus
database (available: http://www.ncbi.nlm.nih.gov/geo/; accession number GSE93742).

METHODS
43
4.5 Protein biochemistry analyses
4.5.1 Protein extraction from cultured cells
Cells on culture plates were washed briefly with ice-cold PBS. A certain volume (80 µl for 6-well
plate, 300 µl for 10 cm dish) of cell lysis buffer supplemented with Proteinase Inhibitor (1x),
PMSF (1 mM) and PhosStop (1x) was incubated with cultured cell on ice for 2 minutes. Cell
lysate was collected and briefly frozen in liquid nitrogen. After thawing, the cell lysate was
sonicated for ten seconds to shear DNA. Afterwards, the suspension was centrifuged at 14,000
RPM for 15 minutes. The supernatant containing total proteins were isolated and stored at -20°C
before analysis.
4.5.2 SDS-Polyacrylamide gel electrophoresis (PAGE) and western immunoblotting
For western immunoblotting analysis, equal amount of proteins ranging from 30-50 µg were
prepared in 3x SDS-protein sample buffer and denatured at 95°C for 5 minutes. Protein samples
were loaded on polyacrylamide gels (8% to 12%) next to 8 µl of a 10-250 kDa Prestained Protein
Ladder (Table 3). Electrophoresis was carried out with 120 V in electrophoresis buffer for 2
hours. Proteins on polyacrylamide gel were transferred to a 0.45 µm nitrocellulose membrane
using a blotting chamber with ice-cold borate buffer at 90 V and 1000 mA/chamber for 1.5 hours.
After blocking unspecific bands with 5% (w/v) milk powder or 5% (w/v) BSA in TBST (0.1%
Tween 20 in TBS, v/v) for 1 hour, membranes were incubated with primary antibodies
(concentrations are listed in Table 7) at 4°C overnight. After incubation, the membranes were
washed 3x with TBST (0.1%), and incubated with respective fluorophore-labeled secondary
antibodies (1:20,000; IRDye 680 and 800) at room temperature for 1 hour. After washing 3x
TBST (0.1%), signals on the membranes were detected using a LI-COR fluorescent imaging
(Odyssey SA Infrared Imaging System). Actin was used as a loading control.
METHODS
44
4.5.3 Fractionation of subcellular proteins
For the fractionation of cytoplasmic and nuclear proteins, a NE-PER™ Nuclear and Cytoplasmic
Extraction Reagents kit was used. Cells were seeded on 10 cm dishes at high cell density (>80%
confluence). For experiments with low cell density, 4 dishes were prepared and pooled.
Fractionation was performed according to the manufacturer’s instructions. After quantification,
cytoplasmic and nuclear protein extracts were loaded on polyacrylamide gel with the ratio of 2:1
(cytoplasmic: nuclear fraction) for western immunoblotting (see 4.5.2). β-Tubulin and PARP
(poly-ADP ribose polymerase) served as loading controls for cytoplasmic and nuclear fractions,
respectively.
Membranous and cytoplasmic protein fractionation was performed by using the Mem-PER Plus
Membrane Protein Extraction Kit. Cells were seeded on 10 cm dishes and fractionation was
performed according to the manufacturer’s instructions. For western immunoblotting of
membranous proteins, an antibody detecting Na+-K
+-ATPase was used for a loading control. For
cytoplasmic proteins, β-Tubulin was used as a loading control.
4.5.4 Enzyme-linked immunosorbent assay (ELISA)
Human SPARC Quantikine ELISA kit was used to determine the secreted concentrations of
SPARC in the supernatant of cultured cells. For this, cells were starved in the respective medium
without FCS for at least 12 hours. Media (100 µl) from cultured cells were collected from each
sample and centrifuged for 15 minutes at 1,000x g to remove particles. The resulting supernatants
were diluted 1:2 in Calibrator Diluent RD6-59. Samples, SPARC standards, and blank control
(Diluent RD6-59) were incubated in the ELISA microplate at room temperature with 300 RPM
shaking for 3 hours. After that, wells were washed simultaneously with wash buffer and
incubated with of human SPARC conjugate antibody (200 µl) in the dark at 4°C for 1.5 hours.
After an additional washing step, 200 µl of the substrate solution was added. Fluorescence was
detected using the Fluostar Omega microplate reader at wavelengths of 450 nm and 550 nm. The
absorbance of 550 nm was subtracted from the absorbance of 450 nm. For each sample and
standard solution, the respective absorbance was corrected for the blank control. Absolute
concentrations for SPARC were calculated according to the standard curves of recombinant
SPARC provided by the manufacturer.

METHODS
45
4.5.5 Protein half-life determination
Cycloheximide (CHX) chase analysis was performed to compare protein stability. To define the
optimal CHX concentration for HepG2 cells, the lowest concentration which efficiently blocked
protein synthesis was analyzed. Specifically, different amounts of CHX (50, 100, 150, 200, and
250 μg/ml) were applied to HepG2 cells for 16 hours. Proteins were extracted (see 4.5.1) and
analyzed by western immunoblotting (see 4.5.2). Measurement of a known unstable protein (e.g.
c-MYC) revealed that that 100 µg/ml CHX efficiently blocked protein synthesis without killing
cells in this time-frame.
For the analysis of PHLPP1 and PTEN stability, HepG2 stable cell lines were seeded with a cell
density of 8x10⁴/well in a 12-well plate. PHLPP1 with short half-life was chased until 8 hours,
with 0.5 to 2-hours intervals. PTEN with longer half-life was chased until 72 hours, with 2 to 8-
hours intervals. Protein extracts from each time points were collected and analyzed by western
immunoblotting (see 4.5.2). The relative protein amounts for PHLPP1 and PTEN were quantified
compared to the original protein levels at time-point '0'. Image Studio software was employed for
the quantification of proteins.
4.5.6 Immunofluorescence analysis of tissue cryosections
A methanol-acetone fixation method was used for immunofluorescence stains of cryosections
derived from human livers. Tissues were fixed in ice-cold methanol for 5 min followed by ice-
cold acetone for 1 min on ice. The permeabilization step was performed by incubation with
Triton X-100/PBS (0.2%, v/v) at room temperature for 5 min. For blocking, tissue sections were
incubated with BSA/PBS (1%, w/v) for 30 min. Samples were then incubated with primary
antibodies (listed in Table 7) in a wet chamber at 4°C overnight. After three times of wash with
PBST (0.01%, Tween in PBS, v/v), tissue sections were incubated with the respective secondary
antibodies in a wet chamber for 1 hour. After washing 3x with PBST, and rinsed with distilled
water, cryosections were dehydrated with 100% ethanol. The visualization of nuclei and tissue
mounting were achieved by the incubation with DAPI Fluoromount-G.

METHODS
46
4.5.7 Immunofluorescence analysis of sandwich cultures
For the visualization of polarity markers in sandwich cultures, a published hepatocyte sandwich
immunofluorescence staining method was modified [62]. In brief, sandwich cultures were
prepared on coverslips in cell culture plates for 1-2 weeks. After washing 1x with MgCl2/PBS
(2mM), the sandwich cultures were fixed with PFA solution (4%, w/v) at room temperature for
20 minutes. This was followed by a permeabilization step with Triton/PBS (0.5%, v/v) at room
temperature for 10 minutes. Afterwards, the coverslips were thoroughly washed 3x with PBS at
room temperature (2x 5 minutes followed by additional 30 minutes). After blocking with
BSA/PBS (5%, w/v) for 30 minutes, the coverslips were washed with PBST (0.05% Tween in
PBS, v/v) and transferred into a wet chamber. On each slide 150-200 µl primary antibodies
(Table 7) were incubated at 4°C, overnight. After primary antibody incubation, sandwiches were
washed 3x with PBST at room temperature for 10 minutes followed by an incubation with 200 µl
secondary antibodies at room temperature in a dark chamber for 2 hours. After incubation, the
sandwich cultures were washed 3x with PBST for 10 minutes, and 3x with PBS for 10 minutes.
Eventually, the sandwich cultures were dehydrated with 100% ethanol, and mounted by a DAPI
Fluoromount-G.
4.5.8 Immunohistochemistry (IHC) and histological analyses
Paraffin embedded tissues were cut in 2-3 µm sections using a microtome and dried overnight.
Tissues were deparaffinised by 3x incubation with xylene for 5 minutes. Afterwards, sections
were rehydrated using an ethanol gradient (2x 100% Ethanol, 96% Ethanol, 70% Ethanol, water
each 2 min). For antigen retrieval, tissue sections were incubated with 10 mM citrate buffer (pH
6.0) in a stream cooker. After cooling down, tissues were blocked with avidin and biotin at room
temperature for 30 minutes (Avidin/Biotin Blocking Kit), and incubated with primary antibodies
(Table 7) in a wet chamber at 4°C overnight.
For E-cadherin, ATF2, and pAKT stains, AP (alkaline phosphatase)-based DCS Detection Line
system was employed. For this, tissue sections were incubated with Rabbit Enhancer for 20 min,
and incubated with AP-Polymer Detection Line for further 20 min. After washing 2x with TBS
for 5 minutes, sections were incubated with Permanent AP Red. For Scrib and MCAM stains, the
horseradish peroxidase (HRP) system was used. Tissues were blocked with H2O2 for 10 min, and
incubated with biotinylated secondary antibody for 30 min. This was followed by incubation with
Streptavidin-HRP for 20 min and signal development with DAB (for Scrib stain) or AEC (for
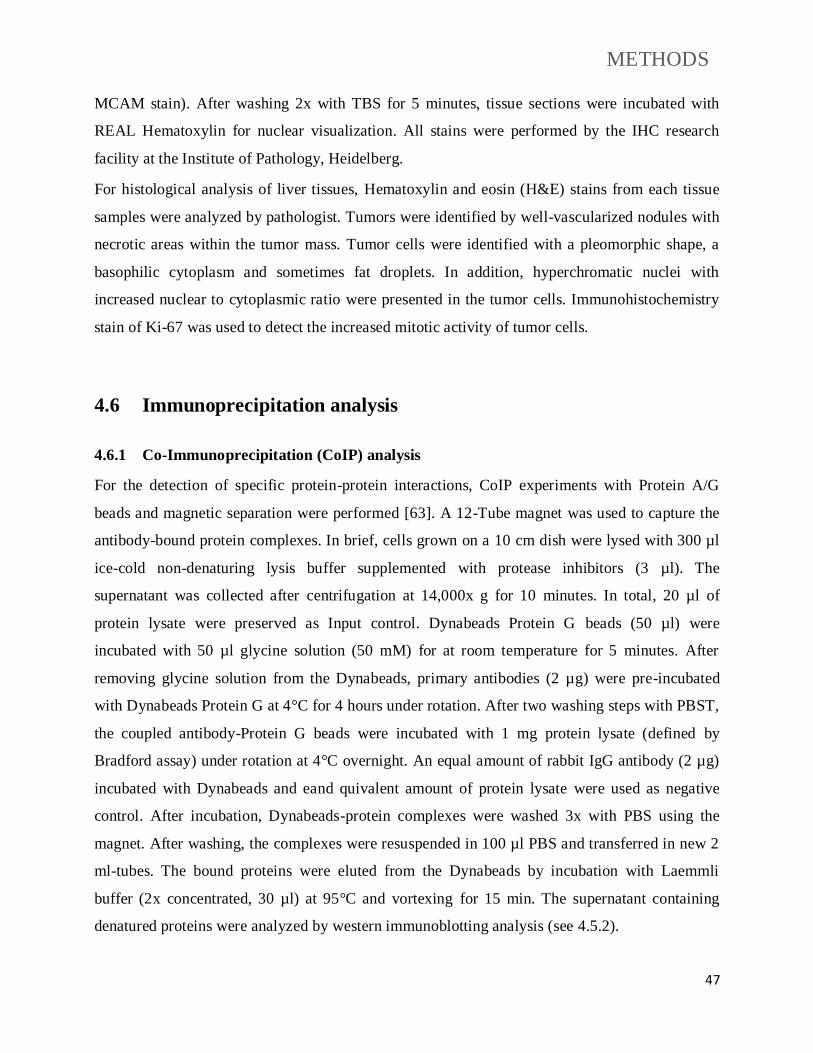
METHODS
47
MCAM stain). After washing 2x with TBS for 5 minutes, tissue sections were incubated with
REAL Hematoxylin for nuclear visualization. All stains were performed by the IHC research
facility at the Institute of Pathology, Heidelberg.
For histological analysis of liver tissues, Hematoxylin and eosin (H&E) stains from each tissue
samples were analyzed by pathologist. Tumors were identified by well-vascularized nodules with
necrotic areas within the tumor mass. Tumor cells were identified with a pleomorphic shape, a
basophilic cytoplasm and sometimes fat droplets. In addition, hyperchromatic nuclei with
increased nuclear to cytoplasmic ratio were presented in the tumor cells. Immunohistochemistry
stain of Ki-67 was used to detect the increased mitotic activity of tumor cells.
4.6 Immunoprecipitation analysis
4.6.1 Co-Immunoprecipitation (CoIP) analysis
For the detection of specific protein-protein interactions, CoIP experiments with Protein A/G
beads and magnetic separation were performed [63]. A 12-Tube magnet was used to capture the
antibody-bound protein complexes. In brief, cells grown on a 10 cm dish were lysed with 300 µl
ice-cold non-denaturing lysis buffer supplemented with protease inhibitors (3 µl). The
supernatant was collected after centrifugation at 14,000x g for 10 minutes. In total, 20 µl of
protein lysate were preserved as Input control. Dynabeads Protein G beads (50 µl) were
incubated with 50 µl glycine solution (50 mM) for at room temperature for 5 minutes. After
removing glycine solution from the Dynabeads, primary antibodies (2 µg) were pre-incubated
with Dynabeads Protein G at 4°C for 4 hours under rotation. After two washing steps with PBST,
the coupled antibody-Protein G beads were incubated with 1 mg protein lysate (defined by
Bradford assay) under rotation at 4°C overnight. An equal amount of rabbit IgG antibody (2 µg)
incubated with Dynabeads and eand quivalent amount of protein lysate were used as negative
control. After incubation, Dynabeads-protein complexes were washed 3x with PBS using the
magnet. After washing, the complexes were resuspended in 100 µl PBS and transferred in new 2
ml-tubes. The bound proteins were eluted from the Dynabeads by incubation with Laemmli
buffer (2x concentrated, 30 µl) at 95°C and vortexing for 15 min. The supernatant containing
denatured proteins were analyzed by western immunoblotting analysis (see 4.5.2).

METHODS
48
4.6.2 Chromatin-Immunoprecipitation (ChIP) analysis
ChIP analysis was carried out to detect the interactions between transcription factors and specific
promoter regions. For this, 1.1x10⁷ cells were seeded on 15 cm dishes and cultured for 2
additional days. DNA and proteins were cross-linked using 20 ml of formaldehyde/PBS (1%) for
12 min, followed by quenching with 1 ml of glycine (2.5 M) for 5 min. After washing with ice-
cold PBS, cells were lysed with 1 ml ice-cold RIPA buffer on ice. The DNA fragments (500 bp-1
kb) were generated by sonication (amplitude 15, power level 1.5) for 2 minutes. Cell debris was
removed by centrifugation at 16,000x g at 4°C for 15 minutes. Protein concentrations were
determined by Bradford assay and equalized to 1 mg/ml with RIPA buffer. Diluted cell lysate
was pre-cleared with 30 µl of Dynabeads Protein G. In parallel, 50 µl Dynabeads Protein G beads
was blocked with salmon sperm DNA (15 µg) and BSA (50 µg) for 2 hours. Pre-cleared samples
were incubated with blocked Dynabeads and respective antibodies (4 µg) at 4°C overnight. The
resulting immunocomplex-bound-beads were washed 4x with RIPA buffer, 2x with IP wash
buffer and again 2x with RIPA buffer (for 5 min each). The Dynabeads complexes were
resuspended in 100 µl TE buffer. Immunocomplexes were eluted with 200 µl of Talianidis
elution buffer (1.5x concentrated) at 65°C for 15 min. Reversal crosslinking was achieved by
adjusting to 200 mM NaCl (4 M) and incubation at 65°C for 5 hours. DNA was extracted by the
PCR Clean-Up kit according to the manufacturer's protocol. Real-time PCRs were performed to
determine the quantity of precipitated promoter fragments with the normalization to a standard
curve derived from serial dilutions of genomic DNA. As a negative control, primers binding to
5,200 bp downstream of the start codon was used.

METHODS
49
4.7 Mouse work
The experimental setup and group size were approved by the German Regional Council of
Baden-Wuerttemberg (ref. number: G-30/16; Karlsruhe, Germany) and in accordance with the
institutional regulations of the Interfakultäre Biomedizinische Forschungseinrichtung (IBF),
University of Heidelberg, Germany). Exclusion and termination criteria are defined in the ATBC
criteria of the animal welfare officer of the University Hospital Heidelberg.
4.7.1 Hydrodynamic tail-vein (HDTV) plasmid delivery
A HDTV gene delivery method was employed to analyze the effect of cytoplasmic and
membranous Scrib on liver tumor development. The establishment of HDTV is based on the
anatomical structure of the liver, which is highly permeable between sinusoids and liver
parenchymal cells (Chapter 1.1.1). The large volume of plasmid DNA solution flowing into vena
cava inferior induces cardiac congestion, which leads to the enrichment of plasmids in the veins
of mouse liver. This allows the penetration of injected plasmid DNA from blood vessels into
hepatocytes under physical pressure. In order to allow a permanent integration and expression of
target genes, a Sleeping Beauty transposon (SB) system was used to mediate genomic integration
of the pT3-EF1α vectors [64]. The pT3-EF1α-c-MYC (12.5 μg) vector was combined with pT3-
EF1α-hScribWT-GFP or pT3-EF1α-hScribP305L-GFP (12.5 μg) plasmids and mixed with SB (5
μg) in 2 ml (approximately 10% of animal body weight) sterile PBS for each mouse. Before
injection, plasmid solutions were pre-warmed at 37´°C in a water bath and transferred in a 2 ml
syringe. For injection, FVB/N mice at the age of 10 weeks were fixed in a mouse restrainer.
Plasmid solution was injected into the lateral-tail vein within 7-10 seconds. As a control, pT3-
EF1α-c-MYC (12.5 μg) vector combined with pT3-EF1α-GFP (12.5 μg) was injected. The
transient transfection efficiency can be analyzed 48 hours after injection by IHC stains of GFP.
However, because the SB-induced genomic integration was applied in this technique, stable
expression of transgenes was analyzed 2 weeks after injection.
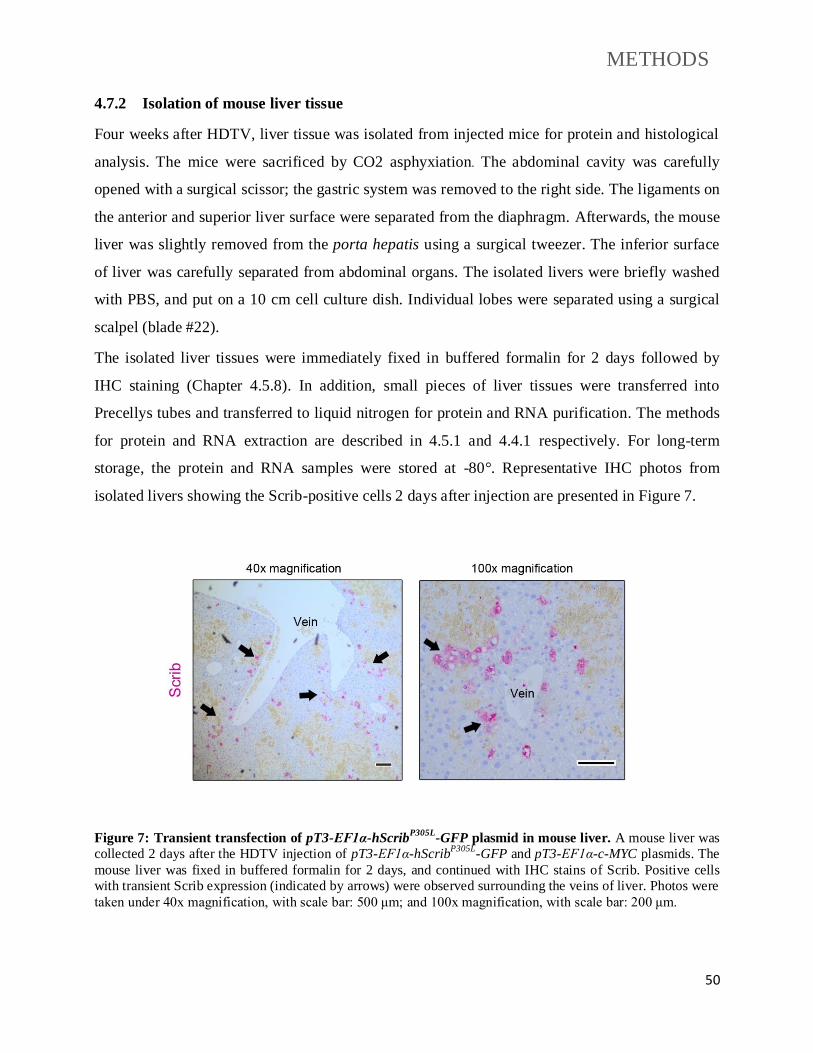
METHODS
50
4.7.2 Isolation of mouse liver tissue
Four weeks after HDTV, liver tissue was isolated from injected mice for protein and histological
analysis. The mice were sacrificed by CO2 asphyxiation. The abdominal cavity was carefully
opened with a surgical scissor; the gastric system was removed to the right side. The ligaments on
the anterior and superior liver surface were separated from the diaphragm. Afterwards, the mouse
liver was slightly removed from the porta hepatis using a surgical tweezer. The inferior surface
of liver was carefully separated from abdominal organs. The isolated livers were briefly washed
with PBS, and put on a 10 cm cell culture dish. Individual lobes were separated using a surgical
scalpel (blade #22).
The isolated liver tissues were immediately fixed in buffered formalin for 2 days followed by
IHC staining (Chapter 4.5.8). In addition, small pieces of liver tissues were transferred into
Precellys tubes and transferred to liquid nitrogen for protein and RNA purification. The methods
for protein and RNA extraction are described in 4.5.1 and 4.4.1 respectively. For long-term
storage, the protein and RNA samples were stored at -80°. Representative IHC photos from
isolated livers showing the Scrib-positive cells 2 days after injection are presented in Figure 7.
Figure 7: Transient transfection of pT3-EF1α-hScribP305L
-GFP plasmid in mouse liver. A mouse liver was
collected 2 days after the HDTV injection of pT3-EF1α-hScribP305L
-GFP and pT3-EF1α-c-MYC plasmids. The
mouse liver was fixed in buffered formalin for 2 days, and continued with IHC stains of Scrib. Positive cells
with transient Scrib expression (indicated by arrows) were observed surrounding the veins of liver. Photos were
taken under 40x magnification, with scale bar: 500 μm; and 100x magnification, with scale bar: 200 μm.

METHODS
51
4.8 HCC Patient material
4.8.1 HCC patient gene expression and survival data
Transcriptome and clinical data derived from 249 primary HCCs and corresponding non-
tumorous liver tissues were used for this study [65]. Expression levels of 33 polarity genes were
compared between HCCs (n=249) and non-tumor livers (n=239). Overall survival and
recurrence-free survivals of HCC patients (n=242) were analyzed using Kaplan-Meier curves and
statistically compared using the Log-Rank Test. Chromosomal gains and losses were calculated
by analyzing CGH array data derived from 60 HCC patients out of the transcriptome cohort [66].
In order to characterize the subcellular localization of Scrib in tissues, cryo-conserved non-
tumorous livers (n=20) as well as HCC tissues (n=32) were obtained from the NCT tissue bank
Heidelberg (application no. 1921). The project was approved by the ethics committee of
Heidelberg University.
4.8.2 HCC tissue-microarray (TMA) analysis
The TMA used for IHC analysis consisted of non-tumor livers (n=7) and HCC tissues (n=105).
The histological grading of HCC tissues was done by an experienced hepato-pathologist (G1=10,
G2=75, G3=16, G4=4). Immunohistochemistry stains were analyzed according to both
quantitative and qualitative parameters. For quantitative parameter, number of cells was
analyzed: 0=no positive cells, 1=less than 1%, 2=less than 10%, 3=10-50%, 4=more than 50%.
For qualitative parameter, staining intensity was analyzed: 0=negative, 1=low, 2=medium,
3=strong. The final score was given by multiplying quantitative and qualitative parameters.
Evaluation was done by two experienced investigators.

METHODS
52
4.9 Data acquisition and statistical analysis
Data are presented as mean ± standard deviation. IBM SPSS Statistics (21.0, Armonk, NY, USA)
was used to perform statistical analysis. The Mann-Whitney U test was used to compare
nonparametric variables between two independent groups. The Spearman rank coefficient test
was used to find associations between variables. Patient survival and recurrence data were
analyzed by the Log-Rank Test. All in vitro experiments were repeated 2-3 times.
Best Cutoff Finder was applied to define two groups of patients for survival analysis [67].
JASPAR data base was used to identify the potential AP1 family binding site on SPARC
promoter region [68]. ImageJ software was used to add scale bars for photos. Adobe Photoshop
CS5 was employed for the design and alignment of figures.

RESULTS
53
5 RESULTS
5.1 Overexpression of Scrib is associated with poor survival in
HCCs
The hypothesis of this study was that dysregulation of single molecules of EPP system,
which leads to a functionally disturbance of hepatocyte polarity, may also play an
important role in the process of HCC development. In order to identify functionally
relevant factors, mRNA expression data of polarity proteins were analyzed in a HCC
cohort of 249 patients [65]. Candidate polarity genes included 33 different factors, which
belong to the three major polarity complexes: Crumbs complex, PAR complex, and Scrib
complex. Additional genes (e.g. CTNNA1 and CTNNB1) are closely related to cell-cell
junctions. The selection criteria were (1) overexpression of the polarity gene in HCC
tissues compared to the surrounding liver tissues; (2) expression level of candidate gene
was associated with both overall survival and recurrence-free survival of HCC patients.
Among the 33 polarity genes, six genes achieved these criteria: CDC42, CTNNA1,
DLG5, MPP5, SCRIB and TJP1. A summary of the expression and survival data from all
the 33 polarity genes is listed in Table 28. The comparisons of mRNA expressions
between livers and HCCs, as well as the Kaplan-Meier survival curves for the six
candidate genes are shown in Figure 8.

RESULTS
54
Table 28: Analysis of 33 polarity genes in human HCC and liver tissues
Gene Symbols
Gene Names HCCs compared to livers
Survival correlation
Recurrence correlation
AMOT Angiomotin Underexpressed Yes No
AMOTL2 Angiomotin like 2 Underexpressed No No
CDC42 Cell Division Cycle 42 Overexpressed Yes Yes
CDH1 Cadherin 1 Underexpressed Yes Yes
CLDN1 Claudin 1 ns No No
CRB1 Crumbs 1, Cell Polarity Complex Component
ns No No
CTNNA1 Catenin Alpha 1 Overexpressed Yes Yes
CTNNB1 Catenin Beta 1 Overexpressed No No
DLG1 Discs Large MAGUK Scaffold Protein 1 Overexpressed No Yes
DLG2 Discs Large MAGUK Scaffold Protein 2 Underexpressed Yes* No
DLG3 Discs Large MAGUK Scaffold Protein 3 Underexpressed No No
DLG4 Discs Large MAGUK Scaffold Protein 4 Underexpressed Yes No
DLG5 Discs Large MAGUK Scaffold Protein 5 Overexpressed Yes Yes
INADL PATJ, Crumbs Cell Polarity Complex Component
Underexpressed No No
LIN7C Lin-7 Homolog C, Crumbs Cell Polarity Complex Component
Underexpressed Yes Yes
LLGL1 Lethal Giant Larvae Homolog 1 Underexpressed Yes Yes
LLGL2 Lethal Giant Larvae Homolog 2 Overexpressed No no
MPP1 Membrane Palmitoylated Protein 1 Underexpressed No Yes
MPP5 Membrane Palmitoylated Protein 5 Overexpressed Yes Yes
PARD3 Par-3 Family Cell Polarity Regulator Overexpressed No No
PARD6A Par-6 Family Cell Polarity Regulator Alpha
Underexpressed No No
PARD6B Par-6 Family Cell Polarity Regulator Beta Underexpressed No No
PRKCZ Protein Kinase C Zeta
Underexpressed No No
SCRIB Scribbled Planar Cell Polarity Protein Overexpressed Yes Yes
TJP1 Tight Junction Protein 1 Overexpressed Yes Yes*
TJP2 Tight Junction Protein 2 Underexpressed Yes No
WWC1 WW And C2 Domain Containing 1
Overexpressed No No
CRB2 Crumbs 2, Cell Polarity Complex Component
ns No No
CRB3 Crumbs 3, Cell Polarity Complex Component
ns No No
MPP4 Membrane Palmitoylated Protein 4
ns No No
MPP7 Membrane Palmitoylated Protein 7
ns No No
PARD6G Par-6 Family Cell Polarity Regulator Gamma
ns No No
AMOTL1 Angiomotin like 2 ns No No
* Small group size according to the “Cutoff Finder”. Bold characters: genes significantly overexpressed in HCC patients and associated with poor overall survival and cancer recurrence.

RESULTS
55
Figure 8: Polarity gene expression of five candidate polarity genes correlated with HCC patient survivals. (A) Gene transcriptome analysis of Scrib mRNA levels in HCC tissues (n=247) compared
to non-tumor liver tissues (n=239). Cutoff value (Log2 mRNA expression) was 6.742 for overall
survival, and 6.879 for recurrence free survival. (B) For CDC42, cutoff value was 5.56 for both
overall and recurrence free survivals. (C) For CTNNA1, cutoff value was 6.55. (D) For DLG5, cutoff
value was 4.90. (E) For MPP5, cutoff value was 3.96. (F) For TJP1, cutoff value was 5.45. The log-
rank test was used for the statistical comparison of groups.

RESULTS
56
Among the 6 polarity genes, MPP5 and TJP1 were moderately but significantly
overexpressed in the group of HCCs. Nevertheless, this elevated expressed of MPP5 and
TJP1 was associated with better patient survival (Figure 8 E/F). Notably, Scrib showed
the strongest induction (2.14-fold) in HCC tissues compared to surrounding liver tissues.
In addition, its overexpression showed the strongest association with poor overall and
recurrence-free survival. For this reason and because the functional impact of Scrib
overexpression was never systematically analyzed in HCC, Scrib was selected for further
analysis.
In order to find out if the overexpression of Scrib in HCCs was due to genomic
alterations, the mRNA expression data derived from human HCCs was compared with
array-based comparative genomic hybridization (array-CGH) data [66]. In an aCGH data
subset of 60 patients, amplifications of Scrib at the gene locus (chr. 8q24.3) were
detected in 11 patients. Indeed, the Scrib mRNA expression levels in these patients with
chromosomal gains were significantly elevated in comparison to patients without
genomic alterations (Figure 9), suggesting that the gains might be causative Scrib
overexpression in some HCCs.
Figure 9: Scrib overexpression was associated with
chromosome gains. Scrib mRNA levels were
compared between HCC samples with chromosomal
gains (n=49), and without chromosomal gains (n=11).
The Mann–Whitney U test was used for statistical
comparison.

RESULTS
57
5.2 Mislocalization of Scrib in HCC tissues and cell lines
Scrib is overexpressed in human HCC tissues and elevated Scrib levels may be due to the
genetic amplifications. Interestingly, the mislocalization of Scrib has also been described
in breast cancer patients [42]. For this reason, I hypothesized that also the localization of
Scrib may play a role in the process of HCC development.
In order to characterize Scrib localization in human livers and HCCs,
immunofluorescence stains of Scrib were carried out using cyosections from healthy
livers (n=20), as well as HCC tissues (n=32). A clear membranous Scrib localization was
observed in most (90%) healthy liver tissues (Figure 10A). In contrast, a frequent
cytoplasmic Scrib mislocalization was found in the majority of HCC tissues (69%). In
tissues with Scrib mislocalization, about 50% of patients had a partial loss of
membranous Scrib, while other patients showed a complete membranous loss and
cytoplasmic enrichment of Scrib (Figure 10B).
Figure 10: Mislocalization of Scrib in HCC tissues. (A) Representative pictures of Scrib
immunofluorescence stains from healthy livers and HCCs. In normal livers, 90% (18/20) of all
analyzed samples showed a clear membranous Scrib localization. In HCCs, most of the cases 69%
(22/32) had a cytoplasmic localization of Scrib. Scale bars: 200 µm. (B) Quantification of Scrib
localization in healthy livers and HCCs. The relative amount of cytoplasmic Scrib is significantly
higher in HCC tissues compared to healthy livers. Fisher's exact test was performed (P≤0.001).

RESULTS
58
In order to test for suitable in vitro models for further studies, the expression and
localization of Scrib were compared in different HCC cell lines (HepG2, HuH1, Huh6,
Hep3B, HLF and HuH7). The mRNA levels of Scrib were higher in most HCC cell lines
compared to the immortalized hepatocytes (THLE-2), (Figure 11A). Protein analysis
confirmed higher Scrib expression in HCC cell lines compared to the non-malignant cell
line. Highest Scrib protein levels were detected in HepG2, HuH6, HLE and HLF cells
(Figure 11B). To gain further insight into Scrib localization in HCC cell lines,
immunofluorescence of Scrib was carried out in lines with higher protein abundance.
HepG2, HuH1 and HuH6 showed a clear membranous localization, while Hep3B, HLF
and HuH7 showed a predominately cytoplasmic localization (Figure 11C). These data
illustrate that next to overexpression, Scrib is also localized in the cytoplasm in a
subgroup of HCC cell lines.

RESULTS
59
Figure 11: Different expression and localization of Scrib in HCC cell lines. (A) Comparison of
Scrib mRNA levels in different HCC cell lines (HepG2, Huh1, Huh6, Huh7, Hep3B, HLE, HLF, and
SNU182) and non-malignant THLE-2 cells by real-time PCR. (B) Comparison of Scrib protein levels
in HCC cell lines and THLE-2 cells using Western immunoblotting. Actin served as the loading
control. (C) Immunofluorescence analysis reveals differential localizations of Scrib in human HCC
cell lines. Magnification: 400-fold, scale bars: 40 μm.

RESULTS
60
5.3 Scrib localization affects hepatocellular polarity
In order to study the impact of cytoplasmic Scrib in HCC cells, two cell lines stably
expressing the wildtype (ScribWT
) and mutated Scrib (ScribP305L
) were generated. The
P305L mutation in the leucine-rich repeats (LRR) domain abrogates the binding of Scrib
with other cell polarity factor leading to its enforced cytoplasmic localization [69].
Plasmids coding for EGFP-tagged ScribWT
and ScribP305L
were transfected into HepG2
cells, which showed a polarized phenotype as well as a membranous localization of Scrib
(Figure 11C). Cell lines stably expressing ScribWT
or ScribP305L
were generated and tested
for the localization of exogenous Scrib by immunofluorescence. As expected, ScribWT
localized specifically to the plasma membrane, whereas ScribP305L
predominantly
accumulated in the cytoplasm (Figure 12A). The localization of both Scrib isoforms was
confirmed by Western immunoblotting using membranous and cytoplasmic protein
fractions (Figure 12B).

RESULTS
61
Figure 12: HepG2 stable cell lines with membranous and cytoplasmic Scrib. (A)
Immunofluorescence of HepG2 cells stably expressing EGFP-tagged ScribWT
and ScribP305L
. Upper
right corner show higher magnifications to illustrate the expected subcellular Scrib localization. Scale
bars: 40 µm. (B) Western immunoblots of protein fractions extracted from ScribWT
and ScribP305L
expressing cells confirm the membranous localization of ScribWT
and cytoplasmic localization of
ScribP305L
. Na+-K
+-ATPase and ß-tubulin served as the loading controls for membranous and
cytoplasmic proteins fractions, respectively.

RESULTS
62
Interestingly, cell lines stably overexpressing ScribWT
and ScribP305L
showed different
morphologies when grown on a plastic surface. The ScribWT
cells established a columnar
shape and compact multilayer colonies, while the ScribP305L
cells acquired a flattened
shape and a monolayer growth pattern (Figure 13A), which is indicative for disturbed
cell-cell contact. In order to further analyze the impact of membranous or cytoplasmic
Scrib on the 3-dimensional hepatocellular structure, a hepatocyte sandwich culture
containing two layers of collagen matrix was used, which allows the formation of highly
polarized cells in vitro [6]. After seeding the both cell lines under sandwich culture
conditions for one week, the cell layers were stained for multidrug resistance-associated
protein 2 (MRP2), which is a marker for the canalicular network. Elongated canalicular
structures were detected in ScribWT
cultures, while only spherical and shortened
structures were found in ScribP305L
cultures (Figure 13B). These results indicate that the
proper localization of Scrib is critical for the maintenance of hepatocellular polarity.
Figure 13: Disturbance of cell polarity by overexpression of cytoplasmic ScribP305L
. (A) Bright
field photos of HepG2 cells stably expressing ScribWT
and ScribP305L
indicate differences in cell
morphology and cell-cell contact. Low magnification: 100-fold, scale bar: 200 µm; High
magnification: 400-fold, scale bar: 40 µm. (B) Sandwich culture stains of MRP2 in ScribWT
and
ScribP305L
expressed HepG2 cells. Cell lines were seeded at a cell density of 400,000 cells per 6 cm
dish between collagen sheets for one week. Immunofluorescence stains of MRP2 were performed to
detect the presence of canalicular structures. Magnification: 400-fold, Scale bars: 40 µm.

RESULTS
63
5.4 Cytoplasmic Scrib induces cell invasion in HCC cell lines
The initial correlation of Scrib expression and HCC patient data revealed an association
of Scrib abundance and tumor prognosis. In addition, immunofluorescence illustrated the
cytoplasmic localization of Scrib in many HCC tissues. In order to find out how
cytoplasmic Scrib affects liver cancer progression, functional analyses including cell
viability, apoptosis, and invasion assays were performed with ScribWT
and ScribP305L
-
positive HepG2 cells.
The cell viability assay revealed that cytoplasmic ScribP305L
induced cell viability (Figure
14A), while membranous ScribWT
did not affect viability for up to 48 hours. In addition, a
cell cytotoxicity assay illustrated that membranous ScribWT
was associated with increased
cell cytotoxicity (Figure 14B), while ScribP305L
only moderately increased cell death in
comparison to untransfected HepG2 cells. To further test if the increase of cytotoxicity
was due to apoptosis and if Scrib with membranous and cytoplasmic localizations can
differently affect drug-induced cell death, a caspase-3 activity assay was performed with
both cell lines. Interestingly, the basal caspase-3 activity was not different between
ScribWT
and ScribP305L
cells, however, cells expressing ScribP305L
showed relatively lower
caspase-3 activity after Doxorubicin treatment (Figure 14C). These data illustrate that
cytoplasmic Scrib moderately affects cell apoptosis and that it may protect hepatocyte
from cytotoxic challenges.
Because Scrib overexpression significantly correlated with cancer recurrence in HCC
patients, additional cell invasion assays were performed. HepG2 cells stably expressing
ScribWT
showed a low invasive capacity. In contrast, cells stably expressing ScribP305L
had a significantly higher invasive capacity (Figure 14D).
Together, the functional analyses revealed that cytoplasmic Scrib predominantly supports
HCC cell mobility and invasion and to a lesser extent cell viability and apoptosis.

RESULTS
64
Figure 14: Functional analyses of HepG2 cells with membranous and cytoplasmic Scrib. (A) Cell
viability of untransfected HepG2 and HepG2 cells expressing ScribWT
or ScribP305L
were measured 24
and 48 hours after seeding. (B) Cell cytotoxicity assay of untransfected HepG2 and cells expressing
ScribWT
or ScribP305L
were performed 24 and 48 hours after seeding. (C) ScribWT
and ScribP305L
expressing HepG2 cells were treated with Doxorubicin (1 µM) for 24 hours followed by measurement
of caspase-3 activity. Cell lysate were incubated with caspase-3 substrate for 4 hours. (D) HepG2 cells
expressing ScribWT
and ScribP305L
were analyzed using Transwell chambers with Matrigel-coated
inserts. The number of transmigrating cells was counted 72 hours after seeding. For each assay, cells
were counted in seven different visual fields (40-fold magnification). Photos were taken with 100-fold
magnification. Scale bars: 250 µm. For statistical testing, the Mann-Whitney U Test was used.
Because GTPases play an essential role in regulating actin filament in cells which
undergo EMT (see Chapter 1.2.3), cytoplasmic Scrib may interaction with GTPases in
the regulation of cell invasion. To further figure out the reasons why cytoplasmic Scrib
induced HCC cell invasion/migration, the ScribWT
and ScribP305L
cell lines were analyzed
with regard to their actin organization as well as the content of Rho family GTPases
using immunofluorescence and Western immunoblotting. Indeed, obvious differences
were found in case of the actin filament organization. Cells expressing ScribP305L
showed
clear actin bundles at the leading and trailing edges, which has been regarded as the
typical structure of actin cytoskeleton in invading/migrating cells [70]. Such actin
filament structure was less obvious in cells expressing ScribWT
(Figure 15A). Differences

RESULTS
65
regarding the expressions of Rho family GTPases were also detected in the both stable
cell lines. Rac 1/2/3 and CDC42, which were strong inducers of cell invasion/migration,
were increased in cells expressing ScribP305L
. However, the negative regulator of cell
invasion/migration, RhoA, was not differentially expressed in both cell lines (Figure
15B).
In summary, these data strongly suggest that cytoplasmic Scrib predominantly supports
HCC cell mobility and invasion via the regulation of actin filaments and Rho GTPases.
Figure 15: Effects of ScribP305L
on actin filament and Rho GTPases. (A) Immunoflurescence stains
of actin in cell lines stably expressing ScribWT
or ScribP305L
indicate differential cytoskeleton
organization. Cells were documented with 400-fold magnification. Scale bars: 40 μm. (B) Western
immunoblot analysis of Rho-GTPase family proteins in cells with ScribWT
or Scrib
P305L expression.

RESULTS
66
5.5 Cytoplasmic Scrib induces tumor formation via AKT
signaling
In the next step, we wanted to identify the relevant signaling pathways that were induced
by cytoplasmic Scrib. Previous studies already demonstrated the regulatory effects of
Scrib on extracellular signal-regulated kinases (ERK) and Hippo pathway activity [50,
71]. We first tested if the transcriptional downstream effector of the Hippo pathway YAP
was affected by the cytoplasmic ScribP305L
in comparison to membranous ScribWT
.
Because YAP phosphorylation regulates its subcellular localization, the phospho-status of
YAP was considered to be a good read-out for the Hippo/YAP pathway activity [46].
However, no difference regarding YAP phosphorylation was observed in HepG2 cells
stably expression both Scrib isoforms (Figure 16A). In addition, the localization YAP and
its paralogue TAZ after siRNA-mediated inhibition of Scrib in untransfected HepG2 cells
was analyzed. Again no nuclear enrichment of YAP or TAZ was detected after Scrib
silencing (Figure 16B). These results indicate that no direct effect of Scrib on Hippo/YAP
pathway activity is detectable in HCC cells.
In the next step, other signaling pathways (ERK1/2, JNK and AKT pathways) that may
be affected by Scrib were analyzed. In HepG2 cells stably expressing ScribWT
or
ScribP305L
, neither the ERK1/2 nor the JNK pathways were significantly regulated by the
different Scrib isoforms (Figure 16C). However, the AKT/mTOR pathway was obviously
induced by cytoplasmic Scrib. Phosphorylation of AKT and its downstream target
phospho-S6 protein were both induced in cells expressing ScribP305L
in comparison to
cells with ScribWT
expression (Figure 16C). In order to test if the induction of AKT
depends on its physiological regulator phosphoinositide 3-kinases (PI3K), PI3K activity
was inhibited by using Wortmannin. AKT activation was blocked under high dose (0.5
μM) in both tested cell lines. However, using lower doses (0.05-0.25 μM), Wortmannin
completely blocked AKT phosphorylation in cells expressing ScribWT
, but not in cells
expressing ScribP305L
(Figure 16D). These results illustrate that AKT/mTOR pathway was
activated by the overexpression of cytoplasmic Scrib in a PI3K-independent manner.

RESULTS
67
Figure 16: Cytoplasmic Scrib activates the AKT/mTOR pathway. (A) Western immunoblot
analysis illustrate that neither total YAP nor phospho-YAP are differentially expressed in ScribWT
and
ScribP305L
cells. (B) siRNA-mediated Scrib inhibition cannot induce the nuclear enrichment of YAP or
its paralogue TAZ in HepG2 cells. Proteins from cytoplasmic and nuclear fractions were isolated 60
hours after siRNA treatment. PARP and ß-tubulin served as the loading controls for nuclear and
cytoplasmic protein fractions, respectively. UTC: untreated cell, NS: non-sense siRNA. (C) Western
immunoblot of protein lysates derived from ScribWT
and ScribP305L
-expressing HepG2 cells shows
increased phosphorylation of AKT and its downstream target S6 protein in the cells expressing
ScribP305L
. (D) Western immunoblot analysis of Wortmannin-treatment cells illustrates the PI3K-
independent activation of the PI3K/AKT pathway in cells stable stably expressing ScribP305L
. DMSO:
DMSO-treated cells.

RESULTS
68
5.6 Cytoplasmic Scrib destabilizes the phosphatases PTEN and
PHLPP1
To further define the molecular mechanism how cytoplasmic Scrib activates the
PI3K/AKT pathway, two PI3K phosphatases: phosphatase and tensin homolog (PTEN)
and PH domain leucine-rich repeat-containing protein phosphatase 1 (PHLPP1) were
chosen as candidates for further analysis. Previous studies already illustrated an
interaction between Scrib and PTEN in breast cancer cells and between Scrib and
PHLPP1 in colon cancer cells [42, 72]. For this reason, I hypothesized that cytoplasmic
Scrib activates PI3K/AKT pathway via physical interactions with PHLPP1 or PTEN in
HCC cells. Interestingly, Co-IP experiments confirmed the bindings of both Scrib
isoforms (ScribWT
and ScribP305L
) with both phosphatases (PHLPP1 and PTEN).
However, no significant difference in the binding capacity was detectable, indicating that
Scrib localization did not change the binding properties with PHLPP1 and PTEN (Figure
17A, B).
Because the Scrib localization did not affect PTEN/PHLPP1 binding, it was interesting to
analyze if and how both phosphatases were involved in the regulation of AKT in HepG2
cells. To first confirm the inhibitory effect of PHLPP1 and PTEN on AKT
phosphorylation and activity, a siRNA-mediated knockdown of PHLPP1, PTEN and both
phosphatases was carried out. Silencing of PTEN or PHLPP1 resulted in a 1.6-fold and a
1.2-fold increase in phospho-AKT, respectively. The strongest effect on AKT
phosphorylation was detectable after combined PTEN/PHLPP1 inhibition (1.9-fold
increase, Figure 17C). These results confirmed the relevance of both phosphatases in the
regulation of AKT. However, how the phosphatases affect AKT activation in HCC cells
was unclear.
Although ScribWT
and ScribP305L
didn't show differential binding to PHLPP1 and PTEN,
the subcellular localizations of Scrib/PHLPP1/PTEN complexes, which is closely
associated with the activity of both phosphatases, might vary. For example, post-
translational modifications of PTEN at its membranous-associated PDZ domain led to
changed protein stability [73]. For this reason, the subcellular localizations of PHLPP1

RESULTS
69
and PTEN were compared in both cell lines stably expressing ScribWT
and ScribP305L
by
western immunoblotting. Indeed, PHLPP1 and PTEN were predominately reduced in the
membranous fractions of ScribP305L
-expressing cells (PTEN: 67% reduction; PHLPP1:
62% reduction, Figure 17D). The possibility of transcriptional regulation of PHLPP1 and
PTEN in these cells was excluded by real-time PCR (Figure 17E).
In cells with cytoplasmic Scrib, PHLPP1 and PTEN levels were reduced especially at the
plasma membrane, which may be associated with decreased protein stabilities. To further
analyze the impact of cytoplasmic Scrib on PHLPP1 and PTEN stability, protein lysates
were collected at different time points after the administration of protein synthesis
inhibitor CHX. Indeed, both PHLPP1 and PTEN were degraded much faster in the cells
expressing ScribP305L
than ScribWT
. The half-life of PHLPP1 was 6 hours in ScribWT
cells
and 3.5 hours in ScribP305L
cells. Similarly, the half-life of PTEN was 48 hours in ScribWT
cells and 32 hours in ScribP305L
cells (Figure 17F). In order to figure out if the decreased
phosphatase stability was due to the increased proteasomal activity, ScribWT
cells and
ScribP305L
cells were treated with proteasome inhibitor MG132 to block protein
degradation. Interestingly, both phosphatases PHLPP1 and PTEN were obviously
increased in ScribP305L
cells but not in ScribWT
cells (Figure 17G). Moreover,
immunoprecipitation analysis of PHLPP1 and PTEN detected higher amount of
ubiquitinated PHLPP1 and PTEN in ScribP305L
cells compared to ScribWT
cells (Figure
17H).
These results revealed that the interaction between membranous and cytoplasmic Scrib
PHLPP1 and PTEN at specific subcellular locations. In addition, cytoplasmic-localized
Scrib leads to augmented degradation of PHLPP1 and PTEN via ubiquitination, which
eventually activates PI3K/AKT-mediated signaling.

RESULTS
70
Figure 17: Cytoplasmic Scrib destabilizes the phosphatases PTEN and PHLPP1. (A) Co-IP
experiments illustrate the interactions between PHLPP1 with ScribWT
and ScribP305L
. Scrib was
precipitated using an antibody against GFP. (B) Co-IP experiments demonstrate the interactions
between PTEN with ScribWT
and ScribP305L
. For (A) and (B), equal amounts of IgG antibody were
used as negative controls. (C) Western immunoblot of phospho-AKT after siRNA-mediated inhibition
of PTEN and PHLPP1. Bar chart shows the normalized results from 3 independent experiments.
Nonsense siRNA (NS) was used as a control. (D) Protein analysis of PHLPP1 and PTEN in
membranous and cytoplasmic protein fractions. Na+-K
+-ATPase and ß-tubulin served as the loading
controls for membranous and cytoplasmic fractions respectively. (E) Real-time PCR compares the
mRNA levels of PHLPP1 or PTEN in ScribWT
and ScribP305L
cells. (F) CHX protein stability assays of
PHLPP1 and PTEN in cells expressing ScribP305L
. Polynomial regression graphs for PHLPP1 and
PTEN were plotted from 3 independent experiments. (G) Cells were treated with MG132 (1 μM)
overnight before protein isolation. DMSO served as a negative control. (H) Cells were pre-treated
with MG132 (1 μM) overnight. For PHLPP1, protein was isolated under denatured condition, and
detected with ubiquitination antibody. For PTEN, protein was precipitated with ubiquitin and detected
with PTEN antibody. IP: immunoprecipitation, IB: immunoblotting.

RESULTS
71
5.7 Identification of target genes induced by cytoplasmic Scrib
To identify the functional relevant downstream effector mechanisms of cytoplasmic
Scrib, transcriptome analysis of cells stably expressing of ScribWT
and ScribP305L
was
performed. For each RNA sample, three biological replicates were analyzed. Genes with
changes ≥1.6 fold or ≤0.63 fold and with adjusted P-value ≤0.05 were selected.
According to these criteria, 81 upregulated genes and 54 downregulated genes were
found in ScribP305L
expressing cells. KEGG database was used to for the network
enrichment analysis of gene signatures and the GeneCards database was used for the
functional annotation of selected genes [74, 75].
Two groups of target genes (downregulated or upregulated) were selected according to
their differential expression in ScribP305L
-positive cells compared to ScribWT
-positive
cells. In the group of downregulated genes (n=54), three genes were described to be the
WNT pathway inhibitors (BICC1, DKK1 and DKK4) according to the functional
annotation by GeneCards database (Figure 18). In the group of positively regulated genes
(n=81), 19 genes (23%) were related to cell invasion/migration according to the
functional annotation and relevant publications. These 19 genes play a role in epithelial-
mesenchymal transition (EMT), tumor extracellular matrix (ECM) remodeling and actin
reorganization (Figure 19).
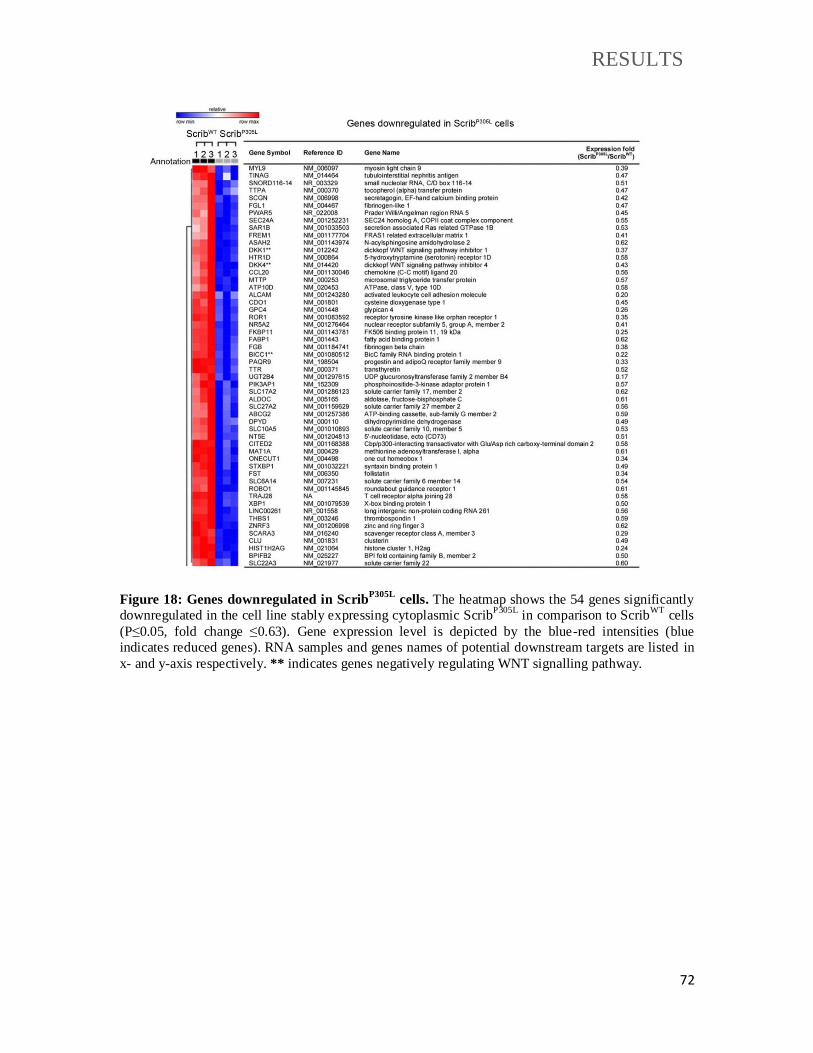
RESULTS
72
Figure 18: Genes downregulated in ScribP305L
cells. The heatmap shows the 54 genes significantly
downregulated in the cell line stably expressing cytoplasmic ScribP305L
in comparison to ScribWT
cells
(P≤0.05, fold change ≤0.63). Gene expression level is depicted by the blue-red intensities (blue
indicates reduced genes). RNA samples and genes names of potential downstream targets are listed in
x- and y-axis respectively. ** indicates genes negatively regulating WNT signalling pathway.

RESULTS
73
Figure 19: Genes upregulated in ScribP305L
cells. Heatmap shows 81 genes significantly upregulated
in the cell line stably expressing cytoplasmic ScribP305L
in comparison to ScribWT
cells (P≤0.05, fold
change≥1.60). Gene expression level is depicted by the blue-red intensities (red indicates upregulated
genes). Among the 81 upregulated genes, 19 genes (indicated by *) play have been described in the
regulating cell motility, EMT, or related to tumor ECM remodelling.

RESULTS
74
Considering the gene expression levels induced by cytoplasmic Scrib, as well as the
importance of genes in cell invasion/migration, eight out of 19 genes were selected for
further analysis. For example, increased N-cadherin levels may affect cell-cell junctions
and the induction of cell invasiveness [76]. Both carcinoembryonic antigen-related cell
adhesion molecule 1 (CEACAM1) and melanoma cell adhesion molecule (MCAM) are
cell adhesion molecules, which are known inducers of EMT and tumor invasiveness [77].
Fascin 1 has important function in the bundling of actin filament, which induces the
filamentous actin (F-actin) in invading cells [78]. Secreted protein acidic and cysteine
rich (SPARC, synonym: Osteonectin), TIMP metallopeptidase inhibitor 1 (TIMP1),
TIMP metallopeptidase inhibitor 2 (TIMP2) and S100 calcium binding protein A10
(S100A10) are secreted factors that play roles in the remodeling of tumor ECM [79-81].
Real-time PCR were carried out to confirm the overexpression of these invasion-
associated genes in ScribP305L
and ScribWT
cells. As expected, all the selected genes were
significantly elevated in the ScribP305L
cells compared to ScribWT
cells with SPARC
showing the highest induction (133-fold increase, Figure 20A). To confirm increased
SPARC secretion in ScribP305L
cells, a SPARC ELISA assay was used. The SPARC
protein levels were 6.5-fold higher in cultured medium of ScribP305L
positive cells (15
ng/ml), compared to ScribWT
positive cells (2 ng/ml) (Figure 20C). In addition, the
overexpression of N-cadherin, CEACAM1 and Fascin 1 at protein levels were confirmed
by western immunoblotting (Figure 20B).
Because it is known that the upregulation of N-cadherin is often accompanied by the
downregulation of E-cadherin in the process of EMT in epithelial cells [76], I tested the
localization of both cadherins by immunofluorescence. In ScribWT
expressing cells, E-
cadherin was clearly localized near the plasma membrane, while in the ScribP305L
cells, E-
cadherin predominantly showed a cytoplasmic localization. On the other hand, the
ScribP305L
expressing cells showed a strong membranous stain for N-cadherin, which was
much weaker in the ScribWT
cells (Figure 20D). These data demonstrate that cytoplasmic
Scrib induces an EMT-like phenotype partly via the regulation of cadherin adhesion
molecules.

RESULTS
75
Because SPARC showed the strongest induction on mRNA and protein levels in cells
expressing cytoplasmic ScribP305L
, this factor was chosen for further analyses. SPARC
has been shown to mediate the interaction of cell surface molecules and extracellular
collagen fibers, leading to the induction of tumor cell invasion in the surrounding ECM
[82]. For this reason, invasion assays with recombinant SPARC protein were performed
to confirm the regulatory effect of SPARC. As previously demonstrated, ScribWT
-
expressing cells with low-SPARC levels showed a low invasive capacity (Figure 14D).
Administration of recombinant SPARC significantly induced the invasiveness of ScribWT
expressing cells (Figure 20E). In addition, the invasive capacity of ScribP305L
expressing
cells, which have a high basal invasion potential, was suppressed when SPARC
expression was inhibited by the siRNA (Figure 20F).
Taken together, these results demonstrate that overexpression of cytoplasmic Scrib
induces tumor invasiveness via the upregulation of genes, including SPARC, which are
involved in EMT and ECM remodelling.

RESULTS
76
Figure 20: Cytoplasmic Scrib induces HCC cell invasiveness. (A) Real-time PCR analysis confirms
the overexpression of the eight selected genes, which are involved in EMT and cell migration (N-
cadherin, CEACAM1, Fascin1, SPARC, TIMP1, TIMP2, and S100A10). Mann-Whitney U test was
performed (P≤0.01). (B) Western immunoblot analysis confirms increased amounts of N-cadherin,
CEACAM1 and Fascin 1 in the cells expressing ScribP305L
. (C) Human SPARC Quantikine ELISA
assay was used to detect SPARC in the supernatant of cultured ScribP305L
expressing cells in
comparison to ScribWT
expressing cells. Supernatant was collected from stable cell lines under
starvation condition after 12 hours. (D) Immunofluorescence stains of N-cadherin and E-cadherin
illustrates the overexpression of N-cadherin and the cytoplasmic localization of E-cadherin in
ScribP305L
cells. Magnification: 400-fold. Scale bars: 40 μm. (E) Cell Invasion was measured 96 hours
after SPARC stimulation. Cells were stained with crystal violet (blue color). (F) Invasion assays
illustrate the SPARC-induced cell invasion was abolished after siRNA-mediated silencing of SPARC
in ScribP305L
cells. The outer wells were supplemented with full FCS. Invasion was measured 72 hours
after transfection. For (E) and (F), photos were taken under 100-fold magnification, scale bars: 200
µm. Invading cells were counted in seven different visual fields under 40-fold magnification.

RESULTS
77
5.8 The role of AP1 family in regulating cytoplasmic Scrib-target
genes
AP1 transcriptional factors are activated by extracellular stimuli and stress, such as
cytokines and growth factors. It can be activated by a variety of intracellular signaling
pathways, e.g., JNK, ERK,p38 and AKT [83]. In order to define the transcriptional
factor, which accounts for the upregulation of Scrib-target genes via AKT, the AP1
family constituents (c-Jun, ATF2 and JunB) were compared in nuclear fractions of cells
stably expressing ScribWT
or ScribP305L
. Both increased total and phosphorylated protein
levels of c-Jun and JunB were observed, while induced phosphorylated level without
changing the total amount of ATF2 was detected in the cells expressing ScribP305L
(Figure
21A). To test if Scrib affects the transcription of AP1 family constituents, real-time PCR
was performed to compare c-Jun, ATF2, and JunB mRNA levels. Interestingly, c-Jun was
transcriptional upregulated in ScribP305L
expressing cells, while ATF2 and JunB were not
affected (Figure 21B).
In the next step, I evaluated the regulatory effect of these AP1 family members on
cytoplasmic Scrib-target genes by siRNA-mediated gene silencing in ScribP305L
expressing cells. After c-Jun silencing, S100A10 was repressed, however, the other
potential target genes were not drastically regulated at all or slightly induced (Figure
21C). After ATF2 inhibition, SPARC, TIMP2 and MCAM were reduced, while Jun-B
silencing led to diminished SPARC, TIMP1, TIMP2, CEACAM, S100A10 and MCAM
transcript levels (Figure 21D/E). Especially, the impact of ATF2 and Jun-B on SPARC
protein secretion in cells stably expressing ScribP305L
was confirmed using the SPARC
ELISA assay (Figure 21F).

RESULTS
78
Figure 21: Scrib target genes are regulated by transcription factor AP1 subunits. (A) Western
immunoblotting shows the differences of total and phosphorylated c-Jun, JunB and ATF2 in the
nuclear fraction of ScribP305L
expressing cells in comparison to ScribWT
expressing cells. (B) Real-time
PCR reveals an upregulation of c-Jun at the mRNA level in cells stably expressing ScribP305L
in
comparison to cells stably expressing ScribWT
. No differences were detected for ATF2 or JunB. (C)
Real-time PCR analysis after c-Jun inhibition in ScribP305L
expressing cells. Significantly regulated
genes were S100A10 (-63%) and TIMP2 (-24%). (D) Real-time PCR of ScribP305L
expressing cells
after ATF2 silencing. Significantly regulated genes were: SPARC (-73%), TIMP2 (-39%) and MCAM
(-33%). (E) Real-time PCR analysis after JunB inhibition in ScribP305L
expressing cells. Significantly
regulated genes were SPARC (-26%), TIMP1 (-38%), TIMP2 (-38%), CEACAM1 (-55%), S100A10
(-49%) and MCAM (-50%). (F) SPARC ELISA assay confirms reduced secretion of SPARC after
ATF2 (-66%) or JunB (-29%) silencing. The siRNA treatment was performed under full FCS
condition. Supernatant were collected from cells after starvation for 12 hours. SPARC concentrations
in ScribP305L
and ScribWT
cells were determined using the SPARC Quantikine ELISA assay (3
independent repetitions). For (C), (D), (E) and (F), UTC: untreated cells, NS: nonsense siRNA
control. Statistical test: Mann-Whitney-U test.

RESULTS
79
To test if the AP1 subunits regulate SPARC expression through direct promoter binding,
ChIP analyses were carried out in cell lines stably expressing ScribWT
and ScribP305L
lines. Two different potential AP1 binding sites were predicted by the JASPAR database
(Figure 22A). The first site was located upstream of the transcriptional start (position -
469 to -360). The second one was located within the second exon of SPARC (position
+1890 to +1998) [84]. Primers were designed to detect these two potential binding sites,
while primers that recognize an unspecific sequence downstream of the SPARC gene
were designed as negative control (position +16083 to +16191). The c-Jun ChIP analysis
revealed binding of c-Jun at the second binding site of the SPARC gene in the ScribP305L
expressing cells (Figure 22B). The ATF2 ChIP analysis demonstrated binding between
ATF2 with both potential binding sites in the SPARC gene (Figure 22C). Similar to c-
Jun, binding of JunB was detectable at the second binding site in the SPARC gene
(Figure 22D). Importantly, none of these interactions between AP1 family members and
the SPARC promoter were found in ScribWT
expressing cells (Figure 22B-D).
Together, these data suggest that cytoplasmic Scrib induces invasion-associated genes via
activation of the AP1 transcriptional factors ATF2 and JunB. Interestingly, c-Jun also
binds to the SPARC promoter. However, this AP1 family member negatively regulates
SPARC expression.
RESULTS
80
Figure 22: Interaction of the AP1 family member c-Jun, ATF2 and JunB with the SPARC promoter. (A) Scheme of two AP1 binding sites in the human SPARC gene promoter region. Primers
used for ChIP analysis are indicated with grey arrows. (B) Real-time PCR for c-Jun ChIP analysis in
cells stably expressing ScribWT
and ScribP305L
. (C) Real-time PCR for ATF2 ChIP analysis in cells
stably expressing ScribWT
and ScribP305L
. (D) Real-time PCR for JunB ChIP analysis in cells stably
expressing ScribWT
and ScribP305L
. For (B), (C) and (D), the amount of precipitated DNA was
normalized to a standard curve of genomic DNA. Statistical test: Mann-Whitney-U test.
5.9 Cytoplasmic Scrib promotes c-MYC-induced tumor
formation
Previous studies illustrated that cytoplasmic Scrib also facilitates oncogenic properties
[42]. For this reason, mouse experiments were carried out to define the oncogenic
potential of cytoplasmic ScribP305L
in comparison to ScribWT
after their stable genomic
integration in non-malignant hepatocytes in vivo by using HDTV injection. For this,
human ScribWT
and ScribP305L
were cloned into pT3-EF1α vectors, which allowed the
integration of genes in hepatocytes after co-expression of the transposase SB in mice

RESULTS
81
(HDTV injection gene delivery technique). Two ml of plasmids diluted in PBS were
injected into lateral tail-vein of each mouse in 7-10 seconds. Increased pressure in liver
vessels forced the entry of plasmids through highly permeable capillary endothelium into
injured hepatocyte [64, 85].
We hypothesized that c-MYC overexpression might be necessary for Scrib to gain its full
oncogenic properties, because c-MYC is frequently co-amplified with Scrib at the
chromosome 8q.24 [86]. For this reason, the pT3-EF1α-c-MYC vector was co-injected
with pT3-EF1α-hScribWT-GFP or pT3-EF1α-hScribP305L-GFP vectors. An IRES sequence
in the pT3-EF1α-hScribWT-GFP and pT3-EF1α-hScribP305L constructs allowed the co-
expression of GFP and Scrib isoforms without the formation of fusion proteins. For this
reason, GFP expression was used as a reporter to determine the transfection and
integration efficiency of exogenous Scrib.
Four weeks after injection, macroscopically visible tumors formed in the majority of the
mice that expressing c-MYC and hScribP305L
, whereas small and microscopically visible
lesions were found in the mice that received c-MYC alone or c-MYC/hScribWT
(Figure
23A). Increased levels of tested EMT and cell invasive signatures (SPARC, CDH2,
TIMP2), and an activation of AKT was observed in samples with c-MYC/ScribP305L
co-
expression was observed in comparison to c-MYC/ScribWT
samples (Figure 23B/C).
Notably, immunohistochemical analysis revealed a prominent induction of AKT and
ATF2 phosphorylation as well as SPARC production in the tumors induced by c-
MYC/ScribP305L
but not in control tumors (Figure 5D). Together these results indicate
that cytoplasmic Scrib selectively activates AKT in hepatocytes and supports liver tumor
formation in conjunction with another oncogene in vivo.

RESULTS
82
Figure 23: Cytoplasmic Scrib induces tumor formation after hydrodynamic gene delivery. (A)
Eight-weeks old FVB mice were injected with vectors coding for c-MYC, SB and one of IRES-GFP
(pT3-EF1α-hScribWT
-GFP, pT3-EF1α-hScribP305L
-GFP or pT3-EF1α-GFP empty vectors). Mouse
livers were collected 4 weeks after injection. Scale bar: 1 cm. (B) Scrib target gene expressions were
compared in liver tissues isolated from the mice injected with ScribWT
/c-MYC (n=4) or ScribP305L
/c-
MYC (n=4). Statistic test: Mann-Whitney U. (C) Western immunoblot analysis revealed increased
amounts of phospho-AKT in mouse livers injected with ScribWT
/c-MYC compared to the mouse livers
injected with ScribP305L
/c-MYC. The presence of GFP protein confirmed the stable integration of
Scrib-transgenes in mouse livers. (D) HE overviews and immunohistochemical analysis of pAKT,
pATF2 and SPARC in ScribP305L
/c-MYC- or c-MYC- induced liver tumor. ScribWT
/c-MYC co-
injection induced one single microscopically visible tumor, which was not suitable for histological
analysis. Tumor and surrounding healthy tissues are shown. N: normal liver, T: tumor. Photos were
taken under 200x magnification, scale bar: 50 μm. Dash lines indicate the hepatocyte-tumor border.

RESULTS
83
5.10 Cytoplasmic Scrib, AKT and ATF2 are associated with HCC
prognosis
To confirm the previous findings in HCC patients, IHC stains of Scrib, phospho-AKT, E-
cadherin and phospho-ATF2 were carried out using a HCC TMA containing human
HCCs and histologically normal livers (7 histologically normal livers, 105 HCCs).
Immunohistochemistry stains were scored by multiplying quantitative and qualitative
parameters (see Chapter 4.8.2). In the non-tumor livers and well-differentiated HCCs,
Scrib showed predominantly a membranous localization (Figure 24A). In contrast, in
poorly differentiated HCC tissues, Scrib was frequently located in the cytoplasm (Figure
24A). Because the function of Scrib depends on its localization, both membranous and
cytoplasmic Scrib were evaluated using individual scores. Phospho-AKT was
predominantly expressed in the cytoplasm of poorly differentiated HCCs, while it was
not detestable in non-tumor livers and well-differentiated HCCs. More importantly, the
expression of cytoplasmic Scrib positively correlated with the expression of phospho-
AKT (rs=0.54, p≤0.001). Phospho-ATF2 was expressed in the nuclei of HCCs, which
also had a positive correlation with cytoplasmic Scrib expression (rs=0.28, p=0.037). In
addition, E-cadherin was expressed on the plasma membrane of non-tumor livers and
well-differentiated HCCs, which is frequently lost during the process of EMT in tumor
development. Interestingly, the cytoplasmic Scrib expression negatively correlated with
the membranous expression of E-cadherin (rs=-0.49, p≤0.001) (Figure 24A).
To figure out if the IHC stains of TMAs (Scrib, phospho-AKT, phospho-ATF2 and E-
cadherin) were statistically associated with tumor de-differentiation, IHC scores for the
respective proteins were compared with HCC grading (Figure 24B). Cytoplasmic Scrib
stains correlated with a poorer tumor differentiation (rs=0.24, p=0.02), whereas
membranous E-cadherin stains correlated with a better tumor differentiation (rs=-0.21,
p=0.04). Phospho-AKT expression also showed association with tumor de-
differentiation, nevertheless this association did not reach the significance level (p=0.1).

RESULTS
84
Figure 24: Cytoplasmic Scrib correlates with AKT and ATF2 activity in human HCC tissues. (A) Representative IHC stains illustrates the association of cytoplasmic Scrib with an EMT-like
phenotype (loss of E-cadherin) and AKT pathway activation (phospho-AKT; pAKT). Exemplary IHC
stains of one non-tumorous liver, two HCC tissues with strong cytoplasmic Scrib, and two HCC
tissues with predominantly membranous Scrib are shown. Photos were taken under 400-fold
magnification (scale bars: 50 µm) and 80-fold magnification (scale bars: 200 µm). (B) Proportional
bar charts illustrate the correlation of IHC stains with tumor de-differentiation. IHC scores (0-12) were
used for the correlation with the tumor grading (0: normal liver tissue, 1: G1, 2: G2. 3: G3, 4: G4).
Spearman’s correlation was used for statistical testing. Constituents of each scoring range (high score,
medium sore and low score) are indicated with different grayscales.

RESULTS
85
The previous results strongly indicated that gene signatures induced by cytoplasmic Scrib
could be used for the identification of HCC patients, who may have a higher risk to
develop tumor metastasis. Therefore, I next aimed to correlate the gene signature
induced by cytoplasmic Scrib with HCC patient prognosis. For this, a HCC cohort
containing 91 patients with defined prognostic subgroups was applied (Figure 25). In this
HCC cohort, transcriptome expression data of patients with good or poor clinical
outcome was analyzed for the presence of gene induced by cytoplasmic Scrib [87]. Genes
identified previously as Scrib-target genes (upregulated or downregulated) in the
ScribP305L
cells were employed for Gene set enrichment analysis (GSEA). Interestingly,
the GSEA revealed a significant correlation between the ScribP305L
-induced gene
signature (n=65) and poorer patient prognosis. Furthermore, invasion-associated genes
(n=16) were selected from the upregulated genes, which again showed a significant
enrichment in HCC patients with poor prognosis (Figure 25 A, B). Vice versa, genes that
were downregulated by ScribP305L
(n=46) showed a significant association with better
HCC prognosis (Figure 25C).
Lastly, survival data from a 249 patients HCC cohort were further used for the analysis of
the eight selected Scrib-target genes SPARC, CDH2, FSCN1, CEACAM1, TIMP1,
TIMP2, S100A10 and MCAM [65]. For SPARC, CDH2, TIMP2, S100A10 and MCAM,
significant induction in HCC tissues compared to the corresponding normal livers were
detectable (Figure 26A). Moreover, the overexpression of CDH2 and MCAM in HCC
tissues positively correlated with poorer overall and recurrence-free survivals (Figure
26B). When patient data were compared with the gene expression of SPARC, CDH2,
S100A10 and TIMP2 in surrounding tissues, all ScribP305L
target genes exhibited
significant correlations with worse overall survival recurrence-free survivals (Figure 27).
To sum up, these data confirmed the association between the overexpression of
cytoplasmic Scrib with the activation of AKT and ATF2 in HCC tissues. The
overexpression of Scrib-target genes is associated with poorer prognosis in HCC patients.

RESULTS
86
Figure 25: Expression of Scrib target genes correlates with HCC prognosis. (A) GSEA and
respective heatmap of Scrib-induced target genes in the pre-defined subgroups of HCC patients with
poor or better prognosis. (B) GSEA and heatmap of invasion-associated genes selected from Scrib-
upregulated signatures in the pre-defined two subgroups. (C) GSEA and heatmap of Scrib-
downregulated signatures in both HCC subgroups. The GSEA was performed using GSEA software
provided by the Broad Institute [88]. For A-C, normalized enrichment score (NES) was used to reflect
the enrichment of signatures for each group. Statistical significance was calculated by nominal P-value
using an empirical phenotype-based permutation test. Heatmaps show the expression of Scrib-target
genes in the two subgroups of HCC patients with poorer or better prognosis.

RESULTS
87
Figure 26: Overexpression of Scrib-target genes in HCC tissues. (A) Gene transcriptome analyses
reveal that SPARC, CDH2, TIMP2, S100A10 and MCAM are significantly overexpressed in HCC
tissues compared to surrounding livers. (B) Kaplan-Meier curves illustrate that higher expression of
CDH2 (Log2 expression≥8.4) and MCAM (Log2 expression≥5.3) levels correlate with poorer overall
and recurrence-free survivals. The overexpression of SPARC in the HCC tissues does not significantly
correlate with survivals. Log-Rank test was used for the survival analyses.

RESULTS
88
Figure 27: Overexpression of Scrib-target genes in tumor-surrounding tissues correlate with poorer survivals. Kaplan-Meier curves shows higher expression of SPARC (Log2 expression≥8.7 for
overall survival, Log2 expression≥7.7 for recurrence-free survival), CDH2 (Log2 expression≥7.9),
S100A10 (Log2 expression≥9.0) and TIMP2 (Log2 expression≥5.7 for overall survival, Log2
expression≥5.4 for recurrence-free survival) mRNA levels in the tumor-surrounding tissues positively
correlate with both worse overall and recurrence-free survivals. Log-Rank test was used for the
survival analyses.

DISCUSSION
89
6. DISCUSSION
6.1 Dysregulation of cell polarity proteins defines HCC patients with
poor clinical outcome
Previous studies already identified alterations of cell polarity genes in different solid cancer cell
types. These alterations include the downregulation of polarity proteins (e.g. Dlg, Lgl and PATJ),
their overexpression (e.g. Par6, aPKC) or mislocalization (e.g. Par3, Scrib, aPKC) [33]. However,
a systematic study of EPP components and their impact on the development and progression of
HCC was missing, so far. In this study, 33 different polarity genes, which belong to the apical
Crumbs complex, the subapical Par complex, and the basolateral Scrib complex were compared
according to the expression levels in HCCs and surrounding tissues [65]. The comparison of
transcript levels in HCCs with clinical data revealed candidate polarity genes, which may act as
oncogenes (in case of overexpression) or tumor-suppressor genes (in case of downregulation).
Although this transcriptome analysis allowed the identification of dysregulated factors; it cannot
identify genes carrying mutations (e.g. point-mutations or small deletions) with direct impact on
protein functionality.
In the subgroup of overexpressed polarity genes that were associated with oncogenic properties,
Scrib, CDC42, CTNNA1 and DLG5 were identified. Their overexpression in HCCs was
associated with poor patient outcome. Notably, two of these polarity genes belong to the
basolateral Scrib complex (Scrib and DLG5), indicating the importance of this complex in
hepatocarcinogenesis. In addition, CTNNA1 (coding for α–catenin) also shows a close spatial
proximity with the Scrib complex at the AJs [89]. A previous study demonstrated the activation
of Wnt singling pathway in HCC patients with multiple intrahepatic metastasis, which was
associated with β-catenin mutations in 70-100% [16]. Although little is known about α–catenin in
HCC development, it has been suggested that this protein supports tumorigenesis via the
interaction with β-catenin and the actin cytoskeleton [90]. The GTPase CDC42, which plays an
important role in the dynamic reorganization of actin filament in migrating cells [39], was

DISCUSSION
90
overexpressed and associated with a poor HCC prognosis in our study. The oncogenic property of
CDC42 identified in my study is in agreement with a previous study, which demonstrated the
important role of CDC42 and other Rho GTPases in HCC invasion and migration [91].
In the subgroup of reduced polarity genes with potential tumor suppressive effects, CDH1
(coding for E-cadherin), LLGL1, TJP1, LIN7C, and MPP5 were identified. Their presence
correlated with a better HCC outcome. Among these polarity genes, E-cadherin has been widely
accepted as a tumor-suppressor in HCC, which is downregulated in a subgroup of HCC patients,
and is associated with Wnt pathway activation in intrahepatic metastasis [16, 92]. Like E-
cadherin, TJP1 is a major component of TJs. In HCC, loss of TJs and associated proteins (e.g.
ZO-1 and claudin) have been connected with the tumor cell dedifferentiation and early metastasis
[93]. Two other regulated factors, LIN7C and MPP5, belong to the apical Crumbs complex in
association with TJs [32]. Although little is known about the role of LIN7C and MPP5
(synonyms: PALS1) in cancer development, these two polarity proteins form a complex with the
apical localized membrane protein Angiomotin, which can inhibit mouse liver tumor formation
via the Hippo/YAP signaling pathway [49, 94].
This systematic analysis of polarity genes in HCC patient material suggested the tumor-
promoting role of the basolateral Scrib complex and the tumor-suppressing property of the apical
Crumbs complex. In many cases, the causes for the enrichment of polarity proteins from the same
complexes sharing a specific biological functionality (oncogenic or tumor-suppressive) remain
unknown. One explanation could be that individual polarity complexes may preferentially
modulate specific intracellular signaling pathways, which may affect different aspects of tumor
cell biology [33].

DISCUSSION
91
6.2 The Scrib gene is frequently amplified and Scrib protein is enriched
in the cytoplasm of HCC cells
Based on stringent selection criteria (significant overexpression and association with patient
outcome), Scrib was further analyzed for its relevance in liver cancer. My study illustrated that
Scrib overexpression in HCCs compared to normal livers was associated with poor clinical
outcome. The upregulation of Scrib was also detected in other human tumor entities (e.g. breast
cancer and lung adenocarcinoma), which confirmed the importance of Scrib in different cancer
types [95]. Interestingly, the Scrib gene is located on chromosome 8q.24.3, which is frequently
amplified in many cancer types [96, 97]. To define the cause for Scrib upregulation, Scrib
expression levels in HCC samples with 8q24.3 gains were compared with samples without
detectable genomic alterations. Indeed, transcriptional upregulation of Scrib was associated with
chromosome amplifications at 8q24.3 (see Chapter 5.1). A meta-analysis of comparative genomic
hybridization data derived from 785 HCC patients confirmed that the Scrib gene locus was
amplified in more than 40% of all HCC patients [98]. Together with my study, these illustrate
that the Scrib upregulation in HCC patients is probably due to the genomic amplification.
Analysis of Scrib localization in HCC tissues and healthy livers revealed the membranous loss
and cytoplasmic enrichment of Scrib in the majority of HCC patients, suggesting the loss of
membranous Scrib expression is one important step during liver cancer formation. Other studies
have equally observed the association between cancer development and cytoplasmic Scrib
localization. For example, disassembly of the Scrib complex led to ovarian tumor formation in
Drosophila melanogaster [99], while overexpression of cytoplasmic Scrib induced hyperplastic
nodules in mouse mammary glands [42]. A recent study showed Scrib was localized in the
cytoplasm in all analyzed HCC tissues (n=6), whereas it was mostly membranous localized in
healthy liver (3/4) [100]. These data further support that the oncogenic function of Scrib is
strictly dependent on its subcellular localization.
Previous studies have identified the membranous localization of Scrib in cells depends on its
LRR and PDZ domains [101], and mutations in these two domains led to cytoplasmic

DISCUSSION
92
mislocalization of Scrib and disturbance of epithelial polarity in Drosophila melanogaster
embryos and breast cancer cells [42, 102]. By analyzing exome sequencing data derived from the
TCGA database, two missense mutations within the LRR or PDZ domains were identified in
HCC patients (n=366). These mutations represent amino acid changes (R220W and A799V),
which are present in 2% of HCC patients [103]. Thus, mutations in LRR and PDZ domains can
be one explanation for the cytoplasmic localization of Scrib. However, the frequency of HCC
patients carrying Scrib mutations is much lower than the HCC patients with cytoplasmic-
localized Scrib (2% vs. 69%), which illustrates that other mechanism may affect the subcellular
Scrib localization in HCC cells.
Underlying liver diseases such as liver fibrosis and cirrhosis may represent one reason for the
cytoplasmic enrichment of Scrib in hepatocytes. During this pathological process, changes in the
composition of ECM due to elevated production of collagen and reorganization of cell polarity
modules is detectable [19], which might affect the release of cell polarity proteins from their
complexes. Another possible reason for Scrib mislocalization might be infection with is hepatitis
virus. So far, only the TJ-associated protein Claudin-1 has been described to interact with HCV-
derived proteins, which induces HCC invasiveness via ERK signaling pathway [104]. Scrib
stability has been connected with human papillomavirus (HPV) infection, which induces
ubiquitination and degradation of the Scrib complex [105]. However, if the infection with
hepatitis viruses is a cause for the observed cytoplasmic Scrib enrichment is not clear, yet. For
example, the analyzed HCC cohort consisted of HBV-positive cancer patients [65], however,
only a subgroup of patients showed a clear Scrib alteration. In addition, a recent study revealed
that palmitoylation of Scrib was necessary for its membranous localization [106], however, if this
secondary modification is also involved in the observed mislocalization in HCC cells has not
been analyzed, so far.

DISCUSSION
93
6.3 Cytoplasmic Scrib activates AKT signaling pathway via the
destabilization of PHLPP1/PTEN
Because one previous study identified TAZ as the downstream effector of Scrib in breast cancer
cells [50], similar effects were expected for HCC cells. However, neither was the TAZ paralogue
YAP differentially phosphorylated in the ScribWT
and ScribP305L
-expression cells, nor did
YAP/TAZ translocate into the nucleus via siRNA-mediated Scrib inhibition (see Figure 15A/B),
which suggested that Scrib may regulate different signaling pathways in a cell type-dependent
manner. Other tumor-associated signaling pathways, including ERK1/2, JNK, AKT and p38
pathways were also not significantly affected by cytoplasmic Scrib. Instead, the AKT pathway
was identified as the central downstream effector according to the used experimental setup
(Figure 15C). This result is in agreement with a study in breast cancer, in which overexpression
of ScribP305L
induced AKT-mTOR activity in cancer cells [42]. However, another breast cancer
study and a recent study in HCC identified the ERK1/2 as a downstream effector of Scrib [71,
100]. In these two studies, the ERK1/2 was dephosphorylated when ScribWT
was overexpressed
in cancer cells, although these two studies had different observations regarding the upstream
activities of ERK1/2 regulators: rapidly accelerated fibrosarcoma (RAF) and mitogen-activated
protein kinase kinase (MEK) [71, 100]. Taken into account a very early study in Drosophila
melanogaster, which identified an enhanced tumor growth after rat sarcoma (Ras) and Scrib
alterations [107], it is possible that both PI3K-AKT and Ras-ERK pathways cooperate with
cytoplasmic Scrib during tumor development. Because PI3K-AKT and Ras-ERK intensively
cross-talks with each other, e.g. phosphatidyl-inositol,3,4,5-triphosphate (PIP3) is activated by
Ras [108], it is not clear if the differential activation of the two pathways is mediated through
independent molecular mechanism. Because PI3K-AKT and Ras-ERK have a common
downstream effector (S6 protein) [108], it is possible that similar target genes and biological
processes can be induced by cytoplasmic Scrib via activation of AKT or ERK signaling.
The phosphatases PHLPP1 and PTEN were analyzed as potential upstream regulators of AKT
because they have previously been connected with Scrib in two independent studies [109, 110].
PTEN is a negative regulator of PI3K/AKT, which dephosphorylates PIP3 and therefore blocks
the recruitment and phosphorylation of AKT at cell membrane [111]. Different from PTEN,
PHLPP1 directly dephosphorylates AKT (on Ser473) and protein kinase C (PKC), and both
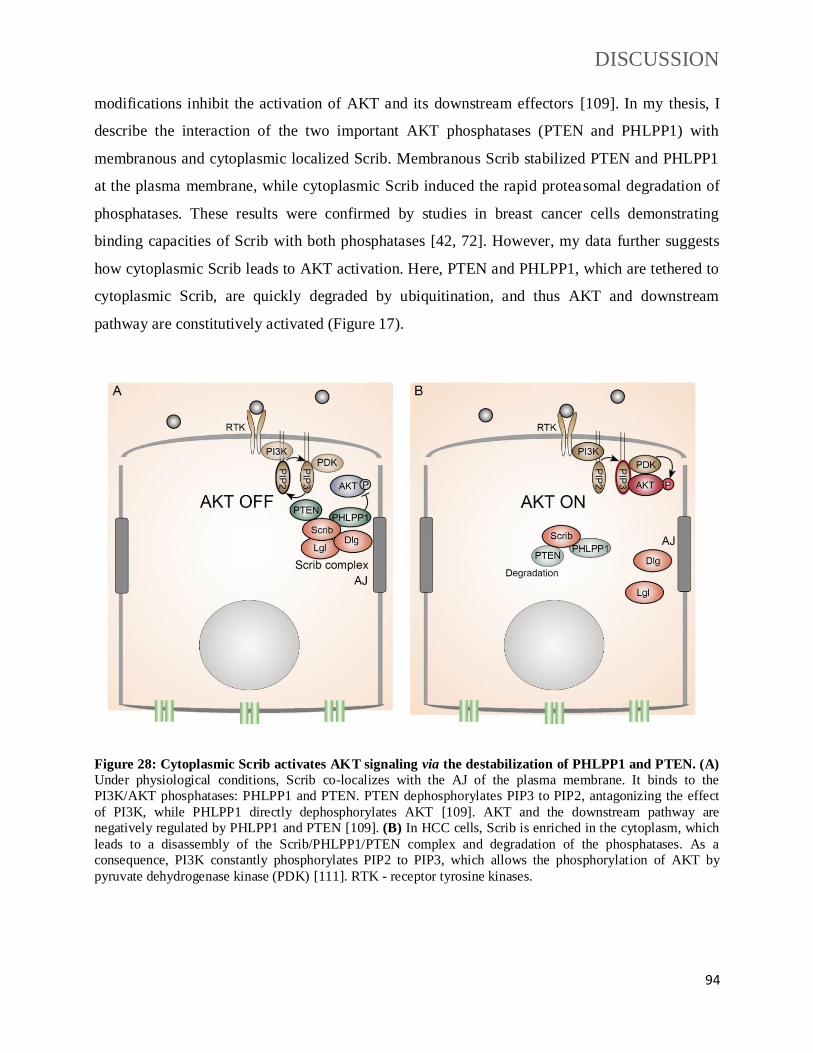
DISCUSSION
94
modifications inhibit the activation of AKT and its downstream effectors [109]. In my thesis, I
describe the interaction of the two important AKT phosphatases (PTEN and PHLPP1) with
membranous and cytoplasmic localized Scrib. Membranous Scrib stabilized PTEN and PHLPP1
at the plasma membrane, while cytoplasmic Scrib induced the rapid proteasomal degradation of
phosphatases. These results were confirmed by studies in breast cancer cells demonstrating
binding capacities of Scrib with both phosphatases [42, 72]. However, my data further suggests
how cytoplasmic Scrib leads to AKT activation. Here, PTEN and PHLPP1, which are tethered to
cytoplasmic Scrib, are quickly degraded by ubiquitination, and thus AKT and downstream
pathway are constitutively activated (Figure 17).
Figure 28: Cytoplasmic Scrib activates AKT signaling via the destabilization of PHLPP1 and PTEN. (A)
Under physiological conditions, Scrib co-localizes with the AJ of the plasma membrane. It binds to the
PI3K/AKT phosphatases: PHLPP1 and PTEN. PTEN dephosphorylates PIP3 to PIP2, antagonizing the effect
of PI3K, while PHLPP1 directly dephosphorylates AKT [109]. AKT and the downstream pathway are
negatively regulated by PHLPP1 and PTEN [109]. (B) In HCC cells, Scrib is enriched in the cytoplasm, which
leads to a disassembly of the Scrib/PHLPP1/PTEN complex and degradation of the phosphatases. As a
consequence, PI3K constantly phosphorylates PIP2 to PIP3, which allows the phosphorylation of AKT by
pyruvate dehydrogenase kinase (PDK) [111]. RTK - receptor tyrosine kinases.

DISCUSSION
95
6.4 Cytoplasmic Scrib induces a signature associated with invasiveness
in HCC
Functional analyses in the cell lines expressing ScribWT
and ScribP305L
revealed a moderate
induction of proliferation and suppression of apoptosis. More strikingly, a strong induction of the
cell invasive capacity was detected after cytoplasmic Scrib overexpression (Figure 14). In
addition, transcriptome analysis of ScribWT
and ScribP305L
expressing cells revealed the
dysregulation of invasion-associated genes in cells with cytoplasmic Scrib. These genes include
cell surface adhesion molecules (N-cadherin, CEACAM1, and MCAM), an actin bundle
component (Fascin1) and secreted factors (SPARC, TIMP1/2 and S100A10). Among these
genes, upregulation of N-cadherin counteracts E-cadherin, which is defined as a so-called
"cadherin switch" in the progression of EMT [76]. Another example for a ScribP305L
-induced and
pro-invasive gene is Fascin. This actin binding protein facilitates the dynamic reorganization of
actin filament at the protruding filopodia, which is found at the leading edge of migrating cells
[112]. Fascin was previously found as a target of the EMT-associated transcriptional factor Zinc
finger protein SNAI2, which promoted tumor growth in K-Ras overexpressed mice, and was
associated with early metastasis in pancreatic cancer patients [113]. Among the other identified
and ScribP305L
-induced genes with pro-invasive capacity TIMP1 and TIMP2, which can regulate
the tumor microenvironment via the interaction with matrix metalloproteinases (MMPs), were
found [114].
Previous studies discussed the tumor-supporting impact of Scrib in cancer development in the
context of tumor cell proliferation, cell apoptosis as well as EMT [71, 115-117]. For example,
loss of Scrib was found to induce cell proliferation via the induction of G1 to S phase cell cycle
transition [116, 117]. Regarding cell invasiveness, which was the most promising aspect from my
analysis; previous studies have focused on the role of membranous Scrib in inhibiting tumor cell
invasion and EMT [117, 118]. Loss of Scrib induced a highly invasive tumor phenotype in
Drosophila melanogaster in combination with Ras overexpression [115]. It has also been
illustrated that this effect of membranous Scrib was dependent on its interaction with βPIX,
which is a GEF protein specifically activating CDC42 and RAC1 [118, 119]. However, a
different mechanism was described in breast cancer through the negative regulation on ERK
pathway and Zinc finger E-box binding homeobox (ZEB) transcriptional factors [71]. These

DISCUSSION
96
studies suggest that membranous-localized Scrib may inhibit EMT/cell invasion, while my results
further demonstrate that cytoplasmic-localized Scrib may promote these invasiveness via the
activation of genes involved in EMT, actin reorganization and ECM remodeling. In addition, the
secreted factors (SPARC, TIMP2 and S100A10), which were upregulated by cytoplasmic Scrib,
were associated with worse clinical outcome of HCC patients (Figure 27).
6.5 SPARC in liver microenvironment induces HCC invasiveness
SPARC was identified as one of the most interesting target gene induced by cytoplasmic Scrib.
Functional analysis of HCC cell lines under different culture conditions with various SPARC
levels demonstrated the indispensable role of this factor in inducing HCC cell invasiveness.
SPARC has important functions in the formation of collagen fibrils (I and IV) and mediating the
interaction between cells and ECM [120]. Depletion of SPARC in mice caused reduced
expression and stability of collagen fibers [121]. For this reason, SPARC-knockout led to
embryonic lethality in Drosophila melanogaster due to the incomplete formation of basal lamina
[122]. However, SPARC is also important in tumor development, especially in promoting
migration and metastasis. Mice lacking SPARC showed increased resistant to skin papillomas
under the UV exposure [123], while SPARC-knockout mice had reduced lung metastasis
compared to the mice with normal SPARC expression in a breast cancer xenograft mouse model
[81].
Difference studies identified multiple mechanisms explaining how SPARC can increase tumor
cell invasion/metastasis and changes in ECM composition. These mechanisms include changes in
the EMT process, enhanced integrin adhesion, and ECM remodeling [124-126]. SPARC was
identified to activate the EMT-associated transcription factor SNAI2 in melanoma cells [124],
and to decrease cell adhesion by reorganizing integrin subunits important for ovarian tumor cell
invasion/metastasis [127]. Another study detected the interaction of SPARC with vascular cell
adhesion molecule 1 (VCAM) on vascular endothelial cells, which increased vascular
permeability via activation of the p38 pathway, and promoted melanoma metastasis in a
xenograft mouse model [125]. Nevertheless, there are contradicting results about the role of
SPARC in tumor development. For example, SPARC inhibited tumor cell proliferation and

DISCUSSION
97
induced cell cycle arrest via the TGF-β/Smad pathway in lung epithelial cells [128], and
suppressed the activation of AKT pathway in ovarian cancer cells [127]. Thus, the potential
tumor-supporting role of SPARC must be evaluated for each individual tumor entity under a
certain pathological process.
In case of HCC, previous findings support our results that SPARC acts as a positive regulator on
liver cancer progression [129, 130]. SPARC was found to be overexpressed in poorly
differentiated HCC tissues compared with non-tumor livers [130]. It was also shown that the CpG
islands in the SPARC promoter were hypo-methylated in HCC primary cells, which could
explain increased SPARC levels in HCC cells [129]. Interestingly, SPARC is already detectable
in fibrotic livers, suggesting that early mechanisms in cancer development are responsible for its
overexpression [2, 131]. Studies in fibrotic livers together with the early study in HCC described
an enrichment of SPARC in liver myofibroblast, which develop from liver stellate cell under
inflammatory conditions [2, 130, 131]. Based on these data, SPARC secreted by myofibroblasts
may induce liver cancer progression in a paracrine manner. My data further illustrate that liver
cancer cells can also produce SPARC after disturbance of cell polarity and cytoplasmic
enrichment of Scrib.
6.6 Mislocalization of Scrib activates the AP1 family members ATF2
and JunB
Because cytoplasmic Scrib activated the AKT signaling pathway and cell invasion/migration-
associated genes, I asked, which transcription factors were responsible for the upregulation of
ttarget genes induced by AKT pathway. It is known that the cytokine and growth factor-induced
AP1 protein family is sensitive to extracellular stimuli and is activated by a variety of
intracellular signaling pathways such as the JNK, ERK,p38 MAPK and AKT pathways [83]. I
therefore hypothesized that AP1 family members might play a key role in the regulation of
ScribP305L
-induced target genes via activation of AKT signaling. Indeed, my results demonstrated
a higher activity of the AP1 proteins ATF2, JunB and c-Jun in ScribP305L
cells, indicating that
AP1 family members may act as important regulators of SPARC transcription in the HCC cells.

DISCUSSION
98
Next, the binding capacity of the AP1 proteins ATF2 and c-Jun at the SPARC promoter was
analyzed. AP1 family members belong to leucine zipper-containing transcription factors, which
binds to DNA as homo- or heterodimers. C-Jun is regarded as a central protein of AP1 family,
which can interact with both ATFs and Fos subgroup members. These subgroups recognize
distinct AP1 dimer binding site. Jun/Fos dimers bind to a 7 bp DNA palindromic sequence (5’-
TGAGTCA-3’ or 5’-TGACTCA-3’) [132], while ATF2 directly binds to a 8 bp palindrome (5’-
TGACGTCA-3’) [133]. Interestingly, different AP1 family members also facilitate distinct
biological processes dependent on the composition of the dimer and the cell types [134, 135]. For
example, c-Jun plays an important role in the regulation of cell cycle and apoptosis, which can be
antagonized by JunB [134]. This suggests that the composition of AP1 dimers might affect the
migratory response of HCC cells as illustrated by the different impacts of AP1 constituents on
SPARC transcription.
ChIP analyses performed in my thesis showed binding of both JunB and c-Jun at the SPARC
promoter/enhancer region, which contains the described 7 bp binding motif (binding site 2) in
cells overexpressing ScribP305L
. Notably, siRNA-mediated c-Jun inhibition revealed its negative
regulatory impact on SPARC secretion, which illustrated that c-Jun may act as a repressor for
SPARC expression. This was confirmed by a previous study showing that SPARC transcription
was repressed by a viral homolog v-Jun in Drosophila melanogaster SL2 cells [136]. In contrast,
JunB induced SPARC transcription, demonstrating that this AP-1 subunit served as a positive
regulator in the used cell system. In addition to c-Jun and JunB, another AP1 protein ATF2,
which showed the strongest impact on SPARC expression, bound to both potential binding sites
in the SPARC promoter/enhancer. This result was in agreement with a large-scale promoter array
analysis, which identified the interaction between ATF2 and SPARC promoter after cisplatin
treatment [137], Notably, the second binding site was a 7-bp palindrome for Jun/Fos subgroups
instead of ATF2, suggesting that the binding of ATF2 at the SPARC promoter/enhancer was
probably due to other binding partners of the AP-1 dimers.

DISCUSSION
99
Figure 29: Summarizing scheme of how cytoplasmic Scrib induces tumor metastasis and EMT via
activation of AKT pathway and AP1 transcriptional factors. (A) When Scrib locates to the plasma
membrane, PHLPP1/PTEN inactivates the AKT signaling pathway in normal hepatocyte. (B) When Scrib
locates to the cytoplasm, the AKT pathway is activated, which leads to a nuclear enrichment of AP1
transcription factors ATF2 and JunB. (C) ATF2 and JunB bind to respective target gene promoters, and turn on
target gene expression important for EMT and cell invasiveness. (D) SPARC is highly expressed by cells with
cytoplasmic Scrib, which binds to membranous receptors on liver cancer cells and activates downstream
signaling pathways involved in EMT and metastasis [125]. In (A) and (B), green colored areas indicate
different subcellular regions of Scrib. In (D), SPARC is indicated in red, while other secreted factors are
presented with grey.

DISCUSSION
100
6.7 Cytoplasmic Scrib co-operates with c-MYC in supporting liver
tumor formation in mice
In this study, I analyzed the oncogenic property of cytoplasmic Scrib in combination with the
oncogene c-MYC, because c-MYC gene is located on chromosome 8q24.21 in close proximity to
the Scrib gene on 8q24.3. This genomic region is known to be frequently amplified in in HCCs
[86, 138]. Previous studies found that c-MYC amplification in HCC patients and induced tumor
formation and progression via different mechanisms, including tumor cell proliferation, apoptosis
and dedifferentiation [139, 140]. C-MYC promotes cell cycle progression through the activation
of cell cycle proteins, e.g. cyclin D, cyclin dependent kinase (CDK) 4 and CDK6 [141]. In the
liver, c-MYC expression synergized with AKT activation in promoting liver tumors after
hydrodynamic gene delivery of both oncogenes [64]. I therefore asked if the co-delivery of c-
MYC and ScribWT/P305L
isoforms (with ScribP305L
leading to AKT activation) in mouse livers
could affect c-MYC-dependent tumor formation in polarized hepatocytes.
Indeed, my data in hydrodynamic tail-vein (HDTV) mouse model demonstrated that cytoplasmic
Scrib cooperates with c-MYC in hepatocarcinogenesis already in early phases of tumor
development. These results are in line with a study in breast cancer, which analyzed the effect of
cytoplasmic Scrib in mammary glands [42]. This study detected frequent occurrence of
hyperplastic lesions and development of malignant tumors after a long-term overexpression
ScribP305L
for two years [42]. The results generated in my thesis, show that the co-expression of
cytoplasmic Scrib and c-MYC accelerates tumor formation in hepatocytes, since first solid cancer
nodules were detectable after 6-8 week. This rapid process is interesting since stable integration
of the injected vectors is achieved in was about 2%-10% of all hepatocytes [64]. Importantly,
HDTV-induced tumor models resemble the human situation of liver cancers, where tumor lesions
are derived from single cells with several genomic alterations [64].
Most studies in vivo paid special attention to the activity of membranous Scrib instead of
cytoplasmic Scrib in cancer development. Loss of membranous Scrib resulted in an EMT-
phenotype and tumor migration in Drosophila melanogaster [99]. Another study showed that
membranous Scrib suppressed the oncogenic property of c-MYC in mammary tumor growth in a

DISCUSSION
101
subcutaneous transplantation mouse model [117]. In the recent HCC study, transgenic mice with
genetic Scrib deletion spontaneously developed liver tumors [100]. Together, these data all
illustrate the tumor-suppressive role of membranous Scrib in different independent tumor models.
However, my thesis added a new level of how cytoplasmic Scrib supports tumor development in
the liver. While mice expressing ScribWT
and c-MYC showed few and small hepatic tumors, the
ScribP305L
/c-MYC co-expression increased the number and size of macros- and microscopically
detectable tumors. These findings, together with the results from other groups, indicate that Scrib
facilitates tumor-suppressor or oncogenic functions depending on its subcellular localization.

DISCUSSION
102
6.8 Potential application of Scrib in HCC prognosis and therapy
Current studies revealed multiple functions of how polarity proteins are involved in tumor
development under pathological conditions [33]. In my study, cytoplasmic localized Scrib
showed an oncogenic property in promoting liver tumor progression, while other studies in HCC
and breast cancer focused on the tumor-suppressive role of Scrib [100, 117]. According to this
thesis, Scrib can be used as a biomarker for the classification of highly invasive HCC; however,
the localization of Scrib has to be carefully analyzed in patients. In addition, some of Scrib target
genes belong to EMT markers (e.g. CDH2 and MCAM). Together with Scrib, these EMT
markers may help to define the subgroup of HCC patients with higher risk of
migration/metastasis.
From the therapeutic point of view, re-establishment of cell polarity with membranous Scrib
localization could inhibit the progression of HCC. However, multiple factors contribute to the
overexpression of Scrib (e.g. genomic alterations), while the direct molecular cause for
cytoplasmic Scrib (mis-)localization is missing here. Current studies proposed an idea of re-
establishing cell polarity via the remodeling of liver ECM, however, irreversible fibrotic collagen
deposition in livers makes this approach clinically not feasible, so far [2]. Because
hyperactivation of AKT pathway was connected with the overexpression of cytoplasmic Scrib in
this study, this supports the idea of personalized therapeutic approach in a subgroup of patients.
These patients may benefit from an AKT/mTOR pathway-directed therapy with by FDA-
approved chemical compounds [142].
In this thesis, I also found that cytoplasmic Scrib induced signature gene expression (e.g.,
SPARC, TIMP1 and TIMP2) which was associated with remodeling of tumor microenvironment.
These secreted factors are potential targets for the development of novel therapeutic approaches
for the treatment of chronic liver disease and cancer [2]. Among these secreted factors, SPARC
showed strongest effects on cell migration/invasion, which was confirmed by independent studies
in different tumor entities [126, 127, 130]. So far, basic research for SPARC is still ongoing to
define the relevant receptors and downstream signaling pathways. For example, the VCAM
receptor, the platelet-derived growth factors (PDGF) receptor and stabilin have been identified as

DISCUSSION
103
potential SPARC-binding proteins. These receptors may differentially activate downstream
pathways involved in, proliferation and migration of tumor cells but also vascular permeability
and angiogenesis after SPARC uptake [125, 143, 144]. This thesis indicated that components
targeting at SPARC or its receptors could be beneficial for a subgroup of HCC patients with early
metastasis. Before this, a comprehensive understanding of the relevant SPARC receptors and
their respective downstream signaling pathways is necessary.

REFERENCES
104
7. REFERENCES
1. Worman, H.J., The Liver: Biology and Pathobiology. Gastrointest Endosc, 1995. 42(3): p. 284. 2. Pellicoro, A., et al., Liver fibrosis and repair: immune regulation of wound healing in a solid organ.
Nat Rev Immunol, 2014. 14(3): p. 181-94. 3. Tsukada, N., C.A. Ackerley, and M.J. Phillips, The structure and organization of the bile canalicular
cytoskeleton with special reference to actin and actin-binding proteins. Hepatology, 1995. 21(4): p. 1106-13.
4. Rappaport, A.M., Hepatic blood flow: morphologic aspects and physiologic regulation. Int Rev Physiol, 1980. 21: p. 1-63.
5. Bryant, D.M. and K.E. Mostov, From cells to organs: building polarized tissue. Nat Rev Mol Cell Biol, 2008. 9(11): p. 887-901.
6. Treyer, A. and A. Musch, Hepatocyte polarity. Compr Physiol, 2013. 3(1): p. 243-87. 7. El-Serag, H.B., Epidemiology of viral hepatitis and hepatocellular carcinoma. Gastroenterology,
2012. 142(6): p. 1264-1273 e1. 8. Altekruse, S.F., K.A. McGlynn, and M.E. Reichman, Hepatocellular carcinoma incidence, mortality,
and survival trends in the United States from 1975 to 2005. J Clin Oncol, 2009. 27(9): p. 1485-91. 9. Balogh, J., et al., Hepatocellular carcinoma: a review. J Hepatocell Carcinoma, 2016. 3: p. 41-53. 10. Asham, E.H., A. Kaseb, and R.M. Ghobrial, Management of hepatocellular carcinoma. Surg Clin
North Am, 2013. 93(6): p. 1423-50. 11. Mathurin, P. and R. Bataller, Trends in the management and burden of alcoholic liver disease. J
Hepatol, 2015. 62(1 Suppl): p. S38-46. 12. Adams, L.A., et al., The natural history of nonalcoholic fatty liver disease: a population-based
cohort study. Gastroenterology, 2005. 129(1): p. 113-21. 13. Oikawa, T., et al., Multistep and multicentric development of hepatocellular carcinoma:
histological analysis of 980 resected nodules. J Hepatol, 2005. 42(2): p. 225-9. 14. Nakano, S., et al., Investigation of resected multinodular hepatocellular carcinoma: assessment of
unicentric or multicentric genesis from histological and prognostic viewpoint. Am J Gastroenterol, 1994. 89(2): p. 189-93.
15. Zhu, A.X., et al., HCC and angiogenesis: possible targets and future directions. Nat Rev Clin Oncol, 2011. 8(5): p. 292-301.
16. Boyault, S., et al., Transcriptome classification of HCC is related to gene alterations and to new therapeutic targets. Hepatology, 2007. 45(1): p. 42-52.
17. Weiler, S.M.E., et al., Induction of Chromosome Instability by Activation of Yes-Associated Protein and Forkhead Box M1 in Liver Cancer. Gastroenterology, 2017. 152(8): p. 2037-2051 e22.
18. Shen, J., et al., Genome-wide DNA methylation profiles in hepatocellular carcinoma. Hepatology, 2012. 55(6): p. 1799-808.
19. Pinzani, M., Epithelial-mesenchymal transition in chronic liver disease: fibrogenesis or escape from death? J Hepatol, 2011. 55(2): p. 459-65.
20. Wong, R.J., et al., Increased long-term survival among patients with hepatocellular carcinoma after implementation of Model for End-stage Liver Disease score. Clin Gastroenterol Hepatol, 2014. 12(9): p. 1534-40 e1.
21. Yeo, W., et al., A randomized phase III study of doxorubicin versus cisplatin/interferon alpha-2b/doxorubicin/fluorouracil (PIAF) combination chemotherapy for unresectable hepatocellular carcinoma. J Natl Cancer Inst, 2005. 97(20): p. 1532-8.

REFERENCES
105
22. Lencioni, R., P. Petruzzi, and L. Crocetti, Chemoembolization of hepatocellular carcinoma. Semin Intervent Radiol, 2013. 30(1): p. 3-11.
23. Llovet, J.M., et al., Sorafenib in advanced hepatocellular carcinoma. N Engl J Med, 2008. 359(4): p. 378-90.
24. Bruix, J., et al., Adjuvant sorafenib for hepatocellular carcinoma after resection or ablation (STORM): a phase 3, randomised, double-blind, placebo-controlled trial. Lancet Oncol, 2015. 16(13): p. 1344-54.
25. Matter, M.S., et al., Targeting the mTOR pathway in hepatocellular carcinoma: current state and future trends. J Hepatol, 2014. 60(4): p. 855-65.
26. Laplante, M. and D.M. Sabatini, mTOR signaling in growth control and disease. Cell, 2012. 149(2): p. 274-93.
27. Wodarz, A. and I. Nathke, Cell polarity in development and cancer. Nat Cell Biol, 2007. 9(9): p. 1016-24.
28. Rodriguez-Boulan, E. and I.G. Macara, Organization and execution of the epithelial polarity programme. Nat Rev Mol Cell Biol, 2014. 15(4): p. 225-42.
29. Vasioukhin, V., et al., Directed actin polymerization is the driving force for epithelial cell-cell adhesion. Cell, 2000. 100(2): p. 209-19.
30. Shin, K., V.C. Fogg, and B. Margolis, Tight junctions and cell polarity. Annu Rev Cell Dev Biol, 2006. 22: p. 207-35.
31. Gumbiner, B.M., Cell adhesion: the molecular basis of tissue architecture and morphogenesis. Cell, 1996. 84(3): p. 345-57.
32. Bulgakova, N.A. and E. Knust, The Crumbs complex: from epithelial-cell polarity to retinal degeneration. J Cell Sci, 2009. 122(Pt 15): p. 2587-96.
33. Halaoui, R. and L. McCaffrey, Rewiring cell polarity signaling in cancer. Oncogene, 2015. 34(8): p. 939-50.
34. Hong, Y., et al., Distinct roles of Bazooka and Stardust in the specification of Drosophila photoreceptor membrane architecture. Proc Natl Acad Sci U S A, 2003. 100(22): p. 12712-7.
35. Betschinger, J., K. Mechtler, and J.A. Knoblich, The Par complex directs asymmetric cell division by phosphorylating the cytoskeletal protein Lgl. Nature, 2003. 422(6929): p. 326-30.
36. Scheffzek, K. and M.R. Ahmadian, GTPase activating proteins: structural and functional insights 18 years after discovery. Cell Mol Life Sci, 2005. 62(24): p. 3014-38.
37. Michaelson, D., et al., Differential localization of Rho GTPases in live cells: regulation by hypervariable regions and RhoGDI binding. J Cell Biol, 2001. 152(1): p. 111-26.
38. Maddox, A.S. and K. Oegema, Closing the GAP: a role for a RhoA GAP in cytokinesis. Mol Cell, 2003. 11(4): p. 846-8.
39. Iden, S. and J.G. Collard, Crosstalk between small GTPases and polarity proteins in cell polarization. Nat Rev Mol Cell Biol, 2008. 9(11): p. 846-59.
40. Atwood, S.X., et al., Cdc42 acts downstream of Bazooka to regulate neuroblast polarity through Par-6 aPKC. J Cell Sci, 2007. 120(Pt 18): p. 3200-6.
41. McCaffrey, L.M., et al., Loss of the Par3 polarity protein promotes breast tumorigenesis and metastasis. Cancer Cell, 2012. 22(5): p. 601-14.
42. Feigin, M.E., et al., Mislocalization of the cell polarity protein scribble promotes mammary tumorigenesis and is associated with basal breast cancer. Cancer Res, 2014. 74(11): p. 3180-94.
43. Knoblich, J.A., Asymmetric cell division: recent developments and their implications for tumour biology. Nat Rev Mol Cell Biol, 2010. 11(12): p. 849-60.
44. Kalluri, R. and R.A. Weinberg, The basics of epithelial-mesenchymal transition. J Clin Invest, 2009. 119(6): p. 1420-8.
45. Viloria-Petit, A.M., et al., A role for the TGFbeta-Par6 polarity pathway in breast cancer progression. Proc Natl Acad Sci U S A, 2009. 106(33): p. 14028-33.

REFERENCES
106
46. Tschaharganeh, D.F., et al., Yes-associated protein up-regulates Jagged-1 and activates the Notch pathway in human hepatocellular carcinoma. Gastroenterology, 2013. 144(7): p. 1530-1542 e12.
47. Benhamouche, S., et al., Nf2/Merlin controls progenitor homeostasis and tumorigenesis in the liver. Genes Dev, 2010. 24(16): p. 1718-30.
48. Zhao, B., K. Tumaneng, and K.-L. Guan, The Hippo pathway in organ size control, tissue regeneration and stem cell self-renewal. Nat Cell Biol, 2011. 13(8): p. 877-883.
49. Zhao, B., et al., Angiomotin is a novel Hippo pathway component that inhibits YAP oncoprotein. Genes Dev, 2011. 25(1): p. 51-63.
50. Cordenonsi, M., et al., The Hippo transducer TAZ confers cancer stem cell-related traits on breast cancer cells. Cell, 2011. 147(4): p. 759-72.
51. Zhao, B., K. Tumaneng, and K.L. Guan, The Hippo pathway in organ size control, tissue regeneration and stem cell self-renewal. Nat Cell Biol, 2011. 13(8): p. 877-83.
52. Komiya, Y. and R. Habas, Wnt signal transduction pathways. Organogenesis, 2008. 4(2): p. 68-75. 53. Gordon, M.D. and R. Nusse, Wnt signaling: multiple pathways, multiple receptors, and multiple
transcription factors. J Biol Chem, 2006. 281(32): p. 22429-33. 54. Habas, R., Y. Kato, and X. He, Wnt/Frizzled activation of Rho regulates vertebrate gastrulation
and requires a novel Formin homology protein Daam1. Cell, 2001. 107(7): p. 843-54. 55. Karasaki, S., Subcellular localization of surface adenosine triphosphatase activity in preneoplastic
liver parenchyma. Cancer Res, 1972. 32(8): p. 1703-12. 56. Kondo, Y. and T. Nakajima, Pseudoglandular hepatocellular carcinoma. A morphogenetic study.
Cancer, 1987. 60(5): p. 1032-7. 57. Gissen, P. and I.M. Arias, Structural and functional hepatocyte polarity and liver disease. J
Hepatol, 2015. 63(4): p. 1023-37. 58. Mirouse, V., et al., LKB1 and AMPK maintain epithelial cell polarity under energetic stress. J Cell
Biol, 2007. 177(3): p. 387-92. 59. Kim, D.H., et al., Synthetic dsRNA Dicer substrates enhance RNAi potency and efficacy. Nat
Biotechnol, 2005. 23(2): p. 222-6. 60. Edelheit, O., A. Hanukoglu, and I. Hanukoglu, Simple and efficient site-directed mutagenesis using
two single-primer reactions in parallel to generate mutants for protein structure-function studies. BMC Biotechnol, 2009. 9: p. 61.
61. Dai, M., et al., Evolving gene/transcript definitions significantly alter the interpretation of GeneChip data. Nucleic Acids Res, 2005. 33(20): p. e175.
62. Artym, V.V. and K. Matsumoto, Imaging cells in three-dimensional collagen matrix. Curr Protoc Cell Biol, 2010. Chapter 10: p. Unit 10 18 1-20.
63. Kaboord, B. and M. Perr, Isolation of proteins and protein complexes by immunoprecipitation. Methods Mol Biol, 2008. 424: p. 349-64.
64. Chen, X. and D.F. Calvisi, Hydrodynamic transfection for generation of novel mouse models for liver cancer research. Am J Pathol, 2014. 184(4): p. 912-23.
65. Roessler, S., et al., A unique metastasis gene signature enables prediction of tumor relapse in early-stage hepatocellular carcinoma patients. Cancer Res, 2010. 70(24): p. 10202-12.
66. Roessler, S., et al., Integrative genomic identification of genes on 8p associated with hepatocellular carcinoma progression and patient survival. Gastroenterology, 2012. 142(4): p. 957-966 e12.
67. Budczies, J., et al., Cutoff Finder: a comprehensive and straightforward Web application enabling rapid biomarker cutoff optimization. PLoS One, 2012. 7(12): p. e51862.
68. Sandelin, A., et al., JASPAR: an open-access database for eukaryotic transcription factor binding profiles. Nucleic Acids Res, 2004. 32(Database issue): p. D91-4.
69. Navarro, C., et al., Junctional recruitment of mammalian Scribble relies on E-cadherin engagement. Oncogene, 2005. 24(27): p. 4330-9.

REFERENCES
107
70. Le Clainche, C. and M.F. Carlier, Regulation of actin assembly associated with protrusion and adhesion in cell migration. Physiol Rev, 2008. 88(2): p. 489-513.
71. Elsum, I.A., C. Martin, and P.O. Humbert, Scribble regulates an EMT polarity pathway through modulation of MAPK-ERK signaling to mediate junction formation. J Cell Sci, 2013. 126(Pt 17): p. 3990-9.
72. Li, X., et al., Scribble-mediated membrane targeting of PHLPP1 is required for its negative regulation of Akt. EMBO Rep, 2011. 12(8): p. 818-24.
73. Vazquez, F., et al., Phosphorylation of the PTEN tail regulates protein stability and function. Mol Cell Biol, 2000. 20(14): p. 5010-8.
74. Kanehisa, M. and S. Goto, KEGG: kyoto encyclopedia of genes and genomes. Nucleic Acids Res, 2000. 28(1): p. 27-30.
75. Belinky, F., et al., PathCards: multi-source consolidation of human biological pathways. Database (Oxford), 2015. 2015.
76. Lamouille, S., J. Xu, and R. Derynck, Molecular mechanisms of epithelial-mesenchymal transition. Nat Rev Mol Cell Biol, 2014. 15(3): p. 178-96.
77. Ebrahimnejad, A., et al., CEACAM1 enhances invasion and migration of melanocytic and melanoma cells. Am J Pathol, 2004. 165(5): p. 1781-7.
78. Jansen, S., et al., Mechanism of actin filament bundling by fascin. J Biol Chem, 2011. 286(34): p. 30087-96.
79. Wu, Z.S., et al., Prognostic significance of MMP-9 and TIMP-1 serum and tissue expression in breast cancer. Int J Cancer, 2008. 122(9): p. 2050-6.
80. Ito, Y., et al., S100A10 expression in thyroid neoplasms originating from the follicular epithelium: contribution to the aggressive characteristic of anaplastic carcinoma. Anticancer Res, 2007. 27(4C): p. 2679-83.
81. Sangaletti, S., et al., Macrophage-derived SPARC bridges tumor cell-extracellular matrix interactions toward metastasis. Cancer Res, 2008. 68(21): p. 9050-9.
82. Nagaraju, G.P., et al., Molecular mechanisms underlying the divergent roles of SPARC in human carcinogenesis. Carcinogenesis, 2014. 35(5): p. 967-73.
83. Shaulian, E. and M. Karin, AP-1 as a regulator of cell life and death. Nat Cell Biol, 2002. 4(5): p. E131-6.
84. Mathelier, A., et al., JASPAR 2014: an extensively expanded and updated open-access database of transcription factor binding profiles. Nucleic Acids Res, 2014. 42(Database issue): p. D142-7.
85. Ho, C., et al., AKT (v-akt murine thymoma viral oncogene homolog 1) and N-Ras (neuroblastoma ras viral oncogene homolog) coactivation in the mouse liver promotes rapid carcinogenesis by way of mTOR (mammalian target of rapamycin complex 1), FOXM1 (forkhead box M1)/SKP2, and c-Myc pathways. Hepatology, 2012. 55(3): p. 833-45.
86. Okamoto, H., et al., PTK2 and EIF3S3 genes may be amplification targets at 8q23-q24 and are associated with large hepatocellular carcinomas. Hepatology, 2003. 38(5): p. 1242-9.
87. Lee, J.S., et al., Classification and prediction of survival in hepatocellular carcinoma by gene expression profiling. Hepatology, 2004. 40(3): p. 667-76.
88. Subramanian, A., et al., Gene set enrichment analysis: a knowledge-based approach for interpreting genome-wide expression profiles. Proc Natl Acad Sci U S A, 2005. 102(43): p. 15545-50.
89. Kobielak, A. and E. Fuchs, Alpha-catenin: at the junction of intercellular adhesion and actin dynamics. Nat Rev Mol Cell Biol, 2004. 5(8): p. 614-25.
90. Drees, F., et al., Alpha-catenin is a molecular switch that binds E-cadherin-beta-catenin and regulates actin-filament assembly. Cell, 2005. 123(5): p. 903-15.
91. Grise, F., A. Bidaud, and V. Moreau, Rho GTPases in hepatocellular carcinoma. Biochim Biophys Acta, 2009. 1795(2): p. 137-51.

REFERENCES
108
92. Osada, T., et al., E-cadherin is involved in the intrahepatic metastasis of hepatocellular carcinoma. Hepatology, 1996. 24(6): p. 1460-7.
93. Lee, N.P. and J.M. Luk, Hepatic tight junctions: from viral entry to cancer metastasis. World J Gastroenterol, 2010. 16(3): p. 289-95.
94. Yi, C., et al., The p130 isoform of angiomotin is required for Yap-mediated hepatic epithelial cell proliferation and tumorigenesis. Sci Signal, 2013. 6(291): p. ra77.
95. Lin, W.H., Y.W. Asmann, and P.Z. Anastasiadis, Expression of polarity genes in human cancer. Cancer Inform, 2015. 14(Suppl 3): p. 15-28.
96. Sato, K., et al., Clinical significance of alterations of chromosome 8 in high-grade, advanced, nonmetastatic prostate carcinoma. J Natl Cancer Inst, 1999. 91(18): p. 1574-80.
97. Rummukainen, J., et al., Aberrations of chromosome 8 in 16 breast cancer cell lines by comparative genomic hybridization, fluorescence in situ hybridization, and spectral karyotyping. Cancer Genet Cytogenet, 2001. 126(1): p. 1-7.
98. Moinzadeh, P., et al., Chromosome alterations in human hepatocellular carcinomas correlate with aetiology and histological grade--results of an explorative CGH meta-analysis. Br J Cancer, 2005. 92(5): p. 935-41.
99. Zhao, M., et al., Basolateral junctions utilize warts signaling to control epithelial-mesenchymal transition and proliferation crucial for migration and invasion of Drosophila ovarian epithelial cells. Genetics, 2008. 178(4): p. 1947-71.
100. Kapil, S., et al., The cell polarity protein Scrib functions as a tumor suppressor in liver cancer. Oncotarget, 2017. 8(16): p. 26515-26531.
101. Albertson, R., et al., Scribble protein domain mapping reveals a multistep localization mechanism and domains necessary for establishing cortical polarity. J Cell Sci, 2004. 117(Pt 25): p. 6061-70.
102. Bilder, D. and N. Perrimon, Localization of apical epithelial determinants by the basolateral PDZ protein Scribble. Nature, 2000. 403(6770): p. 676-80.
103. Gao, J., et al., Integrative analysis of complex cancer genomics and clinical profiles using the cBioPortal. Sci Signal, 2013. 6(269): p. pl1.
104. Stebbing, J., A. Filipovic, and G. Giamas, Claudin-1 as a promoter of EMT in hepatocellular carcinoma. Oncogene, 2013. 32(41): p. 4871-2.
105. Nakagawa, S. and J.M. Huibregtse, Human scribble (Vartul) is targeted for ubiquitin-mediated degradation by the high-risk papillomavirus E6 proteins and the E6AP ubiquitin-protein ligase. Mol Cell Biol, 2000. 20(21): p. 8244-53.
106. Chen, B., et al., ZDHHC7-mediated S-palmitoylation of Scribble regulates cell polarity. Nat Chem Biol, 2016. 12(9): p. 686-93.
107. Wu, M., J.C. Pastor-Pareja, and T. Xu, Interaction between Ras(V12) and scribbled clones induces tumour growth and invasion. Nature, 2010. 463(7280): p. 545-8.
108. Mendoza, M.C., E.E. Er, and J. Blenis, The Ras-ERK and PI3K-mTOR pathways: cross-talk and compensation. Trends Biochem Sci, 2011. 36(6): p. 320-8.
109. Gao, T., F. Furnari, and A.C. Newton, PHLPP: a phosphatase that directly dephosphorylates Akt, promotes apoptosis, and suppresses tumor growth. Mol Cell, 2005. 18(1): p. 13-24.
110. Brognard, J. and A.C. Newton, PHLiPPing the switch on Akt and protein kinase C signaling. Trends Endocrinol Metab, 2008. 19(6): p. 223-30.
111. Carnero, A., et al., The PTEN/PI3K/AKT signalling pathway in cancer, therapeutic implications. Curr Cancer Drug Targets, 2008. 8(3): p. 187-98.
112. Mattila, P.K. and P. Lappalainen, Filopodia: molecular architecture and cellular functions. Nat Rev Mol Cell Biol, 2008. 9(6): p. 446-54.
113. Li, A., et al., Fascin is regulated by slug, promotes progression of pancreatic cancer in mice, and is associated with patient outcomes. Gastroenterology, 2014. 146(5): p. 1386-96 e1-17.

REFERENCES
109
114. Kessenbrock, K., V. Plaks, and Z. Werb, Matrix metalloproteinases: regulators of the tumor microenvironment. Cell, 2010. 141(1): p. 52-67.
115. Pagliarini, R.A. and T. Xu, A genetic screen in Drosophila for metastatic behavior. Science, 2003. 302(5648): p. 1227-31.
116. Nagasaka, K., et al., Human homolog of Drosophila tumor suppressor Scribble negatively regulates cell-cycle progression from G1 to S phase by localizing at the basolateral membrane in epithelial cells. Cancer Sci, 2006. 97(11): p. 1217-25.
117. Zhan, L., et al., Deregulation of scribble promotes mammary tumorigenesis and reveals a role for cell polarity in carcinoma. Cell, 2008. 135(5): p. 865-78.
118. Audebert, S., et al., Mammalian Scribble forms a tight complex with the betaPIX exchange factor. Curr Biol, 2004. 14(11): p. 987-95.
119. Osmani, N., et al., Scrib controls Cdc42 localization and activity to promote cell polarization during astrocyte migration. Curr Biol, 2006. 16(24): p. 2395-405.
120. Bradshaw, A.D., The role of SPARC in extracellular matrix assembly. J Cell Commun Signal, 2009. 3(3-4): p. 239-46.
121. Rentz, T.J., et al., SPARC regulates processing of procollagen I and collagen fibrillogenesis in dermal fibroblasts. J Biol Chem, 2007. 282(30): p. 22062-71.
122. Martinek, N., et al., Haemocyte-derived SPARC is required for collagen-IV-dependent stability of basal laminae in Drosophila embryos. J Cell Sci, 2008. 121(Pt 10): p. 1671-80.
123. Aycock, R.L., et al., Development of UV-induced squamous cell carcinomas is suppressed in the absence of SPARC. J Invest Dermatol, 2004. 123(3): p. 592-9.
124. Fenouille, N., et al., The epithelial-mesenchymal transition (EMT) regulatory factor SLUG (SNAI2) is a downstream target of SPARC and AKT in promoting melanoma cell invasion. PLoS One, 2012. 7(7): p. e40378.
125. Tichet, M., et al., Tumour-derived SPARC drives vascular permeability and extravasation through endothelial VCAM1 signalling to promote metastasis. Nat Commun, 2015. 6: p. 6993.
126. Arnold, S.A. and R.A. Brekken, SPARC: a matricellular regulator of tumorigenesis. J Cell Commun Signal, 2009. 3(3-4): p. 255-73.
127. Said, N., I. Najwer, and K. Motamed, Secreted protein acidic and rich in cysteine (SPARC) inhibits integrin-mediated adhesion and growth factor-dependent survival signaling in ovarian cancer. Am J Pathol, 2007. 170(3): p. 1054-63.
128. Schiemann, B.J., J.R. Neil, and W.P. Schiemann, SPARC inhibits epithelial cell proliferation in part through stimulation of the transforming growth factor-beta-signaling system. Mol Biol Cell, 2003. 14(10): p. 3977-88.
129. van Zijl, F., et al., A human model of epithelial to mesenchymal transition to monitor drug efficacy in hepatocellular carcinoma progression. Mol Cancer Ther, 2011. 10(5): p. 850-60.
130. Le Bail, B., et al., Osteonectin/SPARC is overexpressed in human hepatocellular carcinoma. J Pathol, 1999. 189(1): p. 46-52.
131. Blazejewski, S., et al., Osteonectin (SPARC) expression in human liver and in cultured human liver myofibroblasts. Am J Pathol, 1997. 151(3): p. 651-7.
132. Angel, P. and M. Karin, The role of Jun, Fos and the AP-1 complex in cell-proliferation and transformation. Biochim Biophys Acta, 1991. 1072(2-3): p. 129-57.
133. Hai, T.W., et al., Transcription factor ATF cDNA clones: an extensive family of leucine zipper proteins able to selectively form DNA-binding heterodimers. Genes Dev, 1989. 3(12B): p. 2083-90.
134. Reddy, S.P. and B.T. Mossman, Role and regulation of activator protein-1 in toxicant-induced responses of the lung. Am J Physiol Lung Cell Mol Physiol, 2002. 283(6): p. L1161-78.
135. Hess, J., P. Angel, and M. Schorpp-Kistner, AP-1 subunits: quarrel and harmony among siblings. J Cell Sci, 2004. 117(Pt 25): p. 5965-73.

REFERENCES
110
136. Chamboredon, S., et al., v-Jun downregulates the SPARC target gene by binding to the proximal promoter indirectly through Sp1/3. Oncogene, 2003. 22(26): p. 4047-61.
137. Hayakawa, J., et al., Identification of promoters bound by c-Jun/ATF2 during rapid large-scale gene activation following genotoxic stress. Mol Cell, 2004. 16(4): p. 521-35.
138. Schlaeger, C., et al., Etiology-dependent molecular mechanisms in human hepatocarcinogenesis. Hepatology, 2008. 47(2): p. 511-20.
139. Kawate, S., et al., Amplification of c-myc in hepatocellular carcinoma: correlation with clinicopathologic features, proliferative activity and p53 overexpression. Oncology, 1999. 57(2): p. 157-63.
140. Lin, C.P., et al., Targeting c-Myc as a novel approach for hepatocellular carcinoma. World J Hepatol, 2010. 2(1): p. 16-20.
141. Marian, C., et al., Search for germline alterations in CDKN2A/ARF and CDK4 of 42 Jewish melanoma families with or without neural system tumours. Br J Cancer, 2005. 92(12): p. 2278-85.
142. Sharlow, E.R., et al., A Small Molecule Screen Exposes mTOR Signaling Pathway Involvement in Radiation-Induced Apoptosis. ACS Chem Biol, 2016. 11(5): p. 1428-37.
143. Hirose, Y., et al., Inhibition of Stabilin-2 elevates circulating hyaluronic acid levels and prevents tumor metastasis. Proc Natl Acad Sci U S A, 2012. 109(11): p. 4263-8.
144. Brekken, R.A. and E.H. Sage, SPARC, a matricellular protein: at the crossroads of cell-matrix. Matrix Biol, 2000. 19(7): p. 569-80.

ACKNOWLEDGEMENTS
111
8. ACKNOWLEDGEMENTS
I would like to give my sincere acknowledgements to the people who have helped me to the
successful completion of my PhD thesis.
First of all, I would thank my supervisor Dr. Kai Breuhahn, who always gives valuable support
and guidance for my thesis. I learned from him how to carry out scientific research, how to solve
problems in the study of liver cancer. He also gives me great opportunities to collect ideas from
scientific conferences and meetings. With his help, I have improved my knowledge of tumor
biology, and the skills for scientific research, which is important for my further professional
career.
I would like to thank Prof. Dr. Peter Angel for the guidance of my PhD thesis. He and Dr. Marina
Schorpp-Kistner provided me the knowledge and valuable support for the study of AP1
transcriptional factors in liver cancer.
I would like to give my thanks to Dr. Federico Pinna. He gave me great guidance during the first
two years of my PhD study. I learned from him different laboratory skills, and he provided me
valuable ideas for the study of cell polarity proteins.
I would like to thank Prof. Peter Schirmacher, for giving me the opportunity to study and carry
out research in the group of AG Breuhahn of Pathology Institute.
I would like to thank my colleague Sofia Maria Elisabeth Weiler, who is always ready to help
and give me suggestions during my PhD thesis. She is always willing to share her knowledge and
experiences in the experimental work.
I would like to thank my colleague Anne-Sophie Meyer for the collection of HCC patient tissues,
and the analysis of Scrib localizations.
I would like to thank the members of AG Breuhahn, Jennifer Schmitt and Michaela Bissinger for
the valuable technical support. They are always ready to help when I have problems in my

ACKNOWLEDGEMENTS
112
experiments.
I would like to thank Dr. Stephanie Roessler who provided the HCC patient data and shared the
knowledge of hydrodynamic tail-vein injection.
I would like to thank Prof. Dr. Jens Marquardt from University Hospital of Mainz, for providing
the valuable patient materials and giving suggestions for my thesis.
I would like to thank Dr. Carsten Sticht and Prof. Dr. Norbert Gretz from Medical Faculty
Mannheim. They helped me with the trancriptome analysis, which was important for the
identification of Scrib-target genes.
I would like to thank Dr. Darjus Felix Tschaharganeh for providing the plasmids for
hydrodynamic tail-vein injection. He also gave me suggestions for the scientific research.
I would like to thank Heike Conrad, who did the immunohistochemistry stains of HCC patient
tissues and mouse tissues.
I also would like to give my thanks to the people in the department of Molecular Hepatology, Eva
Eiteneuer, Marcell Toth, Dr. Carolin Plöger, Dr. Stefan Thomann and Dr. Margarita González-
Vallinas Garrachón who helped me during the laboratory work. I enjoyed the cooperation with
these people during my PhD study.
Last but not the least; here I would like to express my gratitude and love to my husband and my
beloved parents for their support, encouragement and help to my life.

ERKLÄRUNG GEMÄß § 8 (3B, C) DER PROMOTIONSORDNUNG
Hiermit erkläre ich, dass die vorgelegte Dissertation mit dem Titel „Impact of the cell polarity
protein Scribble on liver cancer formation and progression“ selbst verfasst und mich dabei keiner
anderen als der von mir ausdrücklich bezeichneten Quellen und Hilfen bedient habe. Des
Weiteren bestätige ich, dass ich an keiner anderen Stelle ein Prüfungsverfahren beantragt bzw.
die Dissertation in dieser oder anderer Form bereits anderweitig als Prüfungsarbeit verwendet
oder einer anderen Fakultät als Dissertation vorgelegt habe.
11/07/2017, Heidelberg
Shan Wan