impact of the atlantic warm pool on united states ... · impact of the atlantic warm pool on united...
TRANSCRIPT

Impact of the Atlantic warm pool on United Stateslandfalling hurricanes
Chunzai Wang,1 Hailong Liu,1,2 Sang‐Ki Lee,1,2 and Robert Atlas1
Received 10 August 2011; revised 1 September 2011; accepted 4 September 2011; published 7 October 2011.
[1] The 2010 Atlantic hurricane season was extremelyactive, but no hurricanes made landfall in the United States,raising a question of what dictated the hurricane track. Herewe use observations from 1970–2010 (also extending backto 1950) and numerical model experiments to show thatthe Atlantic warm pool (AWP) – a large body of warm watercomprised of the Gulf of Mexico, the Caribbean Sea and thewestern tropical North Atlantic – plays an important role inthe hurricane track. An eastward expansion of the AWPshifts the hurricane genesis location eastward, decreasingthe possibility for a hurricane to make landfall. A largeAWP also induces barotropic stationary wave patterns thatweaken the North Atlantic subtropical high and producethe eastward steering flow anomalies along the eastern sea-board of the United States. Due to these two mechanisms,hurricanes are steered toward the northeast without makinglandfall in the United States. Although the La Niña event inthe Pacific may be associated with the increased number ofAtlantic hurricanes, its relationship with landfalling activityhas been offset in 2010 by the effect of the extremely largeAWP. Citation: Wang, C., H. Liu, S.-K. Lee, and R. Atlas(2011), Impact of the Atlantic warm pool on United States landfall-ing hurricanes, Geophys. Res. Lett., 38, L19702, doi:10.1029/2011GL049265.
1. Introduction
[2] Almost all of the severest hurricane‐related loss anddamage occur when hurricanes make landfall. Thus, a betterunderstanding of factors controlling hurricane’s landfall isboth scientifically and socially important. The Atlantic hur-ricane season officially starts on June 1 and ends onNovember 30. An average hurricane season, based on the datafrom 1950–2000 without considering short‐lived storms[Landsea et al., 2010], has 9.6 named storms and an accu-mulated cyclone energy (ACE) index of 96.1 (a measure ofoverall tropical cyclone activity with the unit of 104 kt2) [e.g.,Klotzbach and Gray, 2006]. Of these 9.6 storms, 5.9 arehurricanes (categories 1–5) and 2.5 are major hurricanes(categories 3–5). The average ratio between U. S. landfallinghurricanes and total hurricanes is about 25%. However, anactive hurricane season does not necessarily mean more U. S.landfalling hurricanes because the hurricane track is deter-mined by both the hurricane internal dynamics and large‐scale climate variations.
[3] The 2010 Atlantic hurricane season had 19 namedstorms, 12 hurricanes, 5 major hurricanes and an ACE indexof 166.3, all of which indicate that the 2010 season wasextremely active. However, for the 2010 hurricane season,not a single hurricane made landfall in the United States. Asshown in Figure 1a, there were 6 tropical storms and hurri-canes that made landfall in Central America, and one tropicalstorm that made landfall in Florida. But, these were largelyshort‐lived tropical storms that formed in the Caribbean Sea.Excluding those that formed in the Caribbean Sea, Figure 1bshows that tropical storms and hurricanes formed in the maindevelopment region (MDR) moved northwestward and thenrecurved northeastward to the subtropical North Atlantic,with the exception of two storms that dissipated near theMDR.[4] In this paper, we mainly focus on the tropical cyclones
(TCs) that formed in the MDR and investigate why and howan active hurricane season can occur without a hurricane tomake landfall in the United States. Using observations andnumerical model experiments, we emphasize the role of theAtlantic warm pool (AWP) in the hurricane track. The paperalso discusses the impact of other climate phenomena on thehurricane track.
2. Data Sets and Model Experiments
[5] The first data set is the NOAA extended reconstructedSST version 3 [Smith et al., 2008], and the second one is theNCEP‐NCAR reanalysis [Kalnay et al., 1996]. Hurricanedata are from HURDAT reanalysis database (http://www.aoml.noaa.gov/hrd/data_sub/re_anal.html). What we use hereincludes theACE, all hurricanes,major hurricanes, total namedstorms, and TC track density. The ACE index is calculated bysumming the squares of the estimated maximum sustainedwind of every TC, at six‐hour intervals. Based on the best‐track hurricane data of HURDAT, TC track density is com-puted by counting the number of TCs passing through each5° × 5° grid box for a given calendar year. Since the hurricanedata are relatively reliable after the satellite measurements,here we use the hurricane data from 1970 to 2009. We alsouse the hurricane data from 1950 to 2009 and get the similarresults (Figures 3 and Figure S9 in the auxiliary material).1
The 2010 hurricane data is from NOAA National HurricaneCenter (http://www.nhc.noaa.gov/2010atlan.shtml).[6] The NCAR community atmospheric model version
3.1 (CAM3) is forced by the Hadley Centre SST (HadSST)on a 1° × 1° resolution. Based on the HadSST of 1949–2001, we compute monthly SST composites for large AWP(six large AWP years are 1952, 1958, 1969, 1987, 1995, and
1Atlantic Oceanographic and Meteorological Laboratory, NOAA,Miami, Florida, USA.
2Cooperative Institute for Marine and Atmospheric Studies,University of Miami, Miami, Florida, USA.
This paper is not subject to U.S. copyright.Published in 2011 by the American Geophysical Union.
1Auxiliary materials are available in the HTML. doi:10.1029/2011GL049265.
GEOPHYSICAL RESEARCH LETTERS, VOL. 38, L19702, doi:10.1029/2011GL049265, 2011
L19702 1 of 7

1998) and small AWP (seven small AWP years are 1971,1974, 1975, 1976, 1984, 1986, and 1992). We use theseSST composites to perform two sets of ensemble modelsimulations: large AWP (LAWP) and small AWP (SAWP).In the LAWP run, the twelve‐monthly SSTs for the largeAWP composites are used in the AWP region for forcingCAM3,while themonthly climatology is specified for the restof the global ocean. In the set of the SAWP simulation,CAM3 is forced by the small AWP monthly SST compositesin the AWP region and climatological SST elsewhere. Forthe detailed model experiments, see Wang et al. [2008a].
3. Role of the AWP in the Hurricane Track
3.1. Observational Results
[7] The influence of the AWP on the TC track operatesthrough at least two ways. The first one is the AWP‐relatedshift of the TC genesis location. TheAWP inAugust–October(ASO) expands toward the east during large AWP years,whereas it contracts during small AWP years (Figures 2aand 2b). The eastward shift of warm water and its associ-ated reduction of vertical wind shear result in increased TCactivity [Bell and Chelliah, 2006; Kossin and Vimont, 2007;Wang et al., 2008b]. As shown in Figures 2a and 2b, moreTCs are formed east of 40°W in large AWP years due to theincreased SST and atmospheric convective instability there.Figures 2c and 2d show the tracks of TCs that formed in theMDR for large and small AWPs, with blue (red) colorrepresenting TCs formed in the east (west) of 40°W. Basedon Figures 2c and 2d, the ratios of U. S. landfalling TCs (i.e.,the number of landfalling TCs divided by the total number ofTCs) in the east and west of 40°W are 13.2% and 29.0%,respectively. This indicates that TCs formed further eastwardhave less opportunity to make landfall in the United States.
Figure 1. TC tracks in the 2010 Atlantic hurricane season.Shown are (a) all TCs in the 2010 season and (b) TCs thatformed in theMDR indicated by the box (10°N‐20°N, 60°W‐20°W). TCs that reached major hurricane (Category 3–5)intensity are in red color and TCs that reached Category 1–2 hurricane intensity are in green color.
Figure 2. The TC genesis location, TC track and AWP variability. Shown are the TC genesis location (dots) and SST(shading) for (a) large and (b) small AWP years and the tracks of TCs that formed in the MDR for (c) large and (d) smallAWPs. Based on the data from 1970 to 2009, the top and bottom quartiles of the ASO AWP index are identified as large andsmall AWP years, respectively. The composites of SST for large and small AWP years are then computed. The dots rep-resent the location of all TCs formed southward of 30°N in large (126 TCs) and small (79 TCs) AWP years. In Figures 2cand 2d, 38 (31) TCs are formed in the east (west) of 40°W with 5 (9) TCs making landfall in the United States.
WANG ET AL.: CLIMATE AND LANDFALLING HURRICANES L19702L19702
2 of 7

Therefore, a large AWP shifts the TC genesis location east-ward which increases the possibility for a hurricane to movenorthward without making landfall in the United States.[8] The result is consistent with the southeastward shift of
the genesis location for the strongest Atlantic meridionalmode (AMM) years [Kossin and Vimont, 2007; Kossin et al.,
2010]. The AMM is a climate mode of variability intrinsicto the tropical coupled ocean‐atmosphere system and involvesa positive feedback between surface wind, evaporation andSST. Thus, a strong AMMmay be associated with or induce alarge AWP, resulting in the eastward shift of the TC genesislocation.
Figure 3. The TC steering flow and TC track density, and their relationship with AWP and ENSO variability during ASO.Shown are the TC steering flow anomalies (× 103 hPa m/s) for (a) large and (b) small AWP years, (c) the climatologicalmean of TC track density (the number), (d) the regression coefficient (the number per 100%) of TC track density onto AWPindex, (e) the regression coefficient (the number per 100%) of TC track density onto AWP index with IAS TCs excluded,and (f) the regression coefficient (the number per °C) of TC track density onto Nino3 index. In Figures 3d–3f, the regressioncoefficients higher than the 95% significant level are shaded. The AWP index is calculated as the anomalies of the area ofSST warmer than 28.5°C divided by the climatological ASO AWP area. Based on the data from 1970 to 2009, the top andbottom quartiles of the AWP index are identified as large and small AWP years, respectively. The steering flow anomaliesare computed by compositing the vertically‐averaged wind anomalies from 850 hPa to 200 hPa for large and small AWPyears.
WANG ET AL.: CLIMATE AND LANDFALLING HURRICANES L19702L19702
3 of 7

[9] The second one is that the AWP induces the changesof atmospheric circulation pattern to influence the TC track.The movement of TCs or the TC track is mainly steered bythe surrounding environmental flow in the troposphere andmodified by the beta‐effect. An integrated flow through alayer of the atmosphere is usually defined as the TC steeringflow [e.g., Dong and Neumann, 1986]. To examine the influ-ence of the AWP on the TC steering flow, we calculate the
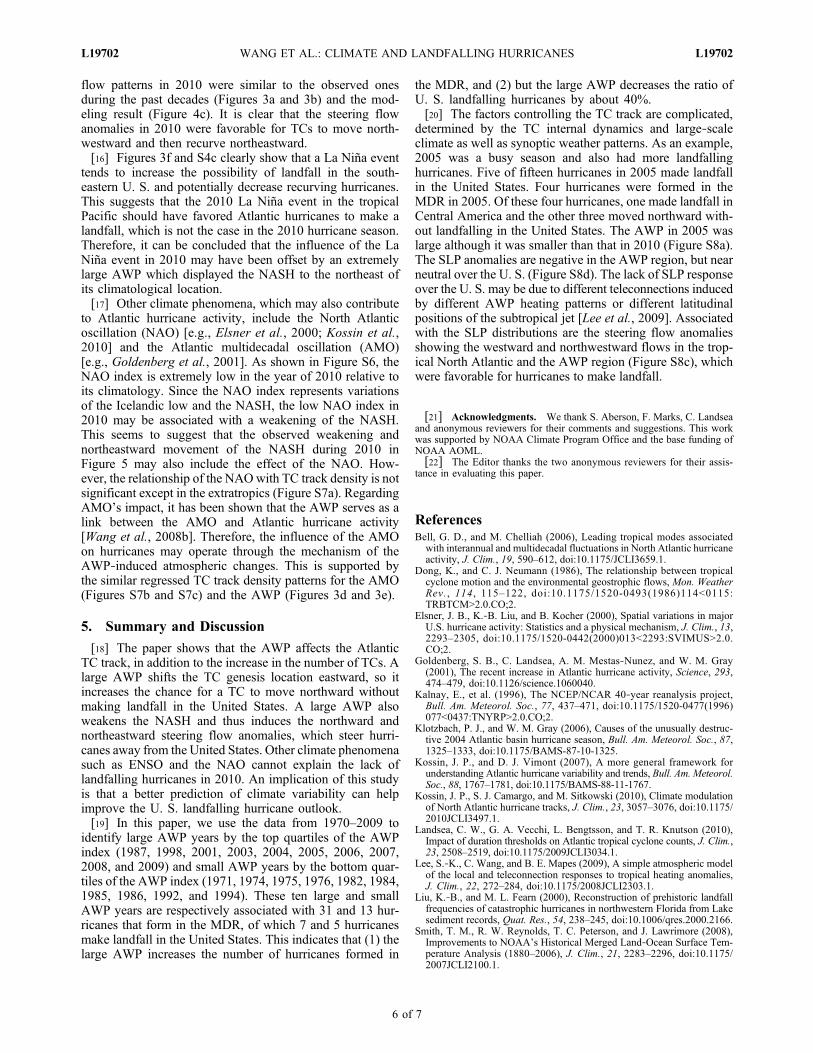
steering flow anomalies for large and small AWP years. Forlarge AWP years, Figure 3a displays an anomalous cyclonicflow over the eastern U. S. and an anomalous anticyclonicflow over Mexico and the eastern North Pacific. Associatedwith these patterns are the southeastward flow anomalies inthe Gulf of Mexico and the northeastward flow anomalies inthe southeast seaboard of the U. S. (Figure 3a). The oppositeis true for small AWP years (Figure 3b). Thus, observationaldata show that a large (small) AWP is associated with thesteering flow which is unfavorable (favorable) for a hurricaneto make landfall in the United States. Additionally, thesteering flow anomalies in neutral AWP years are very smallin comparison with large/small AWP years (Figure S1),indicating that AWP variability plays a key role for the TCsteering flow change.[10] The relationship between the AWP and TC tracks is
further investigated by using the TC track density data from1970 to 2009. The climatological mean of TC track densityis shown in Figure 3c. Consistent with that by Xie et al.[2005], the center of maximum TC density is located inthe western subtropical North Atlantic, reflecting that mostof TCs form in the tropical North Atlantic and movenorthwestward. The impact of the AWP on the TC track isexamined by linearly regressing TC track density onto theAWP index (Figure 3d). The regression is positive in theentire North Atlantic, reflecting that a large (small) AWPincreases (decreases) Atlantic hurricane activity overall [Wanget al., 2006]. The regressed map also shows two maxima:one is in the Intra‐Americas Sea (IAS), i.e., the Gulf ofMexico and the Caribbean Sea, and the other is located in thesubtropical central North Atlantic. The maximum regressionin the IAS is due to TCs that form in the IAS typically duringthe early and late season as in the 2010 season (Figure 1).To confirm the result, we exclude all TCs that form in theIAS from the hurricane data and recalculate the regression.As shown in Figure 3e, the maximum regression in theIAS almost disappears. The maximum regression in thesubtropical central North Atlantic is oriented in a nearlysouth‐to‐north direction far away from the U. S. easternseaboard. This indicates that hurricanes tend to movenorthward to the subtropical North Atlantic Ocean insteadof making landfall in the U. S. during large AWP years.The distributions of TC track density in large and small AWPyears also support the results reported here (Figures S2and S3).
3.2. Modeling Results
[11] We next use CAM3 to show that the AWP affects theTC track via the AWP‐induced steering flow change. In thetropical North Atlantic, TCs usually move toward the westwith a slight poleward component due to an axis of highpressure called the North Atlantic subtropical high (NASH)that extends east‐west poleward of TCs. On the equatorwardside of the NASH, the easterly trade winds prevail. How-ever, if the NASH is weak and/or shifts northeastward, TCsmay turn poleward and then recurve toward the east [e.g.,Liu and Fearn, 2000; Elsner et al., 2000]. On the polewardside of the NASH, the westerly winds prevail thus steeringTCs back to the east. Hence, both the position and strengthof the NASH can determine and change the movement ofTCs.[12] The CAM3 simulated NASHs from the ensemble
LAWP and SAWP model runs are shown in Figure 4. A
Figure 4. The simulated effect of the AWP on the NASHfrom the CAM3 runs during ASO. Shown are the SLPs forthe (a) large AWP (LAWP) run, (b) small AWP (SAWP)run and (c) steering flow difference between LAWP andSAWP runs. The steering flow (× 103 hPa m/s) is calculatedas the vertically‐averaged wind from 850 hPa to 200 hPa.The dashed arrows are schematically drawn, illustratingthe hurricane track if a hurricane forms in the MDR.
WANG ET AL.: CLIMATE AND LANDFALLING HURRICANES L19702L19702
4 of 7

comparison of Figures 4a and 4b shows that the sea levelpressure (SLP) associated with the NASH is significantlydecreased (increased) in response to a large (small) AWP.The contour of 1021‐hPa for the LAWP run stays in theeastern subtropical North Atlantic, whereas its counterpartfor the SAWP run extends westward to the east coast of theUnited States. Therefore, AWP variability affects both thestrength and position of the NASH.[13] The steering flow patterns associated with the LAWP
and SAWP model runs show an anomalous anticyclonicflow centered over the southeastern U. S. and an anomalouscyclonic flow immediately northeastward (Figure 4c). Thesimulated steering flow patterns are consistent with observa-tions although the centers of these steering flow patterns arelocated slightly northeastward in comparison with the obser-vational results of Figure 3. As demonstrated by using asimple two‐level atmospheric model [Lee et al., 2009], thesepatterns are the AWP‐induced barotropic stationary waves inthe boreal summer/fall. These AWP‐forced stationary wavesproduce the eastward flow anomalies along the eastern sea-board of the U. S. that prevent hurricanes from makinglandfall in the United States. As schematically drawn inFigures 4a and 4b, the LAWP‐induced northeastward retreatof the NASH will allow a more frequent northeastwardrecurvature of hurricanes, whereas the SAWP‐induced NASHdistribution creates a more favorable condition for hurricanesto make landfall in the United States. In other words, a largeAWP does not allow the NASH to extend far west, meaningthat hurricanes likely would be steered around NASH’s edgeto the northeast instead of making landfall in the UnitedStates.
4. Impact of Other Climate Factors and the 2010Hurricane Season
[14] It is well‐known that ENSO can remotely influenceAtlantic hurricane activity: a La Niña (El Niño) event in thetropical Pacific increases (decreases) the frequency of Atlantic
hurricanes [e.g., Bell and Chelliah, 2006]. ENSO’s impact onthe hurricane track is shown by regressing TC track densityonto the Nino3 index (Figure 3f). The significant negativeregression is located near the IAS, suggesting that cold(warm) SST anomalies in the tropical Pacific increase(decrease) TC density in the IAS. In other words, a La Niña(El Niño) event in the Pacific tends to enhance (suppress)the possibility for a hurricane to make landfall in CentralAmerica, Caribbean Islands, and the southeastern UnitedStates.[15] Now, with the relationships among the AWP, ENSO,
NASH and hurricane track from historical data and modelexperiments, it is quite straightforward to explain why the2010 hurricane season was so active, but without a land-falling hurricane in the United States. The AWP duringASO of 2010 was extremely large, being about 2.2 timeslarger than its climatological mean (Figure 5a). 2010 wasalso a La Niña year: cold SST anomalies covered theequatorial central and eastern Pacific during the 2010 hur-ricane season. A combination of the local effect of the largeAWP and remote influence of the La Niña condition in thePacific resulted in an active 2010 season. However, the largeAWP in 2010 weakened the NASH and pushed the NASHnortheastward (Figures 5b and 5d). The negative SLPanomalies in the southwestern tropical North Atlantic indi-cated a northeastward retreat of the NASH. As shown anddiscussed earlier, the weakening and the northeastward shiftof the NASH tend to make a hurricane move northward andnortheastward. Therefore, although climate phenomena in2010 tended to increase the number of Atlantic hurricanes,the large AWP in 2010 weakened the NASH and preventedthe NASH from extending far west, resulting in hurricanesbeing steered around NASH’s edge to the northeast insteadof making landfall in the United States. The steering flowanomalies in 2010 showed a cyclonic flow in the westernNorth Atlantic and an anticyclonic flow in the southeasternU. S. (Figure 5c). The cyclonic and anticyclonic steering
Figure 5. The AWP, NASH and steering flow during ASO of 2010. Shown are (a) the SST, (b) the SLP, (c) the steeringflow anomalies (× 103 hPa m/s), and (d) the SLP in ASO of 2010 minus climatological ASO SLP. The AWP is defined bySST warmer than 28.5°C. The dark contour in Figure 5a represents the climatological ASO AWP.
WANG ET AL.: CLIMATE AND LANDFALLING HURRICANES L19702L19702
5 of 7
flow patterns in 2010 were similar to the observed onesduring the past decades (Figures 3a and 3b) and the mod-eling result (Figure 4c). It is clear that the steering flowanomalies in 2010 were favorable for TCs to move north-westward and then recurve northeastward.[16] Figures 3f and S4c clearly show that a La Niña event
tends to increase the possibility of landfall in the south-eastern U. S. and potentially decrease recurving hurricanes.This suggests that the 2010 La Niña event in the tropicalPacific should have favored Atlantic hurricanes to make alandfall, which is not the case in the 2010 hurricane season.Therefore, it can be concluded that the influence of the LaNiña event in 2010 may have been offset by an extremelylarge AWP which displayed the NASH to the northeast ofits climatological location.[17] Other climate phenomena, which may also contribute
to Atlantic hurricane activity, include the North Atlanticoscillation (NAO) [e.g., Elsner et al., 2000; Kossin et al.,2010] and the Atlantic multidecadal oscillation (AMO)[e.g., Goldenberg et al., 2001]. As shown in Figure S6, theNAO index is extremely low in the year of 2010 relative toits climatology. Since the NAO index represents variationsof the Icelandic low and the NASH, the low NAO index in2010 may be associated with a weakening of the NASH.This seems to suggest that the observed weakening andnortheastward movement of the NASH during 2010 inFigure 5 may also include the effect of the NAO. How-ever, the relationship of the NAOwith TC track density is notsignificant except in the extratropics (Figure S7a). RegardingAMO’s impact, it has been shown that the AWP serves as alink between the AMO and Atlantic hurricane activity[Wang et al., 2008b]. Therefore, the influence of the AMOon hurricanes may operate through the mechanism of theAWP‐induced atmospheric changes. This is supported bythe similar regressed TC track density patterns for the AMO(Figures S7b and S7c) and the AWP (Figures 3d and 3e).
5. Summary and Discussion
[18] The paper shows that the AWP affects the AtlanticTC track, in addition to the increase in the number of TCs. Alarge AWP shifts the TC genesis location eastward, so itincreases the chance for a TC to move northward withoutmaking landfall in the United States. A large AWP alsoweakens the NASH and thus induces the northward andnortheastward steering flow anomalies, which steer hurri-canes away from the United States. Other climate phenomenasuch as ENSO and the NAO cannot explain the lack oflandfalling hurricanes in 2010. An implication of this studyis that a better prediction of climate variability can helpimprove the U. S. landfalling hurricane outlook.[19] In this paper, we use the data from 1970–2009 to
identify large AWP years by the top quartiles of the AWPindex (1987, 1998, 2001, 2003, 2004, 2005, 2006, 2007,2008, and 2009) and small AWP years by the bottom quar-tiles of the AWP index (1971, 1974, 1975, 1976, 1982, 1984,1985, 1986, 1992, and 1994). These ten large and smallAWP years are respectively associated with 31 and 13 hur-ricanes that form in the MDR, of which 7 and 5 hurricanesmake landfall in the United States. This indicates that (1) thelarge AWP increases the number of hurricanes formed in
the MDR, and (2) but the large AWP decreases the ratio ofU. S. landfalling hurricanes by about 40%.[20] The factors controlling the TC track are complicated,
determined by the TC internal dynamics and large‐scaleclimate as well as synoptic weather patterns. As an example,2005 was a busy season and also had more landfallinghurricanes. Five of fifteen hurricanes in 2005 made landfallin the United States. Four hurricanes were formed in theMDR in 2005. Of these four hurricanes, one made landfall inCentral America and the other three moved northward with-out landfalling in the United States. The AWP in 2005 waslarge although it was smaller than that in 2010 (Figure S8a).The SLP anomalies are negative in the AWP region, but nearneutral over the U. S. (Figure S8d). The lack of SLP responseover the U. S. may be due to different teleconnections inducedby different AWP heating patterns or different latitudinalpositions of the subtropical jet [Lee et al., 2009]. Associatedwith the SLP distributions are the steering flow anomaliesshowing the westward and northwestward flows in the trop-ical North Atlantic and the AWP region (Figure S8c), whichwere favorable for hurricanes to make landfall.
[21] Acknowledgments. We thank S. Aberson, F. Marks, C. Landseaand anonymous reviewers for their comments and suggestions. This workwas supported by NOAA Climate Program Office and the base funding ofNOAA AOML.[22] The Editor thanks the two anonymous reviewers for their assis-
tance in evaluating this paper.
ReferencesBell, G. D., and M. Chelliah (2006), Leading tropical modes associated
with interannual and multidecadal fluctuations in North Atlantic hurricaneactivity, J. Clim., 19, 590–612, doi:10.1175/JCLI3659.1.
Dong, K., and C. J. Neumann (1986), The relationship between tropicalcyclone motion and the environmental geostrophic flows, Mon. WeatherRev., 114 , 115–122, doi:10.1175/1520-0493(1986)114<0115:TRBTCM>2.0.CO;2.
Elsner, J. B., K.‐B. Liu, and B. Kocher (2000), Spatial variations in majorU.S. hurricane activity: Statistics and a physical mechanism, J. Clim., 13,2293–2305, doi:10.1175/1520-0442(2000)013<2293:SVIMUS>2.0.CO;2.
Goldenberg, S. B., C. Landsea, A. M. Mestas‐Nunez, and W. M. Gray(2001), The recent increase in Atlantic hurricane activity, Science, 293,474–479, doi:10.1126/science.1060040.
Kalnay, E., et al. (1996), The NCEP/NCAR 40‐year reanalysis project,Bull. Am. Meteorol. Soc., 77, 437–471, doi:10.1175/1520-0477(1996)077<0437:TNYRP>2.0.CO;2.
Klotzbach, P. J., and W. M. Gray (2006), Causes of the unusually destruc-tive 2004 Atlantic basin hurricane season, Bull. Am. Meteorol. Soc., 87,1325–1333, doi:10.1175/BAMS-87-10-1325.
Kossin, J. P., and D. J. Vimont (2007), A more general framework forunderstanding Atlantic hurricane variability and trends, Bull. Am. Meteorol.Soc., 88, 1767–1781, doi:10.1175/BAMS-88-11-1767.
Kossin, J. P., S. J. Camargo, and M. Sitkowski (2010), Climate modulationof North Atlantic hurricane tracks, J. Clim., 23, 3057–3076, doi:10.1175/2010JCLI3497.1.
Landsea, C. W., G. A. Vecchi, L. Bengtsson, and T. R. Knutson (2010),Impact of duration thresholds on Atlantic tropical cyclone counts, J. Clim.,23, 2508–2519, doi:10.1175/2009JCLI3034.1.
Lee, S.‐K., C. Wang, and B. E. Mapes (2009), A simple atmospheric modelof the local and teleconnection responses to tropical heating anomalies,J. Clim., 22, 272–284, doi:10.1175/2008JCLI2303.1.
Liu, K.‐B., and M. L. Fearn (2000), Reconstruction of prehistoric landfallfrequencies of catastrophic hurricanes in northwestern Florida from Lakesediment records, Quat. Res., 54, 238–245, doi:10.1006/qres.2000.2166.
Smith, T. M., R. W. Reynolds, T. C. Peterson, and J. Lawrimore (2008),Improvements to NOAA’s Historical Merged Land‐Ocean Surface Tem-perature Analysis (1880–2006), J. Clim., 21, 2283–2296, doi:10.1175/2007JCLI2100.1.
WANG ET AL.: CLIMATE AND LANDFALLING HURRICANES L19702L19702
6 of 7

Wang, C., D. B. Enfield, S.‐K. Lee, and C. W. Landsea (2006), Influencesof the Atlantic warm pool on Western Hemisphere summer rainfall andAtlantic hurricanes, J. Clim., 19, 3011–3028, doi:10.1175/JCLI3770.1.
Wang, C., S.‐K. Lee, and D. B. Enfield (2008a), Climate response to anom-alously large and small Atlantic warm pools during the summer, J. Clim.,21, 2437–2450, doi:10.1175/2007JCLI2029.1.
Wang, C., S.‐K. Lee, and D. B. Enfield (2008b), Atlantic warm pool actingas a link between Atlantic multidecadal oscillation and Atlantic tropicalcyclone activity, Geochem. Geophys. Geosyst., 9, Q05V03, doi:10.1029/2007GC001809.
Xie, L., et al. (2005), Climatology and interannual variability of NorthAtlantic hurricane tracks, J. Clim., 18, 5370–5381, doi:10.1175/JCLI3560.1.
R. Atlas and C. Wang, Atlantic Oceanographic and MeteorologicalLaboratory, NOAA, 4301 Rickenbacker Cswy., Miami, FL 33149, USA.([email protected])S.‐K. Lee and H. Liu, Cooperative Institute for Marine and Atmospheric
Studies, University of Miami, Miami, FL 33149, USA.
WANG ET AL.: CLIMATE AND LANDFALLING HURRICANES L19702L19702
7 of 7
Figure S1. The TC steering flow anomalies during ASO for neutral AWP years. Based on the data from 1970 to 2009, the top and bottom quartiles of the AWP index are identified as large and small AWP years, respectively and the middle quartiles are defined as neutral AWP years. The steering flow anomalies are computed by compositing the vertically-averaged wind anomalies from 850 hPa to 200 hPa for neutral AWP years.

Figure S2. TC track density and AWP variability during ASO. Shown are (a) climatological TC track density, (b) TC track density in large AWP years minus climatological mean, and (c) TC track density in small AWP years minus climatological mean. Based on the data from 1970 to 2009, the top and bottom quartiles of the ASO AWP index are identified as large and small AWP years, respectively.

Figure S3. TC track density with IAS TCs excluded and AWP variability during ASO. Shown are (a) climatological TC track density, (b) TC track density in large AWP years minus climatological mean, and (c) TC track density in small AWP years minus climatological mean. Based on the data from 1970 to 2009, the top and bottom quartiles of the ASO AWP index are identified as large and small AWP years, respectively.
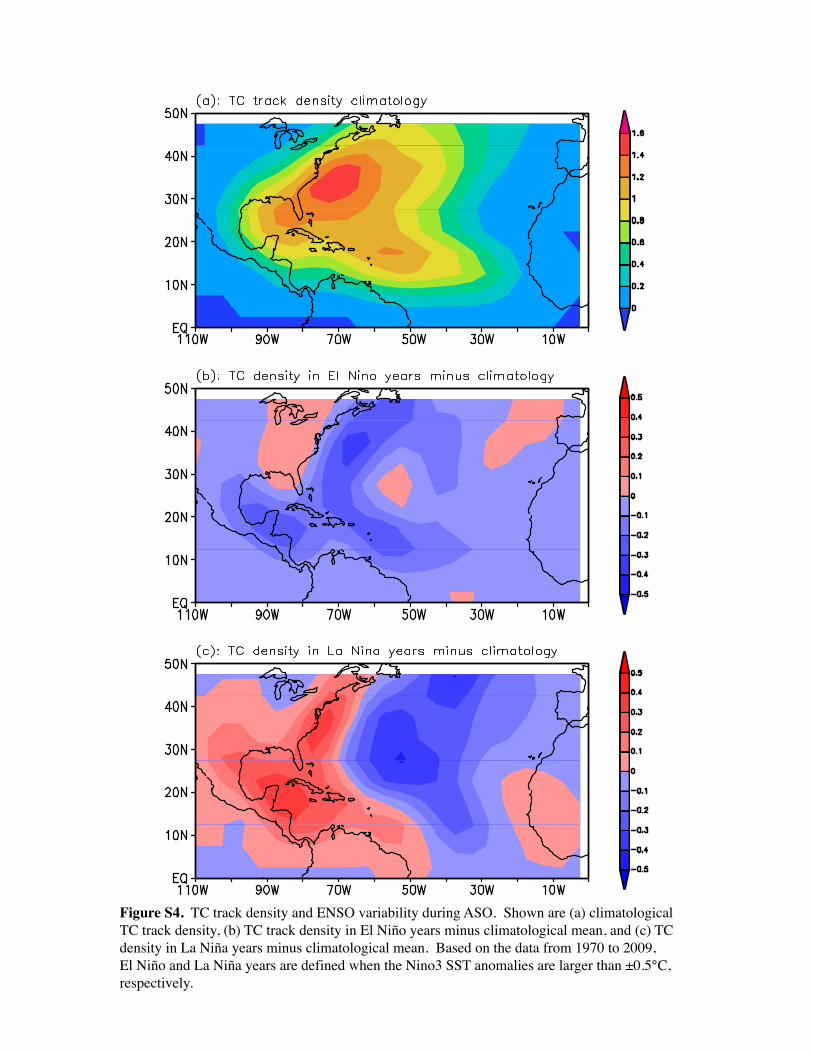
Figure S4. TC track density and ENSO variability during ASO. Shown are (a) climatological TC track density, (b) TC track density in El Niño years minus climatological mean, and (c) TC density in La Niña years minus climatological mean. Based on the data from 1970 to 2009, El Niño and La Niña years are defined when the Nino3 SST anomalies are larger than ±0.5°C, respectively.

Figure S5. TC track density with IAS TCs excluded and ENSO variability during ASO. Shown are (a) climatological TC track density, (b) TC track density in El Niño years minus climatological mean, and (c) TC density in La Niña years minus climatological mean. Based on the data from 1970 to 2009, El Niño and La Niña years are defined when the Nino3 SST anomalies are larger than ±0.5°C, respectively.

Jan Feb Mar Apr May Jun Jul AugSep Oct NovDec−2.0−1.5−1.0−0.5 0.0 0.5 1.0 1.5
NAO index
Climatology2010
Figure S6. The North Atlantic oscillation (NAO) index. The red (blue) bars represent the 2010 (climatological) NAO index.

Figure S7. Relationships of TC track density with NAO and AMO variability during ASO. Shown are (a) the regression coefficient (the number per NAO index) of TC track density onto the NAO index, (b) the regression coefficient (the number per °C) of TC track density onto the AMO index, and (c) the regression coefficient (the number per °C) of TC track density onto the AMO index with IAS TCs excluded. The regression coefficients higher than the 95% significant level are shaded. The AMO index is computed by averaging the North Atlantic SST anomalies from the equator to 60°N.

Figure S8. The AWP, NASH and steering flow during ASO of 2005. Shown are (a) the SST, (b) the SLP, (c) the steering flow anomalies (×103 hPa m/s), and (d) the SLP in ASO of 2010 minus climatological ASO SLP. The AWP is defined by SST warmer than 28.5°C. The dark contour in (a) represents the climatological ASO AWP.

Figure S9. The relationships of the TC steering flow and TC track with climate variability using the data from 1950-2009. Shown are the TC steering flow anomalies (×103 hPa m/s) for (a) large and (b) small AWP years, (c) the climatological mean of TC track density (the number), (d) the regression coefficient (the number per 100%) of TC track density onto AWP index, (e) the regression coefficient (the number per 100%) of TC track density onto AWP index with IAS TCs excluded, and (f) the regression coefficient (the number per °C) of TC track density onto Nino3 index. In (d)-(f), the regression coefficients higher than the 95% significant level are shaded. Based on the data from 1950 to 2009, the top and bottom quartiles of the ASO AWP index are identified as large and small AWP years, respectively. The 15 large AWP years are: 1958, 1969, 1987, 1990, 1998, 1999, 2001, 2002, 2003, 2004, 2005, 2006, 2007, 2008, and 2009 and the 15 small AWP years are: 1950, 1965, 1967, 1971, 1972, 1974, 1975, 1976, 1977, 1982, 1984, 1985, 1986, 1992, and 1994.