impact of student language background on content-based
TRANSCRIPT

Impact of Student Language Background on Content-BasedPerformance: Analyses of Extant Data
CSE Report 603
Jamal AbediCRESST/University of California, Los Angeles
July 2003
Center for the Study of EvaluationNational Center for Research on Evaluation,
Standards, and Student TestingGraduate School of Education & Information Studies
University of California, Los AngelesLos Angeles, CA 90095-1522
(310) 206-1532

Project 4.2 Validity of Assessment and AccommodationsJamal Abedi, Project Director, CRESST/University of California, Los Angeles
Copyright © 2003 The Regents of the University of California
The work reported herein was supported under the Office of Bilingual Education and MinorityLanguages Affairs and the Office of Educational Research and Improvements, Award NumberR305B60002.
The findings and opinions expressed in this report do not reflect the positions or policies of the Office ofBilingual Education and Minority Languages Affairs nor the Office of Educational Research andImprovements.

Executive Summary
Research literature has suggested that the language background of studentsmay impact performance on standardized assessments. The results of data analysesfrom several locations nationwide support the findings of existing literature whichindicate that assessment results may be confounded by language background,particularly for those with limited English proficiency (LEP).1
Existing standardized test and student background data from four differentschool sites nationwide were obtained for analysis. To assure anonymity, these datasites will be referred to as Sites 1, 2, 3, and 4.
Site 1 is a large urban public school district that provided 1999 Iowa Tests ofBasic Skills (ITBS) performance data, as well as background data, for Grades 3through 8.
Site 2 is an entire state with a large number of LEP students that providedStanford 9 test data for all students enrolled in Grades 2 through 11 in public schoolsfor the 1997-1998 academic year. These data included responses to test items (item-level data), subsection scores, and background data. The background data includedgender, ethnicity, socioeconomic status (SES)2, parent education, LEP status, andstudents with disabilities (SWD) status.
Site 3 is an urban school district, with Stanford 9 test data available for allstudents in Grades 10 and 11 for the 1997-1998 academic year. These data includedresponses to test items (item-level data), subsection scores, background data, andtest accommodation data.
Site 4 is a state with a large number of LEP students that provided Stanford 9summary test data for all students in Grades 3, 6, 8, and 10, who were enrolled in thestatewide public schools for the 1997-1998 academic year. Item-level data wasavailable for a sample of the population for Grades 3, 5, 7, and 9 from the 1998-1999academic year. Background data was also available from this site and includedgender, ethnicity, SES level, and LEP, and SWD status.
There were both similarities and differences among the four data sites.Although they all used standardized tests for measuring school achievement inEnglish and other content-based areas, they differed in the type of tests. Thoughthey all had an index of LEP or bilingual status and provided backgroundinformation, they differed in the type of index and the type of background variablesprovided. These differences may limit our ability to perform identical analyses at the
1 The term limited English proficient (LEP) is used primarily by government-funded programs toclassify students, as well as by the National Assessment of Educational Progress (NAEP), fordetermining inclusion criteria. We acknowledge that this term may have a negative connotation. Wealso acknowledge that the broader term, English language learner (ELL) is preferred (see LaCelle-Peterson & Rivera, 1994). However, in keeping with its widespread use in NAEP testing, we uselimited English proficient (LEP) to refer to students who are not native English speakers and who areat the lower end of the English proficiency continuum. Classification here is based on studentbackground information obtained from participating schools.2 SES was determined by free/reduced lunch participation. Students who were eligible for any formof free or reduced lunch were categorized as Low SES. Students who were not eligible for free orreduced lunch were considered Higher SES.

different sites for cross validation purposes. However, there were enoughsimilarities in the data structures at the four different sites to allow for interestingand valid comparisons.
The standardized tests that were used in the four sites were: the StanfordAchievement Test Series, Ninth Edition (Stanford 9 or SAT 9), ITBS, and theLanguage Assessment Scales (LAS). Among the background data that wereprovided by the sites were gender, ethnicity, birth date, and number of years ofparticipation in a bilingual education program (number of years of bilingualservices).
Descriptive statistics comparing LEP and non-LEP student (or bilingual andnon-bilingual) performance by subgroup and across the different content areasrevealed major differences. Disparity Indices (DI) of non-LEP over LEP students areincluded in the descriptive statistics section. These indices showed major differencesbetween students with different language proficiency backgrounds. The moreEnglish language complexity involved in the assessment tool, the greater the DI.
In multiple regression models, LEP status was related to test scores andbackground variables. In a canonical correlation model, the relationship betweenLEP status, parent education, SES (the Set 2 variables), and SAT 9 performance (theSet 1 variables) was examined. The results of these analyses confirmed our earlierfindings that the higher the English “language load” in the assessment, the largerthe gap between performance of LEP and non-LEP students.
The term “language load” refers to the linguistic complexity of the test items.
Though we did not perform any linguistic analyses of test items, it is obviousthat some test items (i.e., in reading assessments) involve more English languagedemand than in other content areas (i.e., math and science).
Several different analyses were performed on the available data, includingdescriptive statistics by LEP status, analyses of internal consistency of the measuresby LEP status, and analyses comparing the structural relationships of theinstruments across various LEP categories. Descriptive analyses showed that LEPstudents generally performed at a lower level than non-LEP students on reading,science, and math subtests—a strong indication of the impact of English languageproficiency on assessment. The level of impact of language proficiency wasespecially greater in the content areas with high language demand. For example,analyses showed that LEP and non-LEP students had the greatest performancedifferences in reading. The gap between the performance of LEP and non-LEPstudents was smaller in other content areas with less language demand, such asmath, which had the smallest difference.
The results of our analyses also indicate that test items for LEP students,particularly for students at the lower end of the English proficiency spectrum, sufferfrom lower internal consistency. That is, the language background of students mayadd another dimension to the assessment. Thus, we speculated that language mightact as a source of measurement error in such cases.
Analyses of the structural relationships between individual items andbetween items with the total test scores showed a major difference between LEP andnon-LEP students. Structural models for LEP students demonstrated lower

statistical fit. Further, the factor loadings were generally lower for LEP students andthe correlations between the latent content-based variables were weaker as well.
The results of our analyses of data from the four sites were consistent withpast literature and indicate that:
1. English language proficiency level is associated with performance oncontent-based assessments.
2. There is a performance gap in content assessment between LEP studentsand non-LEP students.
3 . The performance gap between LEP students and non-LEP studentsincreases as the language load of the assessment tools increases.
4. Test items high in language complexity may be sources of measurementerror.
5. Performance on content-based assessments may be confounded withEnglish language proficiency level.


1
IMPACT OF STUDENT LANGUAGE BACKGROUND ON CONTENT-BASED
PERFORMANCE: ANALYSES OF EXTANT DATA
Jamal Abedi, Seth Leon, and Jim Mirocha
CRESST/University of California at Los Angeles
Abstract
We analyzed existing test data and student background data from four different school sites
nationwide to examine whether standardized test results may be confounded by the lack of language
proficiency of English language learners. Several analyses comparing the performance of limited
English proficient (LEP) students and their non-LEP classmates revealed major differences. A
Disparity Index was created to measure the performance gap between LEP and non-LEP students on
tests with varying levels of language demand. The more linguistically complex the nature of the test,
the greater was the Disparity Index of non-LEP students’ results over LEP students’. This may
suggest that high-language-load test items in assessments of content such as math and science may
act as a source of measurement error. LEP students tended to have lower internal consistency scores
on standardized assessments. Again, this suggests that item language load may interfere with testing
the intended constructs. Using multiple regression, multivariate analysis of variance, and canonical
correlation, we found that the more language load in a test, the stronger the confounding between
LEP status and content-based performance on that test. Structural models for LEP student results
demonstrated a lower statistical fit among test items, as well as between items and the total test
scores. The factor loadings were generally lower for LEP students, and the correlations between the
latent content-based variables were weaker as well.
Results of our analyses indicate that:
1. English language proficiency level is associated with performance on content-basedassessments.
2. There is a performance gap in content assessment between LEP students and non-LEPstudents.
3. The performance gap between LEP students and non-LEP students increases as thelanguage load of the assessment tools increases.
4. Test items high in language complexity may be sources of measurement error.
5. Performance on content-based assessments may be confounded with English languageproficiency level.

2
Perspective
As most standardized, content-based tests are conducted in English andnormed on native English speaking test populations, they may inadvertentlyfunction as English language proficiency tests. LEP students may be unfamiliar withscriptally implicit questions, may not recognize vocabulary terms, or maymistakenly interpret an item literally (Duran, 1989; Garcia, 1991). A first language ofa student may also interfere with their understanding. For example, Schmitt andDorans (1989) found that Hispanic students scored higher than Anglo students onScholastic Aptitude Test (SAT) questions with true cognates (e.g., metal, which hasthe same meaning in both Spanish and English), while they scored lower on false
cognates (e.g., pie, which means foot in Spanish). In general, LEP students mayperform less well on tests because they read more slowly (Mestre, 1988).
In her language analysis of standardized achievement tests, Bailey (2000)used the term “language demand” and indicated that the language demand ofstandardized achievement tests could be a potential threat to the validity of thesetests when administered to LEP students. Because of this source of threat, sheadded, the assessment may not present an accurate picture of LEP student contentknowledge. Bailey elaborated on the concept of language demand as uncommonvocabulary, non-literal usage (idioms), complex or atypical syntactic structure,uncommon genre, or multi-clausal processing.
These language background factors are likely to reduce the validity andreliability of inferences drawn about the content-based knowledge of a student, asstated in the Standards for Educational and Psychological Testing (AmericanEducational Research Association, American Psychological Association, & NationalCouncil on Measurement in Education, 1999, p.91).
For all test takers, any test that employs language is, in part, a measure of their language
skills. This is of particular concern for test takers whose first language is not the languageof the test. Test use with individuals who have not sufficiently acquired the language of
the test may introduce construct-irrelevant components to the testing process. In suchinstances, test results may not reflect accurately the qualities and competencies intended
to be measured. Therefore, it is important to consider language background indeveloping, selecting, and administering tests and in interpreting test performance.

3
Previous Studies
In a series of previous National Center for Research on Evaluation, Standards,and Student Testing (CRESST) studies on the impact of language background onstandardized test performance, we found that (a) language background factors affectperformance in math, and (b) the pattern of responses differs across LEP and non-LEP categories (see Abedi & Lord, 2001; Abedi, Lord, & Hofstetter, 1997; Abedi,Lord, Hofstetter, & Baker, 2000; Abedi, Lord, & Plummer, 1997). For example, wefound that the internal consistency coefficients for the math and reading tests weresystematically lower for LEP students. We also found major differences between thestructural relationship of responses of LEP and non-LEP students to the NationalAssessment of Educational Progress (NAEP) background questions. The fit indiceswere generally lower, and factor loadings of the item-parcels with the latentvariables were weaker, for LEP students. Correlation coefficients between the latentvariables were smaller for LEP students than for non-LEP students (Abedi & Leon,1999; Abedi, Leon, & Mirocha, 2001). We believe that the level of English proficiencyplays an important role in these results. That is, the difficulty in understanding thelanguage of the test items creates another source of measurement error that results inlower reliability and validity of the measures.
The analyses reported earlier included descriptive statistics, analyses ofinternal consistency of the test items, and analyses comparing the structuralrelationship of the measures across all the English proficiency categories (i.e., LEPand non-LEP). These include Re-designated Fluent English Proficiency (RFEP),Fluent English Proficiency (FEP), and English Only (EO). Results of these analysesindicated that LEP students generally performed lower than non-LEP students inreading, science, math, and other content areas—a strong indication of therelationship of English proficiency with achievement measures. However, the levelof impact3 of language on assessment performance of LEP students was greater inthose content areas with high language load. For example, analyses showed thatLEP and non-LEP students have the greatest performance differences in reading.The gap between the performance of LEP and non-LEP students was smaller inother content areas where there is less language load. The difference between LEPand non-LEP performance was smallest in math, particularly math computationitems, where language has less impact.
3 By using the term impact we do not mean any causal relationships.

4
The results of our analyses also indicated that sub-test internal consistencyreliabilities were lower among LEP students (particularly in the lower Englishlanguage proficiency group) than among non-LEP students. That is, languagebackground may add another dimension to performance assessment, whereinlanguage might be a source of measurement error.
We obtained data from several other locations nationwide for furtherinvestigation. Analyzing the new data sets has enabled us to continue exploring themain question of our past studies: whether language background impactsperformance on standardized achievement tests. The following sections aresummaries of our analyses of the new data from Sites 1, 2, 3, and 4.
Data Sources
The data for this study were obtained from four locations:
Site 1. Site 1 is a large urban public school district. We obtained 1999 ITBSperformance data for Grades 3 through 8. The data included responses to test items(item-level data), subsection scores, and background data. These subsectionsummary scores were grouped into four categories that included math concepts andestimation, math problem solving and data interpretation, math computation, andreading. Data were analyzed for Grades 3, 6, and 8. Students were also categorizedbased on whether or not they were receiving bilingual services. There were 36,065students in Grade 3, of which 7,270, or about one in five, received bilingual services.In Grade 6, there were 28,313 students with 3,341 (11.8%) receiving bilingualservices. And, in Grade 8, of the 25,406 students analyzed, 2,306, which is less than 1in 10 (9.1%), were receiving bilingual services.
Site 2. Site 2 is an entire state with a large number of LEP students. TheDepartment of Education for this state gave us access to the SAT 9 test data for allstudents in Grades 2 through 11 who were enrolled in the statewide public schoolsfor the 1997-1998 academic year. These data included responses to test items (item-level data), subsection scores, and background data. The background data includedgender, ethnicity, socioeconomic status (SES), parent education, LEP status, andstudents with disabilities (SWD) status. Scores were available at the subsection levelfor reading, math, language, spelling, science, and social science. Some of thesesubsection scores were not available for all grades. In this report, data were analyzedfor Grades 2, 7, and 9. There were 414,169 students in Grade 2, of which 125,109

5
(30.2%) were labeled as LEP. In Grade 7, out of 349,581 students, 993 (21.2%) wereLEP students. In Grade 9, there were 309,930 students available for analysis, with57,991 (18.7%) LEP students.
Site 3. Site 3 is an urban school district. SAT 9 test data were available for allstudents in Grades 10 and 11 for the 1997-1998 academic year. These data includedresponses to test items (item-level data), subsection scores, accommodation data,and background data. The background data included gender, ethnicity, and LEPand SWD status. The accommodation data indicated both the type ofaccommodation used and the number received. Scores were available at thesubsection level for reading, math, and science. Out of 12,919 students in Grade 10,431 (3.3%) were labeled as LEP. In Grade 11, there were 9,803 students, of which 339(3.5%) were LEP students.
Site 4. Site 4 is a state with a large number of LEP students. The Departmentof Education for this state gave us access to the SAT 9 summary test data for allstudents in Grades 3, 6, 8, and 10 who were enrolled in the statewide public schoolsfor the 1997-1998 academic year. Item-level data were available for Grades 3, 5, 7,and 9 from the 1998-1999 academic year. Background data were also available fromthis site and included gender, ethnicity, SES, and LEP and SWD status. Scores wereavailable at the subsection level for reading, math problem solving, and mathprocedures. There were 13,810 students in Grade 3, with 1,065 (7.7%) LEP students.In Grade 6, out of the 12,998 students, 813 (6.3%) were LEP students. In Grade 8,there were 12,400 students available for analysis, of which 807 (6.5%) were LEPstudents.
Because the type, content, and structure of the data files were different acrossthe sites, we will discuss the structure of the data files and the results of analysesseparately for each site.


7
Descriptive Analyses
Site 1
Data from the Site 1 urban public school district for Grades 3 through 8 forthe 1999 student population were analyzed. The data included responses to ITBS testitems, ITBS subsection scores, and background data. The background data includedstudent ID number, gender, ethnicity, birthdate, and the number of years ofparticipation in a bilingual education program (number of years of bilingualservices). Other school- or test-related variables, such as school unit number, grade,test form, and test level were also included in the data files. Three forms of the ITBSwere used in the 1999 Site 1 testing: Forms K, L, and M. This report focuses on FormM, which was taken by 98.6% of the students. Data were provided for Levels 7through 14 of the ITBS. Each test level was given to students from various grades.However, each test level was associated primarily with a particular grade, asfollows: Level 9 with Grade 3, Level 10 with Grade 4, Level 11 with Grade 5, Level12 with Grade 6, Level 13 with Grade 7, and Level 14 with Grade 8. This reportfollows the primary association just described. For example, ITBS scores from gradesother than Grade 8 were not analyzed for Level 14.
Data files from Site 1 did not include LEP status. However, the files includedthe number of years of bilingual services. As a proxy for LEP status, we created abilingual status variable from the years of bilingual services as follows: a studentwith one or more years of bilingual services was designated “bilingual,” and astudent with no years of bilingual services was designated “non-bilingual.” We alsoused another variable as a proxy for LEP status based on the number of years inbilingual education. Since participation in more bilingual classes may increase thelevel of language proficiency, students with less than 4 years of bilingual educationwere categorized as LEP and those with four or more years of bilingual education asnon-LEP. However, the results of our analyses indicated that the mean score forstudents with more years in bilingual classes was significantly lower than the meanfor students with fewer years in bilingual classes. We therefore decided to use thecategorization based on receiving or not receiving bilingual education.
ITBS subsection (subtest) scores were reported in the following forms: (1) rawscores, (2) percentile ranks, (3) normal curve equivalent (NCE) scores, (4) staninescores, and (5) grade equivalent scores. Scores were available at the subsection level

8
for math concepts and estimation, math problem solving and data interpretation,math computation, and reading.
Among the different subsection scores, we decided to analyze and report theNCE scores4 because of consistency with the reports of data from the other sites (seeAbedi & Leon, 1999). Some of the math scores were composites of more than onesubsection score. For example, the total score of math concepts and estimation was acomposite of two subtests, the math concepts subtest and the math estimation subtest.Similarly, the math problem solving and data interpretation score was a composite of theproblem solving and data interpretation scores. Thus, there were originally fivesubsections in the math test. We report the descriptive statistics for the threesubsections (math concepts and estimation, math problem solving and data interpretation,
and math computation), but discuss the test item characteristics and internalconsistency coefficients for the five math subtests separately.
Table 1 presents frequencies and percentages for students in Grades 3, 6, and8 who took the ITBS tests by their bilingual status. As the data show, 36,065 studentsin Grade 3, 28,133 students in Grade 6, and 25,406 students in Grade 8 took the ITBStests. Numbers and proportions of bilingual students differed across the gradelevels. In Grade 3, more than 20% of students were bilingual. The percent ofbilingual students decreased to about 12% in Grade 6, and further decreased toroughly 9% in Grade 8.
4 NCEs are normalized standard scores with a mean of 50 and a standard deviation of 21.06. Becauseof their distributional properties, for analysis purposes NCEs are preferred over National Percentileranks or raw scores. NCEs coincide with National Percentile ranks at the values 1, 50, and 99.

9
Table 1
Site 1 Grades 3, 6, and 8 ITBS Frequencies
All students Math concepts& estimation
Math prob. solv.& data interp.
Mathcomputation Reading
N % N % N % N % N %
Grade 3
Bilingual 7,270 20.2 7,248 79.9 7,254 79.8 7,260 79.8 7,261 79.8
Non-bilingual
28,795 79.8 28,733 20.1 28,694 20.2 28,740 20.2 28,745 20.2
Allstudents
36,065 100.0 35,981 100.0 35,948 100.0 36,000 100.0 36,006 100.0
Grade 6
Bilingual 3,341 11.8 3,338 88.2 3,335 88.2 3,337 88.2 3,330 88.2
Non-bilingual
24,792 88.2 24,935 11.8 24,915 11.8 24,924 11.8 24,942 11.8
Allstudents
28,133 100.0 28,273 100.0 28,250 100.0 28,261 100.0 28,272 100.0
Grade 8
Bilingual 2,306 9.1 2,300 90.9 2,300 90.9 2,303 90.9 2,291 91.0
Non-bilingual
23,100 90.9 23,036 9.1 23,033 9.1 23,039 9.1 23,071 9.0
Allstudents
25,406 100.0 25,336 100.0 25,333 100.0 25,342 100.0 25,362 100.0
Table 2 presents the means, standard deviations, and number of studentswith non-missing NCE scores for the ITBS subsections at the various grade and test-level combinations. Bilingual students generally performed lower than the non-bilingual students. For the non-bilingual students, the overall mean NCE subsectionscore was 46.25 and ranged from 37.92 to 56.08, while for the bilingual students themean score was 37.59 and ranged from 29.73 to 52.58.5 However, the gap betweenthe test scores of bilingual and non-bilingual students depended on the grade leveland the content of the assessment. The difference between the mean NCE scores ofbilingual and non-bilingual students was generally small for Grade 3 students,except in reading (where there was about a 7-point difference), and favored the non-bilingual group, except in math computation, where the mean was slightly higherfor the bilingual group. Beginning with Grade 4, all the differences favored the non-bilingual students and generally grew larger as we moved to higher grades.
5 Overall means for bilingual and non-bilingual students are averages computed across the six gradelevels and the four ITBS subsections.

10
Table 2
Site 1 Grades 3-8 Descriptive Statistics for the ITBS Subsection NCE Scores
Testlevel Grade Bilingual
statusMath Concepts
& estimationMath prob. solv.
& data interpMath
computation Reading
Non-bilingual
Mean 44.14 40.52 50.21 37.92
SD 20.08 21.49 23.89 17.93
N 28,733 28,694 28,740 28,745
Bilingual
Mean 41.89 36.47 51.84 30.72
SD 19.14 20.57 23.27 17.10
9 3
N 7,248 7,254 7,260 7,261
Non-bilingual
Mean 44.12 45.47 56.08 45.44
SD 20.41 17.77 24.13 15.70
N 24,908 24,904 24,915 24,910
Bilingual
Mean 34.84 38.31 52.58 34.85
SD 18.81 15.67 23.90 12.77
10 4
N 5,226 5,220 5,225 5,221
Non-bilingual
Mean 45.01 45.84 52.32 46.63
SD 19.93 17.30 21.36 14.32
N 22,037 22,022 22,035 22,021
Bilingual
Mean 32.87 34.49 46.45 32.89
SD 17.28 15.96 20.42 12.52
11 5
N 3,850 3,848 3,848 3,844
Non-bilingual
Mean 45.20 43.94 50.82 42.66
SD 20.53 18.57 21.02 16.14
N 24,935 24,915 24,924 24,942
Bilingual
Mean 35.41 33.69 45.60 29.73
SD 17.57 14.30 18.47 12.50
12 6
N 3,338 3,335 3,337 3,330
Non-bilingual13 7
Mean 41.78 45.16 49.78 46.64

11
SD 21.29 17.05 17.59 15.67
N 23,457 23,442 23,435 23,479
Bilingual
Mean 29.80 33.90 44.09 33.39
SD 17.95 15.02 16.17 11.45
N 2,308 2,307 2,307 2,310
Non-bilingual
Mean 48.36 47.50 49.13 46.59
SD 19.31 15.97 16.39 15.19
N 23,036 23,033 23,039 23,071
Bilingual
Mean 37.08 35.94 43.52 32.69
SD 16.07 13.59 14.77 12.52
14 8
N 2,300 2,300 2,303 2,291
For example, the mean NCE math concepts and estimation score for Grade 3non-bilingual students was 44.14 versus 41.89 for bilingual students—a smalldifference (about 2.5 score points higher for non-bilingual students). In Grade 3reading, the non-bilingual students obtained a substantially higher mean (M = 37.92,SD = 17.93) than bilingual students (M = 30.72, SD = 17.10), a gap of approximatelyone-third of a standard deviation. In Grade 4, the reading gap becomes even larger.The mean reading score for non-bilingual students was 45.44 (SD = 15.70), comparedwith a mean of 34.85 (SD = 12.77) for bilingual students, a gap of more than two-thirds of a standard deviation.
Disparity index. The trend of increasing performance gaps between bilingualand non-bilingual students varied across the content/subsection areas. The largestgap between the two groups was in reading. This result was expected because thereading test items have presumably the highest language load among the fourcontent areas, as presented in Table 1. Among these four content areas, the mathcomputation subsection appears to have the lowest language load. Accordingly, theperformance gap between bilingual and non-bilingual students was the smallest onthe math computation subsection. To compare the score differences across test level,grade, and content area for bilingual and non-bilingual students, the percentage ofDisparity Index (DI) of non-bilingual over bilingual students was obtained. The DIwas computed by subtracting the bilingual subtest mean from the non-bilingualsubtest mean, dividing the difference by the bilingual subtest mean, and multiplying

12
the result by 100. The result gives the percentage by which the non-bilingual groupmean exceeds the bilingual group mean on that particular subtest. A negative DIindicates that the bilingual mean exceeds the non-bilingual mean.
Table 3 presents the DIs of non-bilingual students compared to bilingualstudent by test level, grade, and content area. The results present several interestingpatterns:
1. Except for Grade 3 (Level 9) math computation, the DI percentages areall positive, indicating that the non-bilingual students generallyoutperformed the bilingual students.
2. Major differences between bilingual and non-bilingual students werefound for Grades 3 and above. The difference between the mean scoresof bilingual and non-bilingual students increased sharply by grade, upto Grade 6. Starting with Grade 6, the DI was still positive, but the rateof increase slowed down. For example, in Grade 3, non-bilingualstudents had DIs of 5.3% in math concepts and estimation, 11.1% inmath problem solving and data interpretation, -3.1% in mathcomputation (the bilingual group did better than the non-bilingualgroup on this subtest), and 23.4% in reading. In Grade 4, these indicesincreased to 26.9% for math concepts and estimation, 19.3% for mathproblem solving and data interpretation, 6.9% for math computation,and 30.1% for reading. The indices further increased in Grade 5 to 36.5%for math concepts and estimation, 32.7% for math problem solving anddata interpretation, 12.6% for math computation, and 41.1% for reading.
3. As indicated earlier, the largest gap between bilingual and non-bilingualstudents was in reading. The next largest gaps were in the content areasthat appear to have the next highest language load. The math conceptsand estimation and the math problem solving and data interpretationsubsections seem to have higher language load than the mathcomputation subsection. Correspondingly, the DIs were higher for mathconcepts and estimation and for problem solving and datainterpretation. The average DIs for Grades 3 through 8 was 27.7% formath concepts and estimation. That is, the non-bilingual group averagein math concepts and estimation was 27.7% higher than the bilingualgroup average. A similar trend was observed in math problem solvingand data interpretation; the average DIs for this subsection was 26.4%.The average DIs for math computation, however, was 9.0%, which issubstantially lower than the corresponding DIs for the other two mathsubsections. The smaller gap between bilingual and non-bilingualstudents on the math computation subsection might be attributable tothe lower language load of the math computation subsection.

13
Table 3
Disparity Indices of Non-Bilingual over Bilingual Students on Reading and Math Subsections
Testlevel
Primarygrade
Math concepts &estimation
Math prob. solv. &data interp
Mathcomputation Reading
9 3 5.3 11.1 -3.1 23.4
10 4 26.9 19.3 6.9 30.1
11 5 36.5 32.7 12.6 41.1
12 6 27.5 30.9 11.8 43.7
13 7 39.4 32.7 12.9 39.6
14 8 30.5 31.7 12.9 42.7
Average of alllevels/grades 27.7 26.4 9.0 36.8
Cumulative distribution functions. The average score on an indicator oftenmasks important features of the distribution of scores on that indicator, such as thevariability of scores and the shape of the distribution of scores. Graphical displays ofthe scores are therefore useful. A commonly used graphical display is a histogram ofscores.
The cumulative distribution function (CDF) provides an effective display thatshows the entire distribution of scores on an indicator. In probability theory, theCDF of a random variable X is defined as F(x) = Pr(X ≤ x), where x is in the domain
of X. A graph of the CDF thus shows the proportion of scores at or below each valueof the variable.
If {x1, x2,…xn} is a sample from a population, then the empirical cumulativedistribution function (ECDF) is defined as Fn(x) = (1/n)* (number of xi ≤ x). Fn(x)
gives the proportion of the data less than or equal to x.
In this report, we were often interested in comparing the performance of twoor more groups (samples) of students on an achievement test. Rather than simplycomparing group means, we can learn much more by comparing the entiredistributions of the groups. We will thus present the ECDFs for the groups. Tostandardize the comparisons, we utilized the national percentile rankings (NPRs) onthe horizontal axis. We then plotted the ECDF on the vertical axis. Here are a fewproperties of such a plot.6
6Such a plot is also called a quantile-quantile (QQ) plot. For populations, the quantiles of onedistribution are plotted against those of the other distribution. For samples from a population (orpopulations), the quantiles are based on the order statistics.

14
1. If the within group cumulative distribution percentile equals the NPRfor all the data, then the graph of the ECDF is a straight diagonal linefrom the origin to the upper right corner of the graph.
2 . If the ECDF graph lies wholly above the diagonal line, then thecumulative group percentile is greater than the NPR—this indicates thatthe group is performing less well than the national norming sample. Forexample, if the 30th NPR occurs at the 40th percentile in a group, then40% of the group score at or below the 30th NPR.
3 . If the ECDF graph lies wholly below the diagonal line, then thecumulative group percentile is less than the NPR—this indicates that thegroup is performing better than the national norming sample. Forexample, if the 30th NPR occurs at the 20th percentile in a group, thenonly 20% of the group score at or below the 30th NPR.
4. The further the ECDF is away from the diagonal line, the worse (abovethe diagonal) or better (below) the group is performing relative to thenational norming sample.
5. The graph of the ECDF for a group may wander above and below thediagonal line, or towards or away from the diagonal line, indicatingimproving or worsening performance in particular subgroups.
6. The graph of an ECDF begins at the point (1,0) and ends at the point(99,100) because the lowest NPR is 1 and the highest NPR is 99.
Table 4
Site 1 ITBS Percentile Ranks for Bilingual Students at CumulativeDistribution Quartiles, by Subsection
Quartiles
Bilingual service N 1st 2nd 3rd
Reading 3,324 9 18 30
Math concepts 3,324 10 28 47
Math problem solving 3,324 10 22 37
Math computation 3,324 25 40 59

15
Figure 1. Site 1 bilingual CDFs by ITBS subsections.
Table 4 presents ITBS percentile ranks for bilingual students at the cumulativedistribution quartiles and Table 5 presents the same data for non-bilingual students.As the data in Table 4 show, bilingual students obtained the lowest scores onreading, then math problem solving, then math concepts. They obtained the highestscores on math computation. Howevever, even on the math computation subscale,they scored substantially lower than the national norming sample. If all studentsperformed identically to the norming sample, then the cumulative percentile ranksshould correspond with the cumulative quartile columns. For example, under the 1st
quartile, the percentile ranks should all be around 25; under the second, thepercentile ranks should be 50; and under the 3rd quartile, the percentile ranks shouldbe 75. Percentile ranks larger than these points would indicate that studentsperformed better than the norming sample; percentile ranks lower than these areindicative of performance lower than the norming sample.
Figure 1 presents the cumulative distribution functions (CDF) based on thedata from Table 1. The CDF percent curves for all four content areas (reading, mathconcepts, math probability, and math computation) were above the imaginarydiagonal line; this indicates that the bilingual students performed below average onall four content areas. However, the distances between the CDF curves and theimaginary diagonal line differed across the content areas. The line for mathcomputation was closest to the diagonal line, which suggests that bilingual students
Chicago Grade 6 Bilingual CDF’s
By ITBS Subsections
Percentile Ranks
89.0076.0063.0050.0038.0025.0011.001.00Cumulative Percent
100
80
60
40
20
0
ReadingMth CNMth PRMth CP

16
performed similarly to the norming sample on the math computation items but werebelow the norming sample on the other three areas. Thus, bilingual studentsperform considerably better on the math computation subsection when compared tothe other subsections, which involve more language demand.
Table 5 presents Grade 6 percentile ranks for non-bilingual students.Comparing this data with the data in Table 4 shows that bilingual students performlower than non-bilingual students. Figure 2 presents the cumulative distributioncurves for non-bilingual students based on the data in Table 5. Major differencesbetween the performances of bilingual and non-bilingual students are revealed bycomparing Figure 1 (bilingual) with Figure 2 (non-bilingual).
Table 5
Site 1 Grade 6 ITBS Percentile Ranks for Non-Bilingual Students atCumulative Distribution Quartiles, by Subsection
Quartiles
Bilingual service N 1st 2nd 3rd
Reading 28,873 18 38 54
Math concepts 28,873 21 44 66
Math problem solving 28,873 18 37 57
Figure 2. Site 1 Grade 6 non-bilingual CDFs by ITBSsubsections.
Chicago Grade 6 Non-Bilingual CDF’s
By ITBS Subtests
Percentile Rank 97.0084.0070.0059.0046.0033.0021.0011.001.00Cumulative Percent
100
80
6040200
Reading
Mth CNMth PRMth CP

17
For the non-bilingual students (Figure 2), the cumulative curves were closerto the diagonal line than those reported for bilingual students (Figure 1). Thisfinding suggests that non-bilingual students in this study performed more similarlyto the norming group. However, there were some differences in the performance ofnon-bilingual students across the four content areas. The cumulative curve forreading was above all other content cumulative curves indicating that even non-bilingual students performed lowest in reading. Similar to the findings for bilingualstudents, the non-bilingual students performed best on the math computationsubscale.
Site 2
The Department of Education for Site 2 provided SAT 9 test data for allstudents in Grades 2 through 11 who were enrolled in the statewide public schoolsfor the 1997-1998 academic year. This data included responses to SAT 9 test items(item-level data), subsection scores, and background data (student ID number,gender, ethnicity, SES, parent education, LEP and SWD status, home languagesurvey, and district mobility). SAT 9 subsection scores were reported as (1) rawscores, (2) NPRs, and (3) normal curve equivalence (NCE) scores. Scores wereavailable at the subsection level for reading, math, language, spelling, science, andsocial science. Some of these subsection scores were not available for all grades.NCEs were used in our analyses for the purpose of consistency with the other sites.
Table 6 and Table 7 present the number and percent of students in Grades 2,7, and 9 who took the SAT 9 tests, by LEP and SWD status. Table 6 includesinformation for students with non-missing scores on the SAT 9 reading, math, andlanguage subsections. Table 7 presents similar results for students with non-missingscores on the spelling, science, and social science subsections.

18
Table 6
Site 2 Grades 2, 7, and 9 SAT 9 Frequencies
All students Reading Math Language
N % N % N % N %
Grade 2
LEP only 120,480 29.1 97,862 26.5 114,519 28.4 107,861 27.5
SWD only 17,506 4.2 15,051 4.1 16,720 4.2 16,076 4.1
LEP/SWD 4,629 1.1 3,537 1.0 4,221 1.0 3,891 1.0
Non-LEP/Non-SWD
271,554 65.6 252,696 68.4 267,397 66.4 263,955 67.4
All students 414,169 100.0 369,146 100.0 402,857 100.0 391,783 100.0
Grade 7
LEP only 66,410 19.0 62,273 18.5 64,153 18.9 62,559 18.7
SWD only 24,683 7.1 22,388 6.7 23,029 6.8 22,264 6.6
LEP/SWD 7,583 2.2 6,801 2.0 7,074 2.1 6,805 2.0
Non-LEP/Non-SWD
250,905 71.7 244,847 72.8 245,838 72.2 243,199 72.7
All students 349,581 100.0 336,309 100.0 340,094 100.0 334,827 100.0
Grade 9
LEP only 53,457 17.2 48,801 16.6 50,666 17.0 48,909 16.7
SWD only 18,750 6.0 16,732 5.7 17,350 5.8 16,736 5.7
LEP/SWD 4,534 1.5 3,919 1.3 4,149 1.4 3,954 1.3
Non-LEP/Non-SWD
233,189 75.3 224,215 76.4 226,393 75.8 223,721 76.3
All students 309,930 100.0 293,667 100.0 298,558 100.0 293,320 100.0
As the data in Table 6 and Table 7 show, Site 2 provided us with a uniqueopportunity to examine the issues concerning LEP students. With a large number ofLEP students, we could study the interaction of language with other backgroundfactors. The results of our analyses in the other three sites indicated that LEP statusand SES (socioeconomic status) were highly correlated and, to some degree,confounded. Studying large numbers of students helps to understand the uniquecontributions of language factors above and beyond other background variables,such as SES. The number of LEP students was large in all grade levels, but more soin the lower grades. For example, in Grade 2 there were more than 120,000 LEPstudents (more than 25% of the total student population) taking the SAT 9 tests.

19
Table 7
Site 2 Grades 2, 7, and 9 SAT 9 Frequencies
All students Spelling Science Social science
N % N % N % N %
Grade 2
LEP only 120,480 29.1 109,198 27.5 NA NA NA NA
SWD only 17,506 4.2 16,489 4.2 NA NA NA NA
LEP/SWD 4,629 1.1 4,011 1.0 NA NA NA NA
Non-LEP/Non-SWD 271,554 65.6 267,063 67.3 NA NA NA NA
All students 414,169 100.0 396,761 100.0 NA NA NA NA
Grade 7
LEP only 66,410 19.0 64,359 18.8 22,006 21.4 18,293 21.1
SWD only 24,683 7.1 23,390 6.8 6,945 6.8 5,998 6.9
LEP/SWD 7,583 2.2 7,178 2.1 2,755 2.7 2,477 2.8
Non-LEP/Non-SWD 250,905 71.7 246,818 72.3 70,889 69.1 60,156 69.2
All students 349,581 100.0 341,745 100.0 102,595 100.0 86,924 100.0
Grade 9
LEP only 53,457 17.2 16,035 18.6 50,179 16.9 49,859 16.9
SWD only 18,750 6.0 5,417 6.3 17,313 5.8 17,108 5.8
LEP/SWD 4,534 1.5 1,567 1.8 4,108 1.4 4,066 1.4
Non-LEP/Non-SWD 233,189 75.3 63,347 73.3 225,457 75.9 223,989 75.9
All students 309,930 100.0 86,366 100.0 297,057 100.0 295,022 100.0
Note. LEP = limited English proficient. SWD = students with disabilities.
These numbers were lower in Grade 7 (about 19% of the total population), and evenlower in Grade 9 (about 17%). However, even in the higher grades, there aresufficient numbers of LEP students to permit meaningful analyses of test scores bythe variety of background characteristics.
Data from students in Grades 2, 7, and 9 is used for discussion throughoutthis section of the report. Some analyses also incorporated the data from Grades 3and 11. Table 8, Table 9, and Table 10 present descriptive statistics for LEP and SWDstatus, SES, and parent education for students in Grades 2, 7, and 9, respectively.The results of our analyses of the Site 2 data were consistent with the findings from
the other three sites and suggest that language affects performance in the contentareas.

20
Table 8
Site 2 Grade 2 SAT 9 Subsection Scores
Subgroup Reading Math Language SpellingLEP status
LEPM 31.6 37.7 31.6 33.7SD 15.9 19.7 18.9 18.4N 97,862 114,519 107,861 109,198
Non-LEPM 49.3 50.4 50.7 48.1SD 19.7 21.9 23.2 20.1N 252,696 267,397 263,955 267,063
SESLow SES
M 35.4 38.8 35.5 36.7SD 17.5 20.1 20.5 18.7N 106,999 121,461 116,202 117,482
Higher SESM 47.0 48.5 48.0 46.0SD 20.6 22.4 24.0 20.8N 304,092 327,409 320,405 324,832
Parent educationNot high school graduate
M 30.1 34.7 29.9 31.4SD 15.3 19.1 18.2 16.6N 54,855 63,960 60,466 61,431
High school graduateM 40.5 42.6 40.8 40.7SD 18.1 20.3 21.4 18.8N 93,031 101,276 98,798 100,142
Some collegeM 48.8 50.3 50.5 47.8SD 18.6 20.6 22.1 19.2N 66,530 70,381 69,428 70,149
College graduateM 56.5 58.4 59.2 54.9SD 18.5 20.6 21.8 19.8N 54,391 56,451 55,803 56,345
Post graduate studiesM 62.1 64.1 65.3 58.9SD 18.7 20.4 21.2 20.1N 25,571 26,367 26,141 26,336

21
Table 9
Site 2 Grade 7 SAT 9 Subsection Scores
Subgroup Reading Math Language SpellingLEP status
LEPMean 26.3 34.6 32.3 28.5SD 15.2 15.2 16.6 16.7N 62,273 64,153 62,559 64,359
Non-LEPMean 51.7 52.0 55.2 51.6SD 19.5 20.7 20.9 20.0N 244,847 245,838 243,199 246,818
SESLow SES
Mean 34.3 38.1 38.9 36.3SD 18.9 17.1 19.8 20.0N 92,302 94,054 92,221 94,505
Higher SESMean 48.2 49.4 51.7 47.6SD 21.8 21.6 22.6 22.0N 307,931 310,684 306,176 312,321
Parent educationNot high school graduate
Mean 31.2 36.2 36.4 32.8SD 17.7 15.8 18.8 18.8N 58,276 59,573 58,237 59,880
High school graduateMean 39.3 40.9 42.9 40.2SD 19.3 17.9 20.4 20.2N 72,383 73,352 72,125 73,729
Some collegeMean 49.1 49.0 52.2 48.5SD 19.3 19.2 20.7 20.3N 72,589 73,019 72,105 73,304
College graduateMean 52.8 53.7 56.0 52.1SD 20.4 21.3 21.6 20.9N 82,417 82,804 81,855 83,110
Post graduate studiesMean 61.9 63.9 65.2 59.2SD 20.6 22.2 21.2 20.8N 39,443 39,609 39,319 39,697

22
Table 10
Site 2 Grade 9 SAT 9 Subsection Scores
Subgroup Reading Math Language Science Socialscience
LEP statusLEP
Mean 24.0 38.1 34.8 34.9 34.5SD 12.5 15.2 13.7 12.8 13.4N 48,801 50,666 48,909 50,179 49,859
Non-LEPMean 46.0 53.5 52.4 49.2 49.3SD 18.0 19.4 17.7 16.1 17.9N 224,215 226,393 223,721 225,457 223,989
SESLow SES
Mean 32.0 42.5 41.0 39.4 39.3SD 16.2 16.4 16.2 14.3 15.3N 56,499 57,961 56,572 57,553 57,185
Higher SESMean 42.6 50.7 49.2 47.0 46.9SD 19.7 20.1 18.9 17.0 18.6N 338,285 343,480 337,623 341,663 339,445
Parent educationNot high schoolgraduate
Mean 29.2 39.6 38.3 37.3 37.2SD 15.0 15.1 15.3 13.5 14.4N 69,934 71,697 69,705 71,183 70,801
High school graduateMean 35.6 44.1 42.9 41.7 41.0SD 17.0 17.1 16.7 14.9 15.9N 71,986 73,187 71,722 72,810 72,506
Some collegeMean 44.6 51.6 50.5 48.2 47.7SD 17.2 18.1 17.0 15.4 17.0N 70,364 70,971 70,089 70,687 70,455
College graduateMean 48.1 56.3 54.3 51.5 51.4SD 18.5 19.6 18.1 16.4 18.2N 87,654 88,241 87,354 87,956 87,746
Post graduate studiesMean 57.6 65.8 62.6 58.8 60.7SD 19.6 20.7 18.6 17.1 19.7N 34,978 35,087 34,910 35,022 35,005

23
The results reported in Table 8, Table 9, and Table 10 indicate that: (1) LEPstudents perform substantially lower than non-LEP students, particularly in contentareas with more language load, such as reading; (2) the gap between theperformance of LEP and non-LEP students is smaller in the lower grades; (3) LEPstatus may be confounded with SES and parent education.
To compare LEP and non-LEP students, we computed a Disparity Index (DI)by subtracting the mean score of LEP students from the mean of non-LEP students,dividing the difference by the mean of LEP students, and multiplying the result by100. We used the DI to demonstrate the points stated above. Table 11 presents the DIby LEP status, as well as by SES and parent education, for Grades 2 and 7. Table 12presents similar results for students in Grade 9.
Table 11
Site 2 Grades 2 and 7 DIs by LEP Status, SES, and Parent Education
Grade DI Reading Math Language Spelling
2 LEP status 55.8 33.5 60.2 42.8
2 SES 32.7 25.1 35.2 25.3
2 Parent education 106.3 84.9 118.5 87.5
7 LEP status 96.9 50.4 70.7 81.1
7 SES 47.2 29.5 32.9 31.1
7 Parent education 98.4 76.2 79.0 80.5
Through a comparison of the math DI with the DI of the language relatedsubsections (reading, language, and spelling), we can see the impact of language onperformance. The DI of non-LEP students over LEP students was lower on the mathsubtest. For example, for Grade 2, the DI was 55.8% in reading (non-LEP studentsoutperformed LEP students by 55.8%), 60.2% in language, and 42.8% in spelling, ascompared with a DI of 33.5% in math. For Grade 7, the DIs were 96.9% for reading,70.7% for language, and 81.1% in spelling, as compared to 50.4% for math (see Table11). This trend also holds for Grade 9 (see Table 12).
In Table 8, Table 9, and Table 10, the mean, standard deviation by SES, andstandard deviation by parent education are also reported. The DI for the SESvariable (see Table 11 and Table 12) suggests that low SES students performedsubstantially higher than higher SES students. For Grade 2 students, these

24
Table 12
Site 2 Grade 9 DIs by LEP Status, SES, and Parent Education
Grade DI Reading Math Language Science Socialscience
9 LEP status 91.6 40.3 50.5 41.2 34.3
9 SES 33.3 19.8 19.9 19.3 19.4
9 Parent education 97.4 66.4 63.3 57.6 63.0
percentages were 32.7% in reading (low SES students performed 32.7% higher thanhigher SES students), 25.1% in math, 35.2% in language, and 25.3% in spelling (seeTable 11). The corresponding DIs for Grade 7 were 47.2% for reading, 29.5% formath, 32.9% for language, and 31.1% for spelling. For Grade 9, the percentages were33.3% for reading, 19.8% for math, 19.9% for language, 19.3% for science, and 19.4%for social sciences (see Table 12).
Parent education seems to have a much greater impact on studentperformance. The categories for the parent education variable were: not high schoolgraduate, high school graduate, some college, college graduate, and post graduatestudies. DIs for parent education were computed by subtracting the mean score ofthe lowest education category (not high school graduate) from the mean of thehighest category (post graduate studies), dividing the difference by the mean fromthe lowest category, and multiplying the result by 100. For Grade 2 students, the DIwas 106% in reading (students from parents with post graduate educationperformed 106% higher than those from parents with less than high schooleducation), 85% in math, 119% in language, and 88% in spelling. Similar trends werefound for students in Grades 7 and 9 (see Table 11 and Table 12).
LEP students may be more likely to have parents with a lower level ofeducation. Thus, parent education and LEP status may be confounded. Similarly,LEP status may be confounded with SES, as LEP students may be more likely to befrom families with lower SES. We will examine these hypotheses by applying morecomplex statistical models, such as canonical correlation and regression models.
To present a clearer picture of the differences between the performance ofLEP and non-LEP students in conjunction with other background variables, a seriesof cumulative distribution tables and graphs was created. In these distributions,performance was compared across categories of LEP when SES and parent

25
education variables were controlled for. Table 13 presents a summary of the SAT 9percentile ranks at the cumulative distribution quartiles for Grade 9 English only(EO) students with higher SES. Figure 3 shows a graphical representation of the datain Table 13. As the data in Table 14 indicate, percentile ranks were approximately atthe quartiles, suggesting that the EO students performed roughly at the nationallevel in all three content areas.
Figure 3 also shows that the three content curves were very close to thediagonal line. However, there was a slight improvement in the SAT 9 scores whenwe moved from reading to science and from science to math.
Table 13
Site 2 Grade 9 SAT 9 Percentile Ranks for EO/higher SES atCumulative Distribution Quartiles, by Subsection
Quartiles
Sub-test N 1st 2nd 3rd
Reading 157,847 23 45 69
Science 157,847 31 48 70
Math 157,847 32 58 80
Figure 3. Site 2 Grade 9 SAT 9 CDFs forEO/Higher SES.
Table 14 presents data similar to those presented in Table 13, but for EO/lowSES students. Thus, the difference between data in Table 13 and Table 14 is the
California Grade 9 Stanford 9 CDF’s
English Only Students/No Free Lunch
Percentile Rank 9181716151413121111Cumulative Percent
100
80
6040200
ReadingScienceMath

26
difference between SES. Figure 4 graphs the data in Table 14. A comparison of thedata in Table 13 and Table 14 and Figure 3 and Figure 4 suggests, as expected, thatSES has a substantial impact on performance. The percentile ranks for low SESstudents (Table 14) were consistently lower than the ranks for higher SES students(Table 13). For example, the percentile ranks for higher SES students at the 1stquartile were 23 for reading (about the national level), 31 for science, and 32 formath (slightly above the national level). However, for low SES students, the rankswere 11 for reading, 18 for science, and 18 for math, which are substantially lowerthan the national ranks. For both low and higher SES students, the reading scoreswere lower than science, and scores for science were lower than those for math.These are trends that were seen and discussed earlier for Site 1.
Table 14
Site 2 Grade 9 SAT 9 Percentile Ranks for EO/low SES atCumulative Distribution Quartiles, by Subsection
Quartiles
Sub-test N 1st 2nd 3rd
Reading 17,432 11 24 45
Science 17,432 18 35 54
Math 17,432 18 35 58
Figure 4. Site 2 Grade 9 SAT 9 CDFs for EO/lowSES.
California Grade 9 Stanford 9 CDF’s
English Only / Receiving Free Lunch
Percentile Rank 9484726251413121111Cumulative Percent
100
806040200
ReadingScienceMath

27
As presented in Table 13 and 14, the low SES group performed lower than thehigher SES group among non-LEP students. Table 15 and Figure 5 present similardata for LEP students. For LEP students the reading scores were very low, and againscience scores were lower than math.
Table 15
Site 2 Grade 9 SAT 9 Percentile Ranks for LEP Students atCumulative Distribution Quartiles, by Subsection
Quartiles
Sub-test N 1st 2nd 3rd
Reading 50,167 4 10 19
Science 50,167 12 23 35
Math 50,167 16 25 43
Figure 5. Site 2 Grade 9 Stanford 9 CDFs for LEPstudents.
A comparison of data in the three tables reveals that LEP students performedsubstantially lower than non-LEP students, even lower than the low SES group. Forexample, 11% of low SES students had percentile ranks at the 25th percentile pointsas compared with only 4% of LEP students at the 25th percentile point. At the 75th
percentile point, there were 45% of low SES/non-LEP students as compared withonly 19% of LEP students at this percentile point. However, the percentages at thedifferent percentile levels improves as we move from language to science to math(see Table 13, Table 14, and Table 15.)
California Grade 9 Stanford 9 CDF’s
For LEP Students
Percentile Rank
9282726251413121111Cumulative Percent
100
80
60
40
20
0
ReadingScienceMath

28
Table 16 and Figure 6 summarize the percentile rank statistics by parenteducation for higher EO/higher SES students. Table 17 and Figure 7 present similarresults for EO/low SES students, whereas Table 18 and Figure 8 present thepercentile rank statistics for the LEP group. As the data in Table 16 and Figure 6show, parent education had substantial impact on performance, as shown by thepercentile ranks. Percentile ranks at the lowest level of parent education were 8 (atthe 25th point), 19 (at the 50th point), and 37 (at the 75th point), as compared withpercentile ranks of 33, 57, and 77, respectively, for students with the highest level ofparent education.
Table 16
Site 2 Grade 9 SAT 9 Percentile Ranks for EO/higher SES atCumulative Distribution Quartiles, by Parent Education
Quartiles
Parent education N 1st 2nd 3rd
Not high school graduate 10,154 8 19 37
High school graduate 28,064 14 28 51
Some college 36,266 24 44 65
College graduate 66,156 33 57 77
Note. EO = English only.
Figure 6. Site 2 Grade 9 SAT 9 CDFs for EO/higher SESby parent education.
Table 17 and Figure 7 present percentile ranks by categories of parenteducation for low SES students. Comparing data in Table 17 with those reported in
California Grade 9 Reading CDF’s
By Parent Education
English Only Students Not Receiving School Lunch
Percentile Rank
97 84 72 62 52 41 31 21 11 1
Cumulative Percent
100
80
60
40
20
0 Cum
ulat
ive
Perc
ent
<HSGrad HS GradSome

29
Table 16 for higher SES students reveals that, in general, low SES studentsperformed lower than higher SES students academically. However, in the low SESgroup, parent education made a substantial difference. As Table 17 shows, thepercentile ranks for students of parents with a high school education (lower level ofeducation) were 6 (at the 25th percentile point), 15 (at the 50th percentile point), and31 (at the 75th percentile point), as compared with percentile points of 14, 31, and 54,respectively, for students with parents with a higher level of education.
Table 17
Site 2 Grade 9 SAT 9 Percentile Ranks for EO/low SES at CumulativeDistribution Quartiles, by Parent Education
Quartiles
Parent education N 1st 2nd 3rd
Not high school graduate 2,835 6 15 31
High school graduate 4,859 9 20 39
Some college 4,046 15 30 52
College graduate 3,906 14 31 54
Figure 7. Site 2 Grade 9 SAT 9 CDFs for EO/low SES byparent education.
Table 18 and Figure 8 present percentile points by level of parent educationfor LEP students. As data in Table 18 suggest, the level of parent education impactsthe performance of LEP students. LEP students with a higher level of parenteducation perform better than LEP students with a lower level of parent education.
California Grade 9 Reading CDF’s
By Parent Education
English Only Students Receiving School Lunch
Percentile Rank 92776452413121111Cumulative Percent
100
80
60
40
200
<HS Grad
HS GradS. CollegeColl. Grad

30
For example, percentile ranks at the first three quartiles for students with parents ofhigh school education were 4, 9, and 16, as compared with the percentile ranks of 6,14, and 27 for LEP students with higher level of parent education at the threequartiles, respectively.
Table 18
Site 2 Grade 9 SAT 9 Percentile Ranks for LEP at CumulativeDistribution Quartiles, by Parent Education
Quartiles
Parent education N 1st 2nd 3rd
Not high school graduate 23,706 4 9 16
High school graduate 9,668 4 10 19
Some college 3,725 6 14 25
College graduate 5,745 6 14 27
Figure 8. Site 2 Grade 9 SAT 9 CDFs for LEP byparent education.
Site 3
SAT 9 test data for students in Grades 10 and 11 were analyzed. The dataincluded item-level data, subsection scores, and background data. Background dataincluded gender, ethnicity, and LEP and SWD status. This site also provided us withinformation on accommodations used for LEP and SWD students. Similar to Site 2,we analyzed the SAT 9 NCE scores for the content areas of reading, science, andmath.
California Grade 9 Reading CDF’s
LEP Students by Parent Education
Percentile Rank
88736150403020100Cumulative Percent
100
80
60
40
20
0
<HS Grad
HS GradSome Coll.Coll. Grad

31
Table 19 presents the number of students who took the SAT 9 tests. Thenumbers are broken down by LEP and SWD status. A total of 12,919 Grade 10students were tested. Of these students, 391 (3.0%) were categorized by the schooldistrict as LEP, 1,100 (8.5%) as SWD, and 40 (0.3%) as LEP/SWD. Most of thestudents answered SAT 9 test items in the three main content areas: reading, math,and science. In Grade 11, a total of 9,803 students took the tests. Of these students,310 (3.2%) were categorized as LEP, 800 (8.2%) as SWD, and 40 (0.3%) as LEP/SWD.As in Grade 10, the number of students taking the different subtests of the SAT 9differed slightly.
Table 20 presents the means and standard deviations of the SAT 9 NCE testscores in the three content areas according to SWD and LEP status. The mean scoresfor reading, science, and math for all students in Grade 10 were 36.0 (SD = 16.9), 41.3(SD = 17.5), and 38.5 (SD = 17), respectively.
Table 19
Site 3 Grades 10 and 11 SAT 9 Frequencies
All Students Reading Science Math
N % N % N % N %
Grade 10
LEP only 391 3.0 330 3.0 285 2.8 340 3.3
SWD only 1,100 8.5 812 7.3 595 5.8 595 5.8
LEP/SWD 40 0.3 19 0.2 17 0.2 22 0.2
Non-LEP/SWD 11,388 88.2 9,997 89.5 9,334 91.2 9,344 90.7
All students 12,919 100.0 11,158 100.0 10,231 100.0 10,301 100.0
Grade 11
LEP only 310 3.2 289 3.3 248 3.1 277 3.4
SWD only 800 8.2 624 7.1 471 6.0 452 5.6
LEP/SWD 29 0.3 15 0.2 6 0.1 13 0.2
Non-LEP/SWD 8,664 88.3 7,812 89.4 7,175 90.8 7,298 90.8
All students 9,803 100.0 8,740 100.0 7,900 100.0 8,040 100.0

32
Table 20
Site 3 Grades 10 and 11 Descriptive Statistics for the SAT 9 NCEs
Reading Science Math
M SD M SD M SD
Grade 10
LEP only 24.0 16.4 32.9 15.3 36.8 16.0
SWD only 16.4 12.7 25.5 13.3 22.5 11.7
LEP/SWD 16.3 11.2 24.8 9.3 23.6 9.8
Non-LEP/SWD 38.0 16.0 42.6 17.2 39.6 16.9
All students 36.0 16.9 41.3 17.5 38.5 17.0
Grade 11
LEP only 22.5 16.1 28.4 14.4 45.5 18.2
SWD only 14.9 13.2 21.5 12.3 24.3 13.2
LEP/SWD 15.5 12.7 26.1 20.1 25.1 13.0
Non-LEP/SWD 38.4 18.3 39.6 18.8 45.2 21.1
All students 36.2 19.0 38.2 18.9 44.0 21.2
For LEP/SWD students, the mean scores in all three subscales weresubstantially lower than the mean scores for non-LEP/non-SWD students. Becausethe focus of this report is on LEP students, we will discuss the data as related tostudents classified as “LEP only.” However, we will report data for both LEP andSWD students to the extent possible.
The mean scores for the Grade 10 LEP only students for reading, science, andmath were 24.0 (SD = 16.4), 32.9 (SD = 15.3), and 36.8 (SD = 16.0), respectively. Thesedata suggest two interesting trends: first, that test scores for LEP students increase aswe move from reading to science to math; and second, that the difference betweenthe performance of LEP and non-LEP students decreases from reading to science tomath.
Table 20 also presents means and standard deviations for Grade 11, whichwere very similar to Grade 10. The mean scores for all students in Grade 11 forreading, science, and math were 36.2 (SD = 19.0), 38.2 (SD = 18.9), and 44.0 (SD =21.2), respectively. Like Grade 10, the means of subscale scores increase as we movefrom reading to science to math. For science, there was a 6-score-point increase overreading (.4 standard deviation); and for math, there was a 23-score-point increase(1.5 standard deviation) over reading and a 17-score-point increase (1.1 standard

33
deviation) over science. This trend of increase in subscale score is due to severalfactors including content and language factors. The language factors are particularlyimportant for the LEP group.
There were large differences between LEP/SWD and non-LEP/non-SWDgroups in mean scores on the SAT 9 reading test. Among the three LEP/SWDcategories, students in the “SWD only” category performed the lowest in reading.The mean reading score for this group was 14.9 as compared with a mean of 38.4 fornon-LEP/non-SWD students, a difference of more than 1.5 standard deviations. Inscience, SWD only students again obtained the lowest mean score of all the othergroups (M = 21.5, SD = 12.3); however, the difference between means for this groupand the non-LEP/non-SWD group (M = 39.6, SD = 18.8) was smaller than thedifference that was found between the two groups in reading. The differencebetween SWD and non-LEP/non-SWD mean scores decreases even further when wemove from reading to math content area (for SWD only, M = 24.3, SD = 13.2).
Again, because the focus of this report is on LEP students, in the discussion ofpsychometric characteristics and subsequent analyses, we limit our discussion tocomparisons involving LEP students only. In reading, there was a large differencebetween the scores of LEP and non-LEP students. The mean reading score for LEPstudents was 22.5 (SD = 16.1), as compared with a mean score of 38.4 (SD = 18.3) fornon-LEP/non-SWD, a difference of about one standard deviation. This differencewas only .69 standard deviations in science, and nonexistent in math. That is, inGrade 11 math, LEP (M = 45.5, SD = 18.2) and non-LEP/non-SWD (M = 45.2, SD =21.1) students performed about the same (Table 20).
To present a clearer picture of differences between the performance of LEPand non-LEP students, Disparity Indices were computed. The DIs shown in Table 21suggest that the higher the level of language load in the assessment, the larger thegap between the performance of LEP and non-LEP students. For example, for bothGrade 10 and 11, the DI was largest for reading (58.3 for Grade 10 and 70.7 for Grade11), smaller for science (29.5 for Grade 10 and 39.4 for Grade 11) and almost zero formath (7.6 for Grade 10 and –0.7 for Grade 11).

34
Table 21
Disparity Index Non-LEP/Non-SWD StudentsCompared to LEP Only Students
Disparity index
Grade Reading Science Math
10 6 15 31
11 9 20 39
Descriptive statistics on accommodation data. The data from Site 3 providedan excellent opportunity to examine the impact of language background onperformance. The data, however, had some limitations, as with data from any otherlarge school district in the nation. One of the major limitations in the data was thelack of a control group in accommodation. For example, it was impossible tomeasure the impact of accommodation on the performance of accommodatedstudents due to the lack of a baseline (either a pretest score for the accommodatedstudents or a comparison group). Another limitation with the data was the smallnumber of accommodated students. Having these limitations in mind, weperformed some analyses on the accommodation data. Following are some of thefindings.
Table 22 compares the performance in reading of LEP students under threedifferent types of accommodation with non-LEP students (non-accommodated) inGrades 10 and 11. The accommodations are (a) extension of allotted time, (b)multiple shortened periods, and (c) simplified directions. For Grade 10 students, themean NCE score for the non-LEP group is 38.04 (n = 9,957). For the accommodatedLEP students, the mean NCE scores were substantially lower than the mean scoresfor both the non-accommodated LEP students and the non-LEP group. The mean forLEP students receiving “extension of allotted time” was 16.42 (n = 143); “multipleshortened period” was 15.74 (n = 52); and “simplified directions” was 15.81 (n =133). Thus, LEP students had the lowest performance under the “multiple shortenedperiod” accommodation and the highest performance under the “extension of time”accommodation. However, the differences in performances under the threeaccommodation conditions were very small, suggesting that the three forms ofaccommodation produced similar results.

35
Table 22
Site 3 Reading Normal Equivalent Means by Type of Accommodation (Any)
Grade 10 Grade 11
Accommodation type N Mean N Mean
Non-LEP: No accommodation 9,957 38.04 7,775 38.47
LEP: No accommodation 175 30.98 154 28.28
LEP: Any accommodation 155 16.15 135 15.91
LEP: Extension of allotted time 143 16.42 107 14.03
LEP: Multiple shortened periods 52 15.74 34 19.89
LEP: Simplified directions 133 15.81 125 16.29
Note. SWD students have been excluded from this analysis.
The overall mean NCE score for Grade 10 LEP students receiving anyaccommodation was 16.15, which is well below the mean NCE score of 38.04 for thenon-LEP students, a difference of over 1.3 standard deviations. The mean NCE scorefor accommodated LEP students (16.15) was also considerably lower than the meanscore for non-accommodated LEP students (30.98). The very large differencebetween the performance of non-LEP and LEP students may suggest that theaccommodation strategies failed to narrow the gap between the two groups. Itseems more likely however, given the large difference between the accommodatedand the non- accommodated LEP students, that the accommodated LEP studentswere the lowest performing group from the outset. However, the effectiveness ofaccommodations cannot be judged without a baseline measure of languageproficiency.
Similar results were obtained for Grade 11 students. The highest mean forLEP students in Grade 10 (M = 16.42, n = 143) was with the “extension of allottedtime” accommodation, whereas, for students in Grade 11, this accommodationproduced the lowest mean (M = 14.03, n = 107). However, as was the case for Grade10 LEP students, the difference in the scores under the three types ofaccommodation is not large. The overall mean for Grade 11 accommodated LEPstudents was 15.91 (n = 135) as compared with a mean of 28.28 (n = 154) for non-accommodated LEP students and 38.47 (n = 7,775) for the non-LEP students.
Table 23 presents mean NCE science scores by type of accommodation forstudents in Grades 10 and 11. Several types of accommodation were utilized inscience assessment. The mean score for non-LEP students in Grade 10 was 42.63 (n =

36
9,300). For LEP students, mean NCE scores under the different types ofaccommodation were (a) extension of allotted time: M = 27.32 (n = 84); (b) multipleshortened periods: M = 28.50 (n = 39); (c) simplified directions: M = 27.87 (n = 109);(d) reading of questions: M = 27.13 (n = 52); (e) translation of words/phrases: M =28.95 (n = 90); (f) decoding of words: M = 26.60 (n = 57); and (g) use of gestures: M =27.84 (n = 65). The overall science mean for LEP students, under these seven types ofaccommodation, was 28.01 (n = 122), as compared with a mean of 42.63 (n = 9,300)for the non-LEP group. Again, the accommodated LEP students scored substantiallylower than both the non-accommodated LEP students and the non-LEP students.
Table 23 also reports data for students in Grade 11. The mean NCE sciencescore for non-LEP students was 39.67 (n = 7,143). For LEP students, the means were(a) extension of allotted time: M = 23.18 (n = 85); (b) multiple shortened periods: M =28.77 (n = 26); (c) simplified directions: M = 24.19 (n = 106); (d) reading of questions:M = 22.62 (n = 54); (e) translation of words/phrases: M = 22.88 (n = 79); (f) decodingof words: M = 21.80 (n = 59); and (g) use of gestures: M = 23.56 (n = 40). The meanfor all Grade 11 accommodated LEP students was 24.26, as compared with a mean of39.67 for the non-LEP students—a gap of 15.41, or about 1 standard deviation. Thegap between the LEP and non-LEP groups however, was smaller in science scoresthan in reading scores, which were reported earlier.
Table 23
Site 3 Science NCE Means by Type of Accommodation (Any)
Grade 10 Grade 11
Accommodation type N Mean N Mean
Non-LEP: No accommodation 9,300 42.63 7,143 39.67
LEP: No accommodation 163 36.64 136 31.80
LEP: Any accommodation 122 28.01 112 24.26
LEP: Extension of allotted time 84 27.32 85 23.18
LEP: Multiple shortened periods 39 28.50 26 28.77
LEP: Simplified directions 109 27.87 106 24.19
LEP: Reading of questions 52 27.13 54 22.62
LEP: Translation of words/phrases 90 28.95 79 22.88
LEP: Decoding of words 57 26.60 59 21.80
LEP: Use of gestures 65 27.84 40 23.56
Note. SWD students have been excluded from this analysis. Single accommodation N’swill not sum to total as students are allowed multiple accommodations.

37
Table 24 summarizes the results of descriptive statistics for NCE math scoresby seven types of accommodation for Grades 10 and 11. The mean math NCE scorefor non-LEP students in Grade 10 was 39.61 (n = 9,305). For LEP students, means byaccommodations were (a) extension of allotted time: M = 31.83 (n = 116); (b) multipleshortened periods: M = 35.83 (n = 50); (c) simplified directions: M = 34.88 (n = 160);(d) reading of questions: M = 32.56 (n = 61); (e) translation of words/phrases: M =35.69 (n = 128); (f) decoding of words: M = 31.80 (n = 68); and (g) use of gestures: M= 32.19 (n = 72). The mean NCE score over all types of accommodation for Grade 10students was 34.61, as compared with a mean of 39.61 for non-LEP students, adifference of 5.00, which is about one third of a standard deviation.
Analyses for students in Grade 10 were also done for students in Grade 11.Table 24 reports the math NCE means and number of students taking the test. Fornon-LEP students, the mean was 45.18 (n = 7,264). For LEP students, the means were(a) extension of allotted time: M = 44.79 (n = 104); (b) multiple shortened periods: M= 46.35 (n = 35); (c) simplified directions: M = 46.09 (n = 128); (d) reading ofquestions: M = 43.53 (n = 71); (e) translation of words/phrases: M = 45.35 (n = 93); (f)decoding of words: M = 43.09 (n = 75); and (g) use of gestures: M = 45.91 (n = 47).The mean NCE math score for all accommodated LEP students was 46.01 (n = 135),as compared with a mean of 45.18 (n = 7,264) for the non-LEP students.
Table 24
Site 3 Math NCE Means by Type of Accommodation (Any)
Grade 10 Grade 11
Accommodation type N Mean N Mean
Non-LEP: No accommodation 9,305 39.61 7,264 45.18
LEP: No accommodation 168 39.11 142 44.93
LEP: Any accommodation 172 34.61 135 46.01
LEP: Extension of allotted time 116 31.83 104 44.79
LEP: Multiple shortened periods 50 35.83 35 46.35
LEP: Simplified directions 160 34.88 128 46.09
LEP: Reading of questions 61 32.56 71 43.53
LEP: Translation of words/phrases 128 35.69 93 45.35
LEP: Decoding of words 68 31.80 75 43.09
LEP: Use of gestures 72 32.19 47 45.91
Note. SWD students have been excluded from this analysis.

38
The results of these analyses may suggest that accommodations did not helpto reduce the gap between the LEP and non-LEP groups, particularly in reading andscience content areas. However, this conclusion is not warranted since we did nothave access to the complete information needed to make such judgments. We hadno baseline data against which to compare the accommodated assessment data. Itmay be that the students chosen to receive accommodations were less proficient inEnglish than those who did not. Accommodations may have actually helped LEPstudents, and the gap between LEP and non-LEP students could have been muchgreater had no accommodations been provided.
An alternative way to examine the effectiveness of accommodations is tocompare different groups of LEP students who received different numbers ofaccommodations. Students received one, two, or more than two accommodations. Ifaccommodations are effective, then students receiving more accommodationsshould demonstrate a better performance. To test this hypothesis, we computedmean NCE scores for students receiving different numbers of accommodations.Table 25 shows mean NCE reading scores for Grades 10 and 11 by the number ofaccommodations received. Mean NCE scores were reported for non-LEP students(no accommodation), LEP students (no accommodation), LEP students (anyaccommodation), LEP students receiving one accommodation (of any type), LEPstudents receiving two accommodations, and LEP students receiving threeaccommodations.
Table 25
Site 3 Reading NCE Means by Number of Accommodations
Grade 10 Grade 11
Accommodation # N Mean N Mean
Non-LEP: No accommodation 9,957 38.04 7,775 38.47
LEP: No accommodation 175 30.98 154 28.28
LEP: Any accommodation 155 16.15 135 15.91
LEP: 1 Accommodation 33 16.62 31 22.07
LEP: 2 Accommodations 71 16.13 77 11.17
LEP: 3 Accommodations 51 15.89 27 22.34
Note. SWD students have been excluded from this analysis.

39
As shown in Table 25, the mean NCE reading score for non-LEP students (noaccommodation) was 38.04 (n = 9,957). For LEP students receiving oneaccommodation, the mean was 16.62 (n = 33), two accommodations was 16.13 (n =71), and three accommodations was 15.89 (n = 51). These results suggest that theremay not be a systematic impact of the number of accommodations on readingscores. The increase or decrease in the means may also be due to chance since thenumbers of students in the cells were relatively small.
Also reported in this table are NCE reading score means by number ofaccommodations for Grade 11. The mean for non-LEP students is 38.47 (n = 7,775),for LEP students with one accommodation 22.07 (n = 31), with two accommodations11.17 (n = 77); and with three accommodations 22.34 (n = 27). The trends of NCEmeans for Grade 11 are inconsistent with those reported for Grade 10 and with thehypothesized direction that more accommodations means higher performance.
Table 26 presents NCE mean science scores by number of accommodationsfor Grades 10 and 11. Means are reported for non-LEP students (noaccommodation), LEP students (no accommodation), LEP students (anyaccommodation), and LEP students receiving one to seven accommodations.
Table 26
Site 3 Science NCE Means by Number of Accommodations
Grade 10 Grade 11
Accommodation # N Mean N Mean
Non-LEP: No accommodation 9,300 42.63 7,143 39.67
LEP: No accommodation 163 36.64 136 31.80
LEP: Any accommodation 122 28.01 112 24.26
LEP: 1 accommodation 6 30.38 2 30.10
LEP: 2 accommodations 25 26.94 38 24.74
LEP: 3 accommodations 21 29.42 15 33.50
LEP: 4 accommodations 18 28.08 2 4.05
LEP: 5 accommodation 12 28.86 18 19.83
LEP: 6 accommodations 35 28.50 31 21.62
LEP: 7 accommodations 5 18.98 6 20.02
Note. SWD students have been excluded from this analysis.

40
As Table 26 shows, for grade, the mean for non-LEP students was 42.63 (n =9,300). For LEP students, the means were 30.38 (n = 6) with one accommodation,26.94 (n = 25) with two, 29.42 (n = 21) with three, 28.08 (n = 18) with four, 28.86 (n =12) with five, 28.50 (n = 35) with six, and 18.98 (n = 5) with seven accommodations.There was no systematic trend on the means. With one accommodation, LEPstudents had the highest mean score (30.38). This lack of a meaningful trend may bedue to the small number of students in the seven LEP categories, or due to the lackof impact of accommodations on performance, or both. The overall mean (over thetotal number of accommodations) for LEP students was 28.01 (n = 122) as comparedwith a mean of 42.63 for non-LEP students (n = 9,300).
NCE science means by number of accommodations are also reported forGrade 11 in Table 26. Similar to the data reported for Grade 10, there was nosystematic trend in the data. Students with one accommodation had a mean inscience of 30.10 (n = 2). The mean science score over all numbers of accommodationswas 24.26 (n = 112), as compared with a mean of 39.67 (n = 7,143) for non-LEPstudents. Again, the lack of a systematic trend here may be due to the small cell sizesfor the LEP groups, or to lack of effect of accommodations, or both.
Table 27 reports mean NCE math scores by number of accommodations forGrades 10 and 11.
Table 27
Site 3 Math NCE Means by Number of Accommodations
Grade 10 Grade 11
Accommodation # N Mean N Mean
Non-LEP: No accommodation 9,305 39.61 7,264 45.18
LEP: No accommodation 168 39.11 142 44.93
LEP: Any accommodation 172 34.61 135 46.01
LEP: 1 accommodation 6 30.38 2 62.50
LEP: 2 accommodations 47 39.19 46 47.88
LEP: 3 accommodations 39 36.57 15 51.26
LEP: 4 accommodations 19 26.34 3 40.23
LEP: 5 accommodation 10 28.20 22 41.77
LEP: 6 accommodations 45 33.22 37 44.06
LEP: 7 accommodations 6 37.43 10 45.46
Note. SWD students have been excluded from this analysis.
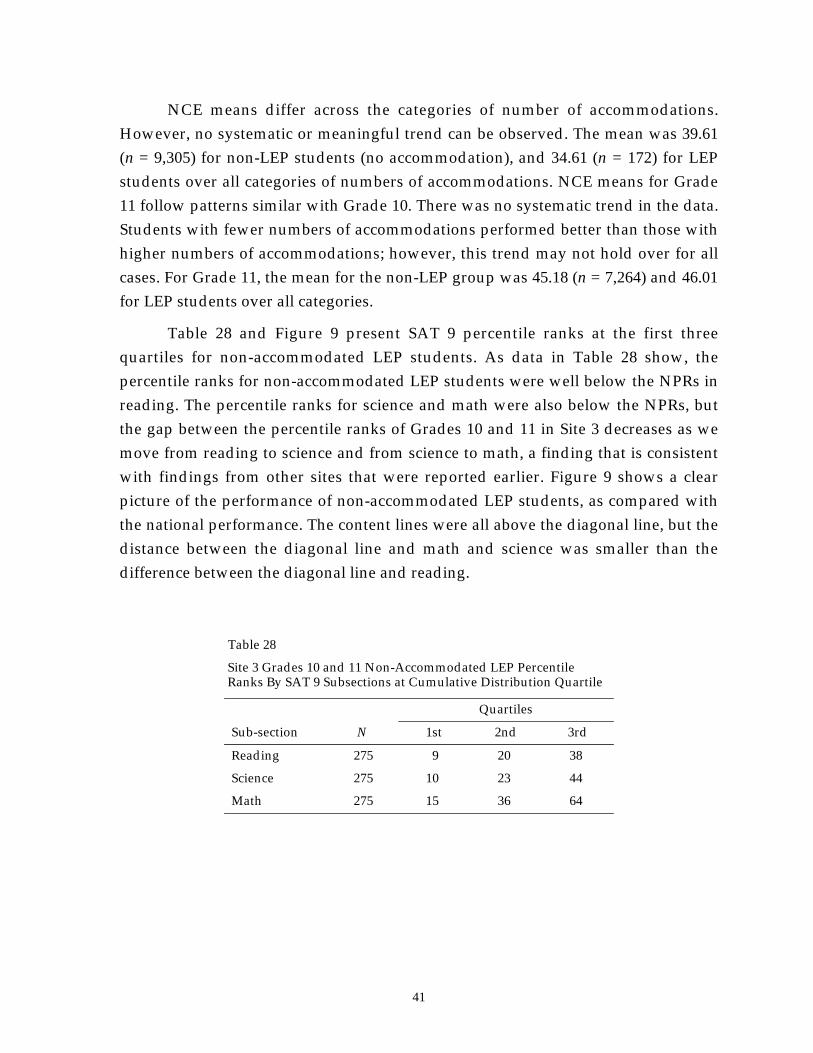
41
NCE means differ across the categories of number of accommodations.However, no systematic or meaningful trend can be observed. The mean was 39.61(n = 9,305) for non-LEP students (no accommodation), and 34.61 (n = 172) for LEPstudents over all categories of numbers of accommodations. NCE means for Grade11 follow patterns similar with Grade 10. There was no systematic trend in the data.Students with fewer numbers of accommodations performed better than those withhigher numbers of accommodations; however, this trend may not hold over for allcases. For Grade 11, the mean for the non-LEP group was 45.18 (n = 7,264) and 46.01for LEP students over all categories.
Table 28 and Figure 9 present SAT 9 percentile ranks at the first threequartiles for non-accommodated LEP students. As data in Table 28 show, thepercentile ranks for non-accommodated LEP students were well below the NPRs inreading. The percentile ranks for science and math were also below the NPRs, butthe gap between the percentile ranks of Grades 10 and 11 in Site 3 decreases as wemove from reading to science and from science to math, a finding that is consistentwith findings from other sites that were reported earlier. Figure 9 shows a clearpicture of the performance of non-accommodated LEP students, as compared withthe national performance. The content lines were all above the diagonal line, but thedistance between the diagonal line and math and science was smaller than thedifference between the diagonal line and reading.
Table 28
Site 3 Grades 10 and 11 Non-Accommodated LEP PercentileRanks By SAT 9 Subsections at Cumulative Distribution Quartile
Quartiles
Sub-section N 1st 2nd 3rd
Reading 275 9 20 38
Science 275 10 23 44
Math 275 15 36 64

42
Figure 9. Site 3 Grades 10 and 11 SAT 9 CDFs fornon-accommodated LEP.
Table 29 and Figure 10 compare percentile ranks of non-LEP students inreading, science, and math with the national ranks. As data in Table 29 show, theperformance of non-LEP students was slightly lower than the NPRs in all threecontent areas, particularly in reading. However, the percentile ranks for non-LEPstudents were higher than those for non-accommodated LEP students (Table 28). AsFigure 10 shows, the performance curves for all three content areas were above thediagonal line, but the distance between the performance curves and the diagonalline was smaller here than those for non-accommodated LEP students.
Table 29
Site 3 Grades 10 and 11 Non-LEP Percentile Ranks By SAT 9Subsections at Cumulative Distribution Quartile
Quartiles
Sub-section N 1st 2nd 3rd
Reading 15,648 15 30 51
Science 15,648 15 33 58
Math 15,648 15 32 59
Philadelphia Grades 10 -11 ITBS CDF’s
For Unaccommodated LEP Students
Percentile Rank
91.0081.0071.0061.0051.0041.0031.0021.0011.001.00Cumulative Percent
100
80
60
40
20
0
Reading
ScienceMath

43
Figure 10. Site 3 Grades 10 and 11 SAT 9.
Table 30 and Figure 11 summarize the percentile rank statistics foraccommodated LEP students. The difference between the percentile ranks in thethree content areas (reading, science, and math) was much larger than the percentileranks reported for both non-accommodated LEP and non-LEP students. Theaccommodated LEP students performed extremely poorly in reading. Theirperformance improved in science and further improved in math. As Figure 11shows, the content curves for the accommodated LEP students were all well abovethe diagonal line, but the distance between the content curves and the diagonal linedecreased as we moved from reading to science to math.
Table 30
Site 3 Grades 10 and 11 Accommodated LEP Percentile RanksBy Sat 9 Subsections at Cumulative Distribution Quartiles
Quartiles
Sub-section N 1st 2nd 3rd
Reading 222 3 6 14
Science 222 5 11 22
Math 222 15 30 55
Philadelphia Grade 10 CDF’s
For Non-LEP Students
Percentile Rank
91.0081.0071.0061.0051.0041.0031.0021.0011.001.00Cumulative Percent
100
80
60
40
20
0
ReadingScienceMath

44
Figure 11. Site 3 Grades 10 and 11 SAT 9 CDFs foraccommodated LEP students.
The results of our analyses may imply that accommodations did not helpreduce the gap between LEP and non-LEP students, especially since the data showthat non-accommodated LEP seem to perform better than accommodated LEP.However, as indicated earlier, we had no baseline data against which to compareaccommodated assessment data. Since reading scores (which have the highest levelof language demand) for accommodated LEP were substantially lower than for non-accommodated LEP, it is likely that students with low performance in reading wereselected to receive an accommodation. Thus, though we still see a performance gapbetween accommodated and non-accommodated LEP, the performance gap couldhave been much larger had no accommodations been provided at all.
Site 4
Data from all school districts in a state were obtained for Grades 3, 6, 8, and10. The data included the SAT 9 NCE scores for some of the strands (subscales).Complete data were available for a small number of the strands from the grades weobtained. Strands 1 (Total Reading) and 5 (Total Math) were available for all fourgrade levels. Strands 7 (Math Calculation) and 8 (Math Analytical) were available forGrades 3, 6, and 8.
To examine the impact of language on performance on content areas, we usedstrands that are traditionally affected by language background and those that maynot be much affected by language. Since we are working with Grades 3, 6, and 8, weused the strands that were available for these three grades.
In a series of analyses, we used Strands 1 (Total Reading), 7 (Math Calculation),and 8 (Math Analytical). LEP and SWD status was used as a grouping variable, of
For ccommod ted LEP tude ts
Percentile Rank
92.0076.0063.0053.0041.0031.0021.0011.001.00Cumulative Percent
100
80
60
40
20
0
ReadingScience
Math

45
which four subgroups were created: (a) LEP only, (b) SWD only, (c) LEP/SWD, and(d) RFEP. Table 31 presents the number and percent of students responding toquestions in reading, math calculation, and math analytical subsections of the SAT 9by LEP and SWD categories. The percent of LEP students in Grade 3 was larger
Table 31
Site 4 Grades 3, 6, and 8 SAT 9 Frequencies
All Students Reading Mathcalculation
Mathanalytical
N % N % N % N %
Grade 3
Non-LEP/non-SWD
11,014 79.8 10,785 79.8 10,975 79.9 10,957 79.9
LEP only 1,009 7.3 996 7.4 1,001 7.3 1,002 7.3
SWD only 819 5.9 782 5.8 800 5.8 796 5.8
LEP/SWD 56 0.4 54 0.4 56 0.4 54 0.4
RFEP 912 6.6 898 6.6 909 6.6 909 6.6
All students 13,810 100.0 13,151 100.0 13,741 100.0 13,718 100.0
Grade 6
Non-LEP/non-SWD
9,890 76.1 9,840 76.2 9,846 76.2 9,855 76.2
LEP only 732 5.6 726 5.6 723 5.6 728 5.6
SWD only 1,030 7.9 1,002 7.8 1,008 7.8 1,005 7.8
LEP/SWD 81 0.6 80 0.6 81 0.6 80 0.6
RFEP 1,265 9.7 1,262 9.8 1,262 9.8 1,259 9.7
All students 12,998 100.0 12,910 100.0 12,920 100.0 12,927 100.0
Grade 8
Non-LEP/non-SWD
9,426 76.0 9,217 76.2 9,278 76.2 9,250 76.2
LEP only 709 5.7 692 5.7 696 5.7 699 5.8
SWD only 923 7.4 872 7.2 883 7.2 873 7.2
LEP/SWD 98 0.8 93 0.8 97 0.8 94 0.8
RFEP 1,244 10.0 1,223 10.1 1,228 10.1 1,229 10.1
All students 12,400 100.0 12,097 100.0 12,182 100.0 12,145 100.0

46
(more than 7%) than in Grade 6 (5.6%) and in Grade 8 (5.7%). The percent of SWDwas larger than the percent of LEP students for all three grades, but the number ofLEP students was large enough to permit analyses by LEP and non-LEP categories.
Descriptive statistics were computed including mean, standard deviation,and number of subjects for each of these subgroups, as well as for the entire group ofstudents. The descriptive statistics for Grade 3 are presented in Table 32.
Table 32
Site 4 Grade 3 Descriptive Statistics for the SAT 9 Test Scores by Strands
Reading Math Mathcalculation
Mathanalytical
Non-LEP/non-SWD
Mean 42.86 51.51 52.23 49.61
SD 19.61 20.81 20.89 20.66
N 10785 10922 10975 10957
LEP only
Mean 27.94 40.94 46.25 37.36
SD 16.39 18.64 20.27 17.75
N 996 998 1001 1002
SD only
Mean 27.14 38.21 39.80 37.58
SD 22.37 22.99 22.34 22.47
N 782 788 800 796
LEP/SD
Mean 13.88 25.06 32.69 22.49
SD 13.31 14.57 17.89 13.98
N 54 54 56 54
RFEP
Mean 46.05 59.44 61.76 55.08
SD 16.20 19.99 20.56 19.28
N 898 906 909 909

47
As the data in Table 32 show, in general, LEP/SWD students have lower scoresthan non-LEP/non-SWD. Also, for the entire group of students, the NCE scoreswere higher for math than for reading. The non-LEP/non-SWD mean NCE score formath was 51.51 (SD = 20.81) and for reading the mean was 42.86 (SD = 19.61), aboutan 8 score-point difference. The difference between performance in reading andmath was even larger for LEP students. The mean scores for LEP were 27.94 (SD =16.39) for reading and 40.94 (SD = 18.64) for math, with a 13 score-point difference.
In addition to reporting overall math scores in Table 32, we also reportedscores for math calculation and math analytical separately. Since there is lesslanguage involved with the math calculation items, we expected LEP students tohave higher scores on this type of item than on the math analytical items. And wesee that the NCE score for the entire group on the math calculation strand washigher than on the math analytical strand. This difference was larger for LEP thanfor non-LEP students.
To compare LEP and non-LEP students, we computed a Disparity Index (DI)by subtracting the mean score of LEP students from the mean of non-LEP students,dividing the difference by the mean of LEP students, and multiplying the result by100. Table 33 reports the DIs for reading/math and for calculation/analytical.
Through a comparison of the reading subsection DI with the DI of the mathsubsections (total, calculation, and analytical), we can see the impact of language onperformance. The DI of non-LEP students over LEP students was lowest on the mathcalculation subtest. For example, for Grade 3, the DI was 53.4% in reading (non-LEPstudents outperformed LEP students by 55.4%), 32.8% in math analytical, ascompared with a DI of 12.9% in math calculation. For Grade 8, the DIs were 125.2%for reading, 44.0% for math analytical, and 25.2% in math calculation (see Table 33).
Table 33
Disparity Index Non-LEP/Non-SWD Students Compared toLEP Only Students
Disparity Index
Grade ReadingMathtotal
Mathcalculation
Mathanalytical
3 53.4 25.8 12.9 32.8
6 81.6 37.6 22.2 46.1
8 125.2 36.9 25.2 44.0

48
Table 34 presents means and standard deviations of NCE scores for students inGrade 6. The trend of the results was very similar to the trend of results reported inGrade 3. There was a large gap between the performance of LEP and non-LEPstudents. This gap, however, reduces with the decrease in the level of languagefactors. For example, the mean reading score for non-LEP/non-SWD students was50.73 (SD = 18.92) as compared with a mean of 27.93 (SD = 14.21) with a 22.8 score-point difference (about 1.5 standard deviation). For math calculation, the differencebetween non-LEP/non-SWD (M = 52.19, SD = 20.60) and LEP students (M = 42.70,SD = 18.45) is only 9.48 score-points (about .5 standard deviation).
Table 34
Site 4 Grade 6 Descriptive Statistics for the SAT 9 Test Scores by Strands
Reading Math Mathcalculation
Mathanalytical
Non-LEP/Non-SWD
Mean 50.73 54.01 52.19 54.73
SD 18.92 20.08 20.60 19.84
N 9840 9807 9846 9855
LEP only
Mean 27.93 39.26 42.70 37.46
SD 14.21 16.21 18.45 15.49
N 726 720 723 728
SWD only
Mean 28.97 33.76 32.84 36.46
SD 18.32 16.43 17.75 16.88
N 1002 992 1008 1005
LEP/SWD
Mean 17.92 27.93 30.91 29.02
SD 12.50 11.09 13.82 10.76
N 80 80 81 80
RFEP
Mean 47.70 55.57 57.01 53.94
SD 16.89 19.95 20.94 19.82
N 1262 1257 1262 1259

49
Table 35 reports descriptive statistics for reading and math for Grade 8. Thesedata are similar to those that were reported in Table 32 and Table 34 for Grades 3and 6, respectively. The trend of performance for Grade 8 was very similar withthose reported for Grades 3 and 6. Here again, students have a higher score on maththan on reading, and LEP students show greater differences between reading andmath and between math computational and math analytical.
Table 35
Site 4 Grade 8 Descriptive Statistics for the SAT 9 Test Scores by Strands
Reading Math Mathcalculation
Mathanalytical
Non-LEP/Non-SWD
Mean 45.63 49.30 49.09 48.75
SD 21.10 20.47 20.78 19.61
N 9217 91.18 9846 92.50
LEP only
Mean 20.26 36.00 39.20 33.86
SD 16.39 18.48 21.25 16.88
N 692 687 696 699
SWD only
Mean 18.86 27.82 28.42 29.10
SD 19.70 14.10 15.76 15.14
N 872 843 883 873
LEP/SWD
Mean 9.78 21.37 22.75 22.87
SD 11.50 10.75 12.94 12.06
N 93 92 97 94
RFEP
Mean 41.33 51.04 52.57 48.84
SD 19.59 21.63 21.92 20.19
N 12.23 12.09 12.28 12.29

50
Table 36 and Figure 12 present percentile ranks data for English only (EO)students with low SES in reading, math application and math computation. The datain Table 36 show that EO/low SES students perform poorly in reading. Theirperformance improves in math (application and computation). Figure 12 presents aclear picture of this trend. The content curve for reading was well above thediagonal line, suggesting poor performance in this content area. The math contentcurves were closer to the diagonal line.
Table 36
Site 4 Grade 8 SAT 9 Percentile Ranks for EO/low SES atCumulative Distribution Quartiles by Subsection
Quartiles
Sub-test N 1st 2nd 3rd
Reading 3,455 9 26 49
Math application 3,455 16 29 54
Math computation 3,455 15 29 55
Figure 12. Site 4 Grade 8 SAT 9 CDFs for EO/lowSES.
Table 37 and Figure 13 present percentile rank information for EO/higherSES students similar to that presented in Table 36 for EO/low SES students.Students performed near the national level in all three subject areas (reading, mathapplication, and math computation), with reading percentiles being slightly lowerthan the NPRs. No major differences were found between reading and math. Thesefindings suggest that the language factors have more critical impact on studentswith low English language proficiency and low SES.
Hawaii Grade 8 Stanford 9 Reading CDF’s
Engish Only Students Receiving Free Lunch
Percentile Rank 97877561483421111Cumulative Percent
100
80
60
40
20
0
ReadingMath Appl.
Math Comp.

51
Table 37
Site 4 Grade 8 SAT 9 Percentile Ranks for EO/higher SES atCumulative Distribution Quartiles, by Subsection
Quartiles
Sub-test N 1st 2nd 3rd
Reading 6,317 24 47 72
Math application 6,317 25 50 75
Math computation 6,317 26 48 77
Figure 13. Site 4 Grade 8 SAT 9 CDFs for EO/higherSES.
Table 38 and Figure 14 present percentile rank results for LEP students.Comparing these data with the data for non-LEP students suggests, once again, thatLEP students perform substantially lower than non-LEP students in subject areaswith a higher level of language demand. As Figure 14 shows, the content curve forreading was well above the diagonal line (national performance). The content curvesfor math application and math computation were also above the diagonal line, butthe distance was much smaller than the reading curve distance.
Descriptive statistics for SES status in Site 4 will be presented in more detail inthe multivariate section of this report. The interaction between LEP status and SESwill also be analyzed.
Hawaii Grade 8 Stanford 9 Reading CDF’s
English Only Students Not Receiving Free Lunch
Percentile Rank
97877561483421111Cumulative Percent
100
80
60
40
20
0
Reading
Math Appl.Math Comp.

52
Table 38
Site 4 Grade 8 SAT 9 Percentile Ranks for LEP Students atCumulative Distribution Quartiles, by Subsection
Quartiles
Sub-test N 1st 2nd 3rd
Reading 767 1 7 17
Math application 767 10 19 33
Math computation 767 9 21 52
Figure 14. Site 4 Grade 8 SAT 9 CDFs for LEPstudents.
Hawaii Grade 8 Stanford 9 CDF’s
LEP Students
Percentile Rank
98887762483421111Cumulative Percent
100
80
60
40
20
0
ReadingMath Appl.Math Comp.

53
Item-Level Analyses
To estimate reliability of the standardized achievement tests used in thisstudy, we considered different approaches. Since parallel forms or test-retest datawere not available, we decided to use an internal consistency approach. The mainproblem with the internal consistency approach, however, is the assumption ofunidimensionality. The literature has suggested that Cronbach’s alpha, which is ameasure of internal consistency, is extremely sensitive to multi-dimensionality oftest items (see, for example, Abedi, Lord, & Hofstetter, 1997; Cortina, 1993).However, because the test items within each content area are supposed to measurethe same construct, we believe this approach may be appropriate for estimatingreliability of the achievement tests used in this study.
Based on the analyses of data from other sites, we suggested earlier that thelanguage load of the test items might introduce a bias into the assessment. That is, alanguage factor may act as a source of measurement error in the assessment of LEPstudents. To examine the hypothesis of the impact of language on assessment, weperformed a principal components analysis on the item-level data and computedinternal consistency coefficients (coefficient alpha) by bilingual status (for issuesconcerning factoring phi-coefficient, see Abedi, 1997). We also compared theperformance of LEP with non-LEP students at the item-level to examine the possibledifferential functioning of each item across the LEP categories.
Because different data sites used different tests and, within the individualsites, different test forms were used in different grades, these analyses wereperformed separately for each site and each grade. Within each grade, we conductedthe internal consistency analyses separately for bilingual and non-bilingual studentsso that we could compare the subtest internal consistencies for the bilingual andnon-bilingual groups. We will report the findings of this part of our study for eachsite separately.
Site 1
Internal consistency of test items by student language status. Site 1 did nothave information on LEP status, but instead provided information on bilingualstatus. Students were categorized as either bilingual or non-bilingual. While the

54
bilingual status of students may be different with their LEP status, we used thisinformation as a proxy for LEP status.
Table 39 summarizes the results of the principal components and internalconsistency analyses for math (problem solving, concepts, estimation, datainterpretation, and computation subsections) and reading. For each of the sixsubsections, more than one component with eigenvalue greater than one wasextracted. Across the subsections, the number of components (factors) witheigenvalue greater than one ranged from 2 through 8. The percent of commonvariance explained by the first component was below 26% of the total item variancefor each subsection at each grade. If the items in a subtest were all measuring thesame construct, then we would have expected a higher proportion of commonvariance for the first principal component. These results may suggest low internalconsistency among the test items in the math and reading subsections, particularlyfor the bilingual subgroup.
To examine the pattern of item internal consistency among bilingual and non-bilingual students, we computed coefficient alphas separately for the two groups ofstudents. As the results in Table 39 show, the item responses of bilingual students ingeneral show lower internal consistency. The gap between the internal consistencycoefficients of the two groups varied across grade and test subsection. Consistentwith our findings reported earlier, the differences between the bilingual and non-bilingual groups were small for Grade 3. For higher grades, this gap increased. Forexample, in Grade 3, the average alpha coefficient (across the six subtests) was .74for bilingual students and .76 for non-bilingual students. In Grade 6, the averagewas .71 for bilingual students and .84 for non-bilingual students. In Grade 8, theaverage was .74 for bilingual students and .83 for non-bilingual students. This trendmay occur because the test items for Grade 3 may be less linguistically complex thanthe items for the higher grades.

55
Table 39
Site 1 Summary Results of Principal Components and Reliability Analyses
Subsection/GradeNumber of
componentseigenvalue>1
Percent ofvariance of 1st
component
Reliability (α)bilingual
Reliability (α)non-bilingual
Math problem solving
Grade 3 2 22.88 .74 .70
Grade 6 2 20.68 .64 .77
Grade 8 3 16.84 .60 .71
Math concepts
Grade 3 2 17.43 .72 .74
Grade 6 4 17.01 .66 .82
Grade 8 4 16.49 .75 .83
Math estimation
Grade 3 2 24.99 .69 .70
Grade 6 3 17.89 .65 .73
Grade 8 5 13.80 .63 .68
Math data interpretation
Grade 3 2 25.25 .60 .66
Grade 6 2 20.16 .51 .69
Grade 8 3 15.86 .48 .64
Math computation
Grade 3 5 23.31 .89 .90
Grade 6 7 20.91 .87 .90
Grade 8 7 20.25 .88 .90
Reading
Grade 3 6 16.77 .82 .85
Grade 6 5 16.64 .65 .88
Grade 8 9 14.67 .72 .87
It is also clear from the results shown in Table 39 that the gap betweeninternal consistency (alpha) coefficients for bilingual and non-bilingual studentsvaried across the content areas. Internal consistency coefficients for subsections withmore language load were substantially lower for bilingual students. For example, onthe reading subsection in Grades 6 and 8 the average alpha was .68 for bilingualstudents, compared with .88 for non-bilingual students. However, on the mathcomputation subsection, which has less language demand, there was a

56
correspondingly smaller difference between the alphas for bilingual (.88) and non-bilingual (.90) students.
Figure 15 compares the internal consistency coefficients for bilingual andnon-bilingual students across the four different content areas for Grade 3. Thedifferences between the bilingual and non-bilingual alphas were very small and, insome cases, non-existent.
Figure 15. Site 1 Grade 3 reliability alphas.
Figure 16 and Figure 17 present the results of analyses for Grades 6 and 8,respectively. As indicated earlier, the differences in alpha coefficients betweenbilingual and non-bilingual students in Grades 6 and 8 were substantially largerthan the differences in Grade 3. The largest differences between bilingual and non-
0
0.1
0.2
0.3
0.4
0.5
0.6
0.7
0.8
0.9
1
Math ProblemSolving
Math Concepts Math Estimation Math DataInterpretation
MathComputation
Reading
BilingualNon-BilingITBS Subscale
Site 1 Grade 3 Reliability by Bilingual Status

57
bilingual students occur in reading, where the language load is greatest. In mathcomputation, where the language load is smallest, the alpha differences were thesmallest.
Figure 16. Site 1 Grade 6 reliability alphas.
0
0.1
0.2
0.3
0.4
0.5
0.6
0.7
0.8
0.9
1
Math ProblemSolving
Math Concepts Math Estimation Math DataInterpretation
MathComputation
Reading
BilingualNon-BilingITBS Subscale
Site 1 Grade 6 Reliabilityby Bilingual Status

58
Figure 17. Site 1 Grade 8 reliability alphas.
The lower reliability (internal consistency) may have been caused by restrictionof range in the bilingual population. It is plausible that the restriction of range in thebilingual group was an effect of language and other factors, such as SES andopportunity to learn (OTL). We used the Grade 8 reading and math computationsubtests to illustrate the possible impact of restriction of range. In the high languagedemand reading content area, there was a large difference in the reliabilities for thebilingual and non-bilingual groups, with alphas of .722 and .869, respectively. Therewas also a large difference in the reading raw score7 variances for the two groups,32.73 and 62.04, resulting in a significant restriction of range in the bilingual group.Figure 18 and Table 40 show the bilingual and non-bilingual reading raw scoredistributions for the two groups along with the variances and alpha reliabilities. Thebilingual distribution had less spread and was centered lower than the non-bilingualdistribution. In stark contrast, in the low language demand math computation area,there was a small difference in the internal consistency reliabilities for the two
7Here we used raw scores rather than NCEs because Cronbach’s alpha utilizes raw score variance.
0
0.1
0.2
0.3
0.4
0.5
0.6
0.7
0.8
0.9
1
Math ProblemSolving
Math Concepts MathEstimmation
Math DataInterpretation
MathComputation
Reading
BilingualNon-BilingITBS Subscale
Site 1 Grade 8 Reliabilityby Bilingual Status

59
groups, and the raw score variances were similar in magnitude. Figure 19 and Table41 show the math computation distributions, variances, and alphas for the twogroups. The distributions were quite similar for the two groups.
Figure 18. Site 1 Grade 8 reading distributions and reliability.
Table 40
Site 1 Grade 8 Reading Distributions and Reliability
LEP/SES status Mean Variance Cronbach’s alpha
Non-bilingual 25.60 75.14 .869
Bilingual 17.76 36.65 .722
We believe that language (and perhaps other factors, such as SES and OTL)causes a restricted range distribution, a distribution of scores with lower variability,and this in turn causes lower internal consistency.
Site 1 Grade 8 Reading ITBS Raw Score Distributions By Bilingual Service Status
0
5
10
15
20
25
1-3 4-6 7-9 10-12 13-15 16-18 19-21 22-24 25-27 28-30 31-33 34-36 37-39 40-42 43-45 46-48 49-51
Number of Correct ResponsNon BilingualBilingual
-
Perc
ent o
f cas
es
Number of correct responses

60
Figure 19. Site 1 Grade 8 math computation distributions and reliability.
Table 41
Site 1 Grade 8 Math Computation Distributions and Reliability
LEP/SES status Mean Variance Cronbach’s alpha
Non-bilingual 25.80 79.24 .904
Bilingual 22.49 69.09 .884
Another factor that could affect the size of alpha (the internal consistencycoefficient) is the number of test items. Because the number of items varied acrossthe subsections, the internal consistency coefficients may differ in size. To control fordifferences in alpha due to differences in the number of items, we adjusted theinternal consistency coefficients by the number of items. The subsection with themaximum number of items was the reading subsection for Grade 8, with 49 items.We thus adjusted the alpha coefficients to reflect a constant length of 49 items foreach subsection. Table 42 presents the unadjusted and adjusted alpha coefficients.By increasing the number of items, the internal consistency coefficients increasedsubstantially in some cases. However, the general trend of lower internalconsistency coefficients for the bilingual students remained.
0
2
4
6
8
10
12
14
16
18
1-3 4-6 7-9 10-12 13-15 16-18 19-21 22-24 25-27 28-30 31-33 34-36 37-39 40-42 43-45
Number of Correct Respons Non BilingualBilingual
-
Perc
ent o
f cas
es
Number of correct responses

61
Table 42
Site 1 Internal Consistency Coefficients Adjusted by the Number of Items
Unadjusted Adjusted
Subsection/Grade Reliability (α)bilingual
Reliability (α)non-bilingual
Reliability (α)bilingual
Reliability (α)non-bilingual
Math problem solving
Grade 3 (14 items) .74 .70 .91 .89
Grade 6 (18 items) .64 .77 .83 .90
Grade 8 (20 items) .60 .71 .79 .86
Math concepts
Grade 3 (20 items) .72 .74 .86 .87
Grade 6 (28 items) .66 .82 .77 .89
Grade 8 (32 items) .75 .83 .82 .88
Math estimation
Grade 3 (12 items) .69 .70 .90 .91
Grade 6 (20 items) .65 .73 .82 .87
Grade 8 (24 items) .63 .68 .78 .81
Math data interpretation
Grade 3 (10 items) .60 .66 .88 .91
Grade 6 (14 items) .51 .69 .79 .89
Grade 8 (16 items) .48 .64 .74 .84
Math computation
Grade 3 (34 items) .89 .90 .92 .93
Grade 6 (41 items) .87 .89 .89 .91
Grade 8 (43 items) .88 .90 .90 .91
Reading
Grade 3 (36 items) .82 .85 .86 .88
Grade 6 (44 items) .65 .88 .68 .89
Grade 6 (44 items) .72 .87 .72 .87
The results presented so far demonstrate that bilingual students do notperform as well as non-bilingual students, especially in content areas with higherlanguage demand. Results of analyses on individual test items were consistent withthis general trend. That is, in most of the cases, item scores for the bilingual studentswere lower than the item scores for non-bilingual students. However, the item-leveldifferences between bilingual and non-bilingual students varied greatly across thetest items. Some of the test items were more difficult for the bilingual students than

62
other items, and items may function differently with different groups. We speculatethat items with more complex language would be more difficult for bilingualstudents, regardless of the level of content difficulty.
We computed the difference between the mean score for each individual itemacross the bilingual categories by subtracting the mean score for bilingual studentsfrom the mean score for non-bilingual students. We called this difference“Difference between Bilingual and Non-bilingual students” (DBN). Because all ITBSitems were in multiple-choice format, DBN was the difference between theproportion of correct responses for bilingual and non-bilingual students. A negativeDBN indicates that bilingual students had higher performance than their non-bilingual peers on that particular item. Due to space limitations, we did not includethe results of this analysis in our report. However, we summarize the results of item-level DBN in Table 43. We rank ordered the items based on the magnitude of DBNand present the minimum, maximum, and average DBN for each ITBS subsection.
As the results indicate, the range and average of DBN vary across the gradelevels and content areas. For Grade 3, the average DBN was small on all subtests,except reading. The average DBN in the math computation subtest was negative,indicating that bilingual students performed slightly better than non-bilingualstudents. This was consistent with our earlier Grade 3 findings that there was aminimal performance gap between bilingual and non-bilingual students. For Grades6 and 8, the DBN was larger in content areas with more language demand. Themaximum difference between the proportion of correct responses of bilingual andnon-bilingual students was .29 for Grade 6 and .38 for Grade 8 reading.

63
Table 43
Site 1 Item-Level Response Differences Between Bilingual and Non-Bilingual Students (DBN)
Subsection/Grade # of items Minimum Maximum Average DBN
Math problem solving
Grade 3 14 .01 .07 .04
Grade 6 18 .01 .19 .12
Grade 8 20 .03 .26 .12
Math concepts
Grade 3 20 -.02 .08 .01
Grade 6 28 -.01 .25 .09
Grade 8 32 -.01 .21 .12
Math estimation
Grade 3 12 .00 .03 .01
Grade 6 20 .00 .14 .09
Grade 8 24 -.02 .16 .08
Math data interpretation
Grade 3 10 -.03 .09 .04
Grade 6 14 .01 .25 .08
Grade 8 16 .05 .28 .11
Math computation
Grade 3 34 -.05 .01 -.02
Grade 6 41 -.02 .15 .04
Grade 8 43 .01 .17 .07
Reading
Grade 3 36 -.04 .17 .08
Grade 6 44 .02 .29 .15
Grade 8 49 .03 .38 .15
As expected, on items with less language demand, the size of DBN wassubstantially smaller than the DBN presented for the reading subsections. Forexample, on the math computation subsection the maximum DBNs for Grades 6 and8 were .15 and .17, while on the reading subsection the maximum differences forGrades 6 and 8 were .29 and .38, respectively.

64
Site 2
Site 2 is an entire state with a large LEP population. This site provided dataon SAT 9 for all students in all elementary schools, middle schools, and high schoolsfor the entire state, along with information on bilingual status and other backgroundvariables. Table 44 presents reliability (internal consistency) coefficients for the SAT9 data for Grade 2. Consistent with the data presented earlier for lower grades, therewas only a slight difference between the alpha coefficients across the LEP categories.Non-LEP students had slightly higher coefficients than the LEP students. There wasalso a slight difference between the alpha coefficients across the SES categories.Higher SES students had slightly higher alphas than low SES students. For example,the average reliability for reading subscale for the higher SES group was .913, ascompared with an average reliability of .893 for the low SES group. The averagereliability for non-LEP was .914, as compared with an average reliability of .856 forLEP students.
As the data in Table 44 show, the difference between reliability coefficients ofLEP and non-LEP was larger than the difference between reliability coefficients ofhigh and low SES.

65
Table 44
Site 2 Grade 2 SAT 9 Sub-Scale Reliabilities (1998), Unadjusted Alphas
Non-LEP students
Sub-scale (# items) Higher SES Low SES EO FEP RFEP LEP
Reading N = 209,262 N = 58,485 N = 234,505 N = 29,771 N = 3,471 N = 101,399
Word Study (48) .917 .895 .916 .915 .920 .865
Vocabulary (30) .913 .897 .915 .906 .907 .857
Reading Comp.(30)
.908 .888 .910 .900 .899 .846
Average reliability .913 .893 .914 .907 .909 .856
Math N = 220,971 N = 63,146 N = 249,000 N = 31,444 N = 3,673 N = 118,740
Problem Solving(45)
.893 .881 .896 .886 .890 .871
Procedures (28) .892 .892 .891 .887 .895 .890
Average reliability .893 .887 .894 .887 .893 .881
Language N = 218,003 N = 62,028 N = 245,384 N = 31,035 N = 3,612 N = 111,752
Total (44) .890 .866 .891 .883 .892 .829
Since the number of test items affects test reliability, we adjusted the reliabilitycoefficients based on the number of test items. Table 45 presents reliabilitycoefficients based on the assumption that all subscales have the same number ofitems. The trend that was observed between the higher and low SES groups, andbetween LEP and non-LEP students, before adjusting by the number of items holdsin the adjusted reliability coefficients. In this table, reliability coefficients for higherSES students were lower than the coefficients for low SES students and the reliabilitycoefficients for non-LEP students were higher than those for LEP students.

66
Table 45
Site 2 Grade 2 Content Area NCEs and Sub-Scale Reliability Adjusted Alphas Based on 54 Items
Non-LEP students
Sub-scale (# items) Higher SES Low SES EO FEP RFEP LEP
Reading NCE = 50.9 NCE = 40.0 NCE = 48.6 NCE = 48.5 NCE = 47.5 NCE = 31.4
Word study (48) .926 .906 .925 .924 .928 .878
Vocabulary (30) .950 .940 .951 .946 .946 .915
Reading comp. (30) .947 .935 .948 .942 .941 .908
Average reliability .941 .927 .941 .937 .938 .900
Math NCE = 51.9 NCE = 41.1 NCE = 49.3 NCE = 50.7 NCE = 51.2 NCE = 37.2
Problem solving (45) .909 .899 .912 .903 .907 .890
Procedures (28) .941 .941 .940 .938 .943 .940
Average reliability .925 .920 .926 .921 .925 .915
Language NCE = 52.6 NCE = 40.0 NCE = 49.9 NCE = 49.5 NCE = 48.4 NCE = 31.3
Total (44) .909 .888 .909 .903 .910 .856
Table 46 presents unadjusted reliability (internal consistency) coefficients forGrade 7. Comparing the internal consistency coefficients for Grade 7 with those forGrade 3 (reported in Table 44 and Table 45) reveals interesting trends. In general, thereliability coefficients for LEP students were lower than the coefficients for non-LEPstudents. We indicated earlier that this might be due to the impact of languagefactors as a source of measurement error. This trend of lower reliability for LEPstudents can be seen for both Grades 3 and 7. However, in Grade 7, the differencebetween reliability coefficients for LEP and non-LEP was larger. For example, thedifference between reliability coefficients for LEP and non-LEP in Grade 3 was .058in reading, .013 in math, and .062 in language, as compared with the LEP and non-LEP reliability difference of .078 for reading, .093 for math, and .109 for language inGrade 7. As these results suggest, the difference between reliability coefficients forLEP and non-LEP students was larger for Grade 7 when compared with Grade 3.This difference was even larger for Grade 9. The difference between reliabilitycoefficients for LEP and non-LEP for Grade 9 was .126 in reading, .096 in math, and.130 in language, as compared with the respective differences of .058 in reading, .013in math, and .062 in language for Grade 3.

67
Table 46
Site 2 Grade 7 SAT 9 Sub-Scale Reliabilities (1998), Unadjusted Alphas
Non-LEP
Sub-scale (# items) Higher SES Low SES EO FEP RFEP LEP
Reading N = 210,325 N = 56,910 N = 207,017 N = 34,730 N = 25,488 N = 99,074
Vocabulary (30) .852 .835 .862 .849 .811 .755
Reading comp. (54) .914 .906 .919 .910 .886 .870
Average reliability .883 .871 .891 .880 .849 .813
Math N = 211,396 N = 57,471 N = 208,363 N = 34,913 N = 25,591 N = 71,277
Problem solving (50) .907 .867 .907 .909 .888 .806
Procedures (30) .891 .850 .888 .896 .877 .803
Average reliability .899 .859 .898 .903 .883 .805
Language N = 208,896 N = 56,567 N = 205,734 N = 34,424 N = 25,305 N = 69,364
Mechanics (24) .811 .779 .819 .804 .751 .723
Expression (24) .824 .798 .832 .816 .771 .710
Average reliability .818 .789 .826 .810 .761 .717
Table 47 presents adjusted reliability coefficients for Grade 7. By increasing thenumber of items in a test, reliability coefficients increased for both LEP and non-LEPgroups but the trend of differences between LEP and non-LEP remained the samewith the unadjusted coefficients. That is, increasing the number of items reduced theperformance gap between LEP and non-LEP students slightly, but the reduction inperformance gap was not large enough to be noticeable.

68
Table 47
Site 2 Grade 7 Content Area NCEs and Sub-Scale Reliability Adjusted Alphas Based on 54 Items
Non-LEP
Sub-scale (# items) Higher SES Low SES EO FEP RFEP LEP
Reading NCE = 52.3 NCE = 40.2 NCE = 50.3 NCE = 48.5 NCE = 46.1 NCE = 25.2
Vocabulary .912 .901 .918 .910 .885 .847
Reading comp. .914 .906 .919 .910 .886 .870
Average reliability .913 .904 .919 .910 .886 .859
Math NCE = 52.6 NCE = 41.5 NCE = 50.0 NCE = 51.5 NCE = 50.0 NCE = 33.6
Problem solving .913 .876 .913 .915 .895 .818
Procedures .936 .911 .935 .939 .928 .880
Average reliability .925 .894 .924 .927 .912 .849
Language NCE = 55.4 NCE = 44.1 NCE = 53.1 NCE = 53.4 NCE = 51.9 NCE = 31.2
Mechanics .906 .888 .911 .902 .872 .854
Expression .913 .899 .918 .909 .883 .846
Average reliability .910 .899 .915 .906 .878 .850
Table 48 presents the unadjusted reliability coefficients for Grade 9. Comparingthese with Grade 3 (reported in Table 44 and Table 45) again revealed that reliabilitycoefficients for LEP students were lower than the coefficients for non-LEP students.Once again, this could be due to the impact of language factors as a source ofmeasurement error. In both Grades 3 and 9, reliabilities were lower for LEPstudents. However, in Grade 9, the difference between reliability coefficients for LEPand non-LEP was larger. For example, the difference between reliability coefficientsfor LEP and non-LEP was .058 in reading, .013 in math, and .062 in language inGrade 3, as compared with the LEP and non-LEP reliability difference of .109 forreading, .096 for math, and .120 for language in Grade 9. These differences for Grade9 were even higher than the differences for Grade 7. Thus, the reliability gapbetween LEP and non-LEP increases as grade level increases. This may be due to theuse of more complex language structures in higher grades.

69
Table 48
Site 2 Grade 9 SAT 9 Sub-Scale Reliabilities (1998), Unadjusted Alphas
Non-LEP
Sub-scale (# items) Higher SES Low SES EO FEP RFEP LEP
Reading N = 205,092 N = 35,855 N = 181,202 N = 37,876 N = 21,869 N = 52,720
Vocabulary (30) .828 .781 .835 .814 .759 .666
Reading comp. (54) .912 .892 .916 .903 .877 .833
Average reliability .870 .837 .876 .859 .818 .750
Math N = 207,155 N = 36,588 N = 183,262 N = 38,329 N = 22,152 N = 54,815
Total (48) .899 .853 .898 .898 .876 .802
Language N = 204,571 N = 35,886 N = 180,743 N = 37,862 N = 21,852 N = 52,863
Mechanics (24) .801 .759 .803 .802 .755 .686
Expression (24) .818 .779 .823 .804 .757 .680
Average reliability .810 .769 .813 .803 .756 .683
Science N = 163,960 N = 28,377 N = 144,821 N = 29,946 N = 17,570 N = 40,255
Total (40) .800 .723 .805 .778 .716 .597
Social science N = 204,965 N = 36,132 N = 181,078 N = 38,052 N = 21,967 N = 53,925
Total (40) .803 .702 .805 .784 .722 .530
Table 49 presents the adjusted reliability coefficients for Grade 9. A similartrend of higher reliability coefficients for non-LEP students was also evident.However, as was the case for Grade 7, the reliability difference between LEP andnon-LEP students decreases slightly by increasing the number of items.

70
Table 49
Site 2 Grade 9 Content Area NCEs and Sub-Scale Reliability Adjusted Alphas Based on 54 Items
Non-LEP
Sub-scale (# items) Higher SES Low SES EO FEP RFEP LEP
Reading NCE = 45.9 NCE = 36.6 NCE = 45.5 NCE = 42.4 NCE = 40.1 NCE = 23.4
Vocabulary .897 .865 .901 .887 .850 .782
Reading comp. .912 .892 .916 .903 .877 .833
Average reliability .905 .879 .909 .895 .864 .808
Math NCE = 53.4 NCE = 45.2 NCE = 52.4 NCE = 51.9 NCE = 50.7 NCE = 37.5
Total .909 .867 .908 .908 .888 .820
Language NCE = 52.0 NCE = 44.8 NCE = 51.1 NCE = 50.9 NCE = 49.9 NCE = 34.1
Mechanics .901 .876 .902 .901 .874 .831
Expression .910 .888 .913 .902 .875 .827
Average reliability .906 .882 .908 .902 .875 .829
Science NCE = 49.3 NCE = 42.1 NCE = 48.9 NCE = 46.6 NCE = 45.3 NCE = 34.5
Total .844 .779 .848 .826 .773 .667
Social science NCE = 49.3 NCE = 42.1 NCE = 48.7 NCE = 47.2 NCE = 45.9 NCE = 34.2
Total .846 .761 .848 .831 .778 .604
Internal consistency of test items by student language status. The results ofinternal consistency analyses that were reported earlier clearly demonstrated thatLEP student responses to test items suffer from lower internal consistency ascompared with non-LEP students. These results may lead us to believe thatlanguage factors may be responsible for the lower internal consistency for LEPstudents. However, the results of multiple regression and canonical correlationanalyses suggests that factors other than language may also contribute to the gapbetween internal consistency of the two groups of students. For example, the resultsof multiple regression analyses showed that ethnicity was the strongest predictoramong a set of variables (gender, reading, and math scores) in predicting LEP status.
The results of canonical analyses also helped us to understand confoundingof LEP status with other background variables. The results of canonical correlationanalyses indicated that parent education was one of the strongest associates of LEP

71
status. In this model, SES also showed a strong relationship with LEP status.However, a main factor affecting the internal consistency coefficient (alphacoefficient) was the distribution of scores. Restriction of range in the distribution ofscores may have substantial impact on the alpha and may cause it to beunderestimated. To present a clear picture of the restriction of range issue, we alsopresented the distribution of scores for subgroups of students that were formedbased on some background variables.
We will first discuss the results of our internal consistency analyses and willthen talk about the effect of score distributions on alpha coefficients.
We categorized all students into three mutually exclusive categories. Non-LEP students were categorized as either higher or low SES. The third category wascomprised of LEP students. We then computed alpha coefficients for these threesubgroups. If LEP status is mainly determined by SES, and if LEP students aremainly from low SES categories, then the scores distributions, as well as alphacoefficients, computed for low SES categories should be similar with thosecomputed for LEP students.
We computed alpha coefficients for Grades 2, 7, 9, and 11 in Site 2. The trendof results was very similar across the different grades. Due to space limitations, wewill only report the results for Grade 7.
The table at the bottom of Figure 20 presents alpha coefficients for readingcomprehension for Grade 7. As the table shows, the alpha coefficient for the higherSES group was .906, as compared with the alpha of .902 for the low SES group, aminor difference. The coefficient for the LEP group, however, was lower (alpha =.870) than the coefficient for the low SES group (alpha = .902). The variances for thehigher SES group (104.49) and for the low SES group (109.19) were similar, but theLEP group has smaller variance (86.40). Thus, the lower reliability for the LEP groupmay be due to restriction of range. However, restriction of range may have been theresult of language factors because language may have limited the level of ability torespond to the test items.
Figure 20 and Table 50 present the distribution of reading comprehensionscores for the three groups (higher SES, low SES, and LEP). LEP students had apositively skewed distribution. However, distributions for high and low SESstudents were negatively skewed. The distributions for the higher SES and LEPgroups are skewed to a relatively similar degree, but in different directions.

72
Figure 20. Site 2 Grade 7 reading comprehension distributions and reliability.
Table 50
Site 2 Grade 7 Reading Comprehension Distributions and Reliability
LEP/SES status Mean Variance Cronbach’s alpha
Higher SES 36.74 104.49 .906
Low SES 31.26 109.19 .902
LEP 23.85 86.40 .870
Figure 21 and Table 51 present the results for language scores for Grade 7.The trend of results for the language subsection was similar across the three contentareas to what was just described for the reading comprehension subsection. Alphacoefficients for the higher and low SES groups were relatively similar to each otherand were different from the alpha coefficients for the LEP group.
Site 2 Grade 7 Reading Comprehension Raw Score Distributions By ELL & SES Status
0
2
4
6
8
10
12
14
16
1-3 4-6 7-9 10-12 13-15 16-18 19-21 22-24 25-27 28-30 31-33 34-36 37-39 40-42 43-45 46-48 49-51 52-54
Number of Correct Respons Higher SESLow SESELL
Perc
ent o
f Cas
es
Number of Correct Responses

73
Figure 21. Site 2 Grade 7 language distribution and reliability.
Table 51
Site 2 Grade 7 Language Distribution and Reliability
LEP/SES status Mean Variance Cronbach’s alpha
Higher SES 31.15 83.69 .868
Low SES 26.35 79.69 .847
LEP 20.49 59.56 .803
Figure 22 and Table 52 present results for social science scores for Grade 7.For social science, more difference can be seen between the alphas for the higher(.837) and low (.767) SES groups than had been seen in the reading and languagesubsections, but there was also a much larger difference between LEP students (.605)and non-LEP students. On the reading and language subsections, the distributionsfor the higher SES and LEP groups showed a relatively similar degree of skewness,but in different directions. However, the distribution across SES and LEP categoriesfor the social science subsection showed a large difference in the degree of skewnessin the same direction.
0
2
4
6
8
10
12
14
16
1-3 4-6 7-9 10-12 13-15 16-18 19-21 22-24 25-27 28-30 31-33 34-36 37-39 40-42 43-45 46-48
Number of Correct ResponsHigher SESLow SESELL
Perc
ent o
f Cas
es
Number of Correct Responses

74
Figure 22. Site 2 Grade 7 social science distribution and reliability.
Table 52
Site 2 Grade 7 Social Science Distribution and Reliability
LEP/SES status Mean Variance Cronbach’s alpha
Higher SES 19.65 52.47 .837
Low SES 16.70 36.82 .767
LEP 13.12 20.90 .605
Figure 23 and Table 53 present results for math procedure scores for Grade 7.The distribution in this subsection more closely resembles the distribution of thesocial science subsection than the distributions we had seen in the reading andlanguage subsections. The difference between the alphas for the higher SES (.892),low SES (.852), and LEP (.803) groups is smaller than what has just been described inthe social science subsection.
0
5
10
15
20
25
30
35
1-3 4-6 7-9 10-12 13-15 16-18 19-21 22-24 25-27 28-30 31-33 34-36 37-39 40
Number of Correct ResponsHigher SESLow SESELL
Perc
ent o
f Cas
es
Number of Correct Responses

75
Figure 23. Site 2 Grade 7 math distribution and reliability.
Table 53
Site 2 Grade 7 Math Distribution and Reliability
LEP/SES status Mean Variance Cronbach’s alpha
Higher SES 15.38 51.38 .892
Low SES 12.07 38.03 .852
LEP 10.06 28.19 .803
The results of all these analyses, once again, suggest that even though LEPstatus may be partially confounded with SES and other background characteristics,it may not be explained by those characteristics alone.
Comparing performance of LEP and non-LEP students. The results ofanalyses comparing LEP and non-LEP students indicate that LEP studentsperformed substantially lower than non-LEP students. This finding was consistentacross grade levels, test levels, and across different sites. The results of item-levelanalyses were also consistent with the general statement that non-LEP studentsoutperform LEP students. However, individual items may differentially separateLEP from non-LEP students. That is, some test items may show a larger performancedifference between LEP and non-LEP students than other items.
To examine the level of differential performance of items when comparing LEPand non-LEP students, we computed the difference between the mean scores foreach individual item across the LEP and non-LEP categories, as discussed in the Site
0
5
10
15
20
25
30
35
1-3 4-6 7-9 10-12 13-15 16-18 19-21 22-24 25-27 28-30
Number of Correct ResponsHigher SESLow SESELL
Perc
ent o
f Cas
es

76
1 section of this chapter. (In the Site 1 section, we compared bilingual and non-bilingual groups). We computed “DBN” (here, this is the difference between LEPand non-LEP performance) for each individual item. A negative DBN indicates thatLEP students had performed higher than their non-LEP peers for that particularitem. Table 54 summarizes the results of item-level analyses comparing LEP andnon-LEP students.
There was a large difference between test items in assessing the performancedifference between LEP and non-LEP students. For example, the DBN index in mathranged from .03 to .26 for Grade 2, from .03 to .39 for Grade 7, and from .02 to .32 forGrade 9. For language and reading, the range of DBN was even wider than therange for math. For language the range of DBN was from .05 to .45 in Grade 2, from-.01 to .32 in Grade 7, and from .04 to .31 in Grade 9. For reading the range was from.03 to .24 in Grade 2, from .02 to .50 in Grade 7, and from .03 to .44 in Grade 9.
Table 54
Site 2 Item-Level Response Differences Between LEP and Non-LEP Students (DBN)
Subsection/Grade # of items Minimum Maximum Average DBN
Math
Grade 2 72 .03 .26 .12
Grade 7 80 .03 .39 .19
Grade 9 48 .02 .32 .16
Language
Grade 2 44 .05 .45 .19
Grade 7 48 -.01 .32 .24
Grade 9 48 .04 .31 .19
Reading
Grade 2 118 .03 .24 .14
Grade 7 84 .02 .50 .25
Grade 9 84 .03 .44 .24

77
The large differences between the performance of LEP and non-LEP studentssuggest that some of the test items could be more linguistically complex than others,regardless of the item content difficulty. Of course other factors, such as lack ofconstruct knowledge or opportunity to learn, could contribute to these differences aswell.
Site 3
Site 3 provided item-level data on SAT 9 for all students, as well as data on LEPstatus and whether or not students received accommodations. We computed theinternal consistency coefficient (coefficient alpha) for each of the content areas forthe total group, as well as for the subgroups that were formed based on languagebackground. Thus, we obtained coefficient alphas for the reading, science, and mathtests for the total population and for LEP, SWD, LEP/SWD, and non-LEP/non-SWDsubgroups separately.
Table 55 summarizes the results of the reliability analyses for students in thevarious LEP subgroups. The alpha coefficients are reported separately for Grades 10and 11 and for each of the three content areas (reading, science, and math). Thealpha coefficient in reading was .87 for LEP students in Grade 10. This coefficientwas .88 for non-accommodated LEP and .78 for accommodated LEP. For non-LEPstudents, the coefficient was .90. For Grade 11, the alpha coefficient was .87 for LEPstudents, .88 for non-accommodated LEP students, .80 for accommodated LEPstudents, and .90 for non-LEP students.

78
Table 55
Site 3 Reliability Coefficients for SAT 9 Reading, Science, and Math Sub-Tests by LEP andAccommodation Status
Reading (54 items) Science (40 items) Math (48 items)
n rtt n rtt n rtt
Grade 10
All LEP 328 .87 284 .64 338 .87
LEP/Non-acc. 174 .88 160 .69 167 .86
LEP/Acc. 154 .78 124 .54 171 .87
Non-LEP 10,000 .90 9,335 .75 9,345 .84
Grade 11
All LEP 289 .87 248 .68 277 .87
LEP/Non-acc. 154 .88 136 .71 142 .87
LEP/Acc. 135 .80 112 .63 135 .87
Non-LEP 7,814 .90 7,176 .81 7,299 .89
In science, the internal consistency coefficients were generally lower than thosereported for reading. This may be due to multi-dimensionality in the scienceconstruct/test. For Grade 10, the alpha coefficient was .64 for all LEP students (.69for non-accommodated and .54 for accommodated) and .75 for non-LEP students.The alpha coefficients were slightly higher for Grade 11. The internal consistencywas .68 for all LEP students (.71 for non-accommodated and .63 for accommodated)and .81 for non-LEP students.
Internal consistency coefficients of the math test by subgroups were higherthan those reported for science and were slightly lower than those reported forreading. For Grade 10, the alpha coefficient was .87 for all LEP students (.86 for non-accommodated and .87 for accommodated) and .84 for non-LEP students. For Grade11, the alpha was .87 for all LEP students (.87 for both non-accommodated andaccommodated) and .89 for non-LEP students.
As the data in Table 55 suggest, there is a trend toward lower reliabilitycoefficients for LEP students, particularly accommodated. This trend was evident inthe areas of reading and science, where language factors have greater impact. Forexample, the alpha coefficients were generally lowest in these areas for theaccommodated LEP students. We indicated earlier that these students had lower

79
reading scores, and this was probably the main reason why they receivedaccommodations. It must be indicated at this point that the internal consistencycoefficients for different subgroups were based on different numbers of students.The number of non-LEP students (from 7,100 to 10,000) was much larger than thenumber of LEP students. The smaller number of subjects may cause a significantdecrease in the size of the internal consistency coefficient due to the restriction ofrange problem (see, for example, Allen & Yen, 1979, pp. 194-196).
As in the previous sites, we adjusted the reliability coefficients by the numberof items in the test. Table 56 presents the reliability coefficients that were reported inTable 55, but were adjusted by the number of items. The science and math tests wereadjusted by the number of items (54) in the reading test, since the reading test hadthe largest number of items.
Table 56
Site 3 Adjusted Reliability Coefficients for SAT 9 Reading, Science, and Math Sub-Tests by LEPand Accommodation Status, Site 3
Reading (54 items) Science (40 items) Math (48 items)
n rtt n rtt n rtt
Grade 10
All LEP 328 .87 284 .71 338 .88
LEP/Non-acc. 174 .88 160 .75 167 .87
LEP/Acc. 154 .78 124 .61 171 .88
Non-LEP 10,000 .90 9,335 .80 9,345 .86
Grade 11
All LEP 289 .87 248 .74 277 .88
LEP/Non-acc. 154 .88 136 .77 142 .88
LEP/Acc. 135 .80 112 .70 135 .88
Non-LEP 7,814 .90 7,176 .85 7,299 .90
Comparing the adjusted reliabilities in Table 56 with the unadjustedreliabilities in Table 55 showed a slight improvement in the reliabilities. Thereliability gap between LEP and non-LEP students also decreased slightly, but thetrend of lower reliability for LEP students remained.

80
Figure 24 and Table 57 present results for reading comprehension scores forGrade 10. The raw score distribution seen in Figure 24 indicates a large positiveskew for the accommodated LEP students with the majority of these studentscorrectly responding to between 12 and 19 questions. The distribution for LEPstudents with no accommodation was also positively skewed, although to a lesserdegree than the accommodated LEP students. In comparison, the correct responsesfor non-LEP students approximate a normal distribution. The difference between thealphas for the non-LEP (.90), LEP with no accommodation (.88), and LEP withaccommodation (.78) may be due in part to a restriction of range issue. The largedegree of positive skew in the LEP with accommodation group results in a smallvariance (47.18) compared to the other two groups.

81
Figure 24. Site 3 Grade 10 Reading distribution and reliability.
Table 57
Site 3 Grade 10 Reading Distribution and Reliability
LEP/Accommodationstatus Mean Variance Cronbach’s alpha
Non-LEP 29.34 113.33 .90
No accommodation 24.49 93.20 .88
Accommodated 17.38 47.18 .78
Figure 25 and Table 58 present results for math scores for Grade 10. The rawscore distribution patterns are similar for non-LEP, LEP students withoutaccommodation, and LEP students with accommodation. Each group has apositively skewed distribution. The alpha coefficients, mean correct responses, andvariances are also similar for the three groups of students.
0
5
10
15
20
25
30
35
0-3 4-7 8-11 12-15 16-19 20-23 24-27 28-31 32-35 36-39 40-43 44-47 48-51 52-54
# of Correct Responses
Per
cen
t o
f C
ases
Non-LEP
No Accommodation
Accommodated

82
Figure 25. Site 3 Grade 10 math distribution and reliability.
Table 58
Site 3 Grade 10 Math Distribution and Reliability
LEP/Accommodationstatus Mean Variance Cronbach’s alpha
Non-LEP 18.38 60.34 .837
No accommodation 19.75 68.91 .863
Accommodated 18.67 74.13 .875
Item characteristics. As demonstrated earlier, LEP/SWD students generallyperform lower than the non-LEP/non-SWD students. This trend can be observedsystematically in the individual test items. That is, the proportions of correctresponse (in multiple-choice items) or mean performance scores (in performanceitems) were generally lower for LEP/SWD students. However, there was a large
Site 3 Grade 10 Math Raw Score Distributions By ELL & Accommodation Status
0
5
1 0
1 5
2 0
2 5
3 0
3 5
0 - 3 4 - 7 8 - 1 1 12 -15 16 -19 20 -23 24 -27 28 -31 32 -35 36 -39 40 -43 44 -47 48 -51
# of Correct ResponsesNon-LEP No AccommodationAccommodated

83
difference between the individual test items in terms of differential treatmentbetween LEP and non-LEP students. Some of the test items showed a much largergap than others in performance between the LEP and non-LEP groups. To present apicture of this phenomenon, item difficulty indices (p-value—proportion of correctresponse in multiple-choice items) were compared across the LEP and non-LEPcategories and an index, called differential treatment index (DTI), was computed.The DTI is simply the difference between p-values of the items across the LEP andnon-LEP groups. We categorized DTI into three different categories: (a) smalldifference, a difference between the LEP and non-LEP groups of less than 9percentage points, (b) moderate difference, a difference between 10 and 20percentage points, and (c) large difference, a difference greater than 20 percentagepoints.
Table 59 presents the DTIs for all three content areas for Grades 10 and 11.Based on the data in Table 56, for all LEP students in Grade 10, 18% of the readingitems had small DTI, 54% showed moderate DTI, and 28% had large DTI. For thenon-accommodated students, the percentages were 54%, 44%, and 2%, respectively;and for the accommodated students, the respective percentages were 11%, 30%, and59%. The results of DTI computation for the Grade 10 science test items for all LEPstudents showed that 88% of the items had small DTI; 10% had moderate DTI; and2% had large DTI. The percentages were 95%, 5%, and 0%, respectively, for the non-accommodated group and 68%, 22%, and 10%, respectively, for the accommodatedgroup. For the Grade 10 math items, the DTI for all LEP students was 100% in thesmall category and 0% in the moderate and large categories. For non-accommodatedstudents, the respective percentages were 100%, 0%, and 0%, and for accommodatedstudents, the percentages were 88%, 12%, and 0%, respectively.

84
Table 59
Site 3 Item Level Data: Raw Score p-Value Difference With Non-LEP Students as aReference—Reading, Science, and Math SAT 9 Scores
Percent of items with small, moderate & large p-value differences
Reading (54 Items) Science (40 Items) Math (48 Items)
Small Mod. Large Small Mod. Large Small Mod. Large
Grade 10
All LEP 18% 54% 28% 88% 10% 2% 100% 0% 0%
Non-acc. 54% 44% 2% 95% 5% 0% 100% 0% 0%
Acc. 11% 30% 59% 68% 22% 10% 88% 12% 0%
Grade 11
All LEP 11% 56% 33% 73% 23% 5% 98% 2% 0%
Non-acc. 37% 52% 11% 85% 10% 5% 100% 0% 0%
Acc. 4% 30% 67% 68% 20% 13% 90% 10% 0%
Note. All SWD students have been excluded from this table. A small difference was considered asless than 9 percentage points; a moderate difference as 10 to 20 percentage points; and a largedifference as greater than 20 percentage points.
Table 60 presents item-level response differences between LEP and non-LEPstudents. Due to space limitations, we did not report response differences betweeneach individual item. Instead, we reported the minimum, the maximum, and theaverage differences between responses to the items. The DBN (difference betweenLEP and non-LEP students) was highest for reading, lower for science, and lowestfor math. The average DBN over the two grade levels in reading, science, and mathwas .24, .08, and 0.0, respectively. That is, a big reduction trend can be seen in theaverage DBN from reading to science and from science to math. In the area of math,no major performance differences were found between LEP and non-LEP students.

85
Table 60
Site 3 Item-Level Response Differences Between LEP and Non-LEP Accommodated Students(DBN)
Subsection/Grade # of items Minimum Maximum Average DBN
Reading
Grade 10 54 -.06 .45 .23
Grade 11 54 .01 .54 .24
Science
Grade 10 40 -.17 .35 .07
Grade 11 40 -.06 .45 .08
Math
Grade 10 48 -.13 .14 .00
Grade 11 48 -.14 .20 -.01
Site 4
Reliability. Internal consistency coefficients were computed on item-level SAT9 data in reading, math, and science from Site 4. Table 61 presents a summary ofinternal consistency analyses for Grades 3, 5, 7, and 9. Internal consistencycoefficients are presented for LEP and non-LEP students. The non-LEP group wasdivided into higher and low SES. Reporting internal consistency coefficients by SESgroups help us understand the impact of SES on test scores and to determine howmuch of the reliability difference between LEP and non-LEP may be explained bySES.

86
Table 61
Reliability Coefficients for SAT 9 Reading Comprehension, Math Problem Solving, and MathProcedures by LEP and SES Status
Number ofstudents
Readingcomprehension
(54 items)
Math problemsolving (48 items)
Mathprocedures (30
items)
n rtt rtt rtt
Grade 3
All LEP 311 .869 .843 .867
Non-LEP/Low SES 2296 .916 .896 .883
Non-LEP/Higher SES 3708 .928 .902 .886
Grade 5
All LEP 285 .805 .836 .844
Non-LEP/Low SES 2090 .904 .890 .875
Non-LEP/Higher SES 3411 .910 .898 .885
Grade 7
All LEP 265 .851 .828 .852
Non-LEP/Low SES 1891 .915 .873 .860
Non-LEP/Higher SES 3096 .900 .893 .880
Grade 9
All LEP 290 .870 .833 NA
Non-LEP/Low SES 1491 .936 .896 NA
Non-LEP/Higher SES 3229 .928 .910 NA
As data in Table 61 show, the SAT 9 test scores for LEP students were lessreliable than for non-LEP students. The difference between reliability coefficients forthe LEP and non-LEP groups was largest in reading, then in math problem solving,and smallest in math procedures. There was also a small increasing trend in thereliability difference for higher grades. Once again, these results are consistent withthe results that were presented earlier based on the data from other sites.
To remove the influence of the number of items on the reliabilities, we adjustedthe reliabilities to reflect a constant length of 54 items. Table 62 presents the adjustedreliability coefficients. The LEP and non-LEP reliability differences were smallest inmath procedures. The reliability coefficients and LEP and non-LEP reliability gapswere similar in reading comprehension and math problem solving, where thelanguage demand was higher than in math procedures.

87
Table 62
Adjusted Reliability Coefficients for SAT 9 Reading Comprehension, Math Problem Solving, andMath Procedures by LEP and SES Status (Based on 54 Items)
Number ofstudents
Readingcomprehension
Math problemsolving
Mathprocedures
n rtt rtt rtt
Grade 3
All LEP 311 .869 .858 .921
Non-LEP/Low SES 2296 .916 .906 .931
Non-LEP/HigherSES
3708 .928 .912 .933
Grade 5
All LEP 285 .805 .852 .907
Non-LEP/Low SES 2090 .904 .901 .926
Non-LEP/HigherSES
3411 .910 .908 .933
Grade 7
All LEP 265 .851 .844 .912
Non-LEP/Low SES 1891 .915 .885 .917
Non-LEP/HigherSES
3096 .900 .904 .930
Grade 9
All LEP 290 .870 .849 NA
Non-LEP/Low SES 1491 .936 .906 NA
Non-LEP/HigherSES
3229 .928 .919 NA
Figure 26 shows Grade 7 raw score distributions for LEP and non-LEP studentsin reading and also presents descriptive statistics for the LEP and non-LEP groups.Table 63 presents overall means and variances as well as average reliabilitycoefficients for Grade 7 in Site 4. For non-LEP students, separate distributions arepresented for higher SES and low SES groups. The distributions of scores for the twonon-LEP groups were skewed to the left (negative skew). For LEP students, thedistribution was slightly skewed to the right (positive skew). However, the SES levelof the non-LEP students appears to impact the distribution. The higher SES/non-LEP group had more of a negative skew than the low SES group. The distributionfor the low SES/non-LEP group lay between the LEP and higher SES/non-LEPdistributions. As indicated earlier, in reading, the low SES students scored lowerthan higher SES students, but not as low as LEP students. These results suggest that

88
language factors may have a greater impact on performance than SES factors. Figure27 presents the distribution of scores for Grade 7 LEP and non-LEP students in mathproblem solving, and also presents the descriptive statistics for the three groups ofstudents. Table 64 presents the means and variances as well as reliability coefficientsfor the math problem solving for Grade 7 in Site 4. Comparing Figure 27 with Figure26 revealed similarities and differences between the data presented by the twofigures. Similar to the data that were presented in Figure 26 for reading, in mathproblem solving, the distribution of scores for LEP students was positively skewed.However, for higher SES/non-LEP students, the distribution of scores was moresymmetric. For low SES/non-LEP students, the math problem solving distributionwas slightly positively skewed. Thus, the differences between LEP and non-LEPdistributions were smaller in math problem solving.
Figure 26. Site 4 Grade 7 reading distributions and reliability.
Site 4 Grade 7 Reading Raw Score Distributions By ELL & Accommodation Status
0
5
10
15
20
25
0-3 4-7 8-11 12-15 16-19 20-23 24-27 28-31 32-35 36-39 40-43 44-47 48-51 52-54
# of Correct Responses
Per
cen
t o
f C
ases
Higher SES
Low SES
LEP

89
Table 63
Site 4 Grade 7 Reading Distributions and Reliability
LEP/SES status Mean Variance Cronbach’salpha
Non-LEP/Higher SES 38.09 85.65 .900
Non-LEP/Low SES 30.37 117.68 .915
LEP 23.44 74.69 .851
Figure 27. Site 4 Grade 7 math problem solving distributions and reliability.
Site 4 Grade 7 Math Problem Solving Raw Score Distributions By ELL & Accommodation Status
0
5
10
15
20
25
30
35
0-3 4-7 8-11 12-15 16-19 20-23 24-27 28-31 32-35 36-39 40-43 44-47 48-51
# of Correct Responses
Per
cen
t o
f C
ases
Higher SESLow SESLEP

90
Table 64
Site 4 Grade 7 Math Problem Solving Distributions and Reliability
LEP/SES status Mean Variance Cronbach’s alpha
Non-LEP/Higher SES 28.12 83.67 .893
Non-LEP/Low SES 21.11 74.81 .873
LEP 17.70 54.67 .828
The differences between the score distributions of the LEP and non-LEP groupswere even smaller in math procedures. Figure 28 compares the three mathprocedures’ raw score distributions for Grade 7. Table 65 presents the means andvariances as well as reliability coefficients for math procedures for Grade 7 in Site 4.The LEP and non-LEP/low SES distributions were quite similar to each other, whiledifferent from the non-LEP/higher SES distribution.
Figure 28. Site 4 Grade 7 math procedures distributions and reliability.
Site 4 Grade 7 Math Procedures Raw Score Distributions By ELL & Accommodation Status
0
5
10
15
20
25
30
35
0-3 4-7 8-11 12-15 16-19 20-23 24-27 28-30
# of Correct Responses
Per
cen
t o
f C
ases
Higher SESLow SES
LEP

91
Table 65
Site 4 Grade 7 Math Procedures Distributions and Reliability
LEP/SES status Mean Variance Cronbach’s alpha
Non-LEP/Higher SES 17.03 45.29 .880
Non-LEP/Low SES 12.26 39.98 .860
LEP 10.78 36.34 .852
To compare performance of LEP and non-LEP students at the item-level, wecomputed the DBN index on each individual item. Table 66 summarizes the resultsof these analyses. We presented a summary of DBN by subject areas and by gradelevel. The performance difference between LEP and non-LEP students was smallerin math (problem solving and procedures) than in reading. This finding wasconsistent with our earlier findings that performance difference between LEP andnon-LEP students is smaller in content areas (such as math and science) wherelanguage may not have much impact as in other areas (such as reading).
Table 66
Item-Level Response Differences Between LEP and Non-LEP Accommodated Students (DBN)
Subsection/Grade # of items Minimum Maximum Average DBN
Reading
Grade 3 54 .10 .38 .25
Grade 5 54 .02 .46 .28
Grade 7 54 .00 .52 .27
Grade 9 54 .09 .49 .27
Math problem solving
Grade 3 48 .00 .36 .20
Grade 5 48 .09 .43 .24
Grade 7 48 .05 .48 .22
Grade 9 48 -.02 .34 .17
Math procedures
Grade 3 30 .07 .39 .21
Grade 5 30 .08 .42 .25
Grade 7 30 .07 .36 .21


93
Multivariate Analyses
Site 1
Regression analyses. To investigate the strength of the relationships amongbilingual status and test scores, various regression models were explored. Bilingualstatus was used as a dependent variable in a regression model in which test scores(math concepts and estimation, math problem solving and data interpretation, mathcomputation, and reading), gender, and ethnicity were used as independentvariables. To present a clearer picture of the association of ethnicity (a categoricalvariable with five categories) and bilingual status, we used criterion-scaling multipleregression methodology (see Pedhazur, 1997, pp. 501-505). Rather than creating k-1dummy variables for the ethnic categories (where k is the number of categories), weused the ethnic group averages in one single variable called “ethnicity.” Thus, in thecriterion-scaling regression model, each individual’s value on the variable“ethnicity” is the mean score of the particular ethnic group of which the individualis a member. Because the math subsection NCE scores were highly correlated, toavoid the multi-collinearity problem, we used the math total NCE score instead ofthe math subsection scores.
A separate multiple regression analysis was conducted for each of the threegrades. Table 67 summarizes the results of multiple regression analyses for studentsin these grades.

94
Table 67
Site 1 Grades 3, 6, and 8 Multiple Regression Results
Variable B SE B ß t Sig t
Grade 3
Math total .0005 .0001 .025 4.479 <.0005
Reading -.0039 .0001 -.173 -30.851 <.0005
Gender .0144 .0030 .018 4.431 <.0005
Ethnicity .9940 .0060 .623 153.350 <.0005
Constants .1010 .0060
R = 0.647 R2 = 0.418
Grade 6
Math total -.0006 .0001 -.036 -5.120 <.0005
Reading -.0047 .0001 -.237 -33.730 <.0005
Gender .0006 .0030 .001 .175 .8610
Ethnicity 1.0130 .0110 .453 88.150 <.0005
Constants .2160 .0070
R = 0.518 R2 = 0.268
Grade 8
Math total -.0008 .0001 -.046 -5.94 <.0005
Reading -.0043 .0001 -.233 -29.99 <.0005
Gender .0073 .0030 .013 2.26 .0240
Ethnicity 1.0140 .0160 .365 64.70 <.0005
Constants .2200 .0070
R = 0.447 R2 = 0.200
As the data in Table 67 suggest, the results of multiple regression analyses wereconsistent across the three grades and indicate that test scores and ethnicity arepowerful predictors of bilingual status. The multiple R for the Grade 3 regressionmodel was .647 and R2 for this model is 0.418, indicating that about 42% of thevariance of bilingual status can be explained by math and reading test scores,ethnicity, and gender. In the Grade 3 model, all predictors had a significantcontribution to the prediction. Among the predictors, ethnicity (the criterion-scaledvariable) had the highest level of contribution to the prediction. The t-ratios fortesting the significance of prediction were significant above and beyond the .01nominal level for all four predictor variables. Once again, the beta coefficientssuggest that ethnicity was the strongest predictor of student bilingual status. For the

95
math and reading variables, reading (beta = -0.173) had a higher level ofcontribution to the prediction of bilingual status than math (beta = 0.025).
As indicated earlier, the results of the multiple regression analyses wereconsistent across the three grades. All three models suggest that ethnicity was thestrongest predictor of bilingual status, with the highest magnitude of the betacoefficient. The next strongest predictor was reading, followed by math. Onedifference among the results for the different grades was that the strength ofassociation decreases in the higher grades. R2 for the Grade 3 model was .418 (42% ofthe variance of bilingual status is explained). For Grade 6, R2 was .268 (27% of thevariance of bilingual status is explained), and for Grade 8, R2 was .200 (20% of thevariance of bilingual status is explained). Another difference was that in Grade 6,gender was not a significant predictor of bilingual status, whereas gender wassignificant in Grades 3 and 8. However, the gender differences were so small as to benot meaningful. Finally, the directionality of math as a predictor of bilingual statuswas reversed in Grade 3, where higher math totals are associated with bilingualmembership. However, the math effect in all three grades was quite small incomparison to the effects of reading and ethnicity.
Multivariate analysis of variance. To ascertain the significance of the meandifferences in the ITBS NCEs for the bilingual and non-bilingual populations, weemployed a single-factor multivariate analysis of variance (MANOVA) model. Inthis model, bilingual status was the explanatory variable and the four ITBS subscaleNCEs for reading, math problem solving and data interpretation, math concepts andestimation, and math computation were the outcome variables. We examined thedata for Grade 8. The overall model was significant, with Wilks’ lambda = .928, F(1,25232) = 487.76, p<.0001. There was strong evidence that the two bilingual statuspopulations differ in their overall ITBS test profiles. Table 68 presents the univariateresults for the four separate ITBS subtests.

96
Table 68
Site 1 Grade 8 Univariate Results
Subtest Error df F p-value Eta-Squared
Reading 25235 1805.44 < .0001 .067
Math problem solving 25235 1121.89 < .0001 .043
Math concepts 25235 742.75 < .0001 .029
Math computation 25235 260.96 < .0001 .010
The results shown in Table 68 indicate that the bilingual and non-bilingualpopulation means differ on each of the four subtests. The four non-bilingualpopulation subtest means are higher than those in the bilingual population.
Table 68 also displays the strength of association measure eta-squared for eachof the subtests. The eta-squareds rank the impact of bilingual status on the subtestscores. It is notable that this ranking coincides with the presumed level of Englishlanguage demand in these subtests. The largest impact of bilingual status is inreading, while the smallest impact is in math computation where there is littleEnglish language demand involved.
Site 2
Canonical correlation analysis. Literature suggests that background variablesimpact performance in school (see for example, Abedi, Lord, & Plummer, 1997;Abedi, Lord, & Hofstetter, 1998; Abedi, Hofstetter, Lord, & Baker, 1998; Cocking &Chipman, 1988; Garcia, 1991; LaCelle-Peterson & Rivera, 1994). Among thesebackground variables, SES was one of the strongest predictors of schoolachievement. To examine the importance of language factors in predictingperformance above and beyond other background variables, a canonical correlationmodel was created. In this model, SAT 9 subsection scores were related to SES,parent education, and LEP status. The purpose of this analysis was to determinehow much of the variance of achievement scores could be explained by the LEPstatus above and beyond the parent education and SES variable.
We created three canonical correlation models, one each for Grades 2, 7, and 9.The independent (Set 2) variables in all three models were LEP status, parenteducation, and SES status. For Grades 2 and 7, the canonical model included SAT 9subsection NCE scores in reading, math, language, and spelling as the dependent

97
(Set 1) variables. For Grade 9, the dependent variables were the reading, math,language, science, and social science NCE scores.
Table 69 presents a summary of the results of the canonical analysis for Grade2. The canonical model yielded three functions, of which only the first wasstatistically significant (Wilks’ Lambda = .70, p<0.001) and explained over 29% of theshared variance. The canonical correlation for this model was .542. All of thecorrelations of the Set 1 variables with the canonical variate were high, ranging from.766 (math) to .976 (reading). However, some of the correlations between the Set 2variables and the canonical variate were not as high as in Set 1. Among the Set 2variables, parent education had the highest correlation with the canonical variate(.912), while LEP status had a moderate correlation with the canonical variate (-.697),and SES had a relatively small correlation with the canonical variate (-.475).1
The academic performance (Set 1) canonical variate consisted mostly of thereading and language scores, as shown by the standardized canonical coefficients of.684 and .405, respectively. Math and spelling made negligible contributions to theSet 1 canonical variate. The background (Set 2) canonical variate was mostly theparent education variable (standardized coefficient = .714), with smallercontributions from LEP status (-.383) and SES (-.173).
The results of the canonical analysis described above suggest that there is ahigh degree of inter-correlation in student performance among the different subjectareas; that is, students who perform high in one of the four subject areas areexpected to perform high in other areas. This result suggests that language may bean underlying factor in achievement. It may also point to an underlying scholasticaptitude factor. The results also suggest that academic achievement is highlydependent on family and language factors, such as SES, parent education, and LEPstatus.
1 The negative sign of the correlation of a variable with the canonical variate is due to the reverse coding of thevariable.

98
Table 69
Site 2 Grade 2 Correlations Between Performance and Background Variables and FirstCanonical Variate, Standardized Canonical Coefficients, Percent of Variance Explained,and Canonical Correlation
First canonical variate
Variable Correlation Coefficient
Set 1 (dependent) variables
Reading .976 .684
Math .766 -.072
Language .926 .405
Spelling .809 .014
Set 2 (independent) variables
Parent education (ordered categories) .912 .714
LEP status (categorical) -.697 -.383
SES (ordered categories) -.475 -.173
Canonical correlation .542
Percent of shared variance explained by first canonical pair 29.4
Table 70 summarizes the results of the canonical analysis for Grade 7. As in theGrade 2 model, the Grade 7 model used the four subsection scores (reading, math,language, and spelling) as the Set 1 (dependent) variables and LEP status, SES, andparent education as the Set 2 (independent) variables.
The Grade 7 canonical model also yielded three functions, of which only thefirst was statistically significant (Wilks’ Lambda = .67, p<0.001) and explained over31% of the shared variance. The canonical correlation was .558. All of thecorrelations of the Set 1 variables with the canonical variate were high, ranging from.800 (math) to .988 (reading). As in Grade 2, the correlations between the Set 2variables and the canonical variate were not as high as in Set 1. Among the Set 2variables, parent education and LEP status strongly correlated with the canonicalvariate (.808 and -.805, respectively), while SES had a smaller correlation with thecanonical variate (-.518).
For Grade 7, the reading score (standardized coefficient = .767) dominated inthe canonical variate of the academic performance variables, while spelling made aminor contribution. Surprisingly, the language score made virtually no contribution(standardized coefficient = .028) to this canonical variate. The math contribution wasalso essentially nil. The canonical variate of the background variables consisted

99
mostly of LEP status and parent education (in roughly equal portions), with a muchsmaller contribution from the SES index.
Table 70
Site 2 Grade 7 Correlations Between Performance and Background Variablesand First Canonical Variate, Standardized Canonical Coefficients, Percent ofVariance Explained and Canonical Correlation
First canonical variate
Variable Correlation Coefficient
Set 1 (dependent) variables
Reading .988 .767
Math .800 .035
Language .870 .028
Spelling .854 .222
Set 2 (independent) variables
Parent education (ordered categories) .808 .540
LEP status (categorical) -.805 -.558
SES (ordered categories) -.518 -.221
Canonical correlation .558
Percent of shared variance explained byfirst canonical pair
31.2
Table 71 summarizes the results of the canonical analysis for Grade 9. Themodel used five subsection scores (reading, math, language, science, and socialscience) as the Set 1 (dependent) variables, and LEP status, SES, and parenteducation as the Set 2 (independent) variables.
The Grade 9 canonical model again yielded three functions, of which only thefirst was statistically significant (Wilks’ Lambda = .69, p<0.001) and explained morethan 29% of the shared variance. The canonical correlation was .544. All of thecorrelations of the Set 1 variables with the canonical variate were high, ranging from.776 (social science) to .990 (reading). As in Grades 2 and 7, the correlations betweenthe Set 2 variables and the canonical variate were not as high as for Set 1. Among theSet 2 variables, parent education and LEP status strongly correlated with thecanonical variate (.861 and -.753, respectively), while SES had a smaller correlationwith the canonical variate (-.397).

100
In the Grade 9 model, the academic performance canonical variate was almostexclusively the reading score (standardized coefficient = .758). The other academicvariables made very small contributions (each standardized coefficient is at most.120). Parent education and LEP status again dominate in the background canonicalvariate.
Table 71
Site 2 Grade 9 Correlations Between Performance and Background Variables andFirst Canonical Variate, Standardized Canonical Coefficients, Percent of VarianceExplained and Canonical Correlation
First canonical variate
Variable Correlation Coefficient
Set 1 (dependent) variables
Reading .990 .758
Math .797 .074
Language .853 .089
Science .817 .120
Social science .776 .022
Set 2 (independent) variables
Parent education (ordered categories) .861 .657
LEP status (categorical) -.753 -.506
SES (ordered categories) -.397 -.135
Canonical correlation .544
Percent of shared variance explained by firstcanonical pair
29.6
In all three grades, the academic variable that correlated most highly with thecanonical variate was reading (.976 to .990). Among the background variables,parent education and LEP status correlated most strongly with the canonical variate(magnitudes greater than .69). Taken together, the results of the multivariatecanonical correlation analyses confirm our earlier findings that suggest thatlanguage background has significant impact on academic performance.
Regression analyses. To further examine the contribution of LEP status topredicting performance, a series of regression models was examined for the Grade 9data. The dependent variables were the NCE scores on the reading, language, math,science, and social science subtests. For each subtest, three models were examined.

101
Model 1 was a simple regression model with the SES index as the predictor variable.Model 2 used the SES index and parent education as the predictor variables. Model 3used three predictor variables: the SES index, parent education, and LEP status.Model 3 captures the contribution of LEP status over and above the contributions ofSES and parent education level.
Table 72 presents a summary of the results of the regression analyses for Grade9. Because of the large sample sizes, all models were significant with p<.0005 and allpredictors were also significant with p<.0005. All of the Model 1 R2s were small,ranging from .027 in social sciences to .046 in reading. In all content areas, R2
increased substantially (and significantly) in Model 2 when parent educationentered the prediction. The increase in R2 was largest in reading (.173) and smallestin social sciences (.127). The increases in R2 when LEP status entered the predictions(from Model 2 to Model 3) were small to modest in absolute size, but statisticallysignificant, ranging from .022 in math to .071 in reading. With SES and parenteducation already in the reading model, the addition of LEP status increased thepercent of reading variance explained from 21.9 to 29.0, an absolute increase of 7.1%and a relative increase of 34.2 %. The absolute (relative) increases in R2 for the othersubtests were: 4.4% (25.4%) in language, 2.2% (12.6%) in math, 3.4% (20.2%) inscience, and 2.9% (18.8%) in social science. The standardized regression coefficients(the betas) suggest that in all five content areas, parent education is the mostpowerful of the three predictors, followed by LEP status. The negative betas for theLEP status and SES variables indicate that higher content NCEs are associated withthe non-LEP and higher SES categories. As expected, higher NCEs are associatedwith higher levels of parent education.
Further analyses. To better understand the complex effects of parent education,SES, and LEP status on SAT 9 achievement, we used three different but relatedapproaches:
1. 3-way full factorial Analysis of Variance (ANOVA) models;
2. Multiple regression models;
3. Change in R2 with nested multiple regression models.

102
Table 72
Grade 9 Multiple Regression Results for All Subtests Except Spelling
Dep Var Model 1 R2 Model 2 R2 Model 3 R2 betas
Reading .046 .219 .290 SES -.074
NCE ∆ = .173 ∆ = .071 Parent Ed .342
LEP -.284
Language .031 .173 .217 SES -.052
NCE ∆ = .142 ∆ = .044 Parent Ed .320
.029 .174 .196 LEP -.225
Math ∆ = .145 ∆ = .022 SES -.052
NCE Parent Ed .344
LEP -.159
Science .032 .168 .202 SES -.062
-.197 ∆ = .136 ∆ = .034 Parent Ed .319
LEP -.197
Social sciences .027 .154 .183 SES -.053
-.197 ∆ = .127 ∆ = .029 Parent Ed .311
LEP -.181
Note. Model 1 predictor: SES. Model 2 predictors: SES, parent education. Model 3predictors: SES, parent education, and LEP status. ∆ = change in R2.
In the first approach, we used a full factorial three-way ANOVA model withreading and math NCEs as the outcome variables and parent education, SES, andLEP status as the explanatory variables. The reading and math cell means from theANOVA are displayed in Table 73 and Table 74, respectively. All interactions andmain effects were significant at p<.0001 (as expected, because of the large samplesizes). The significant 3-way interactions indicate that the effect of any one variableon the SAT 9 NCEs depends on the combination of the levels of the other twovariables and that the joint effect of any two of the variables depends on the level ofthe third variable. For example, the effect of parent education on the SAT 9 readingNCE depends on the combination of SES and LEP status, and the joint effect ofparent education and LEP status on the SAT 9 reading NCE depends on the level ofSES. These effects are described in more detail in the following paragraphs.

103
Table 73
Site 2 SAT 9 Reading NCE Means
Low SES Higher SES
LEP Non-LEP LEP Non-LEP
Parent Ed Mean SD N Mean SD N Mean SD N Mean SD N
< HS Grad 21.74 11.14 8592 34.73 14.55 9909 22.43 11.69 15114 34.05 15.19 21229
HS Grad 22.99 12.02 3205 34.81 15.82 8122 23.59 12.48 6463 38.83 16.85 35524
Some college 26.06 12.32 1134 40.55 16.00 5740 27.99 13.42 2591 46.56 16.75 41583
College Grad 25.12 12.70 1121 40.42 17.09 4677 28.89 14.57 3308 50.37 17.63 54513
Post Grad 23.72 12.39 358 44.30 19.39 1032 31.16 12.40 958 59.33 18.20 22989
TOTAL 22.67 11.67 14410 37.13 16.08 29480 24.25 12.90 28434 46.34 18.65 175838

104
Table 74
SAT 9 Math NCE Means
Low SES Higher SES
LEP Non-LEP LEP Non-LEP
Parent Ed Mean SD N Mean SD N Mean SD N Mean SD N
< HS Grad 35.61 12.49 8892 43.97 15.58 10110 35.23 12.86 15751 42.52 15.98 21506
HS Grad 38.12 14.83 3283 43.40 16.50 8264 37.04 14.47 6698 46.34 17.48 35949
Some college 41.11 15.33 1156 48.00 17.06 5789 41.33 15.74 2632 53.28 17.98 41854
College Grad 42.93 16.95 1131 48.56 18.17 4698 47.17 19.71 3391 57.95 19.34 54750
Post Grad 41.30 16.31 362 53.08 19.92 1040 49.59 21.77 988 67.18 19.89 23028
TOTAL 37.29 13.96 14824 45.63 16.91 29901 38.07 15.46 29460 53.82 19.80 177087

105
First consider reading NCE for low SES students (the left panel of Table73). For the LEP subgroup, there was a rather weak relationship between thereading means and the level of parent education, with the “some college” and“college graduate” groups having higher means (26.06 and 25.12) than the “lessthan high school graduate” and “high school graduate” groups (21.74 and22.99). Surprisingly, the “post graduate” group mean (22.67) ranked lower thanexpected—between the high school and college groups. A possible explanationis that some LEP students reported the wrong parent education category. Suchstudents may have mistakenly thought that “post graduate degree” meant“graduated from elementary school” or “graduated from high school”—theymay have focused on the word “graduate”. It is thus possible that the “postgraduate” mean was underestimated.
Continuing with low SES students, within the non-LEP subgroup therelationship between the reading NCE means and parent education level wasstronger than in the LEP subgroup. The “less than high school graduate” and“high school graduate” means (34.73 and 34.81) were similar and lowest. The“some college” and “college graduate” means (40.55 and 40.42) were similar andconsiderably higher than the two high school group means. The “post graduate”mean (44.30) was the highest (as expected). Figure 29 shows these patternsgraphically.
Figure 29 also shows how the gap between the LEP and non-LEPsubgroups widened somewhat as parent education level increased: from 13NCE points in the “less than high school graduate” group, to 15 points in the“college graduate” group, to more than 20 points in the “post graduate” group.However, the gap may have been overestimated in the “post graduate” group,because the LEP subgroup mean may have been underestimated, as mentionedearlier. Within the low SES group, the overall gap between LEP and non-LEPstudents was about 14.5 NCE points (a weighted average across all parenteducation levels).

106
Figure 29. Site 2 Grade 9 reading NCE low SES by parent education and LEP status.
Turning now to the higher SES group (the right panel of Table 73), for LEPstudents the reading NCE means increased with increasing parent educationlevel, with the largest increase from “high school graduate” (23.59) to “somecollege” (27.99) and a small increase from “college graduate” (28.89) to “postgraduate” (31.16). The non-LEP student group again showed a stronger positiverelationship between reading NCE mean and level of parent education, with alarge increase at each higher level of parent education, and particularly largeincreases from “high school graduate” (38.83) to “some college” (46.56) andfrom “college graduate” (50.37) to “post graduate” (59.33).
The LEP and non-LEP gap increased dramatically from 11.6 at the “lessthan high school graduate” level to more than 21 at the “college graduate” leveland more than 28 at the “post graduate” level. Figure 30 shows these patternsand also shows how much more dramatic the parent education effect was in thehigher SES group, compared to the low SES group. Within the higher SESgroup, the overall LEP/non-LEP gap (averaged across parent education levels)was about 22 NCE points; this is considerably larger than the corresponding gapin the low SES group.
Among the three subgroups non-LEP/low SES, LEP/low SES, andLEP/higher SES, there was little NCE reading mean advantage (about 1 NCEpoint) to the “high school graduate” level versus the “less than high schoolgraduate” level of parent education. In these subgroups there was also little
Free or Reduced Price Lunch RecipientsBy Parent Education and LEP Status
0
10
20
30
40
50
60
70
<HS GRAD HS GRAD SOME COLL COLLGRAD POST GRAD
Parent education
Me
an
NC
E
Non-LEP LEP

107
Figure 30. Site 2 Grade 9 reading NCE higher SES by parent education and LEP status.
difference between the “some college” and “college graduate” reading means.However, there was a gap (ranging from 3 to almost 6 points) between the “highschool graduate” and “some college” levels; which was largest reading gapamong these three subgroups. In contrast, for the LEP/higher SES subgroup,there was an almost 5-point advantage to being at the “high school graduate”level versus the “less than high school” level of parent education. There wasalso an increase of at least 4.75 points with each additional increase in level ofparent education for this subgroup. Additionally, the largest gap in thissubgroup was between the “college graduate” and “post graduate” levels, a gapof about 9 points.
In math, the trends and patterns were similar to those just described inreading, but generally were not as pronounced. For each comparable group, themath NCE mean was higher than the reading mean. One difference betweenmath and reading occurred in the LEP/higher SES subgroup. In math, there wasan approximate 6-point advantage to the “college graduate” level over the“some college” level of parent education; whereas in reading, the correspondingadvantage was less than 1 point. The LEP and non-LEP math gaps generallywere smaller than in reading. Within the low SES group, the LEP and non-LEPmath gap was a little more than 8 points, while the reading gap was about 14.5points. Within the higher SES group, the LEP and non-LEP math gap was about15.7 points, compared with 22 points in reading. Figure 31 and Figure 32 showthe trends in math for the low and higher SES groups, respectively.
pBy Parent Education and LEP Status
0
10
20
30
40
50
60
70
<HS GRAD HS GRAD SOME COLL COLLGRAD POST GRAD
Parent education
Mea
n N
CE
Non-LEP LEP

108
Figure 31. Site 2 Grade 9 math NCE low SES by parent education and LEP status.
Figure 32. Site 2 Grade 9 math NCE higher SES by parent education and LEP status.
Table 75 shows the marginal (main effect) means for the various levels ofthe three explanatory variables. These marginal means are computed byaggregating across the levels of the other two variables. The LEP and non-LEPreading gap was approximately 21.5 NCE points on the average, while in maththe gap was about 15 points. However, as described above, the LEP effectdepends on the combination of SES and parent education levels. The overall SES
California Grade 9 Math NCEFree or Reduced-Price Lunch Recipients
By Parent Education and LEP Status
0
10
20
30
40
50
60
70
<HS GRAD HS GRAD SOME COLL COLLGRAD POST GRAD
Parent education
Mea
n N
CE
Non-LEP LEP
California Grade 9 Math NCENot Free or Reduced-Price Lunch Recipients
By Parent Education and LEP Status
0
10
20
30
40
50
60
70
<HS GRAD HS GRAD SOME COLL COLLGRAD POST GRAD
Parent education
Mea
n N
CE
Non-LEP LEP

109
reading and math gaps were approximately 11 and 9 NCE points, respectively.However, the SES effect depends on the combination of LEP status and parenteducation levels. Similarly the parent education effect depends on thecombination of SES and LEP status levels. The strongest parent education effectin both reading and math occurs in the non-LEP/higher SES group. Theweakest parent education effect in both reading and math occurs in theLEP/low SES group. For both reading and math, within both levels of SES, theparent education effect was stronger in the non-LEP subgroup; and the parenteducation effect was much stronger for non-LEP students than for LEP students.
Table 75
Site 2 Grade 9 Marginal (Main Effect) Reading and Math NCE Means
Reading Math
Mean SD N Mean SD N
LEP status
LEP 23.72 12.53 42,844 37.81 14.98 44,284
Non-LEP 45.02 18.59 205,318 52.63 19.62 206,988
SES
Low SES 32.38 16.26 43,890 42.87 16.47 44,725
Higher SES 43.26 19.52 204,272 51.57 20.01 206,547
Parent education
Not high school Grad 29.04 14.85 54,844 39.64 15.06 56,259
High school Grad 35.42 17.00 53,314 44.24 17.18 54,194
Some college 44.49 17.22 51,048 51.80 18.04 51,431
College Grad 48.08 18.41 63,619 56.44 19.59 63,970
Post Grad 57.15 19.54 25,337 65.55 20.59 25,418
Grand total 41.34 19.44 248,162 50.02 19.71 251,272

110
For the Grade 9 reading data, Table 76 presents estimates of two measuresof strength of association between the independent and dependent variables:eta-squared and omega-squared. (These measures are derived from sums ofsquares and degrees of freedom from the ANOVA summary table). Bothmeasures indicate the same ranking in strength of association, with LEP statusranking highest, followed by parent education, then SES, and finally theinteractions. Note that LEP status was estimated to be roughly three times asstrong as parent education, which is roughly four times as strong as SES.However, these measures were based on using parent education as a nominalvariable. Parent education was actually an ordinal variable, so the strength ofassociation of parent education with the SAT 9 NCEs was underestimated bythe ANOVA models.
Table 76
Site 2 Grade 9 Strength of Association and Standardized Regression Coefficientsfor Reading
Effect Eta-squared Omega-squared Beta
LEP status .049 .0356 -.142
Parent education .017 .0121 .411
SES .004 .0029 .088
Parent Ed by LEP .003 .0021 -.166
Parent Ed by SES .003 .0021 -.188
LEP by SES .001 .0005 -.045
Parent Ed by LEP by SES .001 .0016 .065
Eta-squared and omega-squared for the math model are presented in Table77. Both measures indicated the same ranking in strength of association withmath NCE: parent education was strongest, followed by LEP status. The otherexplanatory variables, including SES, were much less strongly associated withmath NCE. The math ranking was different from the reading ranking. Inreading, the ANOVA model ranked LEP status as the most strongly associatedexplanatory variable, while in math the ANOVA model ranked parenteducation as strongest.

111
Table 77
Site 2 Grade 9 Strength of Association and Standardized RegressionCoefficients for Math
Effect Eta-squared Omega-squared Beta
LEP status .013 .0107 -.078
Parent education .019 .0156 .400
SES .003 .0021 .119
Parent Ed by LEP .001 .0005 -.097
Parent Ed by SES .003 .0025 -.193
LEP by SES .001 .0004 -.043
Parent Ed by LEP by SES .001 .0005 .061
Another approach to assessing the impact of the three explanatoryvariables is to create a multiple regression (MR) model utilizing the threeexplanatory variables and their interactions as predictors of the SAT 9 NCEscores. In such a multiple regression model, parent education is treated as aninterval variable rather than as an ordinal variable. Thus the multiple regressionmodel will overestimate the strength of parent education. Within such an MRmodel, the absolute values of the standardized regression coefficients rank thepredictors in order of relative importance in the model.
The MR model for predicting reading NCE was significant at p<.0001 andwith R2 = .303. All variables and interaction were also significant at p<.0001. Wesee from Table 76 that among these predictors, parent education was the mostimportant predictor for reading, with the largest standardized regressioncoefficient (beta = .411). After parent education, the predictors LEP status, theinteraction of parent education and LEP status, and the interaction of parenteducation and SES were roughly similar in strength (with absolute betas of .142to .188), but lower than parent education. SES and the other interactions werethe least powerful predictors. However, the relative importance of parenteducation (and of the interactions involving parent education) was exaggeratedin this MR model.
The math NCE regression model was significant at p<.0001 and with R2 =.206. As with reading, all variables and interaction were also significant atp<.0001. We see from Table 77 that among these predictors, parent educationwas also the most important predictor for math, with the largest standardized

112
regression coefficient (beta = .400). After parent education, the interaction ofparent education and SES was the next most important predictor of math NCE(beta = -.193). SES (beta = .119) and the interaction of parent education with LEPstatus (beta = -.097) contributed slightly more to the model than did LEP status(beta = -.078). In the presence of the interactions, LEP status contributed less tothe math model than did parent education and SES. As discussed in theprevious paragraph, the relative importance of parent education (and of theinteractions involving parent education) was exaggerated in this MR model.
A third approach to assessing the effects of the three explanatory variables(and their interactions) on the SAT 9 NCEs is to create a sequence of nestedregression models and assess the change in R2 from model to model. A sequenceof five regression models was created. In the first three models, the predictorsSES, parent education, and LEP status were entered one-by-one. In Model 4 thethree 2-way interactions were entered. Finally the 3-way interaction was enteredin Model 5. Table 78 shows the five models and their R2s.
Table 78
Site 2 Grade 9 Nested Regression Models with Predictors and R-squared
Model Predictors R2 Reading R2 Math
1 SES .046 .029
2 SES, parent Ed .219 .174
3 SES, parent Ed, LEP .290 .196
4 SES, parent Ed, LEP, 2-way interactions .303 .206
5 SES, parent Ed, LEP, 2- & 3-way interactions .303 .206
As Table 78 shows, in reading, the largest change in R2 occurred with theentry of the parent education variable and the second largest change in R2
occurred with the entry of the LEP status variable. In math, the largest change inR2 also occurred with the entry of the parent education variable. The changes inR2 with the entries of SES (Model 1) and LEP status (Model 3) were similar andconsiderably smaller than the change in R2 attributable to parent education. Inboth reading and math, the additional increments in R2 provided by theinteractions were relatively unimportant. These results seem to indicate thatparent education was relatively more important than LEP status in the modelsfor reading and math. However, the changes in R2 depend on the order of entry

113
(discussed in the next paragraph). Also, the importance of parent education wasagain overestimated by these models, because parent education was an ordinalvariable, not an interval variable.
There were six possible orders in which the three predictor variables SES,LEP status, and parent education level could be entered into a regression model.The total R2 obtained after all three variables were entered (.290 for reading, .196for math) did not depend on the order of entry. However, the increments to R2
did depend on the order of entry. Table 79 presents the incremental R2s for thesix possible orders.
Table 79
Site 2 Grade 9 Increments to R-squared for Reading and Math
Predictors R2 Reading R2 Math
Order 1 SES .046 .029
SES, parent Ed .219 .174
SES, parent Ed, LEP .290 .196
Order 2 SES .046 .029
SES, LEP .190 .096
SES, LEP, parent Ed .290 .196
Order 3 LEP .172 .082
LEP, parent Ed .285 .194
LEP, parent Ed, SES .290 .196
Order 4 LEP .172 .082
LEP, SES .190 .096
LEP, SES, parent Ed .290 .196
Order 5 Parent Ed .209 .170
Parent Ed, LEP .285 .194
Parent Ed, LEP, SES .290 .196
Order 6 Parent Ed .209 .170
Parent Ed, SES .219 .174
Parent Ed, SES, LEP .290 .196
We see from Table 79 that of the three predictors, parent education has thestrongest relationship with the reading and math NCEs, as the initial R2 washighest when parent education was the first variable entered (Orders 5 and 6).

114
Also, when parent education was the second variable entered, the increment toR2 was larger than the increment when another variable was the second variableentered. For example, with SES as the first variable entered in the readingmodel, including parent education (Order 1) raised the R2 from .046 to .219,whereas including LEP status (Order 2) only raised the R2 to .190. With LEPstatus as the first variable, entering parent education as the second variable(Order 3) raised the R2 from .172 to .285, while entering SES (Order 4) onlyraised the R2 to .190. Similarly, in these models LEP status adds more to theexplanatory power than SES. For the reading models, the R2 when entering LEPstatus first (Orders 3 and 4) was .172 compared with .046 for entering SES first(Orders 1 and 2). Comparing Orders 5 and 6, when LEP status was entered afterparent education, the R2 increased from .209 to .285, while the R2 only increasedto .219 for SES.
In summary, the three approaches gave somewhat conflicting resultsregarding the importance and relative importance of parent education, SES, andLEP status (and their interactions) as explanatory variables for SAT 9 readingand math NCE scores. The ANOVA reading model ranked LEP status as moreimportant than parent education, while the ANOVA math model ranked parenteducation ahead of LEP status. Both ANOVA models underestimated the effectof parent education. The reading and math multiple regression models rankedparent education ahead of LEP status, but overestimated the importance ofparent education. The change in R2 approach ranked parent education ahead ofLEP status, but also overestimated the importance of parent education. In allapproaches, the two- and three-way interactions were significant, but did notadd much to the R2s. However, the interactions are of crucial importance inunderstanding the effects of these variables because the effects of one variabledepend on the particular combinations of the other variables.
Similar trends held in the other Grade 9 tested subject areas of language,science, and social science. Using the change in R2 approach, among the samethree predictors parent education had the strongest relationship with thelanguage, science, and social science SAT 9 scores, followed by LEP status, andSES had the weakest relationship. The overall R2s were largest in reading andsmallest in social science. The reading R2s were considerably larger than thosefor the other tests. Table 80 summarizes the R2s of the five tested subject areasfor both the main-effects and the main-effects plus interactions models.

115
Table 80
Site 2 Grade 9 Models and R-Squares for the SAT 9 NCEs
R-Square
Predictors Reading Math Language Science Socialscience
SES, LEP, parent Ed .290 .196 .217 .202 .183
SES, LEP, parent Ed+ interactions
.303 .206 .226 .212 .194
Focusing on the main-effects models for the SAT 9 NCEs, parent educationalways had the largest standardized regression coefficient, followed by LEPstatus and then by SES. Table 81 presents the absolute values of thestandardized regression coefficients from the main-effects model for eachpredictor for each test. It is tempting to compare the magnitudes of thesestandardized coefficients across tests, but such comparisons can be misleading(see Pedhazur 1997).
Table 81
Site 2 Grade 9 Standardized Regression Coefficients for the SAT 9 NCEs
Predictor Absolute value of standardized regression coefficient
Reading Math Language Science Socialscience
Parent Ed .342 .344 .320 .319 .311
LEP status .284 .159 .225 .197 .181
SES .074 .052 .052 .062 .053
The results for the Grade 2 tests (reading, math, language, and spelling)were very similar. From both the change in R2 and the standardized regressioncoefficient approaches, parent education seemed relatively most important inpredicting/explaining the test NCEs, followed by LEP status. In reading andmath, the Grade 2 R2s were slightly smaller than the corresponding Grade 9 R2s.However, in language, the Grade 2 R2s were considerably larger than the Grade9 R2s. Table 82 and Table 83 replicate Table 80 and Table 81 for Grade 2.

116
Table 82
Site 2 Grade 2 Models and R-Squares for the SAT 9 NCEs
R-Square
Predictors Reading Math Language Spelling
SES, LEP, parent Ed .283 .186 .258 .201
SES, LEP, parent Ed + interactions .289 .192 .264 .204
Table 83
Site 2 Grade 2 Standardized Regression Coefficients for the SAT 9 NCEs
Absolute value of standardized regression coefficient
Predictor Reading Math Language Spelling
Parent Ed .379 .354 .371 .343
LEP status .204 .096 .184 .146
SES .092 .072 .084 .068
Site 3
Multivariate analysis of variance. To test the level of significance of thedifferences between mean test scores for the LEP, SWD, and non-LEP/non-SWDpopulations, a single-factor MANOVA model was used. In this model, LEP andSWD status with four subgroup categories (LEP, SWD, LEP/SWD, non-LEP/non-SWD) was used as the independent variable, and subscale test scores(reading, science, and math) were used as the dependent variables. A similarmodel was used to test for differences between mean test scores for the non-LEP, accommodated LEP, and non-accommodated LEP populations. The resultsof these multivariate analyses of variance are summarized in Table 84 and Table85, respectively. The statistics showing the overall significance of the models arereported in the first sections of Table 84 and Table 85. Differences between meanscores of the three content areas across the subgroups were statisticallysignificant beyond the .01 nominal level (Wilks’ Lambda for these models are0.911 and 0.972, with the probability of a Type-I error of 0.000). It must be notedat this point, however, that the number of students in each of the subgroupcategories of the independent variables varies considerably. Such largedisproportionality may negatively impact the level of Type-I and Type-II errors

117
in ANOVA and MANOVA, even in the case of a moderate violation ofassumptions. Because of this problem, prior to the application of the ANOVAand MANOVA models, we tested the assumption of normality andhomogeneity of variance for the models used in this study. Test results indicatesignificant heterogeneity of subgroup variances. The results of the MANOVAmodels should therefore be interpreted with caution. However, the majorfindings of each of these models were consistent across grade levels, increasingour confidence in these results.
Table 84
Site 3 Grade 10 Multivariate Analysis of Variance Reading, Science and Math NCE ScoresWith LEP & SWD Status
Overall effect of LEP & SWD status
Value Approx. F Sig. of F
Pillais .0902 93.56 .000
Hotellings .0974 97.88 .000
Wilks .9106 96.05 .000
Effect of LEP & SWD status for sub-tests (9,052 DF)
SS MS F Sig. of F
Reading 183779.92 61259.97 262.14 .000
Science 126780.77 42260.26 151.01 .000
Math 106224.88 35408.29 127.48 .000
Comparison of Individual Contrasts
EstimateStandard
error Sig. of F
Reading LEP only with non-LEP/SWD -12.15 0.98 .000
LEP/SWD with non-LEP/SWD -19.65 4.24 .000
LEP only with LEP/SWD -7.50 4.35 .085
Science LEP only with non-LEP/SWD -9.74 1.08 .000
LEP/SWD with non-LEP/SWD -20.42 4.64 .000
LEP only with LEP/SWD -10.68 4.76 .025
Math LEP only with non-LEP/SWD -2.42 1.07 .024
LEP/SWD with non-LEP/SWD -18.61 4.63 .000
LEP only with LEP/SWD -16.19 4.74 .001

118
Table 84 also presents the results of univariate analysis of variance for eachof the three dependent variables (reading, science, and math). In the secondsection, ANOVA results, including sum of squares, mean squares, F-ratios, andthe associated Type-I error rates are reported for each of the three content areas.For reading, an F-ratio of 262.14 with a p-value of 0.000 indicated that the meanscores for the reading section of the SAT 9 differed significantly across the foursubgroups of students. LEP and SWD students performed significantly lowerthan non-LEP/non-SWD students. A similar trend was observed for mean SAT9 scores in science and math. In science, an F-ratio of 151.01 with a p-value of0.000 indicated that the subgroups performed differently, and in math, an F-ratio of 127.48 with a p-value of 0.000 showed significant differences betweenthe subgroups. However, the size of difference was largest in reading andsmaller in science and math content areas. To compare the magnitude ofdifference (the strength of association), a coefficient of determination eta Square(see Kirk, 1995, p. 180) was computed for each of the three content areas. Forreading Eta Square was 0.080, for science eta Square was 0.048 and for math, etaSquare was 0.041. These results indicated that the impact of LEP/SWD statuswas strongest in reading, less so in science, and even less so in math. Thesefindings suggest that the more language is involved, the larger the gap betweenthe groups, particularly for LEP students.

119
Table 85
Site 3 Grade 10 Multivariate Analysis of Variance Reading, Science and Math NCE ScoresWith LEP & Accommodation Status
Overall effect of LEP & SWD status
Value Approx. F Sig. of F
Pillais .028 42.81 .000
Hotellings .029 43.40 .000
Wilks .972 43.11 .000
Effect of LEP & SWD status for sub-tests (9,052 DF)
SS MS F Sig. of F
Reading 44301.05 22150.53 88.93 .000
Science 28677.45 14338.73 49.33 .000
Math 3110.94 1555.47 5.38 .000
Comparison of individual contrasts
EstimateStandard
error Sig. of F
Reading Non-acc LEP vs. non-LEP -5.96 1.30 .000
Acc LEP vs. non-LEP -18.97 1.51 .000
Science Non-acc LEP vs. non-LEP -5.25 1.40 .000
Acc LEP vs. non-LEP -15.07 1.63 .000
Math Non-acc LEP vs. non-LEP -0.31 1.40 .823
Acc LEP vs. non-LEP -5.32 1.62 .001
Univariate analysis of variance for each of the three dependent variables(reading, science, and math) with the subgroup categories of non-LEP,accommodated LEP and non-accommodated LEP are presented in Table 85. Inthe second section, ANOVA results including sum of squares, mean squares, F-ratios, and the associated Type-I error rates are reported for each of the threecontent areas. For reading, an F-ratio of 88.93 with a p-value of 0.000 indicatedthat the mean scores for the reading section of the SAT 9 differed significantlyacross the three subgroups of students. Both accommodated and non-accommodated LEP students performed significantly lower than non-LEPstudents. A comparison of individual contrasts reveals that the estimate of thedifference between accommodated LEP students and non-LEP students wasespecially large (-18.97). A similar trend was observed for mean SAT 9 scores inscience. In science, an F-ratio of 49.33 with a p-value of 0.000 indicated that the

120
subgroups performed differently, and in math, an F-ratio of 5.38 with a p-valueof 0.000 showed significant differences between the subgroups. However, inmath a comparison of individual contrasts showed no significant differencebetween non-accommodated LEP students and non-LEP students. Once againthe size of difference was largest in reading and smaller in the science and mathcontent areas. For reading eta Square was 0.019, for science eta Square was 0.011and for math, eta Square was 0.001. Similarly to the previous model, resultsindicate that the impact of LEP and accommodation status was strongest inreading, less so in science, and even less so in math.
Analyses for Grade 11
To check for consistency, the two multivariate models tested in Grade 10were repeated with Grade 11. With the first model the statistical significance ofthe differences between performance of LEP/SWD and non-LEP/non-SWDstudents was tested. In this model, LEP and SWD status were used as theindependent variable, and scores from the three content areas were used as thedependent variables. Table 86 summarizes the results of MANOVA for Grade11. As the data in this table suggest, the results of multivariate analysis ofvariance for Grade 11 are consistent with those reported for Grade 10. Ingeneral, students obtained the lowest scores in reading and highest in math.Furthermore, the difference between the performances of LEP/SWD studentswith non-LEP/non-SWD students was smaller in math than in reading.
Statistics showing the overall significance of the MANOVA model arepresented in the first section in Table 86. As these data indicate, the overallmodel was statistically significant well above the .01 nominal level (Wilks’Lambda = 0.878, F = 105.71, p = 0.000). These results indicate that there is asignificant difference between the performance of LEP/SWD and non-LEP/non-SWD students across the three content areas.
Data in the second paragraph of Table 86 present univariate tests ofsignificance. These data, which include sum of squares, mean squares, F-ratio,and p-values, indicated that the differences between LEP/SWD and non-LEP/non-SWD students were significant in all three content areas. For reading,the F-ratio was 243.18 with a coefficient of determination eta Square of .093; forscience, the F-ratio was 134.75 with a eta Square of .054; and for math, the F-ratiowas 117.05 with a eta Square of .047. However, as indicated earlier, the

121
magnitude of these differences decreased substantially from reading to science,and from science to math as is evident from the size of eta Square.
The multivariate and univariate statistics that are reported in the first twosections indicate that overall performance was different across the categories ofLEP and SWD. Multiple comparisons were used to test the significance ofdifferences between individual groups. The results of multiple comparisonanalyses are also presented. As the data in this part of the table indicate, theperformance difference between LEP only and non-LEP/non-SWD studentswas significant (t = -13.95, p = 0.000). The difference between LEP/SWD andnon-LEP/non-SWD was also significant (t = -3.04, p = .002). However, thedifference between LEP only and LEP/SWD was not significant (t = -0.74, p =0.459).
The trend of subgroup differences in science was consistent with the trendof subgroup differences in reading. There was a significant difference betweenLEP only and non-LEP/non-SWD (t = -9.76, p = 0.000). However, no significantdifference was found between LEP only with LEP/SWD students. Unlike theresults for reading and science, no significant difference was found betweenLEP only and non-LEP/non-SWD students in math. That is, LEP studentsperformed the same as non-LEP students in math.

122
Table 86
Site 3 Grade 11 Multivariate Analysis of Variance Reading, Science, and Math NCEScores with LEP & SWD Status
Overall effect of LEP & SWD status
Value Approx. F Sig. of F
Pillais .1253 103.03 .000
Hotellings .1364 107.35 .000
Wilks .8775 105.71 .000
Effect of LEP & SWD status for sub-tests (7,089 DF)
SS MS F Sig. of F
Reading 221423.96 73807.99 243.18 .000
Science 134835.02 44945.01 134.75 .000
Math 149812.56 49937.52 117.05 .000
Comparison of individual contrasts
EstimateStandard
error Sig. of F
Reading LEP only with non-LEP/SWD
-16.31 1.17 .000
LEP/SWD with non-LEP/SWD
-21.64 7.11 .002
LEP only with LEP/SWD -5.33 7.20 .459
Science LEP only with non-LEP/SWD
-11.96 1.23 .000
LEP/SWD with non-LEP/SWD
-15.00 7.46 .044
LEP only with LEP/SWD -3.04 7.55 .687
Math LEP only with non-LEP/SWD
0.86 1.39 .537
LEP/SWD with non-LEP/SWD
-18.84 8.44 .026
LEP only with LEP/SWD -19.69 8.54 .021
Table 87 presents the results for a model that tests the statisticalsignificance of the differences between performance of non-LEP, accommodatedLEP, and non-accommodated LEP students. In this model, LEP andaccommodation status were used as the independent variable, and scores fromthe three content areas were used as the dependent variables. Table 87summarizes the results of MANOVA for Grade 11. The results of multivariateanalysis of variance for Grade 11 were again consistent with those reported for

123
Grade 10. In general, students obtained the lowest scores in reading and highestin math. Furthermore, the difference between the performances of non-LEP,accommodated LEP, and non-accommodated LEP students was smaller in maththan in reading.
Statistics showing the overall significance of the MANOVA model arepresented in the first section in Table 87. The overall model was statisticallysignificant well above the .01 nominal level (Wilks’ Lambda = 0.9418, F = 73.28,p = 0.000). These results indicated that there was a significant differencebetween the performance of accommodated LEP students, non-accommodatedLEP students, and non-LEP students across the three content areas.
Data in the second section present univariate tests of significance. Thesedata, which include sum of squares, mean squares, F-ratio, and p-values indicatethat the differences between accommodated LEP students, non-accommodatedLEP students, and non-LEP students was significant in reading and science. Forreading, the F-ratio was 101.02 with a coefficient of determination eta Square of.028; for science, the F-ratio was 47.42 with a eta Square of .013. In math therewere no significant differences among the three LEP/accommodation statussubgroup categories, F = 0.52 and eta Square = .000. As the data suggest, themultivariate and univariate statistics that are reported in the first two sectionsindicate that overall performance was different across the categories of LEP andaccommodation. Multiple comparisons were used to test the significance ofdifferences between individual groups. The results of multiple comparisonanalyses were also presented. The results are similar to those we presented forGrade 10. Both accommodated LEP students and non-accommodated LEPperformed significantly lower than non-LEP students (p = .000) in both readingand science. A comparison of individual contrasts shows that the largestcontrast (-22.97) was the estimate of the difference between accommodated LEPstudents and non-LEP students in reading. As indicated earlier, there were nodifferences among the three subcategories of the LEP and accommodation statusvariable in math.

124
Table 87
Site 3 Grade 11 Multivariate Analysis of Variance Reading, Science and Math NCEScores With LEP & Accommodation Status
Overall effect of LEP & accommodation status
Value Approx. F Sig. of F
Pillais .059 72.17 .000
Hotellings .063 74.39 .000
Wilks .941 73.28 .000
Effect of LEP & accommodation status for sub-tests (7,089 DF)
SS MS F Sig. of F
Reading 65745.71 32872.85 101.02 .000
Science 32989.39 16494.70 47.42 .000
Math 463.19 231.60 0.52 .596
Comparison of individual contrasts
EstimateStandard
error Sig. of F
Reading Non-acc. LEP vs. non-LEP -8.50 1.63 .000
Acc. LEP vs. non-LEP -22.97 1.73 .000
Science Non-acc. LEP vs. non-LEP -6.92 1.68 .000
Acc. LEP vs. non-LEP -15.88 1.79 .000
Math Non-acc. LEP vs. non-LEP 1.51 1.91 .428
Acc. LEP vs. non-LEP 1.32 2.02 .515
Site 4
Canonical correlation analysis. Because there were several relatedperformance indicators in this study, we decided to use these indicators in amultivariate model. We tried to examine the relationship between performancein math and science and background variables, particularly with languagebackground variables. We used a canonical correlation model to link the twosets of variables: (a) the content-based (performance) measures, and (b) thebackground variables, including the language background variables. Theperformance variables that were included in the canonical models were reading,math computational, math analytical, and grade point average (GPA). Thebackground variables that were included in the models were: LEP status(categorical), SES (four ordered categories), gender (categorical), and languagespoken at home (three ordered categories).

125
Principal components analyses were performed on these variables. Bothsets of variables were included in one model. The purpose of componentsanalyses was to find out how much variance the sets of variables share witheach other. Table 88 presents the results of components analyses in which weincluded all the variables mentioned above.
Table 88
Site 4 Grade 8 Rotated Factor Matrix for Performance and BackgroundVariables
Factor loadings
Variable name Factor 1 Factor 2
Set 1, performance variables
Reading 0.86
Math computational 0.85
Math analytical 0.89
GPA 0.74
Set 2, background variables
LEP status (categorical) 0.83
SES (ordered categories) -0.39
Gender (categorical)
Language spoken at home (ordered categories) 0.86
Eigenvalue 3.09 1.52
Percent of shared variance explained 38.6 19.0
Note. Only factor loadings of .33 or greater have been reported.
Table 89 presents the results of canonical correlation analyses forexamining the relationship between the two sets of variables, the performancevariables, and the background variables. The model yielded one significantfunction (Wilks’ Lambda = .75, p = 0.000) and explained 54% of the variance inthe dependent variables. The first canonical correlation was .403, which meansthat the first canonical variate pair explains 16.3 % of the shared variancebetween the two sets of variables.
Correlations and standardized coefficients between the first canonicalfunction and the variables in the first and second sets are reported in Table 89.These correlation coefficients suggest that the first set and the second set of

126
variables were related. The first set of variables was highly correlated with thecanonical variable. The correlation was .95 between reading and the canonicalvariate, which was the largest; .71 between GPA and the canonical variate; .67between math analytical and the canonical variate; and .54 between mathcomputational and the canonical variate. The standardized coefficients can beused to examine the relative influence of each variable in the model. Thestandardized coefficient for reading with the first canonical function was .92.This is large in comparison to the standardized coefficients for mathcomputational (-.21), math analytical (-.28), and GPA (.37). This indicates thatamong the dependent variables, reading had the strongest influence on the firstcanonical covariate. We can infer that reading performance is more dependentupon the set of independent variables than is math computational, mathanalytical, or GPA.
In the second set, the correlations of the variables with the canonicalvariate were not as high as in the first set. The highest correlation was betweenSES and the canonical variate (r = -.64). The next highest correlation wasbetween LEP status and the canonical variate (r = -.61). The standardizedcoefficients indicate that SES had the largest impact on the canonical variate.The standardized coefficient for SES was -.60. Gender and LEP status alsoimpacted the canonical variate, with respective standardized coefficients of -.50and -.49. Language spoken at home had little contribution to the canonicalvariate, as indicated by its standardized coefficient of -.11.
In general, the results of multivariate canonical correlation analysesconfirm our earlier findings that suggest that language background hassignificant impact on performance. This impact appears to be most pronouncedin performance areas that require large language demands, such as reading.

127
Table 89
Site 4 Grade 8, 1996. Correlations, Standardized Canonical Coefficients, and CanonicalCorrelation Between Performance and Background Variables
First canonical variate
Variable Correlation Coefficient
Set 1 (dependent variables)
Reading 0.95 0.92
Math computational 0.54 -0.21
Math analytical 0.67 -0.28
GPA 0.71 0.37
Set 2 (independent variables)
LEP status (categorical) -0.61 -0.49
SES (ordered categories) -0.64 -0.60
Gender (categorical) -0.54 -0.50
Language spoken at home -0.40 -0.11
Percent of variance among performance variables explained 53.78
Canonical correlation 0.403
In order to better understand the joint effects of LEP status and SES on theSAT 9 NCE scores we employed three related approaches:
1. Two-way factorial ANOVA models;
2. Multiple regression models;
3. Change in R2 with nested multiple regression models.
We examined two two-way factorial ANOVA models with Grade 8reading NCE and math total NCE as the outcome variables. The twoexplanatory variables in each model were LEP status (an indicator variable) andSES. Table 90 and Table 91 display the cell means for reading and math,respectively. Both the reading and math models were significant at p<.0001. Inthe reading model, the LEP by SES interaction was significant (p<.0001),indicating that the effect of SES depends on the level of LEP status and the effectof LEP status depends on the level of SES. In the math model, the LEP by SESinteraction was not significant (p = .274), while both main effects weresignificant (p<.0001). These effects are further described in the followingparagraphs.

128
Table 90
Site 4 Grade 8 Reading NCE Means by SES and LEP Status
LEP Status
LEP Non-LEP
FRL (SES) Mean SD N Mean SD N
None 22.48 17.56 316 46.59 21.81 7900
Reduced price 21.91 17.02 61 39.41 20.72 970
Free 18.34 14.63 211 35.03 21.07 1358
AFDC 16.47 14.69 104 32.10 20.51 1564
TOTAL 20.26 16.39 692 42.75 22.21 11792
Table 91
Site 4 Grade 8 Math NCE Means by SES and LEP Status
LEP Status
LEP Non-LEP
FRL (SES) Mean SD N Mean SD N
None 39.98 21.02 314 50.93 21.35 7817
Reduced price 35.52 15.95 63 45.16 20.03 963
Free 33.35 15.08 207 40.80 18.49 1344
AFDC 29.49 14.88 103 37.46 17.14 1526
TOTAL 36.00 18.48 687 47.52 21.06 11650
First, we consider the reading model. Figure 33 displays the cell means forthe reading model. The gap between LEP and non-LEP students depended onthe level of SES, with the largest gap (24.2 NCE points) occurring in the “None”level. This gap decreased across the “Reduced-price” (17.5) and “Free” (16.7)levels, and was smallest in the Aid to Families with Dependent Children(AFDC) (15.6) level. In the LEP student group, the reading NCE meansdecreased slightly across the SES levels, from a high of 22.48 in the “None” levelto a low of 16.47 in the “AFDC” level. The trend of decreasing NCE means wassimilar among the non-LEP students, but the decreases were more dramatic,from a high of 46.59 in the “None” level to a low of 32.10 in the “AFDC” level.Averaging across the four SES levels, the reading mean for the LEP group was20.26, considerably lower than the reading mean of 42.75 for the non-LEP group.Averaging across the two LEP status levels, the means for the four levels of SES

129
decreased from 45.67 (SD = 22.15, N = 8216) for “None”, to 38.38 (SD = 20.92, N= 1031) for “Reduced-price”, to 32.79 (SD = 21.10, N = 1569) for “Free”, to 31.12(SD = 20.55, N = 1668) for the “AFDC” level.
Figure 33. Site 4 Grade 8 Reading NCE by SES and LEP status.
Figure 34 presents the math NCE cell means for the LEP and SESgroupings. The gap between LEP and non-LEP students was relatively similaracross the levels of SES, ranging from a high of about 11 points in the “None”level to a low of about 7.5 points in the “Free” level—the differences in thesegaps were within sampling error. Within the LEP student group, the math NCEmeans decreased from a high of 39.98 in the “None” level to a low of 29.49 in the“AFDC” level, a decrease of about 10.5 points. The trend was similar in the non-LEP group, with the math mean decreasing from a high of 50.93 in the “None”level to a low of 37.46 in the “AFDC” level, an overall decrease of about 13.5points. The overall LEP math mean NCE was 36.00 (SD = 18.48, N = 687), about11.5 points below the non-LEP mean of 47.52 (SD = 21.06, N = 11650). Averagingacross the two LEP groups, the SES level means decreased from 50.50 (SD =21.44, N = 8131) for “None”, to 44.47 (SD = 19.94, N = 1026) for “Reduced-price”,to 39.81 (SD = 18.24, N = 1551) for “Free”, and to 36.96 (SD = 17.11, N = 1629) for“AFDC.”
Site 4 Grade 8 Reading NCEBy SES and LEP Status
0
10
20
30
40
50
60
None Reduced Free AFDC
SES
Mea
n N
CE
Non-LEP LEP

130
Figure 34. Site 4 Grade 8 Math NCE by SES and LEP status.
The strength of association measure eta-squared was calculated for eacheffect for both the reading and math models. The results are presented in Table92. In the reading model, LEP status had the strongest association (.026) with theNCE mean, followed by SES (.008), and then by the LEP by SES level interaction(.002). In the math model, SES level was stronger than LEP status (.011 versus.007), while the interaction had no effect.
Table 92
Site 4 Grade 8 Strength of Association & Standardized RegressionCoefficients (Beta)
Reading Math
Effect Eta-squared Beta Eta-
squared Beta
LEP status .026 -.273 .007 -.132
SES level .008 -.253 .011 -.246
Interaction .002 .076 .000 .033
To summarize the ANOVA models, SES level, LEP status, and theirinteractions each explained a significant portion of the reading NCE variance.LEP status was more strongly associated with the reading NCE means than SESlevel. In math, however, the interaction of SES level and LEP status was notsignificant, and SES level was more strongly associated with mean NCE than
Site 4 Grade 8 Math NCEBy SES and LEP Status
0
10
20
30
40
50
60
None Reduced Free AFDC
SES
Mea
n N
CE
Non-LEP LEP

131
LEP status. Because these ANOVA models ignore the ordinal nature of the SESlevel variable, the impact of SES level on the reading and math NCEs wasunderestimated by these models.
A second approach to assessing the impact of the explanatory variablesSES level and LEP status on the NCEs is to create multiple regression (MR)models with SES level and LEP status and their interaction as predictors andreading and math NCE as the outcome variables. However, because such MRmodels treat SES as an interval variable, these models will overestimate theeffect of SES (SES level is really an ordinal variable).
The MR model for predicting reading NCE was significant, with p<.0001and R2 = .113 (i.e., a little more than 11% of the reading NCE variance wasexplained by the predictors). The model for math NCE was also significant, withp<.0001 and R2 = .074; i.e. a little more than 7% of the math NCE variance wasexplained by the model predictors. Within each model, the absolute values ofthe standardized regression coefficients (betas) rank the predictors as to theirrelative importance. These betas are presented in Table 92. In reading, LEPstatus and SES level were of relatively equal importance. In math, SES level wasrelatively more important than LEP status. However, the MR modelsoverestimate the importance of SES.
A third way of assessing the effects of LEP status and SES on the NCEs isto create a sequence of nested MR models and measure the change in R2 frommodel to model. The predictor variables LEP status and SES can be entered intoa model in two orders, with either one being entered first. For each order, asequence of three regression models was created. In the first order, for the firstmodel SES was the single predictor; the second model contained SES and LEPstatus as predictors; the third model had SES, LEP status, and their interactionas predictors. In the second order, the roles of SES and LEP were reversed. Table93 presents the results of these models for the reading and math NCEs.
From Table 93, we see that the final reading model was better than the finalmath model, with R2 = .113 for reading versus .074 for math. In reading, andespecially in math, in the single predictor models, SES was more stronglyrelated to the NCEs than LEP status; the R2s for the single predictor modelswere .069 and .063 with SES as predictor versus .052 and .016 for LEP status asthe predictor. For reading, with SES already in the model (Order 1), the R2

132
increased .042 (from .069 to .111) with the entry of LEP status into the model. Inmath, with SES already in the model, R2 increased only .011 (from .063 to .074)when LEP status was entered. Thus, with SES already in the model, the entry ofLEP status added considerably to the R2 in reading, but did not add much inmath. In Order 2, with LEP status already in the model, the entry of SES addedconsiderably to R2 for both reading and math. The interaction added little: .002to R2 in reading and nothing to R2 in math. In summary, we see that SES wasimportant in both the reading and math models, while LEP status was far moreimportant in the reading than in the math models. Also, in reading, SES wasslightly more important than LEP status, while in math, SES was moreimportant. These results are very similar to the MR beta results discussedpreviously.
Table 93
Site 4 Grade 8 Increments to R-squared forReading and Math
Predictors R2 Reading R2 Math
Order 1
SES .069 .063
SES, LEP .111 .074
SES, LEP, interaction .113 .074
Order 2
LEP .052 .016
LEP, SES .111 .074
LEP, SES, interaction .113 .074
Comparing the ANOVA and regression approaches, we have somewhatconflicting results regarding the importance and relative importance of LEPstatus and SES. The ANOVA models, which underestimate the effects of SES,indicate that in reading, LEP status is more important than SES, while in math,SES is more important than LEP status. The regression models, whichoverestimate the effects of SES, indicate in reading LEP status is slightly moreimportant than SES, whereas, in math, SES is far more important then LEPstatus. The truth lies somewhere in between these indications.

133
Structural Modeling
The results of our analyses on the SAT 9 item-level data that we reportedearlier suggested that language factors may introduce another source ofmeasurement error in the measurement model for LEP students. Internalconsistency coefficients were lower for LEP students. There were large differences inthe performance of LEP and non-LEP students that were apparent, especially withrespect to the reading items.
Due to the impact of language factors, the intercorrelation between individualtest items, the correlation between items and total test score (internal validitycoefficient), and the correlation between item score and total test score with theexternal criteria (achievement data) may be different for LEP and non-LEP students.That is, these relationships may be stronger for non-LEP students. To furtherexamine the hypothesis of differences between LEP and non-LEP students on thestructural relationship of the test items, a series of confirmatory factor models werecreated in Sites 1 and 3. Fit indices were compared across LEP and non-LEP groups.The results generally indicated that the relationships between individual items,items with the total test score, and items with the external criteria were higher fornon-LEP than for LEP students. We will present a more detailed discussion of theresults of these analyses in the next two sections.
Site 2
Simple structural confirmatory factor models. To compare within-test andcross-test structural relationships between LEP and non-LEP students, a series ofsimple structure confirmatory models were created. In creating these models, testitems in each of the three content areas (reading, science, and math) were grouped as“parcels.”2 Several item-parcels were constructed for each test. Items-parcels wereused as measured variables, and one latent variable was created to represent eachcontent area. Correlation coefficients between the content-based latent variableswere then estimated. Reading tests for Grade 9 had 52 items. Four parcels (measuredvariables) and a reading latent variable based on the four parcels were constructed.Similarly, four parcels and a science latent variable were constructed from the 40-
2 For a detailed description of the item-parcel concept and item-parcel construction, see Abedi, Lord, &Hofstetter, 1997.

134
item science tests for Grade 9. A math latent variable based on four parcels from the48-item math tests in Grade 9 was also created.
Figure 35 presents item-parcels and latent variables for reading, math, andscience and the correlation between the reading, math, and science latent variables.The 52 reading items were grouped into four parcels. Each parcel was constructed tosystematically contain heterogeneous items based on item difficulty. Through thisprocess each parcel contained easy, moderately difficult, and difficult items. Theresult was a set of homogenous parcels. A reading latent variable was constructedbased on these four parcels. Similarly, item parcels and latent variables for scienceand math were created from the 40 science items and 48 math items through thesame process. Correlation between the reading, math, and science latent variableswere estimated. Models were tested on randomly selected sample populations todemonstrate the consistency of the results. In Grade 7, a similar structural modelwas created for content areas reading, math problem solving, and math procedures.Finally, a random sample selected for even sample sizes of non-LEP and LEPstudents was tested to demonstrate that differences in the results were not due touneven sample sizes.

135
Figure 35. Site 2 Grade 9 simple structural equations model.
Heterogeneous items werecombined to create Homogeneous
Reading Parcel # 1 – 13 Items
Reading Parcel # 2 – 13 Items
Reading Parcel # 3 – 14 Items
Reading Parcel # 4 – 14 Items
Math # 4 – 12 Items
Science # 1 – 10 Items
Science # 2 – 10 Items
Science # 3 – 10 Items
Science # 4 – 10 Items
Math # 2 – 12 Items
Math # 1 – 12 Items
Math # 3 – 12 Items
Reading
Math
Science

136
Table 94 shows the results of the structural models run for Grade 9 and Table95 presents similar information for Grade 7. In Table 96, the Grade 7 model wasanalyzed for a sample selected with even numbers of non-LEP and LEP students.The results of these structural models presented in Table 94, Table 95, and Table 96were consistent for all the models tested in this site. Correlations of item parcels tothe latent factors were consistently lower for LEP students than for non-LEPstudents. This finding was true for all parcels, regardless of which grade or whichsample of the population was tested. For example, in Grade 9, for LEP students thecorrelation for the four reading parcels ranged from a low of .719 to a high of .779across the two samples, as shown in Table 94. In comparison, for non-LEP studentsthe correlation ranged from a low of .832 to a high of .858. The item parcelcorrelations were also larger for non-LEP students than for LEP students in mathand science. Again these results were consistent in each sample. The pairedcorrelations between the latent factors were also larger for non-LEP students thanthey were for LEP students. This gap in latent factor correlations between non-LEPand LEP students was especially large when there was a bigger language demanddifference in the latent factors. For example, in the Grade 9 sample #1, thecorrelation between latent factors for math and reading for non-LEP students was.782, compared to just .645 for LEP students. When comparing the latent factorcorrelations between reading and science from the same population, the correlationwas still larger for non-LEP students (.837) than for LEP students (.806), but the gapbetween the correlations decreased. This is likely due to a larger language demanddifference between the reading and math tests, as compared to the reading andscience tests. Once again, this finding remained consistent for sample #2 in Grade 9and for both samples in Grade 7 (see Table 95). A representative sample of non-LEPstudents of comparable size to the LEP population was selected. Table 96 shows theresults of structural models for this sample. There were no changes in the previoustrends. Item parcel correlations and correlations between the latent factors remainlarger for non-LEP students then for LEP students. Multiple group structural modelswere run to test whether the differences between non-LEP and LEP studentsmentioned above were significant. There was significant invariance for allconstraints tested at the p<.05 level.
These results (Table 94, Table 95, and Table 96) indicate that:
1 . Findings from the cross-validation samples are very consistent andprovide evidence for the validity of analyses.

137
2 . Correlations between parcel scores and the content-based latentvariables are generally lower for LEP students.
3. Correlations between the content-based latent variables are generallylower for LEP students.
4. These results are all indicative of a possible language factor as a sourceof measurement error for LEP students.
Table 94
Site 2 Grade 9 SAT 9 Reading and Math and Science Structural Modeling Results(DF = 51)
Non-LEP (N = 22,782) LEP (N = 4,872)
Sample #1 Sample #2 Sample #1 Sample #2
Goodness of fit
Chi square 488 446 152 158
NFI .997 .998 .992 .992
NNFI .997 .997 .993 .993
CFI .998 .998 .995 .995
Factor loadings
Reading Comp.
Parcel 1 .852 .853 .723 .719
Parcel 2 .841 .844 .734 .739
Parcel 3 .835 .832 .766 .779
Parcel 4 .858 .858 .763 .760
Math factor
Parcel 1 .818 .821 .704 .699
Parcel 2 .862 .860 .770 .789
Parcel 3 .843 .843 .713 .733
Parcel 4 .797 .796 .657 .674
Science factor
Parcel 1 .678 .681 .468 .477
Parcel 2 .679 .676 .534 .531
Parcel 3 .739 .733 .544 .532
Parcel 4 .734 .736 .617 .614
Factor correlation
Reading vs. math .782 .779 .645 .674
Reading vs. science .837 .839 .806 .802
Science vs. math .870 .864 .796 .789Note. There was significant invariance for all constraints tested with multiplegroup model (Non-LEP/LEP).

138
Table 95
Site 2 Grade 7 SAT 9 Reading and Math (Problem Solving & Procedures)Structural Modeling Results (DF = 51)
Non-LEP (N = 25,716) LEP (N = 6,546)
Sample #1 Sample #2 Sample #1 Sample #2
Goodness of fit
Chi square 495 531 184 156
NFI .998 .998 .995 .996
NNFI .998 .997 .995 .996
CFI .998 .998 .996 .997
Factor loadings
Reading Comp.
Parcel 1 .842 .846 .763 .770
Parcel 2 .879 .879 .800 .790
Parcel 3 .840 .840 .795 .798
Parcel 4 .858 .860 .816 .817
Math Prob. solving
Parcel 1 .832 .836 .729 .726
Parcel 2 .833 .835 .696 .710
Parcel 3 .845 .846 .705 .711
Parcel 4 .850 .853 .706 .710
Math procedures
Parcel 1 .817 .822 .718 .739
Parcel 2 .783 .783 .667 .684
Parcel 3 .855 .856 .769 .765
Parcel 4 .817 .815 .714 .719
Factor correlation
Reading vs. math PS .809 .810 .720 .718
Reading vs. math Pr .733 .736 .601 .606
Math PS vs. math Pr .921 .918 .874 .883
Note. There was significant invariance for all constraints tested with multiple groupmodel (Non-LEP/LEP).

139
Table 96
Site 2 Grade 7 SAT 9 Reading and Math (Problem Solving & Procedures) StructuralModeling Results (DF = 51) Selected for Even Sample Sizes
Non-LEP (N = 25,716) LEP (N = 6,546)
Sample #1 Sample #2 Sample #1 Sample #2
Goodness of fit
Chi square 204 143 184 156
NFI .997 .998 .995 .996
NNFI .997 .998 .995 .996
CFI .998 .998 .996 .997
Factor loadings
Reading Comp.
Parcel 1 .851 .852 .763 .770
Parcel 2 .879 .882 .800 .790
Parcel 3 .837 .839 .795 .798
Parcel 4 .858 .863 .816 .817
Math Prob. solving
Parcel 1 .842 .830 .729 .726
Parcel 2 .838 .838 .696 .710
Parcel 3 .856 .842 .705 .711
Math procedures
Parcel 1 .830 .818 .718 .739
Parcel 2 .786 .790 .667 .684
Parcel 3 .859 .856 .769 .765
Parcel 4 .815 .813 .714 .719
Factor correlation
Reading vs. math PS .809 .802 .720 .718
Reading vs. math Pr .738 .722 .601 .606
Math PS vs. math Pr .919 .923 .874 .883
Note. There was significant invariance for all constraints tested with multiple groupmodel (Non-LEP/LEP).

140
Site 3
Simple structural confirmatory factor models. To compare within-test andcross-test structural relationships between LEP and non-LEP students, a series ofsimple structure confirmatory models were created. In creating these models, testitems in each of the three content areas (reading, science, and math) were grouped as“parcels.” Several item-parcels were constructed for each test. Item-parcels wereused as measured variables, and one latent variable was created to represent eachcontent area. Correlation coefficients between the content-based latent variableswere then estimated.
From the reading tests for Grades 10 and 11, which had 54 items, five parcels(measured variables) and a reading latent variable were constructed. Similarly, fourparcels and a science latent variable were constructed from the 40-item science tests,and a math latent variable based on five parcels from the 48-item math tests was alsocreated.
Figure 36 presents item-parcels and latent variables for reading and science andthe correlation between the reading and science latent variables. The 54 readingitems were grouped into five parcels (items 1-11 were grouped into parcel 1, items12-22 were grouped into parcel 2, and so on). A reading latent variable wasconstructed based on the five parcels and was labeled as F1. Similarly, four parcelswere created from the 40 science items and a science latent variable was created,labeled as F2. Correlation between the reading and science latent variables wasestimated.

141
Figure 36. Site 3 item-parcels and latent variables for reading and science and theircorrelation.
Table 97 and Table 98 summarize the results of our analyses for the model thatwas presented in Figure 36. To do a cross-validation study, we divided the entirepopulation of students into two groups: (a) the group called “even cases” consistedof students who were assigned even serial numbers, and (b) the group called “oddcases” consisted of students who were assigned odd serial numbers. Becausestudent names were ordered alphabetically, the assignment of subjects to the twogroups was considered systematic random sampling.
Reading
Items 1-11parcels
Items 12-22parcels
Items 23-33parcels
Items 34-44parcels
Items 1-10parcels
Items 11-20parcels
Items 21-30parcels
Items 31-40parcels
F1 F2
Items 45-54parcels
Science

142
Table 97
Site 3 Grade 10 SAT 9 Reading and Science Structural Modeling Results (DF = 24)
All cases(N = 9,182)
Even cases(N = 4,591)
Odd cases(N = 4,591)
Non-LEP(N = 8,918)
LEP(N = 264)
Goodness of fit
Chi square 2040 966 1098 1940 106
NFI .931 .935 .925 .932 .831
NNFI .897 .904 .890 .899 .792
CFI .931 .936 .927 .933 .861
Factor loadings
Reading variables
Parcels 1 .687 .695 .679 .685 .628
Parcels 2 .692 .698 .687 .687 .697
Parcels 3 .745 .738 .751 .741 .724
Parcels 4 .822 .823 .821 .823 .712
Parcels 5 .689 .688 .691 .691 .550
Science variables
Parcels 1 .667 .671 .662 .665 .623
Parcels 2 .564 .554 .575 .565 .449
Parcels 3 .649 .648 .650 .652 .547
Parcels 4 .453 .451 .456 .461 .262
Factor correlation
Reading vs. math .811 .824 .797 .809 .815
In Table 97, we report the goodness of fit statistics, correlation coefficientsbetween the items parcels and the latent variables (factor loadings), and thecorrelation between the two latent variables (reading and math). These statistics arereported separately for the entire group of students in Grade 10, for the two cross-validation subgroups, and for LEP and non-LEP students. Statistics under thegoodness of fit section include Chi-square, Normed Fit Index (NFI), Non-NormedFit Index (NNFI), and Comparative Fit Index (CFI) (see Bentler, 1992; Bentler &Bonett, 1980).
As the data in Table 97 suggest, the fit statistics for the entire group were verysimilar to those reported for the cross-validation subgroups (even and odd cases)and to those reported for the non-LEP groups. For example, the NFI was .931 forGrade 10: .935 for the even cases, .925 for the odd cases, and .932 for the non-LEP

143
group. However, for the LEP group, the NFI dropped to .831, which indicates thatfor LEP students, the fit is not as good as for the non-LEP group or for the entiregroup. This may be due to the fact that for LEP students, the language factor mayintroduce a new source of bias (measurement error), as we speculated earlier.
Additionally, Table 97 reports correlations between the parcel scores and thereading and science latent variables (factor loadings) for all of Grade 10, for the twocross-validation subgroups, and for the non-LEP and LEP groups. These correlationswere very similar for all groups except for the non-LEP group. For the non-LEPgroup, the correlations were generally lower. For the entire group, for the cross-validation groups, and for the non-LEP students, the correlations ranged from .451to .823, with an average of .663. For the LEP group, the correlations ranged from .262to .724, with an average of .577. These results indicate that the latent models do notprovide as strong a structural relationship for the LEP group as for the non-LEPgroups. This may be partly due to impact of language factors on the measurement.
Table 97 also reports correlation coefficients between the factors (latentvariables). These correlations were very similar across the subgroups including theLEP subgroup in this table (Grade 10, reading and math). However, in other cases,these correlations followed the same pattern of lower relationship for LEP students(see, for example, Table 98, Table 99, and Table 100).
Table 98 presents similar results for Grade 11. The results obtained for Grade 11were consistent with those reported for Grade 10. Fit index statistics and factorloadings were generally lower for LEP groups.

144
Table 98
Site 3 Grade 11 SAT 9 Reading and Science Structural Modeling Results (DF = 24)
All cases(N = 7,176)
Even cases(N = 3,588)
Odd cases(N = 3,588)
Non-LEP(N = 6,932)
LEP(N = 244)
Goodness of fit
Chi Square 1786 943 870 1675 81
NFI .931 .926 .934 .932 .877
NNFI .898 .891 .904 .900 .862
CFI .932 .928 .936 .933 .908
Factor loadings
Reading variables
Parcels 1 .733 .720 .745 .723 .761
Parcels 2 .735 .730 .741 .727 .713
Parcels 3 .784 .779 .789 .778 .782
Parcels 4 .817 .822 .812 .816 .730
Parcels 5 .633 .622 .644 .636 .435
Science variables
Parcels 1 .712 .719 .705 .709 .660
Parcels 2 .695 .696 .695 .701 .581
Parcels 3 .641 .628 .654 .644 .492
Parcels 4 .450 .428 .470 .455 .257
Factor correlation
Reading vs. math .796 .796 .795 .797 .791
Similar results are presented in Table 99 and Table 100 for content areasreading and math. Table 99 presents the results for Grade 10 and Table 100 presentsfor Grade 11.

145
Table 99
Site 3 Grade 10 SAT 9 Reading and Math Structural Modeling Results (DF = 32)
All cases(N = 9,250)
Even cases(N = 4,625)
Odd cases(N = 4,625)
Non-LEP(N = 8,947)
LEP(N = 303)
Goodness of fit
Chi square 2875 1490 1407 2736 155
NFI .919 .915 .921 .920 .861
NNFI .887 .883 .892 .888 .838
CFI .920 .917 .923 .920 .885
Factor loadings
Reading variables
Parcels 1 .682 .676 .689 .678 .644
Parcels 2 .689 .688 .689 .682 .675
Parcels 3 .744 .733 .755 .738 .752
Parcels 4 .828 .826 .831 .827 .751
Parcels 5 .696 .692 .700 .695 .615
Math variables
Parcels 1 .733 .726 .740 .736 .723
Parcels 2 .659 .663 .655 .655 .800
Parcels 3 .630 .642 .618 .629 .615
Parcels 4 .727 .721 .734 .725 .749
Parcels 5 .393 .409 .378 .390 .432
Factor correlation
Reading vs. math .702 .700 .704 .721 .485

146
Table 100
Site 3 Grade 11 SAT 9 Reading and Math Structural Modeling Results (DF = 32)
All cases(N = 7,313)
Even cases(N = 4,556)
Odd cases(N = 4,557)
Non-LEP(N = 7,045)
LEP(N = 268)
Goodness of fit
Chi square 2032 971 1115 1929 77
NFI .940 .943 .935 .941 .924
NNFI .917 .922 .911 .918 .934
CFI .941 .945 .937 .942 .953
Factor loadings
Reading variables
Parcels 1 .732 .723 .741 .720 .769
Parcels 2 .740 .744 .735 .729 .742
Parcels 3 .782 .783 .782 .773 .782
Parcels 4 .818 .830 .806 .818 .724
Parcels 5 .639 .644 .634 .643 .442
Math variables
Parcels 1 .768 .761 .775 .771 .741
Parcels 2 .803 .800 .805 .804 .816
Parcels 3 .794 .791 .798 .794 .765
Parcels 4 .705 .709 .701 .706 .654
Parcels 5 .428 .422 .435 .430 .355
Factor correlation
Reading vs. math .692 .690 .693 .718 .465
These results (Table 97, Table 98, Table 99, and Table 100) indicate that:
1. Findings from the two cross-validation samples are very consistent andprovide evidence for the validity of analyses.
2. Structural models show a better fit for non-LEP than for LEP students.
3 . Correlations between parcel scores and the content-based latentvariables are generally lower for LEP students.
4. Correlations between the content-based latent variables are generallylower for LEP students.
5. These results are all indicative of a possible language factor as a sourceof measurement error for LEP students.

147
Multiple Group Factor Analyses
In the previous sections, we reported the results of simple-structureconfirmatory factor analyses showing the structural relationship of test scoresbetween LEP and non-LEP students across the three content areas. The results of ouranalyses showed differences on factor loadings and factor correlations between LEPand non-LEP students. In additional analyses presented in this section, we createdmultiple-group factor models to test the statistical significance of such differences.We examined the hypothesis of invariance of factor loadings and factor correlationsbetween LEP and non-LEP. Specifically, we tested the following null hypotheses:
1. Correlations between parcel scores and a reading latent variable are thesame for the LEP and non-LEP groups.
2. Correlations between parcel scores and a science latent variable are thesame for the LEP and non-LEP groups.
3. Correlations between parcel scores and a math latent variable are thesame for the LEP and non-LEP groups.
4. Correlations between content-based latent variables are the same for theLEP and non-LEP groups.
Table 101 through Table 106 present results for testing the hypotheses ofinvariance between LEP and non-LEP. Table 101 summarizes the results of analysesfor reading and math tests for Grade 10 and the data include fit indices for LEP andnon-LEP, correlations between the parcel scores and the content-based latentvariables (factor loadings), and the correlations between the latent variables.Hypotheses regarding the invariance of factor loadings and factor correlationsbetween LEP and non-LEP were tested. Significant differences between LEP andnon-LEP at or below .05 nominal levels were identified. These differences areindicated by an asterisk (*) next to each of the constraints. There were severalsignificant differences between LEP and non-LEP on the correlations between parcelscores and latent variables. For example, on the math subscale, factor loadingsbetween LEP and non-LEP on parcels 2 and 3 were significant. There was also asignificant difference between LEP and non-LEP students on the correlation betweenreading and math latent variables.

148
Table 101
Site 3 Grade 10 SAT 9 Reading and Math Structural Modeling Results (Parcels Ordered by ItemNumber)
Model #1 (DF = 75) Model #2 (DF = 74)
Goodness of fit
Chi square 2938 2019
NFI .916 .943
NNFI .902 .933
CFI .918 .945
Factor loadings Non-LEP(N = 8,947) LEP (N = 303) Non-LEP
(N = 8,947) LEP (N = 303)
Reading variables
Parcels 1 .677 .683 .679 .685
Parcels 2 .683 .612 .684 .613
Parcels 3 .738 .695 .739 .696
Parcels 4 .826 .816 .824 .812
Parcels 5 .693 .723 .690 .720
Math variables
Parcels 1 .735 .763 .752 .788
Parcels 2 .659 .702a .667 .716a
Parcels 3 .623 .730a .592 .685a
Parcels 4 .724 .774 .722 .774
Parcels 5 .389 .471 .330 .391
Error correlation
E10 vs. E8 --- --- .329 .365a
Factor correlation
Reading vs. math .719 .624a .723 .622a
Note. E10 refers to the error associated with math parcels 5. E8 refers to the error associatedwith math parcels 3.aSignificant univariate invariance <.05.

149
Table 102
Site 3 Grade 10 SAT 9 Reading and Math Structural Modeling Results
Model #1 Homogenous Parcels(DF = 75)
Model #2 HeterogeneousParcels (DF = 75)
Goodness of fit
Chi square 1460 230
NFI .966 .995
NNFI .961 .996
CFI .967 .997
Factor loadings Non-LEP(N = 8,947) LEP (N = 303) Non-LEP
(N = 8,947) LEP (N = 303)
Reading variables
Parcels 1 .473 .540 .773 .739
Parcels 2 .686 .622a .793 .798
Parcels 3 .811 .776 .786 .771
Parcels 4 .880 .863 .838 .818
Parcels 5 .852 .844 .827 .798
Math variables
Parcels 1 .405 .463 .689 .784
Parcels 2 .597 .698a .723 .758
Parcels 3 .738 .796 .719 .791a
Parcels 4 .797 .837a .760 .805
Parcels 5 .790 .846 .664 .735
Factor correlation
Reading vs. math .719 .624a .723 .622a
aSignificant univariate invariance <.05.

150
Table 103
Site 3 Grade 11 SAT 9 Reading and Math Structural Modeling Results
Model #1 Homogenous Parcels(DF = 75)
Model #2 HeterogeneousParcels (DF = 75)
Goodness of fit
Chi square 975 456
NFI .976 .990
NNFI .974 .989
CFI .978 .991
Factor loadings Non-LEP(N = 7,045) LEP (N = 268) Non-LEP
(N = 7,045)LEP
(N = 268)
Reading variables
Parcels 1 .611 .706a .794 .794
Parcels 2 .765 .772 .804 .842
Parcels 3 .775 .792 .791 .754
Parcels 4 .851 .842 .816 .784
Parcels 5 .875 .847a .831 .837a
Math variables
Parcels 1 .491 .530 .759 .762
Parcels 2 .717 .753 .791 .810a
Parcels 3 .819 .846 .779 .801
Parcels 4 .849 .833 .830 .814
Parcels 5 .837 .872 .726 .707
Factor correlation
Reading vs. math .689 .619a .678 .623a
aSignificant univariate invariance <.05.

151
Table 104
Site 3 Grade 10 SAT 9 Reading and Science Structural Modeling Results (Parcels Ordered byItem Number)
Model #1 (DF = 75) Model #2 (DF = 74)
Goodness of fit
Chi Square 2074 1794
NFI .929 .938
NNFI .914 .924
CFI .930 .940
Factor Loadings Non-LEP(N = 8,918) LEP (N = 264) Non-LEP
(N = 8,947)LEP
(N = 303)
Reading Variables
Parcels 1 .683 .682 .686 .685
Parcels 2 .688 .622 .691 .624
Parcels 3 .741 .704 .742 .704
Parcels 4 .822 .797 .819 .792
Parcels 5 .689 .692 .684 .685
Science Variables
Parcels 1 .665 .614 .680 .626
Parcels 2 .563 .535 .563 .537
Parcels 3 .650 .620 .616 .586
Parcels 4 .457 .433a .406 .384a
Error Correlation
E9 vs. E8 --- --- .201 .202
Factor Correlation
Reading vs. Science .808 .888a .825 .909a
Note. E9 refers to the error associated with reading parcel. E8 refers to the error associated withreading parcel 3.aSignificant univariate invariance <.05.

152
Table 105
Site 3 Grade 10 SAT 9 Reading and Science Structural Modeling Results
Model #1 HomogenousParcels (DF = 58)
Model #2Heterogeneous Parcels
(DF = 58)
Goodness of fit
Chi square 760 233
NFI .978 .995
NNFI .975 .994
CFI .980 .996
Factor loadings Non-LEP(N = 8,918)
LEP(N = 264)
Non-LEP(N = 8,918)
LEP(N = 264)
Reading variables
Parcels 1 .480 .539 .774 .749
Parcels 2 .686 .620 .794 .803
Parcels 3 .811 .792 .789 .776
Parcels 4 .878 .848 .837 .811
Parcels 5 .853 .843 .828 .785
Science variables
Parcels 1 .619 .613 .709 .703
Parcels 2 .620 .628 .525 .498
Parcels 3 .676 .635a .675 .653
Parcels 4 .666 .645 .711 .681
Factor correlation
Reading vs. science .746 .807a .740 .791
aSignificant univariate invariance <.05.

153
Table 106
Site 3 Grade 11 SAT 9 Reading and Science Structural Modeling Results
Model #1 Homogenous Parcels(DF = 75)
Model #2 Heterogeneous Parcels(DF = 75)
Goodness of fit
Chi square 806 193
NFI .974 .994
NNFI .970 .995
CFI .976 .996
Factor loadings Non-LEP(N = 6,932) LEP (N = 244) Non-LEP
(N = 6,932) LEP (N = 244)
Reading variables
Parcels 1 .788 .801 .797 .794
Parcels 2 .696 .674 .819 .842
Parcels 3 .790 .772 .798 .810
Parcels 4 .807 .786 .801 .808
Parcels 5 .815 .861a .780 .787
Science variables
Parcels 1 .433 .411 .666 .639
Parcels 2 .666 .594 .697 .663
Parcels 3 .772 .713 .756 .719
Parcels 4 .821 .791 .779 .722
Factor correlation
Reading vs. science .765 .848a .725 .783a
aSignificant univariate invariance <.05.
Table 102 through Table 106 present similar results for other content areas inGrades 10 and 11. The data in these tables show trends that were similar to thosereported in Table 101. The results of our analyses, reported in these tables, suggestthat the structural relationships of test items across the different content areas weredifferent for the two groups. These results, which were consistent across the contentareas and across the two grades, strongly suggest that major differences existbetween the two groups of subjects, and that the two groups should be consideredthe same with respect to measuring their content knowledge.

154
Discussion
The purpose of this study was to examine the impact of students’ languagebackground on the outcome of their assessments. Three major research questionsguided the analyses and reporting and will be the basis for discussion of the results:
1. Could the performance difference between ELL and non-ELL studentsbe partly explained by language factors in the assessment?
2. Could the linguistic complexity of test items as a possible source ofmeasurement error influence the reliability of assessment?
3. Could the linguistic complexity of test items as a possible source ofconstruct-irrelevant variance influence the validity of the tests?
For our extant data analyses, we have been fortunate to have access to datafrom several large school districts nationwide. Complete item-level data onstandardized achievement tests along with student background variables, includinglanguage background variables, were obtained from different sites across the nation.Among the student background variables provided were family SES, ethnicity,gender, and parent education. However, it must be noted that the data files from thevarious sites were different in many aspects. Different tests (such as Stanford 9 andITBS) were used by different sites. The student background variables also variedfrom site to site. Some sites provided data on student free/reduced-price lunchprogram participation as an index of family SES. At some sites we had access toother SES variables such as AFDC; at other sites there were not any data on studentSES. Among the major differences in the data across the different sites was theoperational definition of ELL status. Some sites provided student ESL status, someprovided ELL status, and others provided bilingual program participation status.
In spite of some differences between the structures of data from the differentdata sites, the results of the analyses on some major issues were consistent withinand across the sites. Results of our analyses indicated that ELL students generallyperform lower than non-ELL students in all subject areas, and particularly so inthose areas with more language demand. For example, the results of this studyconsistently demonstrate that the performance gap between ELL and non-ELLstudents is smallest (and in some cases non-existent) in content areas with a lowlevel of language demand, such as math computation, and is largest in content areaswith a high level of language demand, such as reading and writing. The fact that thegap between the performance of ELLs and non-ELL students increases as the

155
language demand of the items increases provides strong evidence of the impactlanguage demand has on content area performance.
A major finding of this study was lower reliability/internal consistency for theELL students. The results of our analyses indicated that test items for ELL students,particularly ELL students at the lower end of the English proficiency spectrum,suffer from lower internal consistency. Structural relationships between test scoresfor ELL and non-ELL students are different. For ELLs, the structural relationshipsare weaker. We speculated that this is due to language. That is, language factorsintroduce another source of measurement error into the structural models for ELLs.
The results of multivariate analyses, which were cross-validated, indicated thatstudent family characteristics might be more important than what we originallythought. For example, parent education proved to be an important variable whenstudying the impact of language on performance. In a multiple regression withcontent-based test scores (math and reading), gender, and ethnicity as predictorvariables, ethnicity showed the highest predictive power in predicting studentbilingual status. The item-level analyses indicated that some test items from thestandardized achievement tests were shown to be more difficult for ELLs. Weidentified those items and we cross-validated our findings with other groups ofstudents.
We can now discuss findings of this study in response to the specific researchquestions raised earlier in this section.
Question 1. Could the performance difference between ELL and non-ELL
students be partly explained by language factors in the assessment?
In response to this research question, results from the analyses of data fromseveral locations nationwide indicated that students’ assessment results might beconfounded with language background variables. Descriptive statistics comparingELL- and non-ELL-student performance by subgroup and across different contentareas revealed major differences between the performances of the two groups.Included in the descriptive statistics section was a Disparity Index (the Disparity ofperformance of non-ELL over that of ELL students). This index showed majordifferences between students with different language backgrounds. The higher thelevel of English language complexity in the assessment tool, the greater theDisparity Index (the performance gap between ELL and non-ELL students).

156
Access to student-level and item-level data from the sites providedopportunities to conduct analyses on student subgroups that were formed based ontheir background variables, including language background. The exceptionally largenumbers of students in some subgroups enabled us to conduct cross-validationstudies to demonstrate consistency of results over different sites and grade levels.The high degree of consistency assured us of the validity and interpretability of theresults.
Descriptive analyses revealed that ELL students generally perform lower thannon-ELL students on reading, science, and math subtests. The level of impact oflanguage proficiency on assessment of ELL students was greater in content areaswith a higher level of language demand—a strong indication of the impact ofEnglish language proficiency on assessment. For example, analyses show that ELLand non-ELL students had the greatest performance differences in reading, and theleast performance differences in math, where language has less of an impact on theassessment.
Question 2. Could the linguistic complexity of test items as a possible source
of measurement error influence the reliability of assessment?
In response to Question 2, the results of our analyses indicated that test itemsfor ELL students, particularly ELL students at the lower end of the Englishproficiency spectrum, suffer from lower internal consistency. That is, the languagebackground of students may add another dimension to the assessment in content-based areas. Thus, we speculated that language might act as a source ofmeasurement error in such areas. It is therefore imperative that test publishersexamine the impact of language factors on test reliability and publish reliabilityindices separately for the ELL subpopulation.
Question 3. Could the linguistic complexity of test items as a possible source
of construct-irrelevant variance influence the validity of the tests?
To shed light on the issues concerning the impact of language factors onvalidity (Research Question 3), concurrent validity of standardized achievementtests (Stanford 9 and ITBS) was examined using a latent-variable modelingapproach. Standardized achievement latent variables were correlated with theexternal-criterion latent variables. The results suggest that: (a) there is a strongcorrelation between the standardized achievement and external-criterion latentvariables; (b) this relationship is stronger when latent-variables rather than

157
measured variables are used; and (c) the correlation between standardizedachievement and external-criterion latent variables is significantly larger for the non-ELL than the ELL population. We speculate that low correlation between the twolatent variables for the ELL group stems from language factors. That is, languagefactors act as construct-irrelevant sources (Messick, 1994).
Analyses of the structural relationships between individual items and betweenitems with the total test scores revealed a major difference between ELL and non-ELL students. Structural models for ELL students demonstrated lower statistical fit.Further, the factor loadings were generally lower for ELL students and thecorrelations between the latent content-based variables were weaker for ELLstudents.
The results of this study suggest that ELL test performance may be explained atleast partly by language factors. That is, linguistic complexity of test items unrelatedto the content being assessed may at least be partly responsible for the performancegap between ELL and non-ELL students. Based on the findings of this study, werecommend that: (1) the issues concerning the impact of language factors on theassessment of ELLs should be examined further; (2) psychometric characteristics ofassessment tools should be carefully reviewed for ELLs; and (3) in assessing ELLs,student language background variables should always be included, and effortsshould be made to reduce confounding effects of language background on theassessment outcome.


159
References
Abedi, J. (1997). Dimensionality of NAEP subscale scores in mathematics (Tech. Rep. No.428). Los Angeles: University of California, Center for the Study of Evaluation.
Abedi, J., Hofstetter, C., Lord, C., & Baker, E. (1998). NAEP math performance and testaccommodations: Interactions with student language background. Los Angeles:University of California, National Center for Research on Evaluation,Standards, and Student Testing.
Abedi, J., & Leon, S. (1999). Impact of students’ language background on content-basedperformance: Analyses of extant data. Los Angeles: University of California,National Center for Research on Evaluation, Standards, and Student Testing.
Abedi, J., Leon, S., & Mirocha, J. (2001). Examining ELL and non-ELL studentperformance differences and their relationship to background factors: Continuedanalyses of extant data. Los Angeles: University of California, National Center forResearch on Evaluation, Standards, and Student Testing.
Abedi, J., & Lord, C. (2001). The language factor in mathematics tests. AppliedMeasurement in Education, 14(3), 219-234.
Abedi, J., Lord, C., & Hofstetter, C. (1997). The impact of students’ language backgroundvariables on their NAEP mathematics performance. Los Angeles: University ofCalifornia, Center for the Study of Evaluation.
Abedi, J., Lord, C., & Hofstetter, C. (1998). Impact of selected background variables onstudents’ NAEP math performance. Los Angeles: University of California, Centerfor the Study of Evaluation/National Center for Research on Evaluation,Standards, and Student Testing.
Abedi, J., Lord, C., Hofstetter, C., & Baker, E. (2000). Impact of accommodationstrategies on English language learners’ test performance. EducationalMeasurement: Issues and Practice, 19(3), 16-26.
Abedi, J., Lord, C., & Plummer, J. (1997). Language background as a variable in NAEPmathematics performance (Tech. Rep. No. 429). Los Angeles: University ofCalifornia, Center for the Study of Evaluation/National Center for Research onEvaluation, Standards, and Student Testing.
Allen, M. J., & Yen, W. M. (1979). Introduction to measurement theory. Monterey, CA:Brooks/Cole.
American Educational Research Association, American Psychological Association, &National Council on Measurement in Education (1999). Standards for educationaland psychological testing. Washington, DC: American Educational ResearchAssociation.

160
Bailey, A. (2000). Language analysis of standardized achievement tests:Considerations in the assessment of English language learners. In AssessingEnglish language learners (Draft Deliverable to OBEMLA). Los Angeles:University of California, Center for the Study of Evaluation/National Centerfor Research on Evaluation, Standards, and Student Testing.
Bentler, P. M. (1992). EQS structural equations program manual. Los Angeles: BMDPStatistical Software.
Bentler, P. M., & Bonett, D. G. (1980). Significance tests and goodness of fit in theanalysis of covariance structures. Psychological Bulletin, 88, 588-606.
Cocking, R. R., & Chipman, S. (1988). Conceptual issues related to mathematicsachievement of language minority children. In R. R. Cocking & J. P. Mestre(Eds.), Linguistic and cultural influences on learning mathematics (pp. 17-46.)Hillsdale, NJ: Erlbaum.
Cortina, M. (1993). What is alpha? An examination of theory and applications.Journal of Applied Psychology, 78(1), 98-104.
Duran, R. P. (1989, October). Assessment and instruction of at-risk Hispanicstudents. Exceptional Children, 56(2), 154-158.
Garcia, G. E. (1991). Factors influencing the English reading test performance ofSpanish-speaking Hispanic children. Reading Research Quarterly, 26(4), 371-391.
Kirk, R. E. (1995). Experimental design: Procedures for the behavioral sciences. PacificGrove, CA: Brooks/Cole.
LaCelle-Peterson, M. W., & Rivera, C. (1994). Is it real for all kids? A framework forequitable assessment policies for English language learners. Harvard EducationalReview, 64(1), 55-75.
Mestre, J. P. (1988). The role of language comprehension in mathematics andproblem solving. In R. R. Cocking & J. P. Mestre (Eds.), Linguistic and culturalinfluences on learning mathematics (pp. 200-220). Hillsdale, NJ: Erlbaum.
Pedhazur, E. (1997). Multiple regression in behavioral research (3rd ed.). New York:Harcourt Brace College.
Schmitt, A. P., & Dorans, N. J. (1989, April). Factors related to differential itemfunctioning for Hispanic examinees on the Scholastic Aptitude Test. Paper presentedat the ETS Invitational Conference of Hispanics and Access: A Conference onHispanics in Higher Education, Princeton, NJ.

161
APPENDIX

162
ACRONYMS
The following is a list of acronyms used throughout the report.
AFDC ........... Aid to Families with Dependent ChildrenANOVA ....... Analysis Of VarianceCDF .............. Cumulative Distribution FunctionCFI................ Comparative Fit IndexCRESST ........ National Center for Research on Evaluation, Standards, and Student
TestingDBN.............. Difference between Bilingual and Non-bilingualDI.................. Disparity Index/IndicesDTI ............... Differential Treatment IndexECDF............ Empirical Cumulative Distribution FunctionELL ............... English Language LearnerEO................. English OnlyFEP ............... Fluent English ProficientGPA.............. Grade Point AverageITBS .............. Iowa Tests of Basic SkillsLAS............... Language Assessment ScalesLEP ............... Limited English ProficientM .................. MeanMANOVA ... Multivariate Analysis of VarianceMR................ Multiple Regressionn.................... NumberNAEP ........... National Assessment of Educational ProgressNCE.............. Normal Curve EquivalentNFI ............... Normed Fit IndexNNFI ............ Non-normed Fit IndexNPR.............. National Percentile RankingsOTL .............. Opportunity to LearnQQ ................ Quantile-quantileRFEP............. Re-designated Fluent English ProficientSAT............... Scholastic Aptitude TestSAT 9............ Stanford Achievement Test Series, Ninth EditionSD ................. Standard DeviationSWD ............. Students With DisabilitiesSES................ Socioeconomic Status