impact of sprinklers on the fire hazard in dormitories ... · qc 100.u5753 #1658 2010 c.2....
TRANSCRIPT

NAT'L INST, OF STAND & TECH
lllllillllllllllll NI8T
A111D7 lE2T7bPUBLICATIONS
NIST TN 1658
Impact of Sprinklers on the Fire Hazard in Dormitories:
Sleeping Room Fire Experiments
Daniel Madrzykowski
William D. Walton
FEMASponsored in part by
Department of Homeland Security
Federal Emergency Management Agency
United States Fire Administration
NisrNational Institute of Standards and Technology
Technology Administration, U.S. Department of Commerce
QC100
.U5753
#1658
2010
C.2


NIST TN 1658
Impact of Sprinklers on the Fire Hazard in Dormitories:
Sleeping Room Fire Experiments
Daniel Madrzykowski
William D. Walton
Fire Research Division
Building and Fire Research Laboratory
National Institute ofStandards and Technology
Gaithersburg, MD 20899-8661
January 2010
-^^'^OFco^
FEMA'^AD '^V'^
Department of Homeland Security
Janet Napolitano, Secretary
Federal Emergency Management Association
Craig Fugate, Administrator
United States Fire Administration
Kelvin J. Cochran, Assistant Administrator
*^4rES o*'^
U.S. Department of CommerceGary Locke, Secretary
National Institute of Standards and
Technology
Patrick Gallagher, Director


Impact of Sprinklers on the Fire Hazard in Dormitories:
Sleeping Room Fire Experiments
Daniel Madrzykowski and William D. Walton
Building and Fire Research Laboratory
National Institute of Standards and Technology
Abstract
As part of a U.S. Fire Administration (USFA) initiative to improve fire safety in college housing,
the National Institute of Standards and Technology (NIST) conducted two series of full-scale fire
experiments in abandoned dormitory buildings. The objective of the study was to compare the
levels of hazard created by room fires in a dormitory building with and without automadc fire
sprinklers in the room of fire origin.
Five experiments were conducted which included variables such as an open/closed door between
the room of origin and the corridor, and with/without sprinklers in the room of origin. Gas
temperatures and concentrations (oxygen, carbon monoxide and carbon dioxide) were measured
continuously in each experiment. This report contains analysis of the data collected and a
detailed discussion of the experimental conditions, such as fuel load in the room of origin,
geometry and construction of the room, and the locations of instrumentation. The results of this
study demonstrate the potential life safety benefits of smoke alarms, compartmentation, and
automatic fire sprinkler systems in college dormitories and similar occupancies. These
experiments were conducted by NIST in cooperation with the University of Arkansas and the
Fayetteville Fire Department.
The other series of experiments was conducted with the fires initiated in a day room area open to
the corridor of the dormitory. These experiments were conducted by NIST in cooperation with
the Myrtle Beach Air Force Base Redevelopment Authority, the Myrtle Beach Fire Department,
and the Bureau of Alcohol, Tobacco and Firearms (ATF). The results of these experiments are
presented in the report. Impact ofSprinklers on the Fire Hazard in Dormitories: Day Room Fire
Experiments, NISTIR 7120.
For further information on the USFA College Campus Fire Safety Program contact:
www.usfa.dhs.gov/citizens/college/.
Key Words: corridor tests; dormitories; fire data; gas concentrations; heat flux; large scale fire
tests; sprinklers; temperature measurements; tenability
ni

Disclaimer
Certain trade names or company products are mentioned in the text to specify adequately the
experimental procedure and equipment used. In no case does such identification imply
recommendation or endorsement by the National Institute of Standards and Technology, nor
does it imply that the equipment is the best available for the purpose.
Regarding Non-Metric Units: The policy of the National Institute of Standards and Technology
is to use metric units in all its published materials. To aid the understanding of this report, in
most cases, measurements are reported in both metric and U.S. customary units, in some cases
the conversion will have been rounded.
IV

Acknowledgements
The authors would Hke to thank the University of Arkansas, especially Mr. John Wichser,
Associate Director for Residential Facilities and the Fayetteville Fire Department, especially
Chief Terry Lawson, for supporting the conduct of the experiments and providing logistical and
fire fighting support. The authors would like to recognize Mr. Laurean DeLauter and Mr. Jay
McElroy of the Building and Fire Research Laboratory at NIST, Ms. Sarah Thompson and Mr.
William Twilley formerly with NIST and Mr. Scott Dillon formerly of the ATF Fire Research
Laboratory for the invaluable support that they provided during this series of experiments.
The authors also wish to thank Jonathan Kent for the application of his programming talents
which enabled improved data analysis capabilities and graph generation.
Finally, the authors express gratitude to the United States Fire Administration and Mr. Larry
Maruskin for their sponsorship and support of this important research program.

Table of Contents
Abstract iii
Disclaimer iv
Acknowledgements v
Table of Contents vi
List of Figures viii
List of Tables xii
1 Introduction 1
2 Technical Approach 2
2.1 Experimental Arrangement 2
2.2 Dormitory Building 2
2.3 Room Contents 7
2.4 Instrumentation 13
2.5 Uncertainty Analysis 17
2.6 Experimental Procedure 18
3 Results 19
3.1 Experiment 1: Closed Door, Non-Sprinklered 19
3.1.1 Experiment Timeline 19
3.1.2 Smoke Alarm and Sprinkler Activation Times 20
3.1.3 Temperature Data 20
3.1.4 Gas Concentrations 24
3.1.5 Heat Flux Data 26
3.2 Experiment 2: Closed Door, Sprinklered 27
3.2.1 Experiment Timeline 27
3.2.2 Smoke Alarm and Sprinkler Activation Times 28
3.2.3 Temperature Data 29
3.2.4 Gas Concentrations 32
3.2.5 Heat Flux Data 34
3.3 Experiment 3: Open Door, Sprinklered 35
3.3.1 Experiment Timeline 35
3.3.2 Smoke Alarm and Sprinkler Activation Times 36
3.3.3 Temperature Data 37
3.3.4 Gas Concentrations 40
3.3.5 Heat Flux Data 42
3.4 Experiment 4: Open Door, Non-Sprinklered 43
3.4.1 Experiment Timeline 43
3.4.2 Smoke Alarm and Sprinkler Activation Times 44
vi

3.4.3 Temperature Data 45
3.4.4 Gas Concentrations 49
3.4.5 Heat Flux Data 51
3.5 Experiment 5: Open Door, Non-Sprinklered 52
3.5.1 Experiment Timeline 52
3.5.2 Smoke Alarm and Sprinkler Activation Times 53
3.5.3 Temperature Data 54
3.5.4 Gas Concentrations 58
3.5.5 Heat Flux Data 60
4 Discussion 62
4.1 Closed Door Experiments 62
4.2 Comparison of the Non-Sprinklered Experiments 66
4.3 Comparison of Open Door, Sprinklered versus Non-sprinklered
Experiments 72
4.4 Summary 78
5 Conclusions 81
6 References 82
Vll

List of Figures
Figure 2.2-1. Photograph of the outside of the northwest wing of the dormitory building, looking
southwest 3
Figure 2.2-2. Photograph of the instrumented corridor in the northwest wing of the dormitory
building, looking east 4
Figure 2.2-3. Floor plan of the northwest corridor 5
Figure 2.2-4. Floor plan of a typical dorm room used in the experiments 6
Figure 2.3-1. Furnishing arrangement of a typical dorm room used in the experiments 7
Figure 2.3-2. Photograph of fixed ftimishings composed of wood chest of drawers, woodshelves and peg board cabinet closet doors 8
Figure 2.3-3. Photograph of the bed fuel package 9
Figure 2.3-4. Photograph of the desk fuel package 10
Figure 2.3-5. Photograph showing clothing and closet fuel load arrangement 1
1
Figure 2.3-6. Photograph of ignition fuel package positioned between the desk and the bed
closest to the window 12
Figure 2.4-1. Floor plan of dorm room with instrumentation locations 14
Figure 2.4-2. Floor plan of corridor with instrumentation locations 15
Figure 3.1-1. Temperature versus time data from thermocouple array 1 in Experiment 1, listed
by distance below ceiling (BC) 21
Figure 3.1-2. Temperature versus time data from thermocouple array 2 in Experiment 1, listed
by distance below ceiling (BC) 22
Figure 3.1-3. Temperature versus time data from thermocouple array 3 in Experiment 1, listed
by distance below ceiling (BC) 23
Figure 3.1-4. Temperature versus time data from thermocouple array 4 in Experiment 1, listed
by distance below ceiling (BC) 23
Figure 3.1-5. Temperature versus time data from thermocouple array 5 in Experiment 1, hsted
by distance below ceiling (BC) 24
Figure 3.1-6. Relative gas concentrations versus time for the gas sampling point at 1.52 m above
the floor at location 1 in Experiment 1 25
Figure 3.1-7. Relative gas concentrations versus time for the gas sampling at 1.52 m above the
floor at location 4 in Experiment 1 26
Figure 3.1-8. Heat flux versus time data for the heat flux gauges at locations 3, 4, and 5 in the
orientations up (vert) and sideways (horz) 27
Figure 3.2-1. Temperature versus time data from thermocouple array 1 in Experiment 2, listed
by distance below ceiling (BC) 30
Figure 3.2-2. Temperature versus time data from thermocouple array 2 in Experiment 2, listed
by distance below ceiling (BC) 30
Figure 3.2-3. Temperature versus time data from thermocouple array 3 in Experiment 2, hsted
by distance below ceiling (BC) 31
Figure 3.2-4. Temperature versus time data from thermocouple array 4 in Experiment 2, listed
by distance below ceiling (BC) 31
Figure 3.2-5. Temperature versus time data from thermocouple array 5 in Experiment 2, listed
by distance below ceiling (BC) 32
viii

Figure 3.2-6. Relative gas concentrations versus time for the gas sampling at 1.52 m above the
floor at location 1 in Experiment 2 33
Figure 3.2-7. Relative gas concentrations versus time for the gas sampling at 1 .52 m above the
floor at location 4 in Experiment 2 34
Figure 3.2-8. Heat flux versus time data for the heat flux gauges at locations 3, 4, and 5 in the
orientations up (U) and sideways (S) in Experiment 2 35
Figure 3.3-1. Temperature versus time data from thermocouple array 1 in Experiment 3, listed
by distance below ceiling (BC) 37
Figure 3.3-2. Temperature versus time data from thermocouple array 2 in Experiment 3, listed
by distance below ceiling (BC) 38
Figure 3.3-3. Temperature versus time data from thermocouple array 3 in Experiment 3, listed
by distance below ceiling (BC) 39
Figure 3.3-4. Temperature versus time data from thermocouple array 4 in Experiment 3, listed
by distance below ceiling (BC) 39
Figure 3.3-5. Temperature versus time data from thermocouple array 5 in Experiment 3, listed
by distance below ceiling (BC) 40
Figure 3.3-6. Relative gas concentrations versus time for the gas sampling at 1.52 m above the
floor at location 1 in Experiment 3 41
Figure 3.3-7. Relative gas concentrations versus time for the gas sampling at 1.52 m above the
floor at location 4 in Experiment 3 42
Figure 3.3-8. Heat flux versus time data for the heat flux gauges at locations 3, 4, and 5 in the
orientations up (vert.) and sideways (horz.) in Experiment 3 43
Figure 3.4-1. Temperature versus time data from thermocouple array 1 in Experiment 4, listed
by distance below ceiling (BC) 46
Figure 3.4-2. Temperature versus time data from thermocouple array 2 in Experiment 4, listed
by distance below ceiling (BC) 46
Figure 3.4-3. Temperature versus time data from thermocouple array 3 in Experiment 4, listed
by distance below ceiling (BC) 47
Figure 3.4-4. Temperature versus time data from thermocouple array 4 in Experiment 4, listed
by distance below ceiling (BC) 48
Figure 3.4-5. Temperature versus time data from thermocouple array 5 in Experiment 4, listed
by distance below ceihng (BC) 48
Figure 3.4-6. Relative gas concentrations versus time for the gas sampling at 1.52 m above the
floor at location 1 in Experiment 4 50
Figure 3.4-7. Relative gas concentrations versus time for the gas sampling at 1.52 m above the
floor at location 4 in Experiment 4 51
Figure 3.4-8. Heat flux versus time data for the heat flux gauges at locations 3, 4, and 5 in the
orientations up (U) and sideways (S) in Experiment 4 52
Figure 3.5-1. Temperature versus time data from thermocouple array 1 in Experiment 5, listed
by distance below ceiling (BC) 55
Figure 3.5-2. Temperature versus time data from thermocouple array 2 in Experiment 5, listed
by distance below ceihng (BC) 55
IX

Figure 3.5-3. Temperature versus time data from thermocouple array 3 in Experiment 5, listed
by distance below ceiling (BC) 56
Figure 3.5-4. Temperature versus time data from thermocouple array 4 in Experiment 5, listed
by distance below ceiling (BC) 57
Figure 3.5-5. Temperature versus time data from thermocouple array 5 in Experiment 5, listed
by distance below ceiling (BC) 57
Figure 3.5-6. Relative gas concentrations versus time for the gas sampling at 1.52 m above the
floor at location 1 in Experiment 5 59
Figure 3.5-7. Relative gas concentrations versus time for the gas sampling at 1.52 m above the
floor at location 4 in Experiment 5 60
Figure 3.5-8. Heat flux versus time data for the heat flux gauges at locations 3, 4, and 5 in the
orientations up (vert.) and sideways (horz.) in Experiment 5 61
Figure 4.1-1. Post fire photographs of the dorm room for Experiment 1 (non-sprinklered) on the
left and Experiment 2 (sprinklered) on the right 63
Figure 4.1-2. Temperature versus time data from thermocouple array 1 from Experiment 1 and 2
at approximately 1.5 m (5 ft) above the floor 64
Figure 4.1-3. Oxygen concentrations versus time in the dorm room from Experiment 1 and 2 at
approximately 1.5 m (5 ft) above the floor 65
Figure 4.1-4. Carbon dioxide concentrations versus time in the dorm room from Experiment 1
and 2 at approximately 1.5 m (5 ft) above the floor 65
Figure 4.1-5. Carbon monoxide concentrations versus time in the dorm room from Experiment 1
and 2 at approximately 1.5 m (5 ft) above the floor 66
Figure 4.2-1. Post fire photographs of the dorm room for Experiment 1 (door closed) on the left
and Experiment 5 (door open) on the right 66
Figure 4.2-2. Post fire photographs of the corridor for Experiment 1 (door closed) on the left and
Experiment 5 (door open) on the right 67
Figure 4.2-3. Temperature versus time data from thermocouple array 1 from Experiment 1, 4
and 5 at approximately 1.5 m (5 ft) above the floor 68
Figure 4.2-4. Temperature versus time data from thermocouple array 4 from Experiment 1, 4
and 5 at approximately 1.5 m (5 ft) above the floor 68
Figure 4.2-5. Oxygen concentrations versus time in the dorm room from Experiment 1, 4 and 5
at approximately 1.5 m (5 ft) above the floor 69
Figure 4.2-6. Oxygen concentrations versus time in the corridor from Experiment 1, 4 and 5 at
approximately 1.5 m (5 ft) above the floor 70
Figure 4.2-7. Carbon dioxide concentrations versus time in the dorm room from Experiment 1, 4
and 5 at approximately 1.5 m (5 ft) above the floor 70
Figure 4.2-8. Carbon dioxide concentrations versus time in the corridor from Experiment 1, 4
and 5 at approximately 1.5 m (5 ft) above the floor 71
Figure 4.2-9. Carbon monoxide concentrations versus time in the dorm room from Experiment
1, 4 and 5 at approximately 1.5 m (5 ft) above the floor 71
Figure 4.2-10. Carbon monoxide concentrations versus time in the corridor from Experiment 1,
4 and 5 at approximately 1.5 m (5 ft) above the floor 72

Figure 4.3-1. Post fire photographs for Experiment 3 (sprinklered) on the left and Experiment 4
(non-sprinklered) on the right 73
Figure 4.3-2. Temperature versus time data from thermocouple array 1 from Experiment 3, 4
and 5 at approximately 1.5 m (5 ft) above the floor 74
Figure 4.3-3. Temperature versus time data from thermocouple array 4 from Experiment 3, 4
and 5 at approximately 1.5 m (5 ft) above the floor 74
Figure 4.3-4. Oxygen concentrations versus time in the dorm room from Experiment 3, 4 and 5
at approximately 1.5 m (5 ft) above the floor 75
Figure 4.3-5. Oxygen concentrations versus time in the corridor from Experiment 3, 4 and 5 at
approximately 1.5 m (5 ft) above the floor 75
Figure 4.3-6. Carbon dioxide concentrations versus time in the dorm room from Experiment 3, 4
and 5 at approximately 1.5 m (5 ft) above the floor 76
Figure 4.3-7. Carbon dioxide concentrations versus time in the corridor from Experiment 3, 4
and 5 at approximately 1.5 m (5 ft) above the floor 76
Figure 4.3-8. Carbon monoxide concentrations versus time in the dorm room from Experiment
3, 4 and 5 at approximately 1.5 m (5 ft) above the floor 77
Figure 4.3-9. Carbon monoxide concentrations versus time in the corridor from Experiment 3, 4
and 5 at approximately 1.5 m (5 ft) above the floor 77
XI

List of Tables
Table 2.3-1.
Table 2.3-2.
Table 2.3-3.
Table 2.3-4.
Table 2.3-5.
Table 2.6-1.
Table 3.1-1.
Table 3.1-2.
Table 3.1-3.
Table 3.2-1.
Table 3.2-2.
Table 3.2-3.
Table 3.3-1.
Table 3.3-2.
Table 3.3-3.
Table 3.4-1.
Table 3.4-2.
Table 3.4-3.
Table 3.5-1.
Table 3.5-2.
Table 3.5-3.
Table 4.4-1.
Table 4.4-2.
Fixed furnishings and interior finish 8
Bed fuel package 9
Desk fuel package 10
Clothing and closet contents 1
1
Ignition fuel package 12
Setup for the 5 experiments 18
Timeline for Experiment Number 1 19
Dorm Room Experiment 1, Smoke Alarm Activation Times 20
Dorm Room Experiment 1, Sprinkler Activation Times 20
Timeline for Experiment Number 2 28
Dorm Room Experiment 2, Smoke Alarm Activation Times 28
Dorm Room Experiment 2, Sprinkler Activation Times 28
Timeline for Experiment Number 3 36
Dorm Room Experiment 3, Smoke Alarm Activation Times 36
Dorm Room Experiment 3, Sprinkler Activation Times 36
Timeline for Experiment Number 4 44
Dorm Room Experiment 4, Smoke Alarm Activation Times 45
Dorm Room Experiment 4, Sprinkler Activation Times 45
Timeline for Experiment Number 5 53
Dorm Room Experiment 5, Smoke Alarm Activation Times 54
Dorm Room Experiment 5, Sprinkler Activation Times 54
Sprinkler and Smoke Alarm Activation Times and Temperatures at Those Devices
at the Time of Activation 79
Time to Reach Given Untenability Criteria (Red) or Most Significant Tenability
Risk Encountered (Blue) for the Dorm Room and Corridor 79
xn

1 Introduction
From 2003 through 2006 there was an estimated annual average of 3,370 structure fires in
dormitory or barracks occupancies in the United States. Of the reported structure fires in
dormitory properties, only 5% of the fires originated in the bedroom or sleeping room. However,
this small percentage of fires resulted in 62% of the civilian fire deaths and 26% of civilian fire
injuries [1].
As part of the U.S. Fire Administration (USFA) initiative to improve fire safety in college
housing, the Nafional Institute of Standards and Technology (NIST) conducted two series of full-
scale fire experiments in abandoned dormitory buildings. The objective of the study was to
compare the levels of hazard created by room fires in a dormitory building with and without
automatic fire sprinklers in the room of fire origin, hi addition, the effect of a closed door was
examined.
One series of experiments was designed with the fires starting in a day room or lounge area open
to the corridor of the dormitory. These experiments were conducted by NIST in cooperation
with the Myrtle Beach Air Force Base Redevelopment Authority, the Myrtle Beach Fire
Department, and the Bureau of Alcohol, Tobacco and Firearms (ATF). The results of these
experiments are presented in the report, Impact ofSprinklers on the Fire Hazard in Dormitories:
Day Room Fire Experiments, NISTIR 7120 [2].
The series of experiments presented in this report were designed with the fires starting in a
dormitory sleeping room. These experiments were conducted by NIST in cooperation with the
University of Arkansas and the Fayetteville, Arkansas Fire Department.
This paper documents experiments conducted to examine the fire development, the spread of hot
gases outside the fire room, and the effectiveness of an automatic sprinkler system in suppressing
the fire. Five fire experiments were conducted:
1) Fire room door closed, non-sprinklered
2) Fire room door closed, sprinklered
3) Fire room door open, sprinklered
4) Fire room door open, non-sprinklered
5) Fire room door open, non- sprinklered
The experiments were conducted in an abandoned college dormitory building located on the
University of Arkansas Campus in Fayetteville, Arkansas.

2 Technical Approach
Opportunities to conduct real scale fire experiments in a structure are rare. These experiments
are important, because they provide the nearest simulation of "real world" conditions, in terms of
geometry, materials and building elements, heat loss to the structure, ventilation, and volume.
Fire experiments were conducted in an unoccupied college dormitory building that was slated for
demolition.
Measurements were made to quantify and differentiate the level of hazard and the rate of hazard
development in both sprinklered and non-sprinklered student sleeping rooms and the adjacent
corridor. Temperature, oxygen, carbon dioxide and carbon monoxide concentration
measurements were made in the sleeping rooms (room of fire origin) and in the corridor. Smokealarm activation and sprinkler activation times were also recorded. In addition, heat flux
measurements in the corridor were made to provide information on the thermal conditions to
which fire fighters approaching the room of origin would be exposed. The experiments were
also recorded with video cameras.
Each sleeping room was furnished with similar furniture, computers and related equipment,
clothing and decorations representative of an actual dorm room. The fuel load was described,
weighed and documented for each room, as means to obtain a similar fuel load in each dorm
room. The experimental approach permitted the examination of the impact of an automatic fire
sprinkler (suppression system) in a real-scale college dormitory building. The other key issue
examined was the impact of a closed door (compartmentation) on conditions inside the room of
fire origin as well as the spread of heat and combustion gases to the corridor. Commercially
available ionization smoke alarms were also installed in the sleeping rooms and in the corridor to
measure the time to alarm. Each experiment involved the ignition of a small fire in one sleeping
room.
2.1 Experimental Arrangement
With the cooperation of the University of Arkansas in Fayetteville and the Fayetteville Fire
Department, the experiments were conducted in an unoccupied dormitory building that was
constructed in the 1950s. The building was of fire resistive construction.
2.2 Dormitory Building
The building used for the experiments was a four-story, dormitory building. The floors and
ceilings of the building were poured concrete and the walls were made from concrete block with
brick covering the exterior. Each floor of the building had four residential wings, two on the
north side of the building and two on the south. The two wings on each of the north and the
south sides of the building were separated by an open air stairway. The north and south sides of
the building were joined by bathroom and shower facilities on the east and western portion of the

building with an open air walkway in between. The overall footprint of the building, including
the two courtyards, was approximately 95 m (310 ft) by 39 m (128 ft).
The first floor of the northwest wing of the building was chosen for the experiments based on the
pristine condition of the dorm rooms. Photographs of the exterior and interior of the northwest
wing are shown in Figure 2.2-1 and Figure 2.2-2. In Figure 2.2-2 the sleeping rooms are on the
left side of the corridor and a courtyard can be seen through the windows on the right.
The length of the corridor was 19.81 m (65.00 ft). The corridor was 2.54 m (8.33 ft) wide with a
ceiling height of 2.39 m (7.83 ft). The rooms were located on the north side of the corridor.
Windows comprised the upper portion of the south wall of the corridor. The single pane
windows were 1.33 m (4.38 ft) high with 0.83 m (2.70 ft) window sill height above the floor. Adoor, 0.98 m (3.23 ft) wide and 2.02 m (6.63 ft) high, provided access to the corridor from the
east end of the corridor. This door was kept closed during the fire experiments. A smoke curtain
made of gypsum board was installed on the west end of the corridor to limit smoke flow into the
portion of the corridor that led to the shower rooms and connected the southwest corridor of the
building. An area 1.55 m (5.08 ft) wide and 1.07 m (3.5 ft) was left open under the smoke
curtain to prevent pressure increase in the corridor during the fire.
Figure 2.2-1. Photograph of the outside of the northwest wing of the dormitory building,
looking southwest.

Figure 2.2-2. Photograph of the instrumented corridor in the northwest wing of the
dormitory building, looking east.
Five rooms of identical size, Dorm Room 1 through Dorm Room 5, each connected to the
corridor, were used for the fire experiments (Figure 2.2-3). The inside dimensions of each room
were: 4.47 m (14.66 ft) deep, 3.45 m (1 1.33 ft) wide and 2.39 m (7.83 ft) high. The doorway to
the corridor was 0.73 m (2.40 ft) wide by 2.03 m (6.65 ft) high.
The dorm room doors were solid core, wood doors, 35.00 mm (1.375 in) thick. Gaps between
the steel door frame and the door were 5 mm ± 2 mm, due in part to rubber bumpers mounted in
the door frames. There was no gasket of any kind used to seal the gap between the doors and the
door frames. There was a 12 mm (0.5 in) gap between the bottom of the door and the corridor
floor.
The single pane windows on the exterior wall of the dorm room were composed of three sections
of glass 0.84 m (2.77 ft) wide and 1.49 m (4.88 ft) high with a window sill height of
0.83 m (2.71 ft). The glass was mounted in an aluminum fi-ame. The floor plan of a dorm room
is given in Figure 2.2-4.

(U
-a
Q.
ou
Cil
OouooQ.
E
yt5
Boo (N
D
ooPi \
/
Q.
Ou.
oo
o ^o Q.
+^
ce
Ou
Xoo
o
ou4-»10
oc
oc
Q.
OO
U
O
rg
01
3CUD

t.N Window Sills - 0.83 m Above floor
Window Openings - 1 .49 m High
0.84 m^^— 0.84 m^-— 0.84 m
4.47 m
0.63 m—
Ceiling
2.39 mH
0.73 m—^0.73 m- 2.01 m2.03 m H
3.45 mFigure 2.2-4. Floor plan of a typical dorm room used in the experiments
6

2.3 Room Contents
Each room was furnished in a similar manner. The furnishings were typical of items found in
college dormitory sleeping rooms: twin beds, desks, computers, books, clothing, towels, posters,
carpeting, a television, and a radio. A complete list of the items in the rooms and a brief
description and the mass of each item is given in Table 2.3-1 through Table 2.3-5. The tables are
categorized by the type or area of fuel load and include the fixed furnishings and interior finish
(Table 2.3-1), the bed fuel package (Table 2.3-2), the desk fuel package (Table 2.3-3), clothing
and closet contents (Table 2.3-4), and the ignifion fuel package (Table 2.3-5).
N
Plastic
Storage Crates
Figure 2.3-1. Furnishing arrangement of a typical dorm room used in the experiments
7

Table 2.3-1 contains the portion of the fuel load that was composed of interior finish materials,
wall hangings and the wooden fixed furniture which lined one side of each of the dorm rooms.
A photograph of the wooden chest of drawers, closet and shelves is provided in Figure 2.3-5.
Table 2.3-1. Fixed furnishings and interior finish
Item # MaterialsDimensions (m) Individual
Mass (kg)
Total
Mass (kg)W(m) L(m) H(m)Padding 1 Urethane foam 12.55 (area m==) 0.012 7.1 7.1
Carpeting 188% olefin, 12% nylon, "26
oz", 14 tuft, 5200 density12.55 (area m^) 0.008 25.0 25.0
Bulletin board 1
Cork Board w/ AluminumFrame
0.610 0.914 0.013 1.75 3.5
Posters 42 - poster board
2 - poster paper0.3
Chests 2 Pine 0.514 0.775 0.464 26.5 53.0
Closet doors 4 Peg board (hard board) 0.927 0.006 1.962 6.4 25.6
Center shelving 1 Pine 0.305 4.775 0.025 12.4 12.4
Upper shelf 2 Pine 0.292 1.753 0.018 6.0 12.0
Lower shelf 2 Pine 0.387 1.753 0.018 4.5 9.0
Upper slider 4 Peg board (hard board) 0.318 1.219 0.006 2.6 10.4
Roll-up blind 1 Vinyl 9.5 mm slat 2.667 1.829 4.4 4.4
Total 162.7
Figure 2.3-2. Photograph of fixed furnishings composed of wood chest of drawers, wood
shelves and peg board cabinet closet doors
8

Table 2.3-2 lists all of the materials that made up the fuel load of the bed and items that were
placed on the bed. A photograph of the bed fuel load is provided in Figure 2.3-3.
Table 2.3-2. Bed fuel package
Item # MaterialsDimensions Individual
Mass (kg)
Total
Mass (kg)W(m) L(m) H(m)
Mattress 2Resin Treated Textile clippings
- 58% Urethane foam - 42% 0.97 1.9 0.63 16.2 32.4
Bed Pad 2 100% polyurethane foam 0.86 1.83 0.03 0.7 1.4
Bedding, Flat
Sheet, Fitted
Sheet, Pillow
Case
2 100% Cotton Twin bed size 1.2 2.4
Pillows 4
Cover - 50% Cotton, 50%polyurethane Stuffed with 100%polyester fiber
0.5 0.71 0.75 3.0
Stuffed animals 5 Polyester filled 2.6
Backpacks 2 Nylon 0.4 0.8
Bed Cover 2 100% Polyester 1.3 2.6
Total 45.2
Figure 2.3-3. Photograph of the bed fuel package

Table 2.3-3 lists the materials that made up the desk fuel package, which included the desk chair,
computer equipment, plastic crate shelving with notebooks and paper products. Figure 2.3-4
shows the desk fuel package.
Table 2.3-3. Desk fuel package
Item # Description / MaterialsDimensions Individual
Mass (kg)
Total
Mass (kg)W(m) L(m) H(m)
Desk Chair
Back cushion
Seat cushion
2
Plastic Shell - PP Seat Cover -
Olefin 40%, Acrylic 40%, Nylon
20% Pad - Polyurethane Foam100%
0.53
0.46
0.53
0.58
0.41
0.46
0.91
0.08
0.09
10.7 21.4
Desk 2 Laminated particle board 1.21 0.62 0.72 39.0 78.0
Desk lamp 2 Polystyrene 0.58 0.23 0.25 0.7 1.4
Monitor 215 in. monitor / FR ABS Plastic
Monitor Case0.36 0.39 0.3 12.9 25.8
Keyboard 2 Plastic 0.45 0.2 0.04 1.5 3.0
Computer 2 Plastic front, steel shell 0.4 0.38 0.1 7.8 15.6
Printer 1 Plastic case 0.48 0.46 0.22 20.2 20.2
File crates 8 Self stacking /HOPE 0.44 0.36 0.29 1.0 8.0
Stationary Notebooks, paper etc 107.2 107.2
Telephones 2 Plastic Shell, Metal Base 0.6 1.2
Total 281.8
Figure 2.3-4. Photograph of the desk fuel package
10
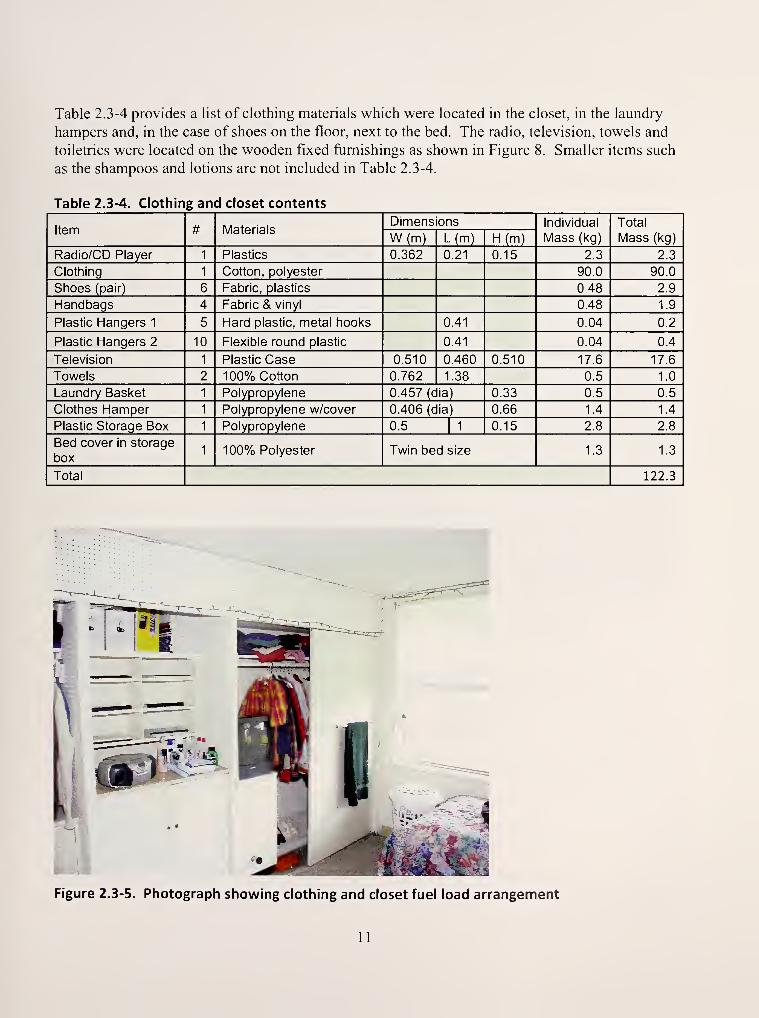
Table 2.3-4 provides a list of clothing materials which were located in the closet, in the laundry
hampers and, in the case of shoes on the floor, next to the bed. The radio, television, towels and
toiletries were located on the wooden fixed furnishings as shown in Figure 8. Smaller items such
as the shampoos and lotions are not included in Table 2.3-4.
Table 2.3-4. Clothing and closet contents
Item # MaterialsDimensions Individual
Mass (kg)
Total
Mass (kg)W(m) L(m) H(m)Radio/CD Player 1 Plastics 0.362 0.21 0.15 2.3 2.3
Clothing 1 Cotton, polyester 90.0 90.0
Shoes (pair) 6 Fabric, plastics 0.48 2.9
Handbags 4 Fabric & vinyl 0.48 1.9
Plastic Hangers 1 5 Hard plastic, metal hooks 0.41 0.04 0.2
Plastic Hangers 2 10 Flexible round plastic 0.41 0.04 0.4
Television 1 Plastic Case 0.510 0.460 0.510 17.6 17.6
Towels 2 100% Cotton 0.762 1.38 0.5 1.0
Laundry Basket 1 Polypropylene 0.457 (dia) 0.33 0.5 0.5
Clothes Hamper 1 Polypropylene w/cover 0.406 (dia) 0.66 1.4 1.4
Plastic Storage Box 1 Polypropylene 0.5 1 0.15 2.8 2.8
Bed cover in storage
box1 1 00% Polyester Twin bed size 1.3 1.3
Total 122.3
Figure 2.3-5. Photograph showing clothing and closet fuel load arrangement
11

The final fuel package, Table 2.3-5, was the waste basket and contents where ignition took place.
The ignition fuel package was intended to represent a small trash container and its contents. Theignition fiiel package was located between the desk and the bed on the window side of the room.
A small flaming source was used to ignite the ftiel package. Figure 2.3-6 shows the ignition fuel
package. An electric match, as described in Table 2.3-5, was used to ignite the fuel package.
Figure 2.3-6. Photograph of ignition fuel package positioned between the desk and the bed
closest to the window
Table 2.3-5. Ignition fuel package
Item MaterialsDimensions Mass
(kg)W(m) L(m) H(m)Waste Basket Wicker 0.25-0.20 (dia) 0.2 0.2
Newspaper Newsprint 0.3 0.4 1.0
Notebook paper Paper sheets, crumpled & straight 0.22 0.28 0.2
2- Plastic "sports" drink bottles,
no lids .592 L (20 oz) sizePETE 0.08 (dia) 0.2 0.1
Electric MatchPaper matchbook with 20 matches,
with ni-chrome wire coil0.04 0.05 0.01
Total 1.5
The total mass of fuel in each dorm room was approximately 614 kg (1350 lbs). Dividing the
mass by the area of the room, 15.4 m^ (166 ft^), yields an averaged fuel load of nearly
40kgW(8.1 lbs/ft^).
12

2.4 Instrumentation
Five main instrument positions were used for each experiment. Two positions (1 and 2) were
located in the room of fire origin as shown in Figure 2.4-1. The other three positions (3 through
5) were located in the corridor and remained the same for all five of the experiments, see Figure
2.4-2. Each position had a vertical array of 0.5 1 mm (0.02 in) nominal diameter bare bead, Type
K thermocouples. In each array a thermocouple was located 25 mm, 0.305 m, 0.610 m, 0.910 m,
1.22 m, 1.52 m, 1.83 m, and 2.13m (1 in, 1 ft, 2 ft, 3ft, 4 ft, 5 ft, 6 ft, and 7 ft) below the ceiling.
Thermocouple arrays in the corridor were along the centerline of corridor. Thermocouples were
also installed adjacent to the sprinkler and smoke alarm located in the dorm rooms.
Gas concentrations were sampled at two different positions. In each experiment, the sampling
line inlets were located adjacent to TC Array 1 and TC Array 4 at 1.52 m (5.0 ft) above the floor.
The sampling lines were connected to calibrated vacuum pumps which moved the gas samples
through a conditioning system, which removed particulate and moisture from the gas sample.
The conditioning system consisted of two filtered cold traps inline to remove soot particles and
moisture from the gas sample. The sampling line had a nominal internal diameter of 9.5 mm.The cold traps were approximately 190 mm long with an internal diameter of 60 mm for an
approximate volume of 500 cm for each trap. The sampling system volume was minimized to
avoid damping out important peak values in the gas concentration measurements. The volume of
each cold trap was reduced by approximately 70 % with the addition of glass wool and glass
beads [3].
The dry gas samples were then drawn through a series of gas analyzers, which were installed in
the room next to "Dorm Room 2". This room was sealed and protected from thermal and fire
gas infiltration. In all of the experiments, oxygen was measured using paramagnetic analyzers
and carbon monoxide and carbon dioxide were measured using non-dispersive infrared (NDIR)
analyzers. The exhaust line from the analyzers discharged outside of the building.
The length of the sample lines and the conditioning system resulted in some delay in the
measurements. The delay times were determined by discharging carbon dioxide near the entry to
the sample line and measuring the time from discharge until the response from the oxygen and
carbon dioxide instruments were observed. These delay times are accounted for in the data
presented in this report.
13

N
4.47 m
TC Array 1 ®
Ceiling
2.39 mH
Ignition
-
(^^ 1.43 m-
Gas Sample
1.52 m above floor
h 1.52 m-
2.13 m
TC Array 2
t 1.43 m-
1.07 m
""^^Hi^i
[SA
^s) Automatic Sprinkler
C!3 Camera
fl Gas Sampling Port
(s^ Smoke Alarm
^ Thermocouple Array
3.45 m
Figure 2.4-1. Floor plan of dorm room with instrumentation locations
14

i-) C3u
t"U
i o 3X)
ex 00 3
o00
FSA >'
<« rr\ E 3"rvi
a r/1ti-
of= Cfl es o
(1)
3 ftl nj (L> t-i ^< U o K 00 h-
— >— o
©OG>©i®
Eil>
. .'
<\Jr)
_-or-^
"in^^3o E
o Os_
OO E
D. / ^_
n 0^E
ri
i
•pi
Eoil
'C o
ao>/^
c
"oj
U '^
s t8- <U1—
0® ~n ^D
E E
'^ '/-I E6 -*' r-j
8- a'
^ \ ^
©®a©n\
/ >en
B E
§ ^ E c
rn~i
np-D0®
6r^
o „ so <csJ
/S
E1
\
8- -fjJ
p!i '
u
oSon
(/)
co(0u
co
n>
C01
E3L.4^I/)
c
oaou*^Oc
Q.k.
OO
O)
3
15

Three pairs of Schmidt Boelter total heat flux gauges were installed near the TC arrays
positioned in the corridor. The heat flux gauges that were located next to TC Array 4, the center
position of the corridor, had a design heat flux range up to 227 kW/m^ (20 Btu/ft^-s). The pair of
heat flux gauges located next to TC Array 3, the west side of the corridor, had a design heat flux7 7
range up to 1 14 kW/m (10 Btu/ft -s). The pair of heat flux gauges, installed next to TC array 5,
the east side of the corridor, had a design heat flux range up to 57 kW/m^ (5 Btu/ft^-s).
Each pair of gauges consisted of one gauge facing the ceiling with another gauge facing the roomof fire origin. The height of the gauges facing the ceiling was approximately 0.91 m (3 ft) above
the corridor floor or 1.48 m (4.85 ft) below the ceiling. The height of the gauges positioned
horizontally toward the fire were approximately 0.86 m (2.83 ft) above the corridor floor or
1.53 m (5 ft) below the ceiling.
Commercially available, battery powered, single station, ionization smoke alarms were used. Asmoke alarm was mounted on the wall of each dorm room, as shown in Figure 2.4-1. The center
of the alarm case was located 150 mm (6 in) below the ceiling. The alarms in the corridor were
mounted under the ceiling at the locations shown in Figure 2.4-2. Each alarm was separately
connected to the data acquisition system. The voltage change, as measured across the battery
terminals at its alarm point, served as the data marker for the alarm time. New smoke alarms
were used for each experiment.
Commercially available quick response sprinklers with a listed activation temperature of
74 °C (165 °F) were installed in each of the dorm rooms and in the center of the corridor adjacent
to TC array 4. In the non-sprinklered experiments, (Experiments 1, 4, and 5), sprinklers were
installed only as a means of obtaining an activation time. In these experiments, the nominal
12.7 mm (1/2 in) diameter, 152 mm (6 in) long drop nipple was filled with water and then the
pipe was capped with an air pressure fitting. A 6 mm (0.25 in) outer diameter copper tube
connected the sprinkler pipe to an air pressure sensor, which was connected to the data
acquisition system. A valved tee fitting in the air line allowed the line to be pressurized to
approximately 20 psi. When the line was pressurized, the valve to the high pressure source was
closed. In this system, once the thermal element fused, the air pressure would drop and the
voltage signal fi"om the pressure sensor would also decrease. The time of this decrease was
recorded as the sprinkler activation time.
In the sprinklered experiments, (Experiments 2 and 3), the sprinklers were connected to a water
supply and allowed to operate normally. In the sprinklered experiments, the nominal 12.7 mm(Yi in) pipe drops were connected via a nominal 1 inch pipe to a nominal 1 Vi single jacket hose
line supplied by a fire engine. An in-line flow meter was located in the hose line. This flow
meter was read manually during the experiments and the flow rates noted. Prior to installation in
the building, the "sprinkler system" was calibrated for flow with an open sprinkler. This allowed
the pump operator to pre-set the pump control to provide the desired flow rate, which was
approximately 1.3 L/s (20 gpm).
16

2.5 Uncertainty Analysis
There are different components of uncertainty in the length, temperature, heat flux, gas
concentrations, mass and flow rate provided in this report. Uncertainties are grouped into two
categories according to the method used to estimate them. Type A uncertainties are those which
are evaluated by statistical methods, and Type B are those which are evaluated by other means
[4]. Type B analysis of systematic uncertainties involves estimating the upper (+ a) and lower
(- a) limits for the quantity in question such that the probability that the value would be in the
interval (± a) is very close to 100 %. For some of these components, such as the zero and
calibration elements, uncertainties are derived from instrument specifications. Here uncertainty
is reported as the expanded relative uncertainty with an expansion factor of 2 (i.e. 2a).
Each length measurement was taken carefully. Length measurements such as the room
dimensions, instrumentation array locations and furniture placement were made with steel tape
measures with a resolution of ± 0.5 mm (0.02 in). However, conditions affecting the
measurement, such as levelness or tautness of the device, yield an estimated uncertainty of
± 0.5 % for measurements in the 0.0 m (0 ft) to 3.0 m (9.8 ft) range. Some issues, such as "soft"
edges on the upholstered furniture, or longer distances in excess of 3.0 m (9.8 ft) result in an
estimated total expanded uncertainty of± 1.0 %.
The standard uncertainty in temperature of the thermocouple wire itself is ± 2.2 °C at 277 °C
and increases to ± 9.5 °C at 871 °C as determined by the wire manufacturer [5]. The variation of
the temperature in the environment surrounding the thermocouple is known to be much greater
than that of the wire uncertainty [6, 7]. Small diameter thermocouples were used to limit the
impact of radiative heating and cooling. The estimated total expanded uncertainty for
temperature in these experiments is ± 15 %.
In this study, total heat flux measurements were made with water-cooled Schimidt-Bolter
gauges. The manufacturer reports a ± 3 % calibration expanded uncertainty for these devices
[8]. Results from an international study on total heat flux gauge calibration and response
demonstrated that the expanded uncertainty of a Schmidt-Boelter gauge is typically ± 8 % [9].
The gas measurement instruments and sampling system used in this series of experiments have
demonstrated an expanded relative uncertainty of± 1 % when compared with calibration span
gas volume fractions [3, 10]. Given the limited set of sampling points in these experiments, an
estimated uncertainty of ± 10 % is applied to the results.
Water flow rate was measured with a spring and piston type inline flow meter with a range from
L/s to 6.3 L/s (0 gpm to 100 gpm) The measuring accuracy per the manufacturer is 2.5 % full
scale at mid range and 4.0 % of full scale over the entire scale range and repeatability of 1 % of
frill scale [11].
The load cell used to weigh the fiiels prior to the experiments had a range of kg (0 lbs) to
200 kg (440 lbs) with a resolution of a 0.05 kg (0.1 1 lb) and a calibration uncertainty within 1 %[12]. The expanded uncertainty is estimated to be ± 5 %.
17

In the following sections, the measurements are presented in graphic and tabular form. In the
graphs, an error bar represents the estimated expanded uncertainty of the measurement.
2.6 Experimental Procedure
Prior to ignition in each experiment, a computerized data acquisition system was started to
collect the temperature, gas concentration, heat flux and smoke alarm data. Data were collected
from each instrument every 2 s. Video cameras recording the experiment were also started at
this time.
After at least 60 s ofbackground data were collected, a resistance heated book of matches was
used to ignite the materials in the waste basket between the bed closest to the window and the
adjacent desk. The fire growth was observed via monitors connected to the video cameras.
After the experimental objectives were met, fire fighters entered the corridor from the door on
the east end and suppressed the fire as needed.
Four different experimental conditions were used as shown in the table below. Three
experiments did not have active sprinklers installed. Experiment 1 had the door between the
dorm room and the corridor closed, while Experiment 4 and Experiment 5 had the door fully
open. Experiment 2 and Experiment 3 used sprinklers with a water supply. Experiment 2 had
the door between the dorm room and the corridor closed, while Experiment 3 had the door ftiUy
opened.
Table 2.6-1. Setup for the 5 experiments
Experiment Door Position Sprinkler Status
1 Closed Non-Sprinklered
2 Closed Sprinklered
3 Open Sprinklered
4 Open Non-Sprinklered
5 Open Non-Sprinklered
18

3 Results
The results of the experiments include experiment timelines based on observations, smoke alarm
and sprinkler activation times, temperature measurements, gas concentrations, heat flux
measurements, photographs and videos.
3.1 Experiment 1: Closed Door, Non-Sprinklered
The objective of this experiment was to evaluate the impact that a closed door would have on the
fire and the level of hazard developed in the room of origin and in the adjoining corridor.
3.1.1 Experiment Timeline
The timeline was developed from observations made during the experiment, review of the video
of the experiment, and review of the data. Table 3.1-1 describes the level of fire development in
the room. This can be compared with other measurements presented in following sections, such
as changes in temperature, gas concentration or fire protection system response.
Table 3.1-1. Timeline for Experiment Number 1
Time (s) Observations
Ignition
24 Smoke Alarm in fire room activated
35 Flames attached to bedding
40 Flames extended to pillow
45 Flames extended to desk chair
90 Smoke layer started to form
120 Tell-tale sprinkler activated
130 Blinds began to melt
150 Smoke layer approx. 1m below ceiling
160 Flames attached to desk
165 Plastic bookshelf melted and fell
205 Blinds fell
210 Flame size decreased
270 Smoke layer descended to floor
275 Flames no longer visible
345 Thermal plume no longer visible on IR Camera
555 Power off in room
610 Door open, Firefighters in
640 Fan in room ON
19

3.1.2 Smoke Alarm and Sprinkler Activation Times
The smoke alarm activation and sprinkler activation times are given in Table 3.1-2 and Table
3.1-3, respectively. The smoke alarm located in the dorm room activated at 24 s, while the fire
was limited to the materials in the waste basket. The temperature at the thermocouple located
near the smoke alarm indicated 52 °C (126 °F) at the time of activation. Even with the door
between the dorm room and the corridor closed, enough smoke leaked into the corridor to
activate all three of the smoke alarms over the course of 5 minutes following the activation of the
alarm in the dorm room.
The fire generated enough heat to activate the sprinkler in the dorm room prior to the first smoke
alarm in the corridor activating. The temperature measured adjacent to the sprinkler at the time
of thermal activation was approximately 1 18 °C (244 °F). The sprinkler in this experiment did
not have a water supply; it was pressurized with air. This time was documented to demonstrate
when the sprinkler would have begun to have impact; however, this was a non-sprinklered
experiment. The sprinkler installed in the center of the corridor, adjacent to TC array 4 did not
activate.
Table 3.1-2. Dorm Room Experiment 1 , Smoke Alarm Ac
Smoke Alarm Location Time (s) Temperature (°C)
1 Dorm Room 24 52
2 West Corridor 160 27
3 Center Corridor 216 27
4 East Corridor 316 27
Table 3.1-3. Dorm Room Experiment 1, Sprinkler Activation Times
Sprinkler Activation Location Time (s) Temperature (°C)
1 Dorm Room 120 118
2 Corridor Did not activate
3.1.3 Temperature Data
Temperatures from the 5 thermocouple arrays located in the dorm room (TC arrays 1 and 2) and
in the corridor (TC arrays 3 through 5) are presented in Table 3.1-1 through Figure 3.1-5. Refer
to Figure 2.4-1 for locations of the TC arrays.
Figure 3.1-1 shows the temperature data from the thermocouple array, in location 1, which was
adjacent to the bed and closest to the source of ignition. The temperature 0.03 m (1 in) below the
ceiling peaked at approximately 250 °C (480 °F), approximately 220 s after ignition. At this
point in time, the flames had begun to decrease in size. After this point, all of the temperatures
recorded at location 1 began to decrease. During this same period, the smoke layer extended to
floor level and the flames were no longer visible in the room. At approximately 280 s after
ignition, the temperatures at location 1 leveled off and remained constant for approximately 60 s.
At 345 s, the thermal plume was no longer visible in the IR camera. After this point the
temperatures continued to decrease. The small and abrupt temperature increase of the lower
20

three thermocouples in the array at approximately 165 s after ignition was caused by the flames
extending to the plastic crate book shelf on the desk, followed by the collapse of the book shelf
and materials to the floor in the vicinity of the TC array 1
.
Room smoke alarm activated
Thermocouple Array Location 1
n 0.03m BC X 1.22m BCO 0.30m BC O 1.52m BC
Oo
V3ns
oa.
Eo
662
572
482
392
302
212
122
re
Q.
Eo
32
100 400 500200 300
Time (s)
Figure 3.1-1. Temperature versus time data from thermocouple array 1 in Experiment 1,
listed by distance below ceiling (BC)
As shown in Figure 3.1-2, the temperatures recorded at thermocouple array 2 had a very similar
trend as those from thermocouple array 1 . The temperature measurement at array 2 was
approximately 50 °C (122 °F) less that the corresponding thermocouple in array 1, except for the
thermocouple closest to the ceiling, which was somewhat lower in temperature.
21

Room smoke alarm activated
300
250
oo
2000)^3*••
re 150^oa.
E 1000)
I-
50
Thermocouple Array Location 2
n 0.03m BC X 1.22m BCO 0.30m BC O 1.52m BCA 0.61m BC V 1.83m BC+ 0.91m BC S 2.13m BC
572
482
u.
39?0)I.
330?
*•>
reI-
(UQ.
212 Eo1-
122
32
100 200 300
Time (s)
400 500
Figure 3.1-2. Temperature versus time data from thermocouple array 2 in Experiment 1,
listed by distance below ceiling (BC)
The temperature time histories from the three vertical thermocouple arrays located along the
center line of the corridor are given in Figure 3.1-3 through Figure 3.1-5. The closed door to the
dorm room limited the flow of hot gases into the corridor. As a result, the temperatures in the
corridor did not change significantly during the course of the experiment.
22

Room smoke alarm activated
oo
5oaEoI-
35
30
25
20
15
10
5
v
Thermocouple Array Location 3
O 0.03m BC X 1.22m BCO 0.30m BC O 1.52m BCA 0.61m BC V 1.83m BC-\- 0.91m BC El 2.13m BC
95
86
% 77
68
59
50
41
32
100 200 300
Time (s)
400 500
Figure 3.1-3. Temperature versus time data from thermocouple array 3 in Experiment 1,
listed by distance below ceiling (BC)
Room smoke alarm activated
35
oo
O3̂̂<Qi_0)Q.
Eo
20
15
10
5
2_
Thermocouple Array Location 4
D 0.03m BC X 1.22m BCO 0.30m BC O 1.52m BCA 0.61m BC V 1.83m BC+ 0.91m BC S 2.13m BC
95
86
77
68
59
50
41
32
100 200 300
Time (s)
400 500
Figure 3.1-4. Temperature versus time data from thermocouple array 4 in Experiment 1,
listed by distance below ceiling (BC)
3+-•
QiQ.
E0)
3*.»
Q.
EoH
23

Room smoke alarm activated
oo
<D
(0
OQ.
EoI-
35
30
25
20
15
10 •
5
T
Thermocouple Array Location 5
D 0.03m BC X 1.22m BCO 0.30m BC O 1.52m BCA 0,61m BC V 1.83m BC+ 0.91m BC El 2.13m BC
95
86
77
68
59
H 50
41
o3(0
Q.
E0)
32
100 200 300
Time (s)
400 500
Figure 3.1-5. Temperature versus time data from thermocouple array 5 in Experiment 1,
listed by distance below ceiling (BC)
3.1.4 Gas Concentrations
The gas concentrations were sampled in two locations, one in the dorm room adjacent to TCarray 1 and one centered in the corridor adjacent to TC array 4. Both of the sample locations
were positioned 1.52 m (5.0 ft) above the floor. Figure 3.1-6 shows the oxygen and carbon
dioxide levels on the upper graph with a range of % to 25 % by volume and the carbon
monoxide is shown on the lower graph which has a range of % to 1 % by volume. At
approximately 350 s, the oxygen concentration dropped below 15 %. It was around this same
time that the thermal plume was no longer visible in IR camera view. Based on the temperature
data presented above and the information from the IR camera, it is estimated that the flaming fire
self-extinguished at approximately 350 s. The level of carbon monoxide continued to increase
after the flaming combustion appeared to cease.
Figure 3.1-7 shows the gas concentration data from the corridor sampling location. Again, due
to the closed door between the room of fire origin and the corridor, no significant changes in the
oxygen, carbon dioxide, or carbon monoxide levels were measured.
24

Room smoke alarm activated
0)
E3O>
c_o'<?
(0
*••
c0)ucooV)(Q
o
25
20
15 t
10
5
1.0
0.8
0.6
0.4
0.2
0.0
O 02% RoomA C02% Room
n C0% Room
100 400 500200 300
Time (s)
Figure 3.1-6. Relative gas concentrations versus time for the gas sampling point at 1.52 mabove the floor at location 1 in Experiment 1
25
fl)
E3O>
co
0)Ucoo(0m
25
20
15
10
1.0
0.8
0.6
0.4
0.2
0.0
Room smoke alarm activated
1r_L
O 02% Corridor
A C02% Corridor
<7 . " -
P C0% Corridor
sz^^ .B.
100 400 500200 300
Time (s)
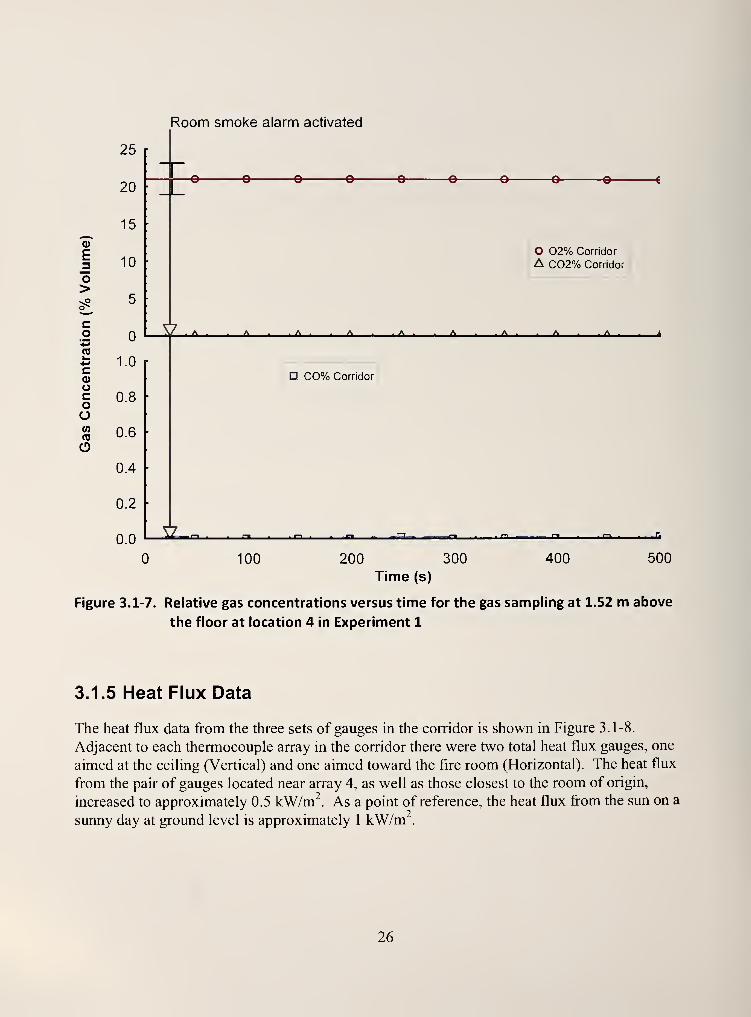
Figure 3.1-7. Relative gas concentrations versus time for the gas sampling at 1.52 m above
the floor at location 4 in Experiment 1
3.1.5 Heat Flux Data
The heat flux data from the three sets of gauges in the corridor is shown in Figure 3.1-8.
Adjacent to each thermocouple array in the corridor there were two total heat flux gauges, one
aimed at the ceiling (Vertical) and one aimed toward the fire room (Horizontal). The heat flux
from the pair of gauges located near array 4, as well as those closest to the room of origin,
increased to approximately 0.5 kW/m^. As a point of reference, the heat flux from the sun on a
sunny day at ground level is approximately 1 kW/m .
26

0.7
0.6
E
1
0.5
0.4
3U. 0.3*•>
noX 0.2
0.1
0.0
Room smoke alarm activated
n Loc. 3 vert.
O Loc. 3 horz
A Loc. 4 vert.
-f- Loc. 4 horz
X Loc. 5 vert.
C> Loc. 5 horz
ssa«fe1^^aAM^^M^ia/^r^^y^l^x^r^mJf^^^^^'^,
100 400 500200 300
Time (s)
Figure 3.1-8. Heat flux versus time data for the heat flux gauges at locations 3, 4, and 5 in the
orientations up (vert) and sideways (horz)
3.2 Experiment 2: Closed Door, Sprinklered
The objective of this experiment was to examine the impact of an automatic sprinkler on a fire in
a dorm room with a closed door. This experiment enables direct comparison between the results
from Experiment 1 and Experiment 2.
3.2.1 Experiment Timeline
The timeline was developed from observations made during the experiment, review of the video
of the experiment, and review of the data. Table 3.2-1 provides a reference to the level of fire
development in the room. This can be compared with other measurements presented in
following sections, such as changes in temperature, gas concentration or fire protection system
response.
27

Table 3.2-1. Timeline for Experiment Number 2
Time (s) Observations
Ignition
12 Smoke Alarm in fire room activated
16 Flames attached to bedding
31 Flames extended to pillow
60 Smoke layer began to form
90 Flames extended to desk
105 Sprinkler activated
125 Flames extinguished
3.2.2 Smoke Alarm and Sprinkler Activation Times
The smoke alarm activation and sprinkler activation times are given in Table 3.2-2 and Table
3.2-3, respectively. The smoke alarm located in the dorm room activated at 12 s, while the fire
was limited to the materials in the waste basket. The temperature at the thermocouple located
near the smoke alarm indicated 32 "C (90 T) at the time of activation. Due to the door being
closed in this test and the rapid reduction of the fire hazard by the sprinkler, not enough smoke
leaked into the corridor to activate the three remaining smoke alarms.
The fire generated enough heat to activate the sprinkler in the dorm room at 105 s after ignition.
At this point the temperature adjacent to the sprinkler was approximately 1 19 °C (246 °F). hi
this experiment, the sprinkler did have a water supply and was flowing water at approximately
1.3 L/s (20 gpm). Within 30 s after activation of the sprinkler, the fire was almost completely
extinguished as indicated by the video and temperature records.
The sprinkler located in the corridor was not exposed to enough thermal energy to activate. This
was due to the door between the dorm room and the corridor being closed, just as in Experiment
1.
Table 3.2-2. Dorm Room Experiment 2, Smoke Alarm Activation Times
Smoke Alarm Location Time (s) Temperature (°C)
1 Dorm Room 12 32
2 West Corridor Did not activate
3 Center Corridor Did not activate
4 East Corridor Did not activate
Table 3.2-3. Dorm Room Experiment 2, Sprinkler Activation Times
Sprinkler Activation Location Time (s) Temperature (°C)
1 Dorm Room 105 119
2 Corridor Did not activate
28

3.2.3 Temperature Data
Temperatures from the 5 thermocouple arrays located in the dorm room (TC arrays 1 and 2) and
in the corridor (TC arrays 3 through 5) are presented in Figure 3.2-1 through Figure 3.2-5.
Figure 3.2-1 shows the temperature data from the thermocouple array in location 1, which was
adjacent to the bed and closest to the source of ignition. The temperature 0.03 m (1 in) below the
ceiling peaked at approximately 175 °C (347 °F), approximately 108 s after ignition. At this
point in time, the sprinkler in the dorm room had activated and water began to suppress the fire.
After this point, all of the temperatures recorded at location 1 rapidly decreased over a span of
about 20 s. During this same period, the thermal plume diminished until it was no longer visible
with the IR camera. Within 60 s of sprinkler activation, the temperatures throughout the dorm
room equalized at approximately 30 °C (86 °F).
Figure 3.2-2 shows the temperature data for the thermocouple array in location 2, which was
adjacent to the other bed and closest to the corridor door. This TC array was also in the fire
room, thus the trends were consistent with that ofTC array 1, excluding the maximumtemperature. At approximately 108 s after ignition, the maximum temperature at thermocouple
array 2 was 118 °C (244 °F).
The temperature time histories from the three vertical thermocouple arrays located along the
center line of the corridor are given in Figure 3.2-3 through Figure 3.2-5. The closed door to the
dorm room limited the flow of hot gases into the corridor. As a result, the temperatures in the
corridor do not change significantly during the course of the experiment.
29

Room snioke alarm ^^'^^}^,.m\er activated
210
180
uD 150
23 12001
oQ.
E0)
90
60
30
30
Thermocouple Array Location 1
0.03m BC X 1.22m BCO 0.30m BC O 1.52m BCA 0.61m BC V 1.83m BC+ 0.91m BC B 2.13m BC
1 410
356
302
248
194
140
86
32
60 90 120 150
Time (s)
180 210 240 270
Figure 3.2-1. Temperature versus time data from thermocouple array 1 in Experiment 2,
listed by distance below ceiling (BC)
o3*-•
(0
aEvI-
Room snioke alarm acfr'ated^^.^^,^^ 3,^^,3,30
140
120
100
3 80csUrn
0)
Q.
E0)
60
40
20
284
248
212
176
140
0)
3<->
104E
30 60 90 180 210 240 270120 150
Time (s)
Figure 3.2-2. Temperature versus time data from thermocouple array 2 in Experiment 2,
listed by distance below ceiling (BC)
30

0)
3CO
oa.
E0)
Room sn^oke alarm act>vated^^.^^^^^
^^,,3ted
15
10
5
y^
Thermocouple Array Location
D 0.03m BC X 1.22m BCO 0.30m BC O 1.52m BCA 0.61m BC V 1.83m BC+ 0.91m BC B 2.13m BC,.
30 60 90 180 210 240
95
86
77
68
59
50
41
32
270120 150
Time (s)
Figure 3.2-3. Temperature versus time data from thermocouple array 3 in Experiment 2,
listed by distance below ceiling (BC)
(U
oaE0)
Oo
0)
3aoaE0)
ROC. smoke alarm ^-^^^^,,,Mer activated
35^
15 [
10
5 [
i_
Thermocouple Array Location 4
D 0.03m BC X 1.22m BCO 0.30m BC O 1.52im BCA 0.61m BC V 1.83m BC-I- 0.91m BC Bl 2.13m BC
30 60 90 120 150
Time (s)
180 210
95
86
77 o
0)
68 3+jroL.
59 0)
F50 (0
1-
41
32
240 270
Figure 3.2-4. Temperature versus time data from thermocouple array 4 in Experiment 2,
listed by distance below ceiling (BC)
31

o3*••
(0
oQ.
E0)
poom smoke alarm acUv^^^^^^^.p^^Wer activated
Thermocouple Array Location 5
P 0.03m BCO 0.30m BCA 0.61m BC+ 0.91m BC
X 1.22m BCO 1.52m BCV 1.83m BC
2.13m BC
30 60 90 180 210 240
95
86
77
68
59
50
41
32
270120 150
Time (s)
Figure 3.2-5. Temperature versus time data from thermocouple array 5 in Experiment 2,
listed by distance below ceiling (BC)
(D
3+j(0k_
0>
a.
Ea>
3.2.4 Gas Concentrations
The gas concentrations were sampled in two locations, one in the dorm room adjacent to
thermocouple array 1 and one centered in the corridor adjacent to thermocouple array 4. Both of
the sample locations were positioned 1.52 m (5.0 ft) above the floor. Figure 3.2-6 shows the
oxygen and carbon dioxide levels on the upper graph with a range of % to 25 % by volume and
the carbon monoxide is shown on the lower graph which has a range of % to 1 % by volume.
The oxygen concentration in the dorm room remained above 19 % throughout the experiment.
The decrease began at approximately 110 s. This was approximately the same time that the
thermal plume was no longer visible in the IR camera and shortly after the automatic sprinkler in
the dorm room activated. This may be due to the mixing and descent of combustion products
which were above the inlet level of the gas sample line at the time of sprinkler activation. The
carbon dioxide concentration at this location was related inversely with the concentration of
oxygen, increasing from % to just below 2 %. The carbon monoxide concentration remained at
% until approximately 180 s, where it increased to about 0.05 %.
The gas concentrations measured from the center of the corridor were consistent with each other
in that they did not change. There was no significant change in any of the three gas
concentrations because the fire hazard did not impact the conditions in the corridor due to the
door to the dorm room being closed.
32

0)
E3O>
co<0
*-•
coocooV)RS
o
25
20
Room smoKe alarm ^-^^^^^^me. activated
X
15
10O 02% RoomA C02% Room
1.0
0.8 \
0.6
0.4
0.2
0.0
Y ^ • ^^
Ep C0% Room
^y ^
""^ ' '^ «v ^ ,a±
^
30 60 90 120 150 180 210 240 270
Time (s)
Figure 3.2-6. Relative gas concentrations versus time for the gas sampling at 1.52 m above
the floor at location 1 in Experiment 2
33

0)
E
O>
c_o'^(0i_4-1
c0)ucoo<n
O
Room smoKe aia.n.adWated^^
.^^,^^^,,„3ted
25 N20
15
10
5
1.0
0.8
0.6
0.4 ^
0.2
0.0
2-.
i
O 02% Corridor
A C02% Corridor
^v A - - A. -A
D C0% Corridor
^V -^
30 60 90 120 150 180 210 240 270
Time (s)
Figure 3.2-7. Relative gas concentrations versus time for the gas sampling at 1.52 m above
the floor at location 4 in Experiment 2
3.2.5 Heat Flux Data
The heat flux data from the three sets of gauges in the corridor is shown in Figure 3.2-8. Overall,
the heat flux throughout the corridor was similar and did not drift far from 0.0 kW/m .
34

Room smoke alarn.^^'oom sprinWer activated
0.14
0.12
CM
E
g0.10
0.08X->
0.06*-"
0.04
0.02
0.00
a Loc. 3 vert.
Loc. 3 horz.
A Loc. 4 vert.
+ Loc. 4 horz.
X Loc. 5 vert
Loc. 5 horz.
30 60 90 180 210 240 270120 150
Time (s)
Figure 3.2-8. Heat flux versus time data for the heat flux gauges at locations 3, 4, and 5 in the
orientations up (U) and sideways (S) in Experiment 2
3.3 Experiment 3: Open Door, Sprinklered
The objective of this experiment was to examine the impact of the automatic sprinkler alone on a
fire in the dorm room without the benefit of the closed door between the dorm room and the
corridor. The effect of the closed door is examined later in this report by direct comparison
between Experiment 2 and 3.
3.3.1 Experiment Timeline
The timeline was developed from observations made during the experiment, review of the video
of the experiment, and review of the data. Table 3.3-1 describes the level of fire development in
the room. This can be compared with other measurements presented in following sections, such
as changes in temperature, gas concentration or fire protection system response.
35

Table 3.3-1. Timeline for Experiment Number 3
Time (s) Observations
Ignition
22 Smoke alarm in fire room activated
35 Flames attached to bedding
60 Fire extended to desk chair
65 Fire extended to pillow
70 Visible smoke layer started to form
85 Flames extended to desk
112 Sprinkler activation
115 Smoke visible in corridor
120 Fire extinguished
3.3.2 Smoke Alarm and Sprinkler Activation Times
The smoke alarm activation and sprinkler activation times are given in Table 3.3-2 and Table
3.3-3 respectively. The smoke alarm located in the dorm room activated at 22 s, while the fire
was limited to the materials in the waste basket. The temperature at the thermocouple located
near the smoke alarm was 46 °C (1 15 °F) at the time of activation. Due to the open door between
the dorm room and the corridor, within 68 s after ignition, the three smoke alarms installed on
the ceiling of the corridor activated.
The fire generated enough heat to activate the sprinkler in the dorm room at 112 s after ignition.
At this point, the temperature adjacent to the sprinkler was approximately 1 12 °C (233 °F). In
this experiment, the sprinkler had a water supply, flowing at approximately 1.3 L/s (20 gpm).
Within 20 s after the activation of the sprinkler, the fire was almost completely exfinguished.
In this experiment, even with the door open, the sprinkler located in the corridor was not exposed
to enough thermal energy to activate. This was due to the rapid reduction of heat release rate
from the fire and cooling of the combustion products caused by the activation of the single
sprinkler in the dorm room.
Table 3.3-2. Dorm Room Experiment 3, Smoke Alarm Activation Times
Smoke Alarm Location Time (s) Temperature (°C)
1 Dorm Room 22 46
2 West Corridor 68 27
3 Center Corridor 36 28
4 East Corridor 62 29
Table 3.3-3. Dorm Room Experiment 3, S prinkler Activation Times
Sprinkler Activation Location Time (s) Temperature (°C)
1 Dorm Room 112 112
2 Corridor Did not activate
36

3.3.3 Temperature Data
Temperatures from the 5 thermocouple arrays located in the dorm room (TC arrays 1 and 2) and
in the corridor (TC arrays 3 through 5) are presented in Figure 3.3-1 through Figure 3.3-5.
Figure 3.3-1 shows the temperature data from the thermocouple array, in location 1, which was
adjacent to the bed and closest to the source of ignition. The temperature 0.03 m (1 in) below the
ceiling peaked at approximately 170 °C (340 °F), approximately 115 s after ignition, just a few
seconds after the sprinkler activated. Within 20 s of sprinkler activation, the temperatures
measured at TC array 1 had all equalized to approximately 30 °C (86 °F).
Figure 3.3-2 shows the temperature data for the thermocouple array in location 2, which was
adjacent to the other bed and closest to the corridor door. Again, the trends from TC array 2
were consistent with that ofTC array 1, with the exception of the temperature measured 0.03 mbelow the ceiling. At approximately 115 s after ignition, the maximum temperature 0.03 mbelow the ceiling at TC array 2 was just over 100 °C (212 °F), about 70 °C (160 °F) less that the
same position in TC array 1 at this time. This was the only time and location that the
temperatures between TC array 1 and 2 were significantly different. This difference was most
likely due to the close proximity of TC array 1 to the thermal plume impingement area on the
ceiling.
210
180„^oo 150
p3 120+j(0
90a.
E0) 601-
30
Room smoke alarm ^^j^^^^^^sprinkleractivated
\Thermocouple Array Location 1
P 0.03m BC X 1.22m BCO 0.30m BC O 1.52m BCA 0.61m BC V 1 83m BC+ 0.91m BC El 2.13m BC
V^^*^ *v^*'
410
356
30? o^^Q)
248 3+-•
ro^194 <u
Q.
F140 0)
1-
86
32
50 100 250 300 350150 200
Time (s)
Figure 3.3-1. Temperature versus time data from thermocouple array 1 in Experiment 3,
listed by distance below ceiling (BC)
37

oo
(0
o
Eo
Room
140
120
100
80
60 •
40
20
smoke alarm ^^j^^^^^^^sprinkleractivated
\Thermocouple Array Location 2
0.03m BC X 1 .22m BCO 0.30m BC O 1.52m BCA 0.61m BC V 1.83m BC+ 0.91m BC El 2.13m BC
284
248
212
176
140
32
50 100 250 300 350150 200
Time (s)
Figure 3.3-2. Temperature versus time data from thermocouple array 2 in Experiment 3,
listed by distance below ceiling (BC)
0)
3*-'
(0
(]>aE0)
I-
The temperature time histories from the three vertical thermocouple arrays located along the
center line of the corridor are given in Figure 3.3-3 through Figure 3.3-5. Unlike the previous
two experiments, the open door to the dorm room allowed hot combustion products to flow into
the corridor.
TC array 4 was the closest of the three arrays in the corridor to the open doorway of the burning
room. As a result, the hot gases reached TC array 4 first and provided the highest temperature
increase at that location. The temperature 0.03 m below the ceiling began to increase at 30 s
after ignition as shown in Figure 3.3-4. The peak temperature in the corridor, approximately
70 °C (160 °F), was measured at the same location at about the same time that the sprinkler
activated.
The only significant temperature increases at TC arrays 3 and 5 were limited to less than
20 °C (68 °F) above ambient at positions within 0.30 m (1 ft) of the ceiling. The temperatures
0.61 m (2 ft) below the ceiling or lower for all three of the arrays located in the corridor never
exceeded 30 °C (86 °F) at any time during the experiment.
38

34-1
(0
oQ.
E
Room smoke alarm ^-^^ ,,,,r.y.\e<activated
50 1^
Thermocouple Array Location 3
D 0.03m BC X 1.22m BCO 0.30m BC O 1.52m BCA 0.61m BC V 1.83m BC+ 0.91m BC B 2.13m BC
50 100 150 200
Time (s)
250 300
122
104 _
86
68
50
32
350
o3n(UaE
Figure 3.3-3. Temperature versus time data from thermocouple array 3 in Experiment 3,
listed by distance below ceiling (BC)
Oo
O3̂̂
0)a.
Ed)
I-
Room
80
60
40
20
sn^oke alarm ^^'^^^spriu^^^^activated
\Thermocouple Array Location 4
a 0.03m BC X 1.22m BCO 0.30m BC O 1.52m BCA 0.61m BC V 1 83m BC+ 0.91m BC H 2.13m BC
176
140 uT
104
68
3
Q.
E0)
32
50 100 250 300 350150 200
Time (s)
Figure 3.3-4. Temperature versus time data from thermocouple array 4 in Experiment 3,
listed by distance below ceiling (BC)
39

60
Room
o3ffi
oQ.
E0)
50
- 40
30
20
10
sn^oke alarm ^^l^^^^^^^sprinkleractivated
\Thermocouple Array Location 5
P 0.03m BC X 1.22tn BCO 0.30m BC O 1.52m BCA 0.61m BC V 1 83m BC+ 0.91m BC B 2.13m BC
140
122
104
86
68
50
32
50 100 250 300 350150 200
Time (s)
Figure 3.3-5. Temperature versus time data from thermocouple array 5 in Experiment 3,
listed by distance below ceiling (BC)
0)
3*->
(0
oQ.
E
3.3.4 Gas Concentrations
The gas concentrations were sampled in two locations, one in the dorm room adjacent to TCarray 1 and one centered in the corridor adjacent to TC array 4, Figure 3.3-6 and Figure 3.3-7
respectively. Both of the sample locations were positioned 1.52 m (5.0 ft) above the floor. In
each figure, the oxygen and carbon dioxide levels are given on the upper graph with a range of
% to 25 % by volume and the carbon monoxide measurement is shown on the lower graph
which has a range of % to 1 % by volume.
The oxygen concentration at both the dorm room and the corridor positions never measured less
than 20 % by volume. The peak measures of carbon dioxide and carbon monoxide in the dorm
room were 1.0 % and less than 0.1 % respectively, hicreases of carbon dioxide and carbon
monoxide at the corridor sampling position were negligible.
40

25
20
15,!-,
(D
E3 10O>S5
5
£O*i«
(0
4-I 1ca>uc OHoo
0.6
Roo,. smoke alarm ^<^'^^^^,,,mer aotWated
\^:
O 02% RoomA C02% Roo^
0.4
0.2
0.0
11 r.
.^-6^ ^^
D C0% Room
3^=: -A- -A. . -Ar-T ; A. .-A
Vn . = o_fc —"-—
^
:a^ i
50 100 250 300 350150 200
Time (s)
Figure 3.3-6. Relative gas concentrations versus time for the gas sampling at 1.52 m above
the floor at location 1 in Experiment 3
41

oE3O>
c_o
(QI.'4-1
C(DOCoO(Ans
Room smoke ala.m ^-'^^^sp<\<^^^e,activated
\
O 02% Corridor
A C02% Corridor
d lA I • ^ ^
.Ua mBm
50 100 250 300 350150 200
Time (s)
Figure 3.3-7. Relative gas concentrations versus time for the gas sampling at 1.52 m above
the floor at location 4 in Experiment 3
3.3.5 Heat Flux Data
The heat flux data from the three sets of gauges positioned in the corridor are shown in Figure
3.3-8. Even with the open door, there was very httle increase in heat flux at the gauges locations,
as there was only a modest amount of heat discharged into the corridor from the fire room, prior
to sprinkler activation. The gauges at location 4, being closest to the open doorway of the fire
room, increased on average to approximately 0.25 kW/m .
42

E
X3
Room smoke alarm ^c^^^J^^^p.-^kler activated
0.4
0.3
0.2
ffi
I 0.1
0.0
n |Loc. 3 vert.
O jLoc. 3 horz.
A Loc. 4 vert.
+ Loc. 4 horz.
X Loc. 5 vert.
O Loc. 5 horz.
50
. .t.V . ^^ Ji ,'- ' I.I ^ J\. ' • - k-^^ I '^' ^' -
100 250 300 350150 200
Time (s)
Figure 3.3-8. Heat flux versus time data for the heat flux gauges at locations 3, 4, and 5 in the
orientations up (vert.) and sideways (horz.) in Experiment 3
3.4 Experiment 4: Open Door, Non-Sprinklered
The objective of this experiment was examine the fire development and measure the level of
hazard produced when there was compromised compartmentation, due to the open door, and no
automatic fire suppression system. This experiment also provided a direct comparison with the
previous experiment as a means to demonstrate the impact of the automatic sprinkler.
3.4.1 Experiment Timeline
The timeline was developed from observations made during the experiment, review of the video
of the experiment, and review of the data. Table 3.4-1 describes the level of fire development in
the room. This can be compared with other measurements presented in following sections, such
as changes in temperature, gas concentration or fire suppression team response.
43

Table 3.4-1. Timeline for Experiment Number 4
Time (s) Observations
Ignition
14 Smoke alarm in fire room activated
15 Flames extended to bedding
30 Flames extended to pillow
60 Visible smoke layer started to form
75 Visible smoke started to enter corridor
76 Tell-tale sprinkler in fire room activated
80 Flames extended to desk
90 Flames extended to floor carpeting
100 Flames extended to plastic bookshelf
110 Visible smoke layer started to form in corridor
128 Tell-tale sprinkler in corridor activated
145 Plastic bookshelf falls
202 Right window failure starting
220 Right window failure complete
220 Center window failure starting
225 Fire out of right window
287 Center window failure complete
290 Fire out of center window
319 Left window failure starting
328 Left window failure complete
Fire out of all three windows
430 Smoke door open, firefighter enter
465 Hose stream suppression
550 Fire extinguished, suppression completed
3.4.2 Smoke Alarm and Sprinkler Activation Times
The smoke alarm activation and sprinkler activation times are given in Table 3.4-2 and Table
3.4-3, respectively. The smoke alarm located in the dorm room activated at 14 s, just as the fire
was spreading to the bedding. The temperature at the thermocouple located near the smoke alarm
was 45 °C (1 13 °F) at the time of activation. Due to the open door between the dorm room and
the corridor, within 62 s after ignition, the three smoke alarms installed on the ceiling of the
corridor activated.
The fire generated enough heat to activate the sprinkler in the dorm room 76 s after ignition. At
this point, the temperature adjacent to the sprinkler was approximately 136 "C (277 °F). hi this
experiment, the sprinkler did not have a water supply, it was installed only to provide an
activation time.
44

Given that there was no suppression from the sprinkler in the dorm room, the fire continued to
grow unabated. As a result, the sprinkler located in the corridor was activated at 128 s after
ignition, being exposed to a gas temperature of 99 °C (210 "F). These sprinklers had no water
supply and were used only to provide an activation time.
Table 3.4-2. Dorm Room Experiment 4, Smoke Alarm Activation Times
Smoke Alarm Location Time (s) Temperature (°C)
1 Dorm Room 14 45
2 West Corridor 60 31
3 Center Corridor 32 29
4 East Corridor 62 32
Table 3.4-3. Dorm Room Experiment 4, Sprinkler Activation Times
Sprinkler Activation Location Time (s) Temperature (°C)
1 Dorm Room 76 136
2 Corridor 128 99
3.4.3 Temperature Data
Temperatures from the 5 thermocouple arrays located in the dorm room (TC arrays 1 and 2) and
in the corridor (TC arrays 3 through 5) are presented in Figure 3.4-1 through Figure 3.4-5.
Figure 3.4-1 and Figure 3.4-2 provide the temperature time history for both of the thermocouple
arrays located in the dorm room. Both graphs show the steady development of a hot gas layer in
the dorm room and rapid progression to a post-flashover condition at approximately 220 s after
ignition. At 220 s after ignition, the thermal conditions had transitioned from having a hot layer
and a cold layer in the room to having a single well mixed reaction zone with nearly equal
temperatures floor to ceiling in excess of 600 °C (1 1 12 °F). This post-flashover burning
condition continued until fire fighters began to suppress the fire 465 s after ignition. The
firefighters completed their suppression efforts approximately 85 s later, 550 s after ignition.
After the suppression was complete, temperatures in the room remained elevated due to the
"stored energy" in concrete ceiling and walls of the room. The temperatures in TC array 1, were
all at 150 °C (302 °F) or below given their position near the now open windows. TC array 2 was
located approximately 1.1m (3.5 ft) north of the south wall of the room. After suppression was
completed, the temperatures ranged from approximately 350 °C (660 °F) near the ceiling to
approximately 150 T (302 °F) near the floor.
45

Room smoke alarm activated
3
0)
Q.
E
1000 r
800
600
400
200 y^M'fJ
Thermocouple Array Location 1
D 0.03m BC X 1 22mBC
£ 0.30m BCOl 52mBC0.61m BC V 1.83m BC
"4=0.91m BC K 2 13mBC
1 1832
1472
1112
752
392
32
100 200 500 600 700 800300 400
Time (s)
Figure 3.4-1. Temperature versus time data from thermocouple array 1 in Experiment 4,
listed by distance below ceiling (BC)
<u
o.
E0)
Room smoke alarm activated
1112 23(0
aE0)
100 200 300 500 600 700 800400
Time (s)
Figure 3.4-2. Temperature versus time data from thermocouple array 2 in Experiment 4,
listed by distance below ceiling (BC)
46

The temperature time histories from the three vertical thermocouple arrays located along the
center line of the corridor are given in Figure 3.4-3 through Figure 3.4-5. This experiment had
an open door similar to Experiment 3, which allowed hot combustion products to flow into the
corridor.
Again TC array 4 was the closest of the three arrays in the corridor to the open doorway of the
burning room. As a result, the hot gases reached TC array 4 first and provided the highest
temperature increase at that location. The temperature 0.03 m below the ceiling began to
increase within 20 s after ignition as shown in Figure 3.4-4. After the dorm room fire
transitioned to a post-flashover fire at 220 s after ignition, the peak temperatures near the ceiling
in the corridor were on the order of 300 °C (572 °F) until suppression began.
The temperatures from TC array 3 and 5 are shown in Figure 3.4-3 and Figure 3.4-5,
respectively. Each of these arrays are positioned 4.6 m (15 ft) away from location 4, although in
opposite directions. At both of these positions the temperatures significantly decreased relative
to TC array 4. The peak temperatures near the ceiling never exceeded 200 °C (392 "F).
The corridor itself did not transition to flashover, as shown by the thermal gradient with a hot gas
layer in the upper portion of the corridor and the near ambient temperatures in the lower portion
of the corridor, as shown in Figure 3.4-3 through Figure 3.4-5. This condition began as hot
combustion products entered the corridor and continued until suppression. Hence a fire fighter
crouching 1 .2 m (4.0 ft) or less above the floor as they approached the fire room would be
exposed to temperatures of 100 °C (212 °F) or less.
Room smoke alarm activated
250
200o0)
3
OQ.
Eo
£ 150
100
50
fc
482
392ULo
3023*•>
CO1-
212 Q.
Eo
122
32
100 200 500 600 700 800300 400
Time (s)
Figure 3.4-3. Temperature versus time data from thermocouple array 3 in Experiment 4,
listed by distance below ceiling (BC)
47
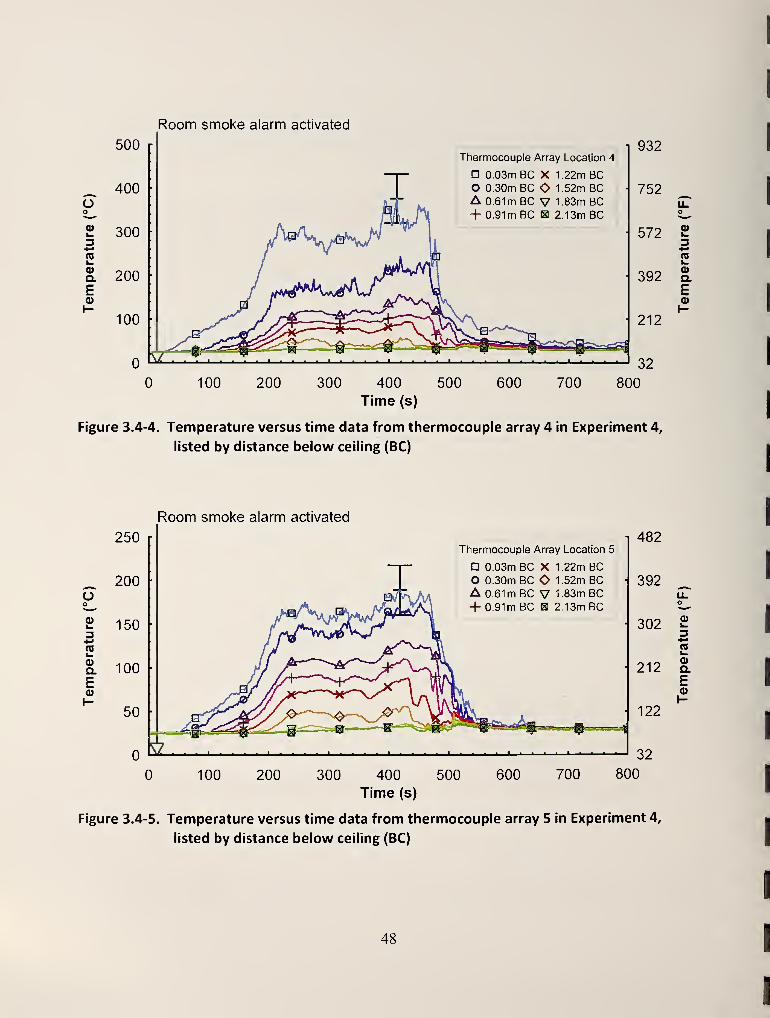
Room smoke alarm activated
Thermocouple Array Location 4
n 0.03m BC X 1.22m BCO 0.30m BC O 1.52m BCA 61m BC V 1.83m BC+ 0.91m BC H 2.13m BC
932
752
572
392
212
0)
3^-»
(0
Q.
Eo
32
100 200 300 500 600 700 800400
Time (s)
Figure 3.4-4. Temperature versus time data from thermocouple array 4 in Experiment 4,
listed by distance below ceiling (BC)
Room smoke alarm activated
oo
oi_
3n>
oQ.
E0)
250
200
150
100
50
100 200 300 400
Time (s)
500 600 700
482
392
302(U
34->
re1-
212Eo>
122
800
Figure 3.4-5. Temperature versus time data from thermocouple array 5 in Experiment 4,
listed by distance below ceiling (BC)
48

3.4.4 Gas Concentrations
The gas concentrations were sampled in two locations, one in the dorm room adjacent to TCarray 1 and one centered in the corridor adjacent to TC array 4; their measured values with
respect to time are shown in Figure 3.4-6 and Figure 3.4-7, respectively. Both of the sample
locations were positioned 1.52 m (5.0 ft) above the floor. In each figure, the oxygen and carbon
dioxide levels are given on the upper graph with a range of % to 25 % by volume and the
carbon monoxide measurement is shown on the lower graph which has a range of % to 8 % by
volume for the dorm room location and a range of % to 4% by volume for the corridor
location.
The oxygen concentration in the dorm room began to decrease at approximately 140 s after
ignition, which indicated that the hot gas layer had extended down from the ceiling to the entry
level of the sampling tube. The carbon dioxide began to increase noticeably as the oxygen
decreased. At approximately 250 s after ignition, the oxygen concentration started to decrease at
a faster rate, decreasing from 18 % to approximately 1 % by volume within a 150 s period.
During this same period, the carbon dioxide increased to 3 %. At this point in the development
of the fire, all of the windows had self-vented and the temperatures in the dorm room had been
consistent with post-flashover conditions for the past 180 s.
49

Room smoke alarm activated
0)
E3O>
c
oocoo(0
o
100 600 700 800200 300 400 500
Time (s)
Figure 3.4-6. Relative gas concentrations versus time for the gas sampling at 1.52 m above
the floor at location 1 in Experiment 4
Figure 3.4-7 shows the measured gas concentrations from the corridor location. The gas
concentrations began to change significantly at approximately 250 s after ignition. The trends of
decreasing oxygen, and increasing carbon dioxide and carbon monoxide continued until after fire
suppression started. Oxygen concentrations reached a low of approximately 5 %. Carbon
dioxide and carbon monoxide reached peak values of 13 % and 3 %, respectively.
The gas concentrations in the dorm room and the corridor returned to near pre-fire by 800 s after
ignition.
50
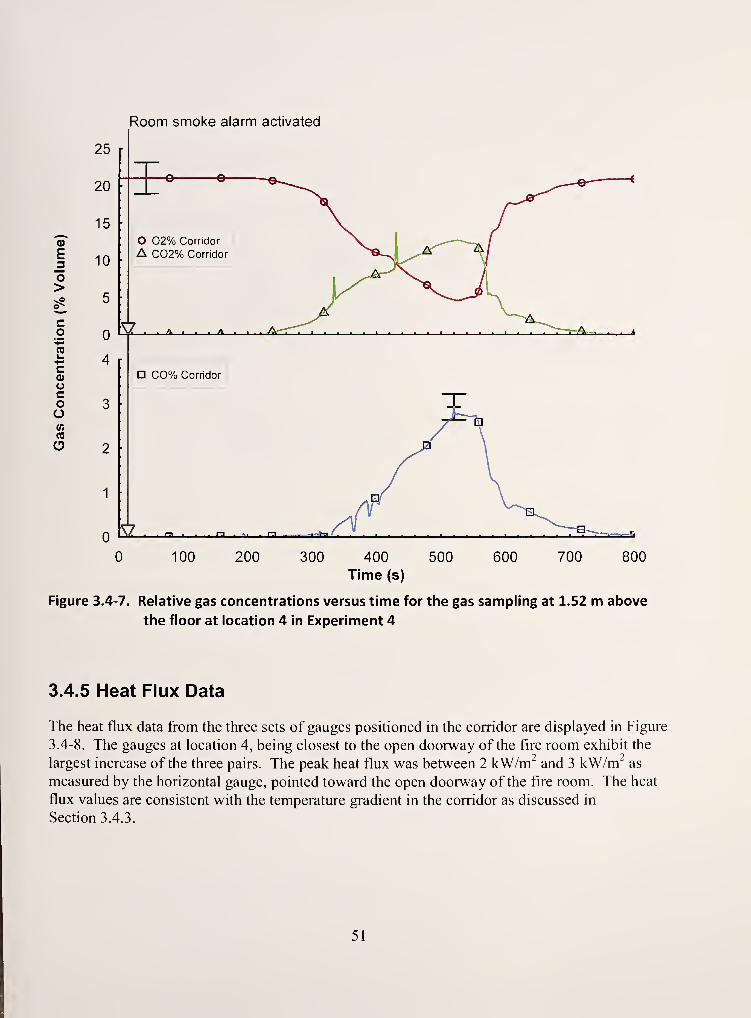
Room smoke alarm activated
oE
O>
c_o
(0t-*-•
c0)ocoom
O
25
20
15
10
5 •
O 02% Corridor
A C02% Corridor
a C0% Corridor
\n 1 I ni |_^|_^_0_^ ^- - '^I I -i-tm
100 200 600 700 800300 400 500
Time (s)
Figure 3.4-7. Relative gas concentrations versus time for the gas sampling at 1.52 m above
the floor at location 4 in Experiment 4
3.4.5 Heat Flux Data
The heat flux data from the three sets of gauges positioned in the corridor are displayed in Figure
3.4-8. The gauges at location 4, being closest to the open doorway of the fire room exhibit the
largest increase of the three pairs. The peak heat flux was between 2 kW/m^ and 3 kW/m as
measured by the horizontal gauge, pointed toward the open doorway of the fire room. The heat
flux values are consistent with the temperature gradient in the corridor as discussed in
Section 3.4.3.
51

Room smoke alarm activated
3.0
2.5^1-1^
N
E
i 2.0
•̂^^^
X 1 53U.4-1
1.0oX
0.5
0.0
n Loc. 3 vert.
O Loc. 3 horz.
A Loc. 4 vert.
+ Loc. 4 horz.
X Loc. 5 vert.
O Loc. 5 horz.
100 200 300 500 600 700 800400
Time (s)
Figure 3.4-8. Heat flux versus time data for the heat flux gauges at locations 3, 4, and 5 in the
orientations up (U) and sideways (S) in Experiment 4
3.5 Experiment 5: Open Door, Non-Sprinklered
The objective of this experiment was to rephcate Experiment 4 and provide another baseline data
set with an open door and no automatic fire suppression.
3.5.1 Experiment Timeline
The timeHne was developed from observations made during the experiment, review of the video
of the experiment, and review of the data. Table 3.5-1 describes the level of fire development in
the room. This can be compared with other measurements presented in following sections, such
as changes in temperature, gas concentration or fire suppression team response.
52

Table 3.5-1. Timeline for Experiment Number 5
Time (s) Observations
Ignition
26 Smoke alarm in fire room activated
25 Visible smoke layer started to form
35 Flames extended to bedding
40 Smoke started to enter the corridor
45 Flames extended to pillow
70 Smoke layer started to form in corridor
110 Tell-tale sprinkler in fire room activated
165 Flames extended to desk
180 Plastic bookshelf falls
191 Right window failure starting (glass cracking)
224 Tell-tale sprinkler in corridor activated
246 Smoke to the floor
247 Center window failure starting
290 Flames out of small openings in right window glass
305 Left window failure starting
331 Right window failure complete
405 Flames out of openings near top of left window glass
417 Center window failure complete
426 Left window failure complete
501 Door open
570 Start suppression
3.5.2 Smoke Alarm and Sprinkler Activation Times
The smoke alarm activation and sprinkler activation times are given in Table 3.5-2 and Table
3.5-3 respectively. The smoke alarm located in the dorm room activated at 26 s. The
temperature at the thermocouple located near the smoke alarm was 31 °C (88 °F) at the time of
activation. Due to the open door between the dorm room and the corridor, within 98 s after
ignition all three smoke alarms installed on the ceiling of the corridor had activated. The time
until activation for the most remote smoke alarm was 36 s longer than in Experiment 4. This
was due in part to the bum room being at the west end of the corridor instead of near the middle
as in the previous experiment.
The fire generated enough heat to activate the sprinkler in the dorm room at 110s after ignition.
At this point the temperature adjacent to the sprinkler was approximately 82 °C (180 °F). In this
experiment, the sprinkler did not have a water supply, it was installed only to provide an
activation time.
Given that there was no suppression from the sprinkler in the dorm room, the fire continued to
grow. As a result, the sprinkler located in the corridor at location 4 was activated at 224 s after
53

ignition. The gas temperature near the sprinkler at the time of activation was 125 °C (257 °F).
This sprinkler was also intended to only provide an activation time.
Table 3.5-2. Dorm Room Experiment 5, Smoke Alarm Activation Times
Smoke Alarm Location Time (s) Temperature (°C)
1 Dorm Room 26 31
2 West Corridor 62 30
3 Center Corridor 80 31
4 East Corridor 98 31
Table 3.5-3. Dorm Room Experiment 5, Sprinkler Activation Times
Sprinkler Activation Location Time (s) Temperature (°C)
1 Dorm Room 110 82
2 Corridor 224 125
3.5.3 Temperature Data
Temperatures from the 5 thermocouple arrays located in the dorm room (TC arrays 1 and 2) and
in the corridor (TC arrays 3 through 5) are presented in Figure 3.5-1 through Figure 3.5-5.
Figure 3.5-1 and Figure 3.5-2 provide the temperature time history for both of the thermocouple
arrays located in the dorm room. Both graphs show the steady development of a hot gas layer in
the dorm room reaching temperatures of approximately 200 °C (392 "F) by 180 s after ignition.
After 180 s, the temperature gradients in the two different areas of the dorm room diverge. The
temperatures near the ceiling at TC array 1, near the area of origin, increase to approximately
800 "C (1470 °F) at 240 s after ignition. At the same time the temperature 1.52 m (5 ft) below
the ceiling was 100 °C (212 °F). There was also a thermocouple in the array 1.83 m (6 ft) below
the ceiling, whose temperature did not follow the trends of the thermocouples either above or
below it. A plastic crate fell and pushed TC array 1 toward the burning bed, and the TC at the
1.83 m position was pushed into the burning bed at that point. This was the only TC affected.
During this same time, 240 s after ignition, the temperatures at TC array 2 reached a plateau of
approximately 580 "C (1076 °F) near the ceiling. At the same time, the temperatures near the
floor of this position were still less than 100 °C (212 °F).
At 330 s after ignition, temperatures in the hot layer began to decrease at both TC array positions
in the dorm room. The right window pane had completely vented open by this time and was
allowing heat to leave the room. About 40 s, later the temperatures began to increase again. The
temperatures in the dorm room increased, transitioning through flashover at approximately 440 s,
based on all of temperature measurements from TC array 1 exceeding 600 °C (1 1 12 °F) at that
time. The temperatures at TC array 2 showed a similar trend, although it occurred about 20 s
later. These temperatures continued until the fire fighters began suppression at 570 s after
54

ignition. Hose stream application resulted in a significant and rapid decrease in temperature
throughout the dorm room.
1200
Room smoke alarm activated
I
Tjhermocouple Array Location 1
Id 03m BC X 1.22m BC1 000 T
I
Q Q 3Q^ QQ ^ ^ 52m BC•A 0.61m BC V 1.83m BC
100 200 400 500
2192
1832
147?oL.
3111? re^
(Ua75? E
0)
600300
Time (s)
Figure 3.5-1. Temperature versus time data from thermocouple array 1 in Experiment 5,
listed by distance below ceiling (BC)
Room smoke alarm activated
100 200 400 500
o3re
752 ^Eo
600300
Time (s)
Figure 3.5-2. Temperature versus time data from thermocouple array 2 in Experiment 5,
listed by distance below ceiling (BC)
55

The temperature time histories from the three vertical thermocouple arrays located along the
center line of the corridor are given in Figure 3.5-3 through Figure 3.5-5. This experiment had
an open door similar to Experiment 3 and 4, which allowed hot combustion products to flow into
the corridor. However in this experiment, TC array 3 was closest to the bum room, while TCarray 5 was the most remote.
The temperature trends in the corridor follow those from the dorm room in that the temperatures
increased, decreased, and then increased again until fire fighting activities commenced with the
opening of the smoke door leading into the corridor at 500 s.
The peak temperatures in the corridor were located 0.03m (1 in) below the ceiling for each of the
TC arrays in the corridor. The peak temperatures were approximately 230 °C (446 °F), 170
°C (338 °F), and 135 "C (275 "F) at locadons 3, 4, and 5 respecfively.
As in Experiment 4, the corridor maintained a two layer thermal environment even though the
dorm room flashed over. Figure 3.5-3 through Figure 3.5-5 show that throughout the
experiment, temperatures 1 .22 m (4 ft) below the ceiling or lower never exceeded
100''C(212°F).
300
250
— 200
(0
oa.
E0)
150
100
50
Room smoke alarm activated
!
Tihermocouple Array Location 3
In 0.03m BC X 1.22m BC|o 0.30m BC O 1.52m BC!A 0.61m BC V 1-83m BC\+ 0.91m BC B 2.13m BC
1 572
482
392 -
302
212
122
3*•>
nj
a.
£
32
100 200 400 500 600300
Time (s)
Figure 3.5-3. Temperature versus time data from thermocouple array 3 in Experiment 5,
listed by distance below ceiling (BC)
56

oo
0)
moQ.
E0)
210
180
150
120
90
60
30
Room smoke alarm activated
I
Thermocouple Array Location 4
D 0.03m BC X 1.22m BCO 0.30m BC O 1.52m BCA 0.61m BC V 1.83m BC4- 0.91m BC Bl 2.13m BC
410
356,_^
302 Li_o
9248
I.
3•*-'
ns^194 (i>
Q.
E140 (D
86
32
100 200 400 500 600300
Time (s)
Figure 3.5-4. Temperature versus time data from thermocouple array 4 in Experiment 5,
listed by distance below ceiling (BC)
180
150
rJ
Room smoke alarm activated
oo
120oV.
390
1.
0)Q.
E 60o\-
30
fiermocouple Array Location 5
0.03m BC X 1.22m BCO 0.30m BC O 1.52m BCA 0.61m BC V 1 83m BC+ 0.91m BC B 2.13m BC
100 200 400 500
356
302,_^u.
2480)^3
194V.
<Ua140 E
0)
86
32
600300
Time (s)
Figure 3.5-5. Temperature versus time data from thermocouple array 5 in Experiment 5,
listed by distance below ceiling (BC)
57

3.5.4 Gas Concentrations
The gas concentrations were sampled in two locations, one in the dorm room adjacent to TCarray 1 and one centered in the corridor adjacent to TC array 4; their measured values with
respect to time are shown Figure 3.5-6 and Figure 3.5-7 respectively. Both of the sample
locations were positioned 1.52 m (5.0 ft) above the floor. In each figure, the oxygen and carbon
dioxide levels are given on the upper graph with a range of % to 25 % by volume and the
carbon monoxide measurement is shown on the lower graph which has a range of % to 8 % by
volume for the dorm room location and a range of % to 2 % by volume for the corridor
location.
In the dorm room, the oxygen concentration began to decrease at approximately 120 s after
ignition; this occurred in conjunction with the increase in carbon dioxide and carbon monoxide.
The rates of change for the gas concentrations are nearly linear until 280 s after ignition, whenthe rate of change increases. For the interval between 120 s and 280 s, the oxygen concentration
decreased approximately 3 % and carbon dioxide increased by approximately 3 %. In absolute
terms, the rate of change for both species during this 160 s period was approximately
1.1 % per min. During the next minute, from 280 s to 340 s, the oxygen concentration decreased
by 10 %, the carbon dioxide increased by 7 % and the carbon monoxide had increased by 1 %.
The oxygen concentration leveled out at about 6 % between 380 s and 410 s after ignition. This
was the period when the temperatures in the dorm room are increasing again, after the opening of
one of the three window sections. During this same period, the carbon dioxide increased to a
steady level of 1 1 % by volume and the carbon monoxide reading increased to more than 2 %.
As the temperature in the dorm room continued to increase during the period fi^om 410s after
ignition to flashover at 440 s, the oxygen and carbon dioxide concentrations incurred two rapid
transitions with the largest change being an increase of 6 % for the oxygen and about a 4 %decrease for the carbon monoxide. Once all of the windows had self-vented and the fire was in
post-flashover, the oxygen and carbon dioxide continued to oscillate for the next 80 s. For the
oxygen, the range of fluctuation was between 5 % and 10 %. Just prior to suppression, the
temperatures in the dorm room continued to increase, peaking in excess of 820 °C (1500 °F). At
that same time, the oxygen concentration dropped to % and the carbon dioxide concentration
peaked at 18 % by volume and the carbon monoxide increased to over 6 % by volume.
Figure 3.5-7 shows the gas concentrations measured in the corridor. The gas concentrations did
not significantly change for the first 300 s after ignition, then conditions in the corridor began to
exhibit rapid change in a manner similar to those inside the dorm room. Just prior to the
complete failure of the last window in the dorm room, the gas concentrations reached their pre-
suppression peak values. At 420 s after ignidon, the oxygen dipped just below 10 %, the carbon
dioxide exceeded 8 %, and the carbon monoxide reached 1 %.
After the dorm room windows had completely vented open, the flow path for the fire consisted
of drawing fresh air from the building and exhausting the majority of the hot gases out of the
window openings. This flow had the impact of increased oxygen concentration and decreased
58

concentrations of carbon dioxide and carbon monoxide. This trend continued until the fire
fighters entered the building and suppression activities began.
Although not shown in the figures, the gas concentrations in the dorm room and in the corridor
had returned to near pre-fire conditions by 800 s after ignition.
Room smoke alarm activated
oE3O>
(0
coocoo(0(Q
CD
100 200 400 500 600300
Time (s)
Figure 3.5-6. Relative gas concentrations versus time for the gas sampling at 1.52 m above
the floor at location 1 in Experiment 5
59

Room smoke alarm activated
oE
o>
coVmCOt—*->
c0)ocoo(0(0
o
25
20
15
10 •
5 •
2.0
1.5
1.0
0.5
0.0 ^-^
O 02% Corridor
A C02% Corridor
a C0% Corridor
'^ • - r-3 . — ra
100 200 400 500 600300
Time (s)
Figure 3.5-7. Relative gas concentrations versus time for the gas sampling at 1.52 m above
the floor at location 4 in Experiment 5
3.5.5 Heat Flux Data
The heat flux data from the three sets of gauges positioned in the corridor are displayed in Figure
3.5-8. The gauges at location 3, being closest to the open doorway of the fire room exhibited the
largest increase of the three pairs. The peak heat flux was between 2 kW/m" and 3 kW/m as
measured by the horizontal gauge, pointed toward the open doorway of the fire room. This was
consistent with the heat flux results from Experiment 4.
60

E
X3
(0
X
2.5
2.0
1.5
1.0
0.5
0.0
Room smoke alarm activated
D Loc. 3 vert.
O Loc. 3 horz
A Loc. 4 vert.
-}- Loc. 4 horz
± Loc. 5 vert.
<> Loc. 5 horz
100 200 400 500 600300
Time (s)
Figure 3.5-8. Heat flux versus time data for the heat flux gauges at locations 3, 4, and 5 in the
orientations up (vert.) and sideways (horz.) in Experiment 5
61

4 Discussion
In order to examine the potential impact of the effectiveness of compartmentation or an
automatic fire sprinkler system, the discussion will begin with benchmark values for thermal
injury and incapacitation due to inhalation of combustion products. The life safety hazards
generated by a fire include: temperature, toxic gases, and loss of visibility. In these experiments,
only quantitative measures of heat and a few toxic gases were made and some qualitative
measures of visibility were made with video cameras.
Heat can be transferred by conduction, convection and radiation. Bum injuries caused by the
combustion products (smoke) can be caused by convection and/or radiant heat transfer.
Frequently the hazard related to heat transfer from the environment to the body is simplified as
an exposure temperature for a prescribed duration.
As presented in the SFPE Handbook of Fire Protection Engineering, estimated limits for
tenability due to convected heat suggest a thermal tolerance of 120 °C (248 °F). Above this limit,
the onset of pain is rapid and bums can develop within a few minutes or less. The estimated
tenability limit due to heat flux is 2.5 kW/m . At this level, the time to bum unprotected skin is
20 s or less [13].
These limits are not absolute limits since clothing, humidity, skin composition etc, can mitigate
or exacerbate the impact of the thermal energy for a given heat level and exposure time. These
values are used as bench marks for the discussion presented here. It is also important to note that
as the fire grew, the temperatures in some areas of the dorm room and corridor increased rapidly
and quickly exceeded the benchmark tenability thresholds, making concems over uncertainty in
the tenability limits a minor point.
Based on individual exposures, incapacitation can occur due to low oxygen (10 % to 13 %) or
high level of carbon dioxide (7 % to 8 %) or carbon monoxide (0.6 % to 0.8 %) after
approximately 5 minutes of exposure [13]. Lower concentrations of oxygen and higher
concentrations of carbon dioxide and carbon monoxide, or the synergistic effect of all three
combustion products would result in incapacitation in a shorter time. For purposes of this
analysis, the following values will be considered the limits of untenablity: oxygen < 10 %,
carbon dioxide > 8 %, and carbon monoxide > 1 %.
In the sections that follow, comparisons between the experiments are made by examining the
temperatures and gas concentrations at approximately 1.5 m (5 ft) above the floor. This
elevation can be considered the face height of a typical, standing person.
4.1 Closed Door Experiments
In these experiments, the door between the dorm room and the corridor remained closed
throughout the experiments. This had the impact of preventing significant amounts of heat or
combustion products from entering the corridor. The conditions in the corridor in both
experiments remained tenable.
62

The post fire damage in both dorm rooms was similar, as shown in Figure 4.1-1. In the non-
sprinklered experiment, the fire self-extinguished due to low oxygen concentration, while in the
other dorm room with a closed door, the water fi-om the sprinkler extinguished the fire.
Figure 4.1-1. Post fire photographs of the dorm room for Experiment 1 (non-sprinklered) on
the left and Experiment 2 (sprinklered) on the right.
Even though the fire damage was similar between Experiment 1 and Experiment 2, the tenability
conditions in the dorm rooms were quite different. Figure 4. 1-2 shows the measured
temperatures from the TC array 1 location in Experiment 1 and Experiment 2. The temperatures
in both experiments increased after ignition and followed similar trends until the sprinkler in
Experiment 2 activated at 100 s. The temperatures significantly diverged at this point, with the
temperatures in the non-sprinklered experiment surpassing untenable levels at approximately
150 s after ignifion. The fire in Experiment 2 was automatically extinguished 125 s after
ignition.
63

210 r
180
^ 150Oo
2 120
g. 90Eo>
•" 60
30 ;
Room Temperatures
D Exp 1 (Unsprinklered)
O Exp 2 (Sprinklered)
v"©^—e-'-'-©—0~-^^0-<~sp
' ' ' -
410
356
302u.o^ ^
?48 £3+J(Uw
194 Q.
Ea>
140h-
86
32
100 200 300
Time (s)
400 500
Figure 4.1-2. Temperature versus time data from thermocouple array 1 from Experiment 1
and 2 at approximately 1.5 m (5 ft) above the floor.
Figure 4.1-3 through Figure 4.1-5 show the comparison of oxygen, carbon dioxide and carbon
monoxide for the two experiments. In both experiments, the measurements showed decreased
oxygen levels and increased amounts of carbon dioxide and carbon monoxide. In the sprinklered
experiment, this occurred after sprinkler activation due to the cooling and mixing of the
combustion products in the hot gas layer. The gas concentration levels in the sprinklered
experiment as the fire was being suppressed were approximately five times less than the peak
values in the non-sprinklered experiment and remained within tenable limits throughout the
experiment.
64

oE
o>
c_o'^flSk.4->
coucoo(0CO
O
25
20
15
10
5
o B o n o
02 Concentrations
n Exp 1 (Unsprinklered)
O Exp 2 (Sprinklered)
100 200 300
Time (s)
400 500
Figure 4.1-3. Oxygen concentrations versus time in the dorm room from Experiment 1 and 2
at approximately 1.5 m (5 ft) above the floor.
Eso>
c_o
(0
*-•
coucoo(/)
(0
o
6
C02 Concentrations
D Exp 1 (Unsprinklered)
O Exp 2 (Sprinklered)
100 200 300
Time (s)
400 500
Figure 4.1-4. Carbon dioxide concentrations versus time in the dorm room from Experiment 1
and 2 at approximately 1.5 m (5 ft) above the floor.
65

E
o>
o
re
0.25
0.20
0.15
-£ 0.10coucoo(0re
0.05
0.00
CO Concentrations
D Exp 1 (Unsprinklered)
O Exp 2 (Sprinklered)
-^ I n I a-t- ^i .Q .^A; q ^e-/S
100 200 300
Time (s)
400 500
Figure 4.1-5. Carbon monoxide concentrations versus time in the dorm room from
Experiment 1 and 2 at approximately 1.5 m (5 ft) above the floor.
4.2 Comparison of the Non-Sprinklered Experiments
Three of the five Experiments, 1, 4 and 5, were conducted without sprinklers. The first
experiment had the dorm room door to the corridor closed, while the door was open in the latter
two experiments (4 and 5). The photos and data that follows show the impact that a closed door
can have on the room of origin.
Figure 4.2-1. Post fire photographs of the dorm room for Experiment 1 (door closed) on the
left and Experiment 5 (door open) on the right.
66

Figure 4.2-2. Post fire photographs of the corridor for Experimerit 1 (door closed) on the left
and Experiment 5 (door open) on the right.
Figure 4.2-3 and Figure 4.2-4 show the temperature time histories in the dorm room and the
corridor locations for Experiment 1, 4 and 5. In all three cases, the temperatures in the dorm
room reached untenable levels in excess of 120 °C (248 °F). Figure 4.2-4 shows that the corridor
temperature approached 120 °C (248 °F) in the open door experiments, while the temperature
remained near ambient for the closed door experiment.
67

1000 r
800
oo
600»-
34-«
ak.
oa.
E400
0)
200 -
Room Temperatures
D Exp 1 (Closed)
O Exp 4 (Open)
A Exp 5 (Open)
Olt"^
1832
1472
1112 0)
3*^re
752 II-
392
32
100 200 300 400 500 600
Time (s)
700 800
Figure 4.2-3. Temperature versus time data from thermocouple array 1 from Experiment 1, 4
and 5 at approximately 1.5 m (5 ft) above the floor.
140 r
120
284
_-_ 100oo
S 803**nkoQ. 60E0)1-
40
20
100 200 300 400 500
Time (s)
600 700 800
Figure 4.2-4. Temperature versus time data from thermocouple array 4 from Experiment 1,
4
and 5 at approximately 1.5 m (5 ft) above the floor.
68

The oxygen measurements in the dorm room and the corridor are shown in Figure 4.2-5 and
Figure 4.2-6. The closed door prevented sufficient oxygen from entering the room. Therefore
the fire was unable to generate additional energy and the fire self-extinguished when the oxygen
level fell below 15%. In the open door experiments, the fires continued to grow until they
transidoned to flashover, which in turn consumed most of the oxygen in the dorm room. In
addition to generating untenable temperatures in the dorm rooms, there were untenable gas
concentrations in the corridor as shown Figure 4.2-5, Figure 4.2-7 and Figure 4.2-9. This led to
incapacitating conditions in the corridor due to reduced oxygen, and increased carbon dioxide
and carbon monoxide as shown in Figure 4.2-6, Figure 4.2-8 and Figure 4.2-10. The closed door
prevented heat or smoke from being transported to the corridor in Experiment 1
.
E
O>
c_o
CoucoO(0re
O
25 r
20
15
10
5
2^o-n^-op
02 Concentrations
D Exp 1 (Closed)
O Exp 4 (Open)
A Exp 5 (Open)
100 200 300 400 500
Time (s)
600 700 800
Figure 4.2-5. Oxygen concentrations versus time in the dorm room from Experiment 1, 4 and
5 at approximately 1.5 m (5 ft) above the floor.
69

E
o>
_o
CO
c0)ocoo(0(0
o
25
20
15
10 •
5 •
5 o-ba dd a n —^^ fl —
B
02 Concentrations
Exp 1 (Closed)
O Exp 4 (Open)
A Exp 5 (Open)
100 200 300 400 500
Time (s)
600 700 800
Figure 4.2-6. Oxygen concentrations versus time in the corridor from Experiment 1, 4 and 5 at
approximately 1.5 m (5 ft) above the floor.
E
o>
20 r
15 •
'E 10
£ucoom(0
O
C02 Concentrations
n Exp 1 (Closed)
O Exp 4 (Open)
A Exp 5 (Open)
100 200 300 400Time (s)
500 600 700 800
Figure 4.2-7. Carbon dioxide concentrations versus time in the dorm room from Experiment
1, 4 and 5 at approximately 1.5 m (5 ft) above the floor.
70

oE
o>
co
20
15
•5 10a
coucoomnO
C02 Concentrations
D Exp 1 (Closed)
O Exp 4 (Open)
A Exp 5 (Open)
100 200 300 400 500 600 700 800
Time (s)
Figure 4.2-8. Carbon dioxide concentrations versus time in the corridor from Experiment 1, 4
and 5 at approximately 1.5 m (5 ft) above the floor.
<D
E3O>
coat-•**
c0)ucoO(0CO
O
8
6 I-
4
2
CO Concentrations
n Exp 1 (Closed)
O Exp 4 (Open)
A Exp 5 (Open)
100 200 300 400
Time (s)
500 600 700 800
Figure 4.2-9. Carbon monoxide concentrations versus time in the dorm room from
Experiment 1, 4 and 5 at approximately 1.5 m {5 ft) above the floor.
71

E
O>
(0
coucoom(0
O
CO Concentrations
D Exp 1 (Closed)
O Exp 4 (Open)
A Exp 5 (Open)
100 200 300 400
Time (s)
500 600 700 800
Figure 4.2-10. Carbon monoxide concentrations versus time in the corridor from Experiment
1, 4 and 5 at approximately 1.5 m (5 ft) above the floor.
4.3 Comparison of Open Door, Sprinklered versus Non-sprinklered
Experiments
Three experiments were conducted with the door from the dorm room to the corridor open, hi
one case, Experiment 3, there was an automatic fire sprinkler in the dorm room and in the other
two experiments (4 and 5), no active sprinkler was provided. The photographs shown in Figure
4.3-1 are representative of the results. With an operating sprinkler present, the fire damage was
very limited. The photograph of the dorm room taken after Experiment 4 shows a room that has
damage consistent with post-flashover (burning floor to ceiling) fire.
72

Figure 4.3-1. Post fire photographs for Experiment 3 (sprinklered) on the left and Experiment
4 (non-sprlnklered) on the right.
The comparative temperatures from the dorm room and corridor are shown in Figure 4.3-2 and
Figure 4.3-3. In the dorm room with a sprinkler, temperatures remained tenable. As previously
noted, the temperatures in the non-sprinklered dorm rooms became untenable within 182 s of
ignition.
Figure 4.3-4 through Figure 4.3-9 provides comparisons of the measured gases in the dorm room
and the corridor from Experiment 3, 4 and 5. The conditions in the sprinklered experiment (3)
remained tenable with respect to the levels of oxygen, carbon dioxide and carbon monoxide that
were present in both the dorm room and the corridor. The two non-sprinklered experiments
transitioned to flashover. In both experiments, the levels of oxygen, carbon dioxide and carbon
monoxide were untenable, as defined earlier in this section, within 346 s and 454 s after ignition
for the dorm room and the corridor respectively, The time to reach the untenability criteria for
each gas is presented in Table 4.4-2.
73

oo
<u
3aoQ.
E4)
1000
800
600
400
200
Room Temperatures
D Exp 3 (Sprinklered)
O Exp 4 (Unsprinklered)
A Exp 5 (Unsprinklered)
»<M^%WII l^^jl' CC'^">^
1 1832
1472
1112
752
• 392
-l__l l_l L.
u.o
0)
3*j(0u.
OQ.
Ea>
I-
32
100 200 300 400 500
Time (s)
600 700 800
Figure 4.3-2. Temperature versus time data from thermocouple array 1 from Experiment 3, 4
and 5 at approximately 1.5 m (5 ft) above the floor.
100 200 300 400 500
Time (s)
600 700 800
Figure 4.3-3. Temperature versus time data from thermocouple array 4 from Experiment 3, 4
and 5 at approximately 1.5 m (5 ft) above the floor.
74

<D
E
O>
co
re
25
20
15
g 10ou
§ 5O(0
5
Hh^CD-nAB
02 Concentrations
n Exp 3 (Sprinklered)
O Exp 4 (Unsprinklered)
A Exp 5 (Unsprinklered)
100 200 300 400
Time (s)
500 600 700 800
Figure 4.3-4. Oxygen concentrations versus time in the dorm room from Experiment 3, 4 and
5 at approximately 1.5 m (5 ft) above the floor.
oE3O>
coV?ret^*->
coucoo(0re
25
20
15
10
5
Ano- cm a QE^i —^ pAn^""^ A
^ i
:
\\ A /
,._A /
02 Concentrations\Ni 7^^
D Exp 3 (Sprinklered)
O Exp 4 (Unsprinklered)
A Exp 5 (Unsprinklered)
100 200 300 400 500
Time (s)
600 700 800
Figure 4.3-5. Oxygen concentrations versus time in the corridor from Experiment 3, 4 and 5 at
approximately 1.5 m (5 ft) above the floor.
75

E
o>
Co'<?
OSk.*Jcoucoomm
20
15
10
C02 Concentrations
D Exp 3 (Sprinklered)
O Exp 4 (Unsprinklered)
A Exp 5 (Unsprinklered)
100 200 300 400
Time (s)
500 600 700 800
Figure 4.3-6. Carbon dioxide concentrations versus time in the dorm room from Experiment
3, 4 and 5 at approximately 1.5 m (5 ft) above the floor.
oE
O>
co'^COI-*->
coocoOv>CO
20
15
10
C02 Concentrations
D Exp 3 (Sprinklered)
O Exp 4 (Unsprinklered)
A Exp 5 (Unsprinklered)
100 200 300 400
Time (s)
500 600 700 800
Figure 4.3-7. Carbon dioxide concentrations versus time in the corridor from Experiment 3, 4
and 5 at approximately 1.5 m (5 ft) above the floor.
76

oEDo>
(0l_*Jcoucoo(0aO
CO Concentrations
n Exp 3 (Spnnklered)
O Exp 4 (Unsprinklered)
A Exp 5 (Unsprinklered)
100 200 300 400
Time (s)
500 600 700 800
Figure 4.3-8. Carbon monoxide concentrations versus time in the dorm room from
Experiment 3, 4 and 5 at approximately 1.5 m (5 ft) above the floor.
oE
O>
c_o
CO
coocoo
O
CO Concentrations
a Exp 3 (Sprinklered)
O Exp 4 (Unsprinklered)
A Exp 5 (Unsprinklered)
100 200 300 400
Time (s)
500 600 700 800
Figure 4.3-9. Carbon monoxide concentrations versus time in the corridor from Experiment 3,
4 and 5 at approximately 1.5 m (5 ft) above the floor.
77

4.4 Summary
The complete set of measurements from each of the five experiments was presented in Section 3.
In the previous portions of this section comparisons have been provided to examine the impact of
automatic sprinkler protection and the impact of keeping the door to the room of origin closed.
In this summary section, Table 4.4-1 presents the smoke alarm and sprinkler activation times for
comparison against the times to reach the untenability criteria in the dorm room and the corridor,
given in Table 4.4-2.
In each of the experiments, the ionization smoke alarms installed in the dorm rooms activated
within 12 s to 26 s after ignition. The average time between the first smoke alarm activation and
the time to reach untenability in the dorm room for the three unsprinklered experiments
(Experiment 1, 4 and 5) was 134 s. The last two experiments (Experiment 4 and 5), which were
unsprinklered and had the dorm room door open, resulted in untenable conditions in the corridor
as well as in the dorm room. The average time between the activation of smoke alarm in the
center location in the corridor and the time to reach untenable conditions in the corridor was
356 s.
The untenable conditions in the corridor for Experiment 4 and 5, would represent the worst case
for a building occupant, not located in the room of origin, who needed to use the corridor as a
means of egress. In these experiments, the warning of the smoke alarms located in the corridor
provided at least 5 minutes of available safe egress time.
Experiment 1 and 2 were conducted with the dorm room door closed. In both cases the corridor
remained tenable throughout the duration of the experiments. In Experiment 1, which was
unsprinklered, the closed door limited the availability of fresh oxygen to the fire, which resulted
in the limitation of the amount of heat that could be released and eventually led to the self-
extinguishment of the fire. While the thermal tenability limit was exceeded in the dorm room,
the transmission of hazardous conditions from the fire to building occupants outside the room of
origin were mitigated by the closed door.
Experiment 2 and 3 had active sprinkler systems installed. The time between the activations of
the smoke alarm and the automatic sprinkler in the same room was approximately 90 s in both
experiments. Experiment 3 had the dorm room door open to the corridor. As a result, the smoke
alarms in the corridor also activated prior to the thermal activation of the sprinkler in the room.
In both of the sprinklered experiments (Experiment 2 and 3), the tenability limits were not
exceeded.
78

o0)
E
re
I/)
0)u'>
O)
OOJI/)
o
re
(/>
3*>re
Q.
E(UI-
TSCre
M
E
co'•Mre
_>
u<
<0)
oE
ac cre o^ '^<u re
2 >
a <
re
ex
^ in o £ U ONON
in
Corrido Sprinkl>o<
H
£
o
(A
< <Z<
OO
Cl.
O £ u oo On rj (NOO
oom
prink]
03
>£ {/i
O ino (N(̂^
O
ex GO < HCl,
L.
co £
Hu (N ON (N ,^
ast
orrido
(U G "^o < CnI r^ r<-i
oiH§ £ Ol
'^Csl OO
ON
w u CO < < H&,
enter
orridor
(U
£ uo <
oo(N
OS mo - >
J2 "-S £ C/1
'^ ooo
u u CO < < HCl,
West
Corridor
<D
£
Huo < ro
o
o£00
AlamActiv £ 1/3
o 'A OO o
Cl,
ation Temu (N (N ^ m ^^
rn •"O m r-i '^ -'^l- (^
§ > 03
"5 s^ '^ (N rs| ^ ^
03cy3 (N ^^ <N <N
Cii 00 < < H
^^ £-'-'
i-i C/3 1/3
^ &. •>1 O <u (U o O< 00 C/2 Z >- > z 2
co -o -o
O o
(U1/3
O1/3
oca.
cID
a. cxQ Dh U u O O O
cQJ
£)_(Ua.XW --^ CNl m '^ m
_3
c3Ouc
I/)
rec0)
cre
'E
.2Plo
(/)
o
TJ(UQ^
re
L.014->
^u ^>• o*rf o^ 1.re oc ua;4-> oC c3 re
c E(U o> oO Q^
^ Fu \-re oa; Q
(Uo4->
(U ^E ot-
(N
^^(U
r̂e1-
O
fcou
Ou A o O o
c/3
oc/3
Ou
oo
A o o o
en
OOONm
c/3
nO
XT
OOV CnI
CAl
NO
c/3
in
£
H
uo
OCM
A
Uo
NO
ouo
(N
o
oUo
O
£oo
oQ
oA O O o
c/3
oCO
CAl
NO
ou
oo
A NO
^ ^ c/3
oo
m On
ooV
o O(N
en
Om
CA)
oo
m
ci
£
H
Uo
O(N
A
CO
NO»n
uo
OO
o
OO
c/3
oo
T—H
en
oo
Active
Sprinkler
System
o2
1/3 c/3
<U o2
o
Door
Position
lUc/3
O
-a
1/3
ou
c&.O
clU
a.o
ca,O
£
CuX
rN m ^ in
79

Experiment 4 and 5 also showed the impact of ventilation on fire growth and development. In
Experiment 4, the first window pane completely vented open at 220 s after ignition, which
coincided with flashover. By 328 s after ignition, all three window panes were gone and flames
were venting out of the openings. In Experiment 5, the fire development was slower than that in
Experiment 4. The first window pane completely vented open at 331 s after ignition. It took
another 95 s for the other two window panes to self-vent, providing the dorm room with the
ventilation needed to achieve flashover. The fire behavior in Experiment 5 transitioned from a
fuel limited fire to an under-ventilated, fuel-rich condition, which resulted in reduced
temperatures in the dorm room. Once all of the window openings were completely vented open,
enough fresh oxygen could be drawn into the room to increase the heat release rate, resulting in
increased temperatures in the room and leading to flashover at approximately 440 s after
ignition, see Figure 3.5-1 and Figure 3.5-2.
The conditions in the corridor during Experiment 4 and 5 also provide insight into the conditions
that firefighters would face under near ideal natural ventilation conditions with ambient air being
introduced from the ends of the corridor while the flames and majority of the hot gases were
exhausted out of the open windows of the dorm room. The peak thermal conditions in the
corridor during two experiments, at approximately 0.9 m (3 ft) above the floor, were
approximately 75 °C (170 °F), with a total heat flux of approximately
2.5 kW/m^(0.22 BTU/ft^s).
80
5 Conclusions
This report describes a series of experiments in which fires were initiated in dormitory sleeping
rooms. These experiments were conducted by NIST in cooperation with the University of
Arkansas and the Fayetteville Fire Department with the support of the U.S. Fire Administration.
The experimental conditions were documented, including a description of the building geometry
and construction, the fuel load in the dorm rooms, and the location of the instrumentation used to
measure gas temperature, oxygen, carbon dioxide and carbon monoxide concentrations, and heat
flux. Smoke alarm activation and sprinkler activation times were also reported. Five
experiments were conducted. In two of the experiments, the door between the dorm room (room
of fire origin) and the corridor was closed, hi the other three experiments, the door from the
dorm room (room of fire origin) remained open to the corridor, hi each case, door closed or door
open, one of the experiments included an operating automatic fire sprinkler. The results from the
experiments comparing the sprinklered and non-sprinklered dorm rooms were presented, as well
as a comparison of the results from the open and closed corridor door experiments.
In each of the experiments the smoke alarm activated prior to the development of untenable
conditions in the room of origin, within 12 s to 26 s after ignition. In all of the experiments, the
smoke alarm sounded while the fire was limited to the first fuel ignited.
Experiment 1 and 2 were conducted with the dorm room door closed. In both of the closed door
experiments, the corridor remained tenable throughout the duration of the experiments.
Experiment 2 and 3 had active automatic fire sprinklers installed. The time between the
activation of the smoke alarm located in the dorm room and the activation of the automatic
sprinkler in the room was approximately 90 s in both experiments. In the sprinklered
experiments, tenability was maintained in the dorm room and the corridor.
Experiments 4 and 5 were conducted with the dorm room door open and no active sprinkler. In
both of these experiments, the tenability limits were exceeded in the dorm room and the corridor.
The results from these experiments demonstrate the potential life safety benefits of smoke alarms
for early detection and notification and automatic fire sprinkler systems for fire suppression and
life safety in college dormitories and similar occupancies. The benefit of a closed door between
the fire room and corridor in limiting the spread of smoke and gasses to other areas of the
building was also demonstrated.
81

6 References
1. Flynn, Jennifer D., Structure Fire in Dormitories, Fraternities, Sororities and Barracks.
National Fire Protection Association, Quincy. MA., August 2009.
2. Madrzykowski, D., Stroup, D.W., Walton, W.D., "Impact of Sprinklers on the Fire hazard in
Dormitories: Day Room Experiments," National Institute of Standards and Technology,
Gaithersburg, MD, June 2004.
3. Stroup, D.W., DeLauter, L.A., Lee, J.H., Roadarmel, G.L., "Large Fire Research Facility
(Building 205) Exhaust Hood Heat Release Rate Measurement System," NISTIR 6509,
National Institute of Standards and Technology, Gaithersburg, MD, July 2000.
4. Taylor, B.N. and Kuyatt, C.E., "Guidelines for Evaluating and Expressing the Uncertainty of
NIST Measurement Results," NIST TN 1297, National histitute of Standards and
Technology, Gaithersburg, MD, January 1994.
5. Omega Engineering Inc., The Temperature Handbook, Vol. MM, pages Z-39-40, Stamford,
CT., 2004.
6. Blevins, L.G., "Behavior of Bare and Aspirated Thermocouples in Compartment Fires",
National Heat Transfer (
Albuquerque, NM, 1999
National Heat Transfer Conference, SB"'' Proceedings. HTD99-280. August 15-17, 1999,
7. Pitts, W.M., E. Braun, R.D. Peacock, H.E. Mitler, E. L. Johnsson, P.A. Reneke, and
L.G. Blevins, "Temperature Uncertainties for Bare-Bead and Aspirated Thermocouple
Measurements in Fire Environments," Thermal Measurements: The Foundation ofFire
Standards. American Societyfor Testing and Materials (ASTM). Proceedings. ASTMSTP 1427. December 3, 2001, Dallas, TX.
8. Medtherm Corporation Bulletin 118, "64 Series Heat Flux Transducers", Medtherm
Corporation, Huntsville, AL., August 2003.
9. Pitts, William, M., Armageri V. Murthy, John L. de Ris, Jean-Remy Filtz, , Kjell Nygard,
Debbie Smith, and Ingrid Wetterlund. Round robin study oftotalflux gauge calibration
atfire laboratories. Fire Safety Journal 41, 2006, pp 459-475.
10. Bundy, M., Hamins, A., Johnsson, E.L., Kim, S.C., Ko, G.H., and Lenhart, D. B.,
"Measurements of Heat and Combustion Products in Reduced-Scale Ventilated-Limited
Compartment Fires", National Institute of Standards and Technology, Gaithersburg, MD.,
NISTTN 1483, July 2007.
11. Omega Engineering Inc., Flow, Level, and Environmental Handbook Omega Engineering
hic, Stamford, CT 2000
82

12. Ohaus Corporation, Manual for SD Series Bench Scale, Pine Brook, NJ., 2000.
13. Purser, David A., "Assessment of Hazards to Occupants from Smoke, Toxic Gases, and
Heat," SFPE Handbook ofFire Protection Engineering, 4' ed. DiNenno, P. J.,
Drysdale, D., Beyler, C.L., Walton, W. D., Custer, R.L.P., Hall J.R., Watts, J.M. (eds).
NFPA Quincy, MA, 2008.
83


