impact of sea surface temperature on cosmo forecasts of a ... · impact of sea surface temperature...
TRANSCRIPT

Journal of Earth Science and Engineering 5 (2015) 338-348 doi: 10.17265/2159-581X/2015.06.002
Impact of Sea Surface Temperature on COSMO
Forecasts of a Medicane over the Western
Mediterranean Sea
Vito Romaniello1, Paolo Oddo1, Marina Tonani1, Lucio Torrisi2, Alessandro Grandi1 and Nadia Pinardi3
1. Istituto Nazionale di Geofisica e Vulcanologia, Bologna 40128, Italy
2. National Center for Aeronautic Meteorology and Climatology, Pomezia (RM) 00071, Italy
3. Department of Physics and Astronomy, University of Bologna 40126, Italy
Abstract: The paper describes and analyzes the sensitivity of an operational atmospheric model to different SST (sea surface temperature) estimates. The model’s sensitivity has been analyzed in a Medicane (Mediterranean hurricane) test case. Numerical simulations have been performed using the COSMO (consortium for small-scale modeling) atmospheric model, in the COSMO-ME configuration. The model results show that the model is capable of capturing the position, timing and intensity of the cyclone. Sensitivity experiments have been carried out using different SSTs surface boundary conditions for the COSMO forecasts. Four different experiments have been carried out: the first two using SST fields obtained from the OSTIA (operational sea surface temperature and sea ice analysis) system, while the other two using the SST analyses and forecasts from MFS (Mediterranean Forecasting System, Tonani et al., 2015; Pinardi and Coppini, 2010). The different boundary conditions determine differences in the trajectory, pressure minimum and wind intensity of the simulated Medicane. The sensitivity experiments showed that a colder than real SST field determines a weakening of the minimum pressure at the vortex center. MFS SST analyses and forecasts allow the COSMO model to simulate more realistic minimum pressure values, trajectories and wind speeds. It was found that MFS SST forecast, as surface boundary conditions for COSMO-ME runs, determines a significant improvement, compared to ASCAT observations, in terms of wind intensity forecast as well as cyclone dimension and location. Key words: Mediterranean Sea, Medicane, atmospheric model, oceanic model.
1. Introduction
In recent years, the scientific community has started
to detect and analyze tropical-like cyclones in the
Mediterranean Sea [1]. The Mediterranean is a large
and sometimes warm body of water, thus it can be an
area of cyclogenesis influenced by convective
instability and air-sea interaction, producing cyclones
with some of the characteristics of hurricanes [2, 3].
The western Mediterranean Sea is an important
cyclogenetic area [4]. These cyclones are
characterized by strong winds and a pressure
minimum in the middle (calm eye). Such systems are
referred in the literature as Medicanes (Mediterranean
Corresponding author: Vito Romaniello, researcher, research field: air-sea interaction sciences. E-mail: [email protected].
Hurricanes) and are rare phenomena (only one or two
per year) [1, 5].
Since the early 1980s, satellite images have enabled
identification and structure analysis of cyclones. The
horizontal scale of cyclones ranges from some tens to
a few hundreds of kilometers, with typical lifetime of
about one to three days.
We analyzed the results of numerical simulations of
a Medicane, occurring over the western Mediterranean
Sea from 7 to 9 November 2011. The aim was to
understand the impact of air-sea interactions in the
maintenance/formation and the characteristics of the
cyclone. In recent hurricane-like cyclones in the
Mediterranean, convective instability has been shown
to play an important role [6]. The means by which
convective instability is produced has been the subject
D DAVID PUBLISHING

Impact of Sea Surface Temperature on COSMO Forecasts of a Medicane over the Western Mediterranean Sea
339
of many numerical studies examining the role of heat
and moisture fluxes rising from the Mediterranean Sea.
Some numerical experiments [7] illustrate that both
the surface heat and moisture fluxes are fundamental
for this type of hurricane-like cyclogenesis and they
play also an important role in the subsequent
development of the cyclone. Sensitivity simulations [8]
have highlighted the sea-air fluxes role in the
formation of the storm as well as the strong influence
of the latent heat release associated with convective
motions during its mature stage. It has been
hypothesized [9] that a hurricane-like cyclone can
intensify in a similar way to tropical cyclones.
2. The Meteorological Events
On 3 November 2011, a wide trough between the
British Isles and the Strait of Gibraltar produced a
pressure minimum near Ireland (Fig. 1a). The following
day, the trough moved eastward, approaching the
southern Mediterranean Sea and its axis tended to
rotate counter-clockwise, resulting in a split of the jet
bordering the trough. On November 5, the low
pressure of the trough almost split into an isolated
minimum, slowing down its eastward motion (Fig. 1c),
while an ascending branch of the polar jet, associated
with a negative anomaly in the high tropopause, was
further displaced toward the central Mediterranean
(not shown). This baroclinic structure caused a
marked area of instability in the central Mediterranean.
On November 6, the cyclonic depression disengaged
completely from the main mid-latitude westerly jet
producing a low cut-off between the Balearic Islands
and Sardinia (Fig. 1d). On November 7, the minimum
pressure tends widened horizontally and took on an
increasing barotropic structure, with the cloud cover
having the typical characteristics of tropical-like
cyclones. Fig. 2 shows the cloud cover evolution
captured by the Meteosat 9 satellite images in the IR
channel (10.8 micrometers).
These satellite images show the persistence of the
vortex throughout the first 12 hours of November 9,
when the Medicane progressively loses its intensity
and expires in the Gulf of Lyon.
The NOAA SSD (Satellite Service Division)
categorized this system as a 01M tropical storm
(http://www.ssd.noaa.gov/PS/TROP/DATA/2011/tdat
a/med/01M.html) to indicate that the cyclone is
“almost perfectly barotropic” and that the
Mediterranean Sea basin is capable of developing this
type of cyclone.
3. COSMO and MFS
The meteorological event described was simulated
using the COSMO (consortium for small-scale
modeling) atmospheric model which is a limited-area,
non-hydrostatic forecasting model (http://www.
cosmo-model.org/). It was designed both for
operational numerical weather prediction and various
scientific applications at meso-β (20-200 km) and
meso-γ scales (2-20 km). The basic version of the
COSMO model was designed at the German weather
service (DWD) and developments are carried out
within the consortium formed by the national
meteorological services of seven European countries:
Fig. 1 Geopotential height (500 hPa) from 3 to 8 November 2011 by ECMWF analyses at 12:00 (corresponding to a), …, f) panels).

Impact of Sea Surface Temperature on COSMO Forecasts of a Medicane over the Western Mediterranean Sea
340
Fig. 2 Meteosat 9 satellite observations in the infrared channel (10.8 micrometers) from 00:00 UTC on 6 November to 12:00 UTC on 9 November every 12 hours (corresponding to a), …, h) panels).
Germany, Greece, Italy, Poland, Romania, Russia and
Switzerland. Operational applications of the model
within COSMO mainly have a grid spacing of 1/16°
(about 7 km).
The Italian Meteorological Centre (CNMCA) uses
the configuration COSMO-ME which covers most of
Europe (Fig. 3) with a horizontal grid of 7 km and 40
vertical levels with a top at about 22 km. The model’s
time integration step is 60 seconds. The operational
integration of COSMO-ME is driven by the boundary
conditions provided by the IFS (integrated forecast
system) global model of ECMWF and is initialized
with atmospheric analysis fields produced by the
LETKF ensemble data assimilation system implemented
at CNMCA [10, 11]. Both IFS and COSMO-ME use
optimally interpolated SSTs (sea surface temperatures)
Fig. 3 Domain of the COSMO model in the COSMO-ME configuration.
from the OSTIA system (Operational Sea surface
Temperature and sea Ice Analysis [12]), which
includes satellites and in situ data. The initial SST
fields are kept constant as boundary conditions during
the COSMO-ME forecast time.
In this paper, SST forecast fields produced by the
MFS (Mediterranean forecasting system) will be also
used as initial and boundary conditions. MFS
(http://medforecast.bo.ingv.it/) is an operational
forecasting system [13-15] consisting of a near
real-time observation system with satellite and in situ
elements, a numerical ocean forecasting model at a
basin scale, based on a primitive equation model [16,
17], and a data assimilation scheme [18]. The MFS
spatial domain is shown in Fig. 4. The numerical
ocean model has a resolution of 1/16° × 1/16° on the
horizontal and 72 unevenly spaced vertical levels [16].
The system produces daily ten-day ocean forecasts
and ocean analyses using a daily assimilation cycle
[19, 20] where a different optimally interpolated SST
from satellites [21] is used to constrain the model
surface temperature.
4. Event Description Using COSMO-ME Forecasts: Dynamics, Heat Fluxes and Thermal Structure
COSMO-ME forecasts were used to detect the main
features of the vortex and its intensity from initial

Impact of Sea Surface Temperature on COSMO Forecasts of a Medicane over the Western Mediterranean Sea
341
stages. To classify the type of cyclone, the expected
wind speed at 10 meters and in particular the
maximum speed value in the area was considered. We
refer to the modified Saffir-Simpson hurricane
wind-scale (http://www.nws.noaa.gov/directives/sym/
pd01006004curr.pdf) to classify the cyclone.
The best estimate of maximum forecast wind was
obtained from three different 00 UTC operational runs
of the model for 6, 7 and 8 November (Fig. 5).
The Medicane can be classified as a tropical storm,
with maximum winds between 18 and 32 m/s in its
mature phase. The most intense phase of the vortex
lasted for about two and a half days from 00:00 UTC
on November 7 to 12:00 on November 9. The evolution
of the Medicane was characterized by a growth phase
of about 40-44 h, during which the maximum intensity
of the wind increased from 18 to 28 m/s, and by a
more rapid decrease of approximately 16-20 hours
Fig. 4 Domain and bathymetry (m) of the MFS model configuration.
Fig. 5 Wind maximum intensity (m/s) from 12:00 UTC on 6 November to 00:00 UTC on 10 November. Black horizontal lines mark the separation between different categories: tropical depression, tropical storm and hurricane category I.
with a maximum intensity that returned below the
threshold of 18 m/s.
The vortex trajectory was also calculated considering
the minimum pressure for the same period. The cyclone
became a tropical storm from the first hours of the day
on November 7, in the area south of the Balearic
Islands. Initially, the vortex moved from the Balearic
Islands to the north-east; thus it moved in an irregular
manner between parallels 41°-42° for several hours.
The minimum pressure was about 994 hPa at 15:00
UTC on 8 November. Finally, it moved a north-west
towards the Gulf of Lyon where, approaching the
coast, it gradually lost its intensity and died out. The
intensity of air-sea latent and sensible heat fluxes was
linked to differences between the SST and the low
level atmospheric air temperature.
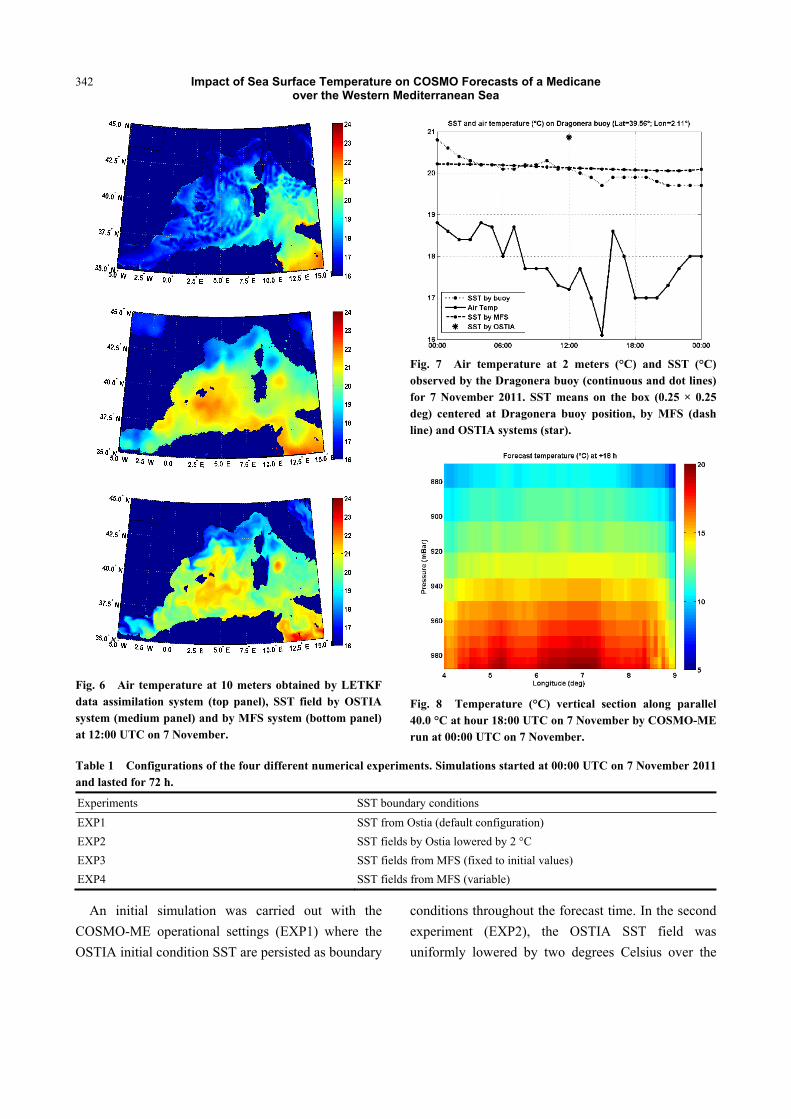
In the vortex growth phase, the sea surface was
quite warm, up to 21-22 °C in the area south of the
Balearic Islands (Fig. 6, medium and bottom panel).
For the same period, the 10-meters air temperature, as
obtained by LETKF data assimilation system, was
between 17 °C and 20 °C (Fig. 6, top panel), creating
an air-sea temperature difference of 1-5 °C.
The temporal variability of the air-sea temperature
differences was monitored from data collected by the
Dragonera buoy (Lat. = 39.56 °C; Lon. = 2.11 °C)
from Puertos del Estado (Spain) [22]. The SST values
measured from buoy are consistent with the SST
forecast values produced by MFS (Fig. 7).
This notable air-sea temperature difference created
large heat fluxes from the sea surface, which thereby
maintained the vortex. The vertical thermal structure
of the cyclone was characterized by a surface warm
core, which is a characteristic structure of tropical-like
cyclones (Fig. 8).
5. SST Sensitivity Studies: Trajectory and Heat Fluxes
In order to assess the impact of different SST
estimates on the formation and maintenance of the
vortex itself, four different simulations were performed
using COSMO-ME (Table 1).
Impact of Sea Surface Temperature on COSMO Forecasts of a Medicane over the Western Mediterranean Sea
342
Fig. 6 Air temperature at 10 meters obtained by LETKF data assimilation system (top panel), SST field by OSTIA system (medium panel) and by MFS system (bottom panel) at 12:00 UTC on 7 November.
Fig. 7 Air temperature at 2 meters (°C) and SST (°C) observed by the Dragonera buoy (continuous and dot lines) for 7 November 2011. SST means on the box (0.25 × 0.25 deg) centered at Dragonera buoy position, by MFS (dash line) and OSTIA systems (star).
Fig. 8 Temperature (°C) vertical section along parallel 40.0 °C at hour 18:00 UTC on 7 November by COSMO-ME run at 00:00 UTC on 7 November.
Table 1 Configurations of the four different numerical experiments. Simulations started at 00:00 UTC on 7 November 2011 and lasted for 72 h.
Experiments SST boundary conditions
EXP1 SST from Ostia (default configuration)
EXP2 SST fields by Ostia lowered by 2 °C
EXP3 SST fields from MFS (fixed to initial values)
EXP4 SST fields from MFS (variable)
An initial simulation was carried out with the
COSMO-ME operational settings (EXP1) where the
OSTIA initial condition SST are persisted as boundary
conditions throughout the forecast time. In the second
experiment (EXP2), the OSTIA SST field was
uniformly lowered by two degrees Celsius over the

Impact of Sea Surface Temperature on COSMO Forecasts of a Medicane over the Western Mediterranean Sea
343
domain and the same settings of EXP1 were used. In
EXP3, the MFS initial analysis SST field was used
and kept fixed as surface boundary conditions
throughout the forecast time. In the last experiment
(EXP4), the MFS forecast SST fields were imposed
every three hours and linearly interpolated for each
model time step during the COSMO-ME forecast time.
The Medicane trajectory, defined as the position of
the pressure minimum, was monitored for 48 hours
starting from 12:00 UTC on November 7, at six hours
intervals, until 12:00 UTC on November 9.
Trajectories resulting by EXP1, EXP2, EXP3 and
EXP4 experiments are shown in Fig. 9 with respect to
the NOAA trajectory analysis (http://www.ssd.noaa.
gov/PS/TROP/DATA/2011/tdata/med/01M.html).
The forecast trajectory for the first 24 hours is quite
similar for all four experiments (Fig. 9) and the
difference respect to NOAA analysis is contained in
30-40 km (Fig. 10).
The trajectories for experiments EXP3 and EXP4
deviate significantly from the EXP1 trajectory for the
next 24 hours, better reproducing the NOAA analysis,
with a maximum difference of about 100 km. Thus,
EXP3 and EXP4 trajectories are significantly different,
compared to EXP1, in the Gulf of Lyon area. Such
differences are attributable to the different SST fields
used as boundary conditions for the COSMO-ME
model (see also Fig. 6). The average SST in the Gulf
of Lyon is 16.7 °C and 18.8 °C for experiments EXP1
and EXP3, respectively (domain of average: 41° < Lat.
< 44°, 3.0° < Lon. < 7.0°). This temperature
difference of about 2 °C determines notable
differences in surface heat fluxes.
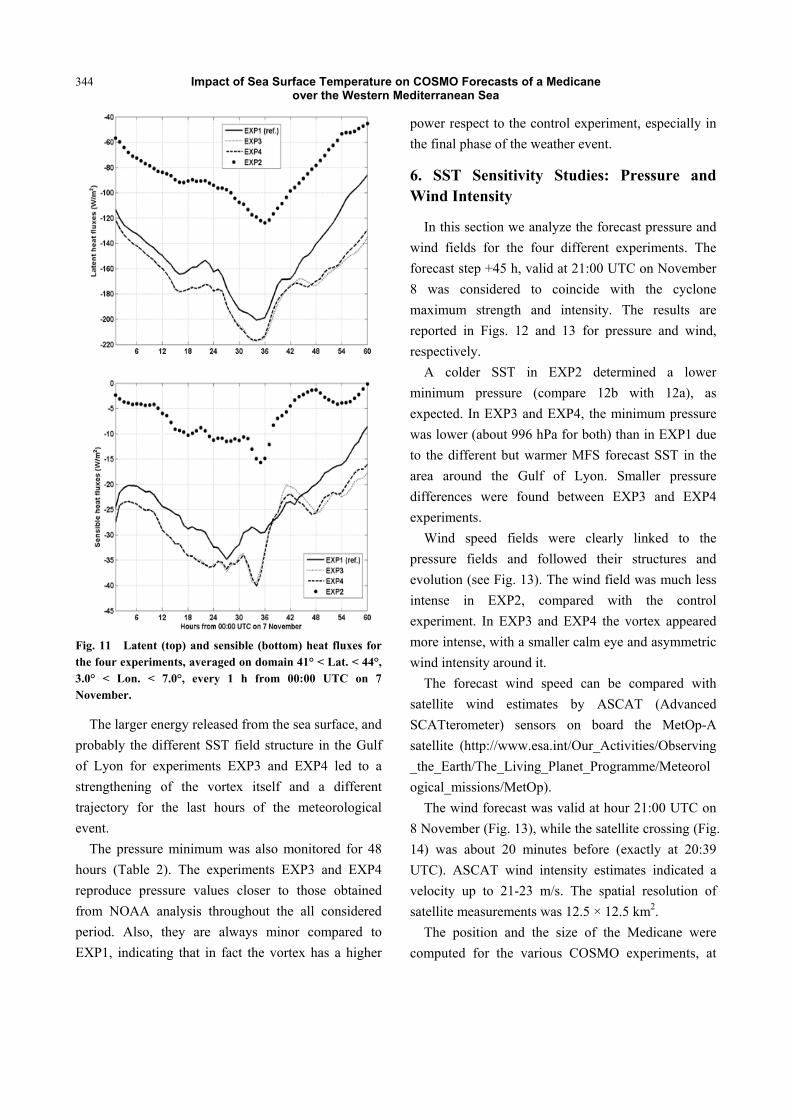
COSMO-ME latent and sensible heat fluxes are
displayed for the four different experiments on the
previous spatial area in Fig. 11, where the negative
values indicate heat flux from the sea to the air. Heat
fluxes for EXP2 are much smaller than in the
reference EXP1 due to the smaller absolute value of
SST imposed. There is a difference up to 100 W/m2
and 35 W/m2 for latent and sensible heat fluxes,
Fig. 9 Trajectories from 12:00 UTC on 7 November every 6 h until 12:00 UTC on 9 November, for the four different COSMO experiments with respect to the NOAA analysis: EXP1 (a), EXP2 (b), EXP3 (c) and EXP4 (d).
Fig. 10 Distances (km) of the pressure minimum positions respect to NOOA analysis, every 6 h from 00:00 UTC on 7 November.
respectively. Heat fluxes of EXP3 and EXP4 were
substantially more intense than in EXP1 for the last
part of the meteorological event. There is a difference
up to 50 W/m2 and 8-10 W/m2 for latent and sensitive
heat fluxes, respectively.
Impact of Sea Surface Temperature on COSMO Forecasts of a Medicane over the Western Mediterranean Sea
344
Fig. 11 Latent (top) and sensible (bottom) heat fluxes for the four experiments, averaged on domain 41° < Lat. < 44°, 3.0° < Lon. < 7.0°, every 1 h from 00:00 UTC on 7 November.
The larger energy released from the sea surface, and
probably the different SST field structure in the Gulf
of Lyon for experiments EXP3 and EXP4 led to a
strengthening of the vortex itself and a different
trajectory for the last hours of the meteorological
event.
The pressure minimum was also monitored for 48
hours (Table 2). The experiments EXP3 and EXP4
reproduce pressure values closer to those obtained
from NOAA analysis throughout the all considered
period. Also, they are always minor compared to
EXP1, indicating that in fact the vortex has a higher
power respect to the control experiment, especially in
the final phase of the weather event.
6. SST Sensitivity Studies: Pressure and Wind Intensity
In this section we analyze the forecast pressure and
wind fields for the four different experiments. The
forecast step +45 h, valid at 21:00 UTC on November
8 was considered to coincide with the cyclone
maximum strength and intensity. The results are
reported in Figs. 12 and 13 for pressure and wind,
respectively.
A colder SST in EXP2 determined a lower
minimum pressure (compare 12b with 12a), as
expected. In EXP3 and EXP4, the minimum pressure
was lower (about 996 hPa for both) than in EXP1 due
to the different but warmer MFS forecast SST in the
area around the Gulf of Lyon. Smaller pressure
differences were found between EXP3 and EXP4
experiments.
Wind speed fields were clearly linked to the
pressure fields and followed their structures and
evolution (see Fig. 13). The wind field was much less
intense in EXP2, compared with the control
experiment. In EXP3 and EXP4 the vortex appeared
more intense, with a smaller calm eye and asymmetric
wind intensity around it.
The forecast wind speed can be compared with
satellite wind estimates by ASCAT (Advanced
SCATterometer) sensors on board the MetOp-A
satellite (http://www.esa.int/Our_Activities/Observing
_the_Earth/The_Living_Planet_Programme/Meteorol
ogical_missions/MetOp).
The wind forecast was valid at hour 21:00 UTC on
8 November (Fig. 13), while the satellite crossing (Fig.
14) was about 20 minutes before (exactly at 20:39
UTC). ASCAT wind intensity estimates indicated a
velocity up to 21-23 m/s. The spatial resolution of
satellite measurements was 12.5 × 12.5 km2.
The position and the size of the Medicane were
computed for the various COSMO experiments, at

Impact of Sea Surface Temperature on COSMO Forecasts of a Medicane over the Western Mediterranean Sea
345
Table 2 Pressure minimum by the four different numerical experiments and NOAA analysis.
12 18 00 06 12 18 00 06 12
EXP1 1001 1001 999 999 1000 1001 1003 1006 1010
EXP2 1002 1003 1001 1002 1003 1006 1010 1013 1016
EXP3 1001 1001 998 997 996 995 996 999 1002
EXP4 1001 1001 998 997 996 995 997 1000 1003
ANALYSIS - 997 991 991 991 991 991 1000 1006
Fig. 12 Forecast mean sea level pressure (hPa) at 21:00 UTC on 8 November for EXP1 (a), EXP2 (b), EXP3 (c) and EXP4 (d) experiments.
Fig. 13 Forecast wind intensity (m/s) at 21:00 UTC on 8 November for EXP1 (a), EXP2 (b), EXP3 (c) and EXP4 (d) experiments.

Impact of Sea Surface Temperature on COSMO Forecasts of a Medicane over the Western Mediterranean Sea
346
Fig. 14 Wind intensity estimate (m/s) from ASCAT sensors on board of MetOp-A satellite at 20:39 UTC on 8 November 2011.
21:00 UTC, and compared with the ASCAT
measurements. The size of a tropical-like cyclone is
difficult to define objectively; different definitions are
currently used by researchers and operational weather
forecasters [23]. In the following, the cyclone size was
defined as the radius of the area with wind speeds
larger than 15 m/s.
For EXP1, EXP3 and EXP4, the mean sizes were
similar, in the range 125-130 km (see Table 3)
consistent with the ASCAT data if an error
corresponding to the 12.5 km bins is considered for
ASCAT and the grid size of 7 km for the
COSMO-ME data. The difference in longitude was
about 1 deg for EXP1 but only 0.6 deg for EXP4 and
the ASCAT estimate. Thus mean size and position of
the cyclone are best depicted by EXP4.
To characterize the wind horizontal structure, Fig.
15 shows normalized histograms of wind intensity at
21:00 UTC on November 8 for the region of the Gulf
of Lyon. The wind intensity is subdivided into classes
of 1 m/s and the number of events is reported as a
percentage with respect to the total number of events.
The modal values are 11, 13 and 16 m/s
respectively for EXP1, EXP4 and ASCAT. The
histogram for EXP1 is wider and more symmetric
than EXP4 and ASCAT, with a modal value that
occurs in about 10% of the cases (14% and 13% for
the EXP4 and ASCAT, respectively). ASCAT data
show a smaller tail for high values of wind speed. In
general, the comparison shows that the velocity
distribution in EXP4 is more similar to ASCAT.
7. Conclusions
A sensitivity study of an operational atmospheric
forecast model, COSMO-ME, with different SST
estimates and impositions was carried out. The
sensitivity of the model was studied for a Medicane
(Mediterranean Hurricane) test case, observed over
the western Mediterranean Sea from November 7 to 9,
2011. ASCAT wind estimates by MetOp-A satellite
indicated an intensity up to 21-23 m/s. Four different
forecasts, using different SST fields, were carried
out with the COSMO atmospheric model. The
operational SST used as initial surface and boundary
conditions from OSTIA optimally interpolated
analyses (EXP1) was compared with SST from MFS
analyses (EXP3) and forecasts (EXP4). The numerical
simulations identified the most intense phase of the
vortex from 00:00 UTC on November 7 to 12:00 on
November 9, for about two and a half days. For this
period, the Medicane can be classified as a tropical
storm with maximum winds between about 20 and
30 m/s.
The different SSTs impacted the trajectory of the
vortex, changing its direction especially in the last part
Table 3 Positions and sizes of the Medicane for the four COSMO-ME experiments (at 21:00 UTC) and for the ASCAT satellite measurements (at 20:39 UTC).
Experiments Lat (deg) Lon (deg) Mean radius (km)
EXP1 42.405° 5.342° 126
EXP2 42.577° 4.989° 117
EXP3 42.352° 5.601° 128
EXP4 42.352° 5.601° 129
ASCAT 42.230° 6.285° 144

Impact of Sea Surface Temperature on COSMO Forecasts of a Medicane over the Western Mediterranean Sea
347
Fig. 15 Histograms (% of total number) of wind for EXP1 (top), EXP4 (middle) and ASCAT (bottom) at 21:00 UTC on 8 November for the model and 20:39 UTC for the ASCAT observations.
of the meteorological event, with EXP3 and EXP4
better reproducing the NOAA trajectory analysis.
Latent and sensible heat flux intensities varied up to
10 and 50 W/m2 respectively, in the experiments
EXP1, EXP3 and EXP4. The major heat fluxes in
EXP3 and EXP4 determined a minimum pressure
lower than in EXP1, according with NOAA analysis.
The wind intensity and its horizontal distribution is
however the major difference between EXP1 and
EXP4, with the latter better reproducing the ASCAT
data. The mean size of the vortex, in the range of
125-130 km, was quite similar between the
experiments EXP1, EXP3 and EXP4.
Our results highlight that the type and value of the
SST boundary conditions play an important role in
determining the distribution of forecast wind
velocities, minimum pressure and location of the
cyclone eye. A three-hour forecast SST from the
operational MFS ocean forecasting model seems to
increase the accuracy of Medicane forecasts with
respect to all other measurements currently available.
Acknowledgments
This work was supported by the European
Commission My Ocean 2 Project
(FP7-SPACE-2011-1-Prototype Operational
Continuity for the GMES Ocean Monitoring and
Forecasting Service, GA 283367) and by the Italian
Project RITMARE, la RIcercai Taliana per il MARE
(MIUR-Progetto Bandiera 2012-2016).
References
[1] Fita, J., Jansa, A., and Genoves, A. 2007. “Analysis of the Environments of Seven Mediterranean Tropical-Like Storms Using an Axisymmetric, Nonhydrostatic, Cloud Resolving Model.” Nat. Hazards Earth Syst. Sci. 7: 41-56.
[2] Reale, O., and Atlas, R. 2001. “Tropical Cyclone-Like Vortices in the Extratropics: Observational Evidence and Synoptic Analysis and Effects.” Amer. Meteor. Soc. 16: 7-34.
[3] Moscatello, A., Miglietta, M. M., and Rotunno, R. 2008. “Numerical Analysis of a Mediterranean ‘Hurricane’ over Southeastern Italy.” Amer. Meteor. Soc. 136: 4373-97.
[4] Campins, J., Jansa, A., and Genoves, A. 2006. “Three-Dimensional Structure of Western Mediterranean Cyclones.” Int. J. Climatol. 26: 323-43.

Impact of Sea Surface Temperature on COSMO Forecasts of a Medicane over the Western Mediterranean Sea
348
[5] Cavicchia, L., Von Storch, H., and Gualdi, S. 2013. “A Long-Term Climatology of Medicanes.” Clim. Dyn. 43 (5-6): 1183-95.
[6] Homar, V., Romero, R., Stensrud, D., Ramis, C., and Alonso, S. 2003. “Numerical Diagnosis of a Small, Quasi-Tropical Cyclone over the Western Mediterranean: Dynamical vs. Boundary Factors.” Q. J. R. Meteorol. Soc. 129: 1469-90.
[7] Pytharoulis, I., Craig, G. C., and Ballard, S. P. 2000. “The Hurricane-Like Mediterranean Cyclone of January 1995.” Meteor. Appl. 7: 261-79.
[8] Miglietta, M. M., Moscatello, A., Conte, D., Mannarini, G., Lacorata, G., and Rotunno, R. 2011. “Numerical Analysis of a Mediterranean ‘Hurricane’ over South-Eastern Italy: Sensitivity Experiments to Sea Surface Temperature.” Atmos. Res. 101: 412-26.
[9] Emanuel, K. 2005. “Genesis and Maintenance of Mediterranean Hurricanes.” Adv. Geosci 2: 217-20.
[10] Bonavita, M., Torrisi, L., and Marcucci, F. 2008. “The Ensemble Kalman Filter in an Operational Regional NWP System: Preliminary Results with Real Observations.” Q. J. R. Meteorol. Soc. 134: 1733-44.
[11] Bonavita, M., Torrisi, L., and Marcucci, F. 2010. “Ensemble Data Assimilation with the CNMCA Regional Forecasting System.” Q. J. R. Meteorol. Soc. 136: 132-45.
[12] Donlon, C. J., Martin, M., Stark, J. D., Roberts, J. J., Fiedler, E., and Wimmer, W. 2011. “The Operational Sea Surface Temperature and Sea Ice Analysis (OSTIA).” Remote Sensing of the Environment 116: 140-58.
[13] Tonani, M., Balmaseda, M., Bertino, L., Blockley, E., Brassington, G., Davidson, F., Drillet, Y., Hogan, P., Kuragano, T., Lee, T., Mehara, A., Paranathara, F., Tanajiura, C. A. S., and Wang, H. 2015. “Status and Future of Global and Regional Ocean Prediction Systems.” Journal of Operational Oceanography 2 (2): 201-20.
[14] Pinardi, N., Allen, I., Demirov, E., De Mey, P., Korres, G., Lascaratos, A., Le Traon, P. Y., Maillard, C., Manzella, G., and Tziavos, C. 2003. “The Mediterranean Ocean Forecasting System: First Phase of
Implementation (1998-2001).” Annales Geophysicae 21: 3-20.
[15] Pinardi, N., and Coppini, G. 2010. “Operational Oceanography in the Mediterranean Sea: The Second Stage of Development.” Ocean Sci. 6: 263-7.
[16] Tonani, M., Pinardi, N., Dobricic, S., Pujol, I., and Fratianni, C. 2008. “A High-Resolution Free-Surface Model of the Mediterranean Sea.” Ocean Sci. 4: 1-14.
[17] Oddo, P., Bonaduce, A., Pinardi, N., and Guarnieri, A. 2014. “Sensitivity of the Mediterranean Sea Level to Atmospheric Pressure and Free Surface Elevation Numerical Formulation in NEMO.” Geosci. Model Dev. 7: 3001-15.
[18] Dobricic, S., and Pinardi, N. 2008. “An Oceanographic Three-Dimensional Variational Data Assimilation Scheme.” Ocean Modelling 22: 89-105.
[19] Dobricic, S., Pinardi, N., Adani, M., Tonani, M., Fratianni, C., Bonazzi, A., and Fernandez, V. 2007. “Daily Oceanographic Analyses by the Mediterranean Basin Scale Assimilation System.” Ocean Sciences 3: 149-57.
[20] Tonani, M., Pinardi, N., Fratianni, C., Pistoia, J., Dobricic, S., Pensieri, S., De Alfonso, M., and Nittis, K. 2009. “Mediterranean Forecasting System: Forecast and Analysis Assessment through Skill Scores.” Ocean Sci. 5: 649-60.
[21] Buongiorno, N. B., Larnicol, G., D'Acunzo, E., Santoleri, R., Marullo, S., and Le Traon, P. Y. 2003. “Near Real Time SLA and SST Products During 2-years of MFS Pilot Project: Processing, Analysis of the Variability and of the Coupled Patterns.” Annales Geophysicae 21: 103-21.
[22] Alvarez, F. E., Alfonso, M., Ruiz, M. I., Lopez, J. D., and Rodriguez, I. 2002. “Real Time Monitoring of Spanish Coastal Waters: The Deep Water Network.” In: Proceedings of the Third International Conference on EuroGOOS, Athens, Greece.
[23] Liu, K. S., and Chan, J. C. L. 1999. “Size of Tropical Cyclones as Inferred from ERS-1 and ERS-2 Data.” Mon. Wea. Rev. 127: 2992-3001.