impact of school-wide positive behavior supports on ... · impact of school-wide positive behavior...
TRANSCRIPT

RMLE Online— Volume 37, No. 8
© 2014 Association for Middle Level Education 11
Dan Bauer, Ph.D., Editor Joanne L. Previts, Ph.D., Editor Georgia Southern University Georgia College Statesboro, Georgia Milledgeville, Georgia
2014 • Volume 37 • Number 8 ISSN 1940-4476
Impact of School-wide Positive Behavior Supports on Student Behavior in the Middle Grades
Edmund J. Nocera University of Saint Joseph West Hartford, CT
Kathleen M. Whitbread University of Saint Joseph
Gene P. Nocera Saint Anthony School Bristol, CT
Abstract
Research shows that school-wide positive behavior supports (SWPBS) can be an effective alternative to traditional reactive, punitive approaches to problem behavior. However, few studies examine the use of the approach as part of a comprehensive school improvement process involving academic as well as behavioral goals, particularly with regard to use of data-driven decision making and data teams. This article describes the efforts of a low-performing middle school in establishing preventative measures and interventions within such a framework. Results indicate a reduction in teacher discipline referrals and student suspensions, including those involving students with disabilities and statistically significant improvement on 30 of 47 items of a school climate and student resiliency survey. In addition, school scores on state mastery tests in both reading and math improved by 25% and 11%, respectively. This study suggests that the implementation of a SWPBS framework may result in improved academic and behavioral outcomes for all students.
In the 1990s, many schools across the country adopted a zero-tolerance disciplinary philosophy designed to impose stricter sanctions on youth, which led to a dramatic increase in out-of-school suspensions and expulsions. Unfortunately, no evidence indicates that suspension and expulsion lead to positive changes in student behavior or safer schools (Skiba, 2000). In addition, studies have uncovered racial, socioeconomic, and gender disparities in rates of suspension and expulsion (Achilles, McLaughlin, & Croninger, 2007; Fremon, & Renfrow-Hamilton, 2001). Students with disabilities are more likely to be suspended than their non-disabled peers (Krezmien, Leone, & Achilles, 2006; Whitbread, Feinstein, Bruder, Fleming, & Kechijian, 2007). High suspension and expulsion rates are associated with lower academic achievement (Arcia, 2006; Brown, 2007; Skiba & Rausch, 2006) and with higher rates of involvement in the juvenile justice system (Skiba, 2008).
RMLE Online— Volume 37, No. 8
© 2014 Association for Middle Level Education 2
Research studies show that school-wide positive behavior supports (SWPBS) are an effective alternative to reactive, punitive policies and result in safer schools and increased academic achievement of students (Skiba & Sprague, 2008; Warren et al., 2006). In a middle school environment defined by its ideal notion of student-centeredness, development of the whole child, responsiveness to the unique needs of individuals, and democratic structure, SWPBS may be an essential model for school leaders seeking the development of a true middle school. Indeed, a randomized controlled study of the effectiveness of school-wide positive behavior supports in elementary schools in two states by Horner and colleagues (2009) found that the implementation of SWPBS resulted in an improved sense of school safety as well as an increase in the number of students meeting or exceeding state academic standards. For example, a five-year longitudinal study of SWPBS conducted in 37 elementary schools found that implementation of a SWPBS model resulted in fewer student suspensions and office discipline referrals (Bradshaw, Reinke, Brown, Bevans, & Leaf, 2008). Factors that contribute to the success of SWPBS include: (a) promotion of social and academic competence in students; (b) a whole-school approach that engages students, staff, and families; (c) ongoing training of staff to develop and sustain practices with fidelity; (d) the use of evidence-based interventions and supports; (e) a team approach with leadership at all levels; and (f) the use of data to continually evaluate and revise practices (Sugai et al., 2010).
The theories that underpin SWPBS are based on long-standing, proven practices in the fields of education and behavior, including applied behavior analysis, differentiated instruction, and data-based decision making (Horner, Sugai, & Anderson, 2010). SWPBS is consistent with the Response to Intervention (RTI) model, a multi-tiered system for addressing the needs of all students and preventing school failure (Sugai & Horner, 2009). Key elements of RTI include:
1. High-quality, research-based core general education instruction in all academic areas
2. A comprehensive school- or district-wide system of teaching and supporting positive behavior
3. Differentiated instruction for all learners, including English language learners (ELLs) and students who are not meeting grade level expectations
4. Progress monitoring of all students using common assessments
5. Early intervention for students experiencing academic and/or behavioral difficulties
6. Data-driven decision making through the use of data teams
RTI provides a continuum of support within the general education system that increases in intensity and individualization to meet the needs of students (Connecticut State Department of Education, 2008).
SWPBS is typically organized into three tiers. At Tier 1, instruction and support is provided for all students. Behavioral expectations are communicated to students in a clear, positive way. Systems are in place to encourage appropriate behavior and to monitor students’ behavioral performance. For those students who are not responsive to this core instruction and support, Tier II interventions provide more structured or more intensive interventions. Finally, Tier III interventions are designed for students whose behaviors are not responsive to Tiers I or II and who require more intensive, individualized behavior supports (Sugai & Horner, 2009).
School Improvement Framework
This article describes a school improvement/reform framework that shows promise in supporting teachers to achieve successful academic and behavioral outcomes for all students, including those with disabilities. The focus of the study was a low-performing middle school in Connecticut that used such a framework successfully to improve academic and social competence.
Connecticut school districts are divided into nine groups called District Reference Groups (DRGs). Similar districts are grouped together in a DRG, labeled with the letters A through I, based on indicators of student need, socioeconomic status and district size. The most affluent and low-need districts, as measured by these indicators, are grouped in DRG A, while the poorest and highest-need districts—including Connecticut’s five largest cites—are grouped in DRG I. Central City (pseudonym), the focus of this article, is grouped with 16 other districts in DRG G, which, of the nine total statewide groups, is the third lowest group based on three socio-economic factors and three additional indicators of need. The socioeconomic factors include median

RMLE Online— Volume 37, No. 8
© 2014 Association for Middle Level Education 3
family income, parental education, and parental occupation. The additional three indicators of need are percentage of children living in families with a single parent, the percentage of public school students eligible to receive free or reduced-price meals, and the percentage of children whose families speak a language other than English at home (Connecticut Voices, 2006).
The framework described in this article focused on school-wide change through a systematic approach that addressed and coordinated the various aspects of the school, including curriculum and instruction, governance, professional development, and the involvement of parents and families (Kidron & Darwin, 2007; Anderberg, 2008). A driving force in the improvement model was the use of data teams (Anderberg, 2008; Reeves, 2004)—small grade- or department-level teams that examine individual student work generated from common formative assessment (Besser, Anderson-Davis, & Perry, 2008). Data teams operate at all levels in the school system: district, school, and instructional grade level or course. Feedback flows from level to level and recycles back again. Accountability measures are built into each level. Applying this approach requires four key steps outlined below and consideration of two critical variables (student characteristics and standards, described later) (Anderberg, 2008).
Step 1: Establish Goals/Identify Standards The District Data Team is assembled with teacher, parent, union, and Board of Education representatives. At this stage, a district improvement plan is established and priority standards are identified.
Step 2: Develop School Improvement PlanThe School Data Team develops the school improvement plan based on student data in line with goals of the district improvement plan and priority standards. Student data includes student achievement results from various measurements. Goals set are ‘S.M.A.R.T’: Specific, Measurable, Achievable, Relevant and Timely (Besser et al., 2008).
Step 3: Develop Assessment/Implement Teaching Strategies The Instructional Data Team develops common formative assessments and implements effective teaching strategies and performance-based assessments to meet priority standards based on student data.
Step 4: Loop FeedbackFeedback emanating from the grade level/course data teams flows back through the school data team to the district data team.
Variable 1: Student CharacteristicsDeveloping a positive school climate and selecting effective teaching strategies must relate to the specific nature of each district, of each classroom, and of the students in those districts and classrooms. A number of research-based options exist to improve school climate. In Connecticut, training is available through the State Department of Education on a variety of practices using a “train-the-trainers” model, in which state consultants provide targeted professional development on designated topics to enable team leaders to train subject area teachers in the school (Connecticut State Department of Education, 2010). Team leaders then take knowledge gained through this training and apply it at team meetings over the course of a two-year period. Central City School District participated in training in a number of school climate change options and, based on the characteristics of the district and its student body, selected Positive Behavior Supports (PBS) as the primary vehicle to be used for improving school climate. Research has shown a strong link between school social climate and student behavior (Hopson & Lee, 2011; Lo et al., 2011; White & Warfa, 2011).
The district also participated in training on research-based instructional strategies focused on improving academic achievement. Specific strategies in each of Marzano’s nine categories from The Art and Science of Teaching (Marzano, 2007) and other strategies were shared with participants who were asked to apply each of the strategies to current lessons and to the development of future unit and lesson plans based on the student needs and characteristics.
Variable 2: StandardsTraining was provided to teachers and administrators on how to identify and “unwrap” priority standards to determine what students must be able to know and do relative to the curriculum. A guiding question for identifying priority standards is: “What do our students need to know and be able to do to be successful in life?” Related to identification of priority standards is the use of Common Formative Assessments (CFAs). CFAs are designed collaboratively by grade level teams to focus on priority standards. They are administered on a periodic basis to all students in a grade level or

RMLE Online— Volume 37, No. 8
© 2014 Association for Middle Level Education 4
course, and data teams analyze the resulting data to inform instruction (Ainsworth & Viegut, 2006).
During training, participants analyzed student assessment results in data teams to plan for differentiated instruction. Participants learned to develop a blend of assessment item types, including selected response (multiple choice, true/false, matching) and constructed response (short or extended). Finally, participants worked collaboratively to design common formative pre- and post-assessments aligned to one another to assess student understanding of the concepts, skills, and big ideas from the unwrapped priority standards (Ainsworth & Viegut, 2006).
Implementation of the School Improvement Framework
Roosevelt Middle School (pseudonym) serves a population of approximately 750 students in grades 7 and 8. At the time of the study, more than 50% of students in the school received free or reduced-price meals. In addition, 40% of students were classified as members of minority groups. During the 2007–2008 school year, Roosevelt Middle School and the Central City School District participated in a mandated district improvement process for those districts that had been identified as needing improvement, as a result of not making adequate yearly progress for five consecutive years. During the previous academic year (2006–2007), a survey was administered to Roosevelt Middle School students in grades 7 and 8 by a researcher unrelated to the present study. The survey, which has been used extensively by the Iowa Department of Education, sought feedback to 47 survey questions related to school climate and student resiliency (Conger et al., 2011). Results of the 2007 survey indicated that, overall, students did not feel empowered in their school. For example, survey items receiving relatively low rankings by the students included; “Adults in the school listen to the student’s side of the story” and “I have enough say in deciding what I should learn.” In the first step of developing a school improvement plan, the district data team used these data, along with data provided to the district by the state department of education, to establish goals related to two need areas: academic achievement and school climate (Step 1).
A school data team was established at Roosevelt Middle School during the 2008–2009 school year (Step 2). The school data team undertook a review of data from multiple sources. Teams at each grade
level reviewed these data and (Step 3) completed a school climate strengths and weaknesses summary for each grade level. The school data team studied the results and generated solutions to address each weakness. One proposed solution was to improve consistent implementation of scientific, research-based behavioral supports and interventions. Parent involvement was sought in the needs assessment/data analysis phase through creation of a compact that included parent, student, and staff pledges to be supportive of one another in carrying out their respective roles. In the needs assessment/data analysis phase, information flowed downward from district data team to school data team to instructional data team as improvement plans at each level were established in accordance with standards set at the district level (Step 4).
Roosevelt Middle School selected Positive Behavior Supports (PBS) from an array of options presented during the State Department of Education training as the method of choice for improving school climate. The PBS model is consistent with RTI. Accordingly, a continuum of behavior supports and interventions was provided at the school/classroom level for all students, specialized group level supports for students at risk for problem behavior (10–15%), and specialized, individualized supports for students with chronic problem behavior (5–10%). A strong emphasis was placed on the knowledge that the 5–10% of students with chronic behavioral challenges (Tier III) had needs that were linked to the whole-school environment. The data team process allowed educators to focus specific attention on this tier of the student population to address significant and chronic behavior problems.
The school-wide positive behavior supports (SWPBS) system (Tier I) included a positive reward system, whereby students earned certificates for pro-social behavior that could be exchanged for rewards. The aim was to provide visible acknowledgement of desirable behavior related to school expectations. This system is referred to as “P.R.I.D.E. Cards for Students.” P.R.I.D.E. cards are given to any student by any teacher when a student has demonstrated Pride, Respect, Integrity, Determination, or Excellence. Students were taught the specific behaviors that demonstrated each element of the school’s behavioral expectations, and this instruction was differentiated for students who might require more concrete or detailed information about, for example, how to demonstrate pride in your school when in the lunchroom or what it means to be respectful in class.
RMLE Online— Volume 37, No. 8
© 2014 Association for Middle Level Education 5
The school principal conducted in-service training with all of the teachers on logical and natural consequences of behavior based on the work of Dreikurs and colleagues (Dreikurs & Cassel, 1972; Dreikurs, Grumwald, & Pepper, 1982; Malmgren, Trezek, & Paul, 2005). The training was based on the premise that problem behavior continues because it serves a function for the student. For example, “disruptive behavior” could represent an underlying desire for attention. Based on an in-depth analysis, effective responses were developed, coupled with strategies for teaching students appropriate replacement behaviors to meet their underlying needs. The in-service used case studies to adapt boiler plate plans to the individual needs of specific students.
The staff also attended a two-day seminar on improving school climate to support student behavior and achievement. This seminar emphasized creating and maintaining a physically, emotionally, and intellectually safe learning environment. In response to the seminar, the school made changes to the daily routines for staff and students. Teachers increased their visibility in the hallways before school, between classes, and after the final bell to provide students with a sense of security and to build positive rapport. The school discipline policy was revised to outline infractions in clear measurable terms and to detail the resulting consequences for each infraction. In support of the revised policy, a Friday detention plan was implemented, which substituted community service for the conventional “sit and work silently” model. A revised homework policy was also developed and shared with parents, who signed a copy of the policy to signify agreement and support for the policy. In addition, district personnel developed a critical five-step process for teachers to employ prior to making an office discipline referral. These steps offered a continuum of preventative actions to reduce the need for office discipline referrals while assisting students to develop pro-social behavior. The steps included:
1. Increasing awareness—Teachers will be observant of student behavior in all areas of the school and offer students the opportunity to correct behavior before it becomes problematic.
2. Staff will conference with students, as needed, to review school-wide expectations and to help students shape their behavior to comply with behavioral expectations.
3. If Steps 1 and 2 are ineffective, the student will be given detention, and the student’s parent will be contacted.
4. A parent meeting will be held with school personnel and the student to review the incident and discuss ways of avoiding future problems.
5. If Steps 1–4 are unsuccessful, staff will make an office discipline referral.
Additional professional development related to student discipline at the Tier II level was provided based on the ‘conflict cycle’ (Fescer & Long, 2000). This training focused on how stressful incidents, student feelings, student behavior, and adult reactions are intertwined and can create power struggles between students and teachers. For example, (a) a stressful incident occurs (a teacher directs a student to take out her homework, and the student has not completed it); (b) the student experiences irrational feelings (‘That teacher is trying to humiliate me in front of the class’); the student reacts (“Get off my back! You can’t tell me what to do!”); (c) the teacher responds (“Raise your voice again and you’ll be in detention!”), and the situation escalates to a power struggle. A trained leader guided Roosevelt School teams through a series of sessions explaining the conflict cycle and how to manage it. Strategies were presented to assist staff in avoiding the kinds of adult negative reactions that could escalate a conflict into a power struggle. Each teacher on the team participated in role-play scenarios to recognize the conflict cycle and to practice, with feedback, how to manage situations that could escalate into a power struggle. The Roosevelt School principal remarked that this training made a notable difference in reducing conflict between teachers and students. Teachers left with the understanding that only they were capable of ending the conflict cycle, and they adjusted their reactions accordingly.
For students requiring Tier III supports, teacher training focused on Functional Behavior Analysis (FBA) and Positive Behavior Intervention and Supports (PBIS). Functional Behavior Analysis is, in essence, a problem-solving process that looks at the possible causes or function of student behavior before developing interventions to address the behavior. FBA examines not only the variables that precipitate and reinforce problem behavior but also those that promote pro-social behavior (Miller, Tansy, & Hughes, 1998). The basic steps to completing an FBA in a school environment include:

RMLE Online— Volume 37, No. 8
© 2014 Association for Middle Level Education 6
1. Specifically defining the challenging behavior in measurable terms so that everyone interacting with the student knows exactly what the behavior looks like and how it will be measured.
2. Collaborate with others, including the student’s family, to collect comprehensive information about the student, including likes, dislikes, strengths, needs, routines, etc.
3. Collect baseline data on the target behavior.
4. Develop a hypothesis of what function the behavior serves for the student.
5. Determine what may be reinforcing the behavior.
6. Plan behavioral interventions based on the information collected in steps 2–5.
The Behavior Intervention Plan should include strategies for reducing the challenging behavior as well as strategies for teaching replacement behaviors that will help the student get his or her needs met in a pro-social way (Moreno & Bullock, 2011). Functional Behavioral Analysis and Positive Behavior Support, together, are a dynamic process that uses data-based decision making to adjust plans to meet the individual needs of each student.
Recognizing the reciprocal relationship between school climate, student behavior, and achievement, school leaders developed ongoing in-service training for teachers on embedded academic aspects of such as Effective Teaching Strategies and Common Formative Assessment. Teachers adopted and practiced Marzano’s (2007) framework for instruction including, but not limited to: establishing and communicating learning goals, employing non-linguistic representations, and developing effective lessons. Academic failure can be a strong contributor to problem behavior; therefore, the overall school improvement plan included a focus on fostering academic achievement. Specific training and support was provided for teachers to plan lessons that addressed both the academic and social/behavioral needs of students.
Zeroing In on Priority StandardsAs noted earlier, achievement goals, priority standards, and district improvement plans developed by the district data team became the basis for action planning for school and instructional levels. For example, an academic goal was to raise overall proficiency in reading and math by 23%, and a goal related to school climate was to reduce the overall
suspension rate by 15%. In addition to training on effective teaching strategies, extensive training was provided on differentiation of instruction. This combination of trainings helped teachers to begin to view students in new ways and to develop relationships with each student based on an appreciation of each student’s strengths, needs, and learning style.
Methods
The middle school chosen for this study was purposefully selected because it provided a site where the participants experienced the adoption of school-wide positive behavior supports as part of a school improvement process over a multi-year period. The fact that the school had experienced significant student behavior problems with consequent teacher discipline referrals and suspensions made it a desirable location to conduct the study. Participants in the study included the principal, assistant principal and four teachers who were members of the school data team. Other participants included approximately 75 seventh grade students and 75 eight grade students in each year of the 2007–2008 and the 2009–2010 school years, for a total of approximately 300 students.
The research design for the study was a concurrent triangulation mixed methods strategy. Both qualitative and quantitative data were collected simultaneously (Creswell, 2009). This approach was selected to enable the researcher to gain a broader perspective on the factors that influenced student behavior. Qualitative data were culled from transcripts of administrator and teacher interviews conducted by the researcher. Transcripts derived from the interviews were coded thematically. School improvement plans, school data team meeting minutes, student behavior infractions reports, teacher referral reports, and student suspension reports were also reviewed and served as reference points in the transcript analysis. Interview of participants was guided by the following questions:
1. What was the school improvement framework used at the school?
2. What professional development activities were planned and experienced by the staff?
3. What policy changes were put into effect?
4. Did actual student behavior changes and school climate changes take place? If so, what were they?
Table 2 College Immersion Program Specifications
Number enrolled Pre-survey Post-survey Interviews Field notes Years of program studied
Site 1 81 (all seventh graders) No Yes No Yes 2007–2011
Site 2 50 total (25 seventh and Yes Yes Yes Yes 2011–2012 eighth grade students from cach School A and School B)
RMLE Online— Volume 37, No. 8
© 2014 Association for Middle Level Education 7
Follow-up questions were asked of respondents as the quantitative data were analyzed or gaps were identified in the data. School data team members were asked several additional clarifying questions (see Appendix for complete list of questions).
Quantitative data were derived from the school climate survey. In 2010, a follow-up survey was conducted using the school climate survey instrument administered in 2007 to determine if a new cross section of students at the school would rate factors differently, in terms of school climate and culture, after intervention. The survey data collected in 2007 served as a baseline. The survey was used to assess perceptions of school climate and originates from the validated “Partners in Education” series from Iowa State University (Conger et al., 2011). The student “Partners” survey was developed using a theoretical framework of student engagement in learning and measures student perception of (a) engagement; (b) membership—including subscales for fairness, personal support, and caring; (c) authentic work—including subscales for extrinsic work, intrinsic rewards and connection to the real world; (d) peer support and spirit; and (e) efficiency. Reliability coefficients for the various scales on the student survey range from .71 to .92. The survey has been used extensively by the Iowa Department of Education to assist local school districts in self-assessing school climate and student resiliency (Grant Wood AEA, 2010).
The sample in the follow-up study was a group of 145 randomly selected seventh and eighth grade students, equally balanced in number of students at each grade level. To match the previous sample, in terms of number and composition, the school was asked to
identify one seventh grade team and one eighth grade team to voluntarily participate in the survey. The volunteer teams included 140 seventh graders and 140 eighth graders.
The anonymous survey was administered to these students by the homeroom teacher in one extended 45-minute homeroom period. To pare down the number of surveys to approximately the same sample size of the 2007 administration, a process of randomization was used to select 72 seventh graders responses and 73 eighth graders responses from the pool of available surveys. The ‘Math.random’ JavaScript programming language generates its random numbers for all modern web browsers. The JavaScript function Math.random randomly generates a number from 0 to slightly less than 1 (shown as <1). These numbers are then transformed into the set of numbers the user has decided a priori. The objects need to be randomized for the study’s unbiased conditional randomization.
In the concurrent triangulation strategy employed there was equal weight given to the collection of qualitative and quantitative data. This strategy aided analysis because quantitative results could be further explained by themes that emerged from interviews and vice versa.
Results
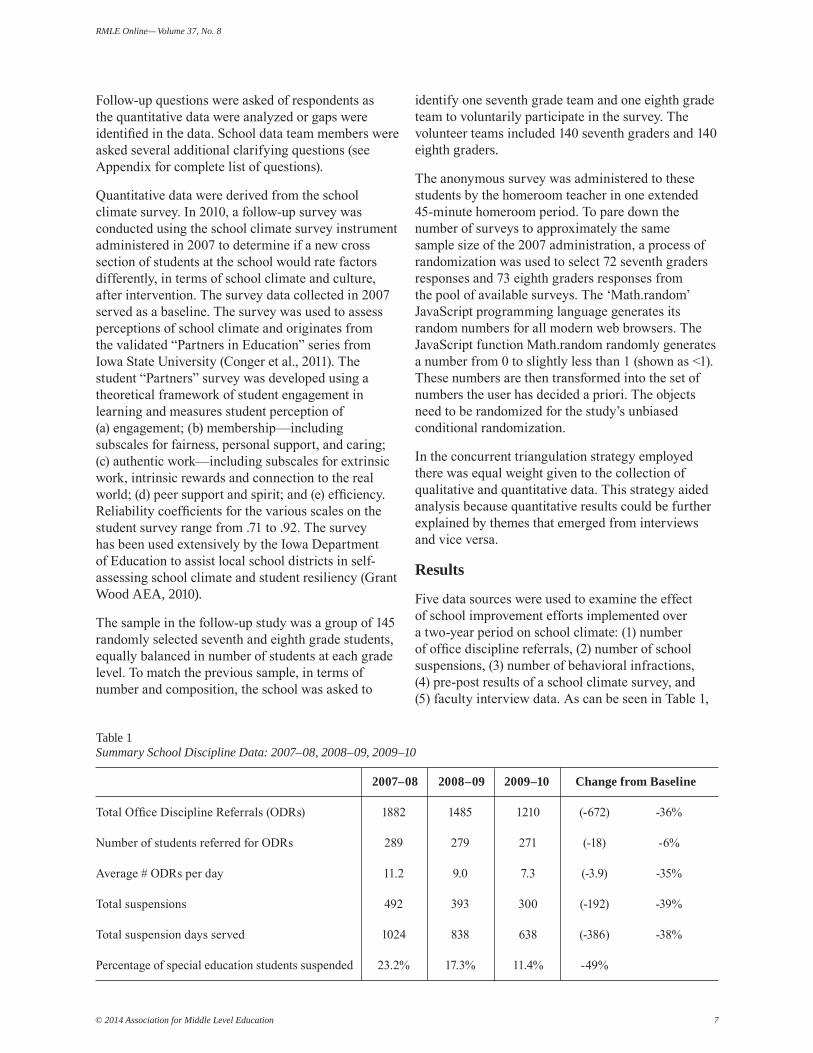
Five data sources were used to examine the effect of school improvement efforts implemented over a two-year period on school climate: (1) number of office discipline referrals, (2) number of school suspensions, (3) number of behavioral infractions, (4) pre-post results of a school climate survey, and (5) faculty interview data. As can be seen in Table 1,
Table 1 Summary School Discipline Data: 2007–08, 2008–09, 2009–10
2007–08 2008–09 2009–10 Change from Baseline
Total Office Discipline Referrals (ODRs) 1882 1485 1210 (-672) -36%
Number of students referred for ODRs 289 279 271 (-18) -6%
Average # ODRs per day 11.2 9.0 7.3 (-3.9) -35%
Total suspensions 492 393 300 (-192) -39%
Total suspension days served 1024 838 638 (-386) -38%
Percentage of special education students suspended 23.2% 17.3% 11.4% -49%

RMLE Online— Volume 37, No. 8
© 2014 Association for Middle Level Education 8
the total numbers of office discipline referrals over a period spanning three school years declined by 36%, and total number of suspensions has declined by 39%. The improvement plan goal of reducing the overall suspension rate by 15% was exceeded. Similarly, suspensions for special education students, who constitute 15% of the total school population, declined by 51%. Although the percentage of African-American and Hispanic students suspended has also been reduced, it continues to run at levels disproportionate relative to Caucasian students suspended, and, as such, the need to reduce this number remains a goal.
The concomitant reduction in the number of behavioral infractions supports the veracity of the reduction in the number of the office discipline referrals and school suspensions. As can be seen in Table 2, infractions for problem behavior declined an average of 40% over a two-year period. Reductions were seen in all eight of the most frequently occurring infractions, including fighting, insubordination, class disruption, inappropriate behavior, skipping detention, cutting class, tardiness, and disrespect to staff. By counting both the number of infractions as well as the number of office discipline referrals, the conclusion can be drawn that the decline in office discipline referrals was not the result of staff reluctance to refer and suspend. With the exception of cutting class, the greatest improvement was seen in lower level infractions that are most responsive to Tier 1 interventions.
Data gathered from faculty interviews and review of data reports further support the premise that student behavior improved at the school. Student behavior data regarding office discipline referrals, types of incidents resulting in referrals, and administrative actions were shared at monthly school data team (SDT) meetings. This process led to discussions regarding the actions taken as a result of each student infraction and to a review of relevant aspects of the School Improvement Plan. The SDT strived to identify additional preventative measures that could be put into place to further support student behavior. For example, as can be seen in Table 2, one prevalent infraction that did not decrease significantly was cutting class. After several months of reviewing this pattern of behavior, the SDT revised the School Improvement Plan to include the requirement that all teachers take attendance within the first five minutes of class and report any absences immediately to the office.
At monthly school data team meetings, reviews were conducted of more detailed behavioral reports. For example, the team reviewed reports for those students who engaged in three or more infractions resulting in office discipline referrals. Within three months, data showed that approximately 40 students had patterns of misbehavior not responsive to Tier I supports. The behavioral progress of these 40 students was closely monitored at each subsequent SDT meeting to determine what additional supports might be needed to reduce problem behavior and increase positive behavior. In addition, an analysis of data regarding time and place of incidents revealed that the highest number of behavioral infractions occurred in the month of October. As a result, the SDT set goals to front load additional positive behavioral supports and student recognition in September and October as a preventative measure.
As discussed previously, a school climate survey was administered at Roosevelt School in 2007 after it was determined by the State Department of Education that the school needed to address identified areas of concern related to school climate and culture. The survey was repeated three years later, in 2010, to determine whether school improvement efforts had resulted in significant changes.
One-sample t-tests were used to determine whether the 2010 mean scores differed from test values derived from the 2007 study. Mean scores from 2010 were identified as significantly different from test values at p < .05. Cohen’s d was used to determine effect size. Effect size indexes of about
Table 2 Summary Highest Frequency Infractions Data: 2007–2008, 2009–2010
Infractions 2007–08 2009–10 Change
Fighting/Physically aggressive behavior 101 70 -31%
Insubordination 60 37 -38%
Disrupting class 49 25 -49%
Inappropriate behavior 29 13 -55%
Skipping a detention 28 13 -44%
Cutting class 27 21 -22%
Tardy 21 14 -33%
Disrespectful to staff 20 11 -45%

RMLE Online— Volume 37, No. 8
© 2014 Association for Middle Level Education 9
.20 are typically regarded as small effects, about .5 as medium effects, and .8 and above as large effects (McMillan & Schumacher, 2006).
An item with a mean score of less than 3.0 was considered below average and was targeted for improvement after the first administration of the survey. Originally, eight items had a mean score of less than 3.0. On the second administration, just two items had a mean score of less than 3.0; however, the score on these two items had improved significantly.
Significant improvement on 30 of the 47 items on the survey resulted from the follow-up administration. Analysis revealed that most of the effect sizes for all survey items showing significant improvement were small to medium; the range was .18 to .53.
Sixteen items from the survey were considered by the researchers to be most pertinent to the aims of PBS. Of these 16 items on the follow-up administration, 12 showed significant improvement. Analysis revealed that most of the effect sizes for survey item pertinent to PBS showing significant improvement were small to medium. Effect sizes for this subgroup of test items were typically higher than effect sizes calculated for the overall survey. A sample of these items includes:
(a) I understand the school rules, (b) Teachers treat me with respect, (c) My teachers care about me, and (d) In this school I am treated like I am important. A complete list of the 16 items is included in Table 3. The results of this 2007 School Climate Survey were used by school data teams to set improvement goals and develop and refine behavioral supports and interventions within an overall School Improvement Plan. Data suggest the conversations that occurred at these data team meetings led to interventions that contributed to improvement in school climate and school culture.
Data gathered from faculty interviews support the premise of improvement in student behavior and school climate. Five themes emerged from interviews with teachers who were school data team members. These included the power of rewarding positive behavior, the importance of staff investment and commitment to a Positive Behavior Supports approach, the critical nature of administrative leadership, the importance of consistency in responding to student behavior, and the value of the school data team in making data-driven decisions that promote school improvement.
Reward SystemAll teacher respondents noted the power of focusing on rewarding positive student behavior. Roosevelt School’s P.R.I.D.E. system was based on the concept of “catching a student doing good.” Teachers looked for exceptional displays of positive and responsible behavior and not only recognized the student for this behavior but gave the student a tangible reward, in the form of a P.R.I.D.E. card. To reinforce family collaboration, a portion of the card went home with the student, and the other portion went into a bucket for a school-wide drawing for a special privilege or activity.
All teachers indicated that the students found the reward system to be highly motivating. As one teacher stated, “Kids love tokens and recognition, and it really changed their behavior.” This type of recognition took place primarily in the classroom but also in other locations such as the hallway. Another teacher described an example of how she implemented the system. She observed a boy she did not know help another boy pick up his dropped binder in the hallway. The helping boy, who received recognition and a P.R.I.D.E. card from the teacher, was visibly pleased to be recognized. All teacher respondents indicated that they were surprised middle school students would be so receptive to the P.R.I.D.E. cards.
Table 3 School Climate Items Considered Most Pertinent to PBS
1. Teachers treat students fairly.
2. I understand the school rules.
3. The school principal(s) treat(s) students fairly.
4. Adults in this school listen to the student’s side of the story.
5. Teachers/Other adults in this school will help me deal with home or personal problems.
6. The counselors in this school are helpful.
7. Rules are enforced fairly in this school.
8. Teachers treat me with respect.
9. My teachers care about me.
10. Teachers reward me for giving my best efforts.
11. The rules in the school are fair.
12. I feel safe in this school.
13. I am praised in class when I do something well.
14. Students in this school treat each other with respect.
15. I look forward to coming to school each day.
16. In this school, I am treated like I am important.
RMLE Online— Volume 37, No. 8
© 2014 Association for Middle Level Education 10
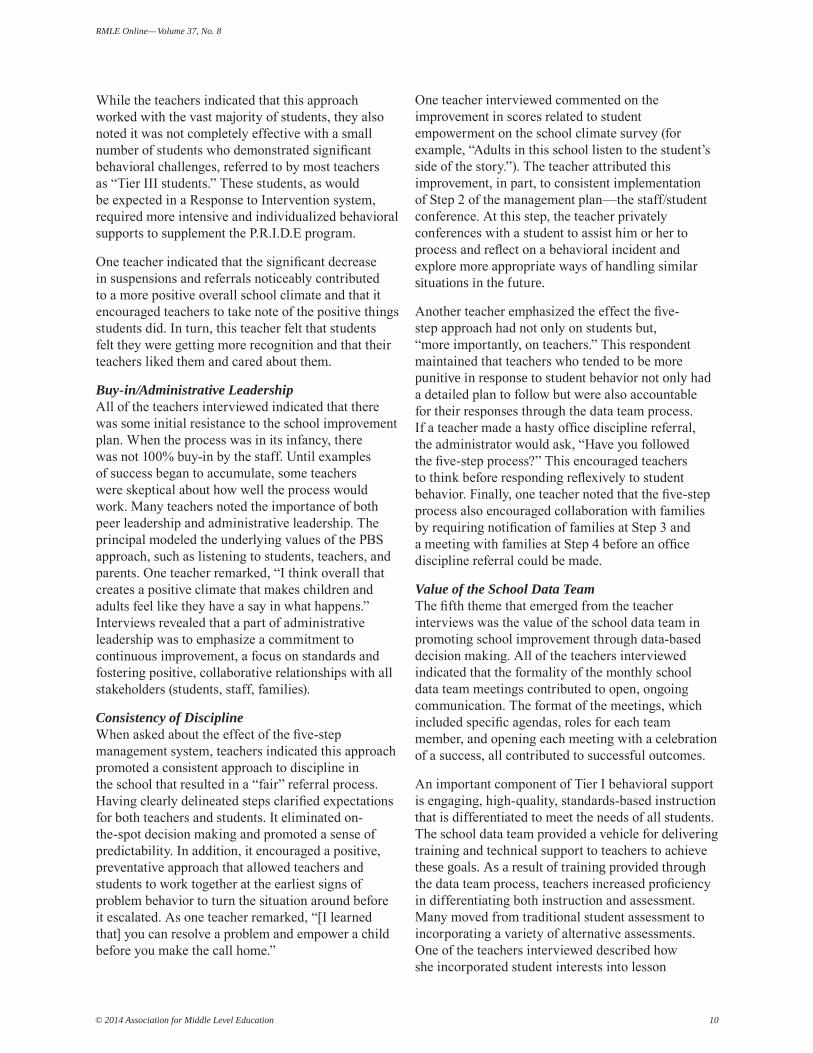
While the teachers indicated that this approach worked with the vast majority of students, they also noted it was not completely effective with a small number of students who demonstrated significant behavioral challenges, referred to by most teachers as “Tier III students.” These students, as would be expected in a Response to Intervention system, required more intensive and individualized behavioral supports to supplement the P.R.I.D.E program.
One teacher indicated that the significant decrease in suspensions and referrals noticeably contributed to a more positive overall school climate and that it encouraged teachers to take note of the positive things students did. In turn, this teacher felt that students felt they were getting more recognition and that their teachers liked them and cared about them.
Buy-in/Administrative LeadershipAll of the teachers interviewed indicated that there was some initial resistance to the school improvement plan. When the process was in its infancy, there was not 100% buy-in by the staff. Until examples of success began to accumulate, some teachers were skeptical about how well the process would work. Many teachers noted the importance of both peer leadership and administrative leadership. The principal modeled the underlying values of the PBS approach, such as listening to students, teachers, and parents. One teacher remarked, “I think overall that creates a positive climate that makes children and adults feel like they have a say in what happens.” Interviews revealed that a part of administrative leadership was to emphasize a commitment to continuous improvement, a focus on standards and fostering positive, collaborative relationships with all stakeholders (students, staff, families).
Consistency of DisciplineWhen asked about the effect of the five-step management system, teachers indicated this approach promoted a consistent approach to discipline in the school that resulted in a “fair” referral process. Having clearly delineated steps clarified expectations for both teachers and students. It eliminated on-the-spot decision making and promoted a sense of predictability. In addition, it encouraged a positive, preventative approach that allowed teachers and students to work together at the earliest signs of problem behavior to turn the situation around before it escalated. As one teacher remarked, “[I learned that] you can resolve a problem and empower a child before you make the call home.”
One teacher interviewed commented on the improvement in scores related to student empowerment on the school climate survey (for example, “Adults in this school listen to the student’s side of the story.”). The teacher attributed this improvement, in part, to consistent implementation of Step 2 of the management plan—the staff/student conference. At this step, the teacher privately conferences with a student to assist him or her to process and reflect on a behavioral incident and explore more appropriate ways of handling similar situations in the future.
Another teacher emphasized the effect the five-step approach had not only on students but, “more importantly, on teachers.” This respondent maintained that teachers who tended to be more punitive in response to student behavior not only had a detailed plan to follow but were also accountable for their responses through the data team process. If a teacher made a hasty office discipline referral, the administrator would ask, “Have you followed the five-step process?” This encouraged teachers to think before responding reflexively to student behavior. Finally, one teacher noted that the five-step process also encouraged collaboration with families by requiring notification of families at Step 3 and a meeting with families at Step 4 before an office discipline referral could be made.
Value of the School Data Team The fifth theme that emerged from the teacher interviews was the value of the school data team in promoting school improvement through data-based decision making. All of the teachers interviewed indicated that the formality of the monthly school data team meetings contributed to open, ongoing communication. The format of the meetings, which included specific agendas, roles for each team member, and opening each meeting with a celebration of a success, all contributed to successful outcomes.
An important component of Tier I behavioral support is engaging, high-quality, standards-based instruction that is differentiated to meet the needs of all students. The school data team provided a vehicle for delivering training and technical support to teachers to achieve these goals. As a result of training provided through the data team process, teachers increased proficiency in differentiating both instruction and assessment. Many moved from traditional student assessment to incorporating a variety of alternative assessments. One of the teachers interviewed described how she incorporated student interests into lesson

RMLE Online— Volume 37, No. 8
© 2014 Association for Middle Level Education 11
development in her seventh grade geography class. The results of her pre-assessment of students (“What do you know? What would like to learn?”) influenced how and what she taught. She reported becoming more student-centered and less teacher-driven in her instruction as a result of discussions that arose during data team meetings. Several faculty noted that the use of differentiated instruction models developed by Marzano (2007) and others resulted in significant improvement in students’ feelings of empowerment, as evidenced by increases in positive responses to relevant items on the School Climate Survey (e.g., “I have enough say in deciding what I should learn.”)
One teacher interviewed, who was initially opposed to being part of a data team, became a strong proponent of the model after participating as a data team member and seeing the value of the process. She said, “It made us all reflect on what kinds of educators we were, both academically and behaviorally. We all used the same vocabulary looking at data. It opened up our eyes to the thought that (we) can really improve in this area.”
Limitations
This study resulted from the collaborative efforts of a university researcher and a school principal, with the purpose of facilitating professional development on positive behavior supports and school climate in an effort to reduce suspensions and office discipline referrals in a designated high-need middle school. The study has several limitations. These include sample size, use of a convenience sample, and use of one-sample T-tests in evaluating survey results.
A single school was selected for study because it provided an opportunity for up-close information gathering at the site where participants experience the issue under study (Creswell, 2009). As such, the subjects who participated in this study were readily available to the researcher because they were students in the school. As described in the results section of the paper, a convenience sample of students completed the School Climate Survey. Given this circumstance, when a relatively small convenience sample is used, the data derived cannot be generalized beyond the population pool of the present study (McMillan & Schumacher 2006).
Finally, it is worth mentioning the methods limitation of the use of one-sample t-tests to evaluate the results of the school climate survey measure. The means derived from the 2010 study survey administration were compared to the means from the earlier
2007 study. It would have been preferable to use independent t-tests to compare the earlier and later data; however, this was not feasible, as raw data were not available from the 2007 survey administration.
Discussion
Nationally, many schools are faced with the need to change their approach to student discipline based on overwhelming evidence demonstrating the ineffectiveness of common disciplinary practices such as suspension and expulsion. School-wide positive behavior support (SWPBS) is an effective alternative to punitive, reactive policies and has been shown to result in positive changes in student behavior and school climate. This article describes the experience of a low-performing middle school that embarked on a long-term school improvement process that incorporated a SWPBS framework to promote positive changes in student behavior and school climate.
Research findings have demonstrated a number of factors that can mean the difference between a failed school improvement initiative and long-term, positive change. A combination of “bottom up” teacher initiated efforts and “top down” systemic district leadership has been shown to result in lasting systematic change (Graczewski, Ruffin, Shambaugh, & Therriault, 2007). To sustain school improvement efforts, all stakeholders must be engaged in the process, including parents, students, teachers, and administrators. Staff must be provided with ongoing training and coaching in evidence-based practices to implement approaches with fidelity. A continuum of supports and interventions must be available to provide students with the skills they need to meet academic and behavioral expectations. Finally, data must be used to guide decision making at all levels.
These factors were embedded in Roosevelt School’s implementation of an overall school improvement effort. Along with a focus on evidence-based academic interventions, a school-wide positive behavior support framework was implemented, resulting in many fewer incidents of problem behavior, teacher discipline referrals and student suspensions. In addition, a cross section of students rated factors regarding climate and culture of the school much more favorably after intervention than did a group of students attending the school before the improvement plan was put in place. There were also academic gains: a review of state mastery test data showed a 25% increase in reading scores and an 11% increase in math scores from 2007 to 2010. By 2010, Roosevelt School had made enough academic gain

RMLE Online— Volume 37, No. 8
© 2014 Association for Middle Level Education 12
to be removed from the state list of schools needing improvement, having failed to meet adequate yearly progress for five consecutive years.
Interviews of teachers who participated in the school improvement efforts at Roosevelt School revealed five themes related to the incorporation of SWPBS into their school improvement plan. These themes dovetailed with the research on successful implementation of a SWPBS framework, including recognizing and rewarding positive behavior, the importance of stakeholder involvement in all steps of the process, the critical nature of administrative leadership, the importance of consistency in responding to student behavior, and the value of data teams to ensure that data informs decision making.
The results of this study are consistent with other studies that support the use of school-wide positive behavior supports and interventions in decreasing ineffective disciplinary practices, resulting in improvements in student behavior and school climate. In addition, quantitative and qualitative data gathered for this study confirm the reciprocal nature of academic and behavioral outcomes in a Response to Intervention framework.
ReferencesAchilles, G. M., McLaughlin, M. J., & Croninger, R.
G. (2007). Sociocultural correlates of disciplinary exclusion among students with emotional, behavioral, and learning disabilities in the SEELS National database. Journal of Emotional and Behavioral Disorders, 15, 33–45.
Ainsworth, L., & Viegut, D. (2006). Common formative assessments: How to connect standards-based instruction and assessment. Thousand Oaks, CA: Corwin.
Anderberg, A. (2008, June). From initiative fatigue to initiative integration: Getting the most out of CALI. Paper presented at the CALI Camp of the Connecticut State Department of Education, Hartford, CT.
Arcia, E. (2006). Achievement and enrollment status of suspended students: Outcomes in a large, multicultural school district. Education and Urban Society, 38, 359–369.
Besser. L., Anderson-Davis, D & Perry, A. (2008). Data teams. Englewood, CO: The Leadership and Learning Center.
Bradshaw, C., Reinke, W., Brown, L., Bevans, K., & Leaf, P. (2008). Implementation of school-wide positive behavioral interventions and supports (PBIS) in elementary schools: Observations from a randomized trial. Education and Treatment of Children, 31, 1–26.
Brown, T. M. (2007). Lost and turned out. Urban Education, 42, 432–455.
Conger, R., Lasley, D. P., Lorenz, F. O., Whitbeck, R., Elder, G. H., Jr., & Norem, R. (2011). Iowa Youth and Families Project, 1989–1992, Interuniversity Consortium for Political and Social Research.
Connecticut State Department of Education. (2008). Using scientific research based interventions: Improving education for all children. Hartford, CT: Connecticut State Department of Education.
Connecticut State Department of Education. (2010). CALI overview presentation. Retrieved from http:www.sde.ct.gov/sde/pdf/curriculum/cali/CALI_Overview_2010_2011.pdf.
Connecticut Voices for Children. (2006). District Reference Group (DRG). Retrieved from http://www.sde.ct.gov/sqe/LIB/sde/PDF/dgm/report
Creswell, J. W. (2009). Research Design: Qualitative, quantitative and mixed methods approaches (3rd Ed.). Thousand Oaks, CA: Sage.
Dreikurs, R., & Cassel, P. (1972). Discipline without tears: A reassuring and practical guide to teaching your child positive behavior (2nd Ed.). New York, NY. Penguin.
Dreikurs, R., Grunwald, B., & Pepper, F. (1982). Maintaining sanity in the classroom: Classroom management techniques (2nd ed.). New York, NY: Harper & Row.
Fecser, F., & Long, N. (2000). Life space crisis intervention. Retrieved from http://cecp.air.org/interact/authoronline/april98/html
Fremon, C., & Renfrow-Hamilton, S. (2001). Are schools failing black boys? Terry College of Business, University of Georgia. Legal 4500/6500 Employment Law.
Graczewski, C., Ruffin, M., Shambaugh, L., & Therriault, S. (2007). Selecting and implementing whole school improvement models: A district and school administrative perspective: Journal of Education for Students Placed at Risk, 12, 75–90.
Grant Wood Area Education Agency. (2010). Resiliency survey. Retrieved from http://www.gwaea.org/curr/assessments.html
Hopson, L. M., & Lee, E. (2011). Mitigating the effect of family poverty on academic and behavioral outcomes: The role of school climate in middle and high school. Children & Youth Services Review, 33, 2221–2229.

RMLE Online— Volume 37, No. 8
© 2014 Association for Middle Level Education 13
Horner, R. H., Sugai, G., Smolkowski, K., Eber, L., Nakasato, J., Todd, A. W., & Esperanza, J. (2009). A randomized, wait-list controlled effectiveness trial assessing school-wide positive behavior support in elementary schools. Journal of Positive Behavior Interventions, 11, 133–144.
Horner, R., Sugai, G., & Anderson, C. (2010). Examining the evidence base for school-wide positive behavior support. Focus on Exceptional Children, 42(8), 1–14.
Kidron, Y., & Darwin, M. (2007). A systematic review of whole school improvement models. Journal of Education for Students Placed at Risk, 12(1), 9–35.
Krezmien, M. P., Leone, P. E., & Achilles, G. M. (2006). Suspension, race, and disability: Analysis of statewide practices and reporting. Journal of Emotional and Behavioral Disorders, 14, 217–226.
Lo, C. C., Young, S. K., Allen, T. M., Allen, A. N., Minugh, P. A., & Lomuto, N., (2011). The Impact of school environmental and grade level on student delinquency: A multi-level modeling approach. Crime & Delinquency, 57, 622–657.
Malmgren, K., Trezek, B., & Paul, P. (2005). Models of classroom management as applied to the secondary classroom. Clearing House: A Journal of Educational Strategies, Issues and Ideas, 79, 36–39.
Marzano, R. (2007). The art and science of teaching. Alexandria, VA: Association for Supervision and Curriculum Development.
McMillan, J. H., & Schumacher, S. (2006). Research in education evidence-based inquiry (6th ed.). Boston, MA: Pearson.
Miller, J. A., Tansy, M., & Hughes, T. L. (1998). Functional behavioral assessment: The link between problem behavior and effective intervention in schools. Current Issues in Education, 1(5). Retrieved from http://cie.ed.asu.edu/volume1number5
Moreno, G., & Bullock, L. M. (2011). Principles of positive behavior supports: Using the FBA as a problem-solving approach to address challenging behavior beyond special populations. Emotional and Behavioral Difficulties, 16, 117–127.
Reeves, D. (2004). Data-driven decision-making and data teams training manual. Englewood, CO: Center for Performance Assessment.
Skiba, R. (2000). Zero tolerance, zero evidence: An analysis of school disciplinary practice (Policy Research Report #SRS2). Bloomington, IN: Indiana Education Policy Center.
Skiba, R. (2008). Are zero tolerance policies effective in the schools? An evidentiary review and recommendations. American Psychologist, 63, 852–862.
Skiba, R. J., & Rausch, M. K. (2006). School disciplinary systems: Alternatives to suspension and expulsion. In G. Bear, K. Minke, & A. Thomas (Eds.), Children’s needs III: Understanding and addressing the developmental needs of children (pp. 87–102). Bethesda, MD: National Association of School Psychologists.
Skiba, R., & Sprague, J. (2008). Safety without suspensions. Educational Leadership, 66(1), 38–43.
Sugai, G., & Horner, R. H. (2009). Responsiveness-to-intervention and school-wide positive behavior supports: Integration of multi-tiered system approaches. Exceptionality, 17, 223–237.
Sugai, G., Horner, R. H., Algozzine, R., Barrett, S., Lewis, T., Anderson, C., Bradley, R., Choi, J. H., Dunlap, G., Eber, L., George, H., Kincaid, D., McCart, A., Nelson, M., Newcomer, L., Putnam, R., Riffel, L., Rovins, M., Sailor, W., & Simonsen, B. (2010). School-wide positive behavior support: Implementers’ blueprint and self-assessment. Eugene, OR: University of Oregon.
Warren, J. S., Bohanon-Edmonson, H. M., Turnbull, A. P., Sailor, W., Wickham, D., Griggs, P., & Beech, S. E. (2006). School-wide positive behavior support: Addressing behavior problems that impede student learning. Educational Psychology Review, 18, 187–198
Whitbread, K., Feinstein, A., Bruder, M., Fleming, G., & Kechijian, L. (2007). The relationship between the juvenile justice system and public schools in serving children with disabilities. Data Report. Farmington, CT: University of Connecticut Center on Developmental Disabilities.
White, R., & Warfa, N. (2011). Building schools of character: A case-study investigation of character educations impact on school climate, pupil behavior, and curriculum delivery. Journal of Applied Social Psychology, 41, 45–60.

RMLE Online— Volume 37, No. 8
© 2014 Association for Middle Level Education 14
Appendix
Data Team Member Interview Questions
Please answer with respect to SWPBS impact on student behavior at the middle school level
2007–2010 as a school Data Team Member:
1. What positive effects do you see with students?
2. Give an example of success you had with that that you can remember.
3. What are the outcomes of a PBS system?
4. What was surprising? What was not?
5. Were there student behavior changes and school climate changes in the school that took place? If so, what were they? To what do you attribute these changes?
6. Did an emphasis on the school five-step management system have an effect? If so, How? Did it help students to feel more empowered?
7. Were there changes in policy, curriculum, and instruction that helped students to feel more empowered?
8. Did communication among staff play a factor in efforts to improve student behavior and school climate?
9. Is there anything else you would like to mention about changes that resulted from a school improvement process?