impact of red blotch disease on grape and wine … · results: wine chemical composition 2015 wine...
TRANSCRIPT

UC DAVIS VITICULTURE AND ENOLOGY
IMPACT OF RED BLOTCH DISEASE
ON GRAPE AND WINE COMPOSITION
Oregon Grape Day: Management of Trunk Disease, Grapevine Viruses and Fungicide ResistanceLaSells Stewart Center, OSU CampusApril 6, 2017
A. Oberholster, R. Girardello, L. Lerno, S. Eridon, M. Cooper, R. Smith, C. Brenneman, H. Heymann, M.
Sokolowsky, V. Rich, D. Plank, S. Kurtural
UC DAVIS VITICULTURE AND ENOLOGY
Introduction
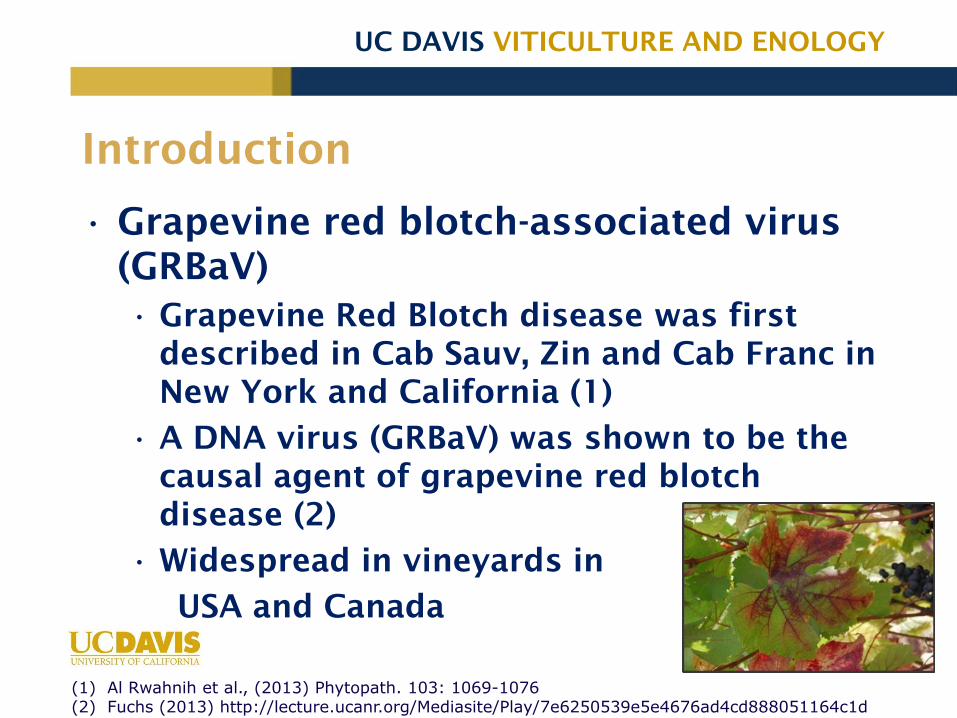
• Grapevine red blotch-associated virus
(GRBaV)
• Grapevine Red Blotch disease was first
described in Cab Sauv, Zin and Cab Franc in
New York and California (1)
• A DNA virus (GRBaV) was shown to be the
causal agent of grapevine red blotch
disease (2)
• Widespread in vineyards in
USA and Canada
(1) Al Rwahnih et al., (2013) Phytopath. 103: 1069-1076(2) Fuchs (2013) http://lecture.ucanr.org/Mediasite/Play/7e6250539e5e4676ad4cd888051164c1d

UC DAVIS VITICULTURE AND ENOLOGY
Introduction
• Grapevine Red Blotch disease symptoms
• RB disease shows symptoms similar to
Leafroll disease
• Unlike Leafroll – RB show red veins on leaf
undersides and no rolling
UC DAVIS VITICULTURE AND ENOLOGY
Introduction
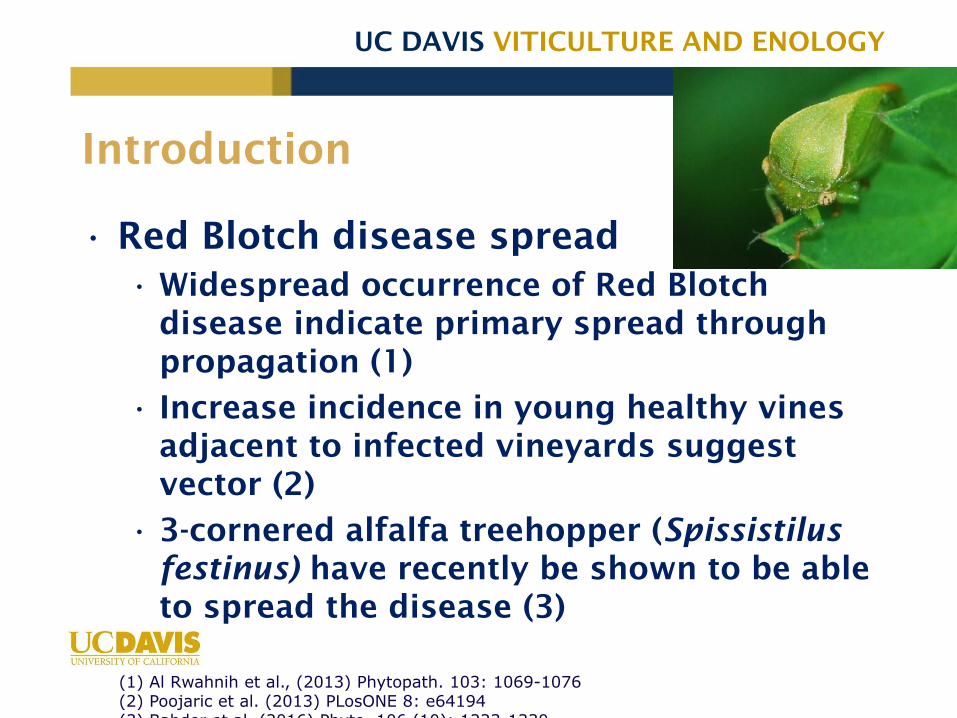
• Red Blotch disease spread
• Widespread occurrence of Red Blotch
disease indicate primary spread through
propagation (1)
• Increase incidence in young healthy vines
adjacent to infected vineyards suggest
vector (2)
• 3-cornered alfalfa treehopper (Spissistilus
festinus) have recently be shown to be able
to spread the disease (3)
(1) Al Rwahnih et al., (2013) Phytopath. 103: 1069-1076(2) Poojaric et al. (2013) PLosONE 8: e64194(3) Bahder et al. (2016) Phyto. 106 (10): 1223-1230

UC DAVIS VITICULTURE AND ENOLOGY
Perceived impact of RB disease on
grape composition
• Sugar accumulation
• As much 4-5 Brix less
• Delay in ripening
• Color development
• TA
• Current research - show not always true
• Malic acid
• True for CH and CS, not Zin
• For CH, ↓yield
UC DAVIS VITICULTURE AND ENOLOGY
Background – phenols in wine
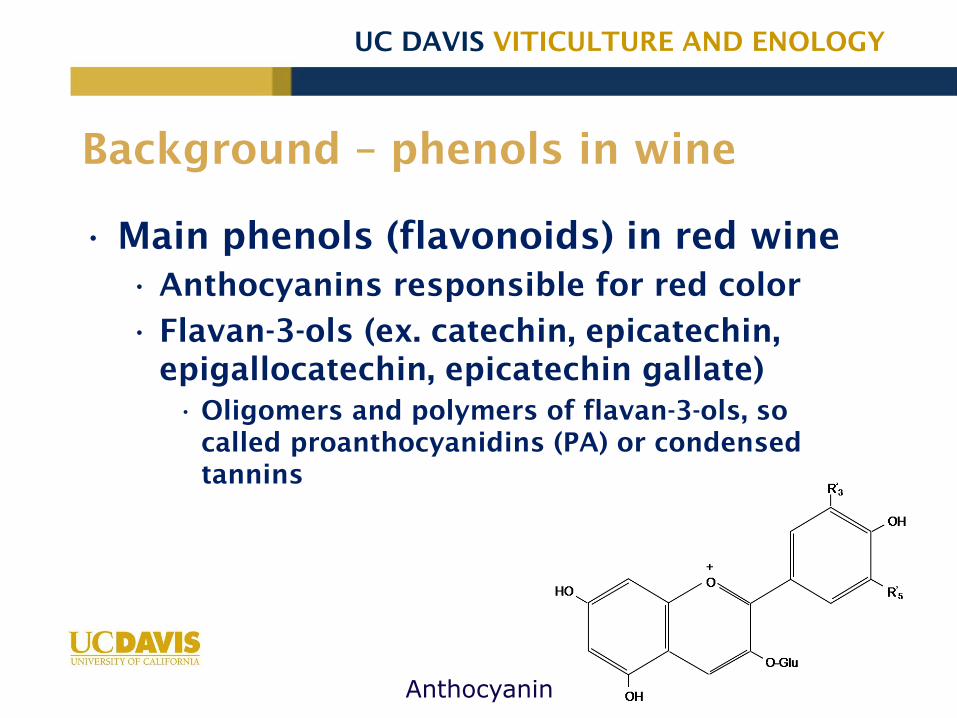
• Main phenols (flavonoids) in red wine
• Anthocyanins responsible for red color
• Flavan-3-ols (ex. catechin, epicatechin,
epigallocatechin, epicatechin gallate)
• Oligomers and polymers of flavan-3-ols, so
called proanthocyanidins (PA) or condensed
tanninsig 1
Anthocyanin
UC DAVIS VITICULTURE AND ENOLOGY
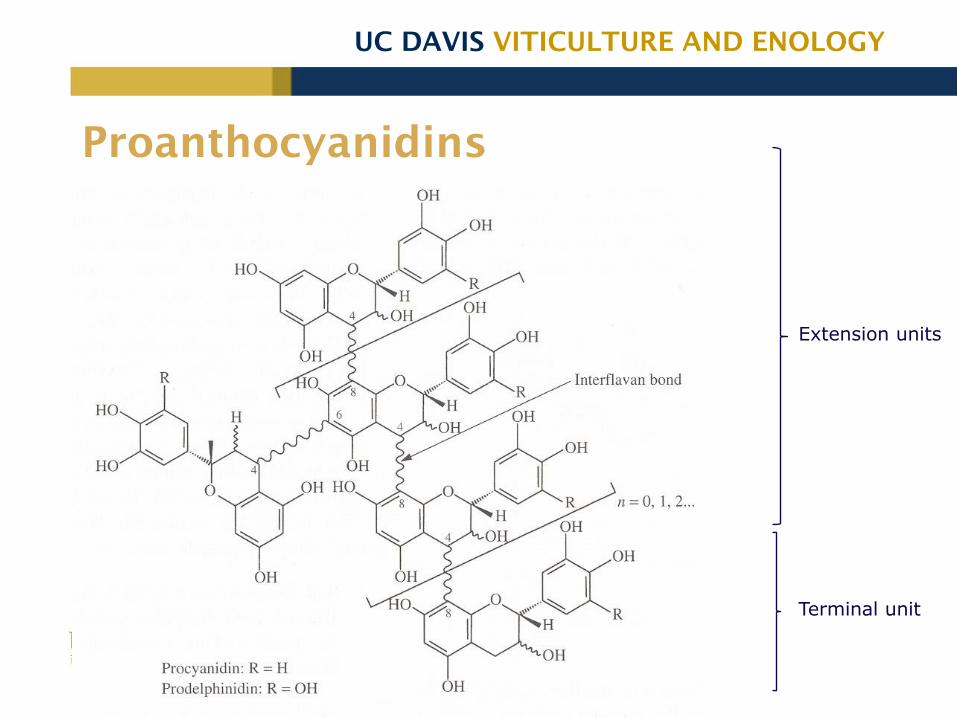
Proanthocyanidins
Extension units
Terminal unit
UC DAVIS VITICULTURE AND ENOLOGY
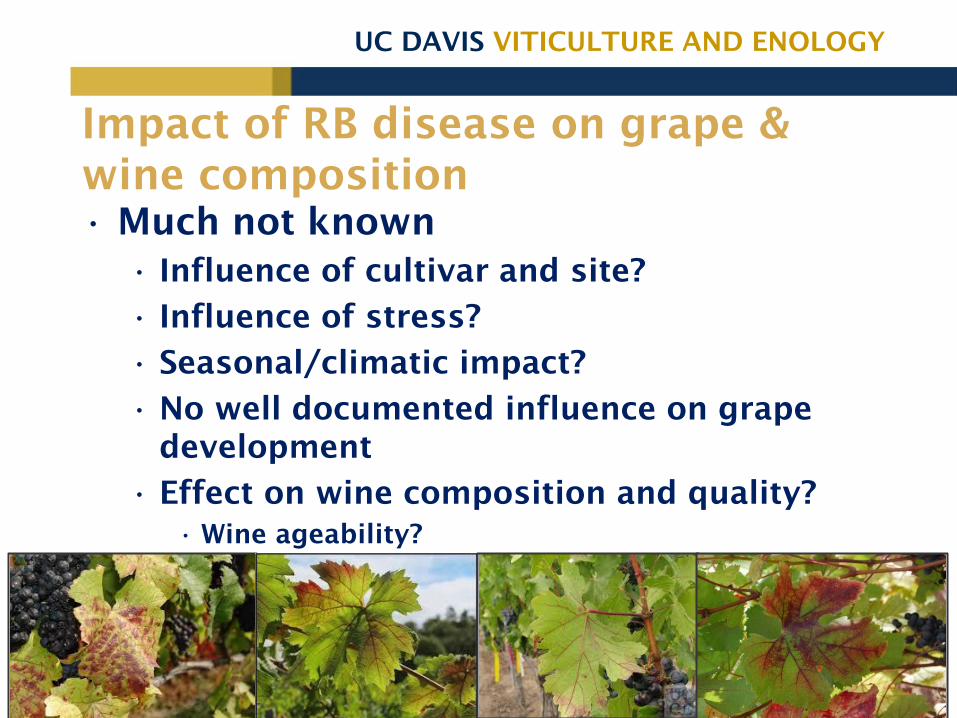
Impact of RB disease on grape &
wine composition
• Much not known
• Influence of cultivar and site?
• Influence of stress?
• Seasonal/climatic impact?
• No well documented influence on grape
development
• Effect on wine composition and quality?
• Wine ageability?
UC DAVIS VITICULTURE AND ENOLOGY
Progress….
• 2014
• Funded project to determine the impact of
GRBaV on the composition of grapes at
harvest and the resulting wines
• To investigate potential sensory and
quality differences between wines made
from GRBaV positive and negative grapes
• 2015
• Unfunded – small investigation
• 2016
• Funded again
UC DAVIS VITICULTURE AND ENOLOGY
Experimental layout
• Virus testing (GRBaV and GRLaV) of
subset vines to determine GRBaV (+)
and (-) sample plots
• Sample grapes at harvest
• Basic chemical panels (Brix, pH, TA)
• Metabolomics analysis (primary and
secondary metabolite profile)
• Phenolic profile (AH-assay, RP-HPLC)
• Tannin composition (SPE isolation,
phloroglucinolysis)
UC DAVIS VITICULTURE AND ENOLOGY
Experimental layout
• Winemaking from GRBaV (+) and (-)
grapes
• Chemical analyses similar to grapes
(previous slide)
• Descriptive sensory analysis
• Correlate wine composition with sensory
attributes
• Impact of GRBaV on wine style/quality
UC DAVIS VITICULTURE AND ENOLOGY
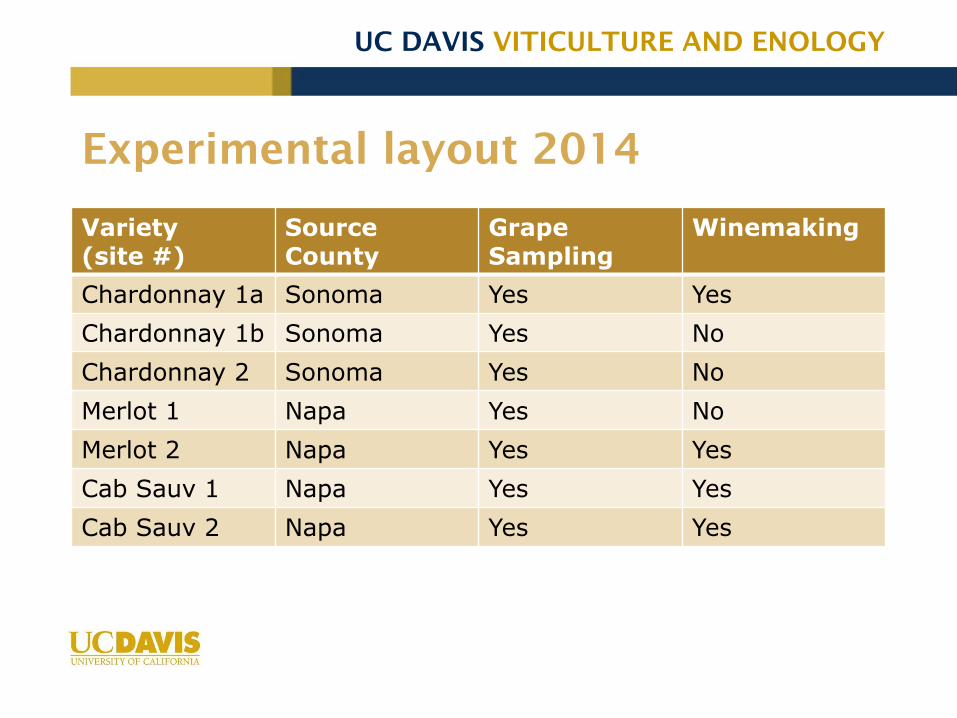
Experimental layout 2014
Variety (site #)
Source County
Grape Sampling
Winemaking
Chardonnay 1a Sonoma Yes Yes
Chardonnay 1b Sonoma Yes No
Chardonnay 2 Sonoma Yes No
Merlot 1 Napa Yes No
Merlot 2 Napa Yes Yes
Cab Sauv 1 Napa Yes Yes
Cab Sauv 2 Napa Yes Yes
UC DAVIS VITICULTURE AND ENOLOGY
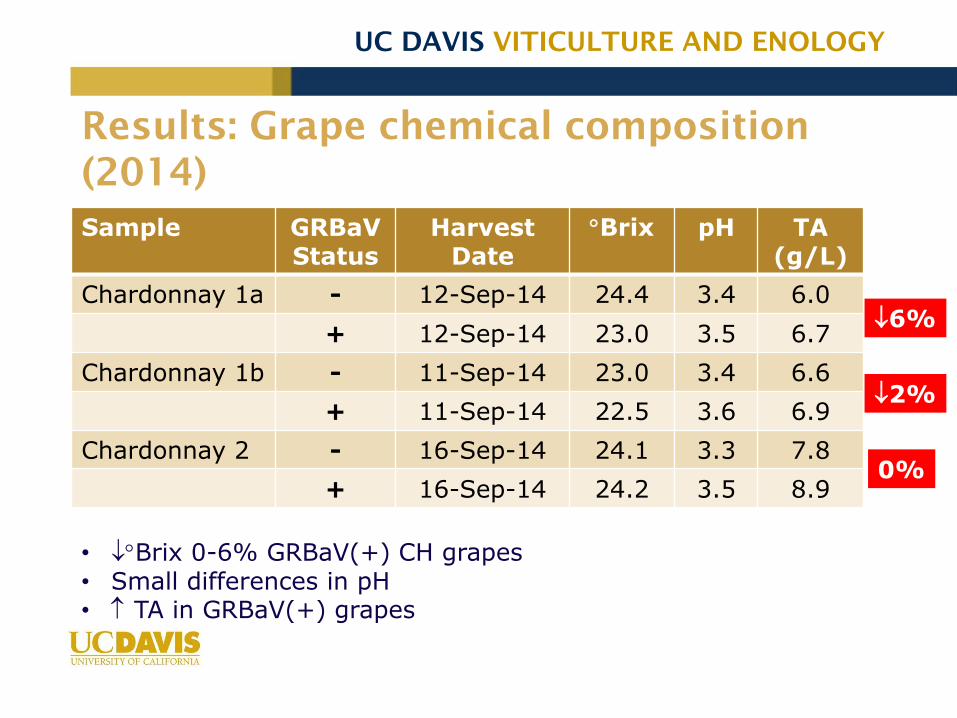
Results: Grape chemical composition
(2014)
Sample GRBaVStatus
Harvest Date
Brix pH TA (g/L)
Chardonnay 1a - 12-Sep-14 24.4 3.4 6.0
+ 12-Sep-14 23.0 3.5 6.7
Chardonnay 1b - 11-Sep-14 23.0 3.4 6.6
+ 11-Sep-14 22.5 3.6 6.9
Chardonnay 2 - 16-Sep-14 24.1 3.3 7.8
+ 16-Sep-14 24.2 3.5 8.9
• Brix 0-6% GRBaV(+) CH grapes• Small differences in pH• TA in GRBaV(+) grapes
6%
2%
0%
UC DAVIS VITICULTURE AND ENOLOGY
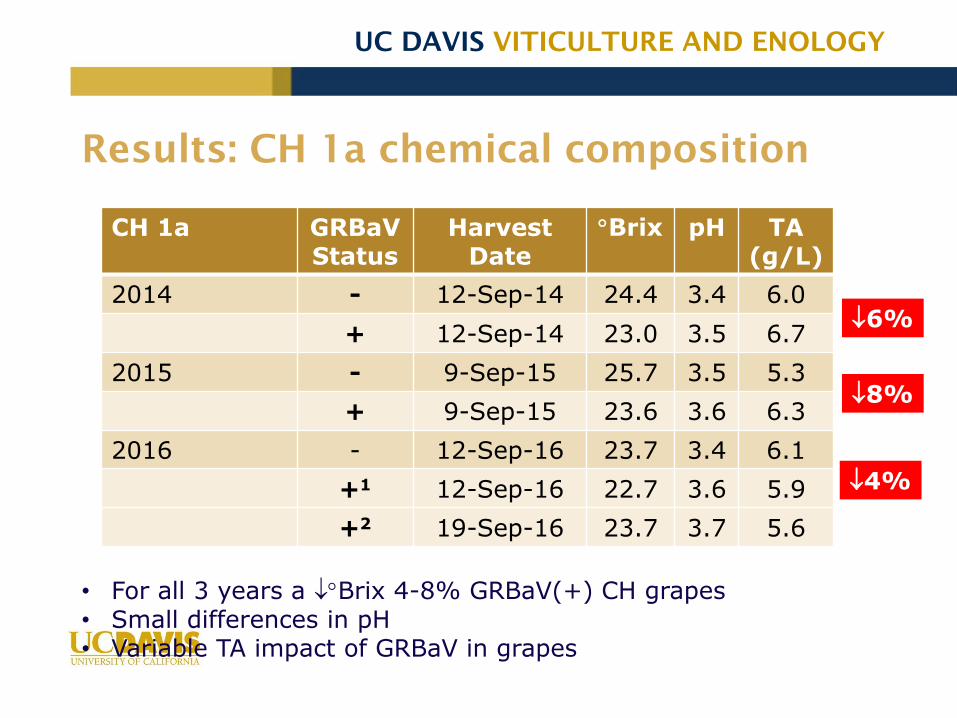
Results: CH 1a chemical composition
CH 1a GRBaVStatus
Harvest Date
Brix pH TA (g/L)
2014 - 12-Sep-14 24.4 3.4 6.0
+ 12-Sep-14 23.0 3.5 6.7
2015 - 9-Sep-15 25.7 3.5 5.3
+ 9-Sep-15 23.6 3.6 6.3
2016 - 12-Sep-16 23.7 3.4 6.1
+1 12-Sep-16 22.7 3.6 5.9
+2 19-Sep-16 23.7 3.7 5.6
• For all 3 years a Brix 4-8% GRBaV(+) CH grapes• Small differences in pH• Variable TA impact of GRBaV in grapes
6%
8%
4%
UC DAVIS VITICULTURE AND ENOLOGY
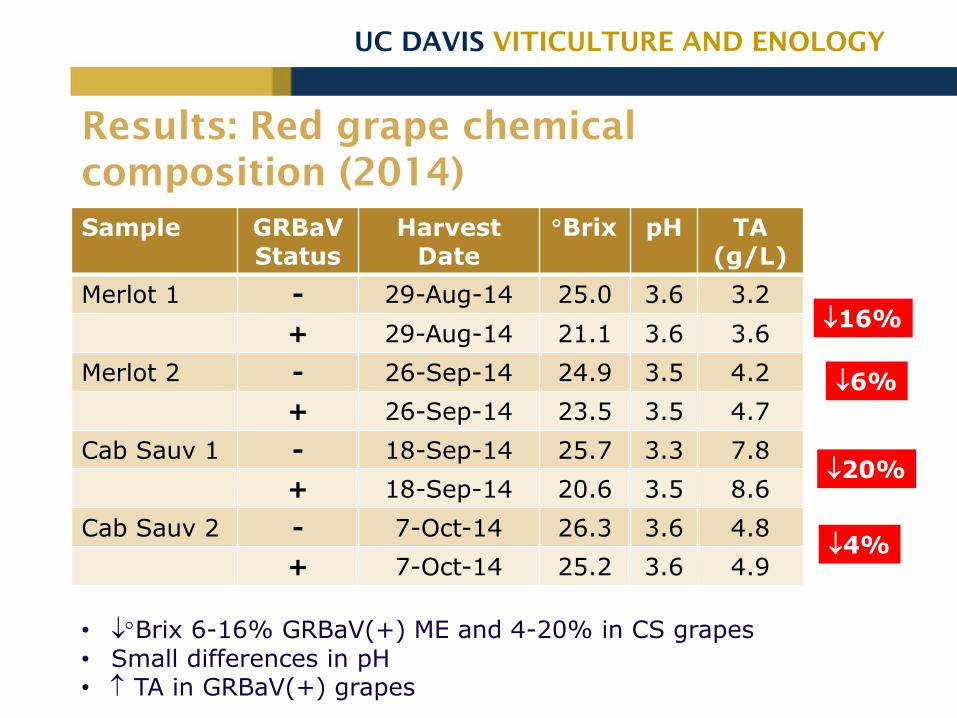
Results: Red grape chemical
composition (2014)
Sample GRBaVStatus
Harvest Date
Brix pH TA (g/L)
Merlot 1 - 29-Aug-14 25.0 3.6 3.2
+ 29-Aug-14 21.1 3.6 3.6
Merlot 2 - 26-Sep-14 24.9 3.5 4.2
+ 26-Sep-14 23.5 3.5 4.7
Cab Sauv 1 - 18-Sep-14 25.7 3.3 7.8
+ 18-Sep-14 20.6 3.5 8.6
Cab Sauv 2 - 7-Oct-14 26.3 3.6 4.8
+ 7-Oct-14 25.2 3.6 4.9
• Brix 6-16% GRBaV(+) ME and 4-20% in CS grapes• Small differences in pH• TA in GRBaV(+) grapes
16%
6%
20%
4%
UC DAVIS VITICULTURE AND ENOLOGY
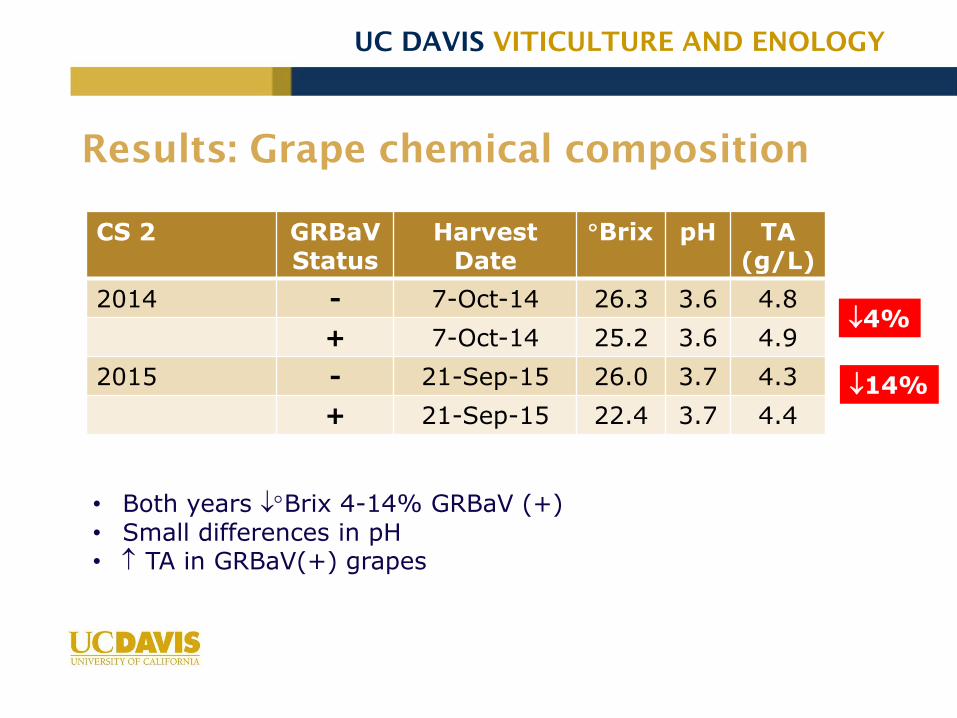
Results: Grape chemical composition
CS 2 GRBaVStatus
Harvest Date
Brix pH TA (g/L)
2014 - 7-Oct-14 26.3 3.6 4.8
+ 7-Oct-14 25.2 3.6 4.9
2015 - 21-Sep-15 26.0 3.7 4.3
+ 21-Sep-15 22.4 3.7 4.4
• Both years Brix 4-14% GRBaV (+) • Small differences in pH• TA in GRBaV(+) grapes
4%
14%
UC DAVIS VITICULTURE AND ENOLOGY
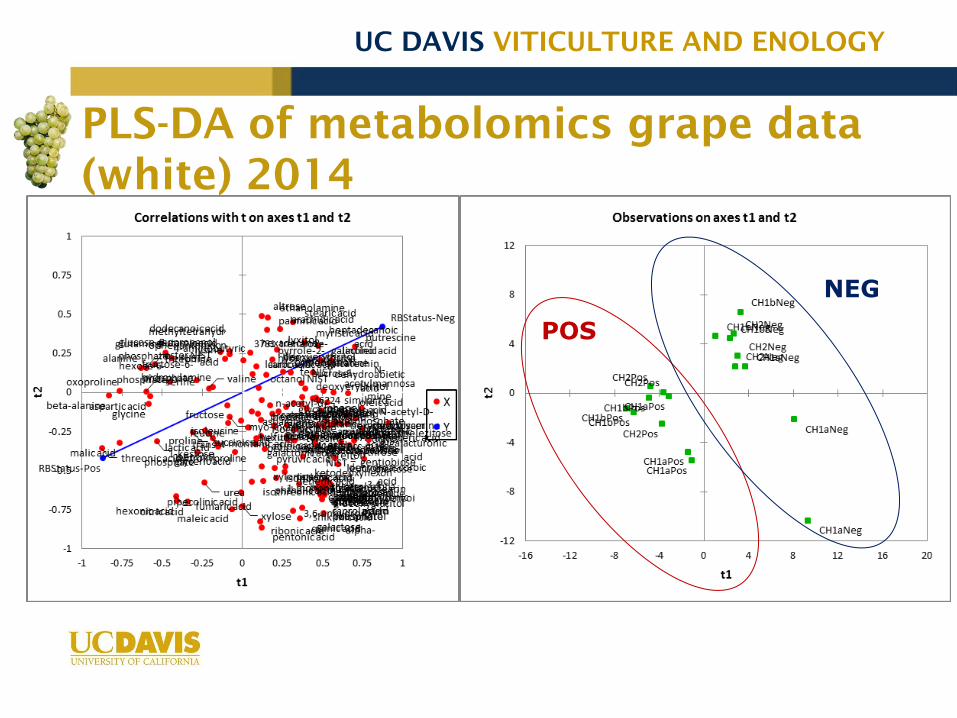
PLS-DA of metabolomics grape data
(white) 2014
POS
NEG
UC DAVIS VITICULTURE AND ENOLOGY
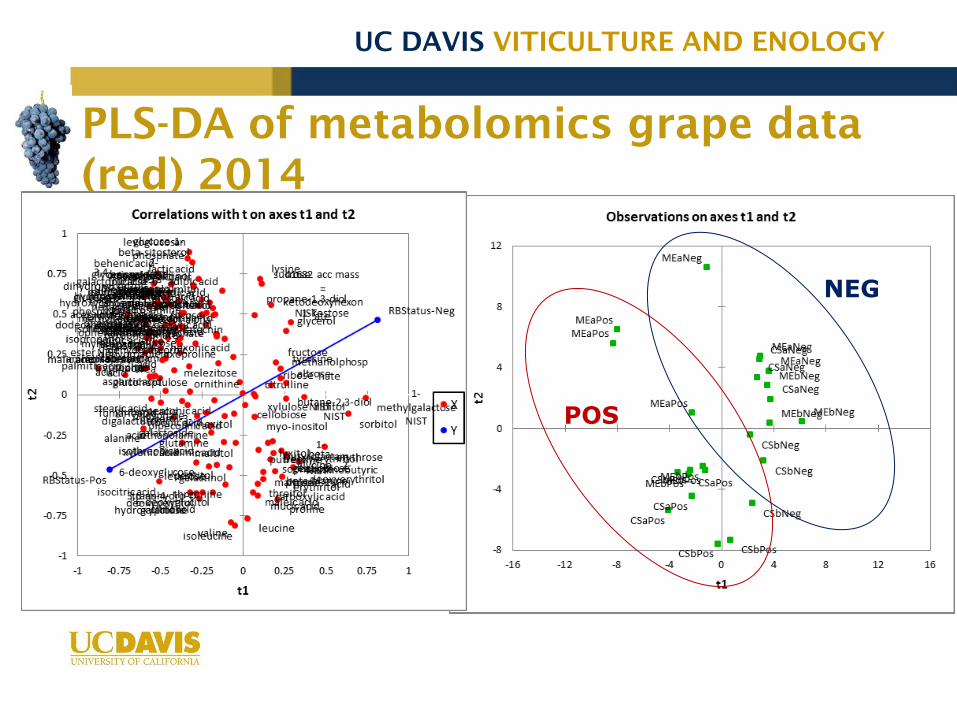
PLS-DA of metabolomics grape data
(red) 2014
POS
NEG
UC DAVIS VITICULTURE AND ENOLOGY
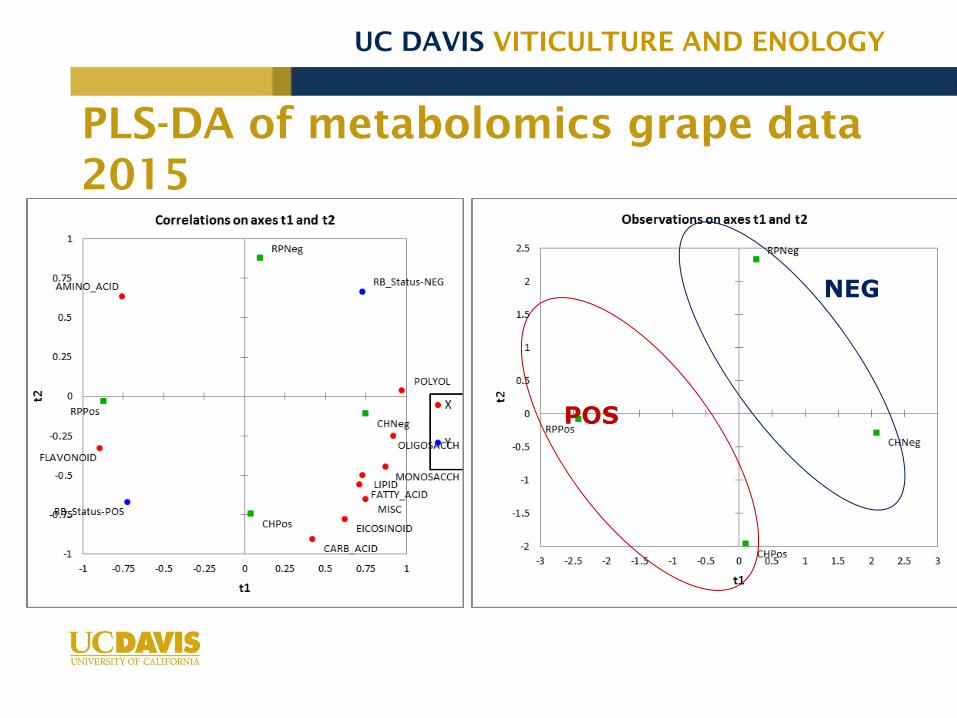
PLS-DA of metabolomics grape data
2015
POS
NEG

UC DAVIS VITICULTURE AND ENOLOGY
Phenolic profile: Chardonnay
0.00
0.05
0.10
0.15
0.20
0.25
1 2 3
mg/g
of berr
y
Flavan-3-ols
(monomer/dimer)
a b
a b
a a
0.0
0.5
1.0
1.5
2.0
2.5
3.0
3.5
1 2 3
mg/g
of berr
y
Polymeric Phenols
Series1
Series2
a b
a b
a b
Figure: RP-HPLC phenolic profile results of RB (-) and RB (+) Chardonnay at harvest in 2014
2015 RP-HPLC Phenolic Profile
• CH 1a RB(+): flavan-3-ols concentration
polymeric phenols concentration (agrees with Protein Precipitation assay)
UC DAVIS VITICULTURE AND ENOLOGY
0
0.01
0.02
0.03
0.04
0.05
0.06
1.00 2.00 3.00 4.00
mg/g
of berr
y
Polymeric Pigments Series
1Series2a b
a a
a a
a a
0.00
0.20
0.40
0.60
0.80
1.00
1.20
1.40
1.60
1.00 2.00 3.00 4.00
mg/g
of berr
y
Anthocyanins a b
a a a a a a
0.00
0.05
0.10
0.15
0.20
0.25
0.30
1.00 2.00 3.00 4.00
mg/g
of berr
y
Flavan-3-ols (mon/dimer)
a a
a aa a
a b
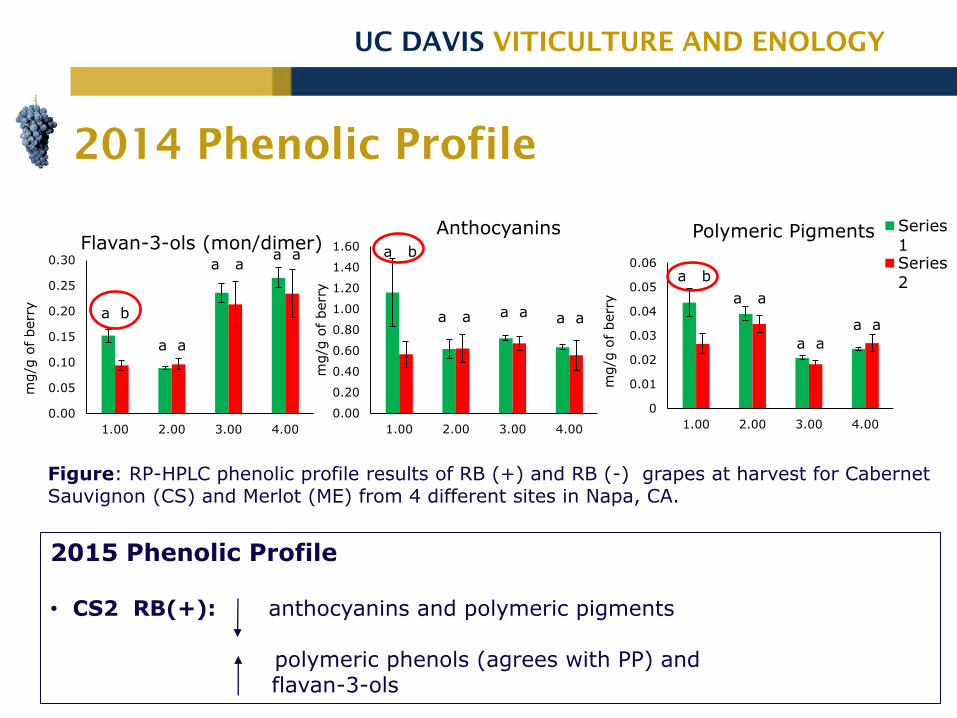
Figure: RP-HPLC phenolic profile results of RB (+) and RB (-) grapes at harvest for Cabernet Sauvignon (CS) and Merlot (ME) from 4 different sites in Napa, CA.
2014 Phenolic Profile
2015 Phenolic Profile
• CS2 RB(+): anthocyanins and polymeric pigments
polymeric phenols (agrees with PP) and flavan-3-ols
UC DAVIS VITICULTURE AND ENOLOGY
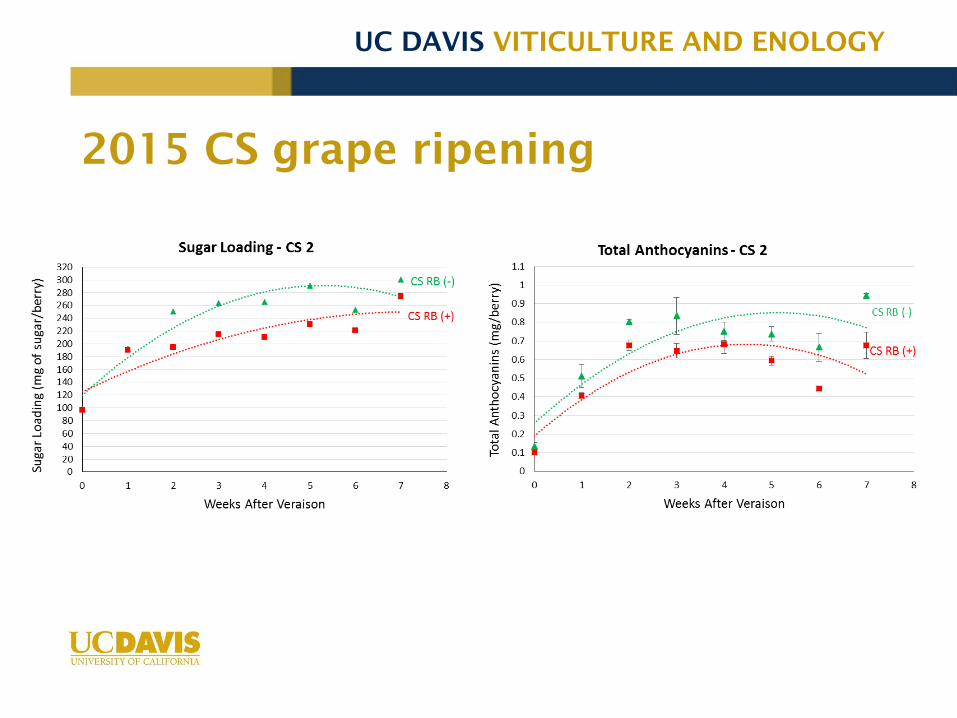
2015 CS grape ripening

UC DAVIS VITICULTURE AND ENOLOGY
Results: Tannin composition by
phloroglucinolysis
results of GRBaV positive and negative Chardonnay at harvest (n=3).
RB(+) = red blotch positive; RB(-) = red blotch negative.
a site.
• Tannin analysis showed signf
differences among diffr varieties
• No diffr due to disease status of grapes
(mDP, % gallo units, % galloylation)
• It looks as if tannin composition
similar
• However method limitations

UC DAVIS VITICULTURE AND ENOLOGY
Figure: Mean Degree of Polymerization (mDP) and skins tannins on CS, CH and ME from 7 different sites in 2014 by phloroglucinolysis
2014 – Skin and Seed Tannin Analyzed by
Phloroglucinolysis
0.0
10.0
20.0
30.0
40.0
50.0
60.0
70.0
1.0 2.0 3.0 4.0 5.0 6.0 7.0
mD
P
mDP Skins
Series1
Series2
• RB (+) CS 2 and CH 1a had significant concentration of tannins in the skins
• Skins tannins and mDP had the same trend as observed in 2014
• RB (-) and RB (+) seed from both 2014 and 2015 did not show differences regardingtannin concentration and mDP
2015
0.0
2.0
4.0
6.0
8.0
10.0
12.0
14.0
16.0
18.0
1 2 3 4 5 6 7
mg
/g
of
skin
Skin Tannins a a a a a a a a a a a a a a
a a a a b a b a b a a a a a
UC DAVIS VITICULTURE AND ENOLOGY
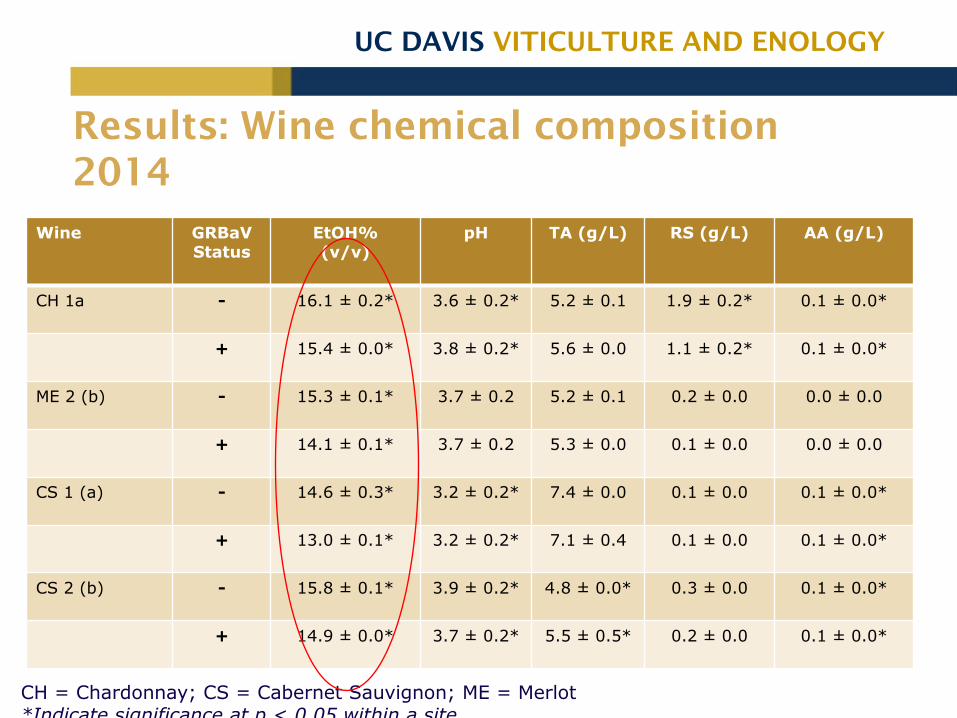
CH = Chardonnay; CS = Cabernet Sauvignon; ME = Merlot*Indicate significance at p < 0.05 within a site
Results: Wine chemical composition
2014
Wine GRBaVStatus
EtOH% (v/v)
pH TA (g/L) RS (g/L) AA (g/L)
CH 1a - 16.1 ± 0.2* 3.6 ± 0.2* 5.2 ± 0.1 1.9 ± 0.2* 0.1 ± 0.0*
+ 15.4 ± 0.0* 3.8 ± 0.2* 5.6 ± 0.0 1.1 ± 0.2* 0.1 ± 0.0*
ME 2 (b) - 15.3 ± 0.1* 3.7 ± 0.2 5.2 ± 0.1 0.2 ± 0.0 0.0 ± 0.0
+ 14.1 ± 0.1* 3.7 ± 0.2 5.3 ± 0.0 0.1 ± 0.0 0.0 ± 0.0
CS 1 (a) - 14.6 ± 0.3* 3.2 ± 0.2* 7.4 ± 0.0 0.1 ± 0.0 0.1 ± 0.0*
+ 13.0 ± 0.1* 3.2 ± 0.2* 7.1 ± 0.4 0.1 ± 0.0 0.1 ± 0.0*
CS 2 (b) - 15.8 ± 0.1* 3.9 ± 0.2* 4.8 ± 0.0* 0.3 ± 0.0 0.1 ± 0.0*
+ 14.9 ± 0.0* 3.7 ± 0.2* 5.5 ± 0.5* 0.2 ± 0.0 0.1 ± 0.0*
UC DAVIS VITICULTURE AND ENOLOGY
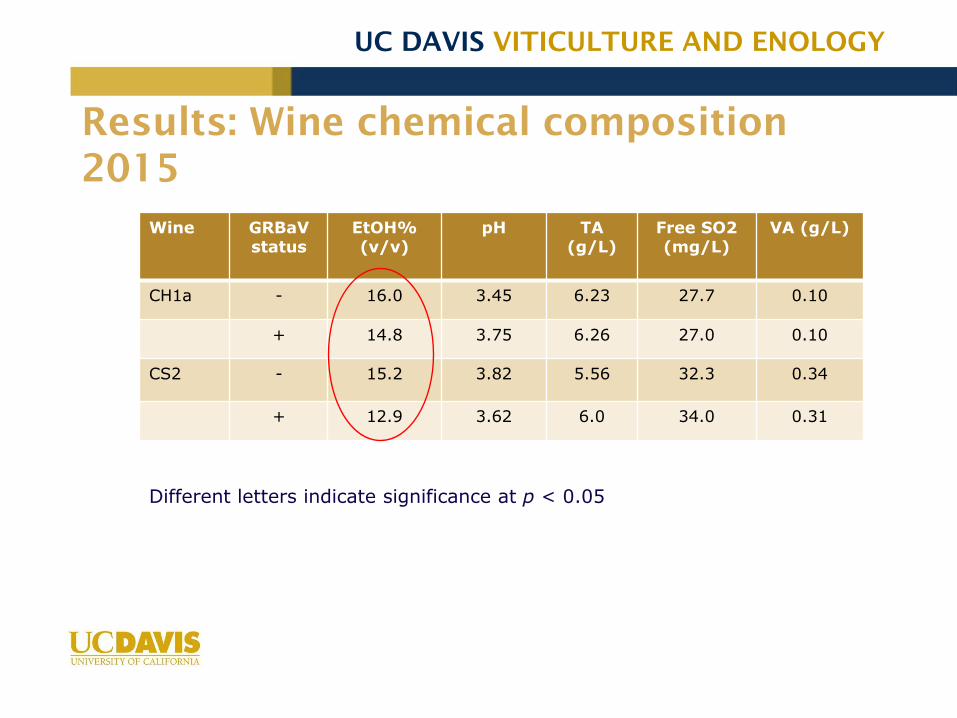
Different letters indicate significance at p < 0.05
Results: Wine chemical composition
2015
Wine GRBaVstatus
EtOH% (v/v)
pH TA (g/L)
Free SO2 (mg/L)
VA (g/L)
CH1a - 16.0 3.45 6.23 27.7 0.10
+ 14.8 3.75 6.26 27.0 0.10
CS2 - 15.2 3.82 5.56 32.3 0.34
+ 12.9 3.62 6.0 34.0 0.31

UC DAVIS VITICULTURE AND ENOLOGY
PLS-DA of wine metabolomics data
2014
UC DAVIS VITICULTURE AND ENOLOGY
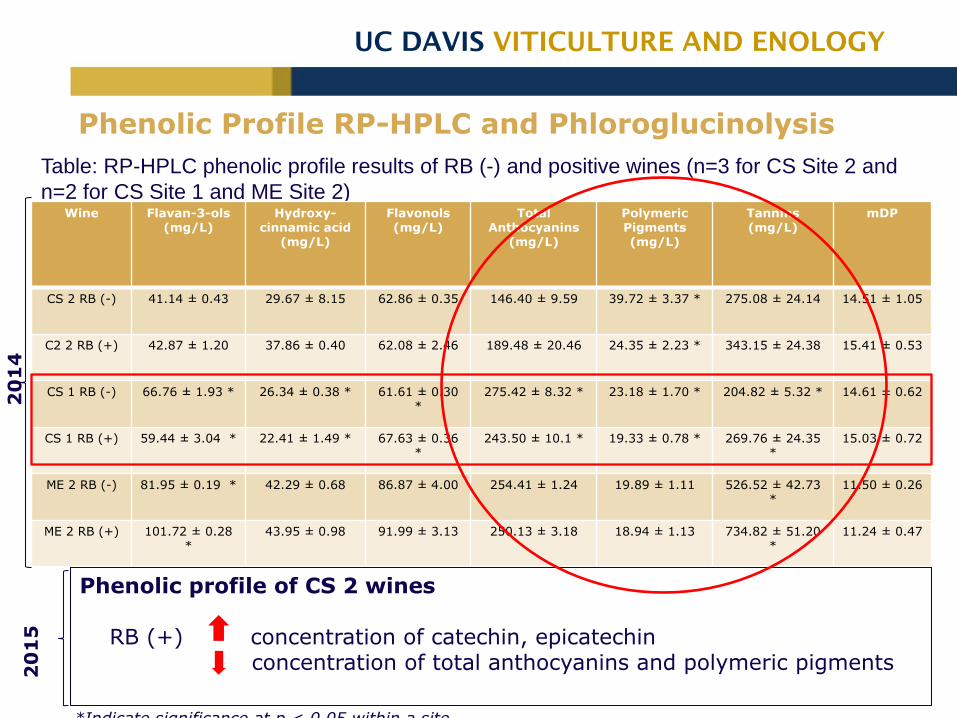
*Indicates significance at p < 0.05 within a site
Table: RP-HPLC phenolic profile results of RB (-) and positive wines (n=3 for CS Site 2 and
n=2 for CS Site 1 and ME Site 2)
2014
Phenolic Profile RP-HPLC and Phloroglucinolysis
Wine Flavan-3-ols(mg/L)
Hydroxy-cinnamic acid
(mg/L)
Flavonols(mg/L)
TotalAnthocyanins
(mg/L)
Polymeric Pigments(mg/L)
Tannins(mg/L)
mDP
CS 2 RB (-) 41.14 ± 0.43 29.67 ± 8.15 62.86 ± 0.35 146.40 ± 9.59 39.72 ± 3.37 * 275.08 ± 24.14 14.51 ± 1.05
C2 2 RB (+) 42.87 ± 1.20 37.86 ± 0.40 62.08 ± 2.46 189.48 ± 20.46 24.35 ± 2.23 * 343.15 ± 24.38 15.41 ± 0.53
CS 1 RB (-) 66.76 ± 1.93 * 26.34 ± 0.38 * 61.61 ± 0.30 *
275.42 ± 8.32 * 23.18 ± 1.70 * 204.82 ± 5.32 * 14.61 ± 0.62
CS 1 RB (+) 59.44 ± 3.04 * 22.41 ± 1.49 * 67.63 ± 0.36 *
243.50 ± 10.1 * 19.33 ± 0.78 * 269.76 ± 24.35 *
15.03 ± 0.72
ME 2 RB (-) 81.95 ± 0.19 * 42.29 ± 0.68 86.87 ± 4.00 254.41 ± 1.24 19.89 ± 1.11 526.52 ± 42.73 *
11.50 ± 0.26
ME 2 RB (+) 101.72 ± 0.28 *
43.95 ± 0.98 91.99 ± 3.13 250.13 ± 3.18 18.94 ± 1.13 734.82 ± 51.20 *
11.24 ± 0.47
Phenolic profile of CS 2 wines
RB (+) concentration of catechin, epicatechinconcentration of total anthocyanins and polymeric pigments2
01
52
01
4
*Indicate significance at p < 0.05 within a site
UC DAVIS VITICULTURE AND ENOLOGY
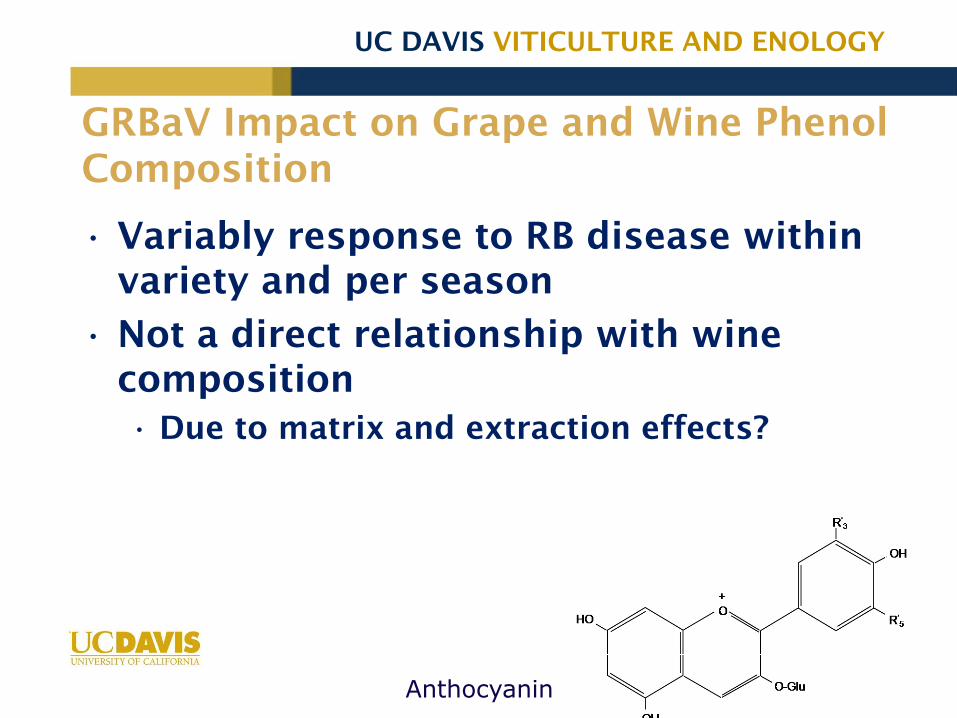
GRBaV Impact on Grape and Wine Phenol
Composition
results of GRBaV positive and negative Chardonnay at harvest (n=3).
RB(+) = red blotch positive; RB(-) = red blotch negative.
a site.
• Variably response to RB disease within
variety and per season
• Not a direct relationship with wine
composition
• Due to matrix and extraction effects?
Anthocyanin
UC DAVIS VITICULTURE AND ENOLOGY
Sensory: Descriptive analysis (DA)

UC DAVIS VITICULTURE AND ENOLOGY
White wine sensory data 2014
• PCA separation of the wines although very little diffr
• Only 1 out of 18 attributes sigf diffr
PCA scores and loading plot
-+2015: 2 signf attributes ↑apple juice,
↓hot mouthfeel in RB(+) wines

UC DAVIS VITICULTURE AND ENOLOGY
Corrected F values for red DA
attributes – 2014 data
AttributesF value wine Significant
red fruits 1.184 no
dark fruits 1.393 no
dried fruits 2.744 yes**
oxidized apple 0.484 no
jammy 0.654 no
cooked vegetables/green bellpepper 1.551 no
leafy/tobacco 2.382 no
ceder 1.085 no
leathery/earthy/mineral 0.874 no
okay 0.970 no
alcohol 3.405 yes***
solvent/sulfur 0.520 no
baking spices 0.586 no
black pepper 0.805 no
cacao/chocolate 1.666 no
floral 1.135 no
sweet 1.994 yes
sour 3.798 yes
salty 1.418 no
bitter 1.753 no
coating 2.205 yes*
viscous 0.579 no
astringent/dry 6.484 yes***
grippy 2.205 yes*
hot/alcohol 2.587 yes**
color 1.630 no
PCA score plot
*, ** and *** indicate significance at respectively p < 0.05, p<0.01, p< 0.0001
UC DAVIS VITICULTURE AND ENOLOGY
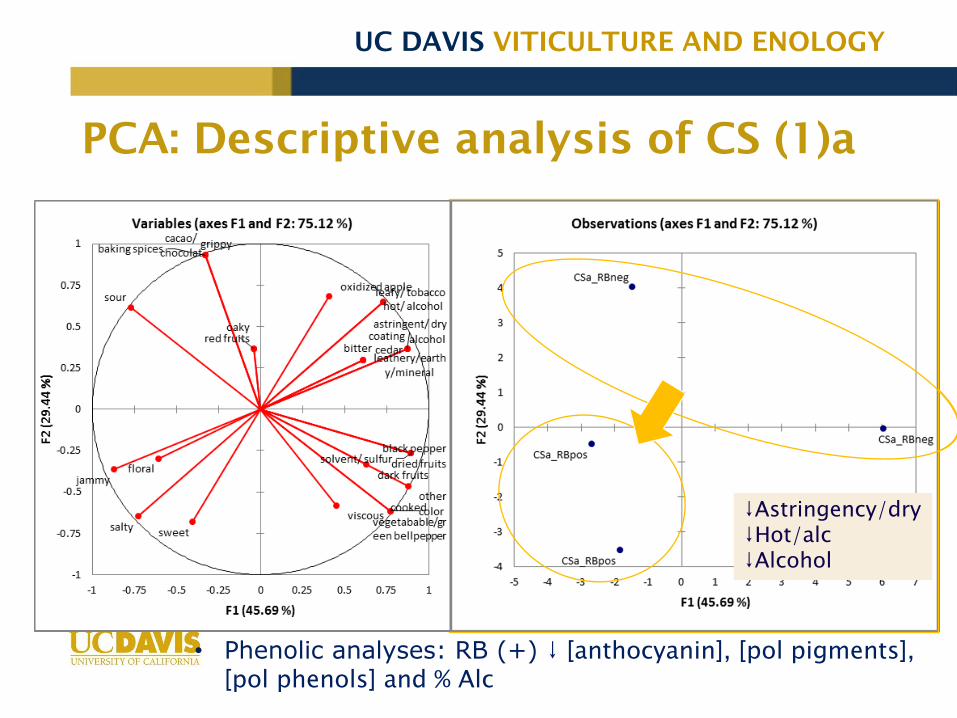
PCA: Descriptive analysis of CS (1)a
↓Astringency/dry↓Hot/alc↓Alcohol
• Phenolic analyses: RB (+) ↓ [anthocyanin], [pol pigments], [pol phenols] and % Alc
UC DAVIS VITICULTURE AND ENOLOGY
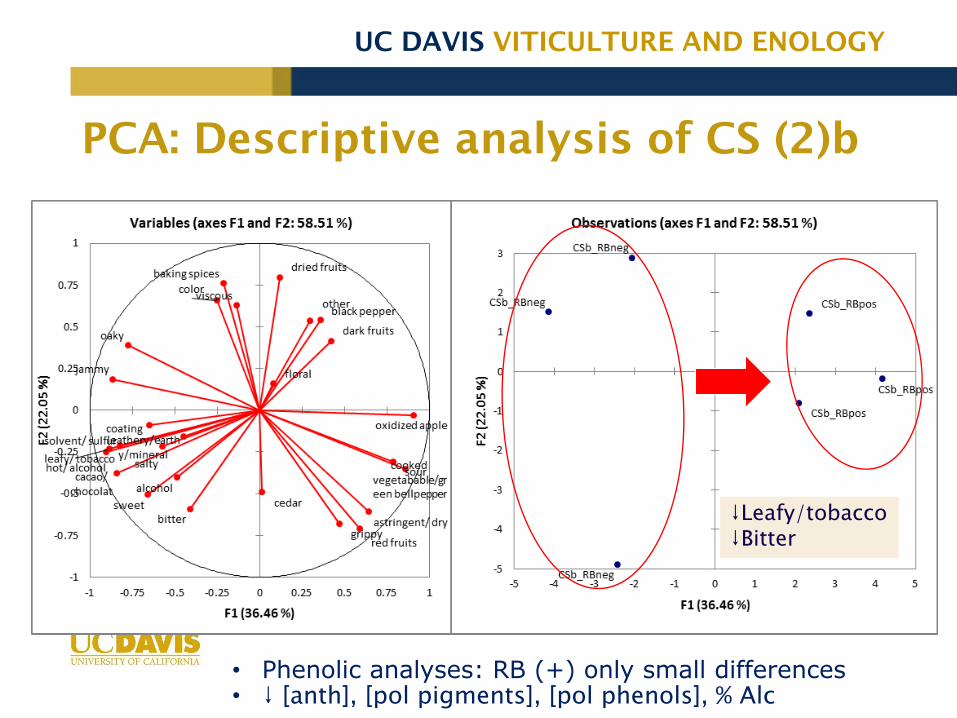
PCA: Descriptive analysis of CS (2)b
↓Leafy/tobacco↓Bitter
• Phenolic analyses: RB (+) only small differences• ↓ [anth], [pol pigments], [pol phenols], % Alc
UC DAVIS VITICULTURE AND ENOLOGY
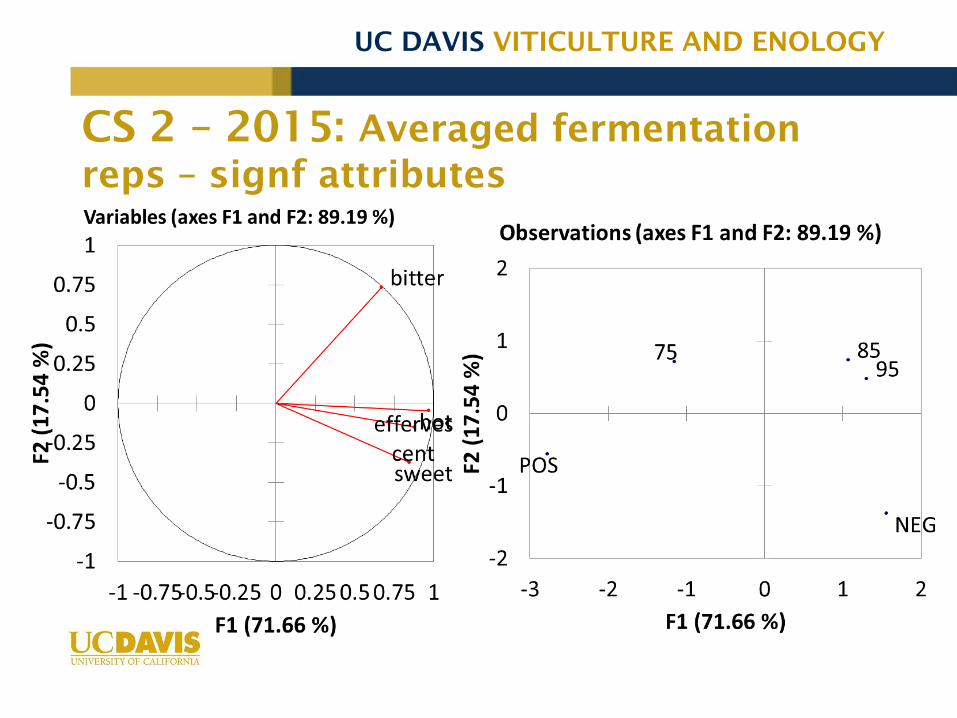
CS 2 – 2015: Averaged fermentation
reps – signf attributes
UC DAVIS VITICULTURE AND ENOLOGY
What does it mean?
• For this specific site and season
• 3.6 Brix difference
• 25% RB (+) fruit included in fermentation could
have significant impact
• Selective harvesting recommended at >15%
incidence in vineyard
• Recommend separate chem analysis for healthy
and diseased vines
• Make informed decision based on chem
differences
UC DAVIS VITICULTURE AND ENOLOGY
In Summary
• Results indicate RB impact is not variety but
site specific
• Seasonal impact
• Untargeted metabolomics indicated large
impact on primary metabolites
• Organic acids
• Sugars
• Amino acids
• Polysaccharides
• Some volatile and non-volatile secondary
metabolites (phenols, aroma precursors) also
impacted
UC DAVIS VITICULTURE AND ENOLOGY
Next Steps
• Make wines from RB (+) and (-) grapes with
the same sugar content
• Sequential harvesting - 2016
• Continue to explore impact of site on
variety
• Find correlation with soil, nutrients…..
• Targeted analysis combined with
transcriptomics to identify metabolic
pathways altered by RB disease resulting
in changes in biochemical composition
• Use impact on gene expression to develop
potential counter measures
UC DAVIS VITICULTURE AND ENOLOGY
THANK YOU