impact of-real-world-driving-emissions-for-uk-cars-and-vans
TRANSCRIPT
Project Name Document Name
1
Quantifying the impact
of real-world driving
on total CO2 emissions
from UK cars and vans
Final report
for
The Committee on
Climate Change
September 2015
Element Energy Limited
Terrington House
13-15 Hills Road
Cambridge CB2 1NL
Tel: 01223 852499
Fax: 01223 353475
Quantifying the impact of real-world driving on total CO2 emissions from UK cars and vans
Contents
Abbreviations ...................................................................................................................................... 1
Executive Summary ............................................................................................................................. 2
1 Background and context ............................................................................................................. 6
1.1 Vehicle type-approval testing and the real world emissions gap ......................................... 6
1.2 Implications of the real world emissions gap for the UK ...................................................... 7
2 Vehicle-level impacts of real-world driving .............................................................................. 10
2.1 Understanding the current emissions gap .......................................................................... 10
2.2 Effect of introducing a new type-approval test on the emissions gap in 2020 ................... 20
2.3 Potential increase of the emissions gap to 2025/30 ........................................................... 28
2.4 Opportunities for reducing the emissions gap to 2030 ...................................................... 31
2.5 Vans ..................................................................................................................................... 33
3 Quantifying the real world emissions gap for the current UK vehicle parc .............................. 37
3.1 Representing the total car and van parc ............................................................................. 37
3.2 Quantifying the current real-world emissions gap of the UK vehicle parc ......................... 39
3.3 Effect of the transition to WLTP in 2020 ............................................................................. 41
3.4 Impact of OEM optimisations in 2030 ................................................................................. 43
3.5 Impact of improved type-approval testing in 2030 ............................................................ 44
4 Summary and conclusions ........................................................................................................ 47
5 Bibliography .............................................................................................................................. 49
Authors
For comments or queries please contact:
Alex Stewart ([email protected] +44 (0)1223 926718)
Alastair Hope-Morley ([email protected] +44 (0)330 088 3916)
Peter Mock ([email protected] +49 (0)30 847 129102)
Uwe Tietge ([email protected] +49 (0)30 847 121198)
Quantifying the impact of real-world driving on total CO2 emissions from UK cars and vans
1
Abbreviations
CCC Committee on Climate Change
CO2 Carbon dioxide
DfT Department for Transport
EC European Commission
EE Element Energy
EU European Union
EUDC Extra Urban Driving Cycle
GHG Greenhouse Gas
HEV Hybrid electric vehicle
ICCT International Committee on Clean Transport
MtCO2 Mega-tonnes of carbon dioxide
NAEI National Atmospheric and Emissions Inventory
NEDC New European Driving Cycle
NOx Nitrogen oxides (NO and NO2)
NTM National Transport Model
NTS National Travel Survey
PEMS Portable emissions monitoring equipment
PHEV Plug-in hybrid electric vehicle
RDE Real Driving Emissions
SMMT Society of Motor Manufacturers & Traders
UDC Urban Driving Cycle
UK United Kingdom
VKT Vehicle kilometres travelled
WLTP Worldwide harmonized Light vehicles Test Procedures
Quantifying the impact of real-world driving on total CO2 emissions from UK cars and vans
2
Executive Summary
Passenger cars and vans contribute to 17% of the UK’s total carbon dioxide emissions, and therefore
have an important role to play in meeting future CO2 targets. Despite rapid falls in the official CO2
emissions of new cars sold in the UK in recent years, evidence of a growing ‘gap’ between official
and real-world driving CO2 emissions for new cars has received much attention, and Government
has become increasingly aware of the risks this poses to the UK’s CO2 reduction efforts. The
Committee on Climate Change commissioned Element Energy and ICCT to understand in more detail
the specific contributions to the emissions gap for the UK car and van fleet. We also examine the
potential long-term impact of new laboratory and on-road test procedures and the extent to which
they can close the gap.
The current new car and van test procedure in the EU, the New European Drive Cycle (NEDC), was
last amended in the 1990s and was originally developed for measuring air pollutants rather than
CO2 emissions. Previous work on the real-world gap by ICCT has shown that the increasing gap has
been caused by limitations in the current procedure and optimisations made by vehicle
manufacturers to minimise emissions during vehicle testing that do not translate to real-world
savings. Partly to address these limitations, the development of a new test procedure, the
Worldwide Harmonized Light Vehicles Test Procedure (WLTP) began in 2007 and the first phase was
completed in 2014. Implementation of the WLTP in the EU is anticipated for 2017. The WLTP brings
with it changes to the test cycle itself, for example, the speed trace that must be followed during
vehicle testing, as well as changes to the test procedure, i.e. aspects like the ambient test
temperature or vehicle test weight.
This study builds on the previous work by ICCT, and is the first to explore in detail the effects of the
transition to the new test procedure on the future emissions gap, and to estimate the impact of the
gap on the overall UK light vehicle fleet rather than only on a per vehicle basis. Since the WLTP does
not include any changes related to the enforcement of vehicle testing regulations, analysis was also
carried out on the effects of additional changes to vehicle test procedures in the 2020s, for example
through the use of in-use conformity testing of vehicles on public roads.
The study involved several work-streams.
First, a detailed bottom-up analysis of the factors driving the current emissions gap was
carried out, building on previous work on this topic as well as discussions with experts
from the automotive and vehicle testing sector.
Secondly, a ‘top down’ analysis of the real world gap was carried out, by comparing user-
reported fuel consumption data with official laboratory test values.
In order to assess the future size of the gap, as part of a third work-stream, today’s NEDC
and the future WLTP test procedures were compared and the relative impact of each
element of the test procedures on the gap were estimated. The results were again verified
by discussing with automotive and testing experts. In this context, for the first time, this
analysis explored the effects of road speed and driving patterns on the gap.
Finally, the current and future estimates of the real-world emissions gap were applied to
a model of the UK car and van fleet. This moves beyond analysis to date which has focused
only on new vehicle emissions, to assess the impact on national emissions of the UK’s
vehicle fleet as the stock is renewed over time.
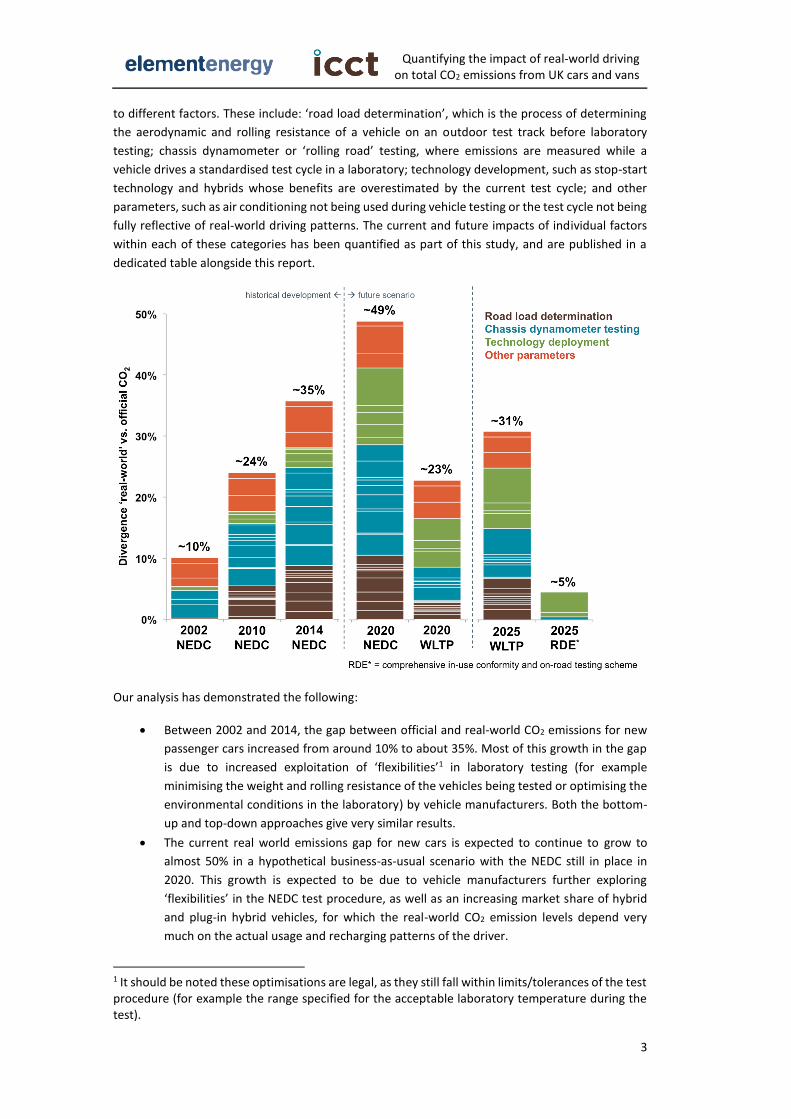
The figure below summarises the historical evolution of the emissions gap, and its expected future
development in future following the transition to WLTP. It also shows the proportion of the gap due
Quantifying the impact of real-world driving on total CO2 emissions from UK cars and vans
3
to different factors. These include: ‘road load determination’, which is the process of determining
the aerodynamic and rolling resistance of a vehicle on an outdoor test track before laboratory
testing; chassis dynamometer or ‘rolling road’ testing, where emissions are measured while a
vehicle drives a standardised test cycle in a laboratory; technology development, such as stop-start
technology and hybrids whose benefits are overestimated by the current test cycle; and other
parameters, such as air conditioning not being used during vehicle testing or the test cycle not being
fully reflective of real-world driving patterns. The current and future impacts of individual factors
within each of these categories has been quantified as part of this study, and are published in a
dedicated table alongside this report.
Our analysis has demonstrated the following:
Between 2002 and 2014, the gap between official and real-world CO2 emissions for new
passenger cars increased from around 10% to about 35%. Most of this growth in the gap
is due to increased exploitation of ‘flexibilities’1 in laboratory testing (for example
minimising the weight and rolling resistance of the vehicles being tested or optimising the
environmental conditions in the laboratory) by vehicle manufacturers. Both the bottom-
up and top-down approaches give very similar results.
The current real world emissions gap for new cars is expected to continue to grow to
almost 50% in a hypothetical business-as-usual scenario with the NEDC still in place in
2020. This growth is expected to be due to vehicle manufacturers further exploring
‘flexibilities’ in the NEDC test procedure, as well as an increasing market share of hybrid
and plug-in hybrid vehicles, for which the real-world CO2 emission levels depend very
much on the actual usage and recharging patterns of the driver.
1 It should be noted these optimisations are legal, as they still fall within limits/tolerances of the test procedure (for example the range specified for the acceptable laboratory temperature during the test).
Quantifying the impact of real-world driving on total CO2 emissions from UK cars and vans
4
The anticipated, but not yet guaranteed, introduction of the WLTP in 2017 is expected to
reduce the gap for new cars to about 23%. This is because aspects like vehicle test weight,
test temperature and test driving pattern are estimated to be more in line with real-world
driving for WLTP than it is currently the case in NEDC.
Based on the lower real-world gap expected under the WLTP, introducing the new test
procedure in 2017 would reduce emissions from the UK car fleet by 3 MtCO2 per year in
2020, with a further 1Mt/yr saving for vans. The 3Mt/yr CO2 saving for cars is
approximately 5% of expected UK car emissions in 2020, and is equivalent to taking 1.4
million cars off the road.
Beyond 2020, our analysis suggests that the emissions gap could grow again to about 31%,
even under WLTP, driven by possibilities for vehicle manufacturers to exploit shortcomings
of the new test procedure, as well as a further increase in the market share of hybrid and
plug-in hybrid vehicles. The emissions gap for plug-in hybrid vehicles strongly depends on
real-world driving and re-charging patterns and could be reduced with appropriate
incentives to drive vehicles preferentially in electric mode.
By 2030, the emissions gap for the UK car and van fleet is estimated to be 12 MtCO2 (a gap
of 27%) under WLTP.
The introduction of a comprehensive in-use conformity testing scheme, supplemented by
on-road vehicle testing could help to reduce the gap to about 5% by 2030, saving an
additional 4 MtCO2 per year (7% of car and van emissions in that year) compared with the
WLTP.
For vans, more research is needed to quantify the gap between test-cycle and real-world
CO2 emission levels. Preliminary data collected within this project suggests that the current
level of divergence might be slightly lower than for passenger cars.
Conclusions
Technologies are available to reduce real-world emissions from new cars and vans2 and regulatory
vehicle emissions targets should help to bring such technologies into the market. However, our
analysis suggests that if targets are not based on an effective testing procedure then there is a risk
that manufacturers will find ‘flexibilities’ to reduce emissions during laboratory vehicle testing
without deploying the effective technologies required to achieve similar reductions under real-
world conditions on the road.
Given this risk, it is important that Government emissions targets make some allowance for the
impact of this emissions gap. UK carbon budgets already make such an allowance in their underlying
modelling, using real-world correction factors of a similar magnitude to those considered here3.
However, with uncertainty over how and when new testing procedures will be adopted in the EU,
the CCC will consider the conclusions of this project and the potential impact on future carbon
budgets in more detail as part of its advice on the 5th Carbon Budget, due to be published at the end
of 2015.
This project’s main conclusions are summarised below:
The results presented here suggest that while the WLTP will provide a significant
improvement in the real world emissions gap and providing savings of millions of tonnes
per year in the UK relative to a continuation of the NEDC, a further move towards
independent in-use conformity and on-road testing will be needed to fully close the gap.
2 See (ICCT, 2013) for a summary briefing 3 As well as an adjustment for PHEVs to represent more realistic driving patterns/recharging behaviour.
Quantifying the impact of real-world driving on total CO2 emissions from UK cars and vans
5
As a first step, the CO2 emission data that will be recorded as part of the air pollution RDE
approach, could be published (at no additional cost for authorities) and made available for
analysis of the on-road CO2 emission performance of new vehicle types by authorities and
research institutes.
Given the time required to introduce such an improved testing scheme, including in-use
conformity and on-road vehicle testing for CO2, it is likely that the WLTP will be used to
underpin future fleet CO2 emission targets to at least 2025. If this is the case, regulators
will need to take into account the real-world emissions gap when defining post-2021 fleet
CO2 targets if real-world emissions are to match regulated targets. In other words, future
CO2 targets defined using WLTP should be highly ambitious, ensuring genuine real-world
emission reductions.
Ultimately, continuing efforts to reduce the real-world gap will benefit all stakeholders.
Governments with binding CO2 targets will have increased certainty on the emissions reduction
potential from the light vehicle sector, and avoid unexpected shortfalls in reductions that must
be delivered instead by other sectors. Vehicle users will benefit from realistic estimates of fuel
costs, allowing informed choices on the trade-offs between upfront costs of fuel saving
technologies and future savings. Finally, manufacturers would benefit from increased customer
satisfaction and an increased demand for low emission vehicles which deliver the advertised
emissions and fuel cost benefits. Given these mutual benefits, regulators and the industry
should continue to work towards a timely introduction of the WLTP as currently planned in
2017, while also turning their attention to further changes in test procedures and a pathway to
testing based on real driving emissions.
Quantifying the impact of real-world driving on total CO2 emissions from UK cars and vans
6
1 Background and context
1.1 Vehicle type-approval testing and the real world emissions gap
Vehicle emission regulations were first introduced in the EU in the 1960s and 1970s. At that time a
first version of a European drive cycle for vehicle testing under laboratory conditions was developed.
It was amended in the 1990s and since then has been called the New European Drive Cycle (NEDC).
While the NEDC originally was developed for measuring air pollutant emissions, it gained special
relevance from 2009, when the EU adopted a mandatory CO2 regulation that includes penalty
payments in the case of exceedingly high CO2 emissions. It is important to understand this historical
context of the NEDC, which was introduced at a time when vehicle CO2 emissions were not even
tested and did not have any impact on a vehicle manufacturer’s economic performance. This is very
different from the situation today: CO2 emissions of vehicles need to be determined very accurately
as they have competitive impacts and potentially lead to millions of Euros of penalty payments if a
manufacturer fails to meet its CO2 emission targets. As will be described in more detail in this report,
this change in regulatory framework conditions has led to a considerable growth of the divergence
between type-approval and real-world CO2 emission levels of new cars in the EU.
In 2007, the development of a new vehicle test procedure began at the United Nations (United
Nations Economic Commission for Europe – UNECE) level. A key objective from the start was to
develop a testing scheme that would better reflect actual driving conditions. Another main objective
was to harmonize global test procedures in order to make it easier and cheaper for vehicle
manufacturers to offer the same vehicle models in different markets without having to carry out
separate type-approval like testing for every individual market. After several years of technical and
political discussions at UNECE, in March 2014, the draft regulatory text for the Worldwide
Harmonized Light Vehicles Test Procedure (WLTP) was adopted by UNECE. The WLTP brings with it
changes to the test cycle itself, i.e. the speed trace that needs to be followed during vehicle testing,
as well as changes to the test procedure, i.e. aspects that like the ambient test temperature or
vehicle test weight. The WLTP however does not include any changes related to the enforcement of
vehicle testing regulations. For example, independent and random conformity tests – a standard
practice in markets like the United States – are neither foreseen in the current NEDC-based EU type-
approval scheme nor for future WLTP-based type-approval. Following its adoption at UNECE level,
the WLTP now needs to be transposed into regional/national law. In the case of the EU, the
European Commission anticipates that the WLTP will become mandatory for new vehicle models
from September 2017 on.4
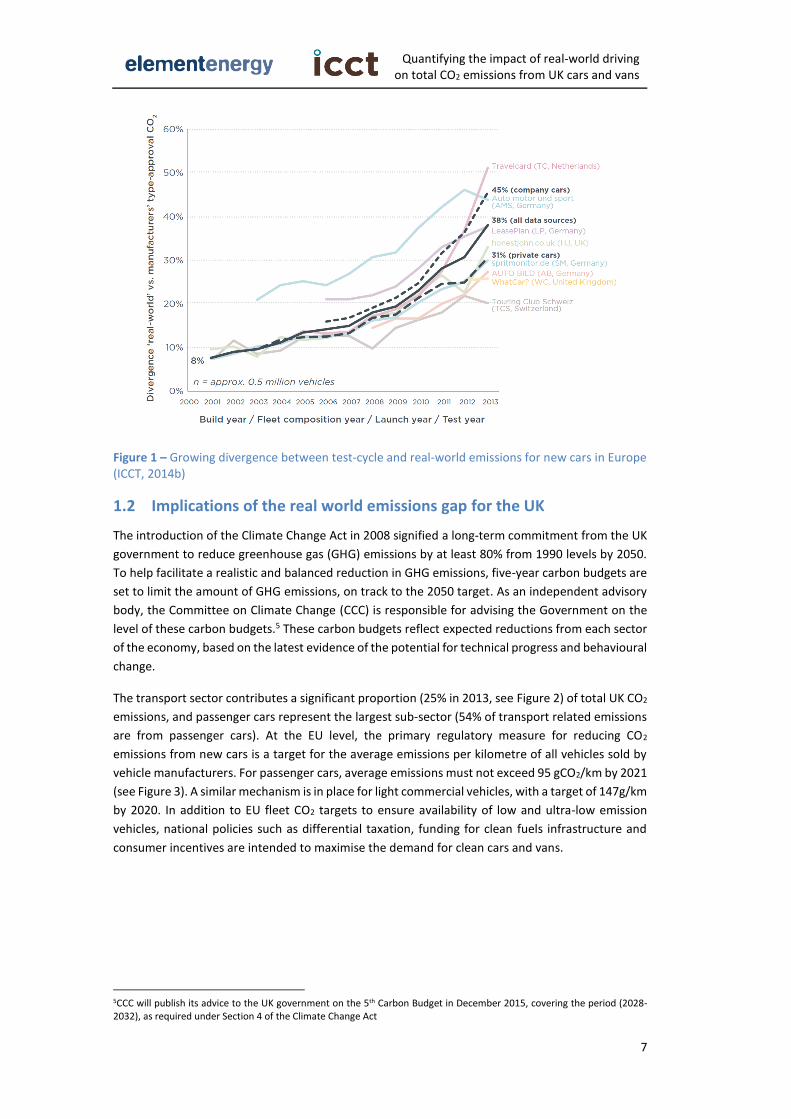
Over the last decade, the difference between the NEDC type approval CO2 emissions and fuel
consumption and performance observed in real world driving has increased significantly, from 8%
in 2000 to 38% in 2013 (see Figure 1). This growing ‘real world emissions gap’ has been highlighted
by a wide range of stakeholders, from regulators and environmental groups concerned about lower
than expected emissions reductions to consumer and motoring groups concerned by car buyers
paying significantly higher fuel bills. Until now, however, there has not been a detailed study on the
impacts of this growing gap on CO2 emissions at a national level.
4 For more details on the development of the WLTP, please refer to (ICCT, 2014a)
Quantifying the impact of real-world driving on total CO2 emissions from UK cars and vans
7
Figure 1 – Growing divergence between test-cycle and real-world emissions for new cars in Europe (ICCT, 2014b)
1.2 Implications of the real world emissions gap for the UK
The introduction of the Climate Change Act in 2008 signified a long-term commitment from the UK
government to reduce greenhouse gas (GHG) emissions by at least 80% from 1990 levels by 2050.
To help facilitate a realistic and balanced reduction in GHG emissions, five-year carbon budgets are
set to limit the amount of GHG emissions, on track to the 2050 target. As an independent advisory
body, the Committee on Climate Change (CCC) is responsible for advising the Government on the
level of these carbon budgets.5 These carbon budgets reflect expected reductions from each sector
of the economy, based on the latest evidence of the potential for technical progress and behavioural
change.
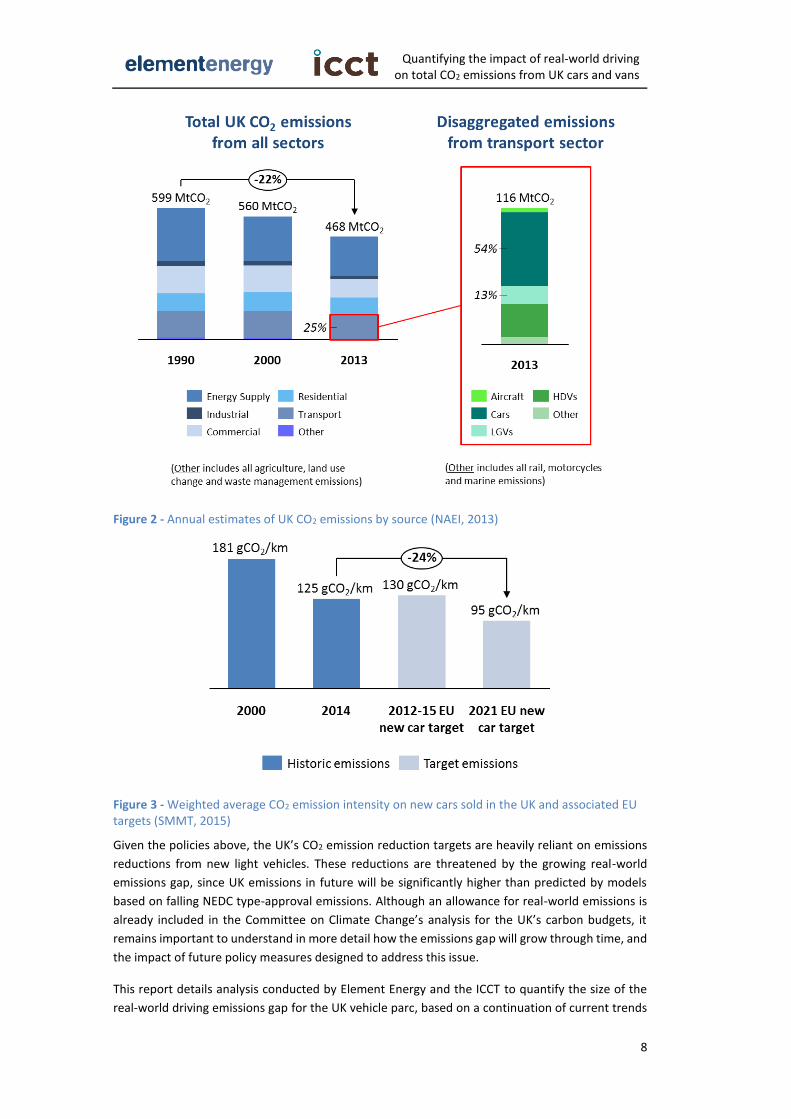
The transport sector contributes a significant proportion (25% in 2013, see Figure 2) of total UK CO2
emissions, and passenger cars represent the largest sub-sector (54% of transport related emissions
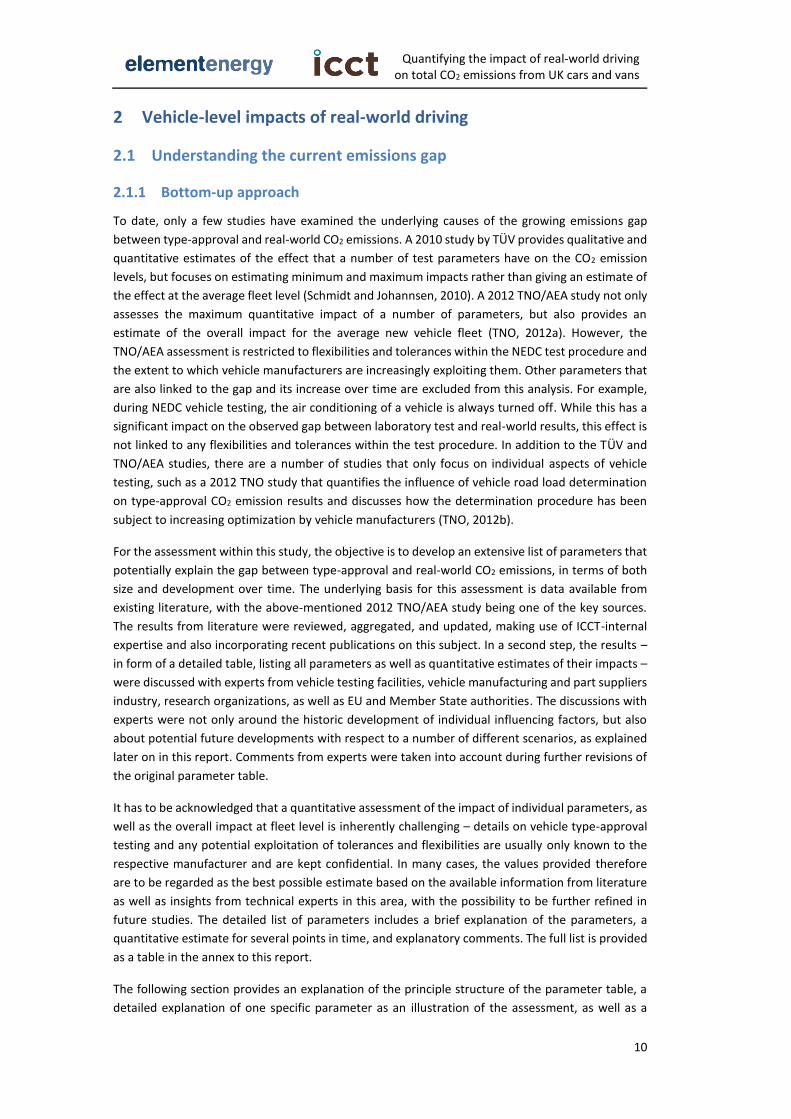
are from passenger cars). At the EU level, the primary regulatory measure for reducing CO2
emissions from new cars is a target for the average emissions per kilometre of all vehicles sold by
vehicle manufacturers. For passenger cars, average emissions must not exceed 95 gCO2/km by 2021
(see Figure 3). A similar mechanism is in place for light commercial vehicles, with a target of 147g/km
by 2020. In addition to EU fleet CO2 targets to ensure availability of low and ultra-low emission
vehicles, national policies such as differential taxation, funding for clean fuels infrastructure and
consumer incentives are intended to maximise the demand for clean cars and vans.
5CCC will publish its advice to the UK government on the 5th Carbon Budget in December 2015, covering the period (2028-2032), as required under Section 4 of the Climate Change Act
Quantifying the impact of real-world driving on total CO2 emissions from UK cars and vans
8
Figure 2 - Annual estimates of UK CO2 emissions by source (NAEI, 2013)
Figure 3 - Weighted average CO2 emission intensity on new cars sold in the UK and associated EU targets (SMMT, 2015)
Given the policies above, the UK’s CO2 emission reduction targets are heavily reliant on emissions
reductions from new light vehicles. These reductions are threatened by the growing real-world
emissions gap, since UK emissions in future will be significantly higher than predicted by models
based on falling NEDC type-approval emissions. Although an allowance for real-world emissions is
already included in the Committee on Climate Change’s analysis for the UK’s carbon budgets, it
remains important to understand in more detail how the emissions gap will grow through time, and
the impact of future policy measures designed to address this issue.
This report details analysis conducted by Element Energy and the ICCT to quantify the size of the
real-world driving emissions gap for the UK vehicle parc, based on a continuation of current trends

Quantifying the impact of real-world driving on total CO2 emissions from UK cars and vans
9
and a number of future scenarios related to new vehicle test procedures. In doing so it builds on
existing work on the evolution of the gap for new vehicles, and applies these results to a vehicle
fleet model to understand the impact on UK-level emissions as these new vehicles penetrate the
vehicle parc.
Quantifying the impact of real-world driving on total CO2 emissions from UK cars and vans
10
2 Vehicle-level impacts of real-world driving
2.1 Understanding the current emissions gap
2.1.1 Bottom-up approach
To date, only a few studies have examined the underlying causes of the growing emissions gap
between type-approval and real-world CO2 emissions. A 2010 study by TÜV provides qualitative and
quantitative estimates of the effect that a number of test parameters have on the CO2 emission
levels, but focuses on estimating minimum and maximum impacts rather than giving an estimate of
the effect at the average fleet level (Schmidt and Johannsen, 2010). A 2012 TNO/AEA study not only
assesses the maximum quantitative impact of a number of parameters, but also provides an
estimate of the overall impact for the average new vehicle fleet (TNO, 2012a). However, the
TNO/AEA assessment is restricted to flexibilities and tolerances within the NEDC test procedure and
the extent to which vehicle manufacturers are increasingly exploiting them. Other parameters that
are also linked to the gap and its increase over time are excluded from this analysis. For example,
during NEDC vehicle testing, the air conditioning of a vehicle is always turned off. While this has a
significant impact on the observed gap between laboratory test and real-world results, this effect is
not linked to any flexibilities and tolerances within the test procedure. In addition to the TÜV and
TNO/AEA studies, there are a number of studies that only focus on individual aspects of vehicle
testing, such as a 2012 TNO study that quantifies the influence of vehicle road load determination
on type-approval CO2 emission results and discusses how the determination procedure has been
subject to increasing optimization by vehicle manufacturers (TNO, 2012b).
For the assessment within this study, the objective is to develop an extensive list of parameters that
potentially explain the gap between type-approval and real-world CO2 emissions, in terms of both
size and development over time. The underlying basis for this assessment is data available from
existing literature, with the above-mentioned 2012 TNO/AEA study being one of the key sources.
The results from literature were reviewed, aggregated, and updated, making use of ICCT-internal
expertise and also incorporating recent publications on this subject. In a second step, the results –
in form of a detailed table, listing all parameters as well as quantitative estimates of their impacts –
were discussed with experts from vehicle testing facilities, vehicle manufacturing and part suppliers
industry, research organizations, as well as EU and Member State authorities. The discussions with
experts were not only around the historic development of individual influencing factors, but also
about potential future developments with respect to a number of different scenarios, as explained
later on in this report. Comments from experts were taken into account during further revisions of
the original parameter table.
It has to be acknowledged that a quantitative assessment of the impact of individual parameters, as
well as the overall impact at fleet level is inherently challenging – details on vehicle type-approval
testing and any potential exploitation of tolerances and flexibilities are usually only known to the
respective manufacturer and are kept confidential. In many cases, the values provided therefore
are to be regarded as the best possible estimate based on the available information from literature
as well as insights from technical experts in this area, with the possibility to be further refined in
future studies. The detailed list of parameters includes a brief explanation of the parameters, a
quantitative estimate for several points in time, and explanatory comments. The full list is provided
as a table in the annex to this report.
The following section provides an explanation of the principle structure of the parameter table, a
detailed explanation of one specific parameter as an illustration of the assessment, as well as a
Quantifying the impact of real-world driving on total CO2 emissions from UK cars and vans
11
summary of the overall results in terms of historical and future development in a business-as-usual
scenario, i.e. without replacing the NEDC by another test procedure. Alternative scenarios, with
NEDC being replaced by a revised test procedure, are described in later sections of this report.
The parameter table is structured into 4 main categories:
(1) Road load determination: Before testing the emissions of a vehicle in the laboratory, its road
load has to be determined outside the laboratory on a designated test track. The vehicle is
accelerated to a certain target speed (usually around 120 km/h) and then coasts until it
(almost) comes to a full stop. From the time it takes the vehicle to slow down, its respective
aerodynamic resistance, rolling resistance and its inertia are calculated – the so-called road
load coefficients. These coefficients are then used as input variables for emissions testing in
the laboratory – where the wheels of the vehicle are spinning but the vehicle itself is stationary
– to simulate the vehicle road load. There are a number of parameters within this road load
determination procedure that are known to offer vehicle manufacturers potential for
exploiting given tolerances and flexibilities. These include, for example, tyre selection, tyre
preparation, selection of the test track, ambient test conditions, representativeness of the test
vehicle, and pre-conditioning of the vehicle.
(2) Chassis dynamometer testing: Both for NEDC and WLTP, testing takes place inside a laboratory
environment on a so-called chassis dynamometer. There are some fundamental reasons for
why there is a difference in the emission results for laboratory testing (as defined by
NEDC/WLTP) and on-road driving, such as differences in ambient conditions, driving behaviour,
and the definition of vehicle test weight (for NEDC testing only the minimum weight of a
vehicle is taken into account, leaving out the weight of any optional equipment). In addition,
there are a number of tolerances and flexibilities in the respective regulations for chassis
dynamometer testing that can potentially be exploited by vehicle manufacturers. These
include running-in periods for the test vehicle, tolerances regarding laboratory instruments,
representativeness of the pre-production test vehicle and powertrain, the state of charge of
the vehicle’s battery, and special test driving techniques.
(3) Technology deployment: This section summarises the influence that certain technologies
might have on the CO2 gap as well as the change in influence that follows from an increasing
deployment of these technologies in the fleet. Examples include stop-start technology and
hybrid technologies.
(4) Other factors: The last section includes the effect of the use of air conditioning in vehicles on
the road, the use of auxiliary electric devices, as well as potential changes in customers’ drive
patterns over time.
Within each of the four sections a brief explanation is provided for each parameter together with a
quantitative estimate of its impact for the years 2002, 2010 and 2014. The years 2002 and 2010
were chosen because they were the years that the 2012 TNO/AEA study focused on. The year 2014
was added to provide the most recent data as possible. Furthermore, the years 2020 and 2025 were
included as an outlook towards potential further developments of the gap between official and real-
world CO2 data. The impact for each parameter is expressed in percentage points, i.e., if the overall
gap was 30% and the impact of a parameter was estimated at 5%, then the remaining 25 percentage
points are explained by other parameters. Some influencing parameters have an impact in absolute
terms, i.e. there is constant impact in g/km independent of the CO2 emission level of the vehicle,
while others have a relative impact, i.e. the impact in terms of g/km varies depending on the overall
Quantifying the impact of real-world driving on total CO2 emissions from UK cars and vans
12
CO2 emission level of the vehicle. For the analysis, all impacts were expressed in percentage terms,
while accounting for the fact that the overall CO2 emission level for the new car fleet has changed
over the years. To calculate the relative impact, it is assumed that the average real-world CO2
emission level of new cars in 2002 was 182 g/km and decreased to a level of 162 g/km by 2014.6 It
should be noted that for the bottom-up estimate of influencing factors, the focus was put on private
car owners, rather than company car fleets. To provide some assessment of differences between
individual vehicle segments, columns for the small, medium and large passenger car segments, as
well as for light-commercial vehicles (vans), are included in the table. Furthermore, a separate
column is included to assess whether any significant difference between the EU estimate and the
UK estimate is expected.
Taking the example of the definition of vehicle test weight, the structure of the parameter table is
illustrated in more detail. There are two vehicle weight aspects that have an influence on laboratory
CO2 emission testing:
(1) For the NEDC, discrete inertia classes are defined. Vehicle manufacturers can therefore
deliberately reduce vehicle weight by a few kilograms to make them ‘jump’ into a lower inertia
class category. In doing so, it is possible to reduce the type-approval CO2 emissions of the
vehicle by a few grams, but the effect for consumers is close to zero, i.e. the CO2 ‘savings’
obtained during the test procedure do not materialize on the road. The effect has been
documented in detail in a previous analysis and it was shown that, in 2011, about 30% of new
vehicles made use of this flexibility of the test procedure (ICCT, 2011). For the analysis, it was
assumed that, in 2014, 30% of vehicles still were affected, explaining about 0.5 percentage
points of the overall CO2 emissions gap. The effect is assumed to be the same for all vehicle
segments and no reasons were found for the estimate to be different for the UK compared to
the EU average fleet. For vans, it is expected that the impact of this test procedure flexibility is
significantly larger because all vans above 2.2 tons of weight are represented by one inertia
class in the current inertia-based NEDC test procedure. In other words, about 50% of all vans
are assigned an inertia class of 2.2 tons, even though their real weight can be several hundred
kilograms higher than that.
(2) The second aspect related to vehicle weight is the fact that, for NEDC vehicle testing, no
optional vehicle equipment or load is taken into account, i.e. basically the lightest available
version of a vehicle model is tested. It was estimated that, in 2002, the additional weight under
real-world conditions due to optional equipment was around 30 kg and that it increased over
the years to around 70 kg by 2014. This increase results from the introduction of additional
equipment, such as navigation systems, but also because manufacturers have increasingly
exploited this flexibility, for example by offering a radio, an air conditioning system or a spare
wheel only as optional equipment instead of including it in the base weight of the vehicle.
Furthermore, the average payload (excluding passengers) used during real-world driving was
estimated to be around 55 kg. In addition to the effect of the inertia class system, the weight
impact of optional equipment and payload is expected to account for about 3.5 percentage
points of the overall gap observed in 2014. Again, the analysis suggests that this impact is
similar in its magnitude for all passenger car segments as well as for the UK new vehicle fleet.
To arrive at an estimate for the overall impact of the various parameters, the impacts of the
individual parameters are multiplied with each other. This is because the effects of different
6 The real-world CO2 emission levels were determined by taking the official CO2 monitoring data and applying the average real-world adjustment factors from ICCT, 2014b for the respective years.
Quantifying the impact of real-world driving on total CO2 emissions from UK cars and vans
13
parameters on the CO2 emissions of a vehicle tend to overlap. By multiplying instead of simply
summing up the different effects, these overlaps, or interaction effects, are taken into account and
the overall impact is discounted accordingly. This method is in line with the approach chosen by
TNO/AEA for their 2012 study.
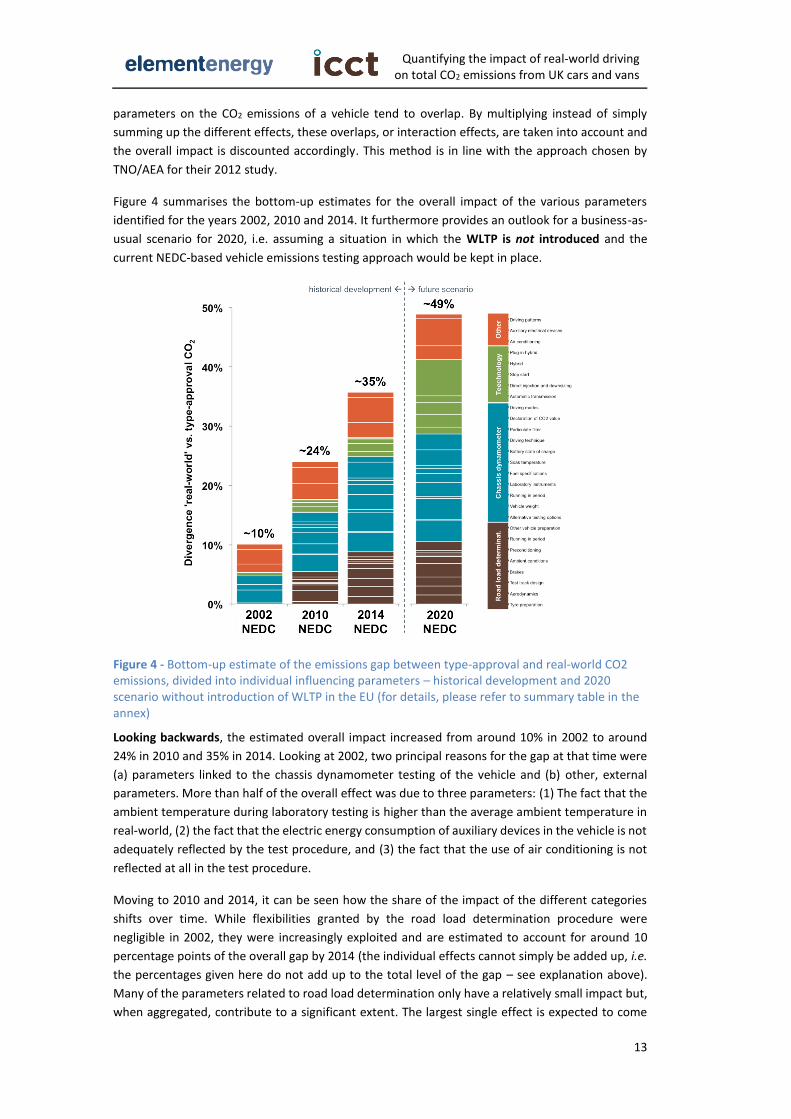
Figure 4 summarises the bottom-up estimates for the overall impact of the various parameters
identified for the years 2002, 2010 and 2014. It furthermore provides an outlook for a business-as-
usual scenario for 2020, i.e. assuming a situation in which the WLTP is not introduced and the
current NEDC-based vehicle emissions testing approach would be kept in place.
Figure 4 - Bottom-up estimate of the emissions gap between type-approval and real-world CO2 emissions, divided into individual influencing parameters – historical development and 2020 scenario without introduction of WLTP in the EU (for details, please refer to summary table in the annex)
Looking backwards, the estimated overall impact increased from around 10% in 2002 to around
24% in 2010 and 35% in 2014. Looking at 2002, two principal reasons for the gap at that time were
(a) parameters linked to the chassis dynamometer testing of the vehicle and (b) other, external
parameters. More than half of the overall effect was due to three parameters: (1) The fact that the
ambient temperature during laboratory testing is higher than the average ambient temperature in
real-world, (2) the fact that the electric energy consumption of auxiliary devices in the vehicle is not
adequately reflected by the test procedure, and (3) the fact that the use of air conditioning is not
reflected at all in the test procedure.
Moving to 2010 and 2014, it can be seen how the share of the impact of the different categories
shifts over time. While flexibilities granted by the road load determination procedure were
negligible in 2002, they were increasingly exploited and are estimated to account for around 10
percentage points of the overall gap by 2014 (the individual effects cannot simply be added up, i.e.
the percentages given here do not add up to the total level of the gap – see explanation above).
Many of the parameters related to road load determination only have a relatively small impact but,
when aggregated, contribute to a significant extent. The largest single effect is expected to come
Quantifying the impact of real-world driving on total CO2 emissions from UK cars and vans
14
from tyre preparation, i.e. from manufacturers carefully choosing and preparing the vehicle tyres
that are used during road load determination. Similarly, the analysis suggests that flexibilities and
tolerances included in the laboratory chassis dynamometer testing procedure were also exploited
more and more over time, accounting for only about 4.5 percentage points in 2002 but around 19
percentage points by 2014. For example, one of the parameters that is most likely systematically
exploited by now is the possibility for manufacturers to declare a CO2 emission level that is up to 4%
lower than the measured CO2 emission figure. Vehicle testing experts widely agree that, given the
precision of today’s measuring equipment, it has become possible and common to make almost full
use of this flexibility. The third most significant area contributing to the overall gap in 2014 were
other, external effects. While statistical data suggests that the use of air conditioning devices has
not significantly changed since 2002, the amount of electricity consumed by other electrical devices
and the impact of this aspect likely have increased. As a result, these other effects are estimated to
have been responsible for about 5 percentage points in 2002 and about 9 percentage points by
2014. Finally, the impact of new technologies being deployed is expected to have had a relatively
minor impact on the growing gap between 2002 and 2014. The effect is estimated to have been
below one percentage point in 2002 and around 4 percentage points in 2014.
Looking forward, however, as Figure 4 highlights, the deployment of new technologies is likely to
have a drastic impact on the gap between type-approval and real-world vehicle CO2 emissions.
Assuming a 2020 world without the introduction of WLTP, it is estimated that the overall gap would
increase much further, from around 35% in 2014 to around 50% by 2020 (details on the estimated
future effect for individual influencing parameters can be found in the table in the annex to the
report). Based on literature data and expert interviews, it is expected that for the areas of road load
determination, chassis dynamometer testing, and external parameters, only moderate
opportunities for further exploitation of flexibilities exist (mainly because real-world CO2 data and
experts’ feedback suggest that at this point in time not yet all vehicle manufacturers are fully
exploiting the known flexibilities). These three areas are estimated to account for around two thirds
of the gap by 2020. However, the deployment of new technologies presents further possibilities for
reducing type-approval CO2 values. The analysis suggests that by 2020, the impact of new
technologies will be around one third of the gap, compared to only about one tenth in 2014.
This strong increase is mainly explained by the fact that the market share of plug-in hybrid vehicles
was less than 1% in 2014 but is assumed to increase to 8% by 20207. There is increasing empirical
evidence that the real-world CO2 emissions of plug-in cars can be significantly higher than those
determined during type-approval testing. There is two main reasons behind this finding:
(1) In the NEDC, a formula is used to calculate the CO2 emissions of a plug-in vehicle. Based on this
formula, the CO2 emissions of a vehicle are reduced by 50% if it has an electric range of 25 km in
NEDC. For any additional 25 km of electric range, the CO2 emission level is reduced by another
third. Most of today’s plug-in hybrid vehicles have an electric driving range in the NEDC that is
between 25 and 50 km. As a result, for the NEDC it is assumed that those vehicles are driven in
electric mode for roughly two thirds of their mileage8. In reality, the electric driving shares for
plug-in hybrids will vary widely between individual customers. This is why a quantitative
estimate for the real-world CO2 ‘gap’ for plug-in hybrids is especially challenging. Nevertheless,
data from (Fraunhofer, 2015) suggests that electric driving shares for many plug-in hybrid
7 The future market shares of plug-in hybrid vehicles used for the analysis within this project were provided as external input data by the CCC. 8 (Fraunhofer, 2015) provides more detailed estimates for some popular plug-in hybrid vehicle models; according to this study, the NEDC electric driving range is about 50% for the Toyota Prius plug-in hybrid, 67% for the Mitsubishi Outlander and Volvo V60, and about 77% for the Chevrolet Volt/Opel Ampera.
Quantifying the impact of real-world driving on total CO2 emissions from UK cars and vans
15
models are lower than assumed for NEDC testing9. For our assessment we assume that the
average electric drive share of plug-in hybrid vehicles in the NEDC is 75%, while in real-world it
is only 50%. Furthermore, assuming a CO2 emission level of 150 g/km for the combustion engine
of the plug-in vehicle, the resulting real-world offset is about 50%, i.e. due to the NEDC CO2
calculation formula the real-world CO2 emission level of a plug-in hybrid vehicle is estimated to
be 50% higher than suggested by its NEDC type-approval figure.
(2) Even if the electric drive share in NEDC was fully representative of real-world driving, there
would still be the possibility for a vehicle driver to re-fuel the plug-in vehicle with petrol instead
of re-charging it with electricity. As reported for example in (TNO, 2014), this is currently not
unusual, especially for company cars where petrol re-fuelling is usually paid for by the employer
while electricity recharging is not. As a result, the real-world offset for plug-in hybrid vehicles in
the Netherlands is – on average, based on a statistical sample of 2,500 cars – about 200%, i.e.
much higher than the effect that is explained by the unrealistic electric drive range assumed for
the NEDC. While the effect of this re-fuelling behaviour is expected to be particularly high in the
Netherlands, data for about 200 plug-in hybrid vehicles in Germany, and also plug-in vehicle
tests of car magazines in Germany10, suggest that the real-world offset – on average – is closer
to 100-150%.
Taking these findings together, for our assessment for 2020 we assume a 100% real-world offset for
plug-in hybrid vehicles, i.e. that these vehicles emit about twice as much of CO2 than suggested by
the official CO2 type-approval figures. It should be noted that, even when taking into account this
particularly high offset for plug-in hybrids, these vehicles still have relatively low CO2 emissions
compared to their combustion engine counterparts. For example, the Volvo V60 plug-in hybrid emits
48 g/km of CO2 in NEDC, or 96 g/km in real-world based on our assumed offset-factor. This is about
one third of a comparable V60 diesel vehicle. It should also be mentioned that for the future changes
in re-charging behaviour of plug-in hybrid vehicles are assumed, thereby lowering the real-world
offset factor (more details provided in the next section of this report).
Based on the findings outlined above, conclusions can be drawn from the bottom-up approach to
estimating the impact of various influencing parameters on the gap between type-approval and
real-world CO2 emission levels:
Increasing exploitation of tolerances and flexibilities in the road load determination and chassis
dynamometer testing procedures are the main reasons for the increasing gap between 2002
and 2014.
In the absence of the introduction of the WLTP, the level of the gap is expected to increase
from about 35% in 2014 to about 50% by 2020. The large difference between the average CO2
emission performance of plug-in electric vehicles under laboratory NEDC test conditions and
real-world usage is expected to be a main driver of this additional growth in the gap between
2014 and 2020.
Based on the bottom-up estimates, no significant difference for the impact of the various
influencing parameters was found between different car segments, nor were the EU and UK
car fleet impacted differently (details on this aspect to be found in the table in the annex).
9 The study finds a real-world electric driving share of 50% or less for the Toyota Prius, Mitsubishi Outlander and Volvo V60. Only for the Chevrolet Volt / Opel Ampera, a higher electric drive share is found (it should be acknowledged though that the data sample of the study focuses mostly on US customers). 10 Auto Bild (http://www.autobild.de) and Auto Motor und Sport (http://www.auto-motor-und-sport.de)
Quantifying the impact of real-world driving on total CO2 emissions from UK cars and vans
16
2.1.2 Top-down approach
To complement the analysis above a second approach was followed to arrive at an estimate of the
gap between type-approval and real-world CO2 emission levels, based on a large dataset of self-
reported on-road fuel consumption values. The main data source for this assessment is the German
consumer website Spritmonitor11. More than 300,000 registered users, mostly private car owners,
report on-road fuel consumption of their vehicles to the Spritmonitor service. As has been shown in
previous studies, while driving styles and resulting fuel consumption figures may vary significantly
between individual drivers, statistical analyses of large collections of such data reveal clear trends
about the gap between type-approval and real-world CO2 levels as well as the development of this
gap over time (ICCT, 2014b).
For the analysis within this study, data from approximately 200,000 passenger cars from
Spritmonitor for the build years 2001-2014 was analysed. After filtering for valid, complete entries
and conducting outlier detection based on Peirce’s criterion12, the final dataset includes detailed
data for approximately 150,000 vehicles. The data was then broken down by fuel type, vehicle
segment, road type, and build year. The resulting matrices were used for the analysis in three
distinct ways:
(1) The average size of the gap, derived using the top-down approach, for the years 2002, 2010
and 2014 were compared with the calculated overall impact factors from the bottom-up
approach.
(2) The factors derived from the top-down approach, subdivided by model year, fuel, segment and
road type, serve as an input for the fleet model discussed further below, in the form of real-
world CO2 emission adjustment factors.
(3) The real-world CO2 emission adjustment factors derived in (2) serve as a basis for applying any
predicted future development of the gap and for estimating the impact on future fleet CO2
emission levels.
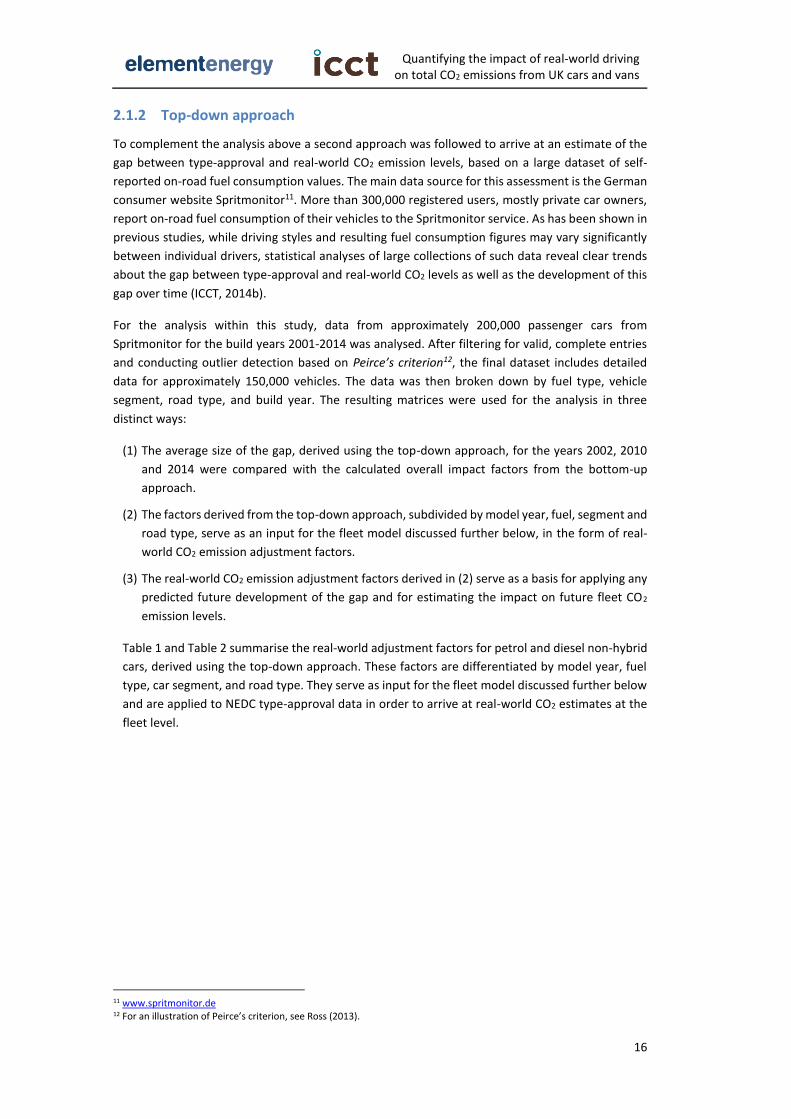
Table 1 and Table 2 summarise the real-world adjustment factors for petrol and diesel non-hybrid
cars, derived using the top-down approach. These factors are differentiated by model year, fuel
type, car segment, and road type. They serve as input for the fleet model discussed further below
and are applied to NEDC type-approval data in order to arrive at real-world CO2 estimates at the
fleet level.
11 www.spritmonitor.de 12 For an illustration of Peirce’s criterion, see Ross (2013).
Quantifying the impact of real-world driving on total CO2 emissions from UK cars and vans
17
Table 1 - Petrol car real-world adjustment factors to be applied to NEDC type-approval data, derived using a top-down approach from Spritmonitor data13
Table 2 - Diesel car real-world adjustment factors to be applied to NEDC type-approval data, derived using a top-down approach from Spritmonitor data
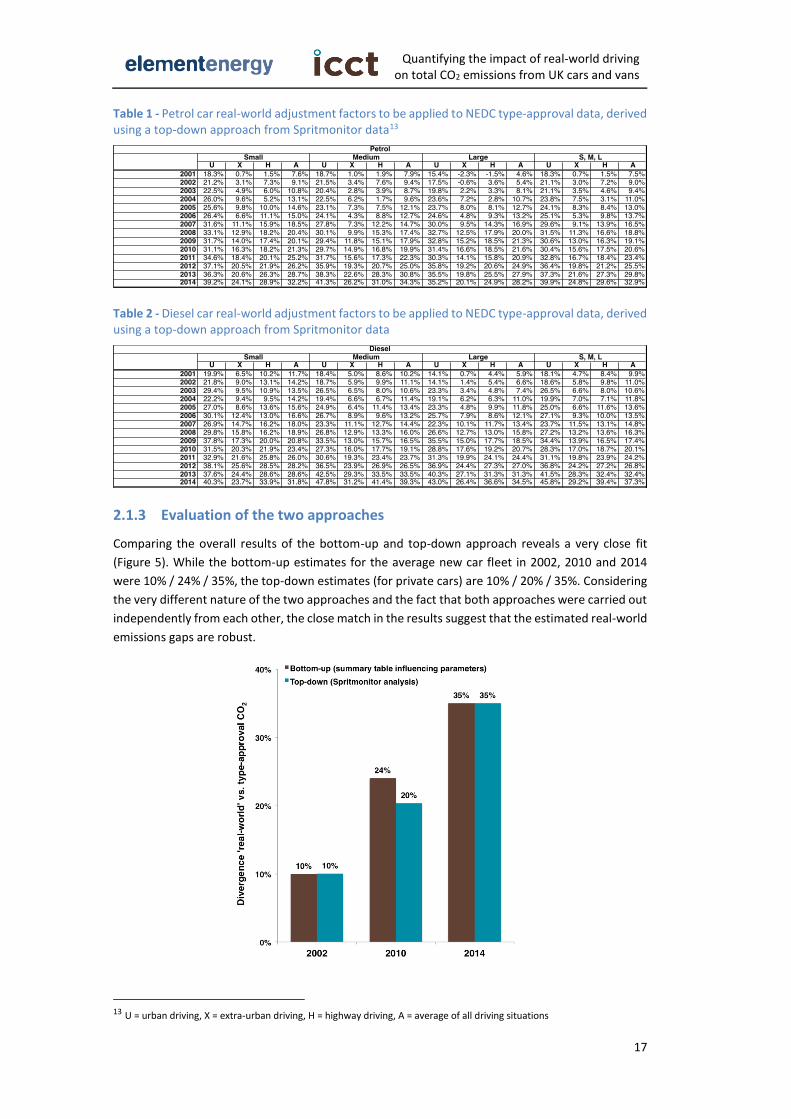
2.1.3 Evaluation of the two approaches
Comparing the overall results of the bottom-up and top-down approach reveals a very close fit
(Figure 5). While the bottom-up estimates for the average new car fleet in 2002, 2010 and 2014
were 10% / 24% / 35%, the top-down estimates (for private cars) are 10% / 20% / 35%. Considering
the very different nature of the two approaches and the fact that both approaches were carried out
independently from each other, the close match in the results suggest that the estimated real-world
emissions gaps are robust.
13 U = urban driving, X = extra-urban driving, H = highway driving, A = average of all driving situations
Quantifying the impact of real-world driving on total CO2 emissions from UK cars and vans
18
Figure 5 - Comparison of the estimated real-world gap, using a bottom-up (by aggregating quantitative estimates for individual parameters) and top-down (by analysing user reported data from Spritmonitor) approach
For 2014, the results can also be compared at vehicle segment level (for 2002 and 2010 the bottom-
up approach was not carried out for individual vehicle segments). As for the overall results, the
estimates by vehicle segment are very close for the two approaches, generally within 4 percentage
points (Figure 6).
Figure 6 - Comparison of the estimated real-world gap in 2014 by car segment, using a bottom-up and top-down approach
Focusing on the UK, in the bottom-up approach, no significant difference between the estimates for
the EU average new car fleet and the new car fleet in the UK was found. This is because the UK new
vehicle market resembles the EU average in many respects. For example, the market share of diesel
cars is 50% in the UK, compared to 53% for the EU average (ICCT, 2014c). Similarly, the share of
hybrid (1.3% vs. 1.4%) and plug-in hybrid (in both cases below 0.5%) vehicles is very similar. External
aspects, such as average ambient temperature and road speed profiles are similar enough to not
expect any major differences for the UK new car fleet.
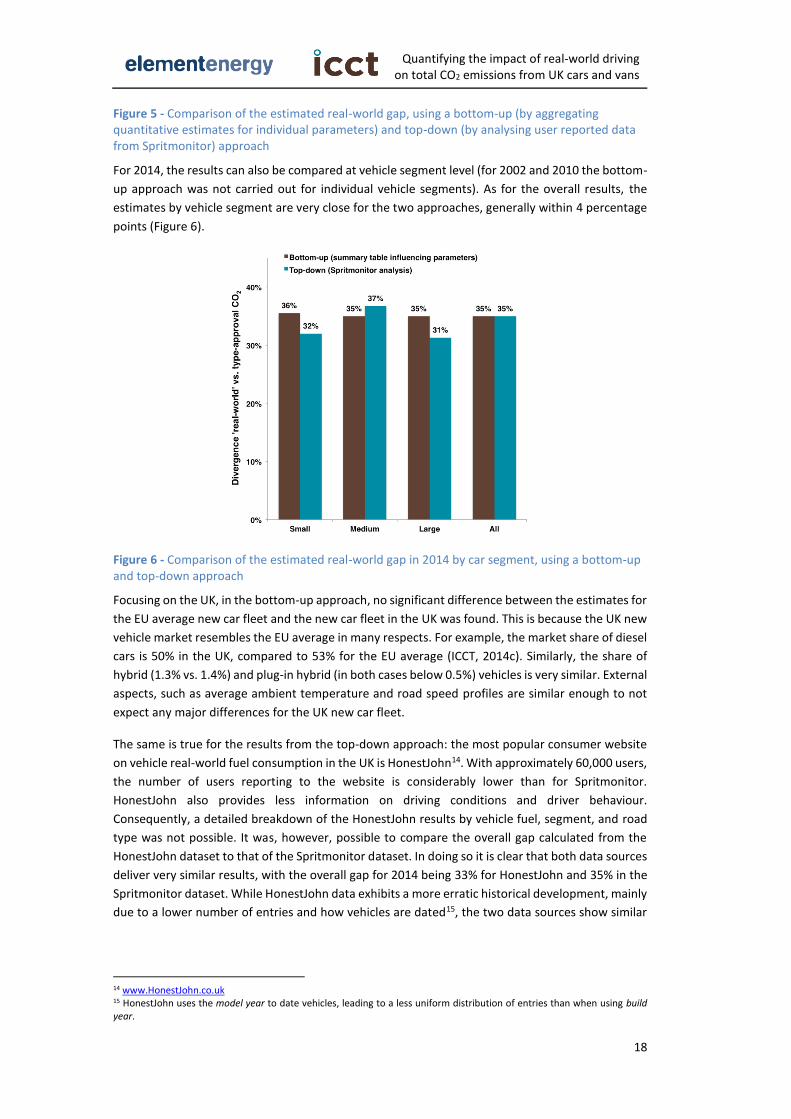
The same is true for the results from the top-down approach: the most popular consumer website
on vehicle real-world fuel consumption in the UK is HonestJohn14. With approximately 60,000 users,
the number of users reporting to the website is considerably lower than for Spritmonitor.
HonestJohn also provides less information on driving conditions and driver behaviour.
Consequently, a detailed breakdown of the HonestJohn results by vehicle fuel, segment, and road
type was not possible. It was, however, possible to compare the overall gap calculated from the
HonestJohn dataset to that of the Spritmonitor dataset. In doing so it is clear that both data sources
deliver very similar results, with the overall gap for 2014 being 33% for HonestJohn and 35% in the
Spritmonitor dataset. While HonestJohn data exhibits a more erratic historical development, mainly
due to a lower number of entries and how vehicles are dated15, the two data sources show similar
14 www.HonestJohn.co.uk 15 HonestJohn uses the model year to date vehicles, leading to a less uniform distribution of entries than when using build year.
Quantifying the impact of real-world driving on total CO2 emissions from UK cars and vans
19
developments in terms of the level and trend of the divergence between real-world and official CO2
emission values (see Figure 7 and Figure 8).
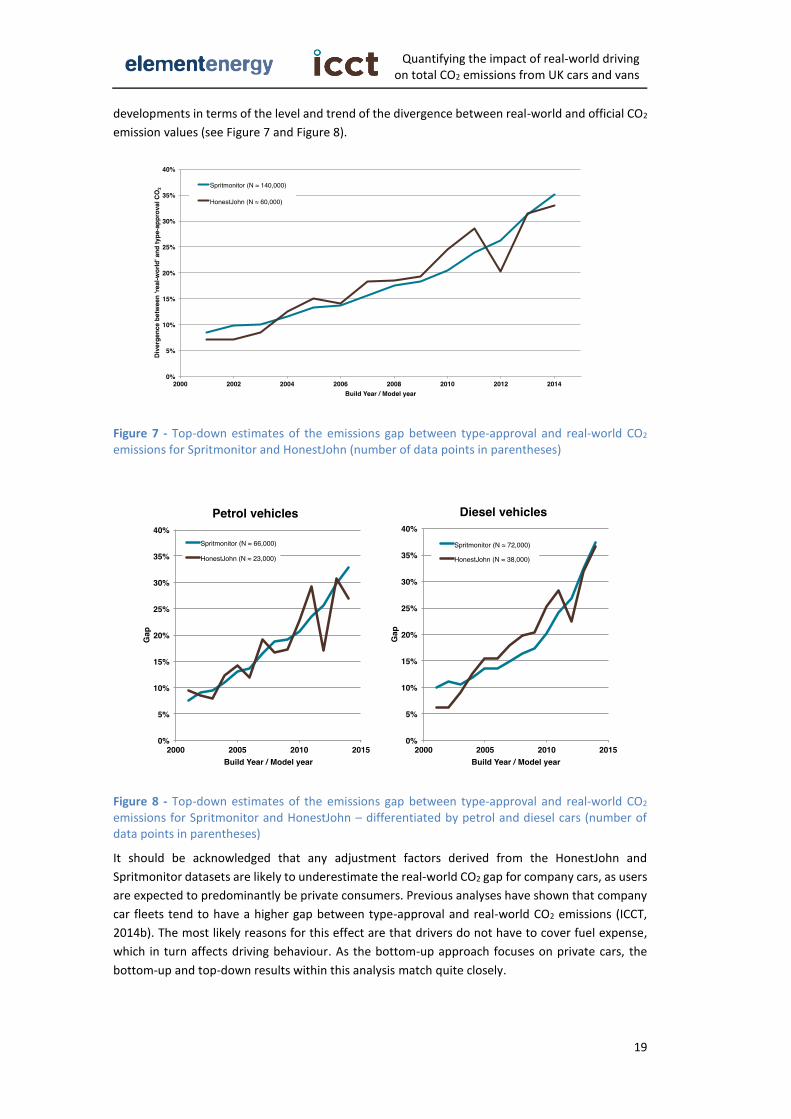
Figure 7 - Top-down estimates of the emissions gap between type-approval and real-world CO2 emissions for Spritmonitor and HonestJohn (number of data points in parentheses)
Figure 8 - Top-down estimates of the emissions gap between type-approval and real-world CO2 emissions for Spritmonitor and HonestJohn – differentiated by petrol and diesel cars (number of data points in parentheses)
It should be acknowledged that any adjustment factors derived from the HonestJohn and
Spritmonitor datasets are likely to underestimate the real-world CO2 gap for company cars, as users
are expected to predominantly be private consumers. Previous analyses have shown that company
car fleets tend to have a higher gap between type-approval and real-world CO2 emissions (ICCT,
2014b). The most likely reasons for this effect are that drivers do not have to cover fuel expense,
which in turn affects driving behaviour. As the bottom-up approach focuses on private cars, the
bottom-up and top-down results within this analysis match quite closely.
Quantifying the impact of real-world driving on total CO2 emissions from UK cars and vans
20
2.2 Effect of introducing a new type-approval test on the emissions gap
in 2020
As explained in Section 1.1, a new test procedure, the WLTP, was developed and adopted at the
UNECE level and is now ready for implementation in the EU. Key changes of the WLTP compared to
the NEDC include:
A driving cycle that is longer (1,800 seconds instead of 1,180 seconds), is conducted at
higher speeds (mean velocity 47 km/h instead of 34 km/h), and is more transient, with a
maximum speed of 130 km/h instead of 120 km/h in the NEDC.
A higher vehicle test mass, taking into account optional equipment and payload of the
vehicle whereas, in the NEDC, only the lightest version without any optional equipment
was tested.
A slightly lower ambient test temperature, defined at 23 ±5 °C instead of 20-30 °C in the
NEDC.
A number of changes in the test procedure, with the intention to design the WLTP to be
more realistic and to contain less flexibilities than the NEDC.
2.2.1 Impact of the WLTP driving cycle
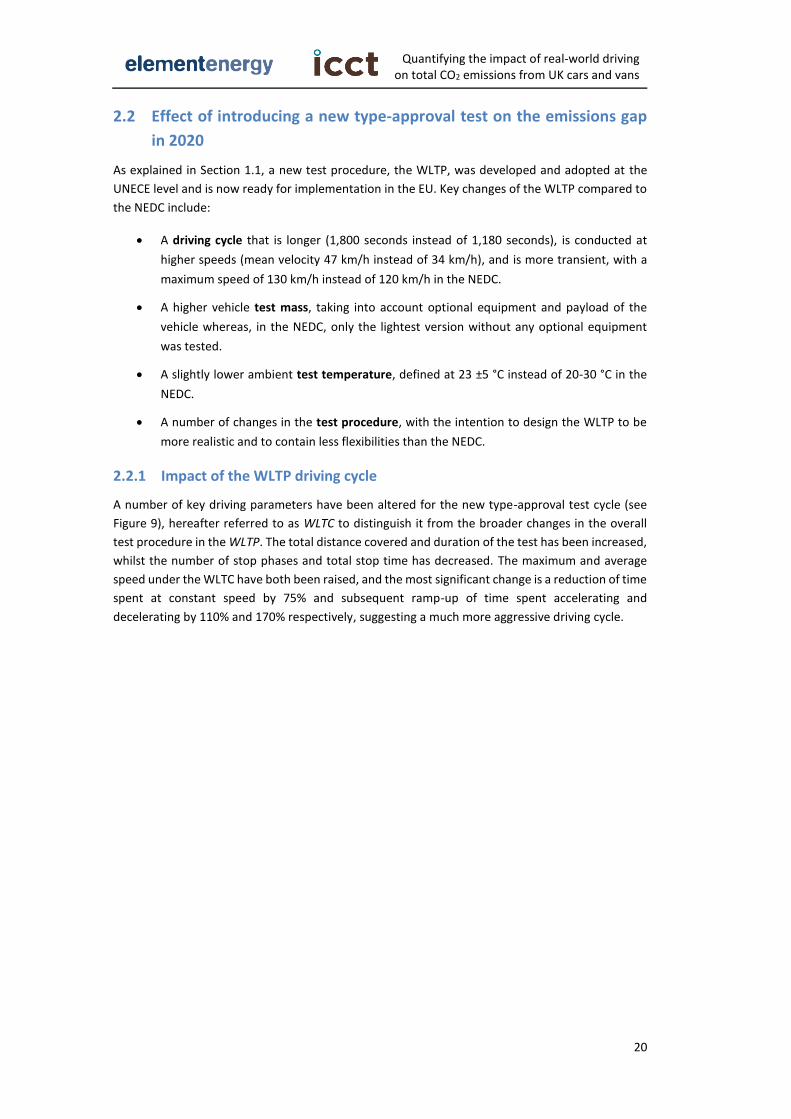
A number of key driving parameters have been altered for the new type-approval test cycle (see
Figure 9), hereafter referred to as WLTC to distinguish it from the broader changes in the overall
test procedure in the WLTP. The total distance covered and duration of the test has been increased,
whilst the number of stop phases and total stop time has decreased. The maximum and average
speed under the WLTC have both been raised, and the most significant change is a reduction of time
spent at constant speed by 75% and subsequent ramp-up of time spent accelerating and
decelerating by 110% and 170% respectively, suggesting a much more aggressive driving cycle.
Quantifying the impact of real-world driving on total CO2 emissions from UK cars and vans
21
Figure 9 – Comparison between key descriptive parameters of the WLTP and NEDC driving cycles
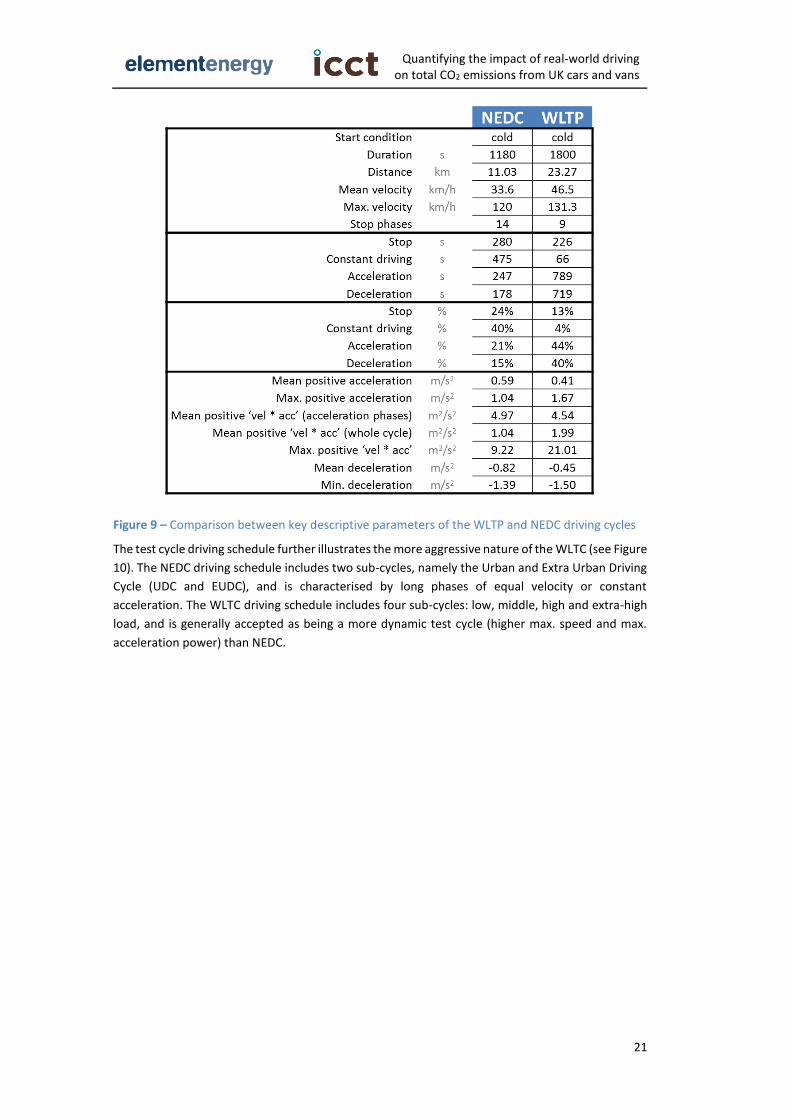
The test cycle driving schedule further illustrates the more aggressive nature of the WLTC (see Figure
10). The NEDC driving schedule includes two sub-cycles, namely the Urban and Extra Urban Driving
Cycle (UDC and EUDC), and is characterised by long phases of equal velocity or constant
acceleration. The WLTC driving schedule includes four sub-cycles: low, middle, high and extra-high
load, and is generally accepted as being a more dynamic test cycle (higher max. speed and max.
acceleration power) than NEDC.
Quantifying the impact of real-world driving on total CO2 emissions from UK cars and vans
22
Figure 10 - Driving schedules for NEDC (top) and WLTC (bottom) test cycles (ICCT, 2014f)
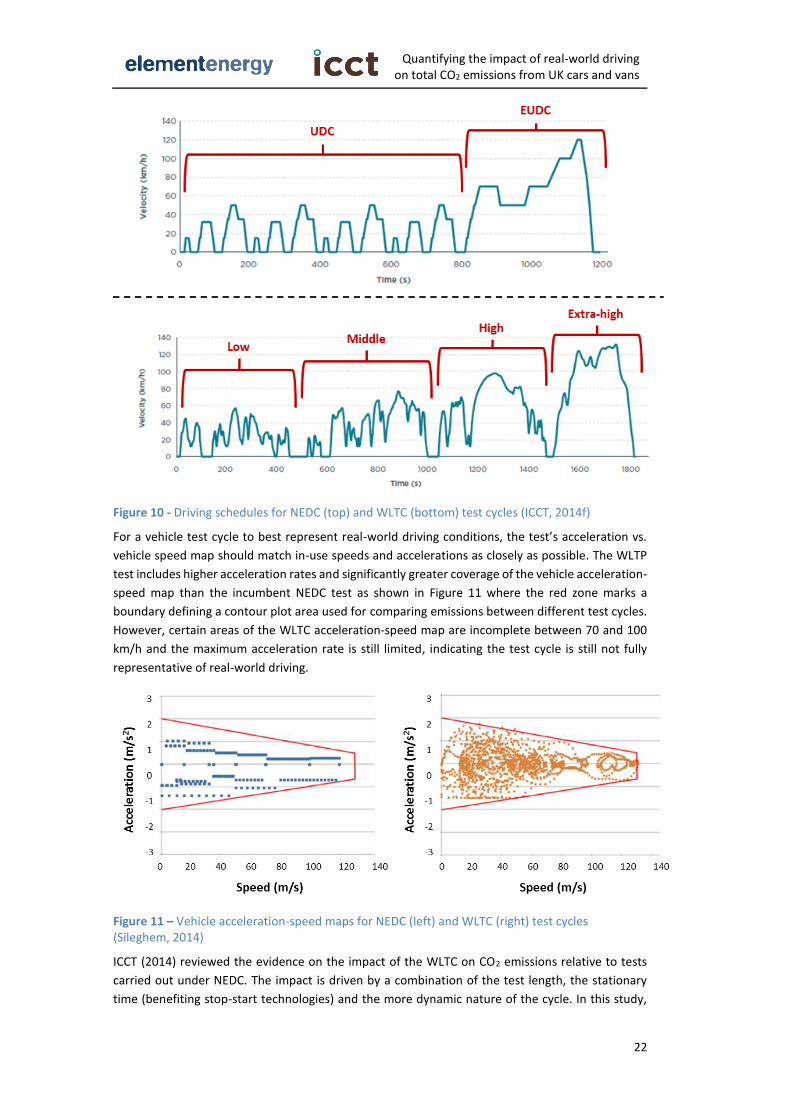
For a vehicle test cycle to best represent real-world driving conditions, the test’s acceleration vs.
vehicle speed map should match in-use speeds and accelerations as closely as possible. The WLTP
test includes higher acceleration rates and significantly greater coverage of the vehicle acceleration-
speed map than the incumbent NEDC test as shown in Figure 11 where the red zone marks a
boundary defining a contour plot area used for comparing emissions between different test cycles.
However, certain areas of the WLTC acceleration-speed map are incomplete between 70 and 100
km/h and the maximum acceleration rate is still limited, indicating the test cycle is still not fully
representative of real-world driving.
Figure 11 – Vehicle acceleration-speed maps for NEDC (left) and WLTC (right) test cycles (Sileghem, 2014)
ICCT (2014) reviewed the evidence on the impact of the WLTC on CO2 emissions relative to tests
carried out under NEDC. The impact is driven by a combination of the test length, the stationary
time (benefiting stop-start technologies) and the more dynamic nature of the cycle. In this study,
Quantifying the impact of real-world driving on total CO2 emissions from UK cars and vans
23
we conducted an additional analysis to explore whether the change in average speed of the WLTC
versus NEDC could explain any of the difference in emission values. Such a finding would be useful
in comparing the WLTC to average driving speeds on UK roads to assess whether it better reflects
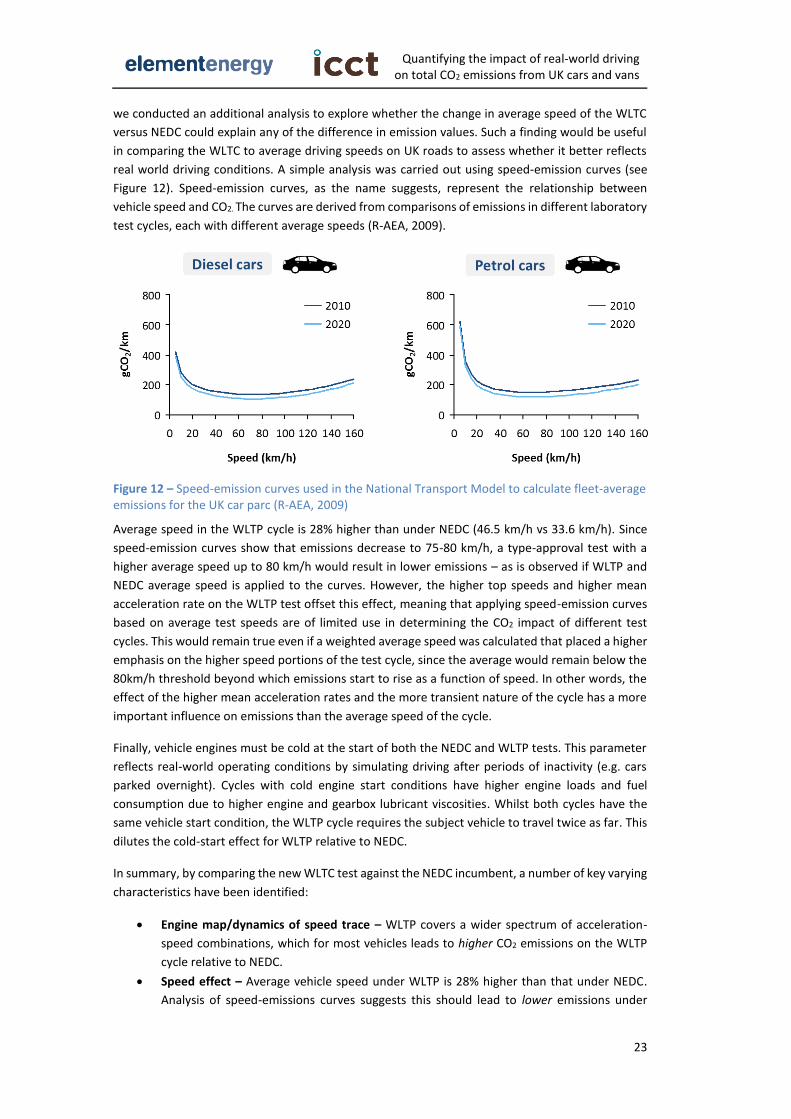
real world driving conditions. A simple analysis was carried out using speed-emission curves (see
Figure 12). Speed-emission curves, as the name suggests, represent the relationship between
vehicle speed and CO2. The curves are derived from comparisons of emissions in different laboratory
test cycles, each with different average speeds (R-AEA, 2009).
Figure 12 – Speed-emission curves used in the National Transport Model to calculate fleet-average emissions for the UK car parc (R-AEA, 2009)
Average speed in the WLTP cycle is 28% higher than under NEDC (46.5 km/h vs 33.6 km/h). Since
speed-emission curves show that emissions decrease to 75-80 km/h, a type-approval test with a
higher average speed up to 80 km/h would result in lower emissions – as is observed if WLTP and
NEDC average speed is applied to the curves. However, the higher top speeds and higher mean
acceleration rate on the WLTP test offset this effect, meaning that applying speed-emission curves
based on average test speeds are of limited use in determining the CO2 impact of different test
cycles. This would remain true even if a weighted average speed was calculated that placed a higher
emphasis on the higher speed portions of the test cycle, since the average would remain below the
80km/h threshold beyond which emissions start to rise as a function of speed. In other words, the
effect of the higher mean acceleration rates and the more transient nature of the cycle has a more
important influence on emissions than the average speed of the cycle.
Finally, vehicle engines must be cold at the start of both the NEDC and WLTP tests. This parameter
reflects real-world operating conditions by simulating driving after periods of inactivity (e.g. cars
parked overnight). Cycles with cold engine start conditions have higher engine loads and fuel
consumption due to higher engine and gearbox lubricant viscosities. Whilst both cycles have the
same vehicle start condition, the WLTP cycle requires the subject vehicle to travel twice as far. This
dilutes the cold-start effect for WLTP relative to NEDC.
In summary, by comparing the new WLTC test against the NEDC incumbent, a number of key varying
characteristics have been identified:
Engine map/dynamics of speed trace – WLTP covers a wider spectrum of acceleration-
speed combinations, which for most vehicles leads to higher CO2 emissions on the WLTP
cycle relative to NEDC.
Speed effect – Average vehicle speed under WLTP is 28% higher than that under NEDC.
Analysis of speed-emissions curves suggests this should lead to lower emissions under
Quantifying the impact of real-world driving on total CO2 emissions from UK cars and vans
24
WLTP compared with NEDC, though this appears to be offset by the more transient nature
of the speed trace
Cold start effect – WLTP cycle distance is double the NEDC distance, thus the overall impact
of the cold start effect is diluted in the new cycle, leading to lower emissions on the WLTP
A recent report quantified the influence of the driving cycle on CO2 emissions between NEDC and
WLTP and found that 2.1% higher emissions are expected under the WLTP cycle (ICCT, 2014a),
suggesting that the three effects described above nearly cancel each other out. This small difference
is included in the vehicle emissions projections under WLTP throughout the report. Instead, the
majority of the estimated impact of the WLTP on the gap is due to changes in the test procedure,
described below.
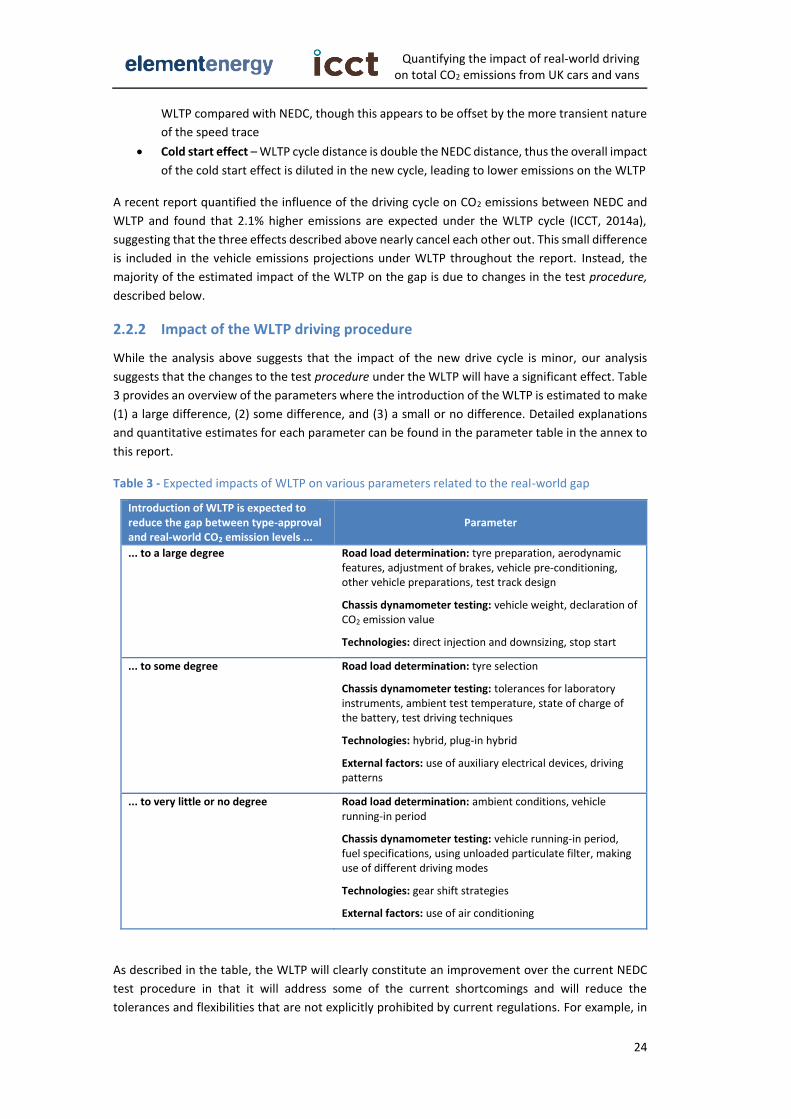
2.2.2 Impact of the WLTP driving procedure
While the analysis above suggests that the impact of the new drive cycle is minor, our analysis
suggests that the changes to the test procedure under the WLTP will have a significant effect. Table
3 provides an overview of the parameters where the introduction of the WLTP is estimated to make
(1) a large difference, (2) some difference, and (3) a small or no difference. Detailed explanations
and quantitative estimates for each parameter can be found in the parameter table in the annex to
this report.
Table 3 - Expected impacts of WLTP on various parameters related to the real-world gap
Introduction of WLTP is expected to reduce the gap between type-approval and real-world CO2 emission levels ...
Parameter
... to a large degree Road load determination: tyre preparation, aerodynamic features, adjustment of brakes, vehicle pre-conditioning, other vehicle preparations, test track design
Chassis dynamometer testing: vehicle weight, declaration of CO2 emission value
Technologies: direct injection and downsizing, stop start
... to some degree Road load determination: tyre selection
Chassis dynamometer testing: tolerances for laboratory instruments, ambient test temperature, state of charge of the battery, test driving techniques
Technologies: hybrid, plug-in hybrid
External factors: use of auxiliary electrical devices, driving patterns
... to very little or no degree Road load determination: ambient conditions, vehicle running-in period
Chassis dynamometer testing: vehicle running-in period, fuel specifications, using unloaded particulate filter, making use of different driving modes
Technologies: gear shift strategies
External factors: use of air conditioning
As described in the table, the WLTP will clearly constitute an improvement over the current NEDC
test procedure in that it will address some of the current shortcomings and will reduce the
tolerances and flexibilities that are not explicitly prohibited by current regulations. For example, in
Quantifying the impact of real-world driving on total CO2 emissions from UK cars and vans
25
the WLTP, the effect of the stop start technology will reflect more accurately the average on-road
CO2 reducing effect of that technology because the new test cycle will have less stop phases than
the NEDC, which is more in line with average driving patterns in the EU. With regards to the test
procedure, abolishing the discrete inertia step system in the WLTP and taking into account optional
equipment and payload will result in a more representative vehicle test weight and thereby a lower
gap in this respect.
There are also a number of parameters for which the WLTP will bring some improvement, but will
not fully eliminate the effect on the gap. For example, in the NEDC, it was not explicitly forbidden
to harden test tyres in the oven (a flexibility that is potentially exploited by vehicle manufacturers
to obtain more favourable road load results and thereby also lower CO2 emissions during laboratory
testing). This will be clearly forbidden in the WLTP test procedure. However, according to vehicle
testing experts, shaving test tyres will still be allowed to some extent (in order to copy the original
shape of the tyre following a run-in on the road), which will reduce CO2 emission levels during type-
approval testing but not in real-world. So while the overall contribution of this parameter to the gap
is expected to be reduced in the WLTP, some difference between the type-approval test and on-
road driving is expected to remain.
For some parameters, the WLTP will show very little or no improvement. For example, vehicle air
conditioning systems are turned off during NEDC testing and this will remain to be the case also for
WLTP testing. The European Commission has been working on a separate test procedure for the
efficiency of vehicle air conditioning systems. But at this point in time it is not clear when this new
test procedure will be introduced in the EU. Also, the WLTP does not include any in-use
enforcement, so the ability to use unrepresentative vehicles and calibrations will remain.
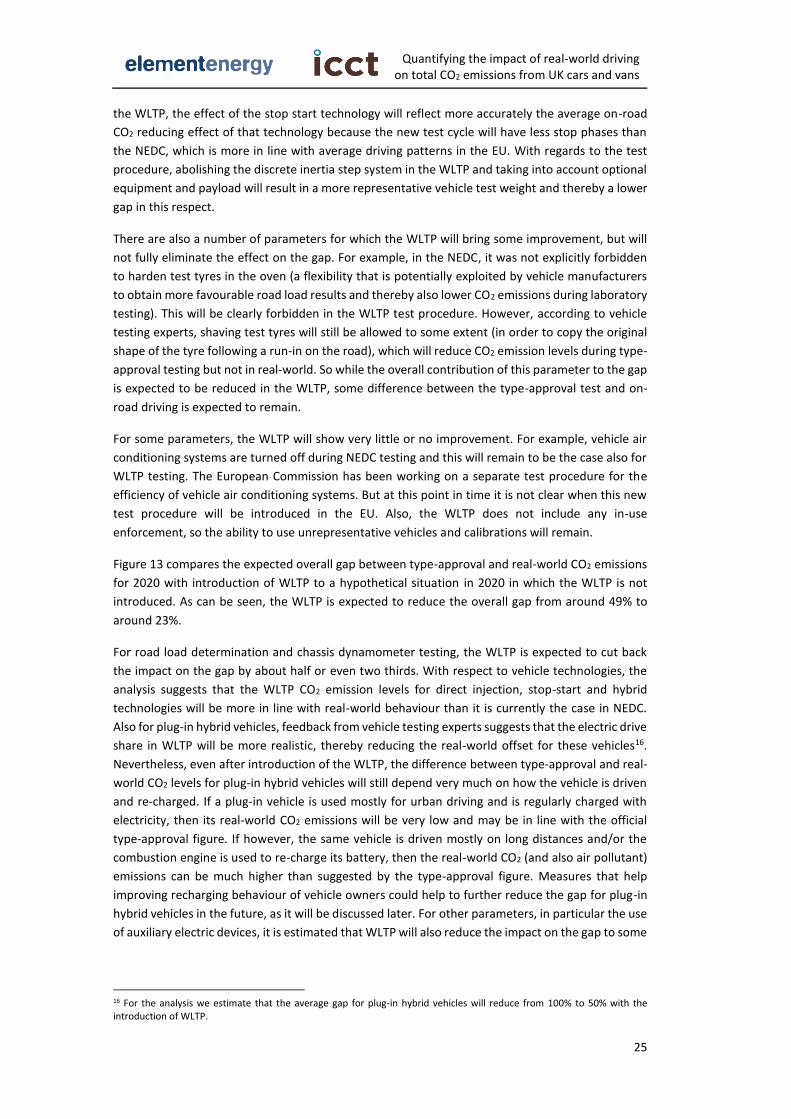
Figure 13 compares the expected overall gap between type-approval and real-world CO2 emissions
for 2020 with introduction of WLTP to a hypothetical situation in 2020 in which the WLTP is not
introduced. As can be seen, the WLTP is expected to reduce the overall gap from around 49% to
around 23%.
For road load determination and chassis dynamometer testing, the WLTP is expected to cut back
the impact on the gap by about half or even two thirds. With respect to vehicle technologies, the
analysis suggests that the WLTP CO2 emission levels for direct injection, stop-start and hybrid
technologies will be more in line with real-world behaviour than it is currently the case in NEDC.
Also for plug-in hybrid vehicles, feedback from vehicle testing experts suggests that the electric drive
share in WLTP will be more realistic, thereby reducing the real-world offset for these vehicles16.
Nevertheless, even after introduction of the WLTP, the difference between type-approval and real-
world CO2 levels for plug-in hybrid vehicles will still depend very much on how the vehicle is driven
and re-charged. If a plug-in vehicle is used mostly for urban driving and is regularly charged with
electricity, then its real-world CO2 emissions will be very low and may be in line with the official
type-approval figure. If however, the same vehicle is driven mostly on long distances and/or the
combustion engine is used to re-charge its battery, then the real-world CO2 (and also air pollutant)
emissions can be much higher than suggested by the type-approval figure. Measures that help
improving recharging behaviour of vehicle owners could help to further reduce the gap for plug-in
hybrid vehicles in the future, as it will be discussed later. For other parameters, in particular the use
of auxiliary electric devices, it is estimated that WLTP will also reduce the impact on the gap to some
16 For the analysis we estimate that the average gap for plug-in hybrid vehicles will reduce from 100% to 50% with the introduction of WLTP.
Quantifying the impact of real-world driving on total CO2 emissions from UK cars and vans
26
extent, but as the impact of air conditioning systems will remain unchanged, the overall change for
this type of parameters is assumed not to be significant.
Figure 13 - Bottom-up estimate of the emissions gap between type-approval and real-world CO2
emissions, differentiated into individual influencing parameters – historical development and 2020 scenarios with and without introduction of WLTP in the EU (for details, please refer to summary table in annex)
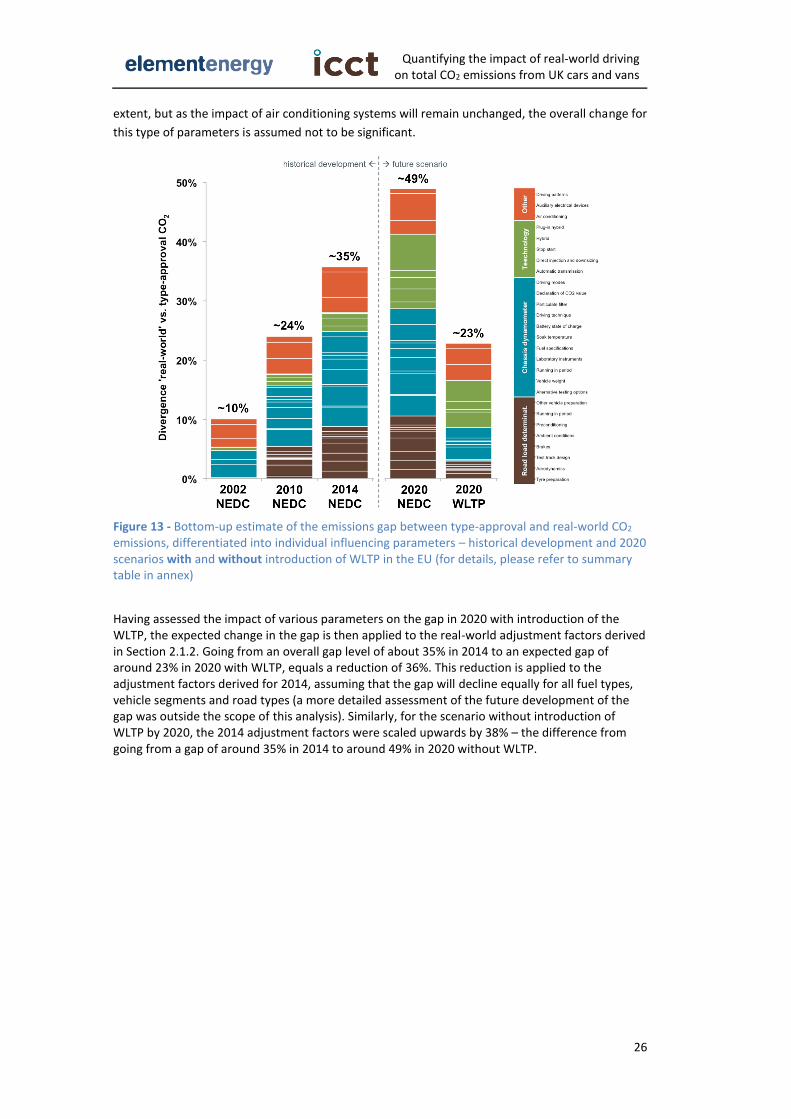
Having assessed the impact of various parameters on the gap in 2020 with introduction of the WLTP, the expected change in the gap is then applied to the real-world adjustment factors derived in Section 2.1.2. Going from an overall gap level of about 35% in 2014 to an expected gap of around 23% in 2020 with WLTP, equals a reduction of 36%. This reduction is applied to the adjustment factors derived for 2014, assuming that the gap will decline equally for all fuel types, vehicle segments and road types (a more detailed assessment of the future development of the gap was outside the scope of this analysis). Similarly, for the scenario without introduction of WLTP by 2020, the 2014 adjustment factors were scaled upwards by 38% – the difference from going from a gap of around 35% in 2014 to around 49% in 2020 without WLTP.

Quantifying the impact of real-world driving on total CO2 emissions from UK cars and vans
27
Table 4 and Table 5 show the resulting adjustment factors.
Quantifying the impact of real-world driving on total CO2 emissions from UK cars and vans
28
Table 4 - Petrol car real-world adjustment factors to be applied to NEDC type-approval data, derived using a top-down approach from Spritmonitor data – including 2020 with and without WLTP scenarios
Table 5 - Diesel car real-world adjustment factors to be applied to NEDC type-approval data, derived using a top-down approach from Spritmonitor data17 - including 2020 with and without WLTP scenarios
2.3 Potential increase of the emissions gap to 2025/30
When comparing the vehicle emissions testing scheme in the EU to other markets, and in particular
with the U.S., fundamental differences are not necessarily found in the test cycle or the test
procedure, but more so in respect to enforcement. In the U.S., the Environmental Protection Agency
(EPA) has the mandate to carry out independent and random confirmatory testing for road load
determination results and chassis dynamometer test results. In addition, there is an extensive in-
production and in-use test program in place, not only for air pollutants but also CO2 emissions, with
vehicle manufacturers being responsible for carrying out the testing and EPA having the right to
carry out independent and random confirmatory testing at any time.
The effectiveness of EPA's enforcement program is demonstrated by the recent settlement with
Hyundai/Kia over improper road load values18. Hyundai and Kia were forced to correct the road load
coefficients for many of their vehicles, retest the affected vehicles with the correct road load values,
correct their fuel economy/CO2 results, revise their fuel economy label values and CAFE/CO2
standard compliance, and pay a $100 million civil penalty. Ford, Daimler, and BMW also recently
corrected some erroneous road load values. In Ford's case, Ford found the error themselves during
routine internal testing and self-reported the correction to EPA, along with correcting fuel economy
label values19. This illustrates how limited in-use enforcement by EPA has caused manufacturers to
properly conduct testing and monitor their own procedures.
17 U = urban driving, X = extra-urban driving, H = highway driving, A = average of all driving situations 18 http://www2.epa.gov/enforcement/hyundai-and-kia-clean-air-act-settlement 19 https://media.ford.com/content/fordmedia/fna/us/en/news/2014/06/12/ford-motor-company-lowers-fuel-economy-ratings--for-six-vehicles.html
Quantifying the impact of real-world driving on total CO2 emissions from UK cars and vans
29
In comparison, in the EU vehicle type-approval emissions testing is either carried out by the vehicle
manufacturer, with an accredited technical service company witnessing the testing, or by the
technical service company on behalf of the manufacturer. Independent and random confirmatory
tests are not foreseen by the regulations. Furthermore, an in-use surveillance program for vehicle
CO2 emissions, with any legal consequences, does not exist in the EU.
This lack of enforcement of vehicle emissions testing will remain unchanged with the introduction
of WLTP. It is part of the reason why the introduction of WLTP is expected to reduce the gap
between type-approval and real-world CO2 emissions only to a limited extent. Furthermore, it is
expected that after the introduction of the WLTP the gap will likely grow again. The WLTP is a
complex regulation, filling about hundreds of pages with technical details. At UNECE level, it was
developed by a group that mostly consisted of representatives from industry and technical institutes
(ICCT, 2014a). Informal feedback gathered from technical experts who have been present in the
WLTP development meetings suggests that it is likely that any complex technical framework such as
the WLTP regulation will include new ‘loopholes’ that may not yet be known today.
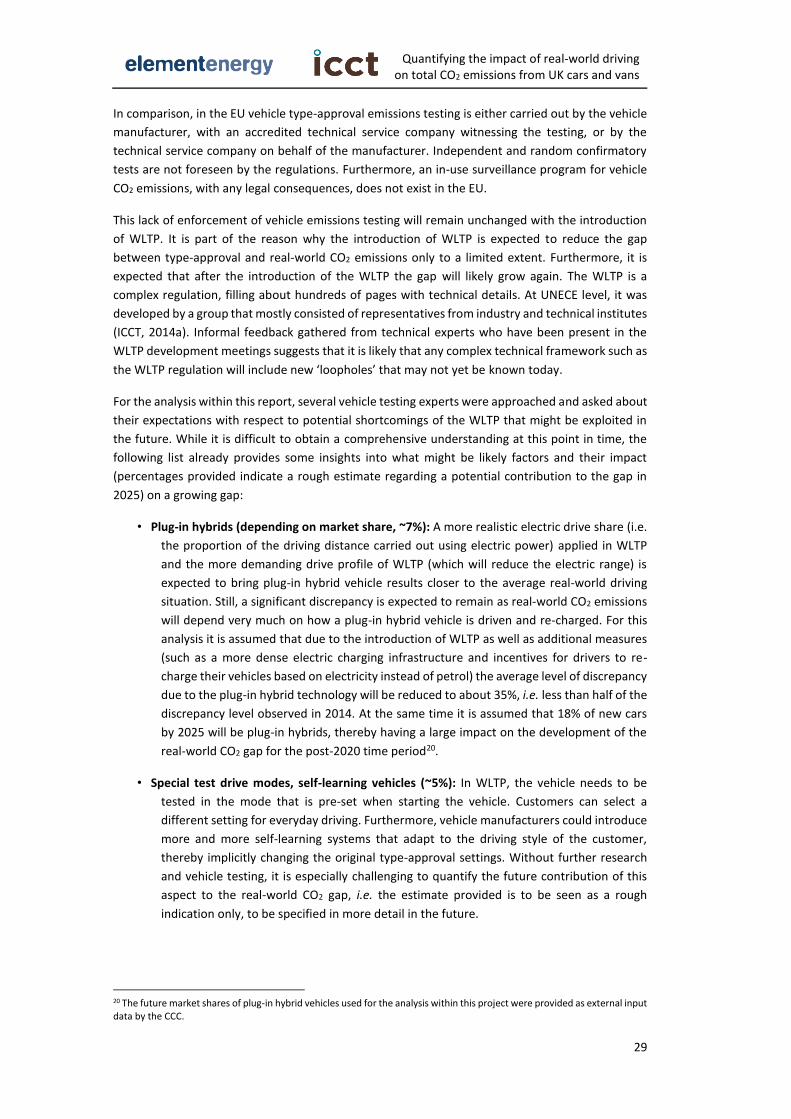
For the analysis within this report, several vehicle testing experts were approached and asked about
their expectations with respect to potential shortcomings of the WLTP that might be exploited in
the future. While it is difficult to obtain a comprehensive understanding at this point in time, the
following list already provides some insights into what might be likely factors and their impact
(percentages provided indicate a rough estimate regarding a potential contribution to the gap in
2025) on a growing gap:
• Plug-in hybrids (depending on market share, ~7%): A more realistic electric drive share (i.e.
the proportion of the driving distance carried out using electric power) applied in WLTP
and the more demanding drive profile of WLTP (which will reduce the electric range) is
expected to bring plug-in hybrid vehicle results closer to the average real-world driving
situation. Still, a significant discrepancy is expected to remain as real-world CO2 emissions
will depend very much on how a plug-in hybrid vehicle is driven and re-charged. For this
analysis it is assumed that due to the introduction of WLTP as well as additional measures
(such as a more dense electric charging infrastructure and incentives for drivers to re-
charge their vehicles based on electricity instead of petrol) the average level of discrepancy
due to the plug-in hybrid technology will be reduced to about 35%, i.e. less than half of the
discrepancy level observed in 2014. At the same time it is assumed that 18% of new cars
by 2025 will be plug-in hybrids, thereby having a large impact on the development of the
real-world CO2 gap for the post-2020 time period20.
• Special test drive modes, self-learning vehicles (~5%): In WLTP, the vehicle needs to be
tested in the mode that is pre-set when starting the vehicle. Customers can select a
different setting for everyday driving. Furthermore, vehicle manufacturers could introduce
more and more self-learning systems that adapt to the driving style of the customer,
thereby implicitly changing the original type-approval settings. Without further research
and vehicle testing, it is especially challenging to quantify the future contribution of this
aspect to the real-world CO2 gap, i.e. the estimate provided is to be seen as a rough
indication only, to be specified in more detail in the future.
20 The future market shares of plug-in hybrid vehicles used for the analysis within this project were provided as external input data by the CCC.
Quantifying the impact of real-world driving on total CO2 emissions from UK cars and vans
30
• Measuring tolerances on chassis dynamometer (~2.5%): Tolerances for laboratory
instruments provided for WLTP are lower than for NEDC, but some flexibility still remains.
• Transmission optimization (~3%): For WLTP there is no change in gear shift guidance for
automatic transmissions. For manual transmissions, gear shift points will be calculated. In
the future, this is expected to allow manufacturers to optimize manual transmissions to
some extent.
• Air conditioning (~2.5%): Air conditioning systems will still be turned off during WLTP testing.
• Auxiliary devices (~3%): For WLTP, the use of electrical devices will be taken into account to
a greater extent, but some discrepancy is expected to remain.
• “Smoothening” the driving pattern (~2%): The WLTP speed profile is more dynamic, i.e. the
braking energy to be gained by "smoothening" the profile is larger (about 12% of braking
energy in WLTP vs. 3% in NEDC). Some experts believe that in the future trained
professional drivers or test driving robots can be used to systematically take advantage of
this effect.
• New options for road load determination (~2%): WLTP will allow new options for
determining vehicle road load, without having to put the vehicle on a test track. For
example, a flat belt in a laboratory wind tunnel could be used. There is only limited
experience with these new testing options and some experts expect new ‘loopholes’ to be
introduced.
• Using different tyres for testing than for real-world sales (~2%): The WLTP will define vehicle
specific tyre specifications for testing, but there will still be a lack of enforcement regarding
in-production and in-use application of tyres. In principle, it will still be possible for
manufacturers to sell different tyres than used for testing and/or customers to select a
different tyre than the one the vehicles has been tested with.
• Remaining flexibilities for specially prepared tyres (~1%): WLTP is more specific about the
definition of allowed tyre pre-treatment. Tyre baking is not allowed anymore, but shaving
is still allowed to some extent. Some other flexibilities are also expected to remain, such as
raising the tyre temperature for testing.
Overall, following the introduction of the WLTP, by 2025/30 the gap is expected to increase again
to a level of around 31% (Figure 14). Table 6 and Table 7 summarize the resulting real-world
adjustment factors for this scenario..
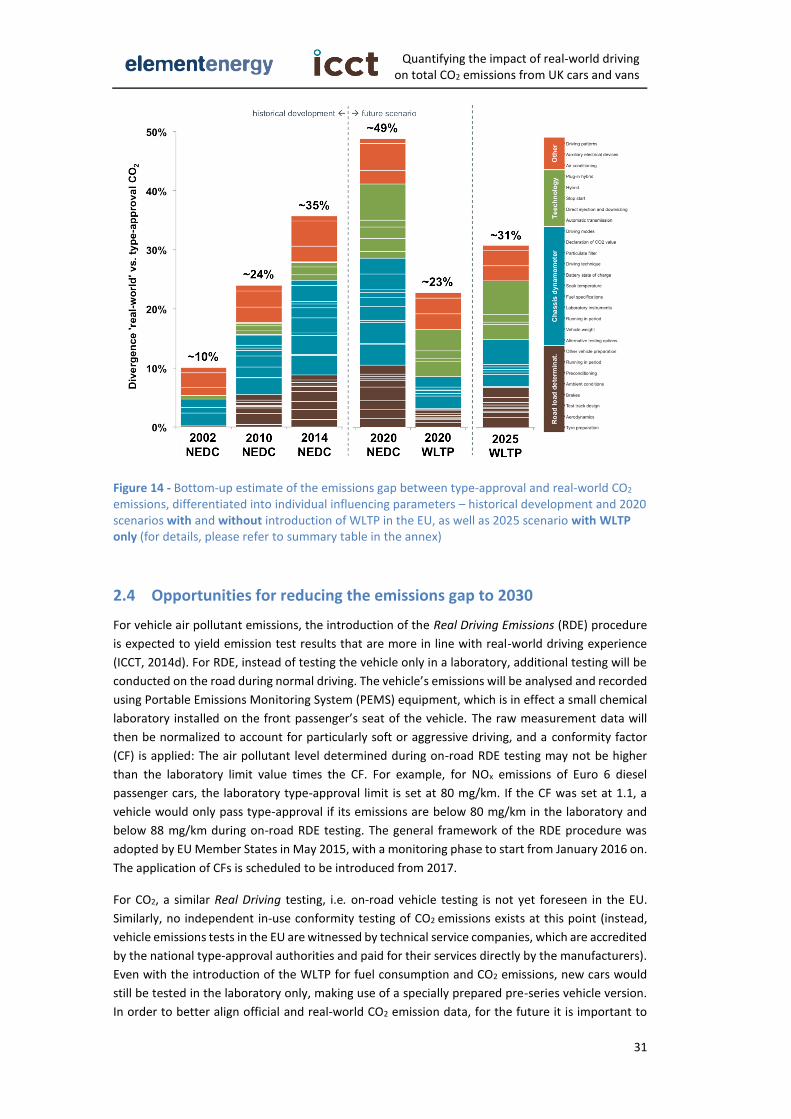
Quantifying the impact of real-world driving on total CO2 emissions from UK cars and vans
31
Figure 14 - Bottom-up estimate of the emissions gap between type-approval and real-world CO2 emissions, differentiated into individual influencing parameters – historical development and 2020 scenarios with and without introduction of WLTP in the EU, as well as 2025 scenario with WLTP only (for details, please refer to summary table in the annex)
2.4 Opportunities for reducing the emissions gap to 2030
For vehicle air pollutant emissions, the introduction of the Real Driving Emissions (RDE) procedure
is expected to yield emission test results that are more in line with real-world driving experience
(ICCT, 2014d). For RDE, instead of testing the vehicle only in a laboratory, additional testing will be
conducted on the road during normal driving. The vehicle’s emissions will be analysed and recorded
using Portable Emissions Monitoring System (PEMS) equipment, which is in effect a small chemical
laboratory installed on the front passenger’s seat of the vehicle. The raw measurement data will
then be normalized to account for particularly soft or aggressive driving, and a conformity factor
(CF) is applied: The air pollutant level determined during on-road RDE testing may not be higher
than the laboratory limit value times the CF. For example, for NOx emissions of Euro 6 diesel
passenger cars, the laboratory type-approval limit is set at 80 mg/km. If the CF was set at 1.1, a
vehicle would only pass type-approval if its emissions are below 80 mg/km in the laboratory and
below 88 mg/km during on-road RDE testing. The general framework of the RDE procedure was
adopted by EU Member States in May 2015, with a monitoring phase to start from January 2016 on.
The application of CFs is scheduled to be introduced from 2017.
For CO2, a similar Real Driving testing, i.e. on-road vehicle testing is not yet foreseen in the EU.
Similarly, no independent in-use conformity testing of CO2 emissions exists at this point (instead,
vehicle emissions tests in the EU are witnessed by technical service companies, which are accredited
by the national type-approval authorities and paid for their services directly by the manufacturers).
Even with the introduction of the WLTP for fuel consumption and CO2 emissions, new cars would
still be tested in the laboratory only, making use of a specially prepared pre-series vehicle version.
In order to better align official and real-world CO2 emission data, for the future it is important to
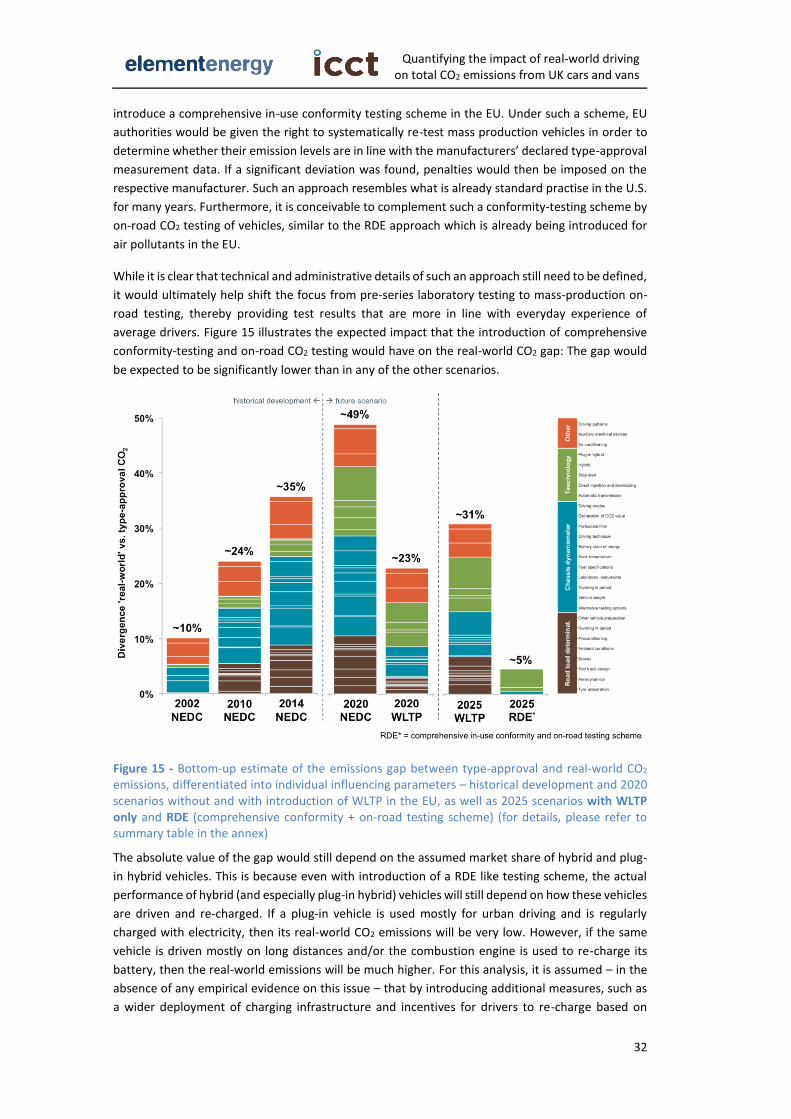
Quantifying the impact of real-world driving on total CO2 emissions from UK cars and vans
32
introduce a comprehensive in-use conformity testing scheme in the EU. Under such a scheme, EU
authorities would be given the right to systematically re-test mass production vehicles in order to
determine whether their emission levels are in line with the manufacturers’ declared type-approval
measurement data. If a significant deviation was found, penalties would then be imposed on the
respective manufacturer. Such an approach resembles what is already standard practise in the U.S.
for many years. Furthermore, it is conceivable to complement such a conformity-testing scheme by
on-road CO2 testing of vehicles, similar to the RDE approach which is already being introduced for
air pollutants in the EU.
While it is clear that technical and administrative details of such an approach still need to be defined,
it would ultimately help shift the focus from pre-series laboratory testing to mass-production on-
road testing, thereby providing test results that are more in line with everyday experience of
average drivers. Figure 15 illustrates the expected impact that the introduction of comprehensive
conformity-testing and on-road CO2 testing would have on the real-world CO2 gap: The gap would
be expected to be significantly lower than in any of the other scenarios.
Figure 15 - Bottom-up estimate of the emissions gap between type-approval and real-world CO2 emissions, differentiated into individual influencing parameters – historical development and 2020 scenarios without and with introduction of WLTP in the EU, as well as 2025 scenarios with WLTP only and RDE (comprehensive conformity + on-road testing scheme) (for details, please refer to summary table in the annex)
The absolute value of the gap would still depend on the assumed market share of hybrid and plug-
in hybrid vehicles. This is because even with introduction of a RDE like testing scheme, the actual
performance of hybrid (and especially plug-in hybrid) vehicles will still depend on how these vehicles
are driven and re-charged. If a plug-in vehicle is used mostly for urban driving and is regularly
charged with electricity, then its real-world CO2 emissions will be very low. However, if the same
vehicle is driven mostly on long distances and/or the combustion engine is used to re-charge its
battery, then the real-world emissions will be much higher. For this analysis, it is assumed – in the
absence of any empirical evidence on this issue – that by introducing additional measures, such as
a wider deployment of charging infrastructure and incentives for drivers to re-charge based on
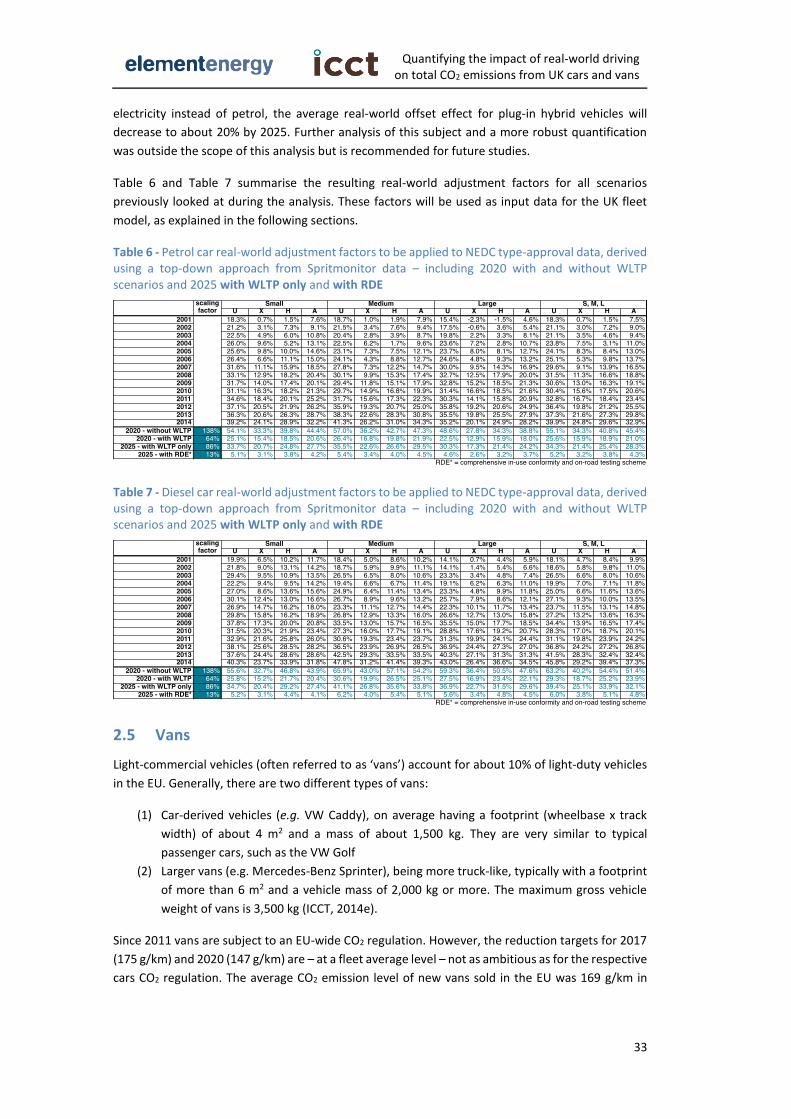
Quantifying the impact of real-world driving on total CO2 emissions from UK cars and vans
33
electricity instead of petrol, the average real-world offset effect for plug-in hybrid vehicles will
decrease to about 20% by 2025. Further analysis of this subject and a more robust quantification
was outside the scope of this analysis but is recommended for future studies.
Table 6 and Table 7 summarise the resulting real-world adjustment factors for all scenarios
previously looked at during the analysis. These factors will be used as input data for the UK fleet
model, as explained in the following sections.
Table 6 - Petrol car real-world adjustment factors to be applied to NEDC type-approval data, derived using a top-down approach from Spritmonitor data – including 2020 with and without WLTP scenarios and 2025 with WLTP only and with RDE
Table 7 - Diesel car real-world adjustment factors to be applied to NEDC type-approval data, derived using a top-down approach from Spritmonitor data – including 2020 with and without WLTP scenarios and 2025 with WLTP only and with RDE
2.5 Vans
Light-commercial vehicles (often referred to as ‘vans’) account for about 10% of light-duty vehicles
in the EU. Generally, there are two different types of vans:
(1) Car-derived vehicles (e.g. VW Caddy), on average having a footprint (wheelbase x track
width) of about 4 m2 and a mass of about 1,500 kg. They are very similar to typical
passenger cars, such as the VW Golf
(2) Larger vans (e.g. Mercedes-Benz Sprinter), being more truck-like, typically with a footprint
of more than 6 m2 and a vehicle mass of 2,000 kg or more. The maximum gross vehicle
weight of vans is 3,500 kg (ICCT, 2014e).
Since 2011 vans are subject to an EU-wide CO2 regulation. However, the reduction targets for 2017
(175 g/km) and 2020 (147 g/km) are – at a fleet average level – not as ambitious as for the respective
cars CO2 regulation. The average CO2 emission level of new vans sold in the EU was 169 g/km in
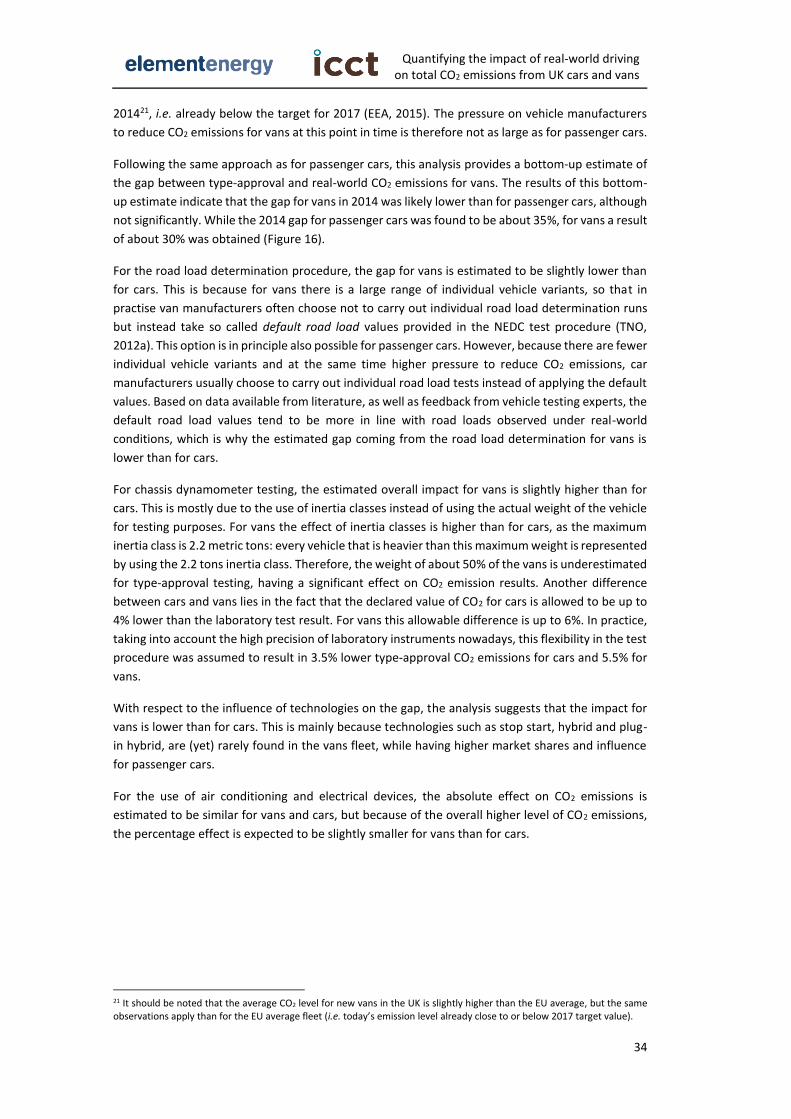
Quantifying the impact of real-world driving on total CO2 emissions from UK cars and vans
34
201421, i.e. already below the target for 2017 (EEA, 2015). The pressure on vehicle manufacturers
to reduce CO2 emissions for vans at this point in time is therefore not as large as for passenger cars.
Following the same approach as for passenger cars, this analysis provides a bottom-up estimate of
the gap between type-approval and real-world CO2 emissions for vans. The results of this bottom-
up estimate indicate that the gap for vans in 2014 was likely lower than for passenger cars, although
not significantly. While the 2014 gap for passenger cars was found to be about 35%, for vans a result
of about 30% was obtained (Figure 16).
For the road load determination procedure, the gap for vans is estimated to be slightly lower than
for cars. This is because for vans there is a large range of individual vehicle variants, so that in
practise van manufacturers often choose not to carry out individual road load determination runs
but instead take so called default road load values provided in the NEDC test procedure (TNO,
2012a). This option is in principle also possible for passenger cars. However, because there are fewer
individual vehicle variants and at the same time higher pressure to reduce CO2 emissions, car
manufacturers usually choose to carry out individual road load tests instead of applying the default
values. Based on data available from literature, as well as feedback from vehicle testing experts, the
default road load values tend to be more in line with road loads observed under real-world
conditions, which is why the estimated gap coming from the road load determination for vans is
lower than for cars.
For chassis dynamometer testing, the estimated overall impact for vans is slightly higher than for
cars. This is mostly due to the use of inertia classes instead of using the actual weight of the vehicle
for testing purposes. For vans the effect of inertia classes is higher than for cars, as the maximum
inertia class is 2.2 metric tons: every vehicle that is heavier than this maximum weight is represented
by using the 2.2 tons inertia class. Therefore, the weight of about 50% of the vans is underestimated
for type-approval testing, having a significant effect on CO2 emission results. Another difference
between cars and vans lies in the fact that the declared value of CO2 for cars is allowed to be up to
4% lower than the laboratory test result. For vans this allowable difference is up to 6%. In practice,
taking into account the high precision of laboratory instruments nowadays, this flexibility in the test
procedure was assumed to result in 3.5% lower type-approval CO2 emissions for cars and 5.5% for
vans.
With respect to the influence of technologies on the gap, the analysis suggests that the impact for
vans is lower than for cars. This is mainly because technologies such as stop start, hybrid and plug-
in hybrid, are (yet) rarely found in the vans fleet, while having higher market shares and influence
for passenger cars.
For the use of air conditioning and electrical devices, the absolute effect on CO2 emissions is
estimated to be similar for vans and cars, but because of the overall higher level of CO2 emissions,
the percentage effect is expected to be slightly smaller for vans than for cars.
21 It should be noted that the average CO2 level for new vans in the UK is slightly higher than the EU average, but the same observations apply than for the EU average fleet (i.e. today’s emission level already close to or below 2017 target value).
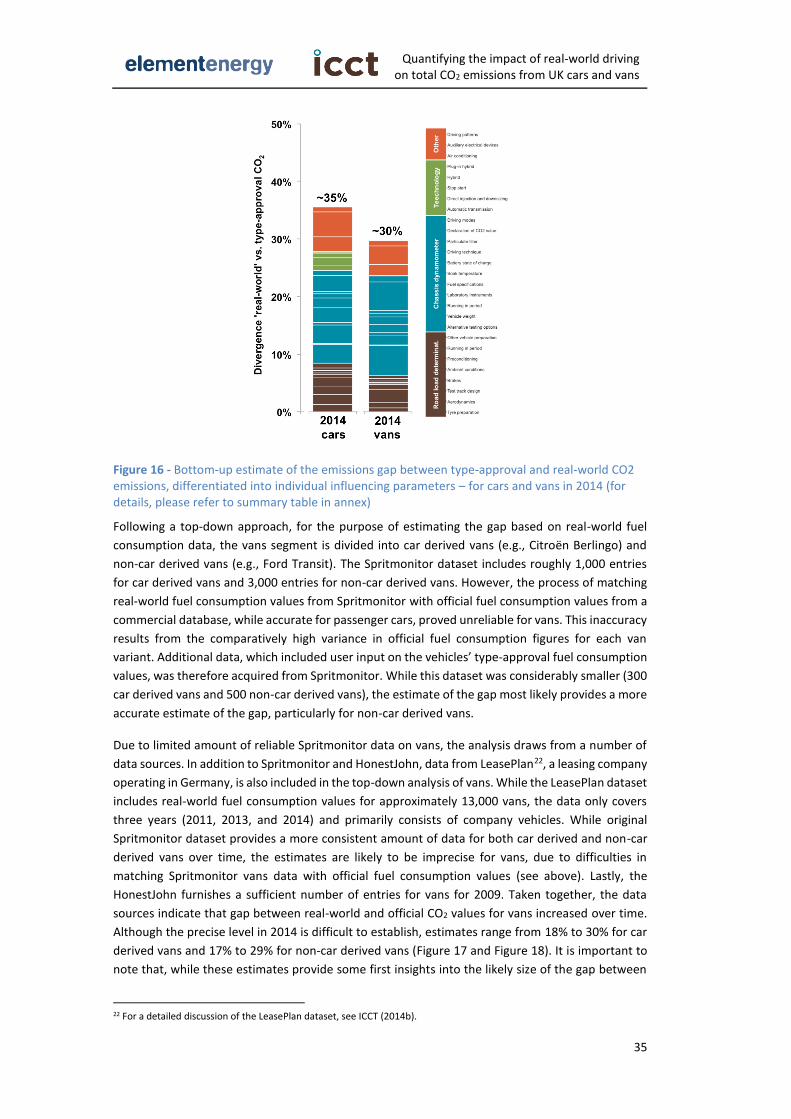
Quantifying the impact of real-world driving on total CO2 emissions from UK cars and vans
35
Figure 16 - Bottom-up estimate of the emissions gap between type-approval and real-world CO2 emissions, differentiated into individual influencing parameters – for cars and vans in 2014 (for details, please refer to summary table in annex)
Following a top-down approach, for the purpose of estimating the gap based on real-world fuel
consumption data, the vans segment is divided into car derived vans (e.g., Citroën Berlingo) and
non-car derived vans (e.g., Ford Transit). The Spritmonitor dataset includes roughly 1,000 entries
for car derived vans and 3,000 entries for non-car derived vans. However, the process of matching
real-world fuel consumption values from Spritmonitor with official fuel consumption values from a
commercial database, while accurate for passenger cars, proved unreliable for vans. This inaccuracy
results from the comparatively high variance in official fuel consumption figures for each van
variant. Additional data, which included user input on the vehicles’ type-approval fuel consumption
values, was therefore acquired from Spritmonitor. While this dataset was considerably smaller (300
car derived vans and 500 non-car derived vans), the estimate of the gap most likely provides a more
accurate estimate of the gap, particularly for non-car derived vans.
Due to limited amount of reliable Spritmonitor data on vans, the analysis draws from a number of
data sources. In addition to Spritmonitor and HonestJohn, data from LeasePlan22, a leasing company
operating in Germany, is also included in the top-down analysis of vans. While the LeasePlan dataset
includes real-world fuel consumption values for approximately 13,000 vans, the data only covers
three years (2011, 2013, and 2014) and primarily consists of company vehicles. While original
Spritmonitor dataset provides a more consistent amount of data for both car derived and non-car
derived vans over time, the estimates are likely to be imprecise for vans, due to difficulties in
matching Spritmonitor vans data with official fuel consumption values (see above). Lastly, the
HonestJohn furnishes a sufficient number of entries for vans for 2009. Taken together, the data
sources indicate that gap between real-world and official CO2 values for vans increased over time.
Although the precise level in 2014 is difficult to establish, estimates range from 18% to 30% for car
derived vans and 17% to 29% for non-car derived vans (Figure 17 and Figure 18). It is important to
note that, while these estimates provide some first insights into the likely size of the gap between
22 For a detailed discussion of the LeasePlan dataset, see ICCT (2014b).
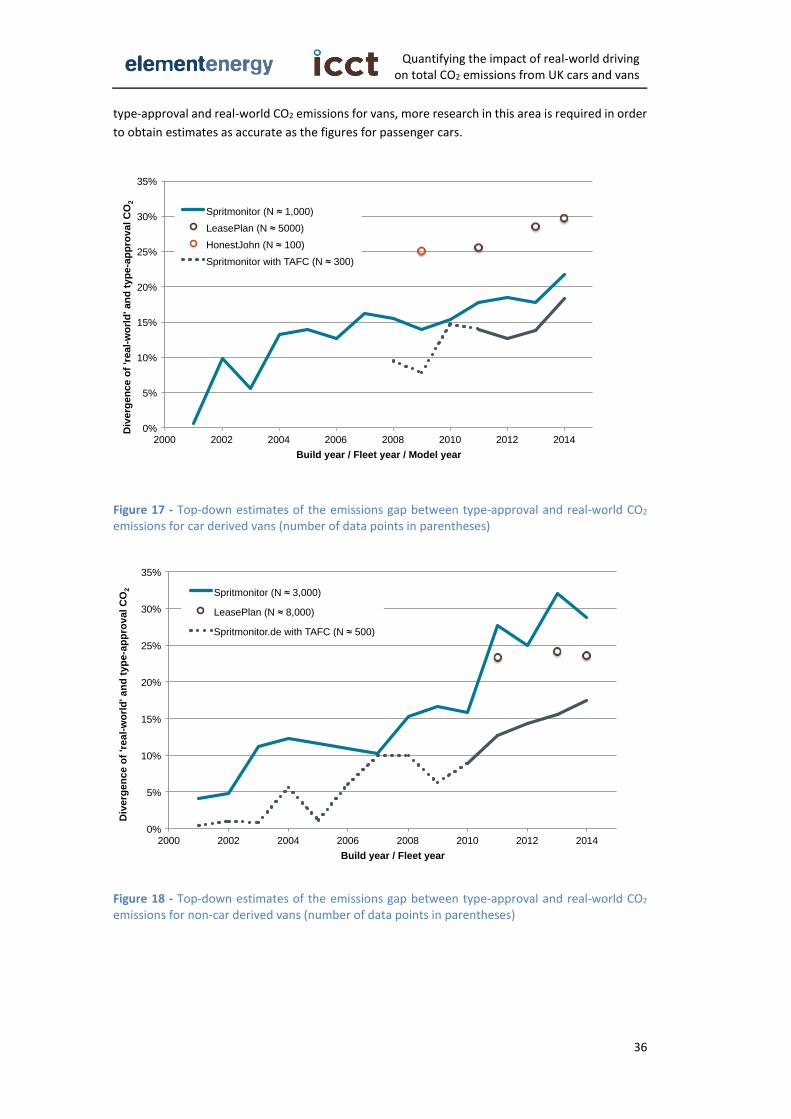
Quantifying the impact of real-world driving on total CO2 emissions from UK cars and vans
36
type-approval and real-world CO2 emissions for vans, more research in this area is required in order
to obtain estimates as accurate as the figures for passenger cars.
Figure 17 - Top-down estimates of the emissions gap between type-approval and real-world CO2 emissions for car derived vans (number of data points in parentheses)
Figure 18 - Top-down estimates of the emissions gap between type-approval and real-world CO2 emissions for non-car derived vans (number of data points in parentheses)
0%
5%
10%
15%
20%
25%
30%
35%
2000 2002 2004 2006 2008 2010 2012 2014
Div
erg
en
ce o
f 'r
eal-
wo
rld
' a
nd
typ
e-a
pp
rova
l C
O2
Build year / Fleet year / Model year
Spritmonitor (N ≈ 1,000)
LeasePlan (N ≈ 5000)
HonestJohn (N ≈ 100)
Spritmonitor with TAFC (N ≈ 300)
0%
5%
10%
15%
20%
25%
30%
35%
2000 2002 2004 2006 2008 2010 2012 2014
Div
erg
en
ce o
f 'r
ea
l-w
orl
d' a
nd
typ
e-a
pp
rov
al
CO
2
Build year / Fleet year
Spritmonitor (N ≈ 3,000)
LeasePlan (N ≈ 8,000)
Spritmonitor.de with TAFC (N ≈ 500)

Quantifying the impact of real-world driving on total CO2 emissions from UK cars and vans
37
3 Quantifying the real world emissions gap for the current UK
vehicle parc
3.1 Representing the total car and van parc
The vehicle-specific adjustment factors discussed in Section 2 are a useful proxy for understanding
the rate of change of the emissions gap for new cars, and are valuable for raising awareness of the
existence of the emissions gap with regulators and consumers. However, quantification of total
annual real-world driving emissions at a UK level requires a representation of how new vehicles are
bought, used and scrapped over time. For the analysis within this study, a car and van fleet model
was developed to track every light vehicle in operation in the UK, as well as vehicles introduced into
the parc between now and 2030. The inputs and outputs to the fleet model are shown in Figure 19,
and the main inputs are described below.
Figure 19 – High-level summary of key inputs and outputs from the fleet model developed to represent the UK car and van parc
Historical vehicle sales and stock
A model of annual vehicle sales since 2000 was developed to represent the current vehicle parc,
including the emissions of each vehicle type and year of manufacture. Sales of vehicles dating back
to 1955 were used to define ‘legacy vehicles’ already on the road before 2000 and still in use today.
The model was based on vehicle licensing statistics from DfT, and disaggregated new vehicle sales
between 2000 and 2013 from the SMMT. It also included a scrappage function to determine the
proportion of vehicles scrapped in a given year, also based on DfT vehicle licensing data. The fleet
model was disaggregated by fuel type, vehicle segment and age. Finally, the parc was also split by
three road types; urban, extra-urban and highway (includes motorways and trunk roads). This
ensured compatibility with the road type-specific real world emissions factors discussed in Section
2. The resulting model gave circa 29 million passenger cars and 3.3 million vans on the road in 2014
for the parc.
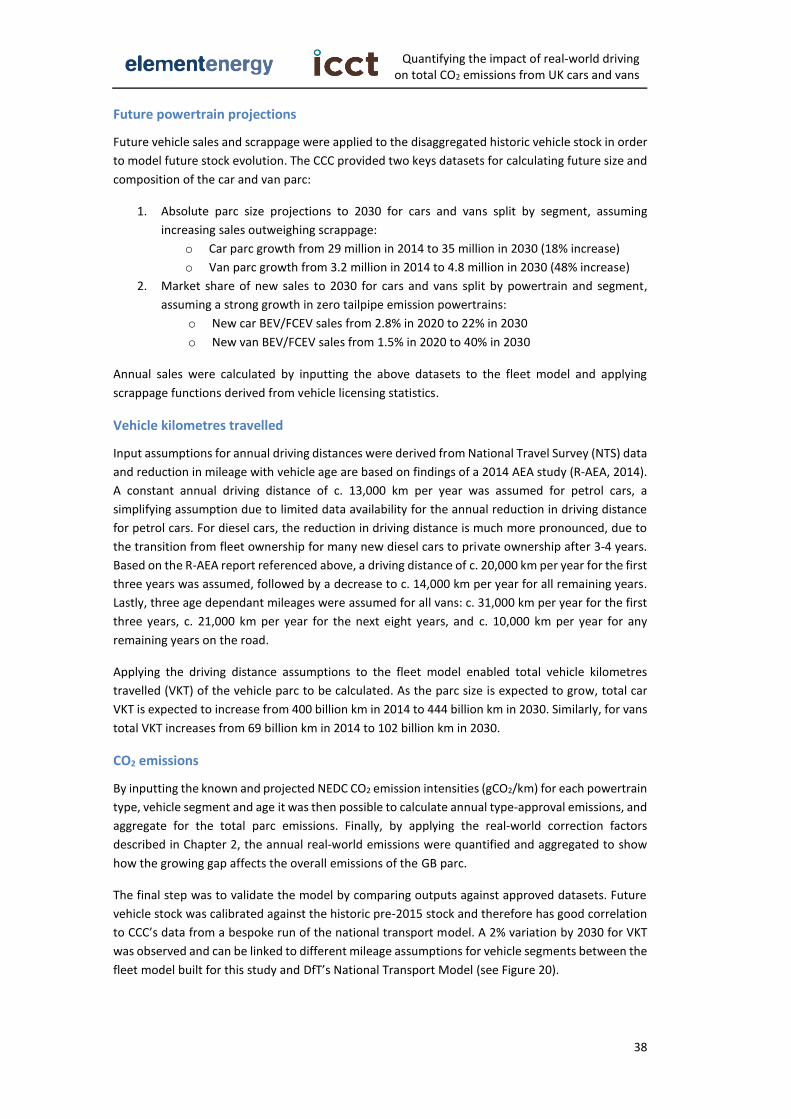
Quantifying the impact of real-world driving on total CO2 emissions from UK cars and vans
38
Future powertrain projections
Future vehicle sales and scrappage were applied to the disaggregated historic vehicle stock in order
to model future stock evolution. The CCC provided two keys datasets for calculating future size and
composition of the car and van parc:
1. Absolute parc size projections to 2030 for cars and vans split by segment, assuming
increasing sales outweighing scrappage:
o Car parc growth from 29 million in 2014 to 35 million in 2030 (18% increase)
o Van parc growth from 3.2 million in 2014 to 4.8 million in 2030 (48% increase)
2. Market share of new sales to 2030 for cars and vans split by powertrain and segment,
assuming a strong growth in zero tailpipe emission powertrains:
o New car BEV/FCEV sales from 2.8% in 2020 to 22% in 2030
o New van BEV/FCEV sales from 1.5% in 2020 to 40% in 2030
Annual sales were calculated by inputting the above datasets to the fleet model and applying
scrappage functions derived from vehicle licensing statistics.
Vehicle kilometres travelled
Input assumptions for annual driving distances were derived from National Travel Survey (NTS) data
and reduction in mileage with vehicle age are based on findings of a 2014 AEA study (R-AEA, 2014).
A constant annual driving distance of c. 13,000 km per year was assumed for petrol cars, a
simplifying assumption due to limited data availability for the annual reduction in driving distance
for petrol cars. For diesel cars, the reduction in driving distance is much more pronounced, due to
the transition from fleet ownership for many new diesel cars to private ownership after 3-4 years.
Based on the R-AEA report referenced above, a driving distance of c. 20,000 km per year for the first
three years was assumed, followed by a decrease to c. 14,000 km per year for all remaining years.
Lastly, three age dependant mileages were assumed for all vans: c. 31,000 km per year for the first
three years, c. 21,000 km per year for the next eight years, and c. 10,000 km per year for any
remaining years on the road.
Applying the driving distance assumptions to the fleet model enabled total vehicle kilometres
travelled (VKT) of the vehicle parc to be calculated. As the parc size is expected to grow, total car
VKT is expected to increase from 400 billion km in 2014 to 444 billion km in 2030. Similarly, for vans
total VKT increases from 69 billion km in 2014 to 102 billion km in 2030.
CO2 emissions
By inputting the known and projected NEDC CO2 emission intensities (gCO2/km) for each powertrain
type, vehicle segment and age it was then possible to calculate annual type-approval emissions, and
aggregate for the total parc emissions. Finally, by applying the real-world correction factors
described in Chapter 2, the annual real-world emissions were quantified and aggregated to show
how the growing gap affects the overall emissions of the GB parc.
The final step was to validate the model by comparing outputs against approved datasets. Future
vehicle stock was calibrated against the historic pre-2015 stock and therefore has good correlation
to CCC’s data from a bespoke run of the national transport model. A 2% variation by 2030 for VKT
was observed and can be linked to different mileage assumptions for vehicle segments between the
fleet model built for this study and DfT’s National Transport Model (see Figure 20).
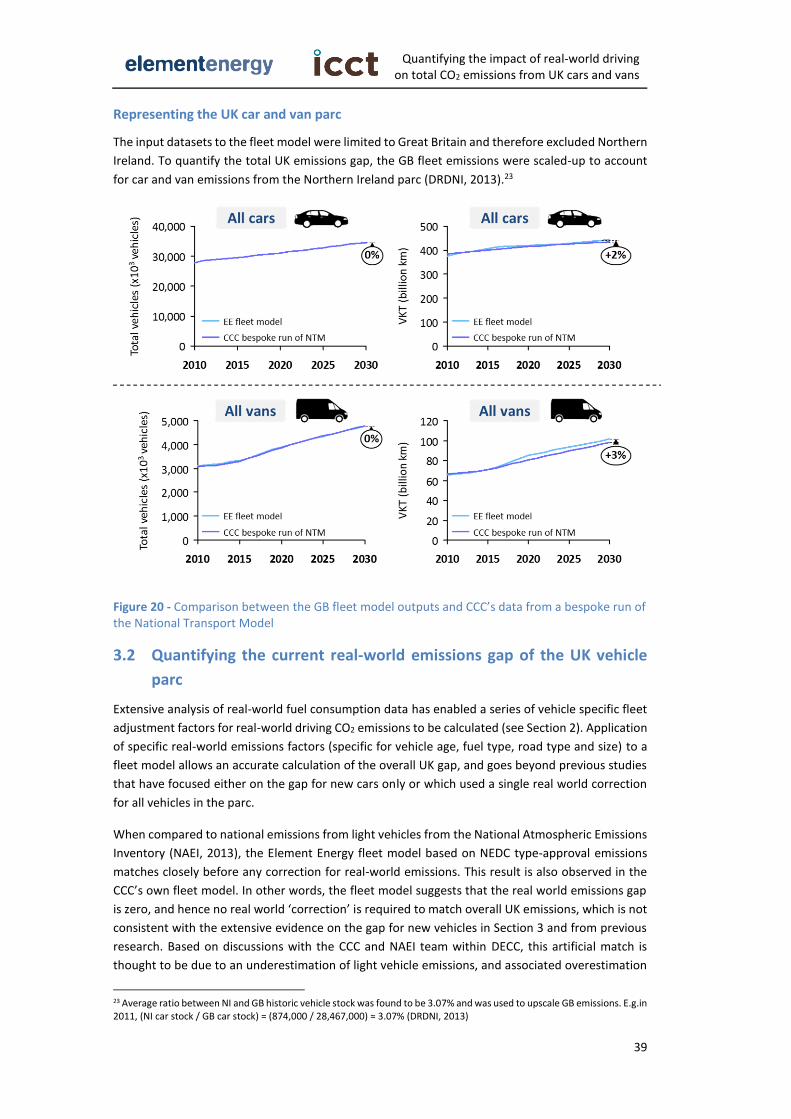
Quantifying the impact of real-world driving on total CO2 emissions from UK cars and vans
39
Representing the UK car and van parc
The input datasets to the fleet model were limited to Great Britain and therefore excluded Northern
Ireland. To quantify the total UK emissions gap, the GB fleet emissions were scaled-up to account
for car and van emissions from the Northern Ireland parc (DRDNI, 2013).23
Figure 20 - Comparison between the GB fleet model outputs and CCC’s data from a bespoke run of the National Transport Model
3.2 Quantifying the current real-world emissions gap of the UK vehicle
parc
Extensive analysis of real-world fuel consumption data has enabled a series of vehicle specific fleet
adjustment factors for real-world driving CO2 emissions to be calculated (see Section 2). Application
of specific real-world emissions factors (specific for vehicle age, fuel type, road type and size) to a
fleet model allows an accurate calculation of the overall UK gap, and goes beyond previous studies
that have focused either on the gap for new cars only or which used a single real world correction
for all vehicles in the parc.
When compared to national emissions from light vehicles from the National Atmospheric Emissions
Inventory (NAEI, 2013), the Element Energy fleet model based on NEDC type-approval emissions
matches closely before any correction for real-world emissions. This result is also observed in the
CCC’s own fleet model. In other words, the fleet model suggests that the real world emissions gap
is zero, and hence no real world ‘correction’ is required to match overall UK emissions, which is not
consistent with the extensive evidence on the gap for new vehicles in Section 3 and from previous
research. Based on discussions with the CCC and NAEI team within DECC, this artificial match is
thought to be due to an underestimation of light vehicle emissions, and associated overestimation
23 Average ratio between NI and GB historic vehicle stock was found to be 3.07% and was used to upscale GB emissions. E.g.in 2011, (NI car stock / GB car stock) = (874,000 / 28,467,000) ≈ 3.07% (DRDNI, 2013)
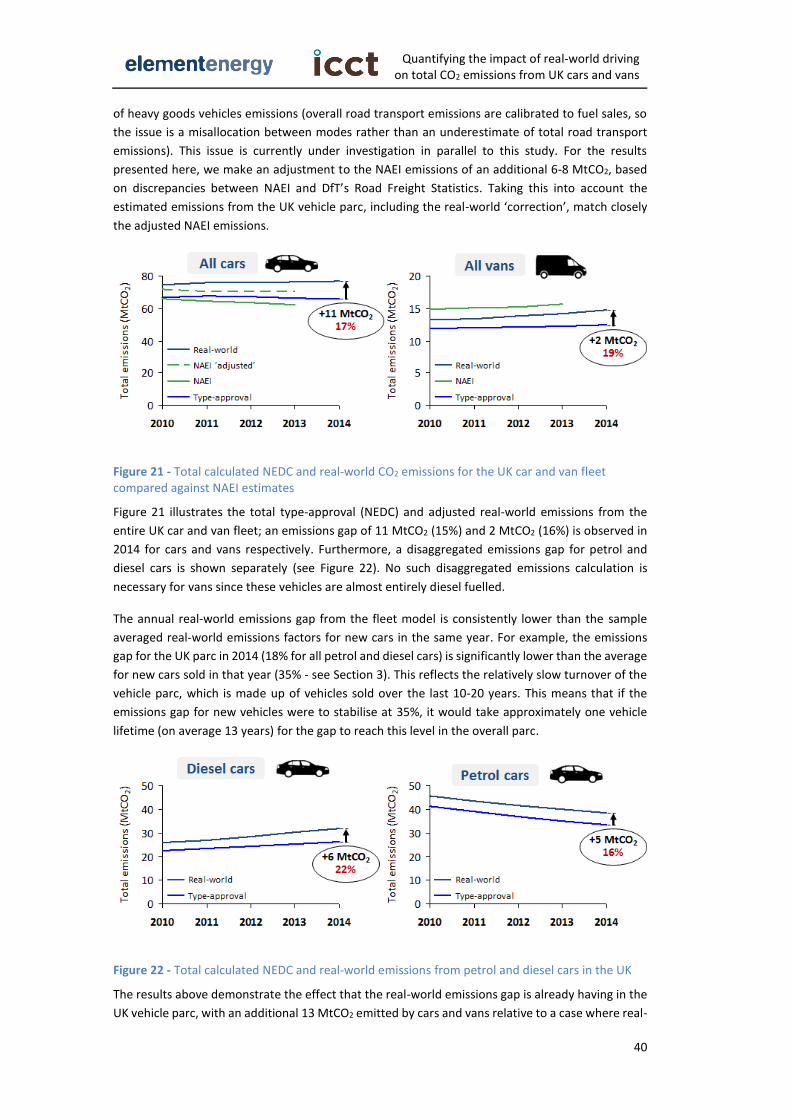
Quantifying the impact of real-world driving on total CO2 emissions from UK cars and vans
40
of heavy goods vehicles emissions (overall road transport emissions are calibrated to fuel sales, so
the issue is a misallocation between modes rather than an underestimate of total road transport
emissions). This issue is currently under investigation in parallel to this study. For the results
presented here, we make an adjustment to the NAEI emissions of an additional 6-8 MtCO2, based
on discrepancies between NAEI and DfT’s Road Freight Statistics. Taking this into account the
estimated emissions from the UK vehicle parc, including the real-world ‘correction’, match closely
the adjusted NAEI emissions.
Figure 21 - Total calculated NEDC and real-world CO2 emissions for the UK car and van fleet compared against NAEI estimates
Figure 21 illustrates the total type-approval (NEDC) and adjusted real-world emissions from the
entire UK car and van fleet; an emissions gap of 11 MtCO2 (15%) and 2 MtCO2 (16%) is observed in
2014 for cars and vans respectively. Furthermore, a disaggregated emissions gap for petrol and
diesel cars is shown separately (see Figure 22). No such disaggregated emissions calculation is
necessary for vans since these vehicles are almost entirely diesel fuelled.
The annual real-world emissions gap from the fleet model is consistently lower than the sample
averaged real-world emissions factors for new cars in the same year. For example, the emissions
gap for the UK parc in 2014 (18% for all petrol and diesel cars) is significantly lower than the average
for new cars sold in that year (35% - see Section 3). This reflects the relatively slow turnover of the
vehicle parc, which is made up of vehicles sold over the last 10-20 years. This means that if the
emissions gap for new vehicles were to stabilise at 35%, it would take approximately one vehicle
lifetime (on average 13 years) for the gap to reach this level in the overall parc.
Figure 22 - Total calculated NEDC and real-world emissions from petrol and diesel cars in the UK
The results above demonstrate the effect that the real-world emissions gap is already having in the
UK vehicle parc, with an additional 13 MtCO2 emitted by cars and vans relative to a case where real-
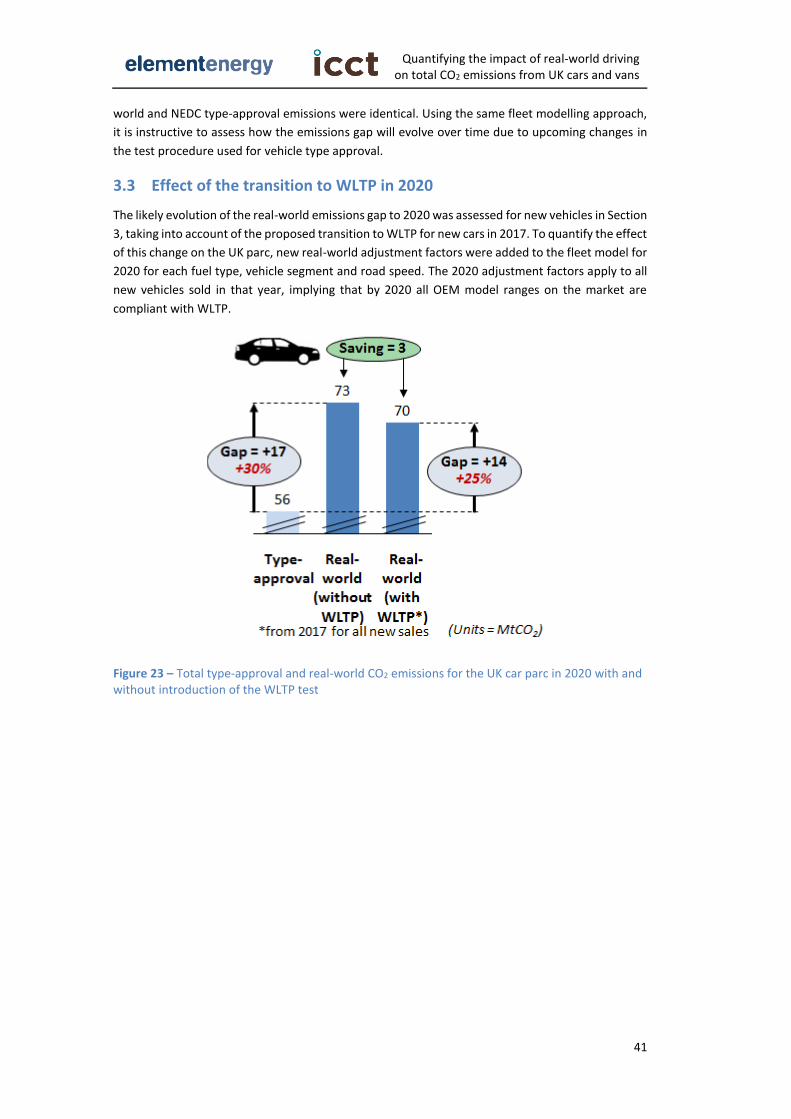
Quantifying the impact of real-world driving on total CO2 emissions from UK cars and vans
41
world and NEDC type-approval emissions were identical. Using the same fleet modelling approach,
it is instructive to assess how the emissions gap will evolve over time due to upcoming changes in
the test procedure used for vehicle type approval.
3.3 Effect of the transition to WLTP in 2020
The likely evolution of the real-world emissions gap to 2020 was assessed for new vehicles in Section
3, taking into account of the proposed transition to WLTP for new cars in 2017. To quantify the effect
of this change on the UK parc, new real-world adjustment factors were added to the fleet model for
2020 for each fuel type, vehicle segment and road speed. The 2020 adjustment factors apply to all
new vehicles sold in that year, implying that by 2020 all OEM model ranges on the market are
compliant with WLTP.
Figure 23 – Total type-approval and real-world CO2 emissions for the UK car parc in 2020 with and without introduction of the WLTP test
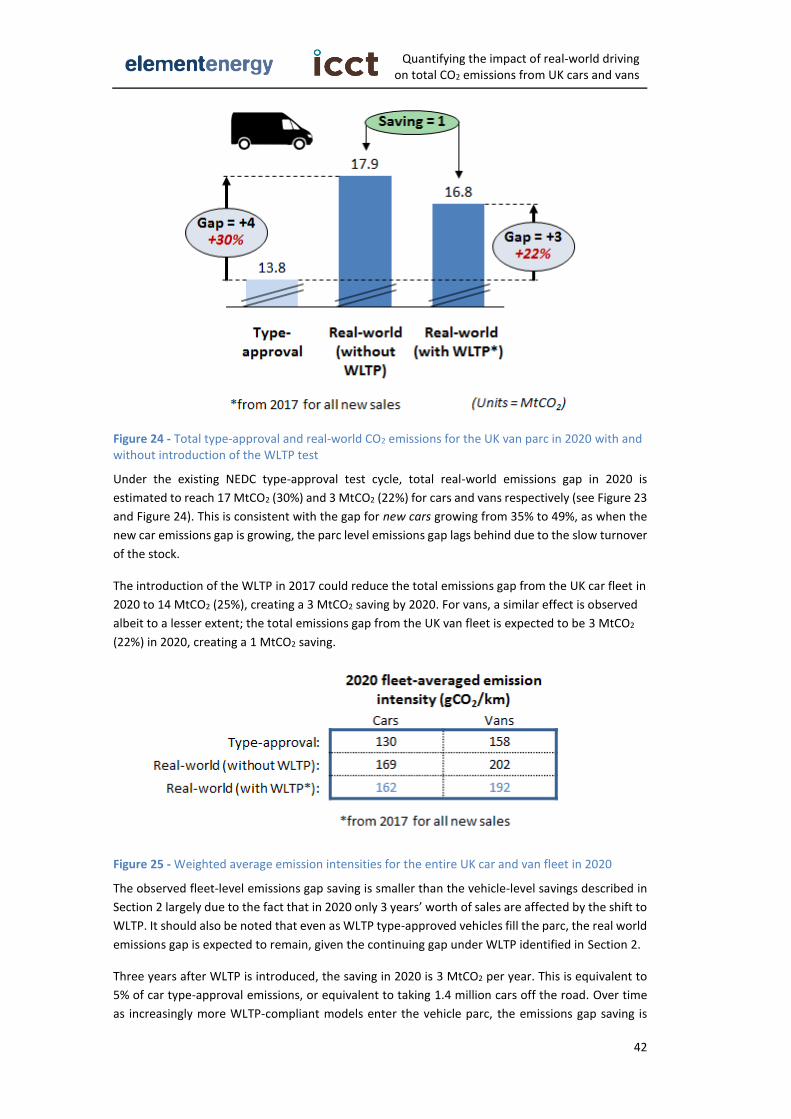
Quantifying the impact of real-world driving on total CO2 emissions from UK cars and vans
42
Figure 24 - Total type-approval and real-world CO2 emissions for the UK van parc in 2020 with and without introduction of the WLTP test
Under the existing NEDC type-approval test cycle, total real-world emissions gap in 2020 is
estimated to reach 17 MtCO2 (30%) and 3 MtCO2 (22%) for cars and vans respectively (see Figure 23
and Figure 24). This is consistent with the gap for new cars growing from 35% to 49%, as when the
new car emissions gap is growing, the parc level emissions gap lags behind due to the slow turnover
of the stock.
The introduction of the WLTP in 2017 could reduce the total emissions gap from the UK car fleet in
2020 to 14 MtCO2 (25%), creating a 3 MtCO2 saving by 2020. For vans, a similar effect is observed
albeit to a lesser extent; the total emissions gap from the UK van fleet is expected to be 3 MtCO2
(22%) in 2020, creating a 1 MtCO2 saving.
Figure 25 - Weighted average emission intensities for the entire UK car and van fleet in 2020
The observed fleet-level emissions gap saving is smaller than the vehicle-level savings described in
Section 2 largely due to the fact that in 2020 only 3 years’ worth of sales are affected by the shift to
WLTP. It should also be noted that even as WLTP type-approved vehicles fill the parc, the real world
emissions gap is expected to remain, given the continuing gap under WLTP identified in Section 2.
Three years after WLTP is introduced, the saving in 2020 is 3 MtCO2 per year. This is equivalent to
5% of car type-approval emissions, or equivalent to taking 1.4 million cars off the road. Over time
as increasingly more WLTP-compliant models enter the vehicle parc, the emissions gap saving is
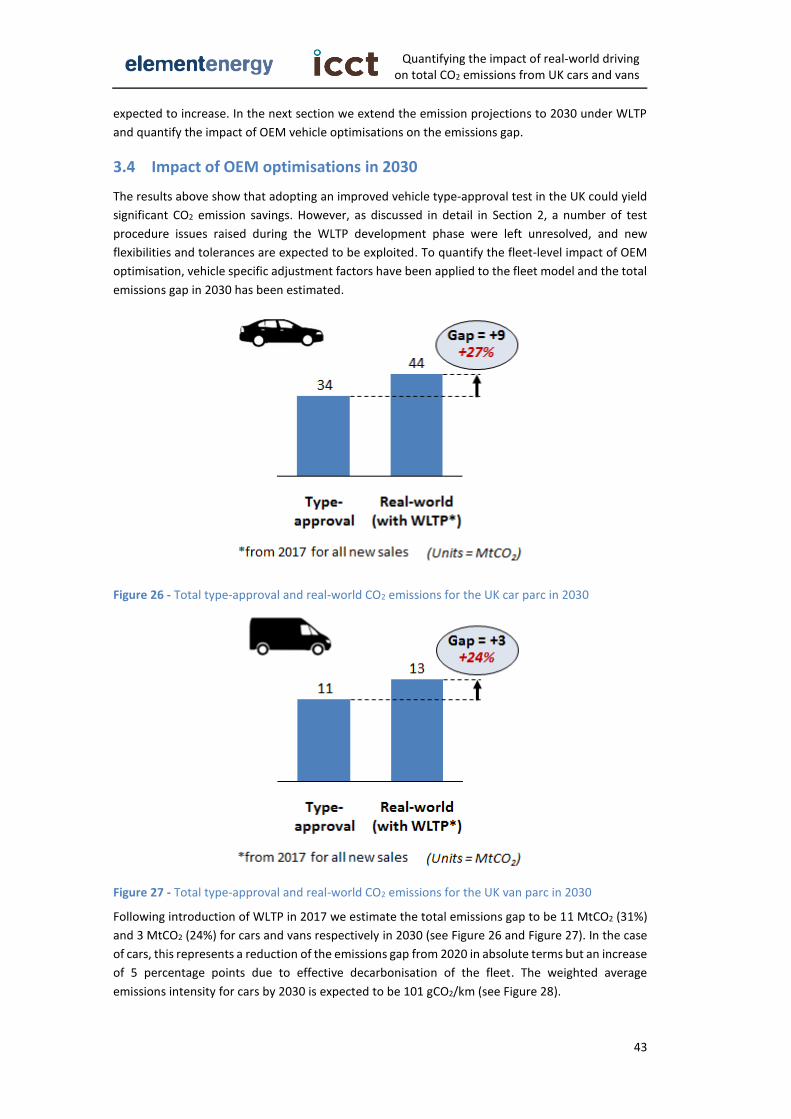
Quantifying the impact of real-world driving on total CO2 emissions from UK cars and vans
43
expected to increase. In the next section we extend the emission projections to 2030 under WLTP
and quantify the impact of OEM vehicle optimisations on the emissions gap.
3.4 Impact of OEM optimisations in 2030
The results above show that adopting an improved vehicle type-approval test in the UK could yield
significant CO2 emission savings. However, as discussed in detail in Section 2, a number of test
procedure issues raised during the WLTP development phase were left unresolved, and new
flexibilities and tolerances are expected to be exploited. To quantify the fleet-level impact of OEM
optimisation, vehicle specific adjustment factors have been applied to the fleet model and the total
emissions gap in 2030 has been estimated.
Figure 26 - Total type-approval and real-world CO2 emissions for the UK car parc in 2030
Figure 27 - Total type-approval and real-world CO2 emissions for the UK van parc in 2030
Following introduction of WLTP in 2017 we estimate the total emissions gap to be 11 MtCO2 (31%)
and 3 MtCO2 (24%) for cars and vans respectively in 2030 (see Figure 26 and Figure 27). In the case
of cars, this represents a reduction of the emissions gap from 2020 in absolute terms but an increase
of 5 percentage points due to effective decarbonisation of the fleet. The weighted average
emissions intensity for cars by 2030 is expected to be 101 gCO2/km (see Figure 28).
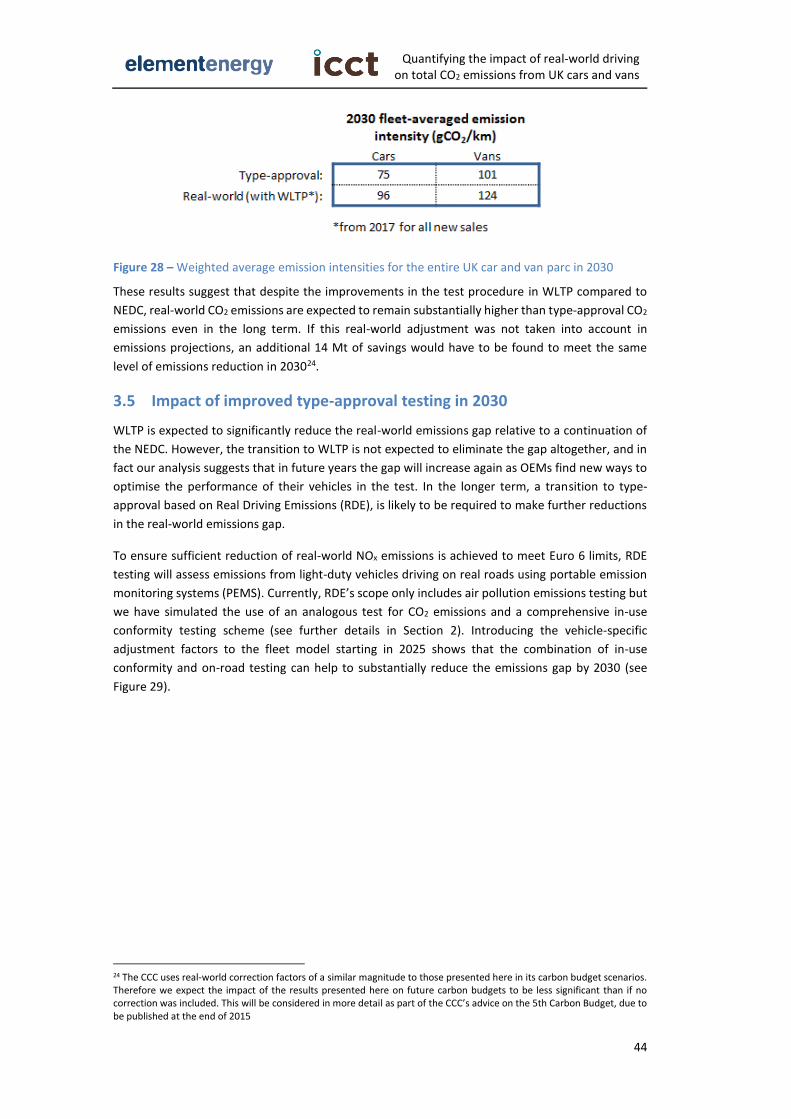
Quantifying the impact of real-world driving on total CO2 emissions from UK cars and vans
44
Figure 28 – Weighted average emission intensities for the entire UK car and van parc in 2030
These results suggest that despite the improvements in the test procedure in WLTP compared to
NEDC, real-world CO2 emissions are expected to remain substantially higher than type-approval CO2
emissions even in the long term. If this real-world adjustment was not taken into account in
emissions projections, an additional 14 Mt of savings would have to be found to meet the same
level of emissions reduction in 203024.
3.5 Impact of improved type-approval testing in 2030
WLTP is expected to significantly reduce the real-world emissions gap relative to a continuation of
the NEDC. However, the transition to WLTP is not expected to eliminate the gap altogether, and in
fact our analysis suggests that in future years the gap will increase again as OEMs find new ways to
optimise the performance of their vehicles in the test. In the longer term, a transition to type-
approval based on Real Driving Emissions (RDE), is likely to be required to make further reductions
in the real-world emissions gap.
To ensure sufficient reduction of real-world NOx emissions is achieved to meet Euro 6 limits, RDE
testing will assess emissions from light-duty vehicles driving on real roads using portable emission
monitoring systems (PEMS). Currently, RDE’s scope only includes air pollution emissions testing but
we have simulated the use of an analogous test for CO2 emissions and a comprehensive in-use
conformity testing scheme (see further details in Section 2). Introducing the vehicle-specific
adjustment factors to the fleet model starting in 2025 shows that the combination of in-use
conformity and on-road testing can help to substantially reduce the emissions gap by 2030 (see
Figure 29).
24 The CCC uses real-world correction factors of a similar magnitude to those presented here in its carbon budget scenarios. Therefore we expect the impact of the results presented here on future carbon budgets to be less significant than if no correction was included. This will be considered in more detail as part of the CCC’s advice on the 5th Carbon Budget, due to be published at the end of 2015
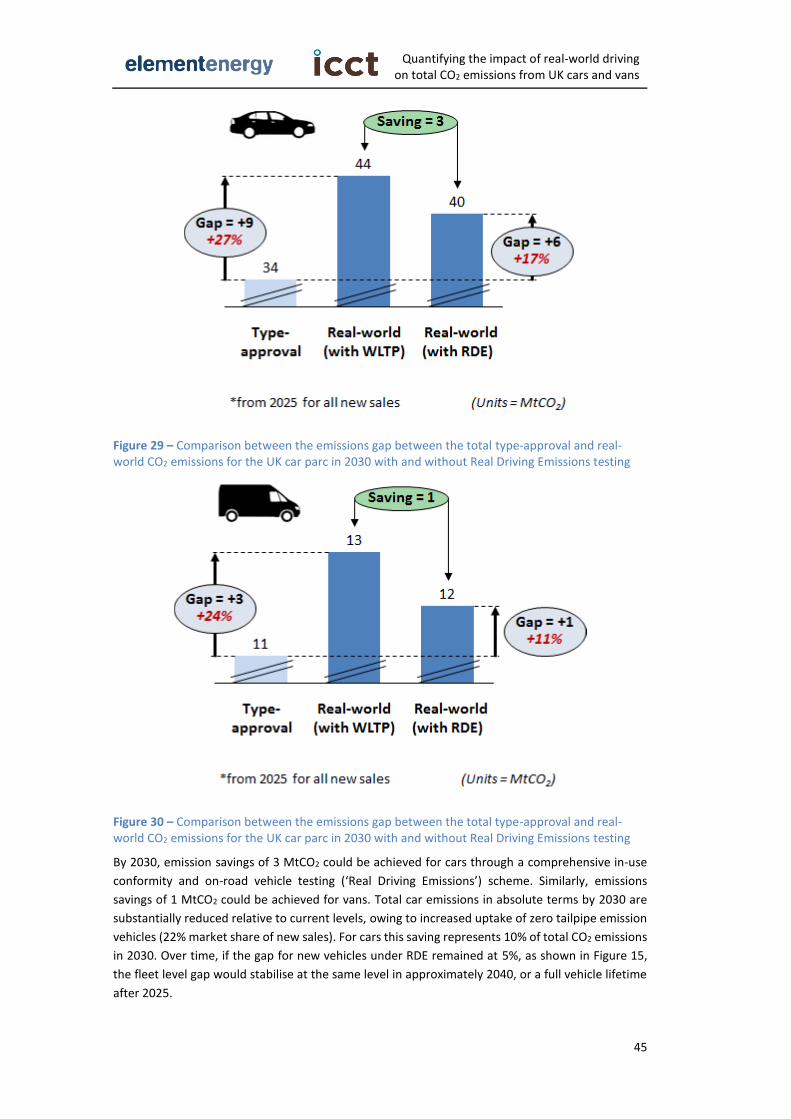
Quantifying the impact of real-world driving on total CO2 emissions from UK cars and vans
45
Figure 29 – Comparison between the emissions gap between the total type-approval and real-world CO2 emissions for the UK car parc in 2030 with and without Real Driving Emissions testing
Figure 30 – Comparison between the emissions gap between the total type-approval and real-world CO2 emissions for the UK car parc in 2030 with and without Real Driving Emissions testing
By 2030, emission savings of 3 MtCO2 could be achieved for cars through a comprehensive in-use
conformity and on-road vehicle testing (‘Real Driving Emissions’) scheme. Similarly, emissions
savings of 1 MtCO2 could be achieved for vans. Total car emissions in absolute terms by 2030 are
substantially reduced relative to current levels, owing to increased uptake of zero tailpipe emission
vehicles (22% market share of new sales). For cars this saving represents 10% of total CO2 emissions
in 2030. Over time, if the gap for new vehicles under RDE remained at 5%, as shown in Figure 15,
the fleet level gap would stabilise at the same level in approximately 2040, or a full vehicle lifetime
after 2025.
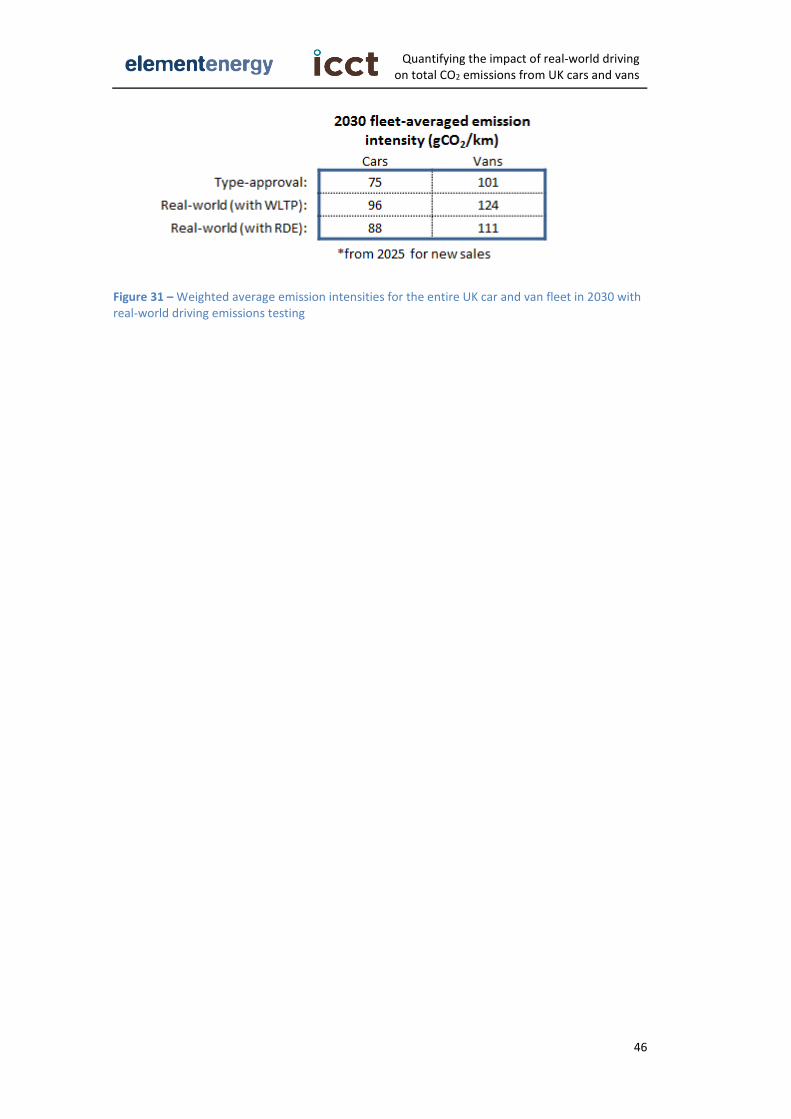
Quantifying the impact of real-world driving on total CO2 emissions from UK cars and vans
46
Figure 31 – Weighted average emission intensities for the entire UK car and van fleet in 2030 with real-world driving emissions testing
Quantifying the impact of real-world driving on total CO2 emissions from UK cars and vans
47
4 Summary and conclusions
Analysis conducted in this study aimed to understand the contributions to the CO2 emissions gap
for the UK car and van fleets and the potential impacts of the transition to the WLTP, both in the
short term and after potential future test cycle optimisations by OEMs. The study provides one of
the first estimates of how the evolution of the gap for new vehicles will affect emissions at a country
level, taking into account all vehicles in circulation, and hence the impacts on future carbon budgets.
The analysis highlights the following findings:
From 2002 to 2014, the gap between type-approval and real-world CO2 emissions for new
passenger cars increased from around 10% to about 35%. Most of this growth in the gap
is due to increased exploitation of tolerances and flexibilities in road load determination
and chassis dynamometer testing by vehicle manufacturers.
The current real world emissions gap for new cars is expected to continue to grow to
almost 50% in a hypothetical business-as-usual scenario with the NEDC still in place by
2020. This growth is expected to be due to vehicle manufacturers further exploring
tolerances and flexibilities in the NEDC test procedure, as well as an increasing market
share of hybrid and plug-in hybrid vehicles, for which the real-world CO2 emission levels
depend very much on the actual usage and re-charging patterns of the driver.
The proposed introduction of the WLTP in 2017 is expected to reduce the gap for new cars
to about 23%, reducing emissions from the UK light vehicle parc by 3 MtCO2 in 2020.
Beyond 2020, the emissions gap is expected to grow again to about 31%, even under
WLTP, driven by possibilities for vehicle manufacturers to exploit shortcomings of the new
test procedure, as well as a further increase in the market share of hybrid and plug-in
hybrid vehicles. The emissions gap for plug-in hybrid vehicles especially strongly depends
on real-world driving and re-charging patterns.
By 2030, the emissions gap for the UK car and van fleet is expected to be 12 MtCO2 (a gap
of 27%) under WLTP.
The introduction of a comprehensive in-use conformity testing scheme, supplemented by
on-road vehicle testing could help to reduce the gap to about 5% by 2030, saving 4 MtCO2
compared with the WLTP.
For light-commercial vehicles, more research is needed to quantify the gap between type-
approval and real-world CO2 emission levels. Preliminary data collected within this project
suggests that the current level of divergence might be slightly lower than for passenger
cars.
These results suggest that while the WLTP will provide a significant improvement in the real world
emissions gap and providing savings of millions of tonnes per year in the UK relative to a
continuation of the NEDC, a further move towards independent in-use conformity and on-road
testing will be needed to fully close the gap. As the US experience demonstrates, effective in-use
conformity testing can be achieved by having the authorities re-testing only a small number of
randomly and targeted selected vehicles, thereby causing no or very little additional cost. This kind
of in-use conformity testing could be introduced in the EU in the short run. Introduction of an on-
road testing scheme is an additional, but independent, element in a future improved testing
scheme. Here, as a first step, the CO2 emission data that will be recorded as part of the air pollution
RDE approach, could be published (at no additional cost for authorities) and made available for
analysis of the on-road CO2 emission performance of new vehicle types by authorities and research
institutes.
Quantifying the impact of real-world driving on total CO2 emissions from UK cars and vans
48
Given the time required to introduce such an improved testing scheme, including in-use conformity
and on-road vehicle testing for CO2, it is likely that the WLTP will be used to underpin future fleet
CO2 emission targets to at least 2025. If this is the case, then it suggests that regulators will need to
take into account the real-world emissions gap when defining post-2021 fleet CO2 targets. In other
words, future CO2 targets defined using WLTP should be highly ambitious, ensuring genuine real-
world emission reductions even after applying an NEDC-WLTP correlation factor and after taking
into account future vehicle manufacturers’ optimisations towards WLTP.
Ultimately, continuing efforts to reduce the real-world gap will benefit all stakeholders.
Governments with binding CO2 targets will have increased certainty on the emissions reduction
potential from the light vehicle sector, and avoid unexpected shortfalls in reductions that must be
delivered instead by other sectors. Vehicle users will benefit from realistic estimates of fuel costs,
allowing informed choices on the trade-offs between upfront costs of fuel saving technologies and
future savings. Finally, manufacturers would benefit from increased customer satisfaction and an
increased demand for low emission vehicles which deliver the advertised emissions and fuel cost
benefits. Given these mutual benefits, regulators and the industry should continue to work towards
a timely introduction of the WLTP as currently planned in 2017, while also turning their attention to
further changes in test procedures and a pathway to testing based on real driving emissions.
Quantifying the impact of real-world driving on total CO2 emissions from UK cars and vans
49
5 Bibliography
(DECC, 2014): Department of Energy and Climate Change, 'Fossil fuel price projections', 2014
(DfT, 2009): Department for Transport, 'Low Carbon Transport: A Greener Future', 2009
(DfT, 2015a): Department for Transport, 'Road Traffic Forecasts (RTF15)', 2015
(DfT, 2015b): Department for Transport, 'Vehicle Licensing Statistics (VEH0211 and VEH0411)', 2015
(DRDNI, 2012): Department for Regional Development Northern Ireland, 'Northern Ireland
Transport Statistics', 2012
(EC, 2014): European Commission, 'CARS 2020', 2014
(EEA, 2015): European Environment Agency, 'Press release: New vans sold in Europe are increasingly
more fuel-efficient. European Environment Agency', 2015
(Fraunhofer, 2015): Fraunhofer ISI, ‘Real-world fuel economy and CO2 emissions of plug-in hybrid
electric vehicles’, 2015
(ICCT, 2013): Peter Mock, ‘Near-term technology potential for new cars in the EU’, 2013
(ICCT, 2014a): Peter Mock, Jörg Kühlwein, Uwe Tietge, Vicente Franco, Anup Bandivadekar, John
German, 'The WLTP: How a new test procedure for cars will affect fuel consumption values in the
EU', 2014
(ICCT, 2014b): International Council on Clean Transportation , 'From Laboratory to Road - A 2014
update of official and 'real-world' fuel consumption and CO2 values for passenger cars in Europe',
2014
(ICCT, 2014c): Peter Mock, 'European Vehicle Market Statistics Pocketbook 2014', 2014
(ICCT, 2014d): Vicente Franco, Francisco Posada Sánchez, John German, and Peter Mock, 'Real-
world exhaust emissions from modern diesel cars', 2014
(ICCT, 2014e): Peter Mock, 'EU CO2 standards for passenger cars and light-commercial vehicles',
2014
(ICCT, 2014f): Jörg Kühlwein, John German, Anup Bandivadekar, 'Development of test cycle
conversion factors among worldwide light-duty vehicle CO2 emission standards', 2014
(ICCT, 2011): Peter Mock, 'Inertia classes, vehicle emissions tests, and the dead hand of the past',
2011
(NAEI, 2013): National Atmospheric Emissions Inventory, 'Detailed GHG emissions data', 2013
(R-AEA, 2009): Ricardo-AEA, 'Updated Vehicle Emission Curves for Use in the National Transport
Model', 2009
(R-AEA, 2014): Ricardo-AEA, 'Understanding vehicle lifetime mileage and its impacts on the cost-
effectiveness of light-duty vehicle CO2 regulations', 2014
Quantifying the impact of real-world driving on total CO2 emissions from UK cars and vans
50
(Ross, 2013): Journal of Engineering Technology, 20(2), 38-41, 'Peirce’s criterion for the elimination
of suspect experimental data', 2013
(Schmidt and Johannsen, 2010): Bundesanstalt fur Straßenwesen (BASt) FE 84.0501/2010,
'Pilotprojekt zur Relevanzanalyse von Einflussfaktoren bei der Ermittlung der CO2-Emissionen und
des Kraftstoffverbrauchs im Rahmen der Typgenehmigung von Pkw (Bundesanstalt fur
Straßenwesen ', 2010
(Sileghem, 2014): Louis Sileghem, Dirk Bosteels, John May, Cécile Favre, Sebastian Verhelst, 'Analysis
of vehicle emission measurements on the new WLTC, the NEDC and the CADC', 2014
(SMMT, 2015): Society of Motor Manufacturers and Traders, 'New Car CO2 report', 2015
(TNO, 2012a): Kadijk, G., Verbeek, M., Smokers, R., Spreen, J., Patuleia, A., van Ras, M., et al.,
'Supporting Analysis regarding Test Procedure Flexibilities and Technology Deployment for Review
of the Light Duty Vehicle CO2 Regulations', 2012
(TNO, 2012b): Kadjik, G., & Ligterink, N., 'Road load determination of passenger cars', 2012
(TNO, 2014): Ligterink, N., Smokers, R. T. M., Bolech, M., 'Fuel-electricity mix and efficiency in Dutch
plug-in and range-extender vehicles on the road', 2014