impact of proposed changes to permitted development rights ... b tbr.pdf · soho, through rbkc,...
TRANSCRIPT

Impact of proposed changes to permitted development rights for Kensington and Chelsea For the Royal Borough of Kensington and Chelsea

Impact of proposed changes to permitted development rights for Kensington and Chelsea For the Royal Borough of Kensington and Chelsea
Prepared by TBR’s Economic Research Team
Enquiries about this report can be addressed to:
Martin Houghton, Senior Associate
22 February 2013 Suite One Top Floor, Burgess House, 93-105 St James Boulevard, Newcastle upon Tyne, NE1 4BW Telephone: +44 (0) 191 279 0900 Fax: +44 (0) 191 221 2220 Email: [email protected] www.tbr.co.uk
economic research & business intelligence
tbr knows… economics, creative, skills, environment

Document Information
© TBR
Document Information
Project Reference Number PN00113R
File Name Document1
Title Impact of proposed changes to permitted development rights for Kensington and Chelsea
Version number 2-1
Last update PN00113R_Significance&ImpactAnalysis_v2-1.docx
Name of Author Andrew Rowell
Name of Reviewer Martin Houghton
Document Status Confidential
Review Status Reviewed
Approval Status Final

Table of Contents
© TBR
Table of Contents
1. INTRODUCTION ................................................................................................... 2
2. THE IMPORTANCE OF BUSINESSES BASED IN B1A PREMISES ............................ 3
2.1 SIGNIFICANT SECTORS IN RBKC ................................................................................... 3
3. THE ECONOMIC IMPACT OF OFFICE CONVERSION .............................................. 7
3.1 RISK CATEGORIES ..................................................................................................... 7
3.2 PATTERNS OF LEASE EVENTS ........................................................................................ 8
3.3 OVERALL DIRECT IMPACT ............................................................................................ 9
3.4 OVERALL INDIRECT AND INDUCED IMPACT ..................................................................... 12
4. CONCLUSIONS: OVERALL ASSESSMENT OF IMPACT .......................................... 18
5. APPENDIX 1: TBR ............................................................................................... 21

Introduction
© TBR Page 2
1. Introduction The Government proposes to amend permitted development rights to allow conversion of office buildings with a business use class of B1a to residential properties without the need for formal planning permission1. The new right is due to come into force in spring 2013, and will be in place for a temporary period of three years. Exemptions for specific locations may be allowed, but only where the Local Authority can demonstrate that the proposed permitted development rights would have substantial adverse economic consequences.
This report focuses on two important implications of the proposed change to permitted development rights for the Royal Borough of Kensington and Chelsea:
• The importance of businesses that utilise B1a space in Kensington and Chelsea – to the local economy, the pan-London economy and the national economy.
• The likely impact of the proposed change, the effect on the office property stock in Kensington and Chelsea and the impact on the local economy.
The report has been developed in consultation with property experts Frost Meadowcroft.
1 Associated external physical development will still require planning permission. There will also be restrictions in relation to
transport, highways, flooding and land contamination.

The importance of businesses based in B1a premises
© TBR Page 3
2. The importance of businesses based in B1a premises TBR has developed an analysis of the scale of B1a business premises in the Royal Borough of Kensington and Chelsea (RBKC) which are at risk from the proposed change in permitted development rights. Firms in the borough are assigned a business use class based on their UK Standard Industrial Classification (UKSIC) as recorded in TBR’s own Trends Central Resource (TCR) database. This matching was validated with data on B1a premises in RBKC taken from the National Non-Domestic Rates (NNDR) and Valuation Office Agency (VOA) datasets. Our analysis identifies around 4,000 firms based in B1a premises in RBKC2.
In 2012, firms in B1a premises are estimated to have contributed to the RBKC economy in the following ways:
• 23% of the stock of firms (an estimated 4,000 firms, from a total of 17,100) • 17% of employment (an estimated 20,300 employees, from a total of around 118,000) • 30% of turnover (an estimated £5.8 billion, from a total of £19.7billion) • 25% of economic output (an estimated £1.5 billion Gross Value Added (GVA) per year, from a total
of £5.6 billion)
2.1 Significant sectors in RBKC
This section provides an analysis of significant sectors in RBKC, focusing on those which have a national and international economic significance. The creative industries are known to have a significant presence in Kensington and Chelsea, and are our focus here (based on the DCMS creative industries definition).
The analysis in this section is based on sector definitions derived from the UKSIC codes. Such an approach is necessarily narrow, focusing on the core business activities within each sector. The approach does not fully reflect the inter-relationships between firms in each sector and their supply chains and distribution channels, which can span a range of sectors.
2.1.1 Music
The UK is the second largest exporter of recorded music in the world after the USA, with a global market share of 12%3. In 2009, the latest year for which there is detailed sector specific data, UK artistic originals generated GVA of £1.33bn4 together with a trade surplus of nearly £138m. Economically, UK music punches above its weight with businesses generating three times more global trade than the UK’s trade in goods and 50% more than in services.
Music publishing is a resounding success in terms of international trade and RBKC represents the core of the UK’s offer, with over 28% of employment for the sector in England. Kensington and Chelsea is home to all four major record labels (Universal, Warner Music, Sony Music and EMI), though the industry’s significance extends far beyond these large, important businesses.
As of 2011, there were nearly 2,000 jobs in sound recording and music publishing in RBKC (SIC 59200) out of a total of 5,220 in London and 7,200 across the UK. Location quotients (LQs)5 demonstrate that
2 A further 350 firms could potentially be classed as occupying B1a premises, but the precise nature of their premises are
unclear. These firms are excluded from our analysis. Firms operating from residential premises (home businesses) are also excluded.
3 BPI Ltd. ‘Support for the creative economy: written evidence submitted by BPI (British Recorded Music Industry) Ltd’. House of Commons Paper on Value of Music, November 2012.
http://www.publications.parliament.uk/pa/cm201213/cmselect/cmcumeds/writev/suppcrec/sce04.htm 4 Intellectual Property Office. ‘Copyright Industry adds an extra £3billion to national accounts’. June 2012.
www.ipo.gov.uk/about/press/press-release/press-release-2012/press-release-20120608.htm 5 Location Quotients are a standard measure used to compare the concentration of firms or employment in an area, relative to
another area. An LQ greater than 1 represents a high concentration, while an LQ less than 1 represents a scarcity. For example, an LQ of 14 represents 14 times the concentration one would expect within London. An LQ of 1.25 or greater is regarded as significant.

The importance of businesses based in B1a premises
© TBR Page 4
employment in the music industry is heavily concentrated in RBKC compared with London (an LQ of 14.3) and England (an LQ of 57.0). Firm LQs of 2.77 and 5.15 were recorded for London and England respectively.
Table 1: Music publishing employment in London
Music Publishing and Sound Recording (SIC 59200) Employees Percentage
Kensington and Chelsea 1,990 38%
Westminster 850 16%
Hammersmith and Fulham 530 10%
Camden 390 7%
Hackney 210 4%
Southwark 210 4%
Other London boroughs combined 1,040 21%
Total 5,220 100%
Source: BRES 2011 (TBR ref: W3/S1)
Music publishing and the music business within RBKC demonstrates the classic characteristics of a cluster, with high LQs for both employment and firms together with the presence of international leaders and independent small businesses. The loss of any of these businesses would represent a blow to the cluster and could undermine the strength of the industry to the UK as a whole. Although smaller, independent firms may be most vulnerable (first because they are less likely to own their office accommodation, and second because the pressure to accept a settlement will be more persuasive) these firms often provide the creative impetus that gives the major record labels confidence to remain in their current location. Although the direct economic impact of smaller firms relocating might be relatively small, the indirect impact that this precipitates could be more significant.
2.1.2 Film, TV and Video
In 2009 the UK film industry contributed over £4.5bn to GDP and £1.2bn to the Exchequer, as well as supporting 100,000 jobs6. There is no equivalent data for TV.
The film sector is concentrated in the South East and especially within a narrow wedge fanning out from Soho, through RBKC, Hammersmith and Fulham, and Ealing to Shepperton and Pinewood studios in the west. The cluster is relatively tight-knit, with firms occupying a range of contemporary settings beyond traditional studios, reflecting the increasing use of digital technology in the industry.
Statistics for the sector are captured through the UKSIC elements: production (SIC 59111), postproduction (SIC 5912) and distribution (SIC 59131). All three subsectors have a presence in RBKC. Kensington and Chelsea is particularly strong in production and distribution. In addition, proximity to Soho, Hammersmith and Fulham, and Ealing together with transport links (the A40 Westway and the Piccadilly line) means that RBKC is home to businesses that are core to the sector.
Table 2 illustrates the overall significance of the sector to RBKC, with most subsectors demonstrating an LQ above 1.25 for both employment and firms.
6 Oxford Economics. The Economic Impact of the UK Film Industry. Oxford Economics: Oxford, 2010.

The importance of businesses based in B1a premises
© TBR Page 5
Table 2: LQs for Film, TV and Video
Segment LQ London (Employment)
LQ England (Employment) LQ London (Firms) LQ England (Firms)
Film production (SIC 59111) 1.5 5.4 3.45 1.52
Post production (SIC 5912) 0.4 1.7 * *
Film distribution (SIC 59131) 1.4 5.9 * *
Video production (SIC 59112) 1.2 3.2 4.41 1.51
TV production (SIC 59113) 0.4 1.7 1.40 0.74
Source: BRES 2011 / TCR (TBR ref: W1/S3)
TV has many similar characteristics to the film sector and they share much of the same supply chain, such as props, special effects and postproduction. They differ most notably at the production and distribution/broadcast stages, though even here the boundaries are blurring with the development of new technologies. West London is particularly strong in TV with studios in Ealing and Park Royal and the BBC in White City.
While the key production facilities are likely to use premises classified as sui generis or B8, the proximity to firms that using B1a offices is important. This is a sector which is built on close working and social relationships and where minor dislocations can result in major disruption.
2.1.3 Publishing
Overall, the emergence of digital media and technology is transforming the publishing sector. One of the defining characteristics has been the continuing decline in traditional print newspapers. In the book publishing sector, there has also been a decline in print sales to both UK domestic and export markets. Digital publishing, on the other hand, is a rapidly growing industry7. This activity is well suited to B1 premises.
The UK book publishing sector is defined by a mixture of large scale publishers such as Random House Penguin, and a large independent publisher sector, which together account for about 45% of the publishing market8. In 2011 the value of publishing’s sales to the UK was £3.2bn, with an increasing contribution coming from the digital sales (8%)9.
Table 3: LQs for Newspaper and Book Publishing
Segment LQ London (Employment)
LQ England (Employment)
LQ London (Firms)
LQ England (Firms)
Newspaper publishing (SIC 58130) 6.72 10.64 1.91 3.07
Book publishing (SIC 58110) 1.99 5.22 3.27 2.08
Source: BRES 2011 (TBR ref: W1/S3)
Our analysis also found that the publishing sector, particularly newspapers, is strong within RBKC. As of 2011, there were over 2,100 jobs associated with newspaper publishing (SIC 58130), 560 with book publishing (SIC 58110) and a further 260 in publishing periodicals and journals (SIC 58142). Of particular significance was that in both firms and employment, newspaper publishing and book publishing were found to have strong LQ concentrations in RBKC in comparison to both London and England.
7 Publishers Association. Market Research and Statistics. Publishing Association: London, 2012. 8 The Guardian. ‘Publishing industry: waving or drowning?’. October 2012
http://www.guardian.co.uk/commentisfree/2012/oct/29/penguin-random-house-merger-editorial
9 Publishers Association. Market Research and Statistics. Publishing Association: London, 2012.

The importance of businesses based in B1a premises
© TBR Page 6
2.1.4 Fashion, textile and design activities
The UK has a global reputation as leaders in fashion design and trendsetting. In 2010, the UK fashion industry was valued at £21 billion. The scope of the industry reaches far beyond fashion design, encompassing a complex web of materials, textile production, clothing design, manufacturing, wholesaling, marketing and retailing of a wide range of fashion products10.
To examine and understand the significance of fashion, textile and design activities found in RBKC it is important to recognise this wider definition of the fashion industry. For example, this means the inclusion of manufacturing activities in SIC divisions 14 (Manufacturing of wearing apparel), 15 (Manufacturing of leather and related products), and 74 (Specialised design activities). Our matching of firm data with data on B1a business premises confirms that firms with these SIC codes are operating in B1a premises in RBKC. It is likely that they relate to small-scale specialist manufacturing, with a heavy emphasis on design activities.
Table 4: Employment LQs for Fashion, Textile and Design Activities
Segment Employment LQ London LQ England
Specialised design activities (SIC 74100) 840 2.32 5.32
Manufacture of women's outerwear, other than leather clothes and workwear (SIC 14132) 52 1.33 1.5
Manufacture of luggage, handbags and the like, saddlery and harness (SIC 15120) 24 1.29 2.14
Source: BRES 2011 (TBR ref: W1/S3)
Our analysis shows that in terms of employment, specialised design activities (74100), Manufacture of women's outerwear other than leather clothes and workwear (14132) and Manufacture of luggage, handbags and the like, saddlery and harness (15120) were fashion industry SICs significant to RBKC.
2.1.5 Other photographic and film processing activities
Our analysis also shows that RBKC is home to a concentration of photographic and film processing businesses, which may be connected to other sectors such as publishing, advertising and fashion. In comparison to both London and England, the concentration of employment in the photographic and film processing industry is higher in RBKC than might be expected.
Table 5: Employment LQs for Other Photographic and Film Processing Activities
Segment Employment LQ London LQ England
Portrait photographic activities (SIC 74201) 40 1.55 2.44
Other specialist photography (SIC 74202) 40 2.13 5.45
Film processing (SIC 74203) 40 1.46 2.80
Other photographic activities (SIC 74209) 170 2.10 4.43
Source: BRES 2011 (TBR ref: W1/S3)
10 Oxford Economics. The Value of the Fashion Industry. Oxford Economics: Oxford, 2010.

The economic impact of office conversion
© TBR Page 7
3. The economic impact of office conversion In order to assess the potential impact of office properties being converted to residential use, TBR designed a methodology which links firms and the economic value they contribute (overall and within key sectors) with the premises they occupy and the risk associated with the conversion of these premises. Our approach is highly granular, and goes significantly beyond simple estimations of the size and scale of the likely impact to look in detail at likely outcomes.
Our analysis is based on linking data from the TCR database11, the Valuation Office Agency and data on National Non-Domestic Rates (business rates). We use approved HM Treasury Green Book techniques to assess impact, including indirect and induced impacts, in order to generate evidence through a recognised, robust approach.
Our analysis of the likely impact of the proposed change to permitted development rights is based on the assumption that conversion rates are likely to be very high and rapid, because a very high proportion of properties in RBKC are highly suitable for conversion and are likely to be available immediately or within the next three years as the premiums are so high that they will allow owners to incentivise tenants to vacate. The assumptions underpinning our analysis have been tested with property experts.
3.1 Risk categories
We assign B1a business premises in RBKC to categories which describe the risk of them being converted from office to residential use. All but a few premises are considered to be at risk. Firms based in B1a premises are assigned to the same risk category as the premises they occupy.
Table 6: Risk categories
Risk category Severity Description
Risk Category 1 Very high to severe risk Vacant office premises which are suitable for conversion to residential use
Risk Category 2 High risk Occupied office premises, suitable for conversion, in areas with high residential premiums
Risk Category 3 Medium to high risk Occupied office premises, suitable for conversion, in areas with lower residential premiums
Risk Category 4 Low risk Other occupied office properties deemed unsuitable on the basis of floorplate or cost of conversion
All premises identified as being vacant are regarded as being at very high to severe risk from the proposed change to permitted development rights (Risk Category 1). Premises identified as being unsuitable for conversion, mainly because of the size and shape of their floorplate, are all regarded as being at low risk (Risk Category 4). The remaining premises are regarded as being at high risk from the proposed change (Risk Category 2), or at medium to high risk (Risk Category 3), on the basis of their postcode. Premises located in areas with high residential premiums are regarded as being at high risk as they are more likely to be converted than premises in areas with low residential premiums – though there is still a significant risk attached to premises in Risk Category 3.
11 See Appendix 1.

The economic impact of office conversion
© TBR Page 8
3.2 Patterns of lease events
The available data suggests that the current leases for most occupied B1a premises in RBKC will end in the next 3–4 years. 60% of leases are due to expire by December 201512.
Figure 1: Lease ends in B1a premises by year
Source: CoStar / Frost Meadowcroft (TBR ref: W6/S2)
A similar number of leases on high risk premises are due to end in each of the next four years, and conversions of these premises are likely to have an ongoing and cumulative effect. In comparison, there is a particular concentration of lease end dates in medium to high risk premises in 2014 and 2015, and the immediate impact of conversions of these premises is likely to be most acute in in these years and into 2016.
Figure 2: Lease ends in B1a premises by year, by risk category
Source: CoStar / Frost Meadowcroft (TBR ref: W6/S2)
12 CoStar / Frost Meadowcroft. Data includes leases on B1a premises expiring by end 2033. Property experts estimate that the
CoStar database covers between 50% and 75% of all leases.
16%
25%
19%
13%
3% 5%
3% 4%
7%
3% 3%
0%
5%
10%
15%
20%
25%
30%
2013 2014 2015 2016 2017 2018 2019 2020 2021 2022 2023 and later
0%
5%
10%
15%
20%
25%
30%
35%
2013 2014 2015 2016 2017 2018 2019 2020 2021 2022 2023 and later
High risk Medium to high risk
The economic impact of office conversion
© TBR Page 9
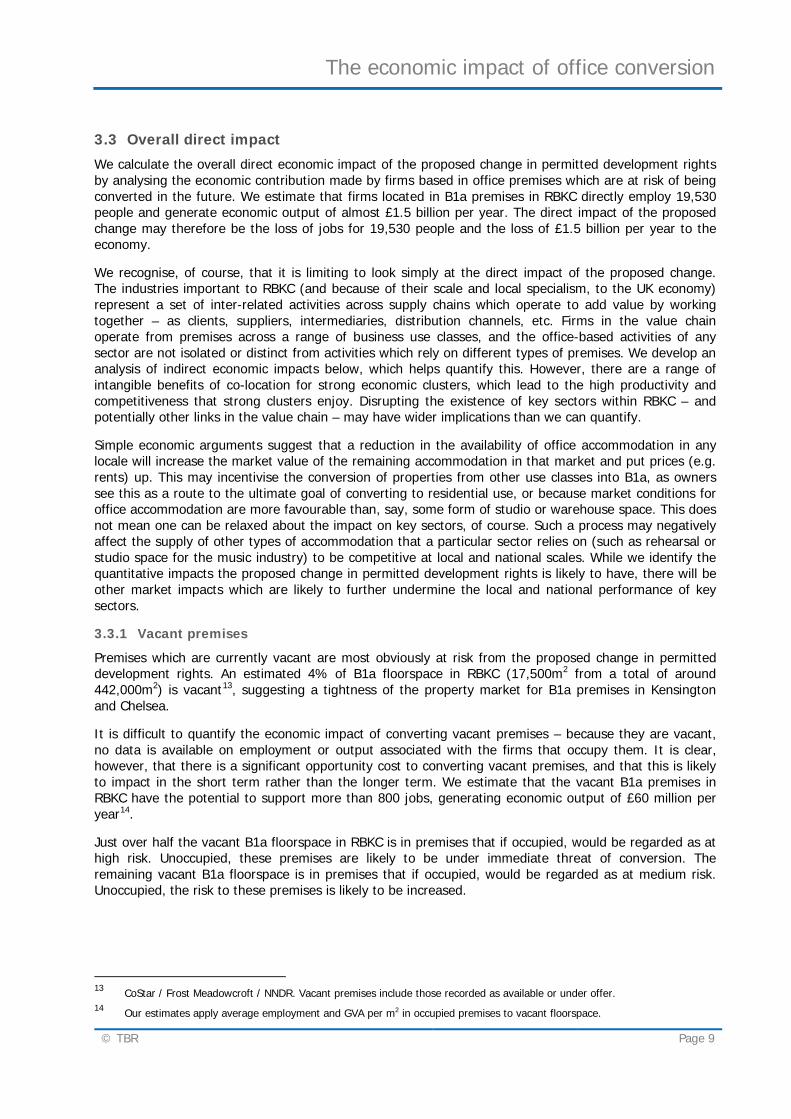
3.3 Overall direct impact
We calculate the overall direct economic impact of the proposed change in permitted development rights by analysing the economic contribution made by firms based in office premises which are at risk of being converted in the future. We estimate that firms located in B1a premises in RBKC directly employ 19,530 people and generate economic output of almost £1.5 billion per year. The direct impact of the proposed change may therefore be the loss of jobs for 19,530 people and the loss of £1.5 billion per year to the economy.
We recognise, of course, that it is limiting to look simply at the direct impact of the proposed change. The industries important to RBKC (and because of their scale and local specialism, to the UK economy) represent a set of inter-related activities across supply chains which operate to add value by working together – as clients, suppliers, intermediaries, distribution channels, etc. Firms in the value chain operate from premises across a range of business use classes, and the office-based activities of any sector are not isolated or distinct from activities which rely on different types of premises. We develop an analysis of indirect economic impacts below, which helps quantify this. However, there are a range of intangible benefits of co-location for strong economic clusters, which lead to the high productivity and competitiveness that strong clusters enjoy. Disrupting the existence of key sectors within RBKC – and potentially other links in the value chain – may have wider implications than we can quantify.
Simple economic arguments suggest that a reduction in the availability of office accommodation in any locale will increase the market value of the remaining accommodation in that market and put prices (e.g. rents) up. This may incentivise the conversion of properties from other use classes into B1a, as owners see this as a route to the ultimate goal of converting to residential use, or because market conditions for office accommodation are more favourable than, say, some form of studio or warehouse space. This does not mean one can be relaxed about the impact on key sectors, of course. Such a process may negatively affect the supply of other types of accommodation that a particular sector relies on (such as rehearsal or studio space for the music industry) to be competitive at local and national scales. While we identify the quantitative impacts the proposed change in permitted development rights is likely to have, there will be other market impacts which are likely to further undermine the local and national performance of key sectors.
3.3.1 Vacant premises
Premises which are currently vacant are most obviously at risk from the proposed change in permitted development rights. An estimated 4% of B1a floorspace in RBKC (17,500m2 from a total of around 442,000m2) is vacant13, suggesting a tightness of the property market for B1a premises in Kensington and Chelsea.
It is difficult to quantify the economic impact of converting vacant premises – because they are vacant, no data is available on employment or output associated with the firms that occupy them. It is clear, however, that there is a significant opportunity cost to converting vacant premises, and that this is likely to impact in the short term rather than the longer term. We estimate that the vacant B1a premises in RBKC have the potential to support more than 800 jobs, generating economic output of £60 million per year14.
Just over half the vacant B1a floorspace in RBKC is in premises that if occupied, would be regarded as at high risk. Unoccupied, these premises are likely to be under immediate threat of conversion. The remaining vacant B1a floorspace is in premises that if occupied, would be regarded as at medium risk. Unoccupied, the risk to these premises is likely to be increased.
13 CoStar / Frost Meadowcroft / NNDR. Vacant premises include those recorded as available or under offer. 14 Our estimates apply average employment and GVA per m2 in occupied premises to vacant floorspace.
The economic impact of office conversion
© TBR Page 10
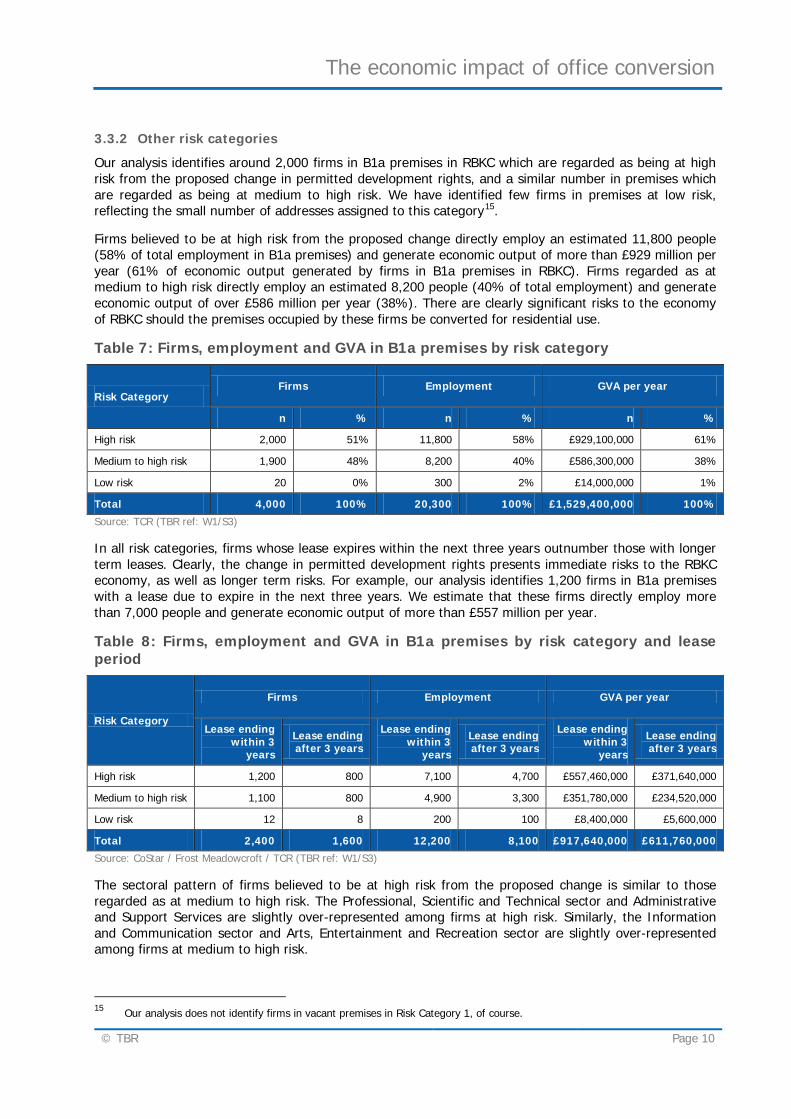
3.3.2 Other risk categories
Our analysis identifies around 2,000 firms in B1a premises in RBKC which are regarded as being at high risk from the proposed change in permitted development rights, and a similar number in premises which are regarded as being at medium to high risk. We have identified few firms in premises at low risk, reflecting the small number of addresses assigned to this category15.
Firms believed to be at high risk from the proposed change directly employ an estimated 11,800 people (58% of total employment in B1a premises) and generate economic output of more than £929 million per year (61% of economic output generated by firms in B1a premises in RBKC). Firms regarded as at medium to high risk directly employ an estimated 8,200 people (40% of total employment) and generate economic output of over £586 million per year (38%). There are clearly significant risks to the economy of RBKC should the premises occupied by these firms be converted for residential use.
Table 7: Firms, employment and GVA in B1a premises by risk category
Risk Category Firms Employment GVA per year
n % n % n %
High risk 2,000 51% 11,800 58% £929,100,000 61%
Medium to high risk 1,900 48% 8,200 40% £586,300,000 38%
Low risk 20 0% 300 2% £14,000,000 1%
Total 4,000 100% 20,300 100% £1,529,400,000 100%
Source: TCR (TBR ref: W1/S3)
In all risk categories, firms whose lease expires within the next three years outnumber those with longer term leases. Clearly, the change in permitted development rights presents immediate risks to the RBKC economy, as well as longer term risks. For example, our analysis identifies 1,200 firms in B1a premises with a lease due to expire in the next three years. We estimate that these firms directly employ more than 7,000 people and generate economic output of more than £557 million per year.
Table 8: Firms, employment and GVA in B1a premises by risk category and lease period
Risk Category
Firms Employment GVA per year
Lease ending within 3
years
Lease ending after 3 years
Lease ending within 3
years
Lease ending after 3 years
Lease ending within 3
years
Lease ending after 3 years
High risk 1,200 800 7,100 4,700 £557,460,000 £371,640,000
Medium to high risk 1,100 800 4,900 3,300 £351,780,000 £234,520,000
Low risk 12 8 200 100 £8,400,000 £5,600,000
Total 2,400 1,600 12,200 8,100 £917,640,000 £611,760,000
Source: CoStar / Frost Meadowcroft / TCR (TBR ref: W1/S3)
The sectoral pattern of firms believed to be at high risk from the proposed change is similar to those regarded as at medium to high risk. The Professional, Scientific and Technical sector and Administrative and Support Services are slightly over-represented among firms at high risk. Similarly, the Information and Communication sector and Arts, Entertainment and Recreation sector are slightly over-represented among firms at medium to high risk.
15 Our analysis does not identify firms in vacant premises in Risk Category 1, of course.

The economic impact of office conversion
© TBR Page 11
Table 9: Firms at risk by sector and risk category
Sector Risk Category
High risk Medium to high risk
Manufacturing 50 50
Construction 200 200
Information and Communication 400 500
Financial and Insurance 50 0
Professional, Scientific and Technical 850 650
Administrative and Support Services 350 200
Arts, Entertainment and Recreation 50 200
Other Services 100 100
Total 2,000 1,900
Source: TCR (TBR ref: W1/S3). Data rounding obscures firms in Risk Category 4, which are not shown.
A majority of firms in the Professional, Scientific and Technical sector, the Administrative and Support Services sector and the Financial and Insurance sector are based in premises regarded as being at high risk. Conversely, a majority of firms in the Information and Communication sector and the Arts, Entertainment and Recreation sector are in premises at medium to high risk.
Table 10: Firms, employment and GVA by sector
Sector Firms Employment GVA per year
Manufacturing 100 600 £37,400,000
Construction 450 2,000 £113,500,000
Information and Communication 900 5,200 £422,900,000
Financial and Insurance 50 200 £14,300,000
Professional, Scientific and Technical 1,500 7,400 £665,500,000
Administrative and Support Services 550 2,900 £182,700,000
Arts, Entertainment and Recreation 250 800 £69,100,000
Other Services 150 1,000 £22,500,000
Total 4,000 20,300 £1,529,400,000
Source: TCR (TBR ref: W1/S3)
There is a clear risk to the RBKC economy in relation to the Professional, Scientific and Technical sector, given its importance in terms of both employment and output. Similarly, the loss of firms in the Information and Communication sector would be significant.
3.3.3 Impact on the creative industries
Our analysis of significant sectors in RBKC showed the importance of the creative industries in Kensington and Chelsea. Most firms in RBKC which operate in the creative industries are based in premises regarded as being at medium to high risk from the proposed change in permitted development rights. Employment and output, however, are to some extent concentrated in premises believed to be at high risk.

The economic impact of office conversion
© TBR Page 12
Table 11: B1a Creative industries at risk in RBKC by risk category
Risk Category Firms Employment GVA per year
High risk 450 3,900 £350,100,000
Medium to high risk 800 3,400 £237,900,000
Total 1,250 7,300 £588,000,000
Source: TCR (TBR ref: W1/S3)
This is true in most creative industries subsectors, with the exception of Music and the Visual and Performing Arts16, and the Film, TV and Video sector where employment and output is more highly concentrated in premises regarded as being at medium to low risk. The Publishing sector, meanwhile, is spread relatively evenly between premises regarded as being at high risk and premises believed to be at medium to high risk.
Table 12: B1a creative industries subsectors at risk in RBKC by risk category
Creative subsector High risk Medium to high risk
Firms Employment GVA per year Firms Employment GVA per year
Advertising 100 1,200 £126,000,000 100 300 £23,400,000
Architecture 70 500 £60,100,000 110 500 £21,000,000
Designer Fashion 30 300 £22,700,000 40 100 £3,900,000
Digital and Entertainment Media 0 100 £11,900,000 10 0 £1,800,000
Music and the Visual and Performing Arts 70 400 £25,700,000 210 600 £54,200,000
Publishing 110 1,100 £89,000,000 80 1,100 £79,000,000
Radio and TV 0 0 £0 10 100 £3,500,000
Video, Film and Photography 80 300 £14,800,000 240 700 £51,100,000
Total 460 3,900 £350,100,000 790 3,400 £237,900,000
Source: TCR (TBR ref: W9/S2)
The Publishing subsector may represent the greatest risk for RBKC, given its overall contribution to the economy in terms of both employment and output, and the pattern of lease end dates by risk category over the next few years. The loss of firms operating in the Advertising, Music and the Visual and Performing Arts, Architecture or the Video, Film and TV subsectors would also be significant.
3.4 Overall indirect and induced impact
3.4.1 Explaining indirect and induced impacts
The economic impact of a particular sector is not confined to its direct contribution in terms of employment and output. Rather, the true economic value of a sector (or grouping of sectors) should be based not solely on an assessment of its direct economic impact, but on a measure that also includes its indirect and induced impacts. Indirect and induced impacts are calculated using multipliers attached to data on direct economic impacts.
A firm delivers indirect economic impacts through supply chain activity. A recording studio purchasing a microphone is an example of an indirect economic impact. The significance of these indirect impacts varies by sector and this leads to different sectors having different multipliers. For example, if a sector’s
16 Our impact analysis uses a broader definition than our analysis of significant sectors in RBKC.

The economic impact of office conversion
© TBR Page 13
annual economic output is £0.8 billion and it has an indirect (or type 1) multiplier of 1.25, then the additional annual benefit to the economy will be £0.2 billion, making £1 billion in total.
A firm also delivers induced economic impacts through the spending of its members of staff. A member of staff purchasing a DVD on the way home from work is an example of an induced economic impact. Again, the significance of these impacts varies by sector and this leads to different sectors having different multipliers. For example, if a sector’s annual economic output is £0.4 billion and it has an induced (or type 2) multiplier of 1.2, then the additional annual benefit to the economy will be £0.08 billion, making £0.48 billion in total.
Sectoral estimates of both indirect and induced multipliers have been transferred from previous research. We apply these estimates on a firm by firm basis, to firms that occupy B1a premises in RBKC.
However, not all indirect and induced impacts will be retained within RBKC. Our recording studio, for example, may order their microphone online, while their member of staff may buy the DVD when they arrive home, and not in the locality where they work. This phenomenon is recognised as economic leakage. TBR has drawn on previous research in the London Borough of Camden to model the leakage from both RBKC, and London as a whole. While there are some differences between the economic profiles of Camden and RBKC, the leakage factors were developed in 2012 and were based on a sample of 402 firms, so they are contemporary and can be expected to be reasonably robust at local authority level. However, the data do not differentiate between sectors, so the same leakage factor is applied to all firms. Additionally, the data do not differentiate between the leakage in indirect impacts and leakage in induced impacts, so the same factor is applied to both.
As we might expect, the leakage from RBKC is higher than the leakage across London. This is partly because London is simply a larger geography, and partly because of its economic coherence. Different areas of the capital specialise in offering different goods and services which, taken in totality, cater for a full spectrum of business and consumer demand.
Our analysis of indirect and induced economic impacts is based on employment and output data that measure direct sectoral economic impact of firms located in B1a premises in RBKC. Applying indirect and induced impact multipliers and estimates of economic leakage to this data enables us to model the economic impact of converting B1a properties to residential use on both the RBKC economy, and the wider economy.
3.4.2 Indirect and induced impacts
As direct employment and economic output are concentrated in firms believed to be at high risk from the proposed change in permitted development rights, indirect and induced economic impacts are also concentrated in these firms.
Table 13: Direct, indirect and induced employment by risk category
Risk Category Direct employment Indirect employment Induced employment Total employment
High risk 11,800 5,500 9,400 26,700
Medium to high risk 8,200 4,600 6,300 19,100
Low risk 300 100 200 600
Total 20,300 10,200 15,800 46,300
Source: TCR (TBR ref: W1/S7)
Our analysis suggests that the conversion of B1a premises regarded as being at high risk from the proposed change will impact on direct employment of 11,800 people in firms based in those premises in RBKC, and indirect and induced employment of 14,900 people in other types of premises or in other locations. The conversion of B1a premises regarded as being at medium to low risk will impact on direct employment of 8,200 people in firms in B1a premises in RBKC, and indirect and induced employment of 10,900 people in other types of premises or in other locations. A total of 45,700 jobs are at risk from the proposed change. A further 600 jobs – 300 directly associated with B1a premises in RBKC, and 300 in

The economic impact of office conversion
© TBR Page 14
other types of premises or in other locations – would be at risk should B1a premises believed to be at low risk be converted.
Table 14: Employment leakage by risk category
Risk Category Employment in RBKC
Employment elsewhere in London
Employment outside London
Total employment
High risk 15,700 4,900 6,100 26,700
Medium to high risk 11,000 3,600 4,500 19,100
Low risk 400 100 100 600
Total 27,100 8,600 10,700 46,300
Source: TCR (TBR ref: W1/S8)
Most of the jobs at risk are located in RBKC, of course. Reflecting the significance of key industries in Kensington and Chelsea, around 8,600 jobs located elsewhere in London and 10,700 jobs outside London are also at risk.
Table 15: Direct, indirect and induced GVA by risk category
Risk Category Direct GVA per year Indirect GVA per year Induced GVA per year Total GVA per year
High risk £929,100,000 £316,300,000 £523,900,000 £1,769,300,000
Medium to high risk £586,300,000 £244,400,000 £359,200,000 £1,189,900,000
Low risk £14,000,000 £4,700,000 £7,600,000 £26,300,000
Total £1,529,400,000 £565,500,000 £890,800,000 £2,985,700,000
Source: TCR (TBR ref: W1/S7)
Similarly, our analysis suggests that converting B1a premises which are believed to be at high risk from the proposed change will impact on direct economic output from firms in B1a premises in RBKC of more than £929 million per year, and indirect and induced economic output from firms in other types of premises or in other locations more than £840 million per year. The conversion of B1a premises regarded as being at medium to high risk will impact on direct economic output from firms in B1a premises in RBKC of more than £586 million per year, and indirect and induced economic output from firms in other types of premises or in other locations of almost £637 million per year. Total direct economic output of almost £3 billion per year is at risk. A further £26 million per year would be threatened if B1a premises believed to be at low risk were to be converted.
Table 16: GVA leakage by risk category
Risk Category Economic output (GVA per year) in
RBKC
Economic output (GVA per year)
elsewhere in London
Economic output (GVA per year) outside London
Total economic output (GVA per
year)
High risk £1,147,552,000 £277,266,000 £344,482,000 £1,769,300,000
Medium to high risk £743,236,000 £199,188,000 £247,476,000 £1,189,900,000
Low risk £17,198,000 £4,059,000 £5,043,000 £26,300,000
Total £1,908,038,000 £480,579,000 £597,083,000 £2,985,700,000
Source: TCR (TBR ref: W1/S8)
Most of the economic output at risk – more than £1.9 billion per year – is generated by firms located in RBKC. Economic output of almost £5 million per year generated by firms elsewhere in London, and output of almost £6 million per year generated by firms outside London, is also at risk.

The economic impact of office conversion
© TBR Page 15
Table 17: Direct, indirect and induced employment by sector
Sector Direct employment
Indirect employment
Induced employment
Total employment
Manufacturing 600 300 400 1,300
Construction 2,000 1,700 3,400 7,100
Accommodation and Food Services 100 0 0 100
Information and Communication 5,200 3,000 4,200 12,400
Financial and Insurance 200 100 200 500
Professional, Scientific and Technical 7,400 2,900 4,600 14,900
Administrative and Support Services 2,900 1,100 1,800 5,800
Arts, Entertainment and Recreation 800 800 800 2,400
Other Services 1,000 300 500 1,800
Total 20,300 10,200 15,800 46,300
Source: TCR (TBR ref: W1/S7)
The greatest indirect and induced impacts on employment and economic output are seen in those sectors where direct employment is most significant, of course. Our analysis confirms the particular risk to the economy, both in RBKC and beyond, of conversions to B1a premises that lead to the evictions of firms in sectors such as Professional, Scientific and Technical services, and Information and Communication.
Table 18: Direct, indirect and induced GVA by sector
Sector Direct GVA per year
Indirect GVA per year
Induced GVA per year
Total GVA per year
Manufacturing £37,400,000 £18,200,000 £26,500,000 £82,100,000
Construction £113,500,000 £41,700,000 £58,600,000 £213,800,000
Accommodation and Food Services £1,500,000 £400,000 £600,000 £2,500,000
Information and Communication £422,900,000 £182,500,000 £246,000,000 £851,400,000
Financial and Insurance £14,300,000 £4,000,000 £8,200,000 £26,500,000
Professional, Scientific and Technical £665,500,000 £197,300,000 £371,700,000 £1,234,500,000
Administrative and Support Services £182,700,000 £53,700,000 £101,700,000 £338,100,000
Arts, Entertainment and Recreation £69,100,000 £58,100,000 £61,800,000 £189,000,000
Other Services £22,500,000 £9,600,000 £15,500,000 £47,600,000
Total £1,529,400,000 £565,500,000 £890,800,000 £2,985,700,000
Source: TCR (TBR ref: W1/S7)
3.4.3 Indirect and induced impacts on the creative industries
Our analysis suggests that converting B1a premises regarded as being at high risk from the proposed change in permitted development rights will impact on direct employment of 3,900 people in creative industries firms in B1a premises in RBKC, and indirect and induced employment of 4,400 people in other types of premises or in other locations. The conversion of B1a premises regarded as being at medium to high risk from the proposed change will impact on direct employment of 3,400 people in creative industries firms in B1a premises in Kensington and Chelsea, and indirect and induced employment of 5,300 people in other types of premises, other sectors or other locations. A total of 17,000 jobs related to the creative industries in RBKC are at risk.

The economic impact of office conversion
© TBR Page 16
Table 19: Direct, indirect and induced employment in the creative industries by risk category
Risk Category Direct employment
Indirect employment
Induced employment Total employment
High risk 3,900 1,800 2,600 8,300
Medium to high risk 3,400 2,400 2,900 8,700
Total 7,300 4,200 5,500 17,000
Source: TCR (TBR ref: W9/S2)
We estimate that 9,800 jobs related to the creative industries are located in RBKC, and are at risk from the proposed change to permitted development rights. A further 3,200 jobs related to the creative industries in RBKC are at risk in London, while 4,000 jobs related to the creative industries in RBKC are at risk outside London.
Table 20: Employment leakage related to the creative industries, by risk category
Risk Category Employment in RBKC
Employment elsewhere in
London
Employment outside London Total employment
High risk 5,000 1,500 1,800 8,300
Medium to high risk 4,800 1,700 2,200 8,700
Total 9,800 3,200 4,000 17,000
Source: TCR (TBR ref: W9/S3)
Our analysis suggests that converting B1a premises which are believed to be at high risk will impact on direct economic output of creative industries firms in B1a premises in RBKC of more than £350 million per year, and indirect and induced economic output from firms in other types of premises, in other sectors or in other locations of almost £352 million per year. The conversion of B1a premises regarded as being at medium to high risk will impact on direct economic output of creative industries firms in B1a premises in RBKC of almost £238 million per year, and indirect and induced economic output from firms in other types of premises, other sectors or other locations of almost £305 million per year. Total economic output of more than £1.2 billion per year related to the creative industries in RBKC is at risk.
Table 21: Direct, indirect and induced GVA in the creative industries by risk category
Risk Category Direct GVA per year Indirect GVA per year Induced GVA per year Total GVA per year
High risk £350,100,000 £138,200,000 £213,400,000 £701,700,000
Medium to high risk £237,900,000 £136,400,000 £168,500,000 £542,800,000
Total £588,000,000 £274,600,000 £381,900,000 £1,244,500,000
Source: TCR (TBR ref: W9/S2)
We estimate that economic output of almost £760 million per year is generated by firms located in RBKC which are related to the cultural industries, and is at risk from the proposed change to permitted development rights. Economic output of almost £217 million per year generated by firms located elsewhere in London, and output of almost £270 million per year generated by firms located outside London, is related to the creative industries in Kensington and Chelsea and is also at risk.

The economic impact of office conversion
© TBR Page 17
Table 22: GVA leakage related to the creative industries, by risk category
Risk Category Economic output (GVA per year) in
RBKC
Economic output (GVA per year)
elsewhere in London
Economic output (GVA per year) outside London
Total economic output (GVA per
year)
High risk £441,516,000 £116,028,000 £144,156,000 £701,700,000
Medium to high risk £317,174,000 £100,617,000 £125,009,000 £542,800,000
Total £758,690,000 £216,645,000 £269,165,000 £1,244,500,000
Source: TCR (TBR ref: W9/S3)
Indirect and induced employment in the creative industries are, broadly, at least as significant as direct employment. Indirect and induced employment are particularly significant in relation to the Music, Visual and Performing Arts sector and the Video, Film and Photography sector.
Table 23: Direct, indirect and induced employment in the creative industries by subsector
Creative subsector Direct
employment Indirect
employment Induced
employment Total
employment
Advertising 1,500 500 900 2,900
Architecture 1,000 400 600 2,000
Designer Fashion 400 200 200 800
Digital and Entertainment Media 100 100 100 300
Music and the Visual and Performing Arts 1,000 900 1,000 2,900
Publishing 2,200 1,000 1,500 4,700
Radio and TV 100 100 100 300
Video, Film and Photography 1,000 1,100 1,000 3,100
Total 7,300 4,200 5,500 17,000
Source: TCR (TBR ref: W9/S2)
Analysis of indirect and induced GVA confirms the importance of the Music, Visual and Performing Arts and Video, Film and Photography sectors to the economy beyond RBKC. Compared with direct output, indirect and induced economic output is also significant in the TV and Radio sector. The proposed change to permitted development rights presents particular threats to the economy in relation to these sectors.
Table 24: Direct, indirect and induced GVA in the creative industries by subsector
Creative subsector Direct GVA per
year Indirect GVA per
year Induced GVA per
year Total GVA per
year
Advertising £149,400,000 £43,900,000 £83,200,000 £276,500,000
Architecture £81,100,000 £23,800,000 £45,200,000 £150,100,000
Designer Fashion £26,600,000 £13,000,000 £20,700,000 £60,300,000
Digital and Entertainment Media £13,600,000 £4,300,000 £6,800,000 £24,700,000
Music and the Visual and Performing Arts £79,900,000 £62,100,000 £67,900,000 £209,900,000
Publishing £168,000,000 £69,100,000 £96,100,000 £333,200,000
Radio and TV £3,500,000 £2,900,000 £3,100,000 £9,500,000
Video, Film and Photography £65,900,000 £55,400,000 £58,900,000 £180,200,000
Total £588,000,000 £274,600,000 £381,900,000 £1,244,500,000
Source: TCR (TBR ref: W9/S2)

Conclusions: Overall assessment of impact
© TBR Page 18
4. Conclusions: Overall assessment of impact We use data on lease end dates to calculate the overall impact of converting B1a premises to residential use on the RBKC economy and the wider economy over the next three years (2013–2015 inclusive), and the subsequent seven years (2016–2022). This analysis takes account of firms based in premises believed to be at high risk or at medium to high risk. We assume that premises regarded as being at low risk will not be converted over this timescale, on the basis that other, more attractive opportunities are available to developers.
The most immediate risk from the change in permitted development rights, of course, is to vacant B1a premises. It is difficult to quantify the economic impact of converting vacant premises – because they are vacant, no data is available on employment or output associated with the firms that occupy them. It is clear, however, that there is a significant opportunity cost to converting vacant premises, and that this is likely to impact in the short term rather than the longer term. We estimate that vacant B1a premises in RBKC have the potential to support more than 800 jobs, generating economic output of £60 million per year.
Our analysis suggests that over the next three years, around 12,100 jobs in firms in B1a premises in RBKC, and a further 15,700 indirect and induced jobs in firms in other types of premises or in other locations, are at risk from the proposed change to permitted development rights.
Table 25: Overall impact on employment, 2013–2015
Risk Category Direct employment Indirect employment Induced employment Total employment
High risk 5,800 2,700 4,600 13,100
Medium to high risk 6,300 3,500 4,900 14,700
Total 12,100 6,200 9,500 27,800
Source: TCR (TBR ref: W1/S7)
Most of the jobs at risk over the next three years are located in RBKC, of course. Reflecting the significance of key industries in Kensington and Chelsea, however, around 5,200 jobs located elsewhere in London and 6,400 jobs outside London are also at risk over this time period.
Table 26: Overall impact on employment by geography, 2013–2015
Risk Category Employment in RBKC Employment elsewhere in London
Employment outside London Total employment
High risk 7,700 2,400 3,000 13,100
Medium to high risk 8,500 2,800 3,400 14,700
Total 16,200 5,200 6,400 27,800
Source: TCR (TBR ref: W1/S8)
We estimate that over the next three years almost £910 million direct economic output per year generated by firms located in B1a premises in RBKC, and a further £876 million per year indirect and induced output generated by firms in other types of premises or in other locations, are at risk from the proposed change.
Table 27: Overall impact on GVA, 2013–2015
Risk Category Direct GVA per year Indirect GVA per year Induced GVA per year Total GVA per year
High risk £455,259,000 £154,987,000 £256,711,000 £866,957,000
Medium to high risk £451,451,000 £188,188,000 £276,584,000 £916,223,000
Total £906,710,000 £343,175,000 £533,295,000 £1,783,180,000
Source: TCR (TBR ref: W1/S7)

Conclusions: Overall assessment of impact
© TBR Page 19
We estimate that economic output of more than £1.1 billion per year generated by firms located in RBKC is at risk over the next three years. Economic output of almost £290 million per year generated by firms elsewhere in London, and output of almost £360 million per year generated by firms outside London, is also at risk from the conversion of B1a premises in RBKC.
Table 28: Overall impact on GVA by geography, 2013–2015
Risk Category Economic output (GVA per year) in
RBKC
Economic output (GVA per year)
elsewhere in London
Economic output (GVA per year) outside London
Total economic output (GVA per
year)
High risk £562,300,500 £135,860,300 £168,796,200 £866,957,000
Medium to high risk £572,291,700 £153,374,800 £190,556,500 £916,223,000
Total £1,134,592,200 £289,235,100 £359,352,700 £1,783,180,000
Source: TCR (TBR ref: W1/S8)
Over the period 2016–2022, we estimate that some 7,300 jobs in firms located in B1a premises RBKC, and a similar number in firms in other types of premises or in other locations, are at risk from the proposed change to permitted development rights.
Table 29: Overall impact on employment, 2016–2022
Risk Category Direct employment Indirect employment Induced employment Total employment
High risk 5,700 2,600 4,500 12,800
Medium to high risk 1,600 900 1,300 3,800
Total 7,300 3,500 5,800 16,600
Source: TCR (TBR ref: W1/S7)
We estimate that 9,700 jobs located in RBKC are at risk over the period 2016–2022. A further 3,100 jobs in London and 3,800 jobs outside the capital are threatened by the conversion of B1a premises in RBKC over this period.
Table 30: Overall impact on employment by geography, 2016–2022
Risk Category Employment in RBKC Employment elsewhere in London
Employment outside London Total employment
High risk 7,500 2,300 2,900 12,800
Medium to high risk 2,200 700 900 3,800
Total 9,700 3,100 3,800 16,600
Source: TCR (TBR ref: W1/S8)
We estimate that over the period 2016–2022 direct economic output from firms in B1a premises in RBKC of more than £563 million per year, and a further indirect and induced output of more than £524 million per year from firms in other types of premises or in other locations, is at risk.
Table 31: Overall impact on GVA, 2016–2022
Risk Category Direct GVA per year Indirect GVA per year Induced GVA per year Total GVA per year
High risk £445,968,000 £151,824,000 £251,472,000 £849,264,000
Medium to high risk £117,260,000 £48,880,000 £71,840,000 £237,980,000
Total £563,228,000 £200,704,000 £323,312,000 £1,087,244,000
Source: TCR (TBR ref: W1/S7)
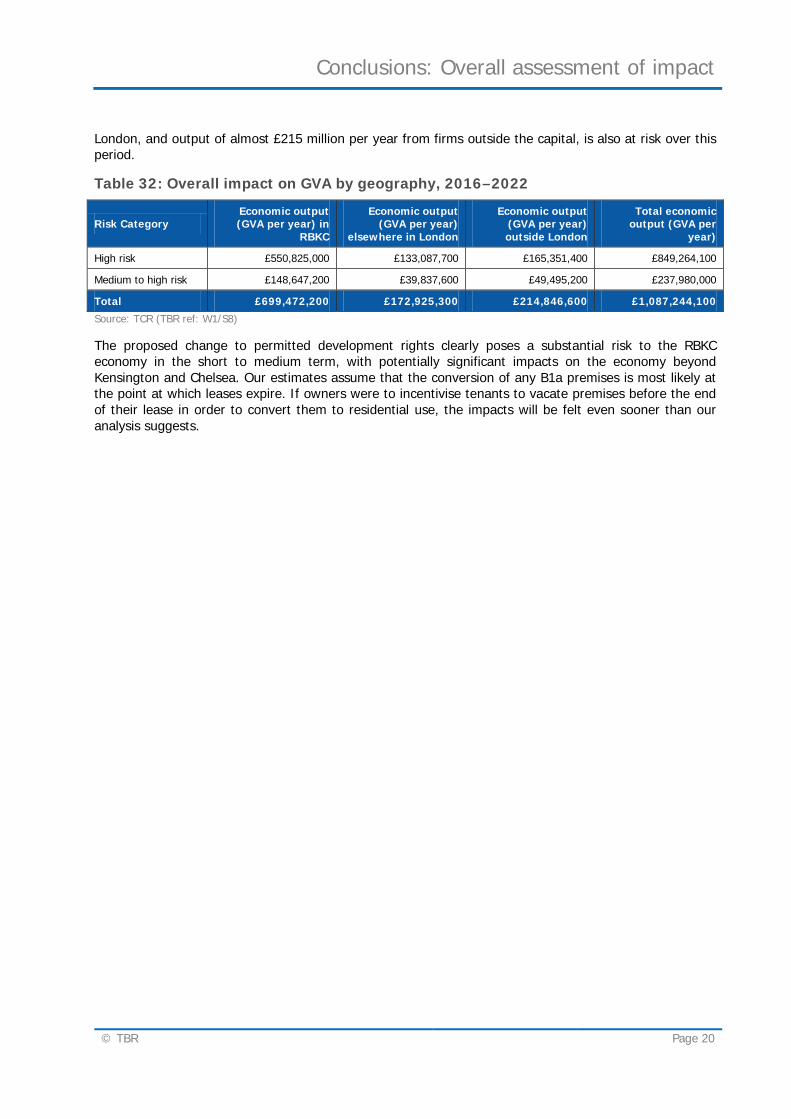
We estimate that economic output of almost £700 million per year from firms located in RBKC is at risk over the period 2016–2022. Output of over £170 million per year from firms located elsewhere in
Conclusions: Overall assessment of impact
© TBR Page 20
London, and output of almost £215 million per year from firms outside the capital, is also at risk over this period.
Table 32: Overall impact on GVA by geography, 2016–2022
Risk Category Economic output (GVA per year) in
RBKC
Economic output (GVA per year)
elsewhere in London
Economic output (GVA per year) outside London
Total economic output (GVA per
year)
High risk £550,825,000 £133,087,700 £165,351,400 £849,264,100
Medium to high risk £148,647,200 £39,837,600 £49,495,200 £237,980,000
Total £699,472,200 £172,925,300 £214,846,600 £1,087,244,100
Source: TCR (TBR ref: W1/S8)
The proposed change to permitted development rights clearly poses a substantial risk to the RBKC economy in the short to medium term, with potentially significant impacts on the economy beyond Kensington and Chelsea. Our estimates assume that the conversion of any B1a premises is most likely at the point at which leases expire. If owners were to incentivise tenants to vacate premises before the end of their lease in order to convert them to residential use, the impacts will be felt even sooner than our analysis suggests.

Appendix 1: TBR
© TBR Page 21
5. Appendix 1: TBR TBR is an economic development and research consultancy with niche skills in the use of economic data to clarify the dynamics of local, regional and national economies, sectors, clusters and markets. Much of our research has focused on the characteristics and performance of high growth SMEs and the factors which drive their growth, including relevant research for BIS, NESTA and UKTI. We also maintain TCR, the largest longitudinal dataset of UK businesses.
5.1.1 Our data: TCR
Our core data resource, TCR, is one of the most extensive bodies of information on UK enterprise. It contains data on 3.5 million live firms in the UK and their performance histories, meaning it can be used to understand the structure and dynamics of any part of the UK economy – any location (down to street level), and sector (down to specific products and services) and any size (from micro to conglomerate)
We use this unique dataset to add value to our research and analysis. It provides us with access to a high level of detail and focus on hard to reach areas of the economy such as small and micro businesses. It also allows us to identify businesses by their distinct activity, meaning we can create niche sector definitions and segment markets. Hence we work extensively in sectors like the creative and cultural industries and renewable energy, where the traditional tools to map and profile a sector do not work.
For more information on TCR, see http://www.tbr.co.uk/pages/tbr-observatory/tcr-database.php