impact of polymer film thickness and cavity size on...
TRANSCRIPT

SANDIA REPORT
SAND2006-4864 Unlimited Release Printed August, 2006
Impact of Polymer Film Thickness and Cavity Size on Polymer Flow during Embossing: Towards Process Design Rules for Nanoimprint Lithography
H. D. Rowland, W. P. King, A. C. Sun, and P. R. Schunk
Prepared by Sandia National Laboratories Albuquerque, New Mexico 87185 and Livermore, California 94550 Sandia is a multiprogram laboratory operated by Sandia Corporation,
a Lockheed Martin Company, for the United States Department of Energy’s National Nuclear Security Administration under Contract DE-AC04-94AL85000.
Approved for public release; further dissemination unlimited.

2
Issued by Sandia National Laboratories, operated for the United States Department of Energy by Sandia Corporation. NOTICE: This report was prepared as an account of work sponsored by an agency of the United States Government. Neither the United States Government, nor any agency thereof, nor any of their employees, nor any of their contractors, subcontractors, or their employees, make any warranty, express or implied, or assume any legal liability or responsibility for the accuracy, completeness, or usefulness of any information, apparatus, product, or process disclosed, or represent that its use would not infringe privately owned rights. Reference herein to any specific commercial product, process, or service by trade name, trademark, manufacturer, or otherwise, does not necessarily constitute or imply its endorsement, recommendation, or favoring by the United States Government, any agency thereof, or any of their contractors or subcontractors. The views and opinions expressed herein do not necessarily state or reflect those of the United States Government, any agency thereof, or any of their contractors. Printed in the United States of America. This report has been reproduced directly from the best available copy. Available to DOE and DOE contractors from U.S. Department of Energy Office of Scientific and Technical Information P.O. Box 62 Oak Ridge, TN 37831 Telephone: (865) 576-8401 Facsimile: (865) 576-5728 E-Mail: [email protected] Online ordering: http://www.osti.gov/bridge Available to the public from U.S. Department of Commerce National Technical Information Service 5285 Port Royal Rd. Springfield, VA 22161 Telephone: (800) 553-6847 Facsimile: (703) 605-6900 E-Mail: [email protected] Online order: http://www.ntis.gov/help/ordermethods.asp?loc=7-4-0#online

SAND2006-4864
Unlimited Release
Printed August 2006
Impact of Polymer Film Thickness and Cavity Size on Polymer Flow during Embossing: Towards Process Design Rules for Nanoimprint Lithography
Harry D. Rowland1, William P. King
1, Amy C. Sun
2, P. Randy Schunk
2
1Woodruff School of Mechanical Engineering
Georgia Institute of Technology
Atlanta, GA 30329-0405
2Dept. 1514, Multiphase Transport Processes
Sandia National Laboratories
P.O. Box 5800
Albuquerque, New Mexico 87185-0836
Abstract
This paper presents continuum simulations of polymer flow during nanoimprint
lithography (NIL). The simulations capture the underlying physics of polymer
flow from the nanometer to millimeter length scale and examine geometry and
thermophysical process quantities affecting cavity filling. Variations in
embossing tool geometry and polymer film thickness during viscous flow
distinguish different flow driving mechanisms. Three parameters can predict
polymer deformation mode: cavity width to polymer thickness ratio, polymer
supply ratio, and Capillary number. The ratio of cavity width to initial polymer
film thickness determines vertically or laterally dominant deformation. The ratio
of indenter width to residual film thickness measures polymer supply beneath the
indenter which determines Stokes or squeeze flow. The local geometry ratios can
predict a fill time based on laminar flow between plates, Stokes flow, or squeeze
flow. Characteristic NIL capillary number based on geometry-dependent fill time
distinguishes between capillary or viscous driven flows. The three parameters
predict filling modes observed in published studies of NIL deformation over
nanometer to millimeter length scales. The work seeks to establish process design
rules for NIL and to provide tools for the rational design of NIL master templates,
resist polymers, and process parameters.

4
Acknowledgments The authors would like to thank Allen Roach for his help in developing meshed
geometries and Tom Baer for his help in applying isolated boundary conditions.

5
Contents
1. Executive Summary ......................................................................................11
2. Introduction ....................................................................................................12
3. Simulation Overview ......................................................................................15
4. Results...........................................................................................................19
4.1. Polymer Deformation Modes...................................................................19
4.2. Cavity Filling Times .................................................................................23
5. Discussion .....................................................................................................26
6. Conclusion .....................................................................................................33
7. References.....................................................................................................34

6
Figures
Figure 1. Nanoimprint lithography polymer deformation modes, exhibiting either single or dual peak deformation. .......................................................................12
Figure 2. Nanoimprint lithography cavity and deforming polymer, showing simulation boundary conditions, geometry variables, and polymer peak deformation location measurement. ..................................................................16
Figure 3. Deformation profiles for (a) increasing cavity width holding indenter width and film thickness constant and (b) decreasing film thickness holding cavity geometry constant. (c) Impact of resist film thickness on cavity filling. The location of the deforming polymer peak location is always a distance from the cavity vertical sidewall approximately equal to the polymer thickness. ............ 20
Figure 4. Effect of shear-thinning on deformation. Decreasing shear-thinning exponent from 1 (Newtonian) to 0.15 (highly shear-thinning) reduces the polymer viscosity near the vertical cavity wall, moving the polymer peak closer to the indenter sidewall and decreasing the time to fill. .............................................. 21
Figure 5. Comparison of geometric configuration for given cavity diameter or width. Confined geometry of cylindrical slot delays the transition from single to double peak for increased cavity diameter. Cylindrical slot also requires longest time to fill. ......................................................................................................... 22
Figure 6. Impact of cavity size and cavity height to film thickness ratio on cavity filling. Increasing cavity height to film thickness ratio increases time to fill. For both single and dual peak deformation, increasing the indenter width or decreasing cavity size increases time to fill. Time to fill levels off at decreasing dimensionless cavity size as deformation transitions to single peak and begins to decrease for single peak flow. As cavity size continues to decrease, time to fill eventually increases dramatically as evenly distributed pressure forces polymer to travel thru confined slot. …. .......................................................................... 24
Figure 7. Impact of polymer availability on filling time. (a) Small cavity sizes require longest time to begin filling. (b) When the indenter width becomes greater than the residual film thickness, squeeze flow between the indenter and substrate causes time to completely fill to dramatically increase. (c) Deformation profile showing the increasing time between fill onset and full filling. ............... 25
Figure 8. Mean shear rate or deviatoric stress profile. Single peak flow pushes non-shearing fluid plug vertically in a single polymer peak. Dual peak flow results

7
from shear near the indenter sidewall with non-shearing fluid plug in cavity center. As flow transitions from shear dominant to squeeze dominant, a plug develops underneath the indenter as well as in the cavity center. ................... 27
Figure 9. NIL polymer deformation regime maps for NIL capillary number CaNIL, directional flow ratio W/hi, and polymer supply ratio S/hr. All of the NIL flows reported in the reference of Table 1 are located on the maps, and fall into the polymer flow regime predicted by the theory of the present paper. The dotted square indicates the simulation space of this work. (a) Directional flow ratio and polymer availability determine characteristic velocity governing polymer deformation. (b) The effect of cavity geometry and polymer film thickness on polymer deformation. CaNIL governs viscous vs. capillary flow, and W/hi governs single vs. dual peak polymer deformation. ....................................................... 31

8
Tables
Table 1. Comparisons of millimeter, micrometer, and nanometer scale imprinting. All studies are for negligible Reynolds number flows (Re < 10-14). Using a characteristic velocity derived from viscous flow theory, all different flow regimes reported may be characterized by capillary number and geometry ratios. The NIL capillary number is independent of viscosity. ………………………….. 30

9
Nomenclature
NIL nanoimprint lithography
Tg glass transition temperature
nm nanometer
µm micrometer
mm millimeter
°C degrees Celsius
Xo characteristic length, tool width
Po characteristic pressure, applied load
To characteristic time
Uo characteristic speed
η polymer viscosity
v* material dimensionless velocity
vm* mesh dimensionless velocity
Г* dimensionless fluid stress tensor
Re Reynolds number
ρ density
n̂ normal vector
Ca Capillary number
H* dimensionless curvature
Prep* dimensionless repulsive force
d* dimensionless distance of the polymer boundary normal to the solid indenter
σ surface tension
Гs* dimensionless elastic stress tensor
P* dimensionless body force of the embossing load
µ Lame mu coefficient
λ Lame lambda coefficient
E* dimensionless small deformation strain tensor
e* dimensionless small deformation volume strain
ηinf infinite shear limit of polymer viscosity
ηo zero shear limit of polymer viscosity
ω polymer time constant
γ& second invariant of shear rate tensor
n shear thinning exponent
a dimensionless parameter describing transition between low-rate and power-law
t fill time
tr ramp time
S indenter width
W cavity half width
hi initial polymer film thickness
hc cavity height
th half the time to onset of filling
to time to onset of filling
tf time when polymer has covered half master cavity floor

10
hr residual film thickness
∆P pressure difference across the fluid interface
R1, R2 principal radii of curvature

11
1. Executive Summary
Nanoimprint lithography (NIL) is a high resolution, high-throughput, economical
alternative to standard silicon based fabrication technologies. For NIL to become a
viable manufacturing technology, a deep understanding of local polymer flow within
simple geometries is required for rational process and master tool design.
This report presents continuum simulations of polymer flow during NIL, investigating the
effects of imprint cavity geometry, polymer film thickness and properties, and process
parameters. The simulations capture the underlying physics of polymer flow from the
nanometer to millimeter length scale and examine geometry and thermophysical process
quantities affecting cavity filling. Simulations investigate embossing of single rectilinear
cavities of viscous dominant flows with no elastic stress relaxation, i.e. Reynolds number
<< 1, Deborah number << 1, and Capillary number >> 1. A uniform pressure applied to
the silicon cavity presses the indenter into the viscous polymer film. No-slip conditions
prescribed at the polymer-indenter and polymer-substrate interface model the contact
while a capillary surface with surface tension captures the physics of the free polymer
surface. Independent variation of imprint pressure, polymer viscosity, polymer film
thickness, indenter width, and cavity width and height allows examination of parameters
influencing local cavity filling time and polymer deformation mode.
Variations in embossing tool geometry during viscous flow distinguish different flow
driving mechanisms. Three parameters predict polymer deformation mode: cavity
geometry and polymer thickness ratio, polymer availability, and Capillary number. The
ratio of cavity width to initial polymer film thickness defines the directional flow ratio,
predicting the importance of deviatoric stress in determining single or dual peak
deformation. Single peak flow is governed by the time required for the polymer to enter
the cavity, while dual peak flow is governed by the time required for the indenter to
penetrate the polymer. The ratio of indenter width to residual film thickness defines the
polymer supply ratio, predicting the influence of squeeze flow and relative filling times
independent of material rheological properties. Characteristic NIL Capillary number
based on Stokes, squeeze, or single peak pipe flow fill time distinguishes between
capillary or viscous driven flows, predicting flow driving mechanism to separate
necessary process design from external embossing setup and internal material physics.
The three parameters predict filling modes observed in published studies of NIL
deformation over nanometer to millimeter length scales. The work seeks to establish
process design rules for NIL and to provide tools for the rational design of NIL master
templates, resist polymers, and process parameters.

12
2. Introduction
In nanoimprint lithography (NIL), a nanofabricated master tool having three-dimensional
topography embosses a thermoplastic substrate, forming a negative relief of the master in
the substrate. NIL offers scalable manufacture of nanoelectronics and
nanoelectromechanical systems (NEMS) with resolution better than 10 nm [1] over areas
greater than 1000 cm2 [2]. Recent studies have improved NIL resolution below 5 nm [3]
and to the molecular scale [4]. A deep understanding of polymer flow during NIL is
critical for rational design of embossing tools and processes. This paper investigates
viscous polymer flow during NIL for a wide range of master tool geometry and
establishes a framework for NIL process design based on geometric ratios, polymer
thickness, and Capillary number.
Several groups have investigated polymer flow during imprint lithography with different
embossing geometries and length scales, resulting in several competing
phenomenological models of polymer flow [5-11]. Experiments and simulations
conducted from the millimeter to nanometer scale resulted in markedly different polymer
deformation modes although length scale has not been the apparent cause of
differentiation. Figure 1, showing single and dual peak viscous flow, illustrates two
polymer deformation modes reported in NIL. Differences in deformation mode and
replication fidelity have been attributed to a variety of factors, notably shear and
extensional stretching, viscous flow and localized stress, residual stress release, shear-
thinning and buckling, and surface tension.
Figure 1. Nanoimprint lithography polymer deformation modes, exhibiting either single or dual peak deformation.
Single Peak
Dual Peak
Embossing Tool
Polymer Film
Cavity
Polymer Film
Embossing Tool
Cavity

13
Studies of embossing on the millimeter to micrometer scale have consistently cited the
impact of shear deformation on replication while also noting other case-specific effects.
Simulations and experiments at the millimeter scale [5] used a cavity of height 800 µm,
width 3.5 mm, and spacing 3 mm to emboss a viscous PMMA film of thickness 1200 µm
at 40 °C above its glass transition temperature (Tg). This system resulted in polymer flow
with shear deformation at the mold surface and extensional stretching at the cavity center.
Experiments at the micrometer scale [6] studied microembossing with indenter width 2
µm, cavity height 4 µm, and cavity widths 30 µm, 50 µm, and 100 µm and 15 – 20 µm
thick PMMA films over a temperature range from Tg - 10 °C to Tg + 20 °C. A region of
localized high strain occurred near the cavity sidewall, resulting in a deforming polymer
peak that spread laterally and vertically to fill the cavity. The microembossing conditions
resulted in viscous flow, localized stress, and shear-thinning phenomena dominant over
surface tension effects. Indentation experiments at the micrometer to nanometer scale [7]
pressed cylindrical micrometer sized cavities of height 2 µm and diameter 10 µm into
glassy polymer films of thickness 450 nm and 1.7 µm. In the 450 nm film, the sharp
cavity entrance produced extensive shear resulting in dual polymer peak filling.
Indentation into the thicker films resulted in dual peak deformation for high loads and
single peak deformation for low loads. Residual stress release on demolding influenced
final replicated feature size, a phenomenon also noted in [12].
A few NIL studies investigated polymer deformation for film thicknesses and cavity
heights in the 100 – 300 nm range. A large area flow experiment [8] studied cavity
filling of 200 nm thick PMMA films embossed at Tg + 100 °C by cavities of width 20
µm, height 175 nm, and spacing 40 µm. The resulting deformation was a flat dual peak
profile with vertical sidewalls and a central buckled region, attributed to effects from
squeeze flow and shear-thinning at the indenter edge and compressive stresses in the
interior of the cavity. This experimental work was followed by finite element simulations
of a Newtonian fluid with surface tension [9]. These simulations showed the buckling
region was the result of capillary forces acting over the large cavity width, where the
polymer preferentially wetted the master surface. When surface tension effects were
removed from the simulations, smooth single or dual peaks were observed dependent on
cavity width, as observed in viscous flow experiments [6]. Other simulations and
experiments [10, 11] investigated purely nanometer scale geometries and film
thicknesses. Elastic solid simulations modeled the polymer with the nonlinear stress-
strain behavior of a Moony-Rivlin material. The studies showed both single and dual
peak flow confined near the master sidewall as described above [6, 7], and noted the
effect of film thickness to retard deformation. The authors concluded that polymer in
NIL shows rubber-like elastic dynamics above Tg with volume compression under high
loads in thick polymer films, suggesting that the elastic component of polymers plays a
large role in deformation even at temperatures well above Tg.
Simulations and experiments investigating embossing and imprint lithography from the
millimeter to nanometer scale have yielded the common features of single or dual peak
deformation that depends on a thermophysical property or process quantity. Each of the
above-referenced studies offers a different phenomenological explanation of the observed
14
behavior and there is little agreement about the relative importance of nonlinear
elasticity, residual stress, linear and nonlinear viscous flow, compressive stresses, and
capillary forces. There is a need for detailed and systematic study of geometric and
material constraints over the length scales of interest. The lack of a comprehensive
understanding of polymer flow in the 10 nm – 100 µm range limits NIL process design to
ad-hoc or recipe-based approaches.
This paper presents simulations of liquid polymer deformation and filling modes during
NIL under viscous-dominant conditions. Independent variation of imprint pressure,
polymer viscosity, polymer film thickness, indenter width, and cavity width and height
allows examination of parameters influencing cavity filling time and polymer
deformation mode. A simple model of laminar flow between plates, Stokes flow, and
squeeze flow characterizes the polymer filling time. The simulation regime is completely
non-dimensionalized and the results are easily extrapolated for comparison to
experiments investigating polymer flow in the 10 nm – 5 mm range. The simulation
results predict behavior seen during all previously published NIL deformation studies.
We suggest that three characteristic parameters, specifically, geometry ratios, polymer
availability, and Capillary number, could form the nucleus of NIL process design rules.
15
3. Simulation Overview
Prior simulations of NIL have treated the polymer as either a viscous Newtonian fluid [9]
or nonlinear elastic solid material [10, 11]. Solid mechanics simulations with a Moony-
Rivlin constitutive model [10, 11] used the commercially-available MARC program,
based on the finite element method and rectangular plane strain elements, to model the
polymer as a rubber elastic above Tg. Fluid mechanics simulations [9] used the
commercial computational fluid dynamics code CFD-ACE, based on the finite volume
method, to simulate NIL on an Eulerian grid using the volume of fluid method (VOF) to
track the deforming polymer interface. VOF methods have also been used to model
micro injection molding [13, 14], but the methods sacrifice boundary shape accuracy for
a faster speed of solution [15]. The free boundary or moving boundary simulations
presented in this paper are ideally suited for GOMA [16], a Galerkin finite element
program specialized for analysis of manufacturing flows having one or more transport
fields such as those that exist in two-phase flows or for the freely-moving polymer
surface of NIL.
GOMA allows the liquid polymer and the solid indenter to be treated in an arbitrary
Langrangian/Eulerian (ALE) reference frame, thereby separating the polymer and solid
motion from the mesh motion thus allowing for large free boundary deformations [15,
17]. All surfaces move as part of a fully-implicit, fully-coupled algorithm [15] that links
the mesh motion to the material motion through surface kinematic conditions. A
Newton-based solution algorithm enables the mesh motion and the rest of the problem
physics to be solved simultaneously. For the simulations presented here, an implicit
Backward-Euler time integration is used with a classical Gaussian elimination LU
decomposition method. The maximum dimensionless time step size is 0.01 with a
residual less than 10-7 at each time step. The mesh uses 9-node isoparametric
quadrilaterals with smaller elements near the indenter-polymer interface and larger
elements at the cavity center for accurate and swift solution convergence.
Figure 2 shows the finite element model with prescribed boundary conditions. The
model assumes the embossing geometry is adequately vented or under vacuum
conditions. To improve computation time and convergence, the problem is non-
dimensionalized by choosing a characteristic length Xo equivalent to the tool width,
pressure Po equivalent to the applied load, time To equivalent to the ratio of polymer
viscosity η to applied load, and speed Uo equivalent to the ratio of characteristic length to
characteristic time. The characteristic time is chosen to match the timescale of
microembossing experiments previously reported [6] and the characteristic speed is
chosen to balance the viscous and pressure forces for computational ease. The scaled
conservation equation for mass is
0** =⋅∇ v , (1)
and the scaled liquid momentum conservation equation is

16
******
*
*
)( Γ⋅∇=
∇⋅−+
∂
∂vvv
t
vRe m , (2)
where Re is the Reynolds number based on polymer zero shear viscosity, v* and vm
* are
the material and mesh dimensionless velocity, respectively, and Г* is the dimensionless
fluid stress tensor. The dimensionless Reynolds number is ρUoXo/η, where ρ is the
density.
Figure 2. Nanoimprint lithography cavity and deforming polymer, showing simulation boundary conditions, geometry variables, and polymer peak
deformation location measurement.
The boundary condition on the free surface of the liquid is modeled by a force balance of
the fluid traction with capillary forces:
4*
*
4
*** 112
1
d
P
XUnH
Can
rep
o
s
o
+∇+=⋅ ση
Γ , (3)
where n is the normal vector, Ca is the Capillary number, H* is the dimensionless
curvature, Prep* is an arbitrary dimensionless repulsive force, and d
* is the dimensionless
distance of the polymer boundary normal to the solid indenter. The Capillary number
Ca=ηUo/σ is a ratio of viscous forces to surface tension forces, where σ is the surface
tension. Equation 3 represents a force balance at the polymer-air interface that balances
the surface tension force due to curvature of the surface, the gradient of surface tension
along the surface, the normal stress from the fluid and the contact force due to the
proximity of the solid surface. The contact force Prep* is not significant physically and is
arbitrarily chosen to ensure no liquid penetration of the solid surface. The repulsive term
is applied to the liquid surface normal to the contact plane, allowing the liquid to slip
along the solid surface without penetrating the solid. The ALE framework allows the
capillary boundary condition to define the material shape of the free surface and a
Peak Distance
from Sidewall
Cavity Width (2W)
Indenter Width (S)
Tool Width
Cavity Height
(hc)
Capillary Surface with
Surface Tension
Uniform Pressure
Solid-Fluid
Stress Balance
No Slip No Fluid
Penetration
Repulsive
Planes

17
kinematic mass balance condition ensures that the mesh location conforms to the material
location at the boundary:
0)( ** =−⋅ mvvn . (4)
The body of the liquid can still be represented by an immaterial mesh that does not
introduce artificial sress or deformation while the capillary surface can determine the
motion of the moving boundary. A no-slip condition is applied to the fluid at the initial
fluid-solid interface with the indenter and substrate.
While the stress and strain in the solid master is important for NIL process design, the
fluid deformation is of primary interest here so the simulations use a single solid cavity of
small mass. Conservation of momentum transfers load from the solid to the fluid.
Assuming elastic forces are much larger than inertial forces, solid momentum
conservation is
01 *** =+⋅∇ PP
Xos
o
Γ , (5)
where Гs* is the dimensionless elastic stress tensor and P
* is the dimensionless body force
of the embossing load. The elastic stress tensor is
IeEs
**2 λµΓ += , (6)
where µ and λ are the Lame elastic coefficients, E* is the dimensionless small
deformation strain tensor, and e* is the dimensionless small deformation volume strain.
At the fluid-solid indenter interface, a stress balance is prescribed where the stresses in
the fluid directly replace the stresses in the solid material residual equation at the
interface. The balance in equation form is
**
so nn
PΓΓ
µ⋅=⋅ . (7)
GOMA is capable of modeling a variety of liquid constitutive equations. Both Newtonian
fluid models and non-Newtonian Carreau-Yasuda models are used, where the Carreau-
Yasuda model is given in unscaled form by
a
n
a
o
)1(
inf )(1)(inf
−
−
++=
•
γωηηηη , (8)
where ηinf and ηo are the infinite shear limit and zero shear limit viscosity, respectively, ω
is the polymer time constant, •
γ is the second invariant of the shear rate tensor, n is the
shear thinning exponent, and a is a dimensionless parameter describing the transition
between the low-rate and power-law region. With proper constants, the model fits well

18
the material properties described by Fuchs et al [18]. A Newtonian viscosity model
better matches the time scale of microembossing experiments near Tg [6], hence a
Newtonian material model is used for the majority of simulations.
To address the largest possible solution space, nondimensionalization reduces the number
of simulation variables. Applied pressure Po, polymer viscosity η, and initial film
thickness hi are chosen as the dimensional parameters, reducing the number of
independent dimensionless variables to a dimensionless time to fill tPo/η, ramp time
trPo/η, density ρPohi2/η
2, indenter width or cavity spacing S/hi, tool width (2S+2W)/hi, and
cavity height hc/hi. The fill time is t, the ramp time is tr, the indenter width is S, the
cavity half width is W, and the cavity height is hc. Under viscous-dominant conditions,
variations in density do not significantly influence the simulations. Ramp time is not
thoroughly investigated for effects on shear rate. For a given applied pressure and
polymer viscosity, the ratios of indenter width to film thickness, tool width to film
thickness, and cavity height to film thickness are systematically varied to determine their
effects on polymer deformation mode and time to fill. The dimensionless ramp time is
constant for all cases.

19
4. Results
Simulations investigated polymer deformation during cavity filling for viscous-dominant
conditions, i.e. Re << 1 and Ca >> 1, where the time scale of relaxation is less than the
time scale of flow. Figure 2 shows a representative rectangular cavity having indenter
width S, cavity height hc, and cavity half width W. Of particular interest is the location
and size of the polymer peak(s), and the time required to fill the cavity. Simulations
modulated cavity geometry, polymer film thickness, and process conditions and
examined their effect on polymer deformation mode. Most simulations modeled the
polymer as a Newtonian fluid, but a few modeled the polymer as shear-thinning.
Cylindrical cavities were briefly investigated as well.
4.1. Polymer Deformation Mode
Figure 3 shows the effect of rectangular cavity width and film thickness on polymer
deformation, where dimensionless cavity size is the ratio of cavity width to tool width
W/(S+W) and dimensionless cavity height is the ratio of cavity height to film thickness
hc/hi. The indenter width is constant and only the cavity width or polymer film thickness
changes. For each configuration, deformation profiles are shown for four times: the start
of imprinting ti, half the time to onset of filling th, onset of filling to, and the time when
polymer has covered half of the master cavity floor tf. Onset of filling occurs when the
polymer peak first touches the master cavity floor. As cavity width increases, the
deformation mode changes from single peak to dual peak deformation. The polymer
deformation also transitions from single to dual peak as the initial polymer film thickness
decreases, as shown in Fig. 3b. For the largest cavity widths and thinnest polymer layers,
the two peaks are highly localized near the vertical cavity walls and do not interact.
For all of the simulations of this paper, the polymer deformation occurs near the indenter
sidewall. Figure 3c shows the transition from single to dual peak flow based on cavity
half width W and initial film thickness hi. The single to dual peak transition is clearly
observed at W/hi near 1.2. The polymer peak remains located roughly hi from the
indenter sidewall regardless of any other parameter. Small variations in peak location for
a given value of W/hi are due to polymer shear limits or complete cavity filling. The
polymer peak will spread laterally but not indefinitely as the lateral motion of the peak is
driven by shear near the indenter sidewall.
The degree of fluid shear-thinning behavior influences peak location, shown in Fig. 4.
Deformation profiles are shown at a dimensionless time of 1.0 for a Newtonian fluid and
shear-thinning fluids of varying degree, where ηinf and ηo differ by four orders of
magnitude. A shear-thinning fluid of power law exponent 0.15 moves the polymer peak
10% closer to the sidewall than a Newtonian fluid and decreases the required time to fill
by nearly 50% compared to the Newtonian fluid for this cavity. In general, a shear-
dependent fluid will affect polymer flow where shear is greatest, which occurs for small
indenter widths, large cavity widths, and small film thickness. The decrease in polymer
shear modulus above Tg also promotes increased influence of shear-thinning parameters.

20
Figure 3. Deformation profiles for (a) increasing cavity width holding indenter width and film thickness constant and (b) decreasing film
thickness holding cavity geometry constant. (c) Impact of resist film thickness on cavity filling. The location of the deforming polymer peak
location is always a distance from the cavity vertical sidewall approximately equal to the polymer thickness.
0 1 2 3 4 5 6 7 8 90.0
0.2
0.4
0.6
0.8
1.0
Norm
alized Peak Distance from Sidewall
Ratio of Cavity Half Width to Film Thickness W/hi
Single Peak
Deformation
Dual Peak
Deformation
(a)
(b)
ti
Size = 0.76
(c)
th
to
tf
Size = 0.20 Size = 0.40 Size = 0.66
ti
th
to
tf
hc/hi = 0.67
Dimensionless Cavity Size W/(S+W)
Dimensionless Time
Dimensionless
Time
Dimensionless Cavity Height hc/hi
hc/hi = 0.44 hc/hi = 0.27

21
n = 1.00
Dimensionless
Time = 1.0
n = 0.70
n = 0.50
n = 0.30
n = 0.15
0.0 0.2 0.4 0.6 0.8 1.0
1.0
1.1
1.2
1.3
1.4
1.5
1.6
1.7
1.8
1.9
Shear-Thinning Exponent
Onset Fill Tim
e
0.50
0.52
0.54
0.56
0.58
0.60
Norm
aliz
ed Peak Distance fro
m Sidewall
Shear-thinning
Exponent
Figure 4. Effect of shear-thinning on deformation. Decreasing shear-thinning exponent from 1 (Newtonian) to 0.15 (highly shear-thinning) reduces the polymer viscosity near the vertical cavity wall, moving the
polymer peak closer to the indenter sidewall and decreasing the time to fill.
22
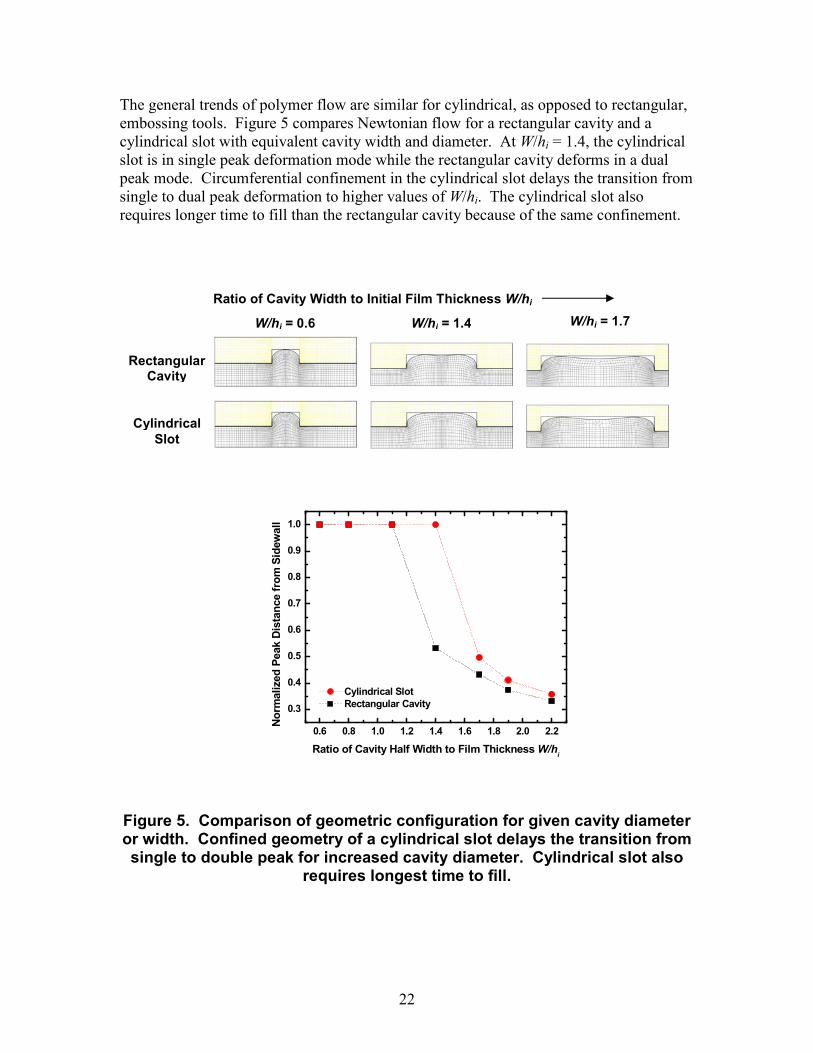
The general trends of polymer flow are similar for cylindrical, as opposed to rectangular,
embossing tools. Figure 5 compares Newtonian flow for a rectangular cavity and a
cylindrical slot with equivalent cavity width and diameter. At W/hi = 1.4, the cylindrical
slot is in single peak deformation mode while the rectangular cavity deforms in a dual
peak mode. Circumferential confinement in the cylindrical slot delays the transition from
single to dual peak deformation to higher values of W/hi. The cylindrical slot also
requires longer time to fill than the rectangular cavity because of the same confinement.
Figure 5. Comparison of geometric configuration for given cavity diameter or width. Confined geometry of a cylindrical slot delays the transition from single to double peak for increased cavity diameter. Cylindrical slot also
requires longest time to fill.
W/hi = 1.7
Rectangular Cavity
Cylindrical
Slot
W/hi = 0.6 W/hi = 1.4
Ratio of Cavity Width to Initial Film Thickness W/hi
0.6 0.8 1.0 1.2 1.4 1.6 1.8 2.0 2.2
0.3
0.4
0.5
0.6
0.7
0.8
0.9
1.0
Norm
alized Peak Distance from Sidewall
Ratio of Cavity Half Width to Film Thickness W/hi
Cylindrical Slot
Rectangular Cavity

23
4.2. Cavity Filling Times
Figure 6 shows the impact of rectangular cavity geometry and film thickness on fill times
for a viscous Newtonian fluid, for several values of W/(S+W) and constant S+W. In
general, wider cavities fill faster than narrower cavities, and taller cavities on thin
polymer films fill slower than shorter cavities on thick polymer films. In all cases, single
vs. dual peak deformation mode affects cavity filling time, as the degree of shear in the
polymer drives the filling. In both single and dual peak flow, it is possible to increase
cavity width and/or decrease indenter width to promote shear. Figure 7 shows the effect
of dimensionless cavity height on fill time. In general, taller cavities fill slower than
shorter cavities. The wider cavities reach filling onset more rapidly than the narrower
cavities but the overall filling time is not necessarily governed by cavity width. As Fig. 7
shows, once filling begins, the main restriction to polymer flow is not inside the cavity
but between the indenter and the hard substrate, resulting in a squeeze flow. Figure 7b
shows that squeeze flow in the polymer film becomes important as the indenter width S
becomes greater than the residual film thickness hr, i.e. when S/hr > 1.

24
Figure 6. Impact of cavity size and cavity height to film thicknes ratio on cavity filling. Increasing cavity height to film thickness ratio increases time to fill. For both single and dual peak deformation, increasing the indenter width or decreasing the cavity size increases time to fill. Time to fill levels off at decreasing dimensionless cavity size as deformation transitions to single peak and begins to decrease for single peak flow. As cavity size continues to decrease, time to fill eventually increases dramatically as evenly distributed pressure forces polymer to travel thru confined slot.
ti
Size = 0.75
th
to
tf
Size = 0.25 Size = 0.40 Size = 0.50 Size = 0.90
Dimensionless Cavity Size W/(S+W)
Dimensionless Time
0.1 0.2 0.3 0.4 0.5 0.6 0.7 0.8 0.90
2
4
6
8
10
12
14
16
18
20
Constant Tool Width
(S+W)
Onset Fill Tim
e
Dimensionless Cavity Size W/(S+W)
Single
Peak
Dual
Peak
0.80
0.67
0.50
0.33 0.20
hc/hi

25
Figure 7. Impact of polymer availability on filling time. (a) Small cavity sizes require longest time to begin filling. (b) When the indenter width becomes greater than the residual film thickness, squeeze flow between
the indenter and the substrate causes time to completely fill to dramatically increase. (c) Deformation profile showing the increasing time between fill
onset and full filling.
(a)
(c)
ti = 0
th = 6.02
to = 12.52
tf = 23.50
S/hr > 1
0.2 0.3 0.4 0.5 0.6 0.7 0.80
2
4
6
8
10
12
14
16
Dimensionless
Cavity Size W/(S+W)
Constant Indenter Width S
Onset Fill Tim
e
Cavity Height to Film Thickness Ratio hc/h
i
0.400
0.657
0.760
0.2 0.3 0.4 0.5 0.6 0.7 0.80
2
4
6
8
10
12
14
16
18
20
22
24
26
Dimensionless
Cavity Size W/(S+W)
Constant Indenter Width S
Full Fill Tim
e
Cavity Height to Film Thickness Ratio hc/h
i
0.400
0.657
0.760
(b)

26
5. Discussion
The polymer deformation predicted here agrees well with a number of articles that
measure and model polymer deformation from the 10 nm to 1 mm scale. Nearly every
report observed deforming polymer peaks located ~hi from the master sidewall [5-7, 9-
11, 19], with single peak deformation when the cavity half width was less than polymer
film thickness, W < hi, and dual peak deformation for cavity half width greater than
polymer film thickness, W > hi. The value W/hi defined dual vs. single peak polymer
deformation for measurements on films of thickness 1.2 mm [5], 500 µm [19], and 20 µm
[6]. Experiments in 1.7 µm films [7] found single peak deformation at W/hi > 2 while the
present simulations predict dual peak deformation at W/hi > 1.2, however the discrepancy
can be attributed to stress relaxation following elastic rather than viscous deformation.
Simulations that excluded surface tension examined embossing of 200 nm thick polymer
films and produced single peak deformation for W/hi < 1 and dual peak deformation for
W/hi > 1 [9]. The Newtonian liquid deformations presented here agree with nonlinear
solid elastic deformations [10, 11] that also noted cavity geometry and initial film
thickness modulate deformation mode.
The effects of film thickness and cavity geometry on filling time also agree well with
reported values over a significant breadth of length scales. All of the referenced studies
state that decreasing hi or increasing hc/hi increases either the filling time [7, 8, 20] or the
filling pressure [10, 11]. For the present viscous liquid simulations, time and pressure are
linearly related in the non-dimensionalization. In solid mechanics simulations [11], both
low and high aspect ratio structures required higher pressures to fill the cavity than
intermediate aspect ratios. The present simulations agree with this previous finding and
explain the phenomena by linking filling time to deformation mode, as shown in Figs. 6
and 7.
The ratio W/hi accurately predicts single vs. dual peak deformation, indicating whether
the polymer flow is mostly vertical or mostly lateral. As such W/hi can be thought of as
the directional flow ratio. Figure 8 shows contours of the mean shear rate (deviatoric
shear stress) for three cavity widths on the same polymer film, for which there is single
and dual peak deformation and free shear flow between the indenter and substrate, and
also for dual peak flow and squeeze flow between the indenter and substrate. For the
cases that there is no squeeze flow between the indenter and the substrate, there is a plug
of non-deforming polymer in the cavity center. This plug is pushed upward in single-
peak flow, but does not move in the case of dual peak flow, as it is too far from the
indenter sidewall to be affected by the induced shear. When the polymer film between
the indenter and substrate becomes thin, squeeze flow dominates the polymer filling, with
consequences for filling time as well as deformation mode as illustrated in Fig. 7.

27
Figure 8. Mean shear rate or deviatoric stress profile. Single peak flow pushes non-shearing fluid plug vertically in a single polymer peak. Dual peak flow results from shear near the indenter sidewall with non-shearing fluid plug in cavity center. As flow transitions from shear dominant to
squeeze dominant, a plug develops underneath the indenter as well as in the cavity center.
The three different characteristic flow profiles in Fig. 8 suggest cavity geometry governs
filling behavior. Simple viscous flow theory, based on mold geometry ratios, can
estimate a characteristic NIL filling time, tNIL, for the filling of each geometry. The case
of single peak flow, occuring when W/hi < 1 regardless the value of S/hr, resembles the
classic fluid mechanics problem of steady laminar flow between infinite plates or within
a pipe. Assuming fully developed flow and no slip conditions at the boundaries, a
characteristic single peak pipe flow fill time can be defined as
2
2
12
(2 ) ( )
η=
+c
NIL
h St
P W S W (9)
and a characteristic velocity, VNIL, may be found by dividing the distance the polymer
must travel, i.e. the cavity height, by tNIL:
2(2 ) ( )
12η
+=NIL
c
P W S WV
h S. (10)
Fill times estimated by Eq. 9 correlate well with single peak fill times simulated here
when W/hi < 0.5. However, when W/hi > 0.5, Eq. 9 underestimates simulated fill times
by a factor of ~ 3 - 5. For these cases, simulated fill times seem to resemble flow through
an abrupt expansion from a flow channel of hi to hi + hc, resulting in roughly 60 - 80%
head loss for the geometries simulated here [21]. Modifying Eq. 9 accounting for the
expansion loss coefficient provides a better estimate for fill time when 0.5 < W/hi < 1.
For the case of dual peak squeeze flow, when W/hi > 1 and S/hr > 1, the cavity filling time
can be estimated by applying the lubrication approximation when assuming a fluid is
squeezed out between infinite plates of width twice the indenter width moving at constant

28
velocity due to an applied load. The situation of cavity filling in NIL cannot be
accurately defined so simply since the polymer is expelled into a finite pressure field due
to confinement and because the effective pressure decreases as more polymer comes into
contact with the cavity surface, thus slowing the imprint. A reasonable characteristic
squeeze flow filling time can be estimated as the time required to squeeze a fluid from the
initial film thickness to the residual film thickness by infinite plates of width twice the
tool width weighted by the ratio of indenter width to tool width:
2
2 2
( ) 1 1
2NIL
r i
S W St
P h h S W
+ = −
+
η. (11)
This time is similar to the fill time defined by [8] but different by choice of plate width
and weighting. Ignoring elastic effects, the residual film thickness hr, or mold flash, is
defined in terms of the master tool dimensions and initial polymer thickness
WS
Whhh c
ir+
−= . (12)
A characteristic squeeze flow velocity can be found by dividing the difference in initial
film thickness and residual film thickness by tNIL: VNIL=(hi-hr)/tNIL. VNIL is therefore
2 2
2
( )
i rNIL
i r
h hPV
S S W h hη=
+ +. (13)
This velocity is close to the imprint velocity defined by [9] but again different by choice
of plate width and weighting. The squeeze flow characteristic fill time best approximates
simulated fill times at large W/hi when the polymer squeezed from beneath the indenter
meets low pressure resistance in the cavity center. For dual peak shear free flow when
W/hi > 1 and S/hr < 1, a different characteristic fill time may be defined based on Stokes
flow [22]. Like squeeze flow filling, shear flow filling will be slowed as more polymer
contacts the cavity surface. Hence a practical estimate for a characteristic Stokes fill time
can be defined using the tool width, rather than the indenter width, as the indenting
surface, giving
6( )
( )NIL i rt h h
P S W
η= −
+, (14)
and a corresponding characteristic Stokes velocity of
( )
6NIL
P S WV
η
+= . (15)
Regardless of length scale, directional flow ratio W/hi and polymer supply ratio S/hr can
determine appropriate VNIL, which in turn can define a Capillary number characteristic of

29
the imprint process, CaNIL=ηVNIL/σ. From Eqs. 10, 13, and 15, the viscosity dependence
of VNIL eliminates the viscosity dependence of CaNIL.
Three parameters, CaNIL, W/hi, and S/hr, can predict all of the previously reported
polymer deformation modes during NIL. CaNIL determines viscous vs. capillary driven
flow, the directional flow ratio W/hi predicts single or dual peak flow, and the polymer
supply ratio S/hr determines shear-dominant Stoke’s flow vs. squeeze flow. Table 1 lists
imprint parameters from a number of articles that examined polymer flow during
embossing and also lists CaNIL, W/hi, and S/hr. Figure 9 shows two regime maps of
polymer filling modes and plots the simulations and experiments listed in Table 1.
Figure 9a shows the determination of VNIL from W/hi and S/hr and Fig. 9b shows flow
driving mechanism defined by W/hi and CaNIL. When located on the regime maps of Fig.
9, all of the experiments and simulations of Table 1 fall within their region of reported
flow behavior. For the present simulations and the viscous deformation measurements of
cited references [5-7, 19], the single vs. dual peak deformation is independent of capillary
number and is determined by geometry only. A cylindrical slot can shift the transition
from single to dual peak deformation to a higher value of W/hi than occurs in rectilinear
cavities.

30
Table 1. Comparisons of millimeter, micrometer, and nanometer scale imprinting. All studies are for negligible Reynolds number flows
(Re < 10-14). Using a characteristic velocity derived from viscous flow theory, all different flow regimes reported may be characterized by capillary number and geometry ratios. The NIL capillary number is independent of
viscosity.
Experiment hr (nm) hr /hi W/hi S/hr VNIL
(nm/sec) CaNIL Flow Profile
Rowland [6] 5.67 x 10³
63.0% 1.11 0.35 6.00 x 101 2.02 x 10
3
Single Peak Viscous
Rowland [6] 5.30 x 10³ 58.8% 2.78 0.38 1.35 x 10
2 4.55 x 10
3
Dual Peak Viscous
Rowland [24] 2.67 x 10³ 44.4% 4.17 1.88 1.18 x 10
1 3.98 x 10
2
Dual Peak Viscous Squeeze
Heyderman [8] 1.56 x 10² 78.1% 50.0 192 5.48 x 10
0 5.54 x 10
-4
Dual Peak Capillary Squeeze
Jeong [9] 1.94 x 10² 97.2% 2.50 77.2 3.96 x 10
1 3.99 x 10
-3
Dual Peak Capillary Squeeze
Jeong [9] 1.99 x 10² 99.7% 0.25 75.2 5.73 x 10
3 5.79 x 10
-1
Dual Peak Capillary-Viscous Squeeze or
Confined Single Peak
(Wet-dependent)
Cross [7] 1.29 x 10³ 75.7% 2.94 4.66 9.83 x 10
-1 3.31 x 10
1
Dual Peak Viscous
Cross [7] 1.29 x 10³ 75.7% 2.94 4.66 7.45 x 10
0 2.51 x 10
2
Dual Peak Viscous
Cross [7] 3.68 x 101 8.2% 11.1 163 1.74 x 10
-4 5.85 x 10
-3
Dual Peak Capillary Squeeze
Hirai [10] -1.5 x 101 -12.5% 4.17 -33.3 3.70 x 10
-4 1.25 x 10
-1
Dual Peak Capillary-Viscous
Squeeze
Hirai [10] 1.15 x 10² 46.0% 2.00 4.35 2.72 x 10
-2 9.15 x 10
0
Dual Peak Viscous-Capillary
Squeeze
Hirai [10] 2.25 x 10² 62.5% 1.39 2.22 1.35 x 10
-1 4.53 x 10
1
Dual Peak Viscous
Juang [5] 6.40 x 10⁵ 53.3% 2.92 2.34 5.98 x 10
3 2.01 x 10
4
Dual Peak Viscous
Shen [19] 4.50 x 10⁵ 90.0% 0.20 0.22 1.20 x 10
2 4.04 x 10
3 Confined Single Peak Viscous
Austin [3] 9.50 x 101 95.0% 0.07 0.07 3.43 x 10
-1 1.15 x 10
-2 Confined Single Peak Capillary (Non-wetting)
Yu [25] 4.64 x 101 22.1% 1.07 7.01 2.11 x 10
0 7.10 x 10
-2
Single Peak Capillary
(Non-wetting)

31
Figure 9. NIL polymer deformation regime maps for NIL capillary number CaNIL, directional flow ratio W/hi, and polymer supply ratio S/hr. All of the NIL flows reported in the reference of Table 1 are located on the maps, and fall into the polymer flow regime predicted by the theory of the present
paper. The dotted square indicates the simulation space of this work. (a) Directional flow ratio and polymer availability determine characteristic
velocity governing polymer deformation. (b) The effect of cavity geometry and polymer film thickness on polymer deformation. CaNIL governs viscous
vs. capillary flow, and W/hi governs single vs. dual peak polymer deformation.
10-2
10-1
100
101
102
0.1
1
10
W / h
i
S/hr
Single Peak
Pipe Flow
Dual Peak
Stokes Flow
Single Peak
Pipe Entrance Flow
Dual Peak
Squeeze Flow
[6]
[6]
[24]
[8]
[9]
[9]
[7]
[7]
[10]
[10] [10]
[5]
[19]
[3]
[25]
Squeeze Flow Stokes Flow
10-6
10-5
10-4
10-3
10-2
10-1
100
101
102
103
104
105
106
0.1
1
10
W / h
i
CaNIL
[6]
[6] [24]
[8]
[9]
[9]
[7] [7]
[7]
[10]
[10] [10]
[5]
Rectilinear Single-
Dual Peak Transition
Dependent on Surface
Properties
[19]
[3]
[25]
Capillary Capillary-
Viscous Viscous
Dual Peak (Wetting) or Single Peak (Non-wetting)
Single Peak Developed Pipe
Flow Transition
Dual Peak
Dual Peak (Wetting) or Single Peak (Non-wetting)
Dual Peak
Single Peak
Single Peak
(a)
(b)

32
Surface tension can influence the single to dual peak transition in capillary flows. As
capillary forces become significant relative to viscous forces, the transition from single to
dual peak deformation can occur at higher values of W/hi than in purely viscous flow as
the surface forces act to minimize the polymer surface area. The region where viscous
forces are comparable to capillary forces is shaded in Figure 9. Competing viscous and
capillary forces can explain the flat deformation profile resulting from a wetting fluid
filling a thin cavity observed by [9]. In the strictly capillary region, transition from single
to dual peak deformation depends strongly on surface chemistry. For a wetting fluid
having a small contact angle with the master sidewall, the fluid will wet the master
surface and climb the indenter sidewalls in a dual peak mode, independent of W/hi. This
wetting behavior has been observed by [8, 9, 20]. The deformation behavior for a non-
wetting fluid is more complex than for a wetting fluid, and can depend on surface
tension, contact angle, viscosity, pressure, film thickness, and cavity spacing. For a non-
wetting fluid with large contact angle, polymer flow will be governed by the ratio of
pressure and surface tension. The classical form of the Young-Laplace equation relates
the radius of curvature of a fluid surface with the surface tension:
+=∆
21
11
RRP σ , (13)
where ∆P is the pressure difference across the fluid interface and R1 and R2 are the
principal radii of curvature. For a surface confined in only one direction, R1 is finite
while R2 is infinite. The range of surface tension values for common engineering
materials spans only 1-2 orders of magnitude [21] and thus for a given cavity, changes in
embossing pressure will affect the curvature of the deforming polymer. While in the
viscous regime, W/hi alone modulates single to dual peak transition, for a non-wetting
fluid in capillary flow, the single to dual peak transition also depends on surface tension
and contact angle, and in general occurs at larger W/hi. Furthermore, for a non-wetting
fluid capillary flow, the impact of cavity curvature is more important than for rectangular
cavities, and thus single to dual peak transition in a cylindrical cavity is shifted to higher
W/hi than for a rectilinear cavity.
The three parameters W/hi, S/hr, and CaNIL, can guide NIL process design. The
directional flow ratio W/hi distinguishes between vertical and lateral mold filling, which
is important for replicating smooth surfaces of unfilled cavities as in the NIL manufacture
of optics components. The polymer supply ratio S/hr gauges the tradeoff between relative
filling time and residual film thickness. The residual film thickness is critical for
nanoelectronics fabrication where the mold flash must be removed before further
processing. High values of the polymer supply ratio may also be unattainable in glassy or
glass-like polymer systems [7, 23]. CaNIL determines the dominant flow driving
mechanism in NIL and defines the imprint regimes where surface chemistry must be
considered. In the viscous regime, modulating polymer viscosity through pressure or
temperature can improve replication time.

33
6. Conclusions
This paper performs simulations of viscous polymer flow during nanoimprint
lithography, investigating the effects of imprint cavity geometry, polymer film thickness
and properties, and process parameters. Polymer deformation and fill time is governed
by location and rate of polymer shear during imprinting, exhibiting deformation
predominantly close to the vertical indenter sidewall that can result in single peak or dual
peak deformation modes. The continuum simulations capture the NIL physics observed
by numerous published articles from the 10 nm to 1 mm scale.
Three parameters, W/hi, S/hr, and CaNIL, accurately predict polymer deformation and
filling mode. The directional flow ratio W/hi predicts importance of deviatoric stress
determining single or dual peak deformation and hence vertical or lateral flow. The
polymer supply ratio S/hr predicts the influence of squeeze flow and relative filling times
independent of material rheological properties. The NIL Capillary number, CaNIL,
predicts flow driving mechanism to distinguish necessary process design from external
embossing setup and internal material physics. The three parameters W/hi, S/hr, and
CaNIL combine to allow rational and predictive NIL process design and provide a step
towards establishing design rules for NIL. Rather than rely on improvised trial and error,
it is possible to use these tools to appropriately tailor tool geometry, process conditions,
and polymer rheology and surface chemistry for optimal NIL.

34
7. References
1. Chou, S. and P. Krauss, Imprint lithography with sub-10 nm feature size and high
throughput. Microelectronic Engineering, 1997. 35: p. 237-240.
2. Khang, D. and H. Lee, Wafer-scale sub-micron lithography. Applied Physics
Letters, 1999. 75: p. 2599-2601.
3. Austin, M.D., et al., Fabrication of 5 nm linewidth and 14 nm pitch features by
nanoimprint lithography. Applied Physics Letters, 2004. 84(26): p. 5299-5301.
4. Hua, G., et al., Polymer Imprint Lithography with Molecular-Scale Resolution.
Nano Letters, 2004. 4(12): p. 2467-2471.
5. Juang, Y.-J., L.J. Lee, and K.W. Koelling, Hot Embossing in Microfabrication.
Part II: Rheological Characterization and Process Analysis. Polymer
Engineering and Science, 2002. 42(3): p. 551-566.
6. Rowland, H.D. and W.P. King, Polymer deformation and filling modes during
microembossing. Journal of Micromechanics and Microengineering, 2004. 14: p.
1625-1632.
7. Cross, G.L.W., et al., The Mechanics of Nanoimprint Forming. Materials
Research Society Symposium Proceedings, 2004. 841.
8. Heyderman, L.J., et al., Flow behaviour of thin polymer films used for hot
embossing lithography. Microelectronic Engineering, 2000. 54: p. 229-245.
9. Jeong, J.-H., et al., Flow Behavior at the Embossing Stage of Nanoimprint
Lithography. Fibers and Polymers, 2002. 3(3): p. 113-119.
10. Hirai, Y., et al., Study of the resist deformation in nanoimprint lithography.
Journal of Vacuum Science and Technology B, 2001. 19(6): p. 2811-2815.
11. Hirai, Y., et al., Simulation and experimental study of polymer deformation in
nanoimprint lithography. Journal of Vacuum Science and Technology B, 2004.
22(6): p. 3288-3293.
12. Martin, C., L. Ressier, and J.P. Peyrade, Study of PMMA recoveries on
micrometric patterns replication by nano-imprint lithography. Physica E, 2003.
17: p. 523-525.
13. Haagh, G.A.A.V. and F.N. Van De Vosse, Simulation of Three-Dimensional
Polymer Mould Filling Processes using a Pseudo-Concentration Method.
International Journal for Numerical Methods in Fluids, 1998. 28: p. 1355-1369.
14. Pitchumani, R., et al. Analysis of a Process Replication of Electroforming Molds
with Integral Microscreens. in Micromachining and Microfabrication Process
Technology IX. 2004. San Jose, CA: Proceedings of SPIE.
15. Sackinger, P.A., P.R. Schunk, and R.R. Rao, A Newton-Raphson Pseudo-Solid
Domain Mapping Technique for Free and Moving Boundary Problems: A Finite
Element Implementation. Journal of Computational Physics, 1996. 125: p. 83-103.
16. Schunk, P.R., et al., Goma 4.0- A Full-Newton Finite Element Program for Free
and Moving Boundary Problems with Coupled Fluid/Solid Momentum, Energy,
Mass, and Chemical Species Transport: User's Guide. 2002, Sandia National
Laboratories.

35
17. Schunk, P.R., TALE: An Arbitrary Lagrangian-Eulerain Approach to Fluid-
Structure Interaction Problems, in Sandia Technical Report. 1999 (unpublished),
Sandia National Laboratories.
18. Fuchs, K., C. Friedrich, and J. Weese, Viscoelastic Properties of Narrow-
Distribution Poly(methyl methacrylates). Macromolecules, 1996. 29: p. 5893-
5901.
19. Shen, X.J., L.-W. Pan, and L. Lin, Microplastic embossing process: experimental
and theoretical characterizations. Sensors and Actuators A, 2002. 97-98: p. 428-
433.
20. Scheer, H.C. and H. Schulz, A contribution to the flow behaviour of thin polymer
films during hot embossing lithography. Microelectronic Engineering, 2001. 56:
p. 311-332.
21. Fox, R.W. and A.T. McDonald, Introduction to Fluid Mechanics. 5th ed. 1998,
New York: John Wiley & Sons, Inc. 762.
22. Deen, W.M., Analysis of Transport Phenomena. Topics in Chemical Engineering,
ed. K.T. Gubbins. 1998, New York: Oxford University Press. 597.
23. Cross, G.L.W., B.S. O'Connell, and J.B. Pethica, Influence of Elastic Strains on
the Mask Ratio in Glassy Polymer Nanoimprint. Applied Physics Letters, 2004
(submitted).
24. Rowland, H.D., et al., This paper.
25. Yu, Z., H. Gao, and S.Y. Chou, In situ real time process characterization in
nanoimprint lithography using time-resolved diffractive scatterometry. Applied
Physics Letters, 2004. 85(18): p. 4166-4168.

36
Distribution:
1 MS9004 Jill Ruby 08100
1 MS0824 Wahid Hermina 01510
1 MS0836 Pat Notz 01514
1 MS0836 Rekha Rao 01514
1 MS9161 Bob Nilson 08764
1 MS0834 Anne Grillet 01512
1 MS0834 Carlton Brooks 01512
1 MS0834 Chris Bourdon 01512
1 MS1245 John Emerson 02453
2 MS9018 Central Technical Files 8945-1
2 MS0899 Technical Library 9616
1 MS0188 D. Chavez, LDRD Office 1030
1 MS0115 CRADA Administration 1323
1 MS0161 Patent and Licensing Office 11500
89444536
MS0123 1011