impact of ph.d. training: a comprehensive analysis based
TRANSCRIPT
Impact of Ph.D. training: a comprehensive analysis basedon a Japanese national doctoral survey
Sotaro Shibayama1,2,3 • Yoshie Kobayashi2
Received: 25 April 2017 / Published online: 11 August 2017� The Author(s) 2017. This article is an open access publication
Abstract Ph.D. training in academic labs offers the foundation for the production of
knowledge workers, indispensable for the modern knowledge-based society. Nonetheless,
our understanding on Ph.D. training has been insufficient due to limited access to the inside
of academic labs. Furthermore, early careers of Ph.D. graduates are often difficult to
follow, which makes the evaluation of training effects challenging. To address these
limitations, this study aims to illustrate the settings of Ph.D. training in academic labs and
examine their impact on several training outcomes, drawing on a national survey of a
cohort of 5000 Ph.D. graduates from Japanese universities. The result suggests that a
supervising team structure as well as the frequency of supervision, contingent to a few
contextual factors, determine the Ph.D. graduates’ career decisions, performance, and
degrees of satisfaction with the training programs.
Keywords Ph.D. training � Academic training � Higher education � Postgraduateeducation � Academic career
Introduction
The modern society is increasingly becoming knowledge-driven and major challenges our
society faces today require solutions with scientific expertise, and thus, the development of
human capital at the knowledge frontier is crucial for the sustainability of our society
(Bozeman et al. 2001). The development of knowledge workers typically takes the form of
& Sotaro [email protected]
1 Sten K. Johnson Centre for Entrepreneurship, School of Economics and Management, LundUniversity, P. O. Box 7080, 220 07 Lund, Sweden
2 National Institute of Science and Technology Policy, Ministry of Education, Culture, Sports,Science and Technology, Tokyo, Japan
3 The Graduate School of Pharmaceutical Sciences, University of Tokyo, Tokyo, Japan
123
Scientometrics (2017) 113:387–415DOI 10.1007/s11192-017-2479-7

postgraduate education, in which research training (academic training, hereafter) plays an
essential role. Academic training is a significant investment that costs students several
years or possibly longer and supervisor’s considerable time and efforts (Stephan 2012).
Nevertheless, the contemporary academic training practices have been criticized, for
example, for failing to meet changing societal needs and for producing excessive Ph.D.s
(National Research Council 1998; Cyranoski et al. 2011).
These problems in academic training are partly attributable to a gap between (mass)
education policies and science policies. Further, recent policies have stressed account-
ability that is often translated into short-term and merit-based evaluation, and a relatively
long-term payoff from academic training tends to be overlooked (Hackett 1990). A similar
gap exists in literature between studies on higher education and those on knowledge
production. Though academic career design has been a popular subject (e.g., Allison and
Long 1990; Geuna 2015; Stephan 2012), early careers are relatively understudied. Among
others, empirical difficulty in accessing two types of data has been compromising our
understanding on academic training. First, prior studies had poor access to the inside of
academic labs where training takes place. Ethnographies in sociology of science have
illustrated the details of lab operation (Campbell 2003; Delamont and Atkinson 2001;
Delamont et al. 1997; Salonius 2007), but their implications are restricted to certain lab
contexts. Second, tracing early careers of academics is often challenging. A few countries
have implemented surveys to follow the careers of Ph.D. graduates; such as Science and
Engineers Statistical Data System (SESTAT) in the USA and Destinations of Leavers from
Higher Education (DLHE) in the UK. These systematic efforts have contributed to our
understanding on early careers of academics (Agarwal and Ohyama 2012; Roach and
Sauermann 2010). Nonetheless, career data and training data have rarely been integrated,
and thus, we still have insufficient understanding on how academic lab training leads to the
development of S&T human capital.
The objective of this study is to address these gaps with the national survey of Japanese
Ph.D. graduates, which inquired into both Ph.D. training settings and traced their careers.
The population of the survey is a cohort of Ph.D. students who graduated from Japanese
universities in 2012, and 5052 responses were collected in 2014. The result finds that
supervisory settings—a supervising team and frequency of supervision—influence the
Ph.D.s’ career decisions, scientific and economic performance, and their level of satis-
faction on the Ph.D. program.
The remainder of this article is organized as follows. ‘‘Literature review’’ section
reviews previous literature. ‘‘Context of academic training in Japan’’ section overviews the
Japanese postgraduate education system. ‘‘Data and methods’’ section explains our data.
‘‘Results’’ section presents the results. ‘‘Discussions’’ section discusses the results and
implications.
Literature review
Linking lab training and training outcome
Postgraduate education programs employ various education approaches, usually involving
(1) a general component that provides students with knowledge commonly needed across
the discipline, often through mass teaching, and (2) a specific component that aims to
develop knowledge and skills concerning a certain area of expertise specific to the lab
388 Scientometrics (2017) 113:387–415
123

through a research project, or academic training. Prior literature on higher education has
paid relatively limited attention to the latter compared to the former. This is partly because
of empirical difficulty in observing the inside of labs, where academic training occurs. A
lab consists of a team of scientists including a supervising professor and junior members
including students (Delamont and Atkinson 2001; Latour and Woolgar 1979; Owen-Smith
2001). The core part of academic training employs the apprenticeship model, where stu-
dents are tasked to solve research questions as a member of a research project under the
supervision of professors (National Research Council 1998). Some anthropological studies
did investigate the inside of academic labs in depth, illustrating how academic science
operates in specific labs in a great detail (Delamont and Atkinson 2001; Delamont et al.
1997; Knorr-Cetina 1999; Latour and Woolgar 1979; Salonius 2007), but academic
training was not necessarily of their primary interest and a general picture is lacking
(Shibayama et al. 2015). Scientometric techniques have been developed to identity student-
supervisor relationships (Lariviere 2012; Morichika and Shibayama 2016), but they cannot
reveal the details of the interpersonal relationships.
Tracing postgraduate careers of students presents another challenge. While identifying
established academics is fairly feasible thanks to increasingly available career data of
academics (Gaughan and Bozeman 2002), early careers are still difficult to identify
because academic jobs in early stages tend to change frequently and be made insufficiently
public. Moreover, if graduates are employed outside academia, their career information is
usually kept private, and even if it is publicly available, linking it with education record
poses another challenge. Addressing these difficulties require systematic and perhaps
authoritative efforts for data collection. Indeed, a few national surveys have been imple-
mented, such as SESTAT in the USA and DLHE in the UK, and contributed to our
understanding on higher education systems. For example, Agarwal and Ohyama (2012)
used SESTAT to investigate the link between scientists’ ability, preferences, and their
career development. Roach and Sauermann (2010), drawing on Survey of Doctorate
Recipients (SDR) in the USA, predicted the innovative performance of Ph.D. graduates
based on their motives. Nevertheless, the focus of these surveys is to follow postgraduate
careers rather than to understand pre-graduate conditions. To link the two elements,
therefore, scholars have needed to rely either on additional data sources or on their original
surveys in smaller scales.
Training outcomes
The current study aims to address these issues by investigating the impact of academic
training on three aspects of training outcome: Ph.D. students’ (1) performance, (2) career
choice, and (3) subjective evaluation on training programs. In what follows, we discuss the
rationale of these outcome aspects in connection with previous literature.
First, students’ subjective evaluation is of practical use for the evaluation of Ph.D.
programs, since it is relatively easy to measure without following students’ postgraduate
careers. Previous literature is rather developed in this area. The higher education literature
evaluated Ph.D. programs from the perspective of students in various dimensions (e.g.,
Hockey 1996; Kam 1997; Marsh et al. 2002). For example, Morrison et al. (2011), drawing
on a survey of Ph.D. graduates in Social Sciences in the USA, found that the quality of
advice from dissertation supervisors is associated with students’ evaluation on the excel-
lence of Ph.D. programs. Similarly, Mainhard et al. (2009) suggested that the availability
of Ph.D. supervisors is a key determinant of the perceived quality of Ph.D. supervision.
These studies have confirmed that lab settings and the interpersonal relationship between
Scientometrics (2017) 113:387–415 389
123

students and supervisors play a critical role in academic training. Nonetheless, they have
had limited link with more objective evaluation such as performance or with longer-term
outcome such as career development. This is why we incorporate two other outcome
aspects.
Second, students’ career choice is also of practical interest as Ph.D. graduates are taking
increasingly diverse types of jobs. As above mentioned, however, a theoretical link
between higher education and later career development has been insufficient. The aca-
demic career is a traditional and increasingly popular research subject (e.g., Agarwal and
Ohyama 2012; Geuna 2015; Long et al. 1979). For example, many studies found that the
prestige of degree-awarding departments determines the destination of academic careers
(e.g., Baldi 1995; Crane 1965; Debackere and Rappa 1995). Long et al. (1979) analyzed
postgraduate careers of biochemical Ph.D.s in the US and found that the prestige of the first
academic jobs is significantly influenced by the performance of Ph.D. supervisors in
addition to the prestige of the degree-awarding departments. Nonetheless, the literature has
rarely examined the detail of supervisory settings, relying on easily observable factors.
Thus, this study aims to contribute to the literature by investigating the detailed operation
of academic training.
Third, students’ performance is of obvious relevance, on which the effectiveness of
academic training should be evaluated. As such, performance itself has been widely
studied, and in particular, the link between higher education and performance outcome has
been studied to some extent. For example, the literature in sociology and in science
policies has found the organizational prestige and supervisors’ performance to be strong
predictors of students’ postgraduate performance (Allison and Long 1990; Geuna 2015;
Long and McGinnis 1985). A line of literature on the organizational design of labs, either
in industry or in academia, has also been investigating various organizational factors such
as prestige, age, and size as determinants of performance (e.g., Heinze et al. 2009; Pelz and
Andrews 1966). Again, however, the literature lacks for depth in the operation of training
with few exceptions (Shibayama et al. 2015).
Supervisory settings
As to the operation of academic training, practices inside labs have been studied in the
higher education and education psychology literature. Since academic training is a highly
personal process and shaped by the interaction between individual supervisors and students
(Brown and Atkins 1988; Hockey 1991), the literature scrutinizes variations in training
styles and motives among individual supervisors. For example, Hockey (1996) identified
sets of motives behind academic training, such as the need for students’ labor and moral
obligation for education. Murphy et al. (2007) also found ‘‘controlling’’ and ‘‘guiding’’
beliefs as supervisors’ distinctive roles in academic training.
Ethnographies in sociology of science have detailed the daily operation of lab research
(Delamont and Atkinson 2001; Delamont et al. 1997; Knorr-Cetina 1999; Latour and
Woolgar 1979; Salonius 2007). In particular, they illustrated the allocation of research-
related tasks between students and supervisors. A stylized view is that supervisors are
responsible for upstream tasks such as problem identification and coordination while
students engage in downstream tasks such as experiments (Laudel 2001; Traweek 1988).
For example, Delamont et al. (1997), using a sample of British universities, found that
supervisors are responsible for identifying research projects and assigning them to students,
while students typically consider their lab experience as an opportunity to acquire technical
skills.
390 Scientometrics (2017) 113:387–415
123

This study also investigates the details of supervisory settings, particularly, in terms of
the intensity of supervision and team structure. The intensity, or the frequency, of
supervision has been relatively well studied (Hockey 1991). For example, Wright and
Lodwick (1989) suggested that frequent supervision increases the likelihood of successful
degree attainment. The intensity of supervision is of practical relevance, since the current
higher education policies tend to give more emphasis to research than to education
(Cyranoski et al. 2011; Gould 2015), where training efforts could be replaced by research
efforts. Recent policies in many countries also tend to produce an increasing number of
postgraduate degrees (Cyranoski et al. 2011), which can reduce training effort for each
student (Salonius 2007) and lower the quality of training outcome (Shibayama and Baba
2015).
To investigate these issues in depth, the current study also incorporates the structure of
supervising teams. As the complexity of science has been increasing, research projects
need more interdisciplinary collaboration (Wuchty et al. 2007). This applies to academic
training (Spelt et al. 2009), where teams of student supervision and evaluation tend to
include multiple members with various backgrounds. Nonetheless, this aspect has been
understudied possibly due to the assumption that students have a single supervisor in the
traditional apprenticeship model. The structure of a supervising team is interrelated with
the intensity of supervision, because efforts for training is shared among multiple
instructors in a team. For example, as later described in this study, a busy professor can
delegate his training role to postdocs in the same lab. Even if their supervision is frequent,
the training effect should be questionable given their limited experience.
Context of academic training in Japan
In Japan, approximately 700 universities offer 4-year undergraduate programs, among
which approximately 400 universities offer Ph.D. programs. They are grouped into three
types based on governing bodies: national, regional (of prefectures or cities), and private.
Among the three, national universities are the main player of scientific research and
academic training while most private universities focus on undergraduate education. For
example, national universities accounted for 75% of 12,000 Ph.D. degrees while private
universities accounted for 77% of 564,000 bachelor degrees awarded in 2014.1
Most postgraduate education programs in Japan consist of a 2-year master program and
a 3-year Ph.D. program.2 A majority of graduate students decide whether to proceed to a
Ph.D. program during a master program (Kato et al. 2012). Once students are admitted to
Ph.D. programs, drop out is rare, and students graduate with limited delay. For example,
50% of the students who enrolled in Science and Engineering Ph.D. programs in 2008
graduated in 3 years, 79% within 4 years (plus 1 year), and 91% within 6 years (plus
3 years). Graduation in the Japanese Ph.D. system does not necessarily mean that students
have successfully earned degrees. Students can choose to graduate Ph.D. programs as long
as they meet certain credit conditions, and after graduation they can apply for degrees as
soon as completing dissertations.3 In fact, 22% of Ph.D. graduates in our sample graduated
1 Source: School Basic Survey (http://www.mext.go.jp/b_menu/toukei/chousa01/kihon/1267995.htm).2 A few universities offer 5-year integrated Ph.D. programs. Ph.D. programs in some fields take four years,such as in Medicine, Veterinary sciences, and Pharmacy.3 Students can stay in a Ph.D. program up to a certain number of years (typically double the standardnumber of years). Apart from this rule, most Ph.D. programs do not have a mechanism to force out students.
Scientometrics (2017) 113:387–415 391
123

without a degree. This is more common in Humanities, Arts, and Social Sciences (HASS)
than in Science, Technology, Engineering, and Mathematics (STEM).
In most Ph.D. programs, each Ph.D. student is officially under the supervision of a
single professor. In practice, however, there is a significant variation in the supervisory
settings. The variation is attributed to a few sources, including the setting of the official
supervisor’s lab and the policies or the environment of the department that offers the Ph.D.
programs. As for the latter, multiple faculty members in the same department usually
participate in the dissertation evaluation committee, and they sometimes play a proactive
role in supporting Ph.D.s from early program stages. As for the former, a lab usually
involves other students and staff, who can also participate in the supervision of students.
Particularly, national universities in STEM fields tend to adopt so-called chair system
modelled on the German system, where a senior professor organizes a lab and supervises
not only students but also junior professors. In this hierarchical structure, the supervision of
students is often in part or whole delegated to junior professors, postdocs, and even senior
students. The chair system sometimes causes organizational barriers between labs,
restricting students’ interaction with researchers in other labs.
Ph.D. programs in Japan used to be mainly meant to train academic researchers, so most
students enrolling in Ph.D. programs pursued academic careers. However, around the
1980s and 1990s, the postgraduate education system was repositioned for the training of
knowledge workers in general to satisfy diversifying societal needs (Ehara and Umakoshi
2004: Ch. 3). A series of system reform increased the admission quota for postgraduate
programs, and many postgraduate programs were newly opened.4 It also allowed candi-
dates who already have jobs to enroll in Ph.D. programs and pursue degrees often in part-
time without quitting the jobs. This so-called ‘‘professional’’ Ph.D. has become common in
applied fields such as Medicine and in Social Sciences. Recent years have also seen an
increasing number of international Ph.D.s. Overall, the number of Ph.D. students was
doubled in 1991–2000. The rapid expansion of the postgraduate system, however, has been
heavily criticized for compromising the quality of Ph.D. training. In addition, employment
conditions for recent Ph.D. graduates are often unstable (Cyranoski et al. 2011).5 Conse-
quently, academic careers have become a less popular option for students, which partially
contributed to a recent decline in Ph.D. enrolment (Morichika and Shibayama 2016).
Data and methods
Survey data
This study draws on a national survey, Japan Doctoral Human Resource Profiling (JD-Pro).
The population of JD-Pro was the entire cohort of 16,445 Ph.D. students who graduated
from Ph.D. programs in Japanese universities in the academic year of 2012. It covered all
Footnote 3 continuedSince students can graduate without earning a degree, drop out, where students leave the program withoutgraduation, is rather rare. Graduation without a degree allows students to save tuition fees compared tostaying in the program for a long period. It is possible to earn a degree many years after graduation.4 Until a reform in 2005, the government controlled the admission quota of postgraduate courses.5 In STEM fields, a Ph.D. degree is almost a requirement for professional academic careers currently. Ph.D.graduates typically experience several years of a postdoc period before earning junior faculty positions. Forexample, 44% of Science Ph.D. graduates in 2002–2006 became postdocs while only 6.2% obtained facultypositions immediately after graduation (Misu et al. 2010).
392 Scientometrics (2017) 113:387–415
123

disciplines and all Japanese universities that offer Ph.D. programs. The survey was carried
out in 2014, 1.5 years after their graduation. JD-Pro included several sets of questions
concerning Ph.D. training programs, employment after graduation, research activities, and
so forth. This study particularly draws on the questions about supervisory settings for Ph.D.
training and several outcome measures. The survey was conducted both on a web-based
system and by mail and collected 5052 effective responses (response rate = 38.1%).
Kobayashi (2015) reports the detail of the survey. The sample consists of international
Ph.D.s (15%), professional Ph.D.s (34%), and regular Ph.D.s (52%) in the fields of Science
(17%), Engineering (24%), Agriculture (7%), Health (29%), Humanities (8%), Social
sciences (9%), and others (6%). The mean age is 38, and 28% are female.
Measures
Supervisory setting
The survey had a section of questions regarding supervisory settings. In particular, it asked
about two main researchers who most frequently gave instructions in research projects,
among the official supervisor, internal faculty members (i.e., in the same university) other
than the official supervisor, external faculty members (i.e., in different universities), and
non-faculty researchers (typically, senior students or postdocs in the same lab). It subse-
quently inquired into the frequency of instruction given by the two researchers. Based on
these measurements, we prepared two sets of variables. The first set is the frequency of
instruction given by the four categories of researchers: (1) the official supervisor (Official
supervisor), (2) internal faculty members (Internal faculty), (3) external faculty members
(External faculty), and (4) non-faculty researchers (Non-faculty). Each variable takes a
five-point scale, 0: never, 1: once a half year or less, 2: once a quarter, 3: once or twice a
month, 4: once a week or more. The second set is a single variable, the number of faculty
members (i.e., excluding non-faculty researchers) engaged in Ph.D. instruction once a
month or more frequently (#Faculty). The variable takes a value of 0, 1, or 2.6
Outcome of Ph.D. training
This study draws on three sets of outcome variables. The first set consists of three variables
concerned with Ph.D.s’ postgraduate careers. First, we study the choice between academic
and non-academic careers. The survey inquired into several questions on the employment
conditions of the respondents at the time of the survey.7 We coded a dummy variable 1 if a
respondent had a job in an academic organization (i.e., a university or a public research
organization) and 0 otherwise (e.g., in a private company) (Academic career). Second, we
test whether students obtained a degree in time because degree attainment is likely to
influence their career decisions. We coded a dummy variable 1 if a degree was awarded
within the standard time period and 0 otherwise (Degree in time). Third, we examine the
relationship between the job and the subject of Ph.D. dissertations to evaluate whether the
6 Note that the survey inquired into only the first and the second instructors. For the first set, the surveyignores third and fourth instructors, if any. We assume that their instruction frequency was negligible andcoded the variables 0 if the category was not included in the first and second instructors. The second-setvariable is right-censored. In addition, it overlooks the possibility that a student is supervised by, forexample, two internal faculty members. In this regard, precisely speaking, the variable may be associatedwith the diversity of supervisors rather than their number.7 4.5% of the respondents were not employed.
Scientometrics (2017) 113:387–415 393
123

knowledge learned in Ph.D. programs are used in postgraduate careers. We coded a
dummy variable 1 if a respondent’s job is related to his or her Ph.D. dissertation and 0
otherwise (Related job).
The second set consists of two variables concerned with performance. Because the
majority of Ph.D. graduates are engaged in research jobs, we draw on scientific publication
as a performance measure. For those who had research jobs, we counted scientific articles
they published before the time of the survey (#Pub). While most Ph.D.s who obtained jobs
in academia continued research, only 56% of those at non-academic jobs were engaged in
research. To address this limitation for non-academic workers, we also measured the wage
rate as a proxy of performance (Wage rate).
The final set of outcome variable consists of a single measure based on the subjective
evaluation by the respondents. Namely, we examine Ph.D. students’ satisfaction with the
program in a five-point scale ranging from 1: not satisfied to 5: satisfied (Ph.D.
satisfaction).
Control variables
The regression analyses control for several factors. We include three dummy variables
corresponding to the student types (regular Ph.D., professional Ph.D., and international
Ph.D.) and seven dummy variables for Ph.D. fields (Ph.D.s in Science, Engineering,
Agriculture, Health, Humanity, Social Sci, and Others). As a proxy of the performance of
supervisors, we control for the prestige of degree-awarding universities. For this, we
grouped Japanese universities into four tiers on the basis of publication shares at the
university level and coded the top tier 4 and the bottom tier 1 (Univ tier).8
We also include several control variables for individual attributes. We control for the
age (Age) and gender (Female) of the respondents. To proxy respondents’ performance
prior to Ph.D. training, we include a dummy variable coded 1 if a respondent had a national
Ph.D. fellowship that is awarded on the basis of their performance before the Ph.D. course
(Fellowship).9 We also control for reasons why the respondents decided to pursue Ph.D.
degrees. In particular, we include a dummy variable coded 1 if the motive was ‘‘to become
an academic teacher or researcher’’ (Academic motive) and another dummy variable coded
1 if the motive was ‘‘to delay job hunting’’ (Job motive).
Results
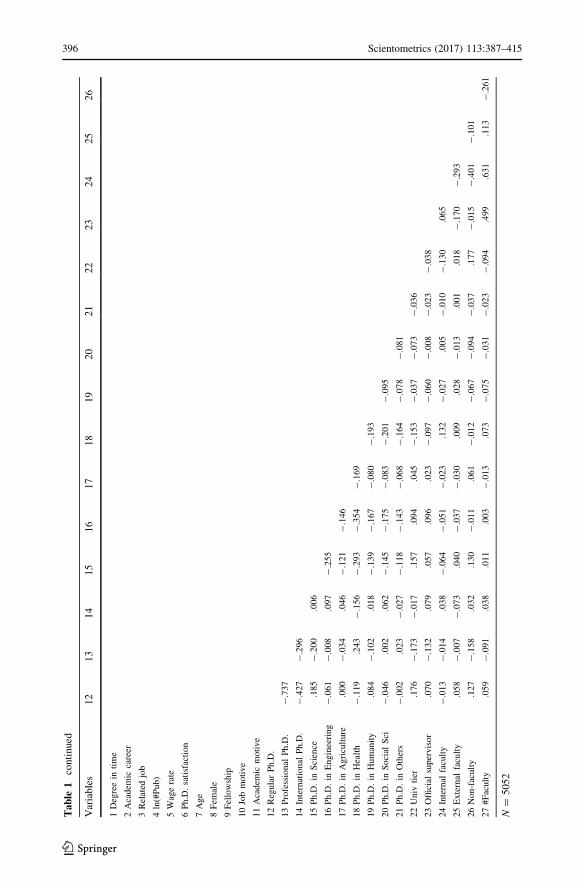
Table 1 presents the descriptive statistics and correlation matrix of the variables. Con-
cerning the career outcomes, 51% of the respondents were awarded Ph.D. degrees in time;
57% chose academic careers; 89% had jobs somewhat related to their Ph.D. dissertations.
The median count of publications is three, and the average wage rate is 2200 JPY per hour.
80% of Ph.D.s were satisfied with the training they received.
8 The publication share of each university among all publications with Japanese addresses:[5% (tier = 4),1–5% (tier = 3), .5–1% (tier = 2), and\.5% (tier = 1).9 The national government offers a fellowship for three years. The selection is based on the applicant’sperformance before Ph.D. (i.e., mostly during the master program).
394 Scientometrics (2017) 113:387–415
123

Tab
le1
Descriptivestatistics
andcorrelationmatrix
Variables
Mean
SD.
Min
Max
12
34
56
78
910
11
1Degreein
time
.510
.500
.000
1.000
2Academ
iccareer
.574
.495
.000
1.000
.002
3Related
job
.894
.308
.000
1.000
.046
.228
4ln(#Pub)
1.334
.654
.000
3.951
.166
.108
.050
5Wagerate
2.214
1.576
.000
17.308
-.034
-.211
-.011
.031
6Ph.D.satisfaction
4.116
1.025
1.000
5.000
.109
.049
.107
.113
.002
7Age
38.338
8.494
27.000
67.000
-.202
-.134
-.030
-.022
.385
.042
8Fem
ale
.276
.447
.000
1.000
-.111
.099
-.019
-.069
-.088
-.014
.064
9Fellowship
.067
.250
.000
1.000
.126
.054
.031
.061
-.100
.014
-.190
-.049
10Jobmotive
.039
.194
.000
1.000
.032
-.043
-.061
-.046
-.077
-.040
-.127
-.031
.016
11Academ
icmotive
.374
.484
.000
1.000
-.019
.277
.056
.083
-.223
.004
-.121
.014
.080
-.031
12RegularPh.D.
.515
.500
.000
1.000
.048
.076
-.006
-.084
-.263
-.099
-.462
-.051
.203
.110
.080
13Professional
Ph.D.
.338
.473
.000
1.000
-.052
-.154
-.017
.044
.479
.024
.552
-.019
-.189
-.130
-.201
14International
Ph.D.
.146
.353
.000
1.000
.001
.098
.032
.060
-.287
.109
-.086
.097
-.034
.018
.156
15Ph.D.in
Science
.175
.380
.000
1.000
.032
.015
-.034
-.030
-.149
-.012
-.213
-.078
.159
.024
.034
16Ph.D.in
Engineering
.235
.424
.000
1.000
.127
-.134
.008
.115
-.024
.085
-.026
-.194
-.010
.065
-.052
17Ph.D.in
Agriculture
.065
.247
.000
1.000
.051
-.008
-.008
.041
-.069
-.006
-.026
-.013
.042
.025
-.014
18Ph.D.in
Health
.289
.454
.000
1.000
.152
.054
.024
-.027
.251
-.074
.061
.081
-.094
-.055
-.119
19Ph.D.in
Humanity
.083
.277
.000
1.000
-.254
.024
-.004
-.036
-.097
-.006
.068
.125
-.032
-.028
.095
20Ph.D.in
Social
Sci
.090
.287
.000
1.000
-.178
.021
-.009
-.084
.009
.021
.123
.022
-.038
-.020
.074
21Ph.D.in
Others
.062
.241
.000
1.000
-.110
.066
.015
-.002
-.031
-.004
.069
.155
-.016
-.018
.079
22Univ
tier
2.267
1.162
1.000
4.000
.084
.035
.033
.054
-.066
-.019
-.194
-.108
.221
.051
.068
23Official
supervisor
3.180
1.135
.000
4.000
.091
.030
.046
.004
-.099
.337
-.128
-.033
.019
.037
.024
24Internal
faculty
1.509
1.591
.000
4.000
.007
.027
.006
-.027
.038
.119
-.014
.007
-.056
.013
-.029
25External
faculty
.342
.951
.000
4.000
.020
.048
-.016
.044
-.031
-.028
-.026
.008
-.004
-.009
.028
26Non-faculty
.704
1.407
.000
4.000
.060
-.011
-.008
-.005
-.082
-.024
-.192
-.045
.133
.056
.012
27#Faculty
1.249
.643
.000
2.000
.087
.045
.019
.003
-.029
.248
-.112
-.025
-.021
.034
-.011
Scientometrics (2017) 113:387–415 395
123
Tab
le1
continued
Variables
12
13
14
15
16
17
18
19
20
21
22
23
24
25
26
1Degreein
time
2Academ
iccareer
3Related
job
4ln(#Pub)
5Wagerate
6Ph.D.satisfaction
7Age
8Fem
ale
9Fellowship
10Jobmotive
11Academ
icmotive
12RegularPh.D.
13Professional
Ph.D.
-.737
14International
Ph.D.
-.427
-.296
15Ph.D.in
Science
.185
-.200
.006
16Ph.D.in
Engineering
-.061
-.008
.097
-.255
17Ph.D.in
Agriculture
.000
-.034
.046
-.121
-.146
18Ph.D.in
Health
-.119
.243
-.156
-.293
-.354
-.169
19Ph.D.in
Humanity
.084
-.102
.018
-.139
-.167
-.080
-.193
20Ph.D.in
Social
Sci
-.046
.002
.062
-.145
-.175
-.083
-.201
-.095
21Ph.D.in
Others
-.002
.023
-.027
-.118
-.143
-.068
-.164
-.078
-.081
22Univ
tier
.176
-.173
-.017
.157
.094
.045
-.153
-.037
-.073
-.036
23Official
supervisor
.070
-.132
.079
.057
.096
.023
-.097
-.060
-.008
-.023
-.038
24Internal
faculty
-.013
-.014
.038
-.064
-.051
-.023
.132
-.027
.005
-.010
-.130
.065
25External
faculty
.058
-.007
-.073
.040
-.037
-.030
.009
.028
-.013
.001
.018
-.170
-.293
26Non-faculty
.127
-.158
.032
.130
-.011
.061
-.012
-.067
-.094
-.037
.177
-.015
-.401
-.101
27#Faculty
.059
-.091
.038
.011
.003
-.013
.073
-.075
-.031
-.023
-.094
.499
.631
.113
-.261
N=
5052
396 Scientometrics (2017) 113:387–415
123
Supervisory setting
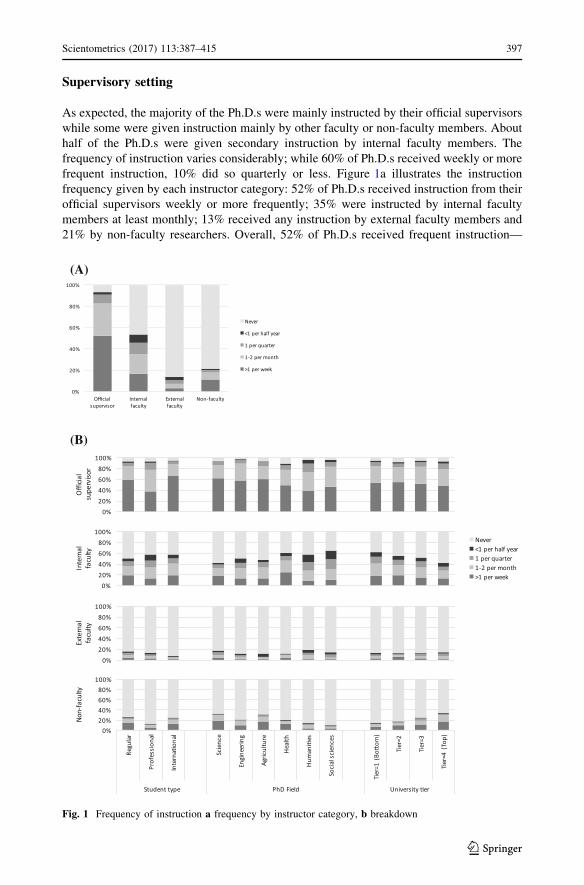
As expected, the majority of the Ph.D.s were mainly instructed by their official supervisors
while some were given instruction mainly by other faculty or non-faculty members. About
half of the Ph.D.s were given secondary instruction by internal faculty members. The
frequency of instruction varies considerably; while 60% of Ph.D.s received weekly or more
frequent instruction, 10% did so quarterly or less. Figure 1a illustrates the instruction
frequency given by each instructor category: 52% of Ph.D.s received instruction from their
official supervisors weekly or more frequently; 35% were instructed by internal faculty
members at least monthly; 13% received any instruction by external faculty members and
21% by non-faculty researchers. Overall, 52% of Ph.D.s received frequent instruction—
(A)
(B)
0%
20%
40%
60%
80%
100%
Officialsupervisor
Internalfaculty
Externalfaculty
Non-faculty
Never
<1 per half year
1 per quarter
1-2 per month
>1 per week
0%20%40%60%80%100%
Officia
lsuperviso
r
0%20%40%60%80%
100%
Internal
faculty
Never<1 per half year1 per quarter1-2 per month>1 per week
0%20%40%60%80%100%
External
faculty
0%20%40%60%80%100%
Regular
Profession
al
Interna�on
al
Science
Engineering
Agriculture
Health
Hum
ani�es
Socialsciences
Tier=1
(Bo�
om)
Tier=2
Tier=3
Tier=4
(Top
)
Student type PhD Field University �er
Non-faculty
Fig. 1 Frequency of instruction a frequency by instructor category, b breakdown
Scientometrics (2017) 113:387–415 397
123

once a month or more frequent—by a single faculty member (i.e., one of the official
supervisor, internal faculty member, or external faculty member); 36% received frequent
supervision from two of them, and 11% received no frequent supervision from faculty
members.
Figure 1b provides breakdowns by student types, Ph.D. fields, and university tiers. To
analyze the determinants of the supervisory settings statistically, Table 2 regress the
supervisory settings on several contextual variables. Since the dependent variables are all
ordinal, we draw on ordinal logistic regressions. Both descriptive and regression analyses
indicate some noticeable patterns in the supervisory setting. Among student types, pro-
fessional Ph.D.s were least frequently instructed by official supervisors, presumably
because they are in frequently present at the lab, and they were also least frequently
instructed by non-faculty researchers probably due to their social status. International
Ph.D.s were most often instructed by official supervisors and internal faculty members but
least by external faculty members, perhaps because their network outside their main
affiliation is limited. Among Ph.D. fields, Ph.D.s in Health in frequently received
instruction by official supervisors but frequently by internal faculty members. This may be
because of the hierarchical chair system typical in the field, where the official supervisor
delegates Ph.D. supervision to junior lab members. Instruction by official supervisors is in
frequent also in HASS, perhaps due to a less team-based nature of research activities in the
field. Among university tiers, higher-tier universities are characterized by less frequent
instruction by official supervisors but more frequent instruction by non-faculty researchers.
This is probably because labs in higher-tier universities are larger and afford to use their
lab members (e.g., senior students, postdocs) for Ph.D. supervision.
Determinants of training outcome
Career outcome
We examine the effect of the supervisory settings on the possibility of earning a degree in
time (Table 3). Model 1 shows that frequent supervision by the official supervisor and by
external faculty members is significantly positively associated with timely degree attain-
ment. Model 2, instead, uses #Faculty as the main independent variable. To distinguish the
impact of having a single instructor and that of having a second instructor, Model 2
includes two dummy variables with #Faculty = 1 as the reference group. The result shows
that a lack of professional supervision is associated with failing to earn degrees in time, and
that having multiple instructors is associated with timely degree attainment. It is plausible
that supervisors decided to give frequent instructions to Ph.D.s who seemed likely to earn
degrees, so Models 3 and 4 control for Ph.D.s’ motives to pursue degrees. Even after
controlling for these motives, the effect of the supervisory settings remains significant,
implying that frequent supervision does facilitate degree attainment. We also ran the same
regression models for several sets of subsamples, finding that the effect of the supervisory
settings is rather consistent between student types, Ph.D. fields, and university tiers. As to
the control variables, the result suggests that young Ph.D.s, male Ph.D.s, and Ph.D.s with
fellowship are more likely to earn degrees in time than otherwise.
Second, Table 4 examines how the supervisory settings influence Ph.D.’s choice
between academic and non-academic careers. As the dependent variable, academic career,
is dichotomous, we use logistic regressions. Table 4A suggests that instructions by official
supervisors and by external faculty members are positively associated (Model 1)—or lack
of it is negatively associated (Model 2)—with academic career choice. Because Ph.D.
398 Scientometrics (2017) 113:387–415
123

Table
2Predictionofsupervisory
setting
Model
1Model
2Model
3Model
4Model
5Official
supervisor
Internal
faculty
External
faculty
Non-faculty
#Faculty
Age
-.026***(.004)
-.002(.004)
-.007(.006)
-.043***(.007)
-.019***(.004)
Fem
ale
-.084(.066)
-.103�(.063)
.076(.099)
-.041(.087)
-.167*(.066)
Fellowship
-.110(.119)
-.361**(.124)
-.129(.174)
.416***(.121)
-.248*(.115)
RegularPh.D.
Professional
Ph.D.
-.509***(.075)
-.192**(.073)
.021(.116)
-.278*(.110)
-.356***(.078)
International
Ph.D.
.339***(.097)
.243**(.086)
-.811***(.170)
.115(.113)
.117(.090)
Ph.D.in
Science
Ph.D.in
Engineering
.031(.094)
.095(.091)
-.436**(.135)
-.395***(.108)
-.018(.090)
Ph.D.in
Agriculture
.019(.136)
.154(.129)
-.498*(.205)
.082(.147)
-.038(.130)
Ph.D.in
Health
-.391***(.093)
.657***(.090)
-.430**(.132)
-.085(.107)
.296***(.089)
Ph.D.in
Humanity
-.816***(.119)
.139(.115)
.146(.161)
-.782***(.166)
-.465***(.124)
Ph.D.in
Social
Sci
-.421***(.118)
.310**(.111)
-.165(.171)
-.966***(.179)
-.163(.119)
Ph.D.in
Others
-.410**(.133)
.277*(.127)
-.190(.192)
-.493**(.179)
-.045(.135)
Univ
tier
-.189***(.026)
-.178***(.025)
.039(.038)
.274***(.033)
-.202***(.026)
Chi-squared
stat
376.292***
187.878***
58.710***
388.648***
199.787***
Loglikelihood
-5530.903
-6650.746
-2774.724
-3448.492
-4494.770
N4802
4809
4817
4814
4817
Unstandardized
coefficients(standarderrorsin
parentheses).Two-tailedtest.�p\
.10;*
p\
.05;**p\
.01;***p\
.001.Ordinal
logisticregressions.RegularPh.D.and
Ph.D.in
Science
arethereference
groupsforstudenttypes
andforPh.D.fieldsrespectively
Scientometrics (2017) 113:387–415 399
123

degrees are often a precondition to obtain academic jobs, Models 3 and 4 focus on a
subsample of Ph.D.s who graduated with a degree. The result indicates a similar pattern,
but the supervision by the official supervisor (Model 3) as well as no frequent supervision
by faculty members (Model 4) turn insignificant, suggesting that these factors affect degree
attainment through which to influence the career choice indirectly. Next, since the career
choice should be influenced by Ph.D.’s motives, Models 5 and 6 use a subsample of Ph.D.s
who had intended to pursue academic careers from the beginning (academic motive = 1).
The result indicates a similar pattern, suggesting that the supervisory settings do influence
the career choice, although the effect of external faculty members turns insignificant.
Among the control variables, the result finds that females are more likely to pursue aca-
demic careers than males. Professional Ph.D.s, who had jobs, are less likely to pursue
academic careers than regular Ph.D.s because many of them continued their original jobs.
Table 3 Prediction of degree awarded in time
Model 1 Model 2 Model 3 Model 4
Age -.044*** (.005) -.044*** (.005) -.044*** (.005) -.044*** (.005)
Female -.235** (.076) -.232** (.075) -.237** (.076) -.235** (.076)
Fellowship .951*** (.147) .937*** (.146) .945*** (.147) .932*** (.147)
Regular Ph.D.
Professional Ph.D. .096 (.089) .093 (.089) .109 (.090) .112 (.090)
International Ph.D. .114 (.105) .111 (.104) .108 (.106) .098 (.105)
Ph.D. in Science
Ph.D. in Engineering .574*** (.100) .589*** (.099) .578*** (.100) .590*** (.100)
Ph.D. in Agriculture .454** (.141) .428** (.140) .457** (.141) .433** (.141)
Ph.D. in Health .751*** (.099) .714*** (.098) .753*** (.099) .712*** (.098)
Ph.D. in Humanity -2.141*** (.191) -2.121*** (.190) -2.148*** (.191) -2.129*** (.191)
Ph.D. in Social Sci -1.002*** (.141) -.974*** (.140) -1.029*** (.142) -1.003*** (.141)
Ph.D. in Others -.613*** (.151) -.618*** (.151) -.619*** (.152) -.627*** (.152)
Univ tier .064* (.030) .060* (.029) .065* (.030) .060* (.029)
Job motive -.023 (.164) -.033 (.163)
Academic motive .065 (.070) .078 (.070)
Official supervisor .137*** (.029) .137*** (.029)
Internal faculty .005 (.024) .008 (.024)
External faculty .091* (.037) .092* (.037)
Non-faculty -.027 (.026) -.024 (.026)
#Faculty = 0 -.297** (.108) -.322** (.109)
#Faculty = 1
#Faculty = 2 .116� (.069) .119� (.069)
Chi-squared stat 936.802*** 924.870*** 939.337*** 926.904***
Log likelihood -2857.935 -2875.557 -2851.121 -2865.621
N 4800 4817 4792 4804
Unstandardized coefficients (standard errors in parentheses). Two-tailed test. � p\ .10; * p\ .05;** p\ .01; *** p\ .001. Logistic regressions. Regular Ph.D., Ph.D. in Science, and #Faculty = 1 are thereference groups for respective sets of independent variables
400 Scientometrics (2017) 113:387–415
123

Tab
le4
Predictionofacadem
iccareer
choice
(A)Basemodel
Model
1Model
2Model
3Model
4Model
5Model
6All
All
Degreeaw
arded
Degreeaw
arded
Academ
icmotive
Academ
icmotive
Age
-.021***(.005)
-.020***(.005)
-.018**(.006)
-.017**(.006)
-.006(.010)
-.005(.010)
Fem
ale
.325***(.074)
.336***(.074)
.332***(.088)
.347***(.088)
.364**(.137)
.358**(.136)
Fellowship
.213(.136)
.184(.135)
.172(.147)
.132(.146)
.184(.214)
.164(.213)
RegularPh.D.
Professional
Ph.D.
-.313***(.086)
-.308***(.085)
-.544***(.100)
-.524***(.100)
-.468**(.180)
-.482**(.179)
International
Ph.D.
.280**(.106)
.258*(.105)
.339**(.122)
.320**(.121)
.095(.160)
.072(.160)
Ph.D.in
Science
Ph.D.in
Engineering
-.335***(.101)
-.323**(.101)
-.289**(.111)
-.277*(.110)
-.188(.181)
-.174(.181)
Ph.D.in
Agriculture
.095(.144)
.069(.143)
.155(.160)
.128(.159)
.063(.268)
.056(.267)
Ph.D.in
Health
.540***(.101)
.536***(.100)
.605***(.113)
.599***(.112)
.503*(.199)
.489*(.198)
Ph.D.in
Humanity
.100(.137)
.135(.136)
.416*(.202)
.460*(.201)
-.574**(.207)
-.511*(.207)
Ph.D.in
Social
Sci
.205(.135)
.232�(.134)
.313�(.173)
.330�(.172)
.055(.217)
.093(.215)
Ph.D.in
Others
.568***(.157)
.583***(.157)
.779***(.207)
.788***(.207)
.104(.240)
.130(.240)
Univ
tier
.058*(.029)
.052�(.029)
.066�(.034)
.057�(.034)
.034(.051)
.024(.050)
Jobmotive
-.499**(.160)
-.509**(.160)
-.557**(.184)
-.568**(.184)
-.609*(.291)
-.640*(.290)
Academ
icmotive
1.119***(.069)
1.125***(.069)
1.228***(.081)
1.233***(.081)
Official
supervisor
.059*(.028)
.032(.034)
.112*(.051)
Internal
faculty
.032(.024)
.019(.027)
.026(.044)
External
faculty
.114**(.036)
.098*(.042)
.101(.066)
Non-faculty
-.045�(.026)
-.070*(.030)
-.050(.048)
#Faculty=
0-.222*(.104)
-.150(.129)
-.463**(.174)
#Faculty=
1
#Faculty=
2.078(.068)
.072(.077)
-.010(.123)
Scientometrics (2017) 113:387–415 401
123

Table
4continued
(A)Basemodel
Model
1Model
2Model
3Model
4Model
5Model
6All
All
Degreeaw
arded
Degreeaw
arded
Academ
icmotive
Academ
icmotive
Chi-squared
stat
634.000***
620.651***
596.708***
583.445***
62.033***
59.943***
Loglikelihood
-2957.850
-2972.398
-2234.548
-2247.034
-969.812
-973.106
N4792
4804
3733
3742
1772
1776
(B)Field
breakdown
Model
1Model
2Model
3Model
4Model
5Model
6STEM
STEM
Health
Health
HASS
HASS
Official
supervisor
.072(.047)
.067(.047)
.021(.071)
Internal
faculty
-.051(.036)
.120**(.041)
.044(.064)
External
faculty
.026(.056)
.249***(.065)
.011(.093)
Non-faculty
-.132***(.037)
.061(.047)
-.034(.084)
#Faculty=
0-.116(.174)
-.197(.197)
-.484*(.204)
#Faculty=
1
#Faculty=
2.124(.101)
.179(.122)
-.235(.171)
Chi-squared
stat
439.050***
423.198***
124.745***
109.928***
75.878***
81.075***
Loglikelihood
-1332.802
-1342.825
-875.494
-885.797
-525.423
-524.756
N2240
2243
1408
1413
842
845
(C)Studenttypebreakdown
Model
1Model
2Model
3Model
4Model
5Model
6Regular
Regular
Professional
Professional
International
International
Official
supervisor
.022(.039)
.041(.050)
.204*(.088)
Internal
faculty
-.035(.033)
.148***(.041)
-.074(.072)
402 Scientometrics (2017) 113:387–415
123

Table
4continued
(C)Studenttypebreakdown
Model
1Model
2Model
3Model
4Model
5Model
6Regular
Regular
Professional
Professional
International
International
External
faculty
.043(.048)
.237***(.064)
.015(.151)
Non-faculty
-.096**(.034)
.027(.053)
-.114(.080)
#Faculty=
0-.262�(.154)
-.070(.161)
-.705*(.342)
#Faculty=
1
#Faculty=
2-.000(.092)
.295*(.121)
-.182(.197)
Chi-squared
stat
266.513***
257.904***
301.583***
288.166***
56.308***
54.377***
Loglikelihood
-1571.827
-1576.625
-993.665
-1004.672
-338.799
-343.201
N2550
2551
1656
1662
586
591
Unstandardized
coefficients(standarderrors
inparentheses).Two-tailedtest.�p\
.10;*p\
.05;**p\
.01;***p\
.001.Logisticregressions.RegularPh.D.,Ph.D.in
Science,and#Faculty=
1arethereference
groupsforrespectivesets
ofindependentvariables.In
Tables(B)and(C),thecontrolvariablesareomittedforparsimony
Scientometrics (2017) 113:387–415 403
123

On the other hand, international Ph.D.s are more likely to pursue academic careers as many
of them explicitly aimed at degrees for academic career development.
Since Table 4A indicates significant differences between Ph.D. fields, Table 4B splits
the sample by Ph.D. fields into STEM (Science, Engineering, and Agriculture), Health, and
HASS (Humanities and Social sciences). In STEM, non-faculty’s supervision shows a
significantly negative effect (Model 1). Frequent instruction by non-faculty researchers,
presumably senior students and postdocs in the same lab, might imply that the lab was
large and internal competition was severe, and thus, Ph.D.s might find it difficult to pursue
academic careers. In HASS, on the other hand, a lack of faculty’s supervision shows a
significantly negative effect (Model 6). This is perhaps because the less team-based nature
of HASS research makes an instruction by a single faculty member all the more influential.
Similarly, Table 4C breaks down student types, presenting clear differences. For
international students, connection with the official supervisor is indispensable due to their
limited local network (Ch. 5.1). Thus, instruction by the official supervisor (Model 5) or
lack of it (Model 6) has significant impact. In contrast, professional students could have
broader network beyond their official supervisors, and successfully exploiting it increases
the likelihood of choosing academic careers after graduation (Models 3 and 4). For regular
students, instruction by non-faculty members (Model 1) or lack of instruction by faculty
members (Model 2) discourages academic career choice.
As the third measure of career outcomes, Table 5 examines how areas of jobs can be
influenced by supervisory settings. Model 1 shows that the instruction by official super-
visors is positively associated with job relatedness, implying that frequent instruction by
supervisors reinforces Ph.D.s’ interest and encourages them to continue research in the
same field. The model finds that academic career has a significantly positive effect because
Ph.D.s at academic jobs are likely to continue related jobs. Thus, we split Ph.D.s who
chose academic jobs (Models 3 and 4) and Ph.D.s who chose non-academic jobs (Models 5
and 6), to find that the effect of supervisory settings is significant only for the academic
subsample.
Models 5 and 6 also show that Ph.D.s in Engineering, Agriculture, and Health tend to
engage in related jobs in industry. As these three fields are applied, this result might
suggest that these fields are successfully transferring knowledge workers to industry, as
designed. Interestingly, the models show that Ph.D.s who intended to delay job hunting are
likely to find jobs unrelated to Ph.D. subjects. Thus, training for Ph.D.s with such a motive
may be ineffective in transferring knowledge workers to industry.
Performance
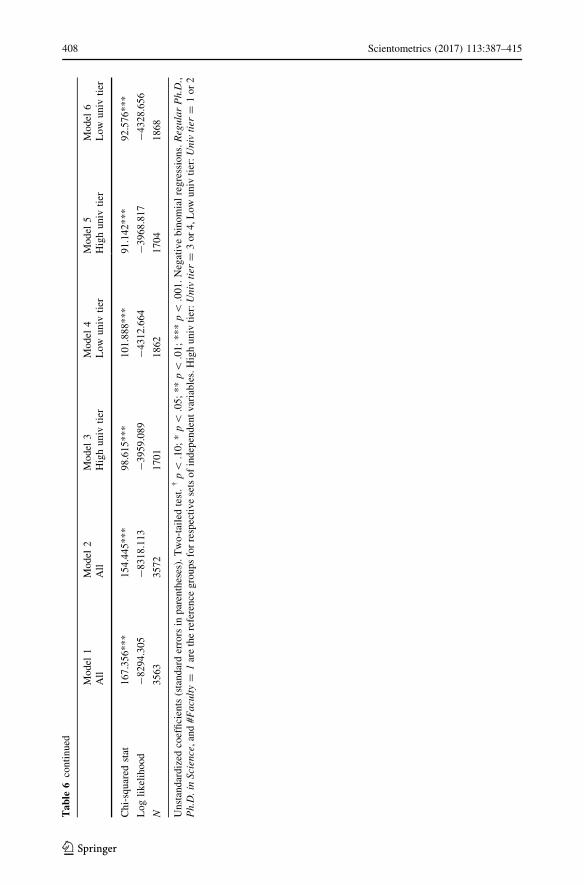
Next, we examine the impact of supervisory settings on Ph.D.s’ performance drawing on
two measurements. First, we use the publication count as the measure of scientific per-
formance (Table 6). Since this is a count variable, we use negative binomial regressions.
Model 1 shows that instruction by external faculty members is positively associated with
the publication count, suggesting that an external information source has positive impact
on scientific performance. We suspect that the contribution of supervision should differ by
the scientific performance of the instructors, and thus, the sample is split into high-tier and
low-tier university subsamples (Models 3–6). Indeed, Model 3 indicates that instruction by
external faculty members is positively associated with scientific performance only in high-
tier universities. Interestingly, Model 4 shows negative coefficients for instructions by the
official supervisor and by internal faculty members. This is probably due to a reverse
causality; that is, poorly performing Ph.D.s in low-tier universities needed frequent
404 Scientometrics (2017) 113:387–415
123

Table
5Predictionofjobrelatedness
Model
1Model
2Model
3Model
4Model
5Model
6All
All
Academ
icAcadem
icNon-academ
icNon-academ
ic
Age
-.009(.007)
-.010(.007)
-.015(.013)
-.012(.013)
-.009(.009)
-.011(.009)
Fem
ale
-.320**(.117)
-.316**(.117)
-.081(.198)
-.019(.197)
-.426**(.149)
-.421**(.148)
Fellowship
.441�(.248)
.469�(.247)
1.204*(.604)
1.208*(.603)
.232(.287)
.282(.285)
RegularPh.D.
Professional
Ph.D.
.208(.140)
.225(.139)
-.477*(.243)
-.483*(.241)
.520**(.172)
.521**(.170)
International
Ph.D.
.205(.182)
.203(.180)
.738*(.368)
.756*(.367)
-.050(.225)
-.065(.222)
Ph.D.in
Science
Ph.D.in
Engineering
.423**(.157)
.455**(.155)
.450(.336)
.496(.335)
.405*(.181)
.414*(.179)
Ph.D.in
Agriculture
.154(.219)
.134(.217)
-.497(.347)
-.542(.347)
.567*(.287)
.538�(.282)
Ph.D.in
Health
.375*(.156)
.336*(.154)
.612*(.292)
.457(.288)
.367�(.189)
.364�(.187)
Ph.D.in
Humanity
.151(.220)
.120(.220)
.333(.374)
.236(.372)
.182(.286)
.144(.285)
Ph.D.in
Social
Sci
.061(.208)
.077(.207)
.294(.374)
.277(.371)
-.033(.263)
-.024(.261)
Ph.D.in
Others
.416(.253)
.400(.252)
.731�(.438)
.646(.436)
.317(.323)
.297(.321)
Univ
tier
.081�(.046)
.072(.046)
.173*(.085)
.153�(.084)
.028(.056)
.026(.056)
Jobmotive
-.808***(.211)
-.799***(.210)
-.571(.446)
-.552(.446)
-.829***(.249)
-.809**(.248)
Academ
icmotive
-.076(.117)
-.077(.117)
.190(.187)
.214(.186)
-.270�(.150)
-.270�(.149)
Academ
iccareer
1.586***(.115)
1.593***(.114)
Official
supervisor
.100*(.043)
.204**(.072)
.042(.053)
Internal
faculty
-.018(.037)
-.043(.066)
.021(.046)
External
faculty
-.078(.054)
-.001(.097)
-.099(.067)
Non-faculty
-.019(.041)
-.110(.073)
.041(.050)
#Faculty=
0.163(.165)
.416(.322)
.076(.195)
#Faculty=
1
#Faculty=
2.173(.110)
.462*(.201)
.089(.134)
Scientometrics (2017) 113:387–415 405
123

Table
5continued
Model
1Model
2Model
3Model
4Model
5Model
6All
All
Academ
icAcadem
icNon-academ
icNon-academ
ic
Chi-squared
stat
284.524***
279.759***
57.227***
52.244***
61.827***
56.832***
Loglikelihood
-1413.330
-1419.080
-511.399
-514.300
-869.655
-874.228
N4559
4570
2721
2729
1838
1841
Unstandardized
coefficients(standarderrors
inparentheses).Two-tailedtest.�p\
.10;*p\
.05;**p\
.01;***p\
.001.Logisticregressions.RegularPh.D.,Ph.D.in
Science,and#Faculty=
1arethereference
groupsforrespectivesets
ofindependentvariables
406 Scientometrics (2017) 113:387–415
123

Tab
le6
Predictionofpublicationperform
ance
Model
1Model
2Model
3Model
4Model
5Model
6All
All
Highuniv
tier
Low
univ
tier
Highuniv
tier
Low
univ
tier
Age
.001(.002)
.002(.002)
-.003(.004)
.003(.003)
-.003(.004)
.004(.003)
Fem
ale
-.110**(.034)
-.109**(.034)
-.185***(.050)
-.062(.046)
-.184***(.050)
-.063(.046)
Fellowship
.210***(.052)
.204***(.052)
.207***(.057)
.212�(.119)
.200***(.057)
.202�(.119)
RegularPh.D.
Professional
Ph.D.
.212***(.041)
.218***(.041)
.214***(.065)
.232***(.054)
.212**(.065)
.239***(.054)
International
Ph.D.
.261***(.044)
.243***(.044)
.243***(.061)
.279***(.063)
.227***(.061)
.258***(.062)
Ph.D.in
Science
Ph.D.in
Engineering
.172***(.045)
.170***(.045)
.219***(.056)
.105(.074)
.216***(.056)
.105(.074)
Ph.D.in
Agriculture
.196**(.065)
.185**(.065)
.135(.085)
.265**(.099)
.123(.085)
.259**(.099)
Ph.D.in
Health
.105*(.046)
.112*(.046)
.106�(.063)
.081(.071)
.112
�(.063)
.088(.070)
Ph.D.in
Humanity
.092(.059)
.108�(.059)
.146�(.081)
.052(.088)
.162*(.081)
.063(.088)
Ph.D.in
Social
Sci
-.104�(.060)
-.105�(.060)
-.068(.084)
-.144�(.088)
-.069(.084)
-.150�(.087)
Ph.D.in
Others
.099(.065)
.102(.065)
.328***(.086)
-.133(.098)
.324***(.086)
-.123(.098)
Univ
tier
.033*(.013)
.033**(.013)
Jobmotive
-.170*(.080)
-.175*(.080)
-.273**(.099)
-.029(.132)
-.280**(.099)
-.029(.133)
Academ
icmotive
.148***(.029)
.152***(.029)
.090*(.040)
.205***(.042)
.091*(.040)
.207***(.042)
Official
supervisor
-.020(.013)
-.002(.018)
-.038*(.019)
Internal
faculty
.000(.011)
.025(.015)
-.025�(.015)
External
faculty
.039*(.016)
.059**(.022)
.021(.022)
Non-faculty
-.010(.012)
-.003(.016)
-.009(.019)
#Faculty=
0.008(.045)
-.026(.061)
.048(.067)
#Faculty=
1
#Faculty=
2.003(.030)
.054(.043)
-.056(.043)
Scientometrics (2017) 113:387–415 407
123
Table
6continued
Model
1Model
2Model
3Model
4Model
5Model
6All
All
Highuniv
tier
Low
univ
tier
Highuniv
tier
Low
univ
tier
Chi-squared
stat
167.356***
154.445***
98.615***
101.888***
91.142***
92.576***
Loglikelihood
-8294.305
-8318.113
-3959.089
-4312.664
-3968.817
-4328.656
N3563
3572
1701
1862
1704
1868
Unstandardized
coefficients(standarderrorsin
parentheses).Two-tailedtest.�p\
.10;*p\
.05;**p\
.01;***p\
.001.Negativebinomialregressions.RegularPh.D.,
Ph.D.in
Science,and#Faculty=
1arethereference
groupsforrespectivesetsofindependentvariables.Highuniv
tier:Univtier
=3or4,Lowuniv
tier:Univtier
=1or2
408 Scientometrics (2017) 113:387–415
123

supervision. Concerning control variables, Table 6 shows that female Ph.D.s publish less
than male Ph.D.s. Fellowship is associated with more publications. Professional Ph.D.s
publish more than regular Ph.D.s, perhaps because they have longer academic careers
before enrolling in Ph.D. programs. International Ph.D.s also perform better than regular
Ph.D.s. Academic motive shows significantly positive coefficients and job motive negative
coefficients, suggesting that scientific performance is predictable to some extent by their
initial motives for Ph.D. degrees.
Since publication performance may not be an ideal measure of non-academic perfor-
mance, we also draw on the wage rate as a proxy of performance (Table 7). From the
analysis, we exclude Ph.D.s who are employed in academic because their salary is usually
set by a formula and non-negotiable. Though Models 1 and 2 found no significant effect of
supervisory settings, subsample analyses splitting university tiers suggest that instruction
by official supervisors and instruction by multiple faculty members are effective only in
high-tier universities. As for control variables, age has a significantly positive effect
because the salary system in Japan is often seniority-based. Females earn less than males.
Professional Ph.D.s earn more than regular Ph.D.s for their supposedly higher skills and
longer professional experience. International Ph.D.s earn less than regular Ph.D.s, even
though the former exceeds the latter in publication performance. This is partly because the
majority of international Ph.D.s found jobs outside Japan, where the salary standard is
lower. Academic motive is negatively associated with the wage rate in non-academia,
suggesting that those who initially intended to pursue academic careers but ended in non-
academic careers earn less than those who did not have such initial intention.
Ph.D. satisfaction
Finally, Table 8 predicts respondents’ satisfaction with Ph.D. programs. As the dependent
variable is ordinal, we use ordinal logistic regressions. Both Models 1 and 2 show that
frequent supervision significantly increases the degree of satisfaction. Unlike in the pre-
vious sections, instruction even by non-academic researchers contributes to Ph.D.s’ sat-
isfaction. The effect is almost universal across Ph.D. fields and university tiers.
Discussions
As the modern society is increasingly becoming knowledge-driven, high-skilled knowl-
edge workers are crucial for the sustainable development of the society (Bozeman et al.
2001). Although postgraduate education is pivotal in this regard, it has not necessarily been
successful in producing human capital that meets the societal needs (Cyranoski et al. 2011;
Gould 2015). Issues in academic training are attributable to gaps both in policy practices
and in theories between higher education and scientific production, but empirical limita-
tions are also responsible. That is, poor access to the inside of academic labs along with
difficulty in identifying early careers of Ph.D. graduates have been undermining our
understanding of academic training. To fill in these gaps, the current study aims to illustrate
Ph.D. supervisory settings and investigate their impact on several outcome aspects,
drawing on the national survey of a cohort of 5000 Ph.D. graduates from Japanese
universities.
The result first shows that most Ph.D.s received instructions by their official supervisors,
and that half of them received additional instruction by internal faculty members. The
Scientometrics (2017) 113:387–415 409
123

Table
7Predictionofwagerate
fornon-academ
icPh.D.sample
Model
1Model
2Model
3Model
4Model
5Model
6All
All
Highuniv
tier
Low
univ
tier
Highuniv
tier
Low
univ
tier
Age
.057***(.005)
.058***(.005)
.051***(.007)
.060***(.007)
.051***(.007)
.060***(.007)
Fem
ale
-.313***(.088)
-.306***(.088)
-.366**(.129)
-.297*(.120)
-.360**(.129)
-.287*(.119)
Fellowship
-.044(.155)
-.038(.155)
-.058(.148)
.233(.415)
-.052(.147)
.239(.412)
RegularPh.D.
Professional
Ph.D.
.633***(.092)
.628***(.091)
.740***(.130)
.582***(.129)
.727***(.127)
.573***(.128)
International
Ph.D.
-.482***(.137)
-.478***(.137)
-.329�(.171)
-.608**(.209)
-.328�(.170)
-.604**(.208)
Ph.D.in
Science
Ph.D.in
Engineering
.062(.102)
.064(.102)
.108(.120)
-.016(.165)
.119(.119)
-.023(.164)
Ph.D.in
Agriculture
-.331*(.152)
-.331*(.152)
-.048(.188)
-.587*(.235)
-.031(.187)
-.592*(.235)
Ph.D.in
Health
.767***(.107)
.774***(.106)
.883***(.138)
.665***(.161)
.898***(.136)
.667***(.160)
Ph.D.in
Humanity
-.824***(.174)
-.836***(.174)
-.733**(.235)
-.939***(.251)
-.773***(.234)
-.959***(.250)
Ph.D.in
Social
Sci
-.153(.158)
-.146(.157)
-.048(.226)
-.225(.222)
-.024(.224)
-.236(.221)
Ph.D.in
Others
-.330�(.186)
-.331�(.186)
-.494�(.282)
-.324(.254)
-.500�(.280)
-.325(.253)
Univ
tier
.062*(.031)
.064*(.031)
Jobmotive
-.150(.161)
-.153(.161)
-.143(.185)
-.145(.265)
-.152(.184)
-.140(.265)
Academ
icmotive
-.261**(.087)
-.272**(.087)
-.170(.110)
-.360**(.132)
-.176(.110)
-.380**(.132)
Official
supervisor
-.015(.030)
.039(.039)
-.056(.045)
Internal
faculty
.034(.025)
.077*(.034)
.006(.036)
External
faculty
-.024(.040)
-.018(.053)
-.030(.059)
Non-faculty
.004(.028)
.011(.034)
.006(.043)
#Faculty=
0.055(.106)
-.016(.135)
.131(.157)
#Faculty=
1
#Faculty=
2.120(.074)
.281**(.097)
.009(.106)
410 Scientometrics (2017) 113:387–415
123

Table
7continued
Model
1Model
2Model
3Model
4Model
5Model
6All
All
Highuniv
tier
Low
univ
tier
Highuniv
tier
Low
univ
tier
FTest
47.837***
53.639***
27.938***
25.477***
31.805***
28.734***
Adjusted
R-squared
.319
.318
.370
.290
.372
.289
N1803
1805
781
1022
781
1024
Unstandardized
coefficients(standarderrorsin
parentheses).Two-tailedtest.�p\
.10;*p\
.05;**p\
.01;***p\
.001.Ordinaryleastsquares.RegularPh.D.,Ph.D.in
Science,and#Faculty=
1arethereference
groupsforrespectivesets
ofindependentvariables.Highuniv
tier:Univ
tier
=3or4,Low
univ
tier:Univ
tier
=1or2
Scientometrics (2017) 113:387–415 411
123

frequency of instruction has substantial variation; the majority of Ph.D.s received weekly
instruction but some less than quarterly. Some Ph.D.s received instruction by non-faculty
members, such as senior students and postdocs. Overall, a great deal of variation is
observed in the Ph.D. supervisory setting both in quantity and in quality.
We find that these variations produce significant differences in training outcome. In
terms of career outcome, the result first suggests that frequent instruction by faculty
members (but not by non-faculty researchers) increases the likelihood of earning degrees in
time, which is consistent with Wright and Lodwick (1989). The result also suggests that
frequent supervision and supervision by multiple instructors increases the possibility of
finding jobs related to dissertation subjects. Finally, the result suggests that frequent
supervision by faculty members increases the likelihood of choosing academic careers
whereas that by non-faculty members decreases it. Overall, the intensity of supervision
seems to facilitate Ph.D.’s learning and motivations to continue related jobs in the same
sector and field. The training effect differs by the type of instructors. Noticeably, non-
faculty members’ instruction leads to non-academic career choice, perhaps because lack of
professional instruction discourages Ph.D.s from pursuing academic careers.
Table 8 Prediction of Ph.D.’ssatisfaction
Unstandardized coefficients(standard errors in parentheses).Two-tailed test. � p\ .10;* p\ .05; ** p\ .01;*** p\ .001. Ordinal logisticregressions. Regular Ph.D.,Ph.D. in Science, and#Faculty = 1 are the referencegroups for respective sets ofindependent variables
Model 1 Model 2
Age .016*** (.004) .011** (.004)
Female -.023 (.065) -.042 (.064)
Fellowship .282* (.116) .255* (.115)
Regular Ph.D.
Professional Ph.D. .459*** (.077) .354*** (.076)
International Ph.D. .589*** (.093) .599*** (.092)
Ph.D. in Science
Ph.D. in Engineering .262** (.091) .262** (.090)
Ph.D. in Agriculture -.133 (.127) -.108 (.126)
Ph.D. in Health -.249** (.090) -.325*** (.088)
Ph.D. in Humanity .176 (.120) .124 (.119)
Ph.D. in Social Sci .176 (.120) .125 (.118)
Ph.D. in Others .101 (.133) .051 (.132)
Univ tier .026 (.025) .011 (.025)
Job motive -.495*** (.140) -.460** (.140)
Academic motive -.088 (.062) -.078 (.061)
Academic career .196*** (.060) .192** (.059)
Official supervisor .574*** (.027)
Internal faculty .220*** (.021)
External faculty .207*** (.032)
Non-faculty .136*** (.023)
#Faculty = 0 -1.297*** (.092)
#Faculty = 1
#Faculty = 2 .455*** (.060)
Chi-squared stat 707.569*** 466.210***
Log likelihood -5648.357 -5784.722
N 4787 4798
412 Scientometrics (2017) 113:387–415
123

These results offer a few policy implications. Successfully earning degrees is obviously
desirable and finding jobs related to Ph.D. research subjects also seems efficient. In this
regard, recent policies in Japan and some other countries might have created an undesirable
situation in that they have allowed over-concentration of Ph.D.s in a small number of labs,
where supervisors can spare insufficient time for the instruction of each Ph.D. student
(Shibayama and Baba 2015). Indeed, our result shows that instruction by faculty members
is significantly less frequent in higher-tier universities. Therefore, it is advisable to ade-
quately control the number of Ph.D.s that a supervisor can actually supervise. The choice
between academic and non-academic careers needs careful interpretation, since modern
higher education system is expected to supply Ph.D.s to both academic and non-academic
sectors. The result indicates that academic career choice is positively correlated with other
outcome measures except for the wage rate, which seems to imply that unsuccessful or
unsatisfied Ph.D.s opt out of academic careers. Thus, training programs for academic and
non-academic careers might need to be differentiated (e.g., distinct courses, training by
practitioners for the latter) (Gould 2015).
Concerning the performance outcome, the result finds that the frequent supervision by
faculty members increases publication performance as well as the wage rate only in high-
tier universities. Thus, training effect on performance might be contingent to supervisors’
scientific capabilities. This interpretation is consistent with Long et al. (1979). The result
also points to the necessity for faculty members to allocate sufficient time and resources for
training in high-tier universities, where over-capacity has been pointed out (Shibayama and
Baba 2015). In addition, the result suggests that instruction by multiple supervisors
increases the wage rate in industry jobs. This might suggest the importance of interdis-
ciplinary or diverse perspectives particularly when Ph.D.s choose to work in industries.
Finally, the result suggests that frequent supervision both by faculty members and by
non-faculty researchers increases Ph.D.s’ satisfaction. This is consistent with previous
findings in educational psychology (Brown and Atkins 1988; Hockey 1991). It is note-
worthy that Ph.D.’s satisfaction is the only outcome positively associated with instruction
by non-faculty researchers. Thus, Ph.D.s can be satisfied even when their performance is
not improved. In this regard, Ph.D.s’ subjective evaluation needs cautious interpretation if
it is used for policymaking purposes.
These results warrant some reservations, and future research is needed to further our
understanding in academic training. The sample specificity restricts the generalizability of
the findings, as postgraduate education systems considerably differ by country. The out-
come measures can be improved. In particular, scientific performance and the wage rate are
measured 1.5 years after graduation. As the effect of academic training might take time to
realize, longer-term performance measures could offer clearer results. In addition, as a
career outcome, inbreeding, where students continue working under the same supervisor, is
of both theoretical and practical interest (Horta et al. 2010). This is particularly so in Japan,
where inbreeding is still common (Morichika and Shibayama 2015). The explanatory
variables can be similarly improved. Our survey inquired into the frequency of supervision
from four sources of instructors, but further details of inter-personal relationships could
help interpret our results. For example, though our results mostly show desirable effects of
frequent instruction by supervisors, it is plausible that excessive control hinders Ph.D.s’
creativity. Testing such hypotheses takes more detailed information such as training styles
(Hockey 1996) and research task allocation (Kam 1997). The expertise fields of instructors
can be informative in evaluating the diversity of supervising teams (Spelt et al. 2009).
Since a lab is a complex organization, the effect of training and the effect of other factors
need to be disentangled. Further data on organizational settings, such as lab size and age,
Scientometrics (2017) 113:387–415 413
123

can be of use in this regard (e.g., Heinze et al. 2009; Pelz and Andrews 1966). In regression
analyses, endogeneity is concerned. In particular, supervisors might have decided the
frequency of training and other training styles on the basis of Ph.D.’s latent capabilities.
We plan to conduct follow-up surveys of the same cohort of Ph.D.s, which we expect can
address a part of these issues.
Acknowledgement This work is partly supported by the Japan Society for the Promotion of Science underGrant-in-Aid for Scientific Research (C) 16K01235 and the Hoansha Foundation fellowship.
Open Access This article is distributed under the terms of the Creative Commons Attribution 4.0 Inter-national License (http://creativecommons.org/licenses/by/4.0/), which permits unrestricted use, distribution,and reproduction in any medium, provided you give appropriate credit to the original author(s) and thesource, provide a link to the Creative Commons license, and indicate if changes were made.
References
Agarwal, R., & Ohyama, A. (2012). Industry or academia, basic or applied? Career choices and earningstrajectories of scientists. Management Science, 59, 950–970.
Allison, P. D., & Long, J. S. (1990). Departmental effects on scientific productivity. American SociologicalReview, 55, 469–478.
Baldi, S. (1995). Prestige determinants of first academic job for new sociology Ph.D.s 1985–1992. Socio-logical Quarterly, 36, 777–789.
Bozeman, B., Dietz, J., & Gaughan, M. (2001). Scientific and technical human capital: An alternative modelfor research evaluation. International Journal of Technology Management, 22, 716–740.
Brown, G., & Atkins, M. (1988). Effective teaching in higher education. London: Methuen.Campbell, R. A. (2003). Preparing the next generation of scientists: The social process of managing
students. Social Studies of Science, 33, 897–927.Crane, D. (1965). Scientists at major and minor universities—A study of productivity and recognition.
American Sociological Review, 30, 699–714.Cyranoski, D., Gilbert, N., Ledford, H., Nayar, A., & Yahia, M. (2011). The Ph.D. factory. Nature, 472,
276–279.Debackere, K., & Rappa, M. A. (1995). Scientists at major and minor universities—Mobility along the
prestige continuum. Research Policy, 24, 137–150.Delamont, S., & Atkinson, P. (2001). Doctoring uncertainty: Mastering craft knowledge. Social Studies of
Science, 31, 87–107.Delamont, S., Parry, O., & Atkinson, P. (1997). Critical mass and pedagogic continuity: Studies in academic
habitus. British Journal of Sociology of Education, 18, 533–549.Ehara, T., & Umakoshi, T. (2004). Reform of graduate education in Japan. Tokyo: Toshindo.Gaughan, M., & Bozeman, B. (2002). Using curriculum vitae to compare some impacts of NSF research
grants with research center funding. Research Evaluation, 11, 17–26.Geuna, A. (2015). Global mobility of research scientists: The economics of who goes where and why. San
Diego: Academic Press.Gould, J. (2015). How to build a better Ph.D.. Nature, 528, 22–25.Hackett, E. J. (1990). Science as a vocation in the 1990s—The changing organizational culture of academic
science. Journal of Higher Education, 61, 241–279.Heinze, T., Shapira, P., Rogers, J. D., & Senker, J. M. (2009). Organizational and institutional influences on
creativity in scientific research. Research Policy, 38, 610–623.Hockey, J. (1991). The social-science Ph.D.—A literature-review. Studies in Higher Education, 16,
319–332.Hockey, J. (1996). Motives and meaning amongst Ph.D. supervisors in the social sciences. British Journal of
Sociology of Education, 17, 489–506.Horta, H., Veloso, F. M., & Grediaga, R. (2010). Navel gazing: Academic inbreeding and scientific pro-
ductivity. Management Science, 56, 414–429.Kam, B. H. (1997). Style and quality in research supervision: The supervisor dependency factor. Higher
Education, 34, 81–103.
414 Scientometrics (2017) 113:387–415
123

Kato, M., Kanegae, Y., & Chayama, H. (2012). Doctoral graduates survey 2011: Analysis on researchtraining and education in doctoral programs in Japanese university, NISTEP Research Material (Vol.217). Tokyo: NISTEP.
Knorr-Cetina, K. (1999). Epistemic cultures: How the sciences make knowledge. Cambridge, MA: HarvardUniversity Press.
Kobayashi, Y. (2015). First report of Japan doctoral human resource profiling: FY2012 doctoral graduatescohort, NISTEP REPORT (Vol. 165). Tokyo: NISTEP.
Lariviere, V. (2012). On the shoulders of students? The contribution of Ph.D. students to the advancement ofknowledge. Scientometrics, 90, 463–481.
Latour, B., & Woolgar, S. (1979). Laboratory life: The construction of scientific facts. Princeton, NJ:Princeton University Press.
Laudel, G. (2001). Collaboration, creativity and rewards: Why and how scientists collaborate. InternationalJournal of Technology Management, 22, 762–781.
Long, J. S., Allison, P. D., & McGinnis, R. (1979). Entrance into the academic career. American Socio-logical Review, 44, 816–830.
Long, J. S., & McGinnis, R. (1985). The effects of the mentor on the academic career. Scientometrics, 7,255–280.
Mainhard, T., Van Der Rijst, R., Van Tartwijk, J., & Wubbels, T. (2009). A model for the supervisor–doctoral student relationship. Higher Education, 58, 359–373.
Marsh, H. W., Rowe, K. J., & Martin, A. (2002). Ph.D. students’ evaluations of research supervision—issues, complexities, and challenges in a nationwide australian experiment in benchmarking univer-sities. Journal of Higher Education, 73, 313–348.
Misu, T., Horoiwa, A., & Chayama, S. (2010). Career paths of recent doctoral graduates in science,NISTEP Research Material (Vol. 184). Tokyo: NISTEP.
Morichika, N., & Shibayama, S. (2015). Impact of inbreeding on scientific productivity: A case study of aJapanese university department. Research Evaluation, 24, 146–157.
Morichika, N., & Shibayama, S. (2016). Use of dissertation data in science policy research. Scientometrics,108, 221–241.
Morrison, E., Rudd, E., Zumeta, W., & Nerad, M. (2011). What matters for excellence in Ph.D. programs?Latent constructs of doctoral program quality used by early career social scientists. Journal of HigherEducation, 82, 535–563.
Murphy, N., Bain, J. D., & Conrad, L. (2007). Orientations to research higher degree supervision. HigherEducation, 53, 209–234.
National Research Council. (1998). Trends in the early careers of life scientists. Washington, DC: NationalAcademy Press.
Owen-Smith, J. (2001). Managing laboratory work through skepticism: Processes of evaluation and control.American Sociological Review, 66, 427–452.
Pelz, D. C., & Andrews, F. M. (1966). Scientists in organizations. New York: Wiley.Roach, M., & Sauermann, H. (2010). A taste for science? Ph.D. scientists’ academic orientation and self-
selection into research careers in industry. Research Policy, 39, 422–434.Salonius, A. (2007). Working in the lab: Social organization of research and training in biomedical
research labs in Canada and its relationship to research funding. Quebec: McGill University.Shibayama, S., & Baba, Y. (2015). Impact-oriented science policies and scientific publication practices: The
case of life sciences in Japan. Research Policy, 44, 936–950.Shibayama, S., Baba, Y., & Walsh, J. P. (2015). Organizational design of university laboratories: Task
allocation and lab performance in Japanese bioscience laboratories. Research Policy, 44, 610–622.Spelt, E. J. H., Biemans, H. J. A., Tobi, H., Luning, P. A., & Mulder, M. (2009). Teaching and learning in
interdisciplinary higher education: A systematic review. Educational Psychology Review, 21, 365–378.Stephan, P. E. (2012). How economics shapes science. Cambridge, MA: Harvard University Press.Traweek, S. (1988). Beamtimes and lifetimes: The world of high energy physicists. Cambridge, MA: Har-
vard University Press.Wright, J., & Lodwick, R. (1989). The process of the Ph.D.: A study of the first year of doctoral study.
Research Papers in Education, 4, 22–56.Wuchty, S., Jones, B. F., & Uzzi, B. (2007). The increasing dominance of teams in production of knowl-
edge. Science, 316, 1036–1039.
Scientometrics (2017) 113:387–415 415
123