impact of organization culture on tqm implementation barriers · impact of organization culture on...
TRANSCRIPT
1
IMPACT OF ORGANIZATION CULTURE
ON TQM IMPLEMENTATION BARRIERS
A thesis submitted in fulfilment of the requirements for the degree of
Doctor of Philosophy
By
Rashed S. Al-Jalahma
Brunel Business School
Brunel University, 2012

ii
Executive Summary
This study examines the relationship between organisational culture and TQM
implementation barriers to gain a more comprehensive understanding of the factors affecting
TQM implementation. For TQM implementation to take root effectively, the critical role of
organisational culture is widely recognised. The existence of pitfalls and obstacles (barriers)
to implementing TQM is also widely recognized, as is the importance of understanding these
TQM implementation barriers. Nevertheless, whilst many TQM implementation models and
frameworks have been designed and proposed, no study has been located in the literature that
has systematically examined the relationship between organisational culture and TQM
implementation barriers. This theoretical lapse in the TQM literature necessitates an
investigation of the direction and significance of the relationship which can help in devising
more informed TQM implementation models.
In this context, a quantitative research methodology was adopted to examine the
profiles of organisational culture and of TQM implementation barriers in organisations in
Bahrain and to examine the relationship between these variables. Bahrain is presently going
through a rapid expansion in quality management system adoption. Accordingly, the
research uses four constructs of organisational culture as independent variables and six
constructs of TQM implementation barriers identified through the literature as dependent
variables. A set of hypotheses was developed describing the expected relationships between
these two sets of variables. The study adopted a positivist, deductive approach using an
online survey questionnaire to obtain quantitative data for hypothesis testing. The research
instrument was assessed for validity and reliability through structured interviews. Responses
to the survey were obtained from 325 organisations located in Bahrain.
Analysis of Moment Structure (AMOS) version 16.0 was used to test the
measurement model using Confirmatory Factor Analysis (CFA), and to test the structural
model using Structural Equation Modelling (SEM). Both models showed a very good fit to
the data, with good construct validity and reliability. The findings of the study showed that
group culture, which is believed to be an ‘ideal’ culture for TQM implementation helps
decrease employee barriers, information barriers and customer related barriers as predicted.

iii
However group culture wasn’t found to help decrease top management barriers. Rational
culture was found to decrease top management barriers as predicted but it wasn’t found to
help decrease employee and customer barriers. The findings confirm the significant impact of
hierarchical culture in the Bahrain context in decreasing planning and process management
barriers. Developmental culture’s potential to lower employee and customer barriers was
observed but was not found to be statistically significant.
This research makes several contributions in both academic and practical terms.
Theoretically, positioning organisational culture as an antecedent of TQM implementation
barriers, this study is the first holistic approach that attempts to empirically investigate which
type of organisational culture is related to which TQM implementation barriers.
Understanding the nature, strength and direction of these relationships can help to inform and
support future TQM implementation attempts. Practically, this research will benefit
organisations who have not been able to fully realise TQM, or who are in the process of
planning the introduction of TQM. The findings of the study can help Bahraini organisations
to realise the long term quality objectives of the Bahrain Centre of Excellence’s Vision 2030
programme. Furthermore, the study has contributed a new empirically tested scale for
measuring TQM implementation barriers - a valuable tool on its own, or in conjunction with
the organisational culture profile assessment tool - for both practitioners wishing to examine
their readiness for TQM or progress in creating a TQM ethos, and for future researchers
wishing to extend our understanding of the influence of TQM barriers and/or culture on
major organisational improvement interventions. It is expected that replication of this study
in other countries and regions with different culture and context may help in developing an
improved model of TQM implementation. Implications for managers and future research are
advanced.

iv
Dedication
This thesis is dedicated to my father who died during my PhD studies, to my
loving mother, my beloved wife and my wonderful children

v
Acknowledgement
Praise is to Allah, the Almighty, who gave me the strength and ability to complete this
doctoral thesis!
The successful accomplishment of a PhD thesis is not a personal and individual task. It would
have been almost impossible for me to overcome the challenges of this project without the
help, encouragement, support and motivation that I received from many wonderful and
supportive people. Indeed, this achievement is made possible because of them.
The first and most important role in accomplishment of this thesis was of my supervisor, Dr.
David Gallear. I will never forget your great contribution, Dr. David. I needed a person to
help me through this wonderful transition process, and I was fortunate to have worked with
you. I must thank you for your help, guidance and suggestions during the different stages of
my research. I learned from your constructive comments on my thesis, and I thank you for
straightforward and clear criticism for improving my work. I benefited a lot from your
comments and suggestion in developing my research work. Thank you so much for your
support, encouragement, and generosity. You have made a great change in my life.
Secondly, I am thankful to my family, my wife, children, brothers and sisters for their
support, prayers, and patience. Their support and encouragement were the most important
assets for me in doing my research without any tension or pressure. All of you were always
supportive, encouraging and enthusiastic, which always motivated me in my studies.
I would like to extend my thanks to Ministry of Defence, Kingdom of Bahrain for funding
my doctoral studies. Also, many thanks to all staff of Brunel Business School for their kind
support during my PhD studies. I am very much thankful to all the organisations and their
staff that participated in this research, for their time and assistance in data collection.
Finally many thanks to all my friends who helped me in one way or another. Their advice and
encouragement helped me a lot to accomplish my research.
vi
Declaration
This is to declare that:
- I am responsible for the work submitted in this thesis
- This work has been written by me
- All verbatim extract have been distinguished and the sources specifically
acknowledged
- During the preparation of this thesis, some papers were prepared as listed below. The
remaining parts of the thesis have not yet been published.
Research Publications:
Aljalahma R. and Gallear D. (2011) “Impact of Organisational Culture on TQM
Implementation Barriers “paper presented at Brunel Business School, PhD Doctoral
Symposium 2011, Brunel University. (Best final Paper Award)
Aljalahma R. And Gallear D. (2011) “Towards understanding the impact of organisational
culture on TQM implementation barriers” International Journal of Business Information
Systems (Paper presented)
Aljalahma R. And Gallear D. (2010) “Exploring the relationships in core elements of TQM
implementation “European, Mediterranean & Middle Eastern Conference on Information
Systems (EMCIS) April 12-13, Abu Dhabi, UAE.
Aljalahma R. And Gallear D. (2011) “Exploring the relationships in core elements of TQM
implementation“. Paper presented at "International Conference on Economics, Business
Management and Marketing held in Paris, France during June 28-30, 2010. (Accepted for
Oral Presentations)
Aljalahma R. And Gallear D. (2011) “Exploring the relationships in core elements of TQM
implementation”. Paper presented at Brunel Business School, PhD Doctoral Symposium
2009, Brunel University.
Aljalahma R. And Gallear D. (2011) “Measuring the importance and implementation of TQM
practices and identifying TQM implementation barriers in Bahraini industries using Baldrige
Criteria of performance excellence” Paper presented at Brunel Business School, PhD
Doctoral Symposium 2009, Brunel University.
Signature: ____________________________
Date: ________________________________
vii
Table of Contents Executive Summary ................................................................................................................... ii
Dedication ................................................................................................................................. iv
Acknowledgement ..................................................................................................................... v
Declaration ................................................................................................................................ vi
Table of Contents ..................................................................................................................... vii
List of Tables ........................................................................................................................... xii
List of Figures ......................................................................................................................... xiv
List of Abbreviations ............................................................................................................... xv
Chapter One: Introduction ......................................................................................................... 1
1.1 Introduction of chapter ..................................................................................................... 1
1.2 Purpose of the study ......................................................................................................... 1
1.3 The research background ................................................................................................. 1
1.4 Problem statement ............................................................................................................ 4
1.5 The context of the study ................................................................................................... 5
1.6 The research questions ..................................................................................................... 7
1.7 The aim and objectives of the study ................................................................................ 7
1.8 Research methodology ..................................................................................................... 7
1.9 Contributions of the study ................................................................................................ 9
1.10 Thesis organisation ...................................................................................................... 10
Chapter Two: Literature Review ............................................................................................. 11
2.1 Introduction .................................................................................................................... 11
2.2 An Overview of Total Quality Management and its Implementation ........................... 12
2.2.1 Origins of the TQM concept ................................................................................... 13
2.2.2 Definition of Total Quality Management ............................................................... 18
2.2.3 TQM and Quality award models............................................................................. 20
2.2.4 Core constructs and principles underlying TQM .................................................... 24
2.3 Scope of TQM and its implementation .......................................................................... 27
2.4 The bespoke nature of TQM and its implementation .................................................... 28
2.5 Core elements of TQM implementation ........................................................................ 30
2.6 Culture and TQM ........................................................................................................... 32
2.6.1 Organisational culture ............................................................................................. 32
2.6.2 The Role of organisational culture in TQM implementation.................................. 35
2.6.3 Measuring organisational culture ............................................................................ 36
2.6.4 The Competing Values Framework ............................................................................ 41

viii
2.6.4.1 Group culture ....................................................................................................... 43
2.6.4.2 Developmental culture ......................................................................................... 44
2.6.4.3 Rational culture ................................................................................................... 44
2.6.4.4 Hierarchical culture............................................................................................. 44
2.6.5 Summary of CVF .................................................................................................... 45
2.6.6 Organisational culture in the context of Bahraini industries ...................................... 46
2.7 TQM implementation barriers ....................................................................................... 47
2.7.1 Profiling commonly cited barriers from previous studies....................................... 52
2.7.2Review of core empirical studies on TQM implementations barriers ..................... 62
2.7.3 Identification of the barrier constructs .................................................................... 67
2.7.4 Review of the most common/significant barriers ................................................... 69
2.7.4.1 Top management barriers ................................................................................ 69
2.7.4.2 Employee barriers ............................................................................................ 73
2.7.4.3 Customer barriers ............................................................................................ 78
2.7.4.4 Planning barriers ............................................................................................. 82
2.7.4.5 Process management barriers ......................................................................... 84
2.7.4.6 Information management barriers ................................................................... 88
2.8 Relationships between organisational culture and TQM implementation barriers ........ 92
2.9 Chapter summary ........................................................................................................... 97
Chapter Three: Conceptual Framework ................................................................................... 99
3.1 Introduction .................................................................................................................... 99
3.2 Key concepts from the literature review ........................................................................ 99
3.2.1 Identifying type of existing organisational culture ............................................... 101
3.2.2 Identifying existing TQM implementation barriers .............................................. 102
3.3 Proposed conceptual framework and hypotheses development ................................... 103
Figure 3.1 Conceptual framework and hypothesised relationships .......................... 103
3.4 Developing research hypotheses .................................................................................. 104
3.5 Examining relationships between organisational culture and TQM implementation
barriers and formulating hypotheses .................................................................................. 105
3.5.1 Group culture and TQM barriers – hypotheses 1, 2, 3 and 4 ................................ 106
3.5.2 Developmental culture and TQM barriers - hypotheses 5 and 6 .......................... 113
3.5.3 Rational culture and TQM barriers - hypotheses 7, 8 and 9 ................................. 115
3.5.4 Hierarchical culture and TQM barriers –hypotheses 10 and 11 ........................... 120
3.6 Chapter summary ......................................................................................................... 123
Chapter Four: Research Methodology ................................................................................... 125
4.1 Introduction .................................................................................................................. 125
4.2 Selection and rationalization of the research process .................................................. 125

ix
4.2.1 Research philosophy ............................................................................................. 126
4.2.2 Research approach ................................................................................................ 129
4.2.3 Research strategy .................................................................................................. 130
4.2.4 Research method ................................................................................................... 132
4.2.5 Data collection method ......................................................................................... 132
4.3 Sampling method ......................................................................................................... 134
4.4 Survey instrument and measurement scale .................................................................. 137
4.4.1 Survey questionnaire design ................................................................................. 138
4.4.1.1 Part I – survey questions on organisational and respondent profile............. 138
4.4.1.2 Part II – survey questions on organisational culture .................................... 139
4.4.1.3 Part III – survey questions for identifying significant TQM implementation
barriers ...................................................................................................................... 140
4.4.2 Summary of measurement scales .......................................................................... 140
4.4.3 Pilot structured interviews to validate the survey instrument ............................... 141
4.5 Data collection ............................................................................................................. 143
4.6 Data analysis ................................................................................................................ 144
4.6.1 Data management.................................................................................................. 144
4.6.2 Data management in MS Excel............................................................................. 145
4.6.3 Data management in SPSS.................................................................................... 145
4.6.4 Data screening prior to analysis ............................................................................ 145
4.6.4.1 Checking data for errors .................................................................................... 146
4.6.4.2Missing data ........................................................................................................ 146
4.6.4.3Checking for Outliers .......................................................................................... 147
4.6.4.4 Normality check ................................................................................................. 148
4.6.4.5 Main analysis ..................................................................................................... 149
4.7 Chapter summary ......................................................................................................... 150
Chapter Five: Data Analysis and Findings ............................................................................ 152
5.1 Introduction .................................................................................................................. 152
5.2 Analyzing data by descriptive statistics ....................................................................... 153
5.2.1 Demographic of the respondents .......................................................................... 153
5.2.2 General demographic profile of the respondents .................................................. 153
5.2.3 Organisational culture profile ............................................................................... 157
5.2.4 TQM implementation barriers profile ................................................................... 161
5.3 Data analysis of hypothesized model using CFA/SEM ............................................... 169
5.3.1 Validating the Measurement Model using CFA ................................................... 170
5.3.1.1 Measurement theory....................................................................................... 170
5.3.1.2 Constructing the model .................................................................................. 171
x
5.3.1.3 Overall fit test ................................................................................................ 173
5.3.1.4Construct validity ............................................................................................ 176
5.3.1.5 Summary of assessment of measurement model ............................................ 182
5.3.2 Testing the structural model using SEM ............................................................... 182
5.3.2.1 Constructing a structural model .................................................................... 183
5.3.2.2 Assessment of structural model (SEM) .......................................................... 185
5.3.2.3 Evaluating hypothesized relationships using SEM ........................................ 187
5.4 Chapter summary ......................................................................................................... 193
Chapter Six: Discussion ......................................................................................................... 195
6.1 Introduction .................................................................................................................. 195
6.2 Organisational culture .................................................................................................. 197
6.2.1 Organisational culture profile by type of culture .................................................. 198
6.2.2 Organisational culture profile by dimensions of culture....................................... 203
6.3 TQM implementation barriers ..................................................................................... 204
6.3.1 Profile of TQM implementation barrier constructs .............................................. 204
6.3.2 TQM implementation barrier constructs/constituent indicators ........................... 206
6.3.2.1 Top management barriers .............................................................................. 206
6.3.2.2 Employee barriers .......................................................................................... 207
6.3.2.3 Customer barriers .......................................................................................... 208
6.3.2.4 Planning barriers ........................................................................................... 209
6.3.2.5 Process management barriers ....................................................................... 209
6.3.2.6 Information management barriers ................................................................. 210
6.4 Impact of organisational culture on TQM implementation barriers ............................ 211
6.4.1 Impact of group culture on TQM implementation barriers .................................. 211
6.4.1.1 Relationship of group culture and top management barrier construct (H1) . 212
6.4.1.2 Relationship of group culture and employee barrier construct (H2) ............ 214
6.4.1.3 Relationship of group culture and customer barrier construct (H3) ............. 218
6.4.1.4 Relationship of group culture and information barrier construct (H4) ........ 220
6.4.2 Impact of developmental culture on TQM implementation barrier constructs..... 222
6.4.2.1 Impact of developmental culture on employee barrier construct (H5) .......... 223
6.4.2.2 Impact of developmental culture on customer barrier construct (H6) .......... 226
6.4.3 Impact of rational culture on TQM implementation barriers ................................ 228
6.4.3.1 Impact of rational culture on top management barrier construct (H7)......... 229
6.4.3.2 Impact of rational culture on employee barrier construct (H8) .................... 231
6.4.3.3 Impact of rational culture on customer barriers (H9) ................................... 234
6.4.4 Impact of hierarchical culture on TQM implementation barriers ......................... 236
6.4.4.1 Impact of hierarchical culture on planning barriers (H10) .......................... 236

xi
6.4.4.2 Impact of hierarchical culture on process management barriers (H11) ....... 237
6.5 Summary of discussion ................................................................................................ 239
Chapter Seven: Conclusion .................................................................................................... 242
7.1 Introduction .................................................................................................................. 242
7.2 Main outcomes of study ............................................................................................... 242
7.3 Limitations of the study ........................................................................................... 243
7.4 Conclusion ............................................................................................................... 245
7.5Contributions of the study ............................................................................................. 249
7.5.1 Specific theoretical and methodological implications .......................................... 249
7.5.2 Specific practical/managerial implications ........................................................... 251
7.6 Directions for future research ...................................................................................... 256
References .............................................................................................................................. 259
Appendix 1Survey Questionnaire .......................................................................................... 288
Appendix 2 SPSS Data file .................................................................................................... 298
Appendix 3 Normality Test ................................................................................................... 310
Appendix 4 AMOS Output CFA ........................................................................................... 316
Appendix 5 AMOS Output SEM ........................................................................................... 324
Appendix 6 Standardized Regression Weight CFA and SEM ............................................... 332
xii
List of Tables
Table 2.1 Definitions of TQM in the literature ........................................................................ 19 Table 2.2 significant TQM factors given in 5 studies .............................................................. 26
Table 2.3 Ideal types of culture used in CVF framework ........................................................ 41 Table 2.4 Profiling previous studies on TQM implementation barriers .................................. 53 Table 2.5List of commonly cited significant barriers extracted from 15 studies .................... 60 Table 2.6 Potential barriers to TQM implementation and underlying dimensions by Ngai and
Cheng (1997) ........................................................................................................................... 64 Table 2.7 List of 32 barriers identified in 5 studies ................................................................. 65 Table 2.8 Categorizing identified TQM implementation barrier indicators into higher order
barriers constructs .................................................................................................................... 68
Table 3.1 Constructs of barriers ............................................................................................. 103
Table 3.2 list of hypotheses ................................................................................................... 104
Table 4.1 Features of the positivistic paradigms, source: Hussey and Hussey (1997) .......... 128
Table 4.2 Features of positivistic/deductive paradigm ......................................................... 129
Table 4.3Sample stratification by industry- target and actual ............................................... 135
Table 4.4: List of 5 barriers indicators suggested by structured interviews .......................... 143 Table 4.5Summary of selected research design elements ...................................................... 150
Table 5.1Categories of respondent organisations in service and manufacturing sector ........ 153
Table 5.2 General demographic profile ................................................................................. 154 Table 5.3 Specific quality program types and their duration ................................................. 156 Table 5.4Overall mean of organisational culture types ......................................................... 157
Table 5.5Mean value of each six dimensions for each of culture type .................................. 158 Table 5.6 Mean value of each culture type by organisation size, type and operation ........... 158
Table 5.7 Overall mean and std. deviation of TQM barrier constructs ................................. 161 Table 5.8 Mean value of each barrier construct by organisation size, type, operation and
TQM duration ........................................................................................................................ 162
Table 5.9Individual barrier results of top management barrier construct .............................. 165 Table 5.10 Individual barrier results of employee barrier construct ...................................... 166 Table 5.11 Individual barrier results of customer barrier construct ....................................... 166 Table 5.12 Individual barrier results of planning barrier construct ....................................... 167 Table 5.13 Individual barrier results of process management barrier construct .................... 167 Table 5.14 Individual barrier results of information barrier construct .................................. 168 Table 5.15 overall fit indices of CFA .................................................................................... 174
Table 5.17Discriminant validity ............................................................................................ 181
Table 5.18 Nomological validity ........................................................................................... 181
Table 5.19 Overall fit indices – hypothesized structural model ............................................ 185 Table 5.20 Comparison of results of CFA and SEM ............................................................. 187 Table 5.21Hypothesis test results .......................................................................................... 188 Table 5.22 Summary of Results of Hypotheses Testing ........................................................ 190

xiii
Table 6.1 Result of hypothesis test related to group culture ................................................. 211
Table 6.2 Result of hypotheses test related to developmental culture .................................. 223 Table 6.3 result of hypothesis test related to rational culture ................................................ 229 Table 6.4 results of hypothesis test related to hierarchical culture ........................................ 236
xiv
List of Figures
Figure 1.1 State of existing literature on core elements of TQM implementation .................... 5
Figure2.1 Process of reviewing literature ................................................................................ 11
Figure 2.2 Competing Values Framework for profiling organisational culture ...................... 42 Figure 2.3 Three-step process for identifying significant TQM implementation barriers ...... 50
Figure 3.1 Conceptual framework and hypothesised relationships ...................................... 103
Figure 4.1 the research ‘onion’ .............................................................................................. 126 Figure 4.2 the process of deduction in positivism paradigm ................................................. 127
Figure 4.3 deductive and inductive approaches ..................................................................... 130
Figure 5.1Flow chart of data analysis process (Source: author) ............................................ 152
Figure 5.2 Graphical display of 10 Construct Measurement Model ..................................... 172 Figure 5.3 Graphical display of 10 construct structural model .............................................. 184 Figure 5.4 Hypothesised structural model of organisational culture and TQM barrier
constructs ............................................................................................................................... 189
Figure 6.1 Mean score of each culture type ........................................................................... 199 Figure 6.2 Results of each culture in four different studies .................................................. 201
Figure 6.3 Score of six dimensions of each type of organisation culture .............................. 203 Figure 6.4 Mean score on TQM implementation barriers ..................................................... 205

xv
List of Abbreviations
TQM Total Quality Management
CVF Competing Values Framework
QM Quality Management
MBNQA Malcolm Baldrige National Quality Award
EFQM European Foundation for Quality Management
ASQ American Society of Quality
NIST National Institute of Standards and Technology
DP Deming Prize
CSFs Critical Success Factors
SPC Statistical Process Control
QC Quality Circles
JIT Just-In-Time
ISO International Organisation for standardisation
OCAI Organisational Culture Assessment Instrument
DOCS Denison Organisational Culture Survey
EDB Economic Development Board
GCC Gulf Cooperation Council
IT Information Technology
PDCA plan, do, check, act
PDSA plan, do, study, act
QAA Quality Assurance Authority
SMEs Small and Medium Enterprises
AMOS Analysis of Moment Structure
SPSS Statistical Package for Social Sciences
CFA Confirmatory Factor Analysis
SEM Structural Equation Modelling
ANOVA Analysis of Variances
M Mean
CR Critical Ratio
CFI Comparative Fit Index
CV Convergent Validity

xvi
DV Discriminant validity
GFI Goodness of Fit Index
ML Maximum Likelihood
RMSEA Root Mean Square Error Approximation
SE Standard Error
Sig. Significant
χ 2 Chi Square
PCA Principal Component Analysis
CA Correspondence Analysis
OC Organisational Culture
BRtm Top management barrier
BRemp Employee barrier
Brim Information barrier
BRpln Planning barrier
BRProc Process barrier
BRCus Customer barrier
Grp Group culture
Dev Developmental culture
Rat Rational culture
Hier Hierarchical culture
p-value Probability
df degrees of freedom
BOF Badness of Fit
RMR Root Mean Square Residual
CFI Comparative Fit Index
RNI Relative Non-Centrality Index
TLI Tucker-Lewis coefficient index
IFI Incremental Fit Index
AVE Average Variance Extracted
SMC Squared Multiple Correlations
F Factor Loadings
CR Critical Ratio
β Beta
SD Standard Deviation
1
Chapter One: Introduction
1.1 Introduction of chapter
This chapter presents the purpose and background of the thesis. The problem
statement is explained and the research questions prompted by the problem statement are
defined. Accordingly, the aim and objectives of the research are then presented. After a brief
overview of the research methodology used in this study, the main academic and practical
contributions of the study are set out. Finally, the organisation of the thesis is discussed.
1.2 Purpose of the study
The main purpose of this study was to develop a better understanding of TQM
implementation through the empirical examination of the relationships between two core
elements of TQM implementation - organisational culture and TQM implementation barriers.
A thorough examination of the literature to date indicates that there is no significant study
that has investigated the impact of organisational culture on TQM implementation barriers.
This study is the first holistic approach that attempts to investigate the relationship and hence
to determine which type of organisational culture is related to which TQM implementation
barrier. Understanding the nature, strength and direction of these relationships can help to
support future TQM implementation attempts by helping organisations to understand which
culture type they might seek to develop that can help to sustain TQM implementation, and
likewise which cultural type may impede TQM implementation. It is expected that future
replication of this study in other organisations with different culture profiles and contexts will
help in developing an improved model of TQM implementation.
1.3 The research background
The increasing effects of globalization and uncertainty in the business world have
played a significant role in prompting business managers and academic researchers to
question and examine how organisational performance can be improved and how any
competitive advantage can be sustained. For performance improvement of organisations,
many tools have been developed by academic researchers and practitioners focusing on
multifaceted aspects of organisations. Mainly, these tools have tended to address one
functional requirement at a time – focused on improving a single aspect or activity, rather
than helping to integrate the spectrum of business activities. For example, the focus of one
2
tool may be to increase the number of trained employees, while another tool may be used to
identify and resolve quality problems. This prompted quality practitioners’ search for an
approach that has the potential to integrate all the improvement tools into a single approach.
A well researched tool among them is TQM which can be defined as a synthesis of the
organisational, technical and cultural components of any company (Vorley and Tickle, 2001).
Many other improvement tools have been developed, but TQM has emerged as a holistic
management model which can help transform the organisation to meet consumer needs and
their intangible expectations through continuous improvement of the quality of goods and
services and the development of integrated business processes across the firm (Prajogo and
McDermott, 2005). These features of TQM can facilitate organisational improvement in
terms of growth, delighting customers and getting ahead of competitors (Irani et al, 2004).
TQM’s history is rich with success stories (Evans and Lindsay, 2001, Krishnan et al.,
1993) but many TQM interventions have also been reported to have failed (Smith et al.,
1994; Wilkinson et al., 1998; Harari, 1993a; Fuchsberg, 1992; Brown, 1993; Jacob, 1993).
Such failures have made some organisations believe that TQM does not deliver according to
its promise and that any investment in TQM would be a risk (Shin et al., 1998; Ackoff, 1993;
Becker, 1993; Bemowski, 1995). Although TQM failure rates reported in the literature are
contradictory, (23% - Kunst and Lemmink, 2000; 7% - Walsh et al. 2002; 41% - Taylor and
Wright, 2003; 14% - Sila, 2007) the rate is arguably not an overriding issue since even a
single failure is not desirable. Therefore it is very critical to seek to ascertain the reasons why
some TQM initiatives still fail (Cândido and Santos, 2008). In this context, previous studies
on TQM implementation have, broadly, revealed two salient findings. First, that TQM is
often not implemented properly and second, that when properly implemented, TQM
undeniably improves performance (Zeitz et al., 1997). Many researchers agree that TQM is a
useful philosophy for management if properly planned and implemented (Dayton, 2001;
Stephens et al, 2005; Wilson and Collier, 2000). Oakland (2001) argues that if TQM is used
properly and is fully integrated into a business, the approach can help any organisation
deliver its goals, targets and strategy. Since the TQM approach has and continues to be used
by world class companies to achieve organisational excellence (Oakland, 2001), previous
research has largely attributed TQM failures to implementation, rather than to TQM theory
and method (Huq, 2005). Hence, it can be argued that TQM implementation is a critical
factor affecting ability of organisations to improve their performance.

3
For comprehensive and effective TQM implementation, several researchers have
recognized the critical role of organisational culture (Chang and Wiebe, 1996; Zeitz et al.,
1997; Dellana and Hauser, 1999; Prajogo and McDermott, 2005; Naor et al., 2008; Zu et al.,
2009) and the importance of understanding TQM implementation barriers (Ngai and Cheng,
1997; Salegna and Fazel, 2000; Sebastianelli and Tamimi, 2003; Huq, 2005; Zeng et al.,
2007; Angell and Corbett, 2009; Amaral and Sousa, 2009; Bhat and Raj, 2009).
Among several other factors attributed as key determinants of effective TQM,
organisational culture is often amongst those listed at the top (Prajogo and McDermott,
2005). It has been argued that in many instances TQM implementation has lacked strategic
focus and has been introduced as a bolt-on to unchanged business culture (Zairi et al., 1994).
McNabb and Sepic (1995) placed extreme importance on the influence of organisational
culture on the effective implementation of TQM. Similarly, in conclusion to their study of
cultural effects on TQM implementation, Sousa-Poza et al. (2001) report that TQM
implementation is complex and has a strong relationship with the organisational culture.
There is broad agreement that culture can greatly influence the understanding, selection,
planning, implementation and monitoring of TQM in a country (Kumar, 2006; Tan et al.,
2003), and that many TQM implementations have failed, preventing organisations from
realizing its potential benefits, because of the ignorance of the cultural factors (Wilkinson et
al., 1998).
The TQM literature is rich in contributions that have sought to identify obstacles or
barriers affecting TQM implementation (Sebastianelli & Tamimi, 2003; Salegna and Fazel,
2000; Amaral and Sousa 2009; Bhat and Raj, 2009; Angell and Corbett, 2009; Rad, 2005).
The main focus of these studies has been to identify the most significant obstacles or barriers
in TQM implementation. According to Taylor and Wright (2003), TQM programmes fail
because of TQM implementation barriers such as lack of senior management commitment,
lack of resources, lack of understanding of TQM, and lack of involvement of employees in
TQM practices. Therefore, the rationale of this study is that removing the barriers will help
the full and comprehensive implementation of TQM.
One of the intrinsic problems with TQM is that it can take considerable time to
establish, gain maturity, and show results (minimum 3-5 years, according to Deming (1986)).
Therefore, it is reasonable to argue that any TQM implementation barrier not identified
before implementation commences will be discovered late (i.e. during implementation) and
after potentially considerable resources and time may have been wasted. When barriers are
4
identified late in the process their negative implications are likely to have already occurred.
For lasting and promising results from TQM implementation, it is desirable that proper
planning takes place before implementation, with knowledge of likely barriers, thus
preventing problems associated with barriers from occurring in the first place - removing the
barriers before TQM implementation process initiates (Oakland, 2004). According to Masters
(1996), it is important for all organisations to understand and avoid these barriers both before
and during TQM implementation. Therefore, this study also attempts to undertake systematic
research on the potential barriers that inhibit the process of TQM development in Bahraini
industries.
1.4 Problem statement
As stated in the previous section, there are many studies on organisational culture and
TQM; and many on barriers to TQM implementation. Despite an extensive search, no studies
have been located in the literature that have investigated the relationships of these sets of
variables – TQM implementation barriers and organisational culture - in order to formulate
guidance for TQM implementation that explicitly considers their impact on each other. These
observations about the existing literature led to the identification of the following critical gap
in the TQM literature in relation to TQM implementation:
Many TQM implementation models and frameworks have been developed but
none of these models have investigated the impact of organisational culture on
TQM implementation barriers. Thus, there is a need to examine these
relationships in order to inform efforts to achieve effective TQM
implementation.
Figure 1.1 illustrates the state of the existing literature regarding examining the
relationship between organisational culture and TQM implementation; and between TQM
implementation barriers and TQM implementation. However, despite their importance, no
study, model or framework is found in literature that has investigated the impact of
organisational culture on TQM implementation barriers.

5
Figure 1.1 State of existing literature on core elements of TQM implementation
This gap in the knowledge base calls for empirically examining the evidence on the
relationships between the two sets of core elements of TQM in order to better understand
their influence towards full and effective TQM implementation. Knowledge of these
relationships will extend present understanding of prevalent barriers and context specific
culture; and will contribute towards developing revised models for TQM implementation in
future research. This research focuses on getting to the root of the issue instead of treating the
symptoms, by finding out what type of supportive culture can either reduce the barriers or
offset the effects of these barriers. It is proposed that by tackling the barriers in real time
through managing organisational culture, organisation will be able to overcome TQM
implementation barriers, eventually enhancing TQM implementation. Therefore, this study
identifies the types of organisational culture and significant TQM implementation barriers
existing in Bahraini industries. A conceptual framework was developed using types of
organisational culture developed by Denison and Spreitzer (1991) and a set of TQM
implementation barriers derived from the literature to examine the relationships between
organisational culture and TQM implementation barriers.
1.5 The context of the study
The context of this thesis is within the sphere of improvement of business culture and
overall economic development of the Kingdom of Bahrain. Recent reviews of Bahrain market
and organisational data have shown that standards of quality; employee skills; the employee
talent pool; and company performance needs considerable improvement (Ernst and Young,
2009). According to Ernst and Young (2009), overall only 13% of the respondents to their
study have implemented QM (Quality Management) in their respective organisations.
TQM implementation
Organizational culture
TQM implementation
barriers
No studies have been located in literature examining the relationship of organizational culture and TQM barriers
(Ngai and Cheng, 1998; Salegna and Fazel, 2000; Sebastianelli and Tamimi, 2003; Huq, 2005; Zeng et. al.2008; Angell and Corbett 2009; Amaral and Sousa, 2009; Bhat and Raj, 2009)
(Chang and Wiebe, 1996; Zeitz et al., 1997; Dellana and Hauser, 1999; Alkhalifa & Aspinwall, 2000; Tan et al., 2003; Prajogo & McDermott, 2005; Kumar, 2006; Naor et al., 2008; Zu et al., 2010)

6
According to this report, the businesses in Bahrain lack a culture of quality, resulting in slow
development. Another study by D&B (2008) has reported that a lack of skilled employees
and training is a key challenge to the economy of Bahrain. Understanding this problem, the
government of Bahrain in its long term strategic plan (Vision 2030) has created policies with
a special emphasis on meeting challenges such as business culture improvement, increasing
government’s promotional and investment strategies and creating easier market access to
enable enterprise growth.
In this regard, the government of Bahrain has started to implement a number of
initiatives, such as setting up a Bahrain Centre of Excellence in Manama in 2008. Under
these initiatives, the government has established three organisations to monitor progress and
development of education, economy, public sector business excellence and small businesses.
The Business Excellence Centre has started to organize workshops, working on themes of
excellence and providing training to business leaders. Economy, education and small
business growth are managed by an Economic Development Board (EDB), a Quality
Assurance Authority (QAA) and by Tamkeen (an Independent Authority for Strategic and
Operational plans) respectively (www.bahrainedb.com, 2009). However, the overall rate of
adoption and demand for QM among SMEs (Small and Medium Enterprises) is low primarily
on account of a lack of awareness among the SMEs on what QM is, how it can be
implemented and what benefits the enterprise could derive from implementing it (Ernst and
Young, 2009).
Hence, it is recognised by the Bahraini government that the business environment and
businesses in Bahrain need extensive quality and cultural improvement (D&B, 2008). The
required improvement is likely to be a long term process but can be supported by appropriate
use of approaches such as TQM (Ernst and Young, 2009). In order to compete with other
countries in the GCC (Gulf Cooperation Council) area and with industrialized economies,
Bahrain needs an understanding of how the TQM approach can be implemented with a high
rate of success. Therefore, this thesis contributes to the provision of such an understanding by
examining the types of organisational culture that would help organisation in the Bahraini
context, to overcome TQM implementation barriers. In doing so, consequently the study
provides the government of Bahrain with a set of recommendations that seek to enhance
effective TQM implementation. In this context, this study will not only close a gap in the
TQM implementation literature but also benefit organisations who have not been able to

7
implement TQM effectively and comprehensively, or who are in the process of planning the
introduction of the TQM approach.
1.6 The research questions
This gap in the TQM literature identified in the section 1.4 raises a number of important
research questions in the research context:
1. What are the types of existing organisational culture in the industries of Bahrain?
2. What are the significant TQM implementation barriers in the industries of Bahrain?
3. What is the relationship between organisational culture and TQM implementation
barriers, based on the culture profile and barriers that exist?
1.7 The aim and objectives of the study
Accordingly, the aim of the study presented in this thesis is to empirically examine
evidence on the impact of cultural characteristics on TQM implementation barriers to better
understand their influence towards the comprehensive and effective implementation of TQM.
The setting for the study is Bahrain, and the key objectives of the study are:
- to identify the types of organisational culture existing in Bahraini companies,
- to identify significant TQM implementation barriers in Bahraini companies,
- to investigate what type of organisational culture is associated with what type of barrier,
and
- to establish which types of culture could/should be strengthened or developed to support
TQM implementation by the firms seeking to adopt a TQM approach
1.8 Research methodology
Many factors can influence TQM and its implementation but the major relationship to
be tested here is between culture of the organisations and TQM implementation barriers.
Therefore, based on analysis of literature and drawing from earlier research in the field of
organisational culture and TQM implementation barriers, this study proposes a framework
and a set of hypotheses which are the central proposition to be tested in this study. The
methodology adopted in this study, broadly comprised of the following four elements:
- selection of the research approach and its major elements;
8
- deriving a sample and designing a data collection instrument ;
- reliability and validity testing of the research instrument that had been designed; and
- selecting and applying the appropriate data analyses tools and methods
The primary research used a quantitative research method to collect empirical data
from respondents in companies operating in service and manufacturing industries of Bahrain.
This kind of research can be defined as a deductive research approach with a positivism
stance. The research approach relates more to a positivism stance as it takes the proposed
theoretical concept from theory building to testing the theory using primary and secondary
data (Saunders et al., 2007). Data was collected from a sample of service and manufacturing
companies in Bahrain ensuring that the sample closely represented the population of
businesses operating in Bahrain and could provide the primary data needed to examine the
phenomena under inquiry. The researcher used non-probability sampling based on the
judgement, experience and convenience for both types of data collection through
questionnaires and structured interviews. A non-probability sample is a sampling method in
which there is no way of specifying the probability of each unit’s inclusion in the sample
(Neuman, 2003). According to the nature of this research non-probability samples are
particularly relevant and suitable, as discussed in section 4.3. A total of 540 target
respondents were selected from the population. The criteria for selecting the respondents
from the target population in this survey were based on relevance, qualification and
experience. Managers, directors, quality managers, operation managers and policy
implementers within the firms were the target respondents. The survey instrument
(questionnaire) was developed based on an extensive literature review. The variables
identified were used to construct appropriate measures. The respondents of the survey were
asked to indicate their perceived level of agreement, or the extent to which a barrier/culture
type applies to their organisation. Likert scales were used for each set of measures. The
assessment of the measurement model included the determination of construct
unidimensionality, convergent validity and discriminant validity.
The external validity of the questionnaire was ensured through pilot testing.
Structured interviews were conducted with twelve selected prominent quality practitioners
and academics. Thus, feedback on the proposed research instrument was secured from field
experts, quality professionals, TQM managers and TQM employees who were similar to the
target population of the main survey (Fink and Kosecoff, 1998; Nunnally and Bernstein,
1994). They were asked to comment on the clarity, content, structure and validity of the
questionnaire. Using their feedback, the instrument was revised and further refined. The pilot
9
respondents provided useful information on designing the questionnaire and recommended
adding seven indicators of TQM implementation barriers specific to Bahraini industries.
After discussion with academics and other quality professionals, five of these indicators of
TQM barriers were selected and added to the survey instrument to make it more
comprehensive. The survey was administered online and data was collected from 325
respondents, representing a response rate of 60%.
Data validity tests such as missing data, outlier examination, linearity test, normality
of data, reliability analysis tests and descriptive statistics were performed (Tabachnick and
Fidell, 2007; Hair et al., 2010). Descriptive statistics were used to analyse profiles of
organisational culture and TQM implementation barriers; and to examine various
demographics of the respondents. Analysis of moment structure (AMOS) 16.0 versions
software was used to perform both the confirmatory factor analysis and the structural model
testing (Hair et al., 2010).
1.9 Contributions of the study
This research contributes significantly in both academic and practical dimensions.
One of the theoretical contributions of this thesis is identifying a gap in literature regarding
research on effective implementation of TQM. In order to address this gap, this study
attempts to investigate the relationships between organisational culture and TQM
implementation barriers to determine which type of organisational culture is related to which
TQM implementation barrier. This study enhances the existing knowledge on TQM and its
implementation as it is the first study, both in a western and non-western context that has
explicitly examined the influence of organisational culture on TQM implementation barriers.
Thus, the findings of this research provide for a deeper and richer understanding of the
factors affecting the implementation of TQM. Given that the theoretical model was based on
literature developed mainly in western contexts (such as the U.S., Europe and Japan), the test
of the theoretical model in the context of Bahraini firms also provided a good opportunity for
the researcher to evaluate the applicability of culture/TQM barrier theory in a different, non-
western national context. Finally, this study has also developed and initially validated a scale
to measure TQM barriers based on the synthesis of prior work, identified significant barriers
to TQM implementation from literature by a systematic methodology and validated them
through structured interviews thus providing a much more robust typology of TQM barriers.
10
The survey instrument measures the distinct dimensions of both culture and TQM
implementation barriers which will allow practitioners to assess the readiness of the
organisation's culture to embrace a formal TQM approach. The research will benefit
organisations who have not been able to implement TQM comprehensively, or who are in the
process of planning the introduction of the TQM approach. More specifically, the framework
and survey instrument can be used in any organisational environment in any country or
region. Therefore, it is envisaged that this study would help to enhance the success rate of
TQM implementation on large scale.
1.10 Thesis organisation
This thesis is structured in seven chapters.
- Chapter 1 Introduction - has outlined the thesis including its purpose, background,
context, problem definition, the aim and objectives, research questions, research
methodology, and the contribution of the study.
- Chapter 2 Literature Review - provides the review of the academic literature and
analysis in order to develop the theoretical background of the research.
- Chapter 3 Conceptual Framework - integrates the theory on organisational culture and
on TQM implementation barriers to provide a conceptual framework for TQM
implementation and develop hypotheses for testing.
- Chapter 4 Methodology - explains the research methodology and research design
adopted for the study.
- Chapter 5 Data analysis and Finding – presents the results from the empirical survey
based research.
- Chapter 6 Discussion - discusses the main findings from the results of the primary
data analysis.
- Chapter 7 Conclusion – presents the salient conclusions derived from the empirical
findings, sets out the contributions of the study and its limitations and recommends
directions for future research.

11
Chapter Two: Literature Review
2.1 Introduction
This chapter comprises a review of the literature on TQM in the context of this study.
It provides a broad understanding of the concept of TQM and examination of TQM as a tool
for organisational excellence. The chapter examines organisational culture in the context of
TQM and the Competing Values Framework (CVF) that seeks to identify the typical
organisational culture conducive to TQM implementation. The chapter also includes a critical
review of the factors hampering the implementation of TQM, which in turn leads to the
identification of the major barriers associated with TQM implementation. This is followed by
a review and examination of the impact of underlying cultural characteristics of organisations
on TQM implementation barriers, in order to map out their influence towards the effective
implementation of TQM. The broad process of reviewing the literature is shown in figure 2.1.
Figure2.1 Process of reviewing literature
This literature review was carried out using academic and peer reviewed research
articles, industry reports, company reports, trade publications and regulatory and certification
agencies’ data, and relevant textbooks on the subject (where necessary).
The structure of the literature review broadly follows the structure of the research
questions presented in section 1.5. The review is divided and organised into a conceptual and
thematic structure comprising five main sections. Section (2.2) gives an overview of TQM
(Total Quality Management) that includes a brief look at the origins of TQM, various
definitions of TQM, core constructs and principles underlying TQM and quality award
frameworks based on TQM. Section 2.3 includes the scope of TQM and its implementation
and section 2.4 examines the bespoke nature of TQM and its implementation. Core elements
Searching for literature (from quality academic
journals)
Sorting and prioritizing the
retrieved literature
Analytical reading of papers
Evaluative reading of papers
Comparison across studies
Organizing the content

12
of TQM implementation are discussed in section 2.5. This examination sets the scene for the
remainder of the chapter, in which the TQM literature is examined from more specific
viewpoints.
Section 2.6 examines the organisational culture and the role of organisational culture
in TQM implementation. It includes findings of examination of what organisational culture
is, how many types of organisational culture there are, and what specific dimensions of
culture each type comprises. Consequently, the review helps to identify a suitable framework
(Competing Values Framework) for determining the types of organisational culture that exist
in any industry.
Section 2.7 reviews observed causes and consequences of obstacles to the effective
introduction of TQM focusing on significant TQM implementation barriers and the role of
TQM implementation barriers in the implementation process of TQM. In this connection, the
section reviews the research streams on literature dealing with significant TQM
implementation barriers and the impact of these barriers on TQM implementation. This
review provides a systematically derived set of significant TQM implementation barriers
along with their hypothetical significance.
Section 2.8 presents findings of an examination of the relationships between
organisational culture and TQM implementation barriers. Findings relating to the strength
and direction of relationships between organisational culture and TQM implementation
barriers identified in previous research are presented. The section also reviews why the
knowledge of culture types is important for TQM implementation and examines the impact of
each type of culture on TQM implementation barriers. In this context, research streams for
both variables (culture and barriers) are explored in order to establish relationship between
them to help in developing and testing hypotheses. The final section (2.9) of the literature
review presents a brief summary of the chapter.
2.2 An Overview of Total Quality Management and its Implementation
This section defines and explains the TQM concept from different perspectives and
reviews various definitions specified by TQM researchers and practitioners. Commonalities
and differences in conceptualization are presented. This review commences with a brief look
at the origins of TQM, various definitions of TQM, core constructs and principles underlying

13
TQM and quality award frameworks based on TQM. The scope of TQM and its
implementation, and the bespoke nature of TQM implementation are also discussed.
2.2.1 Origins of the TQM concept
The origin of the TQM concept dates back to Feigenbaum in 1957 and later developed
by the works of Ishikawa (1976), Crosby (1979), Juran (1980), Deming (1982), Taguchi
(1990) and Oakland (1993). These theorists are regarded as the key founders of TQM
philosophy therefore the origin of TQM concept evolves mostly from their work. In order to
understand TQM content and its process, study has selected the seminal works of four gurus
(Crosby, 1979, 1996; Deming, 1982, 1986; Ishikawa, 1985; and Juran, 1951, 1962, 1974,
1988, 1989, 1992) who had a considerable influence on the development of TQM in
organisations throughout the world. Here the approaches of arguably the top four gurus of
TQM - Crosby, Deming, Ishikawa and Juran are discussed:
Crosby’s concept of TQM
During the late 1970s and into the 1980s North American manufacturers were losing
market share to Japanese firms, largely due to the superiority of quality of the Japanese
products. Crosby's response to the quality crisis was the principle of "doing it right the first
time" (DIRTFT). He included four major principles in this theory:
- quality is conformance to requirements
- the management system is prevention
- the performance standard is zero defects
- the measurement system is the cost of quality
Crosby's audience was primarily top management; he sold his approach to them and
stressed increasing profitability through quality improvement. His argument was that higher
quality reduces costs and raises profits. Crosby's programme of 14 steps (Crosby, 1979)
focuses on how to change the organisation using quality and what specific action plans are
required for its implementation. Crosby is acknowledged as great motivator of senior
management in helping them to understand how to get the improvement process started. His
approach is generally regarded as simple and easy to follow.
Deming’s concept of TQM
The theoretical essence of the Deming approach to TQM concerns the creation of an
organisational system that fosters cooperation and learning for facilitating the implementation
14
of process management practices, which, in turn, leads to continuous improvement of
processes, products, and services as well as to employee fulfilment, both of which are critical
to customer satisfaction, and ultimately, to firm survival (Anderson et al., 1994a). Deming
(1986) stressed the responsibilities of top management to take the lead in changing processes
and systems. Deming (1986) also emphasized the importance of identification and
measurement of customer requirements, creation of supplier partnership, use of functional
teams to identify and solve quality problems, enhancement of employee skills, participation
of employees, and pursuit of continuous improvement.
Deming's approach is highly statistical and he believed that every employee should be
trained in statistical quality techniques. A 14-point approach (Deming 1986) summarizes his
management philosophy for improving quality and changing the organisation's culture.
Deming's argument was that quality, through a reduction in statistical variation, improves
productivity and competitive position. He defined quality in terms of quality of design,
quality of conformance and quality of the sales and service function. Deming's main
argument was that by improving quality it is possible to increase productivity and this will
improve organisational competitiveness. Deming's other main contributions were the PDCA
(plan, do, check, act) or the PDSA (plan, do, study, act) cycle of continuous improvement,
and pinpointing of the seven 'deadly diseases' (lack of consistency of purpose; emphasis on
short term profits; evaluation of performance, merit rating or annual review, mobility of
management; running a company on visible figures alone; excessive medical costs and
excessive cost of liability). Deming expected managers to develop a partnership with those at
the operating level of the business and to mange quality with direct statistical measures
without cost of quality measures. Deming's approach to change the organisational culture is
closely aligned with Japanese practices.
Ishikawa’s concept of TQM
According to Dale et al. (2007), Ishikawa has mainly contributed in three areas: 1)
Simplification and use of seven basic quality control tools, 2) The company wide quality
movement, and 3) quality circles. Ishikawa argued that quality management extends beyond
the product and encompasses after-sales service, the quality of management, the quality of
individuals and the firm itself (Ishikawa, 1985). He claimed that the success of a firm is
highly dependent on treating quality improvement as a never-ending quest. A commitment to
continuous improvement can ensure that people will never stop learning. He advocated
employee participation as the key to the effective implementation of TQM. Quality circles, he
15
believed, are an important vehicle to achieve this (Ishikawa, 1985). Like all other gurus he
emphasized the importance of education, stating that quality begins and ends with it. He has
been associated with the development and advocacy of universal education in the seven QC
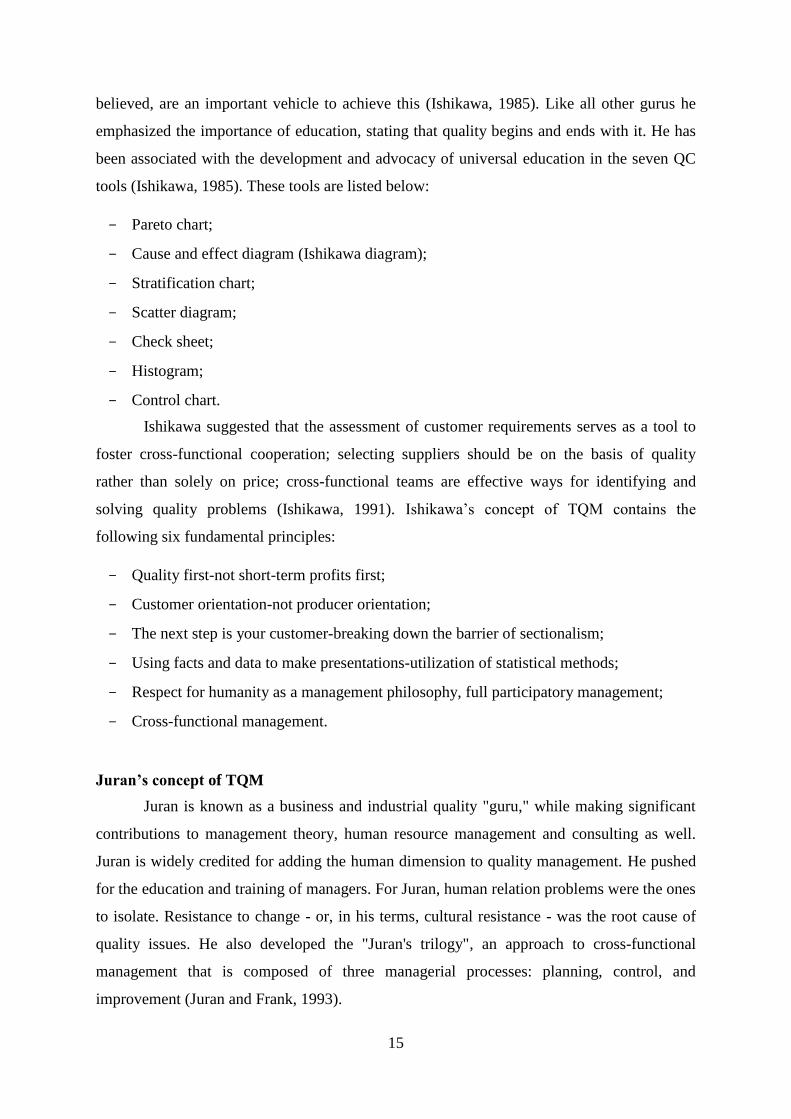
tools (Ishikawa, 1985). These tools are listed below:
- Pareto chart;
- Cause and effect diagram (Ishikawa diagram);
- Stratification chart;
- Scatter diagram;
- Check sheet;
- Histogram;
- Control chart.
Ishikawa suggested that the assessment of customer requirements serves as a tool to
foster cross-functional cooperation; selecting suppliers should be on the basis of quality
rather than solely on price; cross-functional teams are effective ways for identifying and
solving quality problems (Ishikawa, 1991). Ishikawa’s concept of TQM contains the
following six fundamental principles:
- Quality first-not short-term profits first;
- Customer orientation-not producer orientation;
- The next step is your customer-breaking down the barrier of sectionalism;
- Using facts and data to make presentations-utilization of statistical methods;
- Respect for humanity as a management philosophy, full participatory management;
- Cross-functional management.
Juran’s concept of TQM
Juran is known as a business and industrial quality "guru," while making significant
contributions to management theory, human resource management and consulting as well.
Juran is widely credited for adding the human dimension to quality management. He pushed
for the education and training of managers. For Juran, human relation problems were the ones
to isolate. Resistance to change - or, in his terms, cultural resistance - was the root cause of
quality issues. He also developed the "Juran's trilogy", an approach to cross-functional
management that is composed of three managerial processes: planning, control, and
improvement (Juran and Frank, 1993).

16
According to Juran, TQM is the system of activities directed at achieving delighted
customers, empowered employees, higher revenues, and lower costs (Juran and Frank, 1993).
Juran believed that main quality problems are due to management rather than workers. He
also emphasized the importance of top management commitment and empowerment,
participation, recognition and rewards. According to Juran, it is very important to understand
customer needs. Identifying customer needs requires more vigorous analysis and
understanding to ensure the product meets customers’ needs and is fit for its intended use, not
just meeting product specifications. A 10 point plan summarizes his approach. Juran's
approach is more consistent with American management practices. He took the existing
management culture as starting point and built a quality improvement process from that
baseline.
It is evident that each of the three quality gurus has his own distinctive approach.
Nevertheless, the principles and practices of TQM proposed by these quality gurus provide a
good understanding of the concept of TQM. Their insights offer a solid foundation for
conducting this study. Although their approaches to TQM are not totally the same, they do
share some common points which can be summarized as follows:
- It is management’s responsibility to provide commitment, leadership, empowerment,
encouragement, and the appropriate support to technical and human processes.
- It is imperative that management foster the participation of the employees in quality
improvement, and develops a quality culture by changing perception and attitudes toward
quality.
- The importance of employee education and training is emphasized in changing
employees’ beliefs, behaviour, and attitudes; enhancing employees’ abilities in carrying
out their duties.
- Employees should be recognized and rewarded for their quality improvement efforts.
- It is very important to control the processes and improve quality system and product
design. The emphasis is on prevention of product defects, not inspection after the event.
- Quality is a systematic firm-wide activity from suppliers to customers. All functional
activities, such as marketing, design, engineering, purchasing, manufacturing, inspection,
shipping, accounting, installation and service, should be involved in quality improvement
efforts.
17
Each of the approaches given above has its strengths and weaknesses and they are all
proven packages. Nevertheless, none of the experts has all the answers to the problems facing
organisations. A number of writers (e.g. Bendell, 1989; Fine, 1985; Gerald, 1984) have
compared and contrasted the approaches of the experts and their commentaries are helpful in
assessing the value of each approach. These experts can be characterized by the main focus of
their approach as follows:
- Crosby: company-wide motivation
- Deming: statistical process control
- Ishikawa: focus on continuous improvement by involving everyone
- Juran: project management
All the authors agree to the purpose of quality to delight customers and reduce the
cost by process management. It is unanimously agreed by the authors that TQM will not work
without the commitment of top management. It is also acknowledged by these authors that
employees have to be trained and educated about quality concepts, quality tools and
techniques. Similarly, establishing and using teams is recommended by these authors to solve
quality problems.
There are other areas where there is partial agreement among the authors. For
example, Crosby (1996) does not support the idea to use the statistical tools for analysis to
improve control but other three authors stress to use statistical tools. Similarly, Ishikawa and
Deming value the focus on long-term plans, but Crosby doesn’t give it any precedence, and
Juran only stresses the long-range quality programmes. Ishikawa and Juran emphasise
product design, but Crosby and Deming don’t. All other authors stress on planning except
Crosby. Juran covers all aspects of planning, Deming emphasises on action planning, and
Ishikawa has a focus on feedback and control. Moreover, the most important concept of
modern day TQM, such as empowerment of employee is not given due importance by most
of these authors except Juran (1995) who brings up empowerment as major element of
quality movement. Despite, these differences, there is complete convergence in their views
on the core elements of TQM.
Fine (1985) concludes that the teachings of Crosby, Deming. Ishikawa and Juran have four
points in common:
- The top management support and participation
- The workforce training and education

18
- Planning and involvement
- Continuous quality improvement programmes
These prescriptions of Crosby, Deming, Ishikawa and Juran are certainly reasonable
foundation for any organisation introducing TQM. The argument for this approach is that
each of these experts has a well-founded and rational package that provides a kind of logical
framework to streamline the processes.
2.2.2 Definition of Total Quality Management
The global marketplace has become very competitive because of more informed
customers who are demanding superior quality of products and services. Therefore, quality
and its management and the associated continuous improvement are looked upon by many
organisations as the means by which they can survive in increasingly aggressive markets and
maintain a competitive edge over their rivals (Dale et al, 2007). As a result of the efforts
made by organisations to respond to these marketplace demands the quality of products,
services and processes has increased considerably during the last three decades (Oakland,
2003). Such an improvement is obviously the result of many quality improvement tools
developed by researchers and practitioners but quality practitioners were in search of an
approach that has the potential to integrate all the improvement tools in one solution. In this
context, TQM has emerged as a holistic management model because the concept of TQM is
much broader than the traditional quality concepts. It encompasses not only product, service
and process improvement but those relating to costs and productivity and to people
involvement and development (Dale et al., (2007). TQM has been arguably the most
significant approach to the management of organisations and their operations and its
improvement and has provided many tools and techniques (Capon et al., 1995; Curkovic et
al., 2000; Dean and Bowen, 1994; Evans and Lindsay, 1999; Juran, 1995; Ahire et al., 1996;
Flynn et al., 1994; Samson and Terziovski, 1999; Saraph et al., 1989). Oakland (2003) asserts
that TQM helps in the management of operational activities and in business process
improvement in two ways: Firstly, increasing effectiveness of the organisation by improving
the processes that result profit, and secondly, by reducing defects and eliminating extra costs
to products and services thus decreasing overall costs and creating extra capital for the
development of organisational resources such as human capital.
Much research has been conducted about TQM. However, it is evident from the
literature that different researchers have adopted different definitions and frameworks based
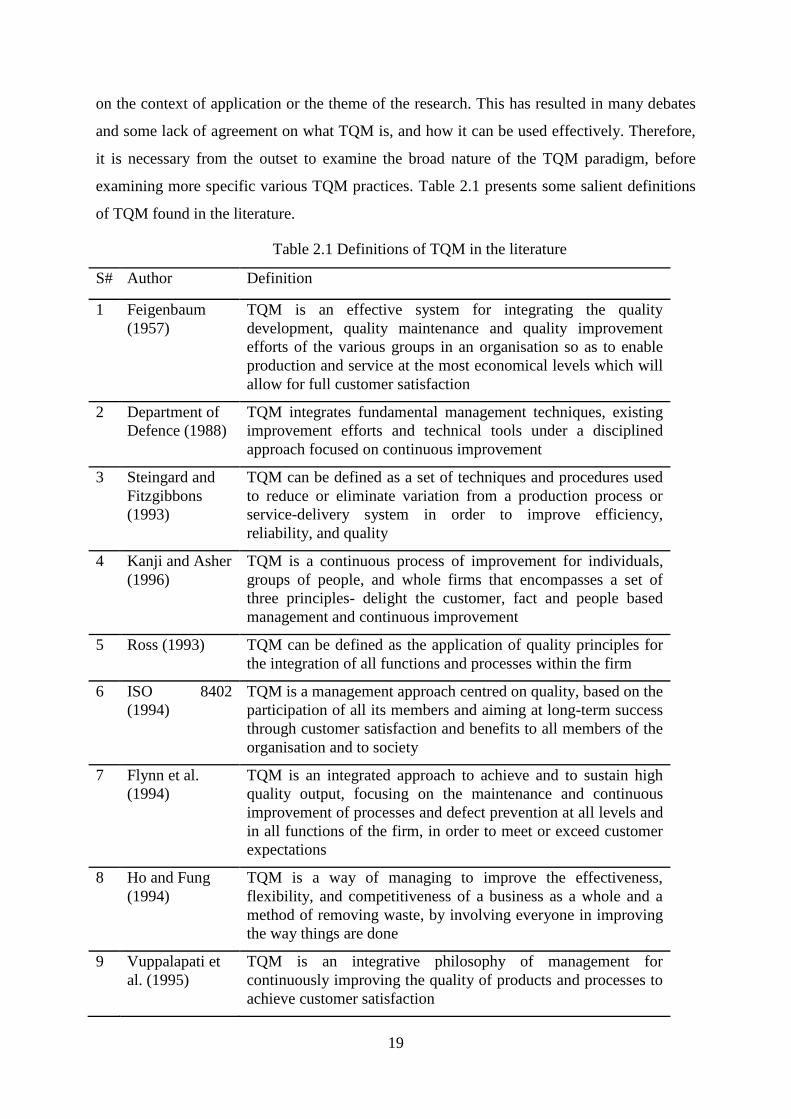
19
on the context of application or the theme of the research. This has resulted in many debates
and some lack of agreement on what TQM is, and how it can be used effectively. Therefore,
it is necessary from the outset to examine the broad nature of the TQM paradigm, before
examining more specific various TQM practices. Table 2.1 presents some salient definitions
of TQM found in the literature.
Table 2.1 Definitions of TQM in the literature
S# Author Definition
1 Feigenbaum
(1957)
TQM is an effective system for integrating the quality
development, quality maintenance and quality improvement
efforts of the various groups in an organisation so as to enable
production and service at the most economical levels which will
allow for full customer satisfaction
2 Department of
Defence (1988)
TQM integrates fundamental management techniques, existing
improvement efforts and technical tools under a disciplined
approach focused on continuous improvement
3 Steingard and
Fitzgibbons
(1993)
TQM can be defined as a set of techniques and procedures used
to reduce or eliminate variation from a production process or
service-delivery system in order to improve efficiency,
reliability, and quality
4 Kanji and Asher
(1996)
TQM is a continuous process of improvement for individuals,
groups of people, and whole firms that encompasses a set of
three principles- delight the customer, fact and people based
management and continuous improvement
5 Ross (1993) TQM can be defined as the application of quality principles for
the integration of all functions and processes within the firm
6 ISO 8402
(1994)
TQM is a management approach centred on quality, based on the
participation of all its members and aiming at long-term success
through customer satisfaction and benefits to all members of the
organisation and to society
7 Flynn et al.
(1994)
TQM is an integrated approach to achieve and to sustain high
quality output, focusing on the maintenance and continuous
improvement of processes and defect prevention at all levels and
in all functions of the firm, in order to meet or exceed customer
expectations
8 Ho and Fung
(1994)
TQM is a way of managing to improve the effectiveness,
flexibility, and competitiveness of a business as a whole and a
method of removing waste, by involving everyone in improving
the way things are done
9 Vuppalapati et
al. (1995)
TQM is an integrative philosophy of management for
continuously improving the quality of products and processes to
achieve customer satisfaction
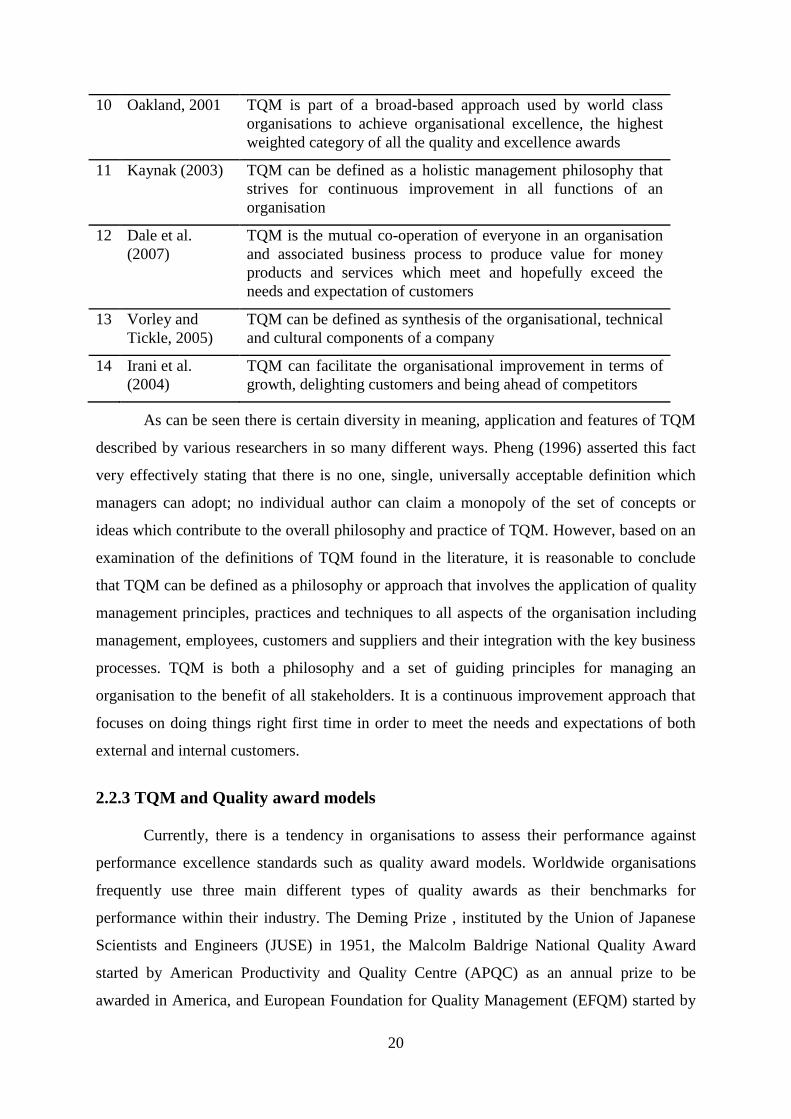
20
10 Oakland, 2001 TQM is part of a broad-based approach used by world class
organisations to achieve organisational excellence, the highest
weighted category of all the quality and excellence awards
11 Kaynak (2003) TQM can be defined as a holistic management philosophy that
strives for continuous improvement in all functions of an
organisation
12 Dale et al.
(2007)
TQM is the mutual co-operation of everyone in an organisation
and associated business process to produce value for money
products and services which meet and hopefully exceed the
needs and expectation of customers
13 Vorley and
Tickle, 2005)
TQM can be defined as synthesis of the organisational, technical
and cultural components of a company
14 Irani et al.
(2004)
TQM can facilitate the organisational improvement in terms of
growth, delighting customers and being ahead of competitors
As can be seen there is certain diversity in meaning, application and features of TQM
described by various researchers in so many different ways. Pheng (1996) asserted this fact
very effectively stating that there is no one, single, universally acceptable definition which
managers can adopt; no individual author can claim a monopoly of the set of concepts or
ideas which contribute to the overall philosophy and practice of TQM. However, based on an
examination of the definitions of TQM found in the literature, it is reasonable to conclude
that TQM can be defined as a philosophy or approach that involves the application of quality
management principles, practices and techniques to all aspects of the organisation including
management, employees, customers and suppliers and their integration with the key business
processes. TQM is both a philosophy and a set of guiding principles for managing an
organisation to the benefit of all stakeholders. It is a continuous improvement approach that
focuses on doing things right first time in order to meet the needs and expectations of both
external and internal customers.
2.2.3 TQM and Quality award models
Currently, there is a tendency in organisations to assess their performance against
performance excellence standards such as quality award models. Worldwide organisations
frequently use three main different types of quality awards as their benchmarks for
performance within their industry. The Deming Prize , instituted by the Union of Japanese
Scientists and Engineers (JUSE) in 1951, the Malcolm Baldrige National Quality Award
started by American Productivity and Quality Centre (APQC) as an annual prize to be
awarded in America, and European Foundation for Quality Management (EFQM) started by

21
14 Western European countries in 1988. Based on the TQM concept two other significant
tools, Six Sigma (used for zero defect quality production systems) and Human Sigma (to
improve quality at the employee - customer service interface) have also been developed.
Black and Porter (1996) assert that literature studies have often identified key
differences between these prescriptions, and no single model has established itself as a basis
for Total Quality Management theory. Authors further argue that there is not only an absence
of a practical model that could be used by organisations in developing their TQM systems,
but also a lack of easily applied methods for identifying areas for improvement in current
TQM programmes, resulting in a trend in organisations to use TQM frameworks based upon
the assessment criteria from key quality awards such as the Deming Prize in Japan, the
Malcolm Baldrige National Quality Award in the U.S. and the European Quality Award.
Sunday and Liberty (1992) imply that most of organisations use the criteria to identify which
companies utilised the best quality management practices. The large number of requests for
copies of the Baldrige Award guidelines indicates the popularity of this award among
organisations world wide, making the Baldrige Award the best established framework for
TQM practice (http://www.nist.gov/baldrige/). However, the European Quality Award
assessment model, introduced in 1992, is also gaining approval of organisations wishing to
use the criteria for self-assessment of their TQM practice.
The criteria of awards encapsulate a comprehensive and holistic management model
covering its various activities, practices and process and provide the mechanism for
qualifying an organisation’s current state of TQM development by means of points score.
Since the establishment of these awards there has been an explosion in published materials
describing them and comparing their characteristics. Van der Wiele et al (1996) reports that
the five most important reasons for organisations starting self assessment were to:
- Find opportunities for improvement
- Create a focus on a TQM based on either the EFQM or MBNQA model criteria.
- Direct the improvement process
- Provide new motivation for the improvement process
- Manage the business.
This self assessment provides the information on improvement and helps management
to understand how business operates. More importantly, it helps to analyze affect of actions
on results. However it should be kept in mind that what has not been implemented cannot be

22
assessed. Therefore, organisations must understand the potential gap that can exist between
where they currently stand in relation to TQM and the model of the award being used in order
to make comparisons.
Major quality award models
As mentioned in the beginning of this section, there are a number of internationally
recognized award models, the main ones being the Deming Application Prize in Japan, the
MBNQA in America and the EFQM excellence model in Europe. Although there are some
differences between the models, they have a number of common elements and themes. Most
of the national and regional awards are more or less duplicates of the international models,
with some modifications to suit issues which are of national or local interest. The broad aims
of these awards are described as follows (Ghobadian and Woo, 1996):-
- Increase awareness of TQM because of its important contribution to superior
competitiveness;
- Encourage systematic self-assessment against established criteria and market awareness
simultaneously;
- Stimulate sharing and dissemination of information on successfully deployed quality
strategies and on benefits derived from implementing these strategies;
- Promote understanding of the requirements for the attainment of quality excellence and
effective deployment of TQM;
- Encourage firms to introduce a continuous improvement process.
Each award model is based on a perceived model of TQM. The award models do not
focus solely on either product or service perfection or traditional quality management
methods, but consider a wide range of management activities, behaviour and processes that
influence the quality of the final offerings (Ghobadian and Woo, 1996). They provide a
useful audit framework against which firms can evaluate their TQM implementation
practices, seek improvement opportunities, and achieve the end results.
The Deming Prize
The Deming Prize was established by the Board of Directors of the Japanese Union of
Scientists and Engineers in 1951. Its main purpose is to spread the quality gospel by
recognizing performance improvements flowing from the successful implementation of firm-
wide quality control based on statistical quality control techniques (Ghobadian and Woo,
1996). The Deming Prize proved an effective instrument for spreading TQM philosophy
throughout the Japanese industries.
23
There are ten primary elements in the Deming Application Prize (1996), as well as a
checklist that is used to evaluate the performance. This checklist emphasizes the importance
of top management’s active participation in quality management activities and understanding
of the main requirements of quality improvement programmes. It also provides senior
executives with a list of what they need to do.
The European Model for TQM
The European Quality Award was officially launched in 1991. The primary purpose
of the award is to support, encourage, and recognize the development of effective TQM by
European firms. The EFQM Excellence Model (www.efqm.org) is used as a basis for self-
assessment, an exercise in which an organisation grades itself against a given criteria.
The EFQM’s latest, 2010, model consists of 9 criteria that help to understand and
analyse the cause and effect relationships between what organisations do and the results they
achieve. The model of the European Quality Award is divided into two parts, enablers and
results. Five of these criteria are 'Enablers' (Leadership; Policy and Strategy; People;
Partnerships and Resources; Processes) and four are 'Results' (Customer Results; People
Results; Society Results; and Key Performance Results). The 'Enabler' criteria cover what an
organisation does and how it does it. The 'Results' criteria cover what an organisation
achieves (www.efqm.org).
Each of the 9 criteria has a definition, which explains the high level meaning of that
criterion. To develop the high level meaning further, each criterion is supported by a number
of criterion parts. The RADAR logic helps organisations to assess and score the level of each
sub-criterion. This exercise helps organisations to identify current strengths and areas for
improvement against strategic goals. This gap analysis then facilitates definition and
prioritisation of improvement plans to achieve sustainable growth and enhanced performance.
Improving the Enablers in turn leads to improved Results.
The Malcolm Baldrige National Quality Award
The purpose of this award is to promote an understanding of the requirements for
performance excellence and competitiveness, improvements and to promote the sharing of
information on successful performance strategies (NIST, 2008 -www.nist.gov). The criteria
for performance excellence are available in business, education and health care divisions. The
programme and award are managed by NIST, an agency of the US Department of Commerce.
The American Society of Quality (ASQ) administers the MBNQA under contract to National
24
Institute of Standards and Technology (NIST). The model framework can be used to assess
firms’ current quality management practices, benchmark performance against key
competitors and world class standards, and improve relations with suppliers and customers.
The Malcolm Baldrige National Quality Award model framework (2008) includes –
Leadership, Strategic Planning, Customer and Market Focus, Measurement, Analysis, and
Knowledge Management, Workforce Focus, Process Management, and Results.
The MBNQA, EFQM and Deming prize are most widely recognised award models.
These three quality award models provide a universal framework for evaluating aspects of
TQM practices in a firm. They also provide a framework for identifying a range of intangible
and tangible processes that influence the firm’s TQM implementation and the end results.
Although each award has its own unique categories and emphasis, there are some common
areas:-
- Each award model has two parts: One is the enablers (TQM implementation) and the
other is the overall business results. TQM implementation makes overall business results
happen.
- All three award models emphasize the importance of leadership, human resources
management, employee participation, employee education and training, process
management, strategy and policy, information, supplier quality management, and
customer focus.
- The three quality award models provide firms with a means to measure their position
against a set of universal criteria, and to identify their strengths and weaknesses in the
areas of quality management practices and business results.
- These models provide an insight into the practical way of applying TQM, and give a
better understanding of the concept of TQM.
2.2.4 Core constructs and principles underlying TQM
Much of the past research on quality management has focused on core constructs and
TQM principles (Saraph, et al., 1989; Parker and Porter, 1993; Tamimi and Gershon, 1995;
Black and Porter, 1996; Ahire et al, 1996; Pannirselvam et al., 1998; Dow et al, 1999, Wilson
and Collier, 2000; Kaynak, 2003). Hackman and Wageman (1995) reviewed TQM definitions
given by three quality gurus namely Deming, Juran, and Ishikawa. They identified six
interventions as the core of TQM: 1) explicit identification and measurement of customer
25
wants and needs, 2) creation of supplier partnership, 3) use of functional teams to identify
and solve quality problems, 4) use of scientific methods to monitor performance, 5) identify
points of high leverage for performance improvement and 6) use process management
heuristics to enhance team effectiveness.
Major principles and associated practices covering the complete TQM requirements
have also been advanced by Ho and Fung (1994), Mann and Kehoe (1994), Powell (1995),
Black and Porter (1996) and Choi and Eboch (1998). These can be listed as top management
commitment, leadership involvement, customer satisfaction, employee management, training,
empowerment and development of staff, process and quality control, error prevention, team
work, stakeholders relationships management, corporate culture, suppliers co-operation and
system adoption capabilities. In the TQM literature, these principles are frequently called
critical success factors (CSFs).
Perhaps the most remarkable study ever done in relation to the importance of TQM
factors was by Black and Porter (1996) in identifying critical TQM factors by self-assessment
framework of Baldrige Award to guide quality managers in the development of TQM.
Although the 10 factors identified by this empirical analysis do not fit into a convenient
taxonomy of the type suggested by the Baldrige framework, the concepts remain consistent
with established TQM theory. They were: corporate quality culture, strategic quality
management, teamwork structure, external interface management, supplier partnership,
operational quality planning, quality improvement measurement system, communication of
improvement information, people and customer management, and customer satisfaction
orientation.
This study was also reiterated by Dayton (2001) in US with 1000 members of the
American Society of Quality. Author made a comparison of TQM critical success factors
between UK versus USA firms to identify the current critical success factors in TQM systems
in US corporations by empirically measuring the quality professional’s perception of which
TQM critical factors were the most important. The critical factors identified in the Black and
Porter (1996) European study were rated as important TQM critical factors by the US quality
professionals.
Schniederjans et al. (2006) made a comparative analysis of Baldrige Criteria to
determine if Baldrige criteria constructs are perceived to be of equal importance to quality
managers in the countries of India, Mexico, and the US. The study revealed a number of

26
similarities and differences in the perceptions of the value of nine different quality criteria
constructs. The results revealed that there are significant differences in quality management
practices when India is compared to either Mexico or the United States, but Mexico and the
United States have similar assessments, agreements, perceptions, or opinions on quality.
Saraph et al. (1989) used the concept of developing TQM constructs and this trend
was continued by subsequent researchers. Each researcher used their own constructs and
added or deleted previous ones, leading to inconsistency in defining the content of TQM
constructs. This situation comes out to be a complication while addressing real TQM content.
Since, this thesis research was not aimed at developing or validating another set of TQM
constructs, the author decided to select small set of a model representative from the previous
empirical studies on TQM to act as guidance in subsequent stages of the research
development.
Five studies are identified from literature offering a simple, reliable and valid
methodology for scientifically examining how TQM systems can be modelled over time.
These studies have demonstrated how empirical work provide new insights into Total Quality
Management and identify significant TQM factors for implementation to achieve
performance excellence. The selected studies and identified significant TQM factors are
listed below in table 2.2.
Table 2.2 significant TQM factors given in 5 studies
S# Author Significant TQM factors
1 Ho and Fung,
1994
Leadership, commitment, total customer satisfaction, continuous
improvement, total involvement, training and education, ownership,
reward and recognition, error prevention, and cooperation and
teamwork are ten TQM elements
2 Mann and
Kehoe, 1994
Ten key elements of TQM are identified as supplier improvement,
process control and improvement, internal customer focus,
measurement and reporting, leadership, quality system,
participation, recognition, education and training, and external
customer focus
3 Powell, 1995 Elements of TQM framework: Executive commitment, adopting the
TQM philosophy, closer to customers, closer to suppliers,
benchmarking, training, open organisation, employee empowerment,
zero-defects mentality, flexible manufacturing, process
improvement, and measurement
4 Black and
Porter, 1996
TQM has ten critical factors: People and customer management,
supplier partnership, communication of improvement information,
customer satisfaction orientation, external interface management,
27
strategic quality management, team-work structure for
improvement, operational quality planning, quality improvement
measurement systems, and corporate quality culture
5 Choi and
Eboch, 1998
Management of process quality, human resources management,
strategic quality planning, and information and analysis are the
constructs of TQM implementation
2.3 Scope of TQM and its implementation
The TQM literature suggests two common issues/problems associated with the
implementation of TQM: 1) TQM implementation barriers (Ngai and Cheng, 1997; Salegna
and Fazel, 2000; Sebastianelli and Tamimi, 2003; Huq, 2005; Bhat and Raj, 2009), and 2)
unfavourable organisational culture (Dellana and Hauser, 1999; Prajogo and McDermott,
2005; Zu et al., 2010). For example, in order to implement the TQM principle of employee
focus, managers need to address employee barriers. In other words, to implement the
employee focus principle of TQM, organisations should also consider the attitudes, values
and behaviour of employees in relation to quality objectives because managers need to
understand which behaviours of employees would have a desirable impact on offsetting the
implementation barriers (Chang and Wiebe, 1996; Zeitz et al., 1997; Dellana and Hauser,
1999). Identification and resolution of these two issues is considered to be critical in the
implementation process (Mann and Kehoe, 1998; Newall and Dale, 1991).
According to Lundquist (1995), TQM implementation is based on three core
elements: 1) the TQM philosophy that comprises a set of TQM principles; 2) the
organisational culture - the antecedent that influences TQM implementation; and 3) TQM
implementation barriers – that hamper effective implementation of TQM. In this respect,
accepting the proposition that TQM has valid content, the other two key elements that play a
role in effective TQM implementation are organisational culture and TQM implementation
barriers. In their efforts to implement TQM, organisations have extensively used
implementation models, latest standards, strategies of implementation, tools and techniques,
but there is much less evidence that organisations have specifically tried to minimize (or
eliminate) the TQM implementations barriers. The relationships between what organisations
do (enablers) and what they achieve (results) is the measure of TQM success but often
organizations can’t do what they want because of barriers in implementing these enablers.
Therefore, it is logical to argue that if organisations can minimise the barriers to TQM
implementation, there is a greater likelihood that the implementation of enablers can advance
successfully. Therefore, exploring the impact of organisational culture on TQM
28
implementation barriers is logical because the elimination (or minimization) of TQM
implementation barriers should lead to more effective TQM implementation (Huq, 2005;
Zeng et al., 2008).Therefore, unlike the other studies in this domain, the focus of this study is
on TQM implementation barriers instead of enablers.
In his study, Ross (1993) defined TQM implementation as the integration of all
functions and processes within an organisation to achieve continuous improvement of the
quality of goods and services with the ultimate goal being customer satisfaction. Jung et al.
(2008), stated that TQM implementation encompasses and facilitates all functional areas,
processes, and systems of business, including design, development, production, distribution,
and customer support.
Ahire et al. (1996) made a landmark study in the development, validation and
implementation of TQM constructs. Their work points to an underlying theory consisting of
interrelated determinants of effective TQM implementation. They conclude that various
quality management practices act in synergy to affect product quality. For example, top
management commitment appears to influence product quality through improved customer
focus and effective human resource mobilization. Techniques such as SPC and benchmarking
require effective usage by motivated and quality trained employees.
Still a number of other factors affect the eventual outcome of effective TQM
implementation. Oakland (2004) stated that organisations don’t achieve the desired
performance level from TQM implementation mainly because of two reasons: 1) the
programme is not introduced and implemented effectively and 2) during post-implementation
the effects are allowed to fade away over time. He pointed out that other factors such as over
enthusiasm; uncoupled efforts; lack of commitment, organisational resources, and
capabilities; and false underlying assumptions at the time of planning can increase resistance
and barriers to the effective implementation. Employee resistance due to various reasons can
be the biggest resistance to the introduction and implementation of the TQM, as pointed out
by Dale et al. (2007).
2.4 The bespoke nature of TQM and its implementation
All over the world, organisations operate in differing work environments and
contexts, with diverse organisational cultures and differing business requirements. Quality
initiatives that suit one organisation may not work well for another. Naturally therefore, some
TQM practices might not be as applicable to some companies as to others. Such disparity is
29
likely to exist among companies, countries and regions, mainly due to organisational and
national cultures. Flynn and Saladin (2005) made a notable contribution in this respect while
examining the relevance of theoretical TQM factors across national cultures. Their findings
indicate that national culture plays a strong role in the effectiveness of the Baldrige
constructs. Their findings also indicate the need for countries to develop awards and quality
initiatives tailored to their national cultures.
When planning TQM implementation, a prevalent question that strikes organisations
is “what TQM practices to implement”. Internationally, quality managers have differences in
perception of the importance of TQM practices (Rao et el., 1997, Solis et al., 1998, Black and
Porter, 1996). Because the managers of each company are knowledgeable about their
strengths and weaknesses, they are in the best position to select what is right or wrong for
them in terms of the quality activities and practices to implement in their organisations.
Accordingly, a set of TQM factors based upon the perceptions of actual industrial
practitioners is arguably more valid than a `standard` prescriptive set of activities and
practices (Black and Porter, 1996).
According to Oakland (2004), the company leaders and quality managers of many
industries may not be specifically familiar with TQM but may be practicing TQM principles
routinely without even knowing it. Therefore, any TQM programme in any organisation
should be validated by the leaders of the organisation. For this purpose, an appreciation of the
perceived importance of TQM factors by managers at every level is required. Further more,
the managers should be familiar with the recognized best practices in a TQM programme,
and allowed in an informed manner to choose what they feel right for them. As such, their
preference in implementation would be based on their practical experience in addition to their
knowledge of the TQM theory or any TQM framework.
According to Soltani et al. (2005), there is a great deal of confusion about what TQM
actually comprises, and each writer’s version reflects their management background. Soltani
et al.(2005), further argue that such variations in TQM practice are also replicated differently
in different organisations. Thus, although, it is likely that core TQM principles will be present
in one form or another during implementation, complementary practices will differ from
organisation to organisation. Therefore, it is important to consider TQM implementation from
the perspective of each organisation having different TQM and organisational culture
profiles. Each organisation should follow individual implementation strategies that fit its
business needs (Ghobadian and Gallear, 2001). Organisations need to develop their TQM

30
initiatives tailored to their organisational and national cultures and business environment
(Oakland, 2003).
An equally relevant argument regarding the bespoke nature of TQM implementation
was made by Ghobadian and Gallear (2001). They undertook an empirical examination and
proposed a generic model by developing a non-prescriptive model of TQM implementation
within which practitioners and researchers can place other evidence in order to enhance their
understanding of the complexities. According to Ghobadian and Gallear (2001), organisations
have different contingencies in terms of their internal and external environments and thus, the
details of implementation, like activities and tactics, may differ substantially.
Shin et al. (1998) also concluded that implementation should be unique to each
company. They argued that the success of TQM is a function of many variables (both
controllable and uncontrollable), and many of them are unique to the company situation.
Therefore, they concluded that each company should tailor its approach to exploit its unique
strengths and focus on its particular weaknesses. As cited by Gallear and Ghobadian (2004), a
number of researchers and authors have noted that for all the attention TQM has received,
there appears to be an apparent neglect of the design issue (Glover, 1993; Tolchinsky and
Ranney (1994); Mann and Kehoe (1995). That is to say, there appears to have been little
research attention devoted to the development of empirically grounded and practical
diagnostic tools that can provide guidance to the TQM implementation designers in their
endeavours to appropriately customise their organisation’s TQM implementation efforts
(Gallear and Ghobadian, 2004).
The arguments put forward in this section support the proposition that organisations
should use a rational approach of identifying areas of improvement, identifying existing
organisational culture, understanding significant TQM implementation barriers, and dealing
with them on a priority basis, in order to help to save effort and money during the TQM
implementation.
2.5 Core elements of TQM implementation
It has been repeatedly argued that the most problematic aspect associated with TQM
is its implementation (Dale et. al, 2004; Nwabueze, 2001). Although TQM’s success rate is
not as high as might be desired, evidence in the literature clearly indicates that many
organisations have used the TQM approach successfully (Evans and Lindsay, 2001, Krishnan

31
et al., 1993; Dayton, 2001; Stephens et al, 2005; Wilson and Collier, 2000; Oakland, 2004). This
evidence supports the proposition that TQM can and does work and that the failures of TQM
in some organisations can’t be subjectively linked to deficiencies in the principles of TQM.
Hence, there is no need to revisit or re-establish the key principles of TQM as many scholars
have already addressed these principles. This study focuses only on implementation issues
that have not been fully explored, but are believed to be very critical. Therefore, based on the
assumption that TQM principles are valid, TQM failures can be associated with other core
factors.
As mentioned earlier, according to Lundquist (1995), TQM implementation is based
on three core elements: 1) the TQM philosophy that comprises a set of TQM principles; 2)
the organisational culture - the antecedent that influences TQM implementation; and 3) TQM
implementation barriers – that hamper effective implementation of TQM. In this respect,
accepting the assertion that TQM has valid practices, the other two key elements that play a
role in effective TQM implementation are organisational culture which may or may not
support TQM implementation and TQM implementation barriers that can restrict the pace
and comprehensiveness of effective implementation of TQM. Lundquist’s (1995) argument
is supported by several researchers who have recognized the critical role of organisational
culture for effective TQM implementation (Chang and Wiebe, 1996; Zeitz et al., 1997;
Dellana and Hauser, 1999; Prajogo and McDermott, 2005; Naor et al., 2008; Zu et al., 2009)
and the importance of understanding TQM implementation barriers (Ngai and Cheng, 1997;
Salegna and Fazel, 2000; Sebastianelli and Tamimi, 2003; Huq, 2005; Zeng et. al.2008;
Angell and Corbett 2009; Amaral and Sousa, 2009; Bhat and Raj, 2009). The research on
both of these key elements in the existing literature is abundant, however it is also clear that
to date these two sub-fields have not fully converged, and that the impact of organisational
culture on TQM implementation barriers has not yet been adequately examined in the
literature.
The next two main sections examine these two key elements in turn. Section 2.6
defines organisational culture and explores how previous studies have defined the role of
culture on TQM implementation and how these studies have identified and measured types of
organisational culture that generally exist in organisations. Furthermore, the section explores
each type of culture in the context of TQM implementation and hence examines how culture
is compatible with quality goals of organisations. The subsequent section (2.7) then identifies
significant TQM implementation barriers from previous studies. Section 2.8 then examines

32
what type of culture is associated with what barrier, and hence what broadly, is the impact of
each culture type on TQM implementation barriers as evidenced from the literature that is
present, but fragmented, on this important issue.
2.6 Culture and TQM
Although culture and TQM have different origins, recently both fields have converged
with the idea that in order to achieve excellence and quality, organisations have to change or
work with culture (Lewis, 1996a). Zeitz et al. (1997) strongly argued that organisational
culture and TQM practices are closely related to each other. Powell (1995) promoted the
importance of cultural aspects of TQM and argued that TQM practices have to be
implemented within a suitable environment (i.e. culture). There are many studies in the
literature that deal with culture in order to achieve TQM (Saraph and Sabetian, 1993; van
Donk and Sanders, 1993; Sinclair and Collins, 1994; Smith et al., 1994).
In this context, Van Donk and Sanders (1993) conclude that one of the basic reasons
for much of the delay in TQM implementation is that top managers and external consultants
are insufficiently aware of the basic issues and values which support the daily practices in the
organisation, in other words, organisational culture. Most of the authors who explicitly
address TQM and culture see organisational culture as a variable which can be affected by
internal and external stimuli and which may be consciously managed by organisations
themselves (Lewis, 1996a).
2.6.1 Organisational culture
The role of organisational culture in improving competitiveness and increasing
productivity and profits has urged top managers in many organisations to explore ways of
managing and changing organisational culture (Cameron and Freeman, 1991). As a result
there has been an abundance of research on organisational culture and its associated
disciplines, bringing forth diverse definitions of organisational culture and its relevance to
other organisational parameters (Chang and Wiebe, 1996; Zeitz et al., 1997; Dellana and
Hauser, 1999; Prajogo and McDermott, 2005; Naor et al., 2008; Zu et al., 2010). Although
there are many definitions of culture in the literature, most of these definitions point to
organisational culture as comprising commonly held attitudes, value and beliefs of
organisation members (Gallear and Ghobadian,2004). For example, according to Schein
33
(1985), organisational culture can be defined as the general pattern of mindsets, beliefs and
values members of the organisation share in common, and which shape the behaviours,
practices and other artefacts of the organisation which are easily observable. Similarly,
Munter (1993) defined culture as the dominant and continuing values, attitudes and
behaviours of a group; and Martin (1985) defined it as commonly held attitudes, values, and
beliefs. However, according to Eagleton (2000), different disciplines define organisational
culture differently. This fact is further explained by Maull et al. (2001) (cited by Gallear and
Ghobadian, 2004) who identified four views on culture in the organisational culture literature
- a belief system, a learned entity, a strategy and mental programming.
From a broader perspective, organisational culture was defined by Jaeger (1986) as a
common set of ideas shared by group members of what their fellows know, believe, and
mean. By practice, such ideas are transformed into the behaviour of an organisation’s
members which is built on “commonly held attitudes, values, and beliefs” (Martin, 1985;
Schein, 1985; Munter, 1993). Therefore, the behaviour and its artefacts of organisation
members are shaped by these patterns of values and ideas (Zammuto and Krakower, 1991).
Such day-to-day behaviour of members in the organisation is governed by a core set of
assumptions, understandings, and implicit rules that reflect organisational culture (Deal and
Kennedy, 1982). Hence, organisational culture is also broadly considered to reflect the
behaviour of members of the organisation (Chang and Wiebe, 1996; Zeitz et al., 1997;
Dellana and Hauser, 1999; Prajogo and McDermott, 2005; Naor et al., 2008; Zu et al., 2010),
and it is the organisation’s culture that helps to shape and determine the behaviour of the
members and practices within that organisation (Al-khalifa and Aspinwall, 2000). The same
argument was argued by Gallear and Ghobadian (2004), asserting that some scholars view
culture as ‘shared values’ (attitudes, values, and beliefs), a second group view it as a ‘way of
working’ (behaviour) and a third group view it as a combination of ‘shared values’ and ‘way
of working’ (behaviour based on attitudes, values, and beliefs). They concluded that from a
TQM implementation perspective, the view of the third group appears more appropriate as
the ‘shared values’ of a group would in turn, influence its ‘way of working’.
Organisational culture is a system of shared meanings that differentiate one
organisation from another (Schein, 2005). It is an explanatory variable that can make a
distinction between any two organisations (Sathe, 1985). Not only does it vary from
organisation to organisation, it also varies from place to place and region to region because
there are nationality influenced differences in work values, beliefs and orientations of

34
organisations across different countries (Hofstede, 1991, 2001; Inglehart et al., 1998;
Trompenaars, 1994; Black and Mendenhall, 1989). Work values, beliefs and orientations of
the branches of a multinational company like IBM, for example, are different in different
countries because of the influence of the national culture on its employees (Hofstede, 2001;
Hall, 1990; Harris and Moran, 1996; Rosseau, 1990). Therefore, Schwartz (1994) and
Hofstede (1991) strongly argue that the cultural values of each organisation need to be
specifically identified, and that reliance on reported values and beliefs from, for example, a
parent company in one region may not be a reliable measure of the culture of a subsidiary in
another region.
The TQM literature supports the proposition that a change in culture is necessary in
order to make the organisational change permanent (Gallear and Ghobadian 2004, Saraph and
Sabetian, 1993; Sinclair and Collins, 1994; Kim et al., 1995; Huq and Martin, 2000; Maull et
al., 2004). In the TQM implementation process, “hard” aspects such as tools, techniques, and
systems can’t be implemented unless “softer” behavioural and cultural aspects of TQM are
favourable (Prajogo and McDermott, 2005). This favourable culture has been labelled a
‘TQM culture’ (Kumar, 2006). Therefore, a TQM culture is a culture conducive to TQM
implementation and can be developed by using appropriate channels (Kim et al., 1995; Tata
and Prasad, 1998, Thompson, 1998, Gallear and Ghobadian 2004,).
A`TQM culture` can be considered to be one which uses teams, promotes pride in
workmanship, drives out fear, allows participative management, promotes leadership in place
of supervision and promotes long term orientation among the members of the organisation
(Deming, 1993; Al-Khalifa and Aspinwall, 2000; Saha and Hardie, 2005). For TQM to take
root successfully in the long term, it must have a positive influence not only on employees’
behaviour, but also on their attitudes and values (Ghobadian and Gallear, 2001). Typical
cultures that are considered in the literature as suitable for implementing TQM are those
related to a flexible, people-oriented style. Such practices as leadership commitment,
employee involvement and empowerment, teamwork, customer focus, and continuous
improvement are the reflection of people-centred and flexible cultures, or will be best
implemented where such cultures prevail (Tata and Prasad, 1998). The study by Westbrook
and Utley (1995) provides further support for this argument. They found that creating culture
where employees are valued and empowered leads to effective TQM implementation.
The arguments presented above support the preposition that identifying and
understanding the organisational culture is necessary before TQM implementation as well as

35
during implementation, as there is an indication of a positive relationship in the literature
stating that an appropriate culture is vital to the success of TQM (McNabb and Sepic, 1995;
Sousa-Poza et al, 2001).
2.6.2 The Role of organisational culture in TQM implementation
The founders of TQM and many other researchers have described TQM as a universal
philosophy that can fit anywhere (Dale et al., 2007; Oakland, 2003). However, another group
of researchers argues that national culture, business environment and organisational
behaviour have a great influence on effective TQM implementation (Abraham et al., 1999;
Adebanjo and Kehoe, 1998; Ho et al., 1999; Zeitz et al., 1997; Dellana and Hauser, 1999;
Prajogo and McDermott, 2005; Zu et al., 2009). These authors strongly emphasize that the
effective implementation of TQM requires effective change in an organisation’s culture.
Although these researchers have greatly emphasized the impact of culture on TQM
implementation, relatively little effort is evident that has explored the intensity and nature of
this impact.
Among several factors which have been attributed as key determinants of TQM
success, organisational culture is often among those listed at the top (Prajogo and
McDermott, 2005). Many TQM implementations have failed, preventing companies from
realizing its potential benefits because of ignorance of the cultural factors (Becker, 1993;
Dale and Cooper, 1992; Oakland, 1995; Thomas, 1995; Van Donk and Sanders, 1993;
Wilkinson et al., 1998). Corporate culture has been frequently blamed for TQM-
implementation failures (Utley et al., 1997; Bowen and Lawler, 1992). McNabb and Sepic
(1995) place extreme importance on the influence of corporate culture on the effective
implementation of TQM. In their conclusion of a study on cultural effects on TQM
implementation, Sousa-Poza et al., (2001) reported that TQM implementation is a complex
programme that has a strong relationship with the organisation's corporate culture.
Furthermore, the literature indicates that culture influences the understanding of TQM in a
country and it also affects the operationalisation of TQM in a country (Kumar, 2006; Tan et
al., 2003). In his ground breaking research, Powell (1995) argued that for real success, TQM
practices need to be implemented within a suitable environment (i.e. culture).
The few studies that have attempted to examine the TQM-culture relationship, such as
those by Chang and Wiebe (1996), Zeitz et al. (1997) and Dellana and Hauser (1999) always
place organisational culture as the antecedent of TQM practices. As argued by many other

36
researchers (Maull et al., 2001; McNabb and Sepic, 1995; Westbrook and Utley, 1995),
organisational culture tends to determine more the results of TQM implementation rather than
the TQM implementation bringing about cultural change. These arguments infer that an
appropriate strategy for TQM implementation is one in which TQM needs to be moulded to
the organisation's culture before any attempts are made to re-shape the organisation culture to
fit TQM (Klein et al., 1995). Thus, although TQM may need profound cultural change, a firm
cannot expect to change the culture all at once. Rather culture changes as a result of doing the
right things over time (Oakland, 2003)
Moreover, according to Cameron (2004), moving toward one particular type of
culture does not mean that other culture types should be abandoned or ignored, it means only
that special emphasis must be placed on certain factors if the culture change is to be
successful. However, there are potentially many trade-offs in deploying strategies for cultural
change, such as abandoning some characteristics of the existing culture, preserving some
characteristics of the existing culture, and adopting some attributes of other types of culture
(Cameron and Quinn, 1999).
2.6.3 Measuring organisational culture
Measuring culture has presented a challenge to organisational scholars and change
agents (Dellana and Hausser, 1997). According to Chatman and Jehn (1994) to establish a
robust set of culture dimensions that can characterize organisational cultures is a challenge
for researchers, because no single instrument provides a valid measure of a sufficiently large
set of generic cultural dimensions. A big challenge in most organisations is whether they
know what their culture is and whether it is the right culture to support their strategy. In order
to identify the type of culture in organisations, a range of methods and instruments have been
designed to describe and assess organisational culture. In this context, Wallach (1983)
developed a set of cultural dimensions based upon a synthesis of other major organisational
culture indices; an Organisational Culture Profile Scale was developed by O’Reilly et al.
(1991); the Competing Values Framework (CVF) was developed by Quinn and Rohrbaugh
(1983); and the Organisational Value Congruence Scale was developed by Enz (1986). Some
of the instruments that appear to have good validity to assess organisational cultures are
presented as follows:
The Quality Improvement Implementation Survey was developed by Shortell et al. (2000)
to examine the impact of culture (and of TQM) on endpoints of care for coronary artery

37
bypass graft surgery patients. The dimensions in this culture scale are almost the same as
the CVF (discussed below) with some terms modified - organisational character,
management style, cohesion, prioritization of goals, and rewards - resulting in four
different culture types (group, developmental, rational and hierarchical). Respondents
divide 100 points between these 20 states to measure the dominant culture profile. The
validity of instrument is unknown but has high face validity. Internal consistency for one
of the scales was 0.79. The survey is simple and quick to complete.
The Organisational Culture Inventory was initially developed by Cooke and Lafferty
(1987) and later improved and used by Thomas et al. (1990); Seago (1997); and Ingersoll
et al. (2000). It measures shared norms and expectations that guide thinking and behavior
of group members, resulting in 12 thinking styles of individuals within a group:
humanistic-helpful, affiliative, approval, conventional, dependent, avoidance,
oppositional, power, competitive, competence/perfectionalist, achievement, and self-
actualization (Scott et al. 2003). Analysis of these 12 styles results in three factors -
people/security culture, satisfaction culture and task/security culture (Scott et al. 2003).
The Survey has an inventory of 120 items measured on a 5-point Likert scale. Internal
consistency of items is 0.67-0.92 and convergent and discriminant validity has been
established. The instrument has good face validity and is widely used with graphic
illustration of results. It has been used in wide variety of different settings and has strong
psychometric underpinning.
MacKenzie's Culture Questionnaire developed by MacKenzie (1995) consists of 12
cultural dimensions - employee commitment, attitudes to and belief about innovation,
attitudes to change, style of conflict resolution, management style, confidence in
leadership, openness and trust, teamwork and cooperation, action orientation, human
resource orientation, consumer orientation and organisational direction. In the 76 item
survey, respondents tick each statement which they feel is broadly true of their
organisation. The origin of the measurement items is unclear and scientific properties are
unknown, but the survey is simple to complete.
The Survey of Organisational Culture was developed by Tucker et al. (1990). It describes
culture in terms of 13 dimensions: orientation to customers, orientation to employees,
congruence amongst stakeholders, impact of mission, managerial depth/maturity, decision
making/autonomy, communication/openness, human scale, incentive/motivation,
cooperation versus competition, organisational congruence, performance under pressure,
theory S/theory T. It measures 55 items on a 5-point scale. It has good internal reliability,

38
but median alpha scores for 14 scales of 0.62- 0.9 (Tucker et al., 1990). Detailed
qualitative work was conducted as part of its development and it has been used in the
public and private sector. To date it appears to have only used in U.S. and mostly used on
senior leaders and managers, rather than on all levels of workforce.
The Corporate Culture Questionnaire was developed by Walker et al. (1996). It has four
principal domains: performance, human resources, decision-making, and relationships. It
has a variation of 69 to 126 items measured on 5-point Likert-type scale and is used
widely as a management consulting tool (Walker et al., 1996). The internal reliability of
the scale is 0.72 - 0.89, with detailed factor analysis performed. This comprehensive
instrument was systematically developed from a review of previous instruments.
The Organisational Culture Survey was developed by Glaser, et al. (1987). It addresses
six empirical factors: teamwork and conflict, climate and morale, information flow,
involvement, supervision, meetings and measures 31 items on 5-point scale. In this
instrument, the Cronbach's alpha value items is 0.82 - 0.91, with extensive reliability
testing and comprehensive process of development.
The Competing Values Framework, developed by Cameron and Freeman (1991);
Gerowitz et al. (1996) and Gerowitz (1998) has four key dimensions of staff climate,
leadership style, bonding systems, and prioritization of goals. Assessment results in four
different culture types, described as: clan, adhocracy, hierarchy, and market types. Each
organisation usually has more than one of these types. It has a 16 item scale with the
description of dominant characteristics of each dimension of culture. Respondents divide
100 points between these states depending on how similar each scenario is to its own
organisation. It has high face validity, strong theoretical basis, assesses both congruence
and strength of culture and also simple and quick to complete. Originally it was
developed for use in educational organisations.
In the context of the above discussion of various models, it was proposed that the
criteria for selecting a model for measuring organisational culture as part of this research
study should be:
Does the instrument measure all the dimensions of culture?
Whether instrument has been tested for validity and reliability?
Whether the instrument has been used in TQM context?
Consistent with Denison and Spreitzer (1991), this research employed Quinn and
Rohrbaugh’s (1983) approach of the Competing Values Framework to describe and measure

39
organisational cultures. The competing values framework (CVF) is one of the models that
predominantly meet these criteria as explained below:
Does the instrument measure all the dimensions of culture?
The competing values framework was initially developed by Quinn and Rohrbaugh
(1983) to measure organisational effectiveness. The framework focuses on competing
tensions and conflicts inherent in any human system. Primary emphasis is placed on the
conflict between stability and change and the conflict between internal organisation and
external environment (Denison and Spreitzer, 1991). By focusing on the inherent tensions of
organisational life, the model allows for the conceptualization of both paradoxical and linear
phenomena, and for analysis of both transformation and equilibrium (Denison and Spreitzer,
1991).
The CVF has proven to be a useful framework for assessing and profiling the cultures
of organizations because it helps identify the underlying cultural characteristics that exist in
organizations. CVF has four orientations (control vs. autonomy and internal vs. external) in
four quadrants representing four culture types. Each culture type further consists of six
commonly accepted dimensions (organizational character; leadership demonstration;
management style; binding force; organizational emphasis; and success criteria). Therefore,
the structure of CVF is manageable and has broad implications.
Whether instrument has been tested for validity and reliability?
Since its introduction, the CVF has proved itself as an effective tool for mapping out
complex management issues. The robust approach of competing values has frequently been
used across many applications and has proved a reliable tool as a measurement instrument for
organisational culture. Perceiving the usefulness of this framework, academic researchers
have used it to examine many organisational aspects such as model organisation forms
(Quinn and Hall, 1993); organisation life cycles (Quinn and Cameron, 1983); leadership roles
(Quinn, 1994); organisational climate (Zammuto and Krakower, 1991); human resource
policies (Yeung, et al, 1991; Giek and Lees, 1993); strategy (Bluedorn and Lundgren, 1993);
organisational change (Hooijberg and Petrock, 1993); and management information systems
(Cooper and Quinn, 1993). Quinn and Kimberly (1984) extended the framework to examine
organisational culture for the first time and it was very successful in measuring organisational
culture as it enabled variations in culture to be identified and profiling of culture in categories
according to its major characteristics. Another landmark study on measuring organisational

40
culture was undertaken by Quinn (1988) which presented what is arguably the most
comprehensive form of this framework. Many studies on organisational culture e.g. (Denison,
1990; and Cameron and Freeman, 1991) were developed based on this study. Nevertheless,
the framework suggested by Denison and Speitzer (1991) is better established, more widely
accepted and has been more extensively used than the others. It is important to note that the
cultural factors in other studies and those in Denison and Speitzers (1991) study are very
similar in content (mainly with differences only in terminology). More recently, many other
studies have used CVF framework for profiling organizational culture (Chang and Wiebe,
1996; Zeitz et al., 1997; Dellana and Hauser, 1999; Alkhalifa and Aspinwall, 2000, 2001;
Prajogo and McDermott, 2005; Naor et al., 2008; Zu et al., 2009). These high impact studies
have tested the CVF instrument for validity and reliability.
Whether the instrument has been used in TQM context?
This study is examining relationship between culture and TQM barrier, therefore
another concern of author about measuring the cultural profile was to find studies that relate
culture and TQM because the methodology adopted in such studies would be more relevant
and applicable in conducting this study. Although in the past, research on organisational
culture has been perceived to be closely linked with qualitative and ethnographic methods,
the use of quantitative measures in the research of organisational culture gathered a
momentum in the early 1990s when the CVF framework based on quantitative measures was
repeatedly used by researchers. This alternate approach, based on a common set of
quantitative measures, has been applied across a variety of organisational settings by Yeung
et al. (1991); Zammuto and Krakower (1991); and Quinn and Spreitzer (1991). Each of these
three studies recognized that the use of a quantitative methodology in identifying
organisational culture was reliable, and represents an integrated set of studies that are
grounded in the Competing Values Framework. Therefore, the CVF framework based on
quantitative measures was frequently used by researchers to measure relationships of culture
and TQM. The studies by Chang and Wiebe (1996), Zeitz et al. (1997), Dellana and Hauser
(1999), Prajogo and McDermott (2005); Stock et al. (2007), Naor et al., (2008); and Zu et al.
(2009) are profiling both culture and TQM to examine their relationships. Therefore, the
relevance of CVF in TQM context is also substantiated by these studies.
Above discussion implies that CVF is empirically validated in cross-cultural research
and a large number of empirical studies have established the reliability and validity of the
CVF. In addition, CVF is also used with GCC and Asian samples (e.g., Alkhalifa and
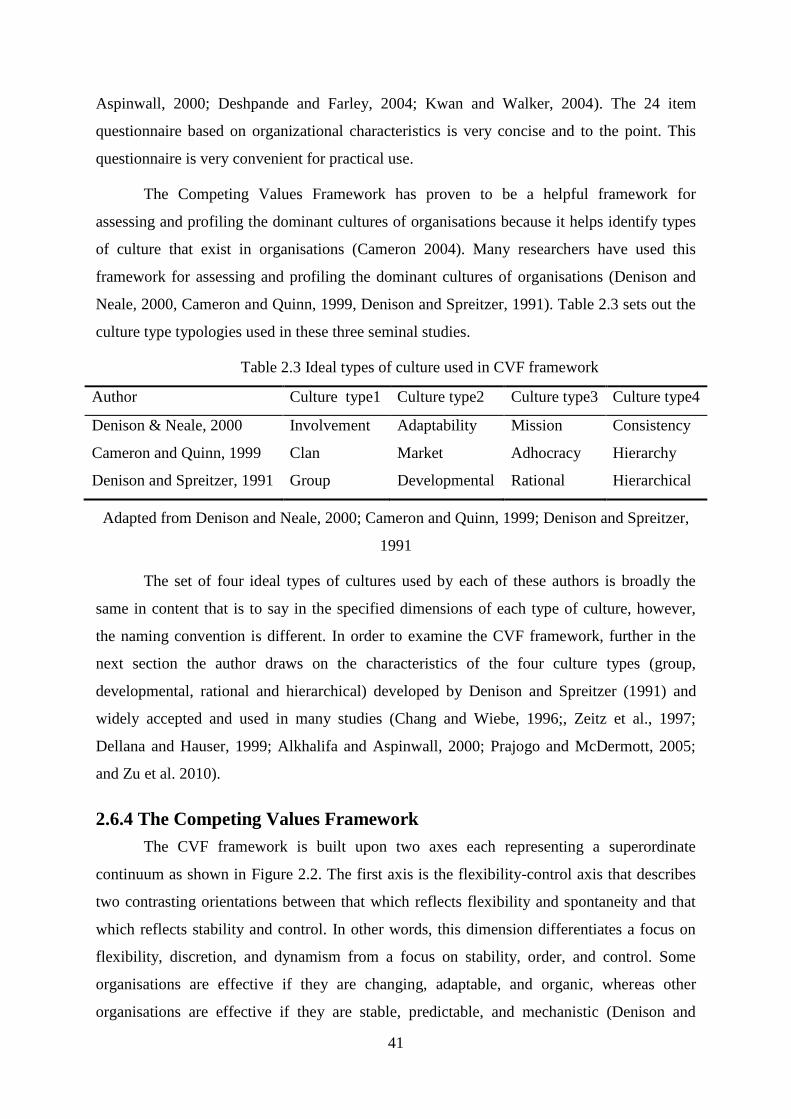
41
Aspinwall, 2000; Deshpande and Farley, 2004; Kwan and Walker, 2004). The 24 item
questionnaire based on organizational characteristics is very concise and to the point. This
questionnaire is very convenient for practical use.
The Competing Values Framework has proven to be a helpful framework for
assessing and profiling the dominant cultures of organisations because it helps identify types
of culture that exist in organisations (Cameron 2004). Many researchers have used this
framework for assessing and profiling the dominant cultures of organisations (Denison and
Neale, 2000, Cameron and Quinn, 1999, Denison and Spreitzer, 1991). Table 2.3 sets out the
culture type typologies used in these three seminal studies.
Table 2.3 Ideal types of culture used in CVF framework
Author Culture type1 Culture type2 Culture type3 Culture type4
Denison & Neale, 2000 Involvement Adaptability Mission Consistency
Cameron and Quinn, 1999 Clan Market Adhocracy Hierarchy
Denison and Spreitzer, 1991 Group Developmental Rational Hierarchical
Adapted from Denison and Neale, 2000; Cameron and Quinn, 1999; Denison and Spreitzer,
1991
The set of four ideal types of cultures used by each of these authors is broadly the
same in content that is to say in the specified dimensions of each type of culture, however,
the naming convention is different. In order to examine the CVF framework, further in the
next section the author draws on the characteristics of the four culture types (group,
developmental, rational and hierarchical) developed by Denison and Spreitzer (1991) and
widely accepted and used in many studies (Chang and Wiebe, 1996;, Zeitz et al., 1997;
Dellana and Hauser, 1999; Alkhalifa and Aspinwall, 2000; Prajogo and McDermott, 2005;
and Zu et al. 2010).
2.6.4 The Competing Values Framework
The CVF framework is built upon two axes each representing a superordinate
continuum as shown in Figure 2.2. The first axis is the flexibility-control axis that describes
two contrasting orientations between that which reflects flexibility and spontaneity and that
which reflects stability and control. In other words, this dimension differentiates a focus on
flexibility, discretion, and dynamism from a focus on stability, order, and control. Some
organisations are effective if they are changing, adaptable, and organic, whereas other
organisations are effective if they are stable, predictable, and mechanistic (Denison and

42
Spreitzer, 1991). This dimension ranges from organisational versatility and flexibility at one
end to organisational steadiness and stability at the other. The second axis is the internal-
external axis that also describes two orientations, one being oriented towards maintenance
and improvement of the existing organisation and the other being focused on adaptation and
interaction with the external environment. Logically, this dimension differentiates a focus on
an internal orientation, integration, and unity from a focus on an external orientation,
differentiation, and rivalry. That is, some organisations are effective if they have harmonious
internal characteristics, whereas others are effective if they focus on interacting or competing
with others outside their boundaries (Denison and Spreitzer, 1991). This dimension ranges
from organisational harmony and unity at one end to organisational separation and
independence at the other. These axes reflect several classics of organisational theory such as
Thompson (1967) and Lawrence and Lorsch (1986).
Figure 2.2 Competing Values Framework for profiling organisational culture
Source: Denison and Spreitzer (1991)
What is notable about these dimensions is that they represent opposite or competing
assumptions. Each continuum highlights a core value that is opposite from the value at the
other end of the continuum - i.e., flexibility versus stability, internal versus external. The
43
dimensions, therefore, produce quadrants that are also contradictory or competing across the
diagonals. The upper left quadrant identifies values that emphasize an internal, organic focus,
whereas the lower right quadrant identifies values that emphasize an external, control focus.
Similarly, the upper right quadrant identifies values that emphasize an external, organic focus
whereas the lower left quadrant emphasizes internal, control values. These competing or
opposite values in each quadrant give the name for the model the Competing Values
Framework. The combination of the two dimensions results in four quadrants of cultural
dimensions, namely group, developmental, hierarchical, and rational.
Adopting the conception of organisational culture propounded by Cameron and Quinn
(1998), organisational culture refers to the taken-for-granted values, underlying assumptions,
expectations, collective memories, and definitions present in an organisation. It reflects the
prevailing ideology people carry inside their heads, it conveys a sense of identity to
employees, provides unwritten and, often, unspoken guidelines for how to get along in the
organisation, and enhances the stability of the social system that they experience (Cameron
and Quinn, 1998). As was discussed in section 2.6.1 organisational culture can be expressed
in many ways such as values, norms, behaviours, responses, communication, work ethics,
moral and ideology. Organisational culture thus conceived has many manifestations. While
the shared cognitive assumptions of organisational members are difficult to measure, cultural
values, manifestation of beliefs and artefacts can be systematically assessed (Yeung et al.,
1991). With the instrument developed by Denison and Spreitzer, (1991) and Cameron and
Quinn (1999), the value orientations of cultural members can be extracted and represented in
cultural profiles. These cultural profiles are ideal types that can be used to characterize the
organisational culture. The main characteristics of the ideal types were given in Table 2.3.
Although there are four distinctive cultural categories, in reality, organisations are unlikely to
reflect only one cultural type. To be effective, the adoption of some elements of each of the
four ideal culture types is necessary (Zammuto and Krakower, 1991; Cameron and Quinn,
1998). The implications of each culture type are summarized as follows:
2.6.4.1 Group culture
According to Denison and Spreitzer (1991), group culture places emphasis on
flexibility and internal orientation. Organisations with emphasis on this culture promote the
development of human resources, emphasizing openness, participation, cohesiveness and
commitment to membership. Such organisations are typified as a friendly place to work
44
where people share a lot. It is akin to an extended family with best friends at work. Leaders
are thought of as mentors, coaches, and, perhaps, even as parent figures. The organisation is
held together by loyalty, tradition, and collaboration. Commitment is high. The organisation
emphasizes the long-term benefits of individual development with high cohesion and morale
being important. Success is defined in terms of internal climate and concern for people. The
organisation places a premium on teamwork, participation, and consensus.
2.6.4.2 Developmental culture
According to Denison and Spreitzer (1991), developmental culture also emphasizes
flexibility but with more focus on the external environment. The orientation is towards
growth, creativity stimulation, resource acquisition, innovation, and continual adaptation to
the external environment. Organisation with development culture is characterized as a
dynamic, entrepreneurial, and creative workplace. People stick their necks out and take risks.
Effective leadership is visionary, innovative, and risk-oriented. The binding force that holds
the organisation together is commitment to experimentation and innovation. The emphasis is
on being at the leading edge of new knowledge, products, and/or services. Readiness for
change and meeting new challenges are important. The organisation’s long term emphasis is
on rapid growth and acquiring new resources. Success means producing unique and original
products and services.
2.6.4.3 Rational culture
According to Denison and Spreitzer (1991), the rational culture is also focused on the
external environment but is control-oriented. It emphasizes productivity, performance, goal
achievement, and one of the primary motivating factors is competition. Such organisation is a
results-oriented workplace. Leaders are hard-driving producers, directors, and competitors.
They are tough and demanding. The binding force that holds the organisation together is an
emphasis on winning. The long-term concern is on competitive actions and achieving stretch
goals and targets. Success is defined in terms of market share and penetration. Outpacing the
competition, escalating share price, and market leadership dominate the success criteria.
2.6.4.4 Hierarchical culture
According to Denison and Spreitzer (1991), the hierarchical culture is both control
and internal oriented. It emphasizes rules and regulations, and standardization to achieve

45
control and stability. Such organisation is characterized as a formalized and structured place
to work. Procedures and well-defined processes govern what people do. Effective leaders are
good coordinators, organizers, and efficiency experts. Maintaining a smooth-running
organisation is important. The long-term concerns of the organisation are stability,
predictability, and efficiency. Formal rules and policies hold the organisation together.
2.6.5 Summary of CVF
Denison and Spreitzer (1991) stress that the four cultures in their typology should be
viewed as ideal types, meaning that organisations are characterized by some combination of
these four cultures – although some types could be more dominant than the others. Thus, as
scales have been developed and validated to empirically measure this, the items are allowed
to vary independently (Quinn and Spreitzer, 1991). As McDermott and Stock (1999) noted in
a later study using the CVF, “as such, a high rating on one dimension (e.g. internal
orientation) does not exclude a high rating at the other end (e.g. external orientation)”.
The review of the literature on the competing value framework reveals that the
following characteristics describe each type of culture:
- Group culture - Supporting and mentoring leadership, employee involvement and
empowerment, employee participation in decision making, continuous improvement,
teamwork, development of human resources, emphasizing openness, participation,
cohesiveness and commitment to membership
- Developmental culture - Growth, creativity, innovation, resource acquisition, continual
adaptation to the external environment/risks, visionary leadership, innovative and risk-
oriented, commitment to experimentation and innovation, being at the leading edge of
new knowledge, products, and/or services, readiness for change and meeting new
challenges, long term emphasis, rapid growth, producing unique and original products
and services
- Rational Culture - Productivity, performance, goal achievement, competition, competitive
actions, achieving stretch goals and targets, market share and penetration, outpacing the
competition, escalating share price, and market leadership
- Hierarchical culture - Emphasis on rules/regulations and standardization to achieve
control and stability, procedures and well-defined processes, stability, predictability, and
efficiency

46
2.6.6 Organisational culture in the context of Bahraini industries
As highlighted in section 2.6.1, the literature indicates that organisational culture is
influenced by national culture (Hofstede, 1991, 2001; Inglehart et al., 1998; Trompenaars,
1994; Black and Mendenhall, 1989) and that organisational culture affects TQM
implementation (Dellana and Hauser, 1999; Prajogo and McDermott, 2005; Zu et al., 2010).
In addition, the literature indicates that there are many cultural traits in Arab nations in
general and in GCC nations in particular that promote the implementation of some specific
TQM practices (Alkhalifa and Aspinwall (2000). However, there may equally be other TQM
practices that won’t find GCC countries favourable place to flourish. From a practical
viewpoint, these practices need to be identified for effective implementation of TQM.
Taking the case of Bahraini industries, the observed organisational culture seems to
be dominated by rational and hierarchical cultures. This was verified by Dedoussis (2004)
who examined Middle Eastern societies (including Bahrain) and discovered that their cultures
are supportive of many of the TQM principles highlighted by TQM scholars, but have a
negative impact on the development of other TQM principles. According to Dedoussis
(2004), Middle Eastern cultures are highly receptive towards teamwork, promote a high
degree of trust and loyalty between the organisation and its workers and can produce strong
leaders. Dedoussis (2004) further argues that these cultures are not naturally disposed to the
use of participatory leadership and management and they tend to discourage employee
involvement in decision making. This observation is supported by Al-Khalifa and Aspinwall
(2000), in their study of the national culture in Qatar that concluded that companies in Qatar
(a Middle Eastern country sharing many cultural characteristics with Bahrain) would find
great difficulties in implementing TQM since they tend to be dominated by rational and
hierarchical cultures. Although the results of these studies are useful points of departure for
this study, the results can’t be generalized to fit Bahraini industries because culture is
unpredictable and varies from place to place (Hofstede, 1991). Schwartz (1994) and Hofstede
(1991) strongly argue that it is crucial to measure the cultural values of the particular sample
being studied and not to rely on reported values from other samples, even if they are for what
are perceived to be the same cultural area or grouping. These observations support the need
for an empirical investigation to identify the types of organisational culture existing in
Bahraini industries.

47
Having examined organisational culture in the context of TQM implementation, and
identified a suitable model for examining organisational culture, discussion now moves to the
next factor - examining the literature on TQM implementation barriers.
2.7 TQM implementation barriers
Shin et al (1998) observed that although the principles of quality management appear
obvious, many organisations have found them difficult to execute because the
implementation is cumbersome, time consuming, and frequently lacking in focus. This view
is supported by Rahim (1994) who stated that “although the TQM practices appear obvious
and common sense, they are in reality difficult to execute and very time consuming. A TQM
philosophy must be driven throughout the entire organisation as it requires major changes in
the way companies operate.”
One of the inherent characteristics of TQM is that it takes considerable time to mature
and bring results (Deming, 1993; McConnell, 2007, Oakland, 2003; Taylor, 1998). If TQM
implementation barriers are not identified before implementation and necessary strategies to
offset these barrier are not adopted then considerable efforts can be expended and time
wasted during reactive after-the-event quick fixes (Dale, 2007). In the TQM implementation
process, the detection of barriers at a late stage is likely to significantly hamper the
effectiveness of the TQM implementation and they can potentially be much more difficult to
minimize or remove at a later stage (Oakland, 2003). The TQM literature supports the view
that lasting and promising results of TQM implementation can best be achieved through
proper planning and preventing problems from occurring at source (Dale, 2007).
It is reasonable to argue, based on the literature on TQM in general, that TQM
implementation can be conceptualised as being underpinned by two parallel processes. On
the one hand the process of identifying practices or policies that are working properly,
identifying how to sustain them and seeking to further enhance their performance through
continuous improvement initiatives; and on the other hand, the process of identifying
practices or policies that are problematic, ineffective or inadequate and improving or re-
engineering them (Dale, 2007). Both processes, but arguably more so for the latter, require
the systematic identification of actual or potential barriers that do or can inhibit the process of
TQM development.
One thing that is prevalent from a cursory examination of the TQM literature is the
citing of problems that have been encountered or the obstacles and barriers that have had to
48
be addressed or overcome in the adoption of the TQM approach. The 1990s in particular saw
a raft of prescriptive contributions dedicated to the reasons for TQM failure (Whiteley, 1991;
Steele, 1993; Summers, 1993; Harari, 1993a; and Tolchinsky and Ranney, 1994). Many
studies also provided anecdotal empirical evidence of one or more barriers based on case
studies. For example, Mallinger (1993) reported that lack of trust, particularly between top
management and employees and the absence of commitment at all levels was, in part,
responsible for failure to create change through TQM at a large fortune 500 manufacturer in
the aerospace industry. Pitman et al. (1994) suggested that two major complications in TQM
implementation are: 1) learning how to define a problem and 2) how to measure the process.
Roufaiel and Meissner (1995) suggested that behavioural and diversity issues are the factors
that hinder TQM implementation. Similarly, Wilshaw and Dale (1996) studied a marketing
and service industry and outlined a number of problems in the introduction of TQM, such as
lack of senior management understanding of TQM and involvement; departments failing to
follow through agreed actions and objectives; lack of support to teamwork; and failure to
match up improvement projects to the skills and resources in the project team.
Other survey-based empirical work has also highlighted obstacles encountered as part
of their more wide-ranging investigations on quality and TQM. Newall and Dale (1991)
proposed that despite the considerable amount of literature there was lack of information on
the problems that companies may expect to encounter during introduction, development and
advancement of TQM and measurement of progress. In their study of eight UK organisations,
six were identified with a major problem with management commitment, and four cited poor
education and training, a general lack of awareness of quality, and lack of understanding
customer needs. Longenecker and Scazzero (1993) reported the results of their research
conducted to assess why a medium sized US manufacturing company that had formally
introduced TQM was struggling in its quality improvement efforts. As a result of combined
findings of an employee survey and management interviews, the authors concluded that the
organisation failed to realise its potential for success through TQM because management at
all levels didn’t create a climate for quality.
Coulson-Thomas (1992) reported from a survey of quality priorities and barriers that
the main barrier was top management commitment and other significant barriers such as
narrow understanding of quality, horizontal boundaries between functions and specialisms,
vested interests, organisational politics, cynicism, organisational structure and customer
expectations. Clemmer (1991) reported five major TQM implementation problems. They

49
were: inability to get top management support; inward focus of organisations; misconception
of skill training (how to apply improvement technologies and methods); short term efforts;
and less dynamic plans, strategies and policies. Radovilsky et al (1996) reported from their
survey of TQM implementation, that the problems most frequently faced in implementing
TQM were: lack of management commitment to quality improvement, poor communication
between departments and a perception of TQM as one more campaign rather than as a real
working system.
More recently, a number of scholars have focused their empirical work more
specifically towards identifying the barriers to TQM in various settings and locations. These
studies are reviewed in the remainder of section 2.7. What became clear early in the review
of these studies is that while they all focus on the TQM barriers, there is variation, (often
significant) in the barriers that they report. In other words it is evident that while attention
has been devoted to examining TQM barriers, the level of consensus amongst the various
contributions when they are compared with each other was inconsistent. This pointed to a
gap in the literature, that is to say the need for a secondary examination of the multiple
contributions to derive a clearer and less fragmented understanding of barriers.
Given this observation about this body of literature, it was therefore decided that
alongside reviewing this body of literature on TQM barriers, to use a systematic process to
make sense of the contributions. In other words, to use a systematic process that would
enable the most common barriers to be identified and to organise them in a meaningful
typology. This process was important for another reason, as firstly it derived a set of TQM
barrier constructs that would subsequently be needed to more clearly define the set of
hypotheses describing the relationship between organisational culture and TQM barriers (see
Chapter 3) and, secondly, it derived the set of measures (scales) for each main TQM
implementation barrier construct that would be needed for the empirical work to be
subsequently undertaken (see section 4.4.2). Accordingly, in the rest of the review, the
research used a three step process to identify the most commonly cited barriers from the
literature and organize them in a meaningful way. This three -step process is illustrated in
figure 2.3.
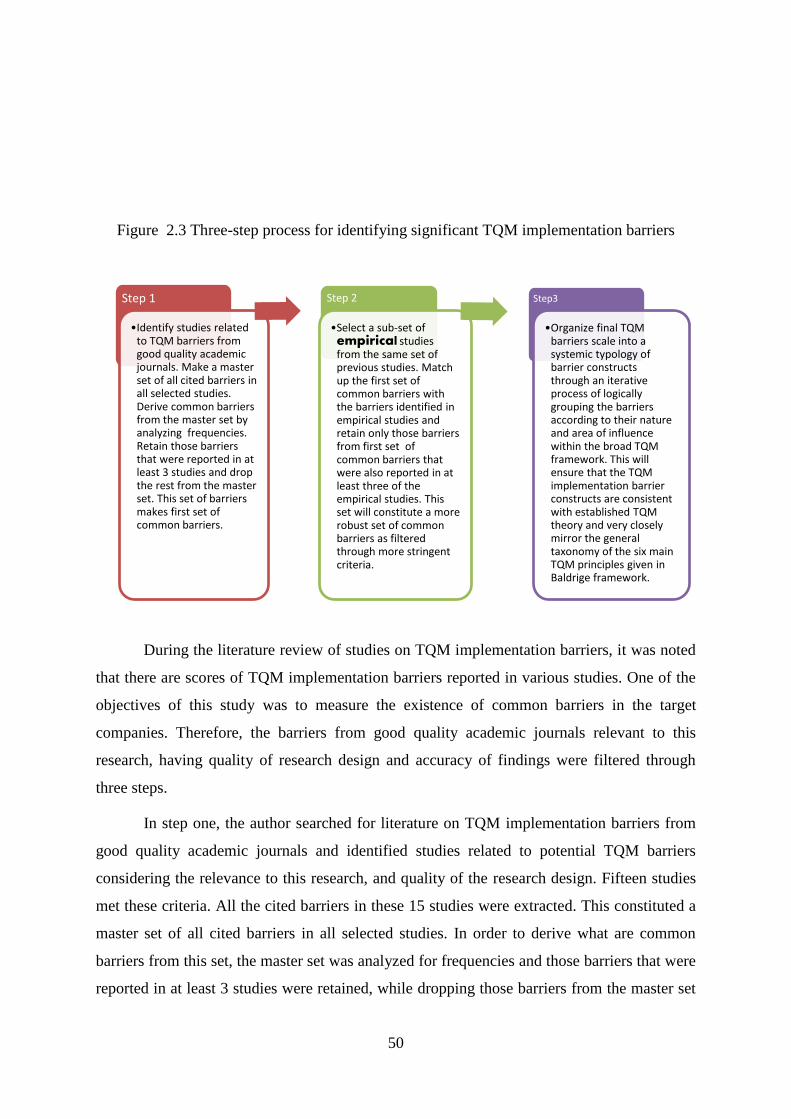
50
Figure 2.3 Three-step process for identifying significant TQM implementation barriers
During the literature review of studies on TQM implementation barriers, it was noted
that there are scores of TQM implementation barriers reported in various studies. One of the
objectives of this study was to measure the existence of common barriers in the target
companies. Therefore, the barriers from good quality academic journals relevant to this
research, having quality of research design and accuracy of findings were filtered through
three steps.
In step one, the author searched for literature on TQM implementation barriers from
good quality academic journals and identified studies related to potential TQM barriers
considering the relevance to this research, and quality of the research design. Fifteen studies
met these criteria. All the cited barriers in these 15 studies were extracted. This constituted a
master set of all cited barriers in all selected studies. In order to derive what are common
barriers from this set, the master set was analyzed for frequencies and those barriers that were
reported in at least 3 studies were retained, while dropping those barriers from the master set
Step 1
•Identify studies related to TQM barriers from good quality academic journals. Make a master set of all cited barriers in all selected studies. Derive common barriers from the master set by analyzing frequencies. Retain those barriers that were reported in at least 3 studies and drop the rest from the master set. This set of barriers makes first set of common barriers.
Step 2
•Select a sub-set of empirical studies from the same set of previous studies. Match up the first set of common barriers with the barriers identified in empirical studies and retain only those barriers from first set of common barriers that were also reported in at least three of the empirical studies. This set will constitute a more robust set of common barriers as filtered through more stringent criteria.
Step3
•Organize final TQM barriers scale into a systemic typology of barrier constructs through an iterative process of logically grouping the barriers according to their nature and area of influence within the broad TQM framework. This will ensure that the TQM implementation barrier constructs are consistent with established TQM theory and very closely mirror the general taxonomy of the six main TQM principles given in Baldrige framework.

51
that appeared in less than 3 contribution. This derived set of 55 barriers constituted the first
set of common barriers. See section 2.7.1 for detail.
In step two, the author selected a sub-set of empirical studies from the same set of 15
previous studies that were deemed to be of particularly high quality. They were selected
considering the relevance to this research and the clarity/robustness of the methodology (see
table 2.4 below). Only five studies met these criteria. The distinctive features of these five
studies and rational in selecting these studies are given in detail in section 2.7.2.The author
then matched up the first set of 55 common barriers with the barriers identified in these five
empirical studies and only those barriers from first set of 55 common barriers were retained
that appeared in at least three of the five empirical studies also. This set constituted a more
robust set of common/significant barriers as filtered through more stringent criteria. Hence, a
final set of 32 TQM barriers was derived, guided by the findings of those studies (i.e. a subset
of all empirical studies) that exhibited particularly high clarity and robustness in their
empirical methodological approaches.
In step 3 of the process the barriers were organized into a systemic typology of barrier
constructs. As mentioned previously, this was crucial in order to derive a set of TQM barrier
constructs and hence be able subsequently (see chapter 3) to identify and define the set of
hypotheses describing the relationship between organisational culture constructs and TQM
barrier constructs. Each of the final 32 items (see table 2.8 below) represented a TQM barrier
indicator. Organizing them into TQM barrier constructs involved an iterative process of
logically grouping the barriers according to their nature and area of influence within the
broad TQM framework. This helped to ensure that the TQM implementation barrier
constructs remained consistent with established TQM theory. This was further guided by
those studies that had previously attempted to put forward higher level barrier construct,
namely the study by Ngai and Cheng (1997) which identified four barrier categories. The
result of these iterative processes was the derivation of six TQM implementation barrier
constructs: top management barriers, employee barriers; customer barriers; planning barriers;
process management barriers; and information management barriers. It is interesting to note
that the resulting barrier constructs very closely mirrored the general taxonomy of the six
main TQM principles identified in the Baldrige framework. See section 2.7.3 for detail.
52
2.7.1 Profiling commonly cited barriers from previous studies
For step 1 of the process, the author identified literature on barriers from good quality
academic journals. Based on this criteria, a total number of 15 studies related to potential
barriers that inhibit the process of TQM development were identified (Ngai and Cheng, 1997;
Sebastianelli and Tamimi, 2003; Rad, 2005; Huq, 2006; Salegna and Fazel, 2000; Adebanjo
and Kehoe, 1998; Jones, 2008; Masters, 1996; Bhat and Raj, 2009; Amaral and Sousa, 2009;
Zeng et al., 2007; Jun et al., 2004 ; Ali et al., 2008; Mosadegh, 2006; Amar and Zain, 2002).
These studies were selected for detailed review as the most likely candidates to profile
TQM implementation barriers. The 15 studies are reviewed in table 2.4. The table examines –
title, authors/year of publication, stated aim(s) / hypotheses, main modelling and main finding
to help author evaluate quality of research design and accuracy of findings in these studies.
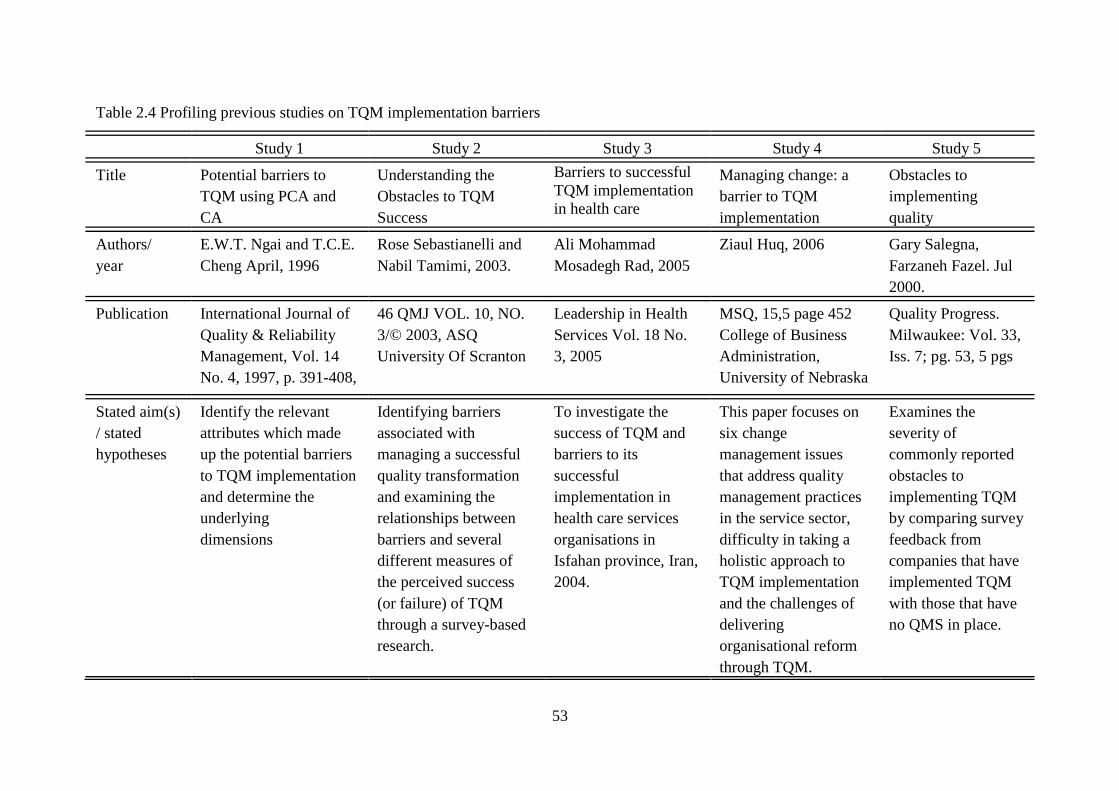
53
Table 2.4 Profiling previous studies on TQM implementation barriers
Study 1 Study 2 Study 3 Study 4 Study 5
Title Potential barriers to
TQM using PCA and
CA
Understanding the
Obstacles to TQM
Success
Barriers to successful
TQM implementation
in health care
Managing change: a
barrier to TQM
implementation
Obstacles to
implementing
quality
Authors/
year
E.W.T. Ngai and T.C.E.
Cheng April, 1996
Rose Sebastianelli and
Nabil Tamimi, 2003.
Ali Mohammad
Mosadegh Rad, 2005
Ziaul Huq, 2006
Gary Salegna,
Farzaneh Fazel. Jul
2000.
Publication International Journal of
Quality & Reliability
Management, Vol. 14
No. 4, 1997, p. 391-408,
46 QMJ VOL. 10, NO.
3/© 2003, ASQ
University Of Scranton
Leadership in Health
Services Vol. 18 No.
3, 2005
MSQ, 15,5 page 452
College of Business
Administration,
University of Nebraska
Quality Progress.
Milwaukee: Vol. 33,
Iss. 7; pg. 53, 5 pgs
Stated aim(s)
/ stated
hypotheses
Identify the relevant
attributes which made
up the potential barriers
to TQM implementation
and determine the
underlying
dimensions
Identifying barriers
associated with
managing a successful
quality transformation
and examining the
relationships between
barriers and several
different measures of
the perceived success
(or failure) of TQM
through a survey-based
research.
To investigate the
success of TQM and
barriers to its
successful
implementation in
health care services
organisations in
Isfahan province, Iran,
2004.
This paper focuses on
six change
management issues
that address quality
management practices
in the service sector,
difficulty in taking a
holistic approach to
TQM implementation
and the challenges of
delivering
organisational reform
through TQM.
Examines the
severity of
commonly reported
obstacles to
implementing TQM
by comparing survey
feedback from
companies that have
implemented TQM
with those that have
no QMS in place.

54
Main
Modelling
Self-completion
questionnaire was
distributed to quality
practitioners of 750
companies. A total of
179 complete
questionnaires were
received
A survey was done on
874 companies of ASQ
in USA obtaining
respondents’ opinions
about a series of
statements representing
both barriers to TQM as
well as potential
undesirable outcomes
This descriptive and
cross-sectional
research was done via
two questionnaires
(TQM success and its
barriers). The
population of this
research consists of
managers of health
care organisations who
implemented TQM
The study employs a
quasi-qualitative case
study methodology.
Twenty service
companies from health
care, insurance,
consulting, and
banking and financial
services
were studied over a
period of two years to
assess their change
management practices
for implementing TQM
A survey was done
on 2000 randomly
selected firms and
109 usable responses
received from
company presidents
and CEOs who were
asked to rate the
degree to which
each listed obstacle
represented a
problem during
TQM
implementation.
Main finding PCA results produced
four orthogonal
dimensions to potential
barriers to TQM
Implementation
(Cultural and employee
barriers, Infrastructure
barriers, Managerial
barriers, Organisational
barriers). CA was then
applied in order to
corroborate the findings
Derived following
Four factors from their
17-item scale: 1)
cultural and employee
barrier, 2) infrastructure
barrier, 3) managerial
barrier, and 4)
organisational barrier.
These four factors offer
more refinement and
consequently, a better
understanding of the
In correlation analysis
between the barriers to
TQM and the problem
dimensions, human
resource, strategic and
structural problems
were the most
important barriers to
TQM successful
implementation.
Among other issues,
unrealistic expectations
of employee
commitment, absence
of process focus, lack
of organisation around
information flow, holes
in education and
training, and failure to
create a continuous
improvement culture
contributed
Study reveals that
non-TQM
companies perceive
the severity of
problems differently
from TQM
counterparts.
Majority of failures
involve the process
by which the TQM
philosophy is
implemented rather
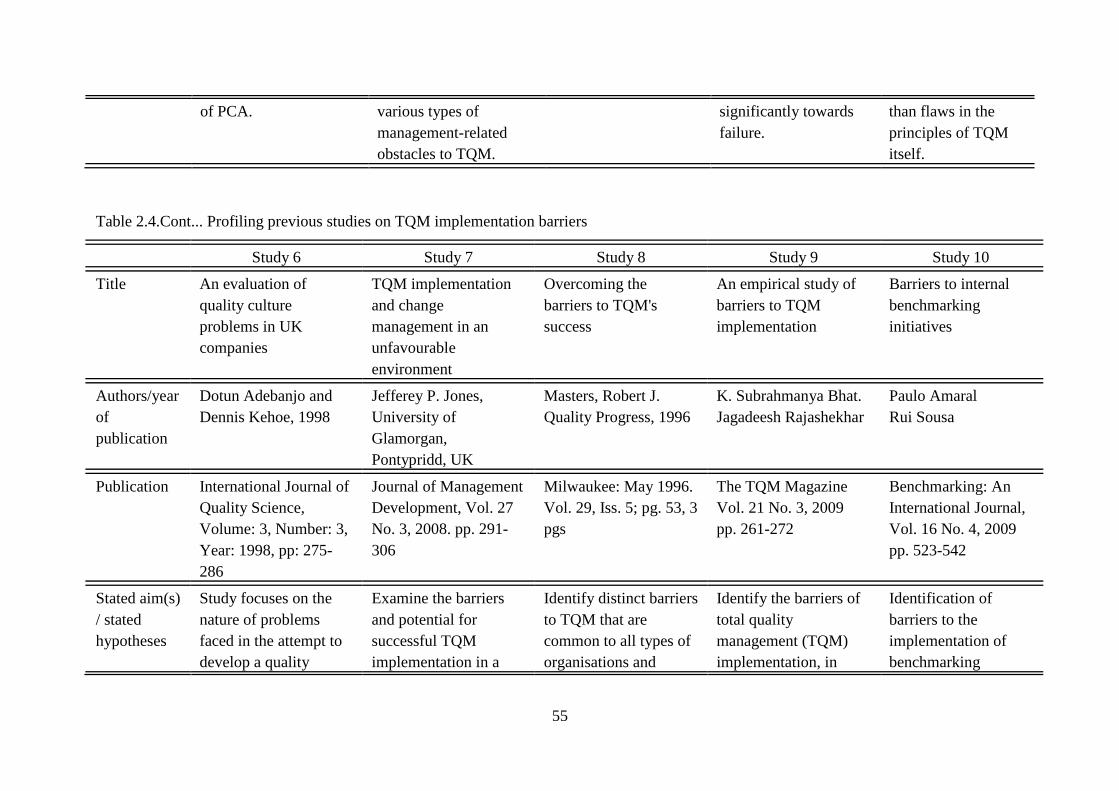
55
of PCA. various types of
management-related
obstacles to TQM.
significantly towards
failure.
than flaws in the
principles of TQM
itself.
Table 2.4.Cont... Profiling previous studies on TQM implementation barriers
Study 6 Study 7 Study 8 Study 9 Study 10
Title An evaluation of
quality culture
problems in UK
companies
TQM implementation
and change
management in an
unfavourable
environment
Overcoming the
barriers to TQM's
success
An empirical study of
barriers to TQM
implementation
Barriers to internal
benchmarking
initiatives
Authors/year
of
publication
Dotun Adebanjo and
Dennis Kehoe, 1998
Jefferey P. Jones,
University of
Glamorgan,
Pontypridd, UK
Masters, Robert J.
Quality Progress, 1996
K. Subrahmanya Bhat.
Jagadeesh Rajashekhar
Paulo Amaral
Rui Sousa
Publication International Journal of
Quality Science,
Volume: 3, Number: 3,
Year: 1998, pp: 275-
286
Journal of Management
Development, Vol. 27
No. 3, 2008. pp. 291-
306
Milwaukee: May 1996.
Vol. 29, Iss. 5; pg. 53, 3
pgs
The TQM Magazine
Vol. 21 No. 3, 2009
pp. 261-272
Benchmarking: An
International Journal,
Vol. 16 No. 4, 2009
pp. 523-542
Stated aim(s)
/ stated
hypotheses
Study focuses on the
nature of problems
faced in the attempt to
develop a quality
Examine the barriers
and potential for
successful TQM
implementation in a
Identify distinct barriers
to TQM that are
common to all types of
organisations and
Identify the barriers of
total quality
management (TQM)
implementation, in
Identification of
barriers to the
implementation of
benchmarking
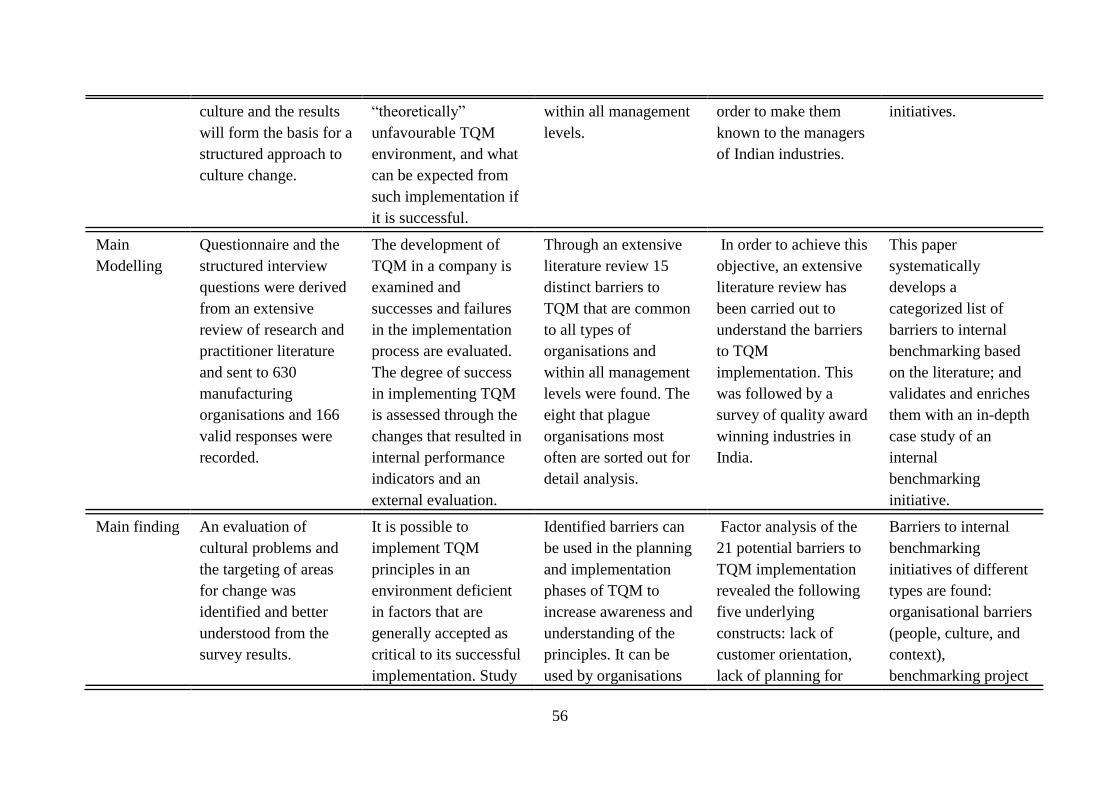
56
culture and the results
will form the basis for a
structured approach to
culture change.
“theoretically”
unfavourable TQM
environment, and what
can be expected from
such implementation if
it is successful.
within all management
levels.
order to make them
known to the managers
of Indian industries.
initiatives.
Main
Modelling
Questionnaire and the
structured interview
questions were derived
from an extensive
review of research and
practitioner literature
and sent to 630
manufacturing
organisations and 166
valid responses were
recorded.
The development of
TQM in a company is
examined and
successes and failures
in the implementation
process are evaluated.
The degree of success
in implementing TQM
is assessed through the
changes that resulted in
internal performance
indicators and an
external evaluation.
Through an extensive
literature review 15
distinct barriers to
TQM that are common
to all types of
organisations and
within all management
levels were found. The
eight that plague
organisations most
often are sorted out for
detail analysis.
In order to achieve this
objective, an extensive
literature review has
been carried out to
understand the barriers
to TQM
implementation. This
was followed by a
survey of quality award
winning industries in
India.
This paper
systematically
develops a
categorized list of
barriers to internal
benchmarking based
on the literature; and
validates and enriches
them with an in-depth
case study of an
internal
benchmarking
initiative.
Main finding An evaluation of
cultural problems and
the targeting of areas
for change was
identified and better
understood from the
survey results.
It is possible to
implement TQM
principles in an
environment deficient
in factors that are
generally accepted as
critical to its successful
implementation. Study
Identified barriers can
be used in the planning
and implementation
phases of TQM to
increase awareness and
understanding of the
principles. It can be
used by organisations
Factor analysis of the
21 potential barriers to
TQM implementation
revealed the following
five underlying
constructs: lack of
customer orientation,
lack of planning for
Barriers to internal
benchmarking
initiatives of different
types are found:
organisational barriers
(people, culture, and
context),
benchmarking project
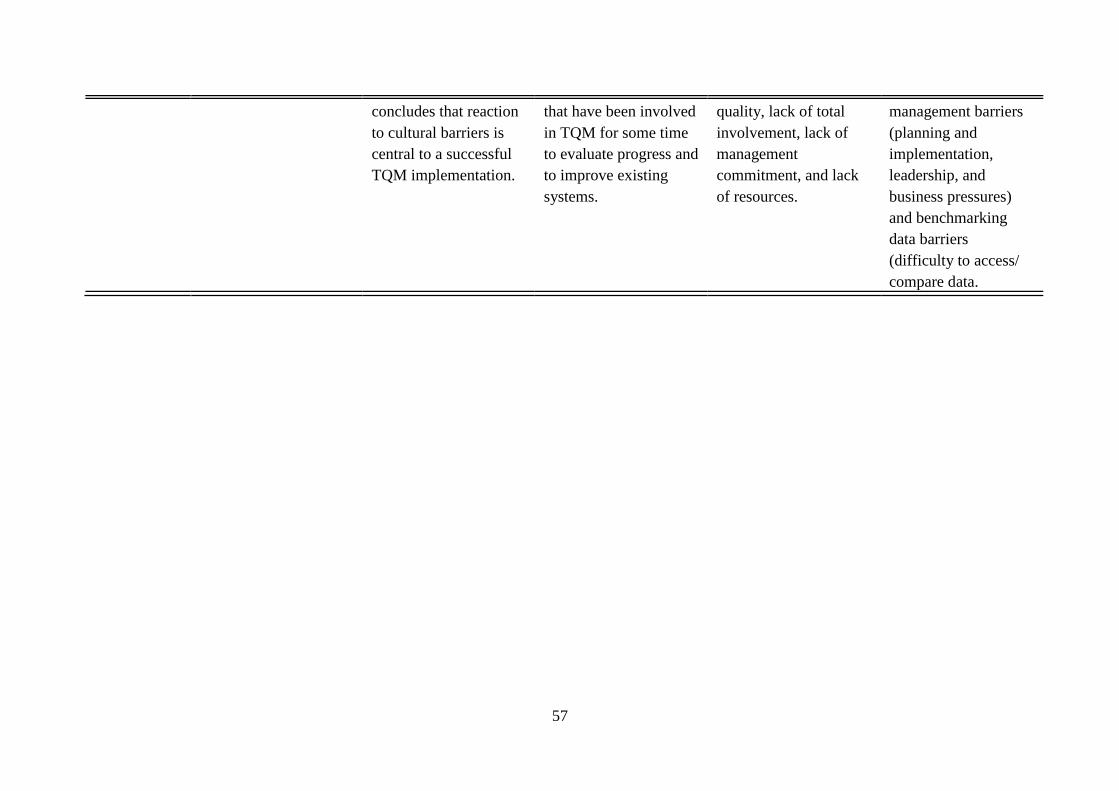
57
concludes that reaction
to cultural barriers is
central to a successful
TQM implementation.
that have been involved
in TQM for some time
to evaluate progress and
to improve existing
systems.
quality, lack of total
involvement, lack of
management
commitment, and lack
of resources.
management barriers
(planning and
implementation,
leadership, and
business pressures)
and benchmarking
data barriers
(difficulty to access/
compare data.

58
Table 2.4.Cont... Profiling previous studies on TQM implementation barriers
Study 11 Study 12 Study 13 Study 14 Study 15
Title Overcoming Barriers to
implementations of the
ISO 9002 system
Obstacles to TQM
Implementation in
Mexico’s Maquiladora
Industry
People resistance in
TQM implementation: a
qualitative study on
Malaysian universities
The impact of
organisational
culture on the
successful
TQM implementation
Barriers to
implementing TQM in
Indonesian
manufacturing
organisations
Authors/year
of
publication
S.X. Zeng,P Tian, C.M
Tam
Minjoon Jun, Shaohan
Cai and Robin T.
Peterson
Noor Azman Ali,
Mohamed Zairi,
Fauziah Mahat
Ali Mohammad
Mosadegh Rad
Kifayah Amar,
Zuraidah Mohd Zain,
2002
Publication Managerial auditing
journal 2007,Vol 22.3,pg
244-254
Total Quality
Management,
Vol. 15, No. 1, 59–72,
January 2004
International Journal of
Productivity and
Quality Management
Volume 3, No 1 / 2008,
Pg.1 – 11
The TQM Magazine
Vol. 18 No. 6, 2006
pp. 606-625
The TQM Magazine,
Vol.14, issu6
Stated aim(s)
/ stated
hypotheses
This study aims to
explore the barriers to
implementation of ISO
9000 in China, and to
identify how these
barriers can be
overcome.
The purpose of this
paper is to empirically
investigate barriers
that firms in the
Maquiladora industry
experience.
To discuss the
theoretical and research
evidence related to the
issue of people barriers
concerning problems
and pitfalls in Total
Quality Management
(TQM) implementation.
To determine the
impact of cultural
values on the success
of TQM
implementation in
Isfahan University
Hospitals (IUHs), Iran.
This study examines
the barriers faced by
Indonesian
manufacturing
organisations in the
implementation of
TQM.
Main
Modelling
Using a structural
questionnaire survey,
this paper examines the
Study was based on
25 potential obstacles
to TQM success, and
A qualitative survey on
seven universities in
Malaysia was made.
Data was collected on
the characteristics of
organisational
A multi-response
survey conducted on a
total sample size of
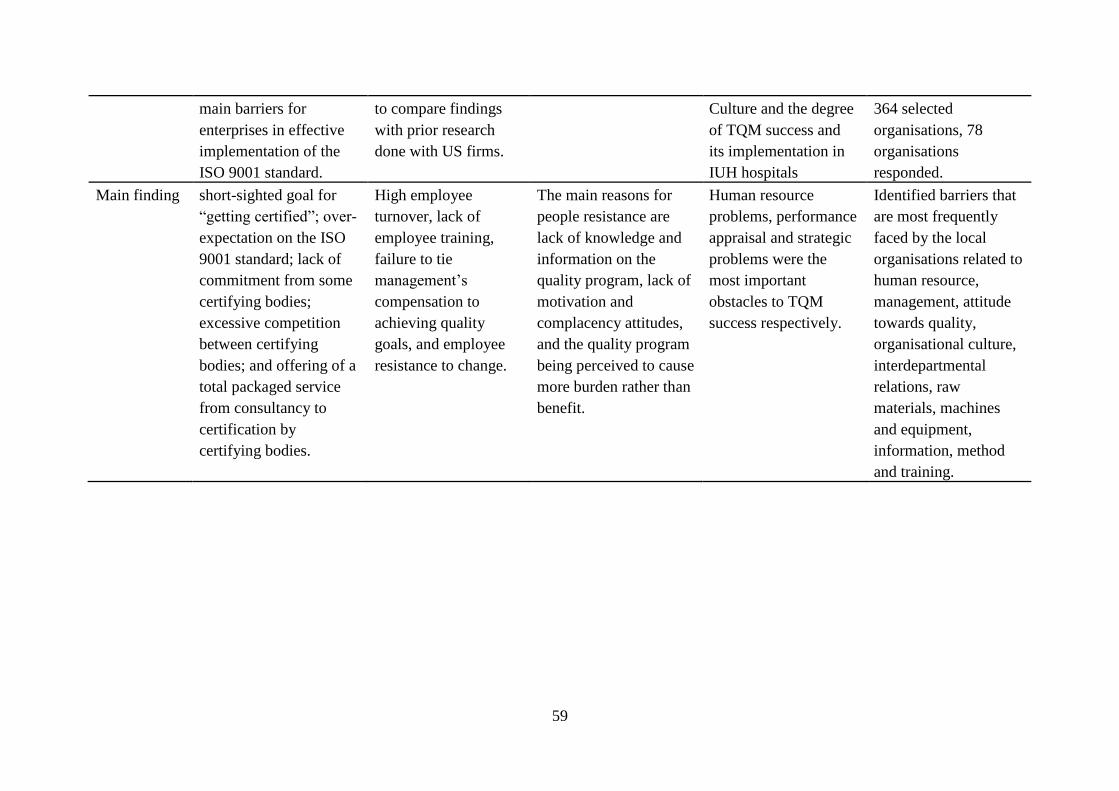
59
main barriers for
enterprises in effective
implementation of the
ISO 9001 standard.
to compare findings
with prior research
done with US firms.
Culture and the degree
of TQM success and
its implementation in
IUH hospitals
364 selected
organisations, 78
organisations
responded.
Main finding short-sighted goal for
“getting certified”; over-
expectation on the ISO
9001 standard; lack of
commitment from some
certifying bodies;
excessive competition
between certifying
bodies; and offering of a
total packaged service
from consultancy to
certification by
certifying bodies.
High employee
turnover, lack of
employee training,
failure to tie
management’s
compensation to
achieving quality
goals, and employee
resistance to change.
The main reasons for
people resistance are
lack of knowledge and
information on the
quality program, lack of
motivation and
complacency attitudes,
and the quality program
being perceived to cause
more burden rather than
benefit.
Human resource
problems, performance
appraisal and strategic
problems were the
most important
obstacles to TQM
success respectively.
Identified barriers that
are most frequently
faced by the local
organisations related to
human resource,
management, attitude
towards quality,
organisational culture,
interdepartmental
relations, raw
materials, machines
and equipment,
information, method
and training.
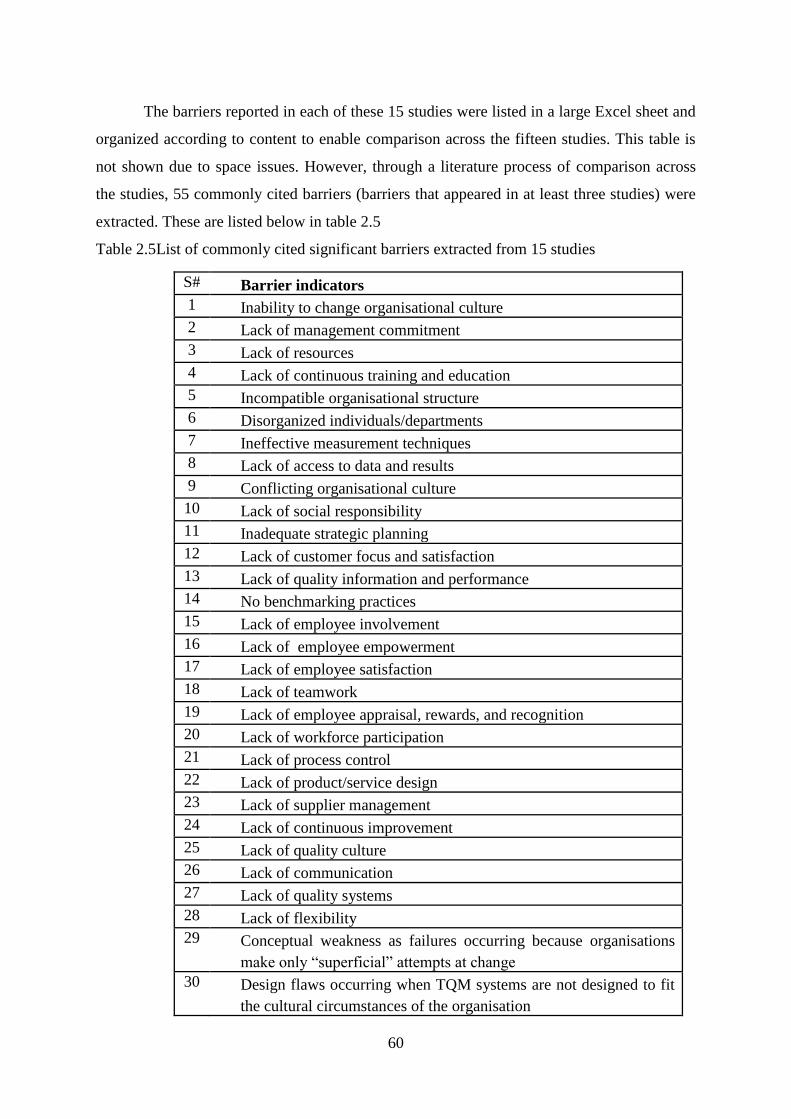
60
The barriers reported in each of these 15 studies were listed in a large Excel sheet and
organized according to content to enable comparison across the fifteen studies. This table is
not shown due to space issues. However, through a literature process of comparison across
the studies, 55 commonly cited barriers (barriers that appeared in at least three studies) were
extracted. These are listed below in table 2.5
Table 2.5List of commonly cited significant barriers extracted from 15 studies
S# Barrier indicators
1 Inability to change organisational culture
2 Lack of management commitment
3 Lack of resources
4 Lack of continuous training and education
5 Incompatible organisational structure
6 Disorganized individuals/departments
7 Ineffective measurement techniques
8 Lack of access to data and results
9 Conflicting organisational culture
10 Lack of social responsibility
11 Inadequate strategic planning
12 Lack of customer focus and satisfaction
13 Lack of quality information and performance
14 No benchmarking practices
15 Lack of employee involvement
16 Lack of employee empowerment
17 Lack of employee satisfaction
18 Lack of teamwork
19 Lack of employee appraisal, rewards, and recognition
20 Lack of workforce participation
21 Lack of process control
22 Lack of product/service design
23 Lack of supplier management
24 Lack of continuous improvement
25 Lack of quality culture
26 Lack of communication
27 Lack of quality systems
28 Lack of flexibility
29 Conceptual weakness as failures occurring because organisations
make only “superficial” attempts at change
30 Design flaws occurring when TQM systems are not designed to fit
the cultural circumstances of the organisation
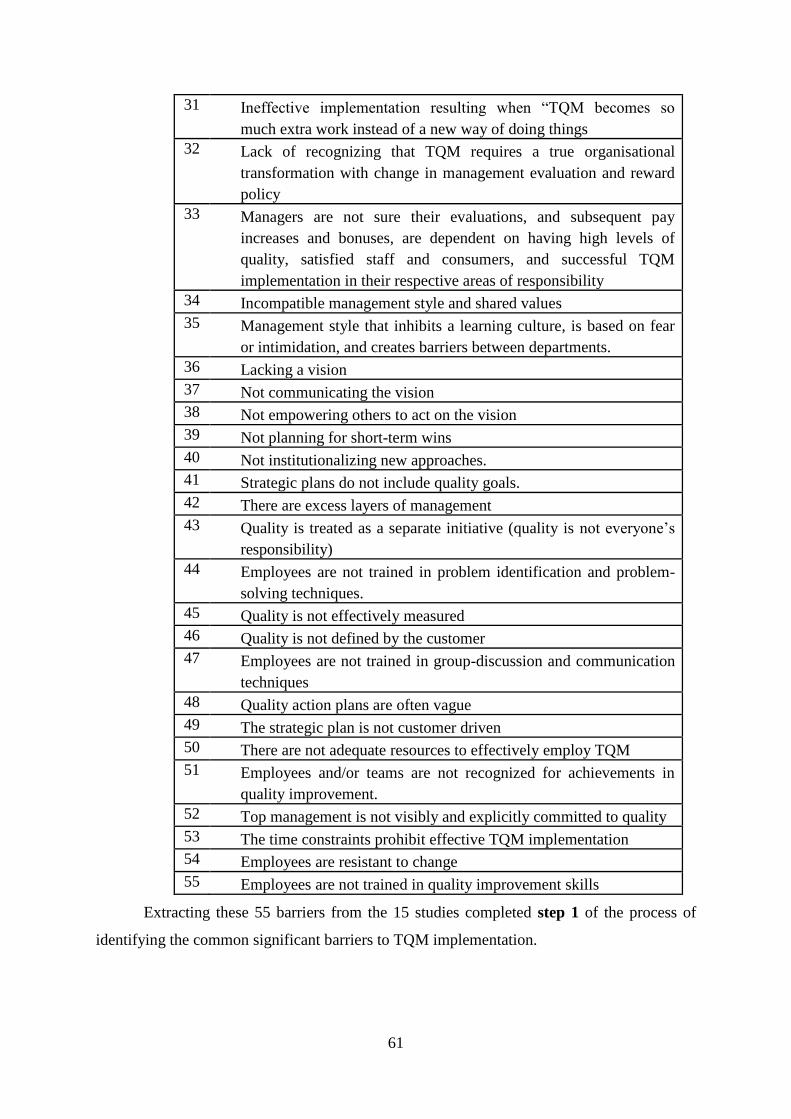
61
31 Ineffective implementation resulting when “TQM becomes so
much extra work instead of a new way of doing things
32 Lack of recognizing that TQM requires a true organisational
transformation with change in management evaluation and reward
policy
33 Managers are not sure their evaluations, and subsequent pay
increases and bonuses, are dependent on having high levels of
quality, satisfied staff and consumers, and successful TQM
implementation in their respective areas of responsibility
34 Incompatible management style and shared values
35 Management style that inhibits a learning culture, is based on fear
or intimidation, and creates barriers between departments.
36 Lacking a vision
37 Not communicating the vision
38 Not empowering others to act on the vision
39 Not planning for short-term wins
40 Not institutionalizing new approaches.
41 Strategic plans do not include quality goals.
42 There are excess layers of management
43 Quality is treated as a separate initiative (quality is not everyone’s
responsibility)
44 Employees are not trained in problem identification and problem-
solving techniques.
45 Quality is not effectively measured
46 Quality is not defined by the customer
47 Employees are not trained in group-discussion and communication
techniques
48 Quality action plans are often vague
49 The strategic plan is not customer driven
50 There are not adequate resources to effectively employ TQM
51 Employees and/or teams are not recognized for achievements in
quality improvement.
52 Top management is not visibly and explicitly committed to quality
53 The time constraints prohibit effective TQM implementation
54 Employees are resistant to change
55 Employees are not trained in quality improvement skills
Extracting these 55 barriers from the 15 studies completed step 1 of the process of
identifying the common significant barriers to TQM implementation.

62
2.7.2Review of core empirical studies on TQM implementations barriers
Step 2 of the process consisted of profiling a subset of empirically based studies on
TQM implementation barriers, studies exhibiting precision of modelling, adequate
population, appropriate sample size, robust data collection methodologies and precise
analytical methods. The following 5 studies were selected from the 15 original studies based
on the stricter aforementioned criteria, in order to help profile the commonly cited TQM
Implementation barriers.
1. The objective of the first empirical study by Sebastianelli and Tamimi (2003) was to
identify barriers associated with managing a successful quality transformation and
examining the relationships between barriers and several different measures of the
perceived success (or failure) of TQM through survey-based research. A survey was done
on 874 companies who were member of the ASQ in USA, obtaining respondents’
opinions about a series of statements representing both barriers to TQM as well as
potential undesirable outcomes. Factor analysis was used to empirically derive barriers
from scale items that represent commonly cited barriers. This study extended previous
work by examining the causal relationships between these derived barriers and the
perceived barriers. Measures used were: inadequate human resource development and
management; lack of planning for quality; lack of leadership for quality; inadequate
resources for TQM; lack of customer focus. Because the scale used in this study
emphasized barriers associated with managing the quality transformation, these four
factors offer more refinement and consequently, a better understanding of the various
types of management-related obstacles to TQM. The study derived five TQM
implementation barriers - inadequate human resources development and management,
lack of planning for quality, lack of leadership for quality, inadequate resources for TQM
and lack of customer focus. This study covered all TQM elements except Information
System. It is clear that Sebastianelli and Tamimi’s (2003) study met the criteria of
relevance to this research and the clarity/robustness of their methodology.
2. The objective of study by Salegna and Fazel (2000) was to examine the severity of
commonly reported obstacles to implementing TQM by comparing survey feedback from
companies that have implemented TQM with those that have no quality management in
place. A survey was done on 2000 randomly selected manufacturing firms and 109 usable

63
responses were received to test the hypotheses. The survey was addressed to company
presidents and CEOs who were asked to rate, on a scale of 1 to 7 the degree to which each
listed obstacle represented a problem during TQM implementation. Analysis of
covariance was used to test for statistical differences between the degree of severity of the
obstacles for TQM and non-TQM companies. The results revealed the several commonly
reported obstacles to implementing TQM and concluded that a majority of TQM failures
involve the process by which the TQM philosophy is implemented rather than flaws in
the principles of TQM itself. It is clear that study of Salegna and Fazel (2000) met the
criteria of relevance to this research and the clarity/robustness of their methodology.
3. The objective of the study by Ngai and Cheng (1997) was to identify the relevant
attributes which made up the potential barriers to TQM implementation and determine the
underlying dimensions. This study used self-completion questionnaires that were
distributed to quality practitioners of 750 companies in an attempt to understand potential
barriers to TQM implementation. A total of 179 completed questionnaires were received.
PCA (Principal component analysis) was first applied to determine the underlying
structure of the potential quality barriers to TQM implementation. CA (correspondence
analysis) was then used to provide a study of the relationships between the potential
barriers in TQM in order to reduce the complexity of the data and identify their possible
association with different types of industry. Measures used in the research were:
employee and cultural barriers, infrastructure barriers, managerial barriers and
organisational barriers. Multivariate statistical techniques, PCA and CA were used on real
data – “the potential barriers data set” to demonstrate their use. PCA was conducted on
the set of survey data and produced four orthogonal dimensions to potential barriers to
TQM implementation. CA was then applied in order to corroborate the findings of the
PCA. Also CA showed how the potential barriers relate to one another and to the different
types of industry, interpreting the data and making inferences from a more informed
perspective.
A highly reliable part of Ngai and Cheng’s (1997) work was that they produced four
orthogonal dimensions associated with managing a successful quality transformation, as
given in table 2.6 below. Obviously the study of Ngai and Cheng (1997) met the criteria
of relevance to this research and the clarity/robustness of their methodology.

64
Table 2.6 Potential barriers to TQM implementation and underlying dimensions by Ngai
and Cheng (1997)
Dimensions Barriers
Cultural and employee
barriers
Change of culture, fear/resistance to change, lack of
employee commitment, and lack of confidence by employees
Infrastructure barriers Insufficient quality training and education, lack of customer
feedback systems, lack of recognition and reward systems,
underdeveloped measurement of quality and lack of expertise
in quality management
Managerial barriers Lack of top management commitment, no proper vision and
mission, high turnover/changes in key executives, and lack of
leadership
Organisational barriers ineffective internal and external communication network,
territorialism, and organisational politics
4. The purpose of the study by Bhat and Rajashekhar (2009) was to identify the barriers of
total quality management implementation, in order to make them known to the managers
of Indian industries. In order to achieve this objective, an extensive literature review was
carried out to understand the barriers. This was followed by a survey of quality award
winning industries in India. A total of 41 completed questionnaires were received and the
overall response rate was 31 percent. The findings of this survey suggest that the most
important TQM barriers in Indian industry are: “no benchmarking of other company’s
practices” and “employees are resistant to change”. Factor analysis of the 21 potential
barriers to TQM implementation revealed the following five underlying constructs: lack
of customer orientation, lack of planning for quality, lack of total involvement, lack of
management commitment, and lack of resources. The author proposed that this empirical
research presented a solution to the difficulties faced by the managers while
implementing TQM effectively in their industries. Apparently the study of Bhat and
Rajashekhar (2009) met the criteria of relevance to this research and the clarity/robustness
of their methodology.
5. The purpose of the study by Jun et al. (2004) was to empirically investigate barriers that
firms in the Maquiladora industry experience. The study was based on 25 potential
obstacles to TQM success, and the findings were compared with prior research done with
US firms. The findings of this study suggest that a prevalent TQM barrier in the
Maquiladora industry is high employee turnover. Obstacles to TQM implementation that

65
are common to both Maquiladora and US firms included lack of employee training,
failure to tie management’s compensation to achieving quality goals, and employee
resistance to change. The study also analyzed the managerial implications of these
obstacles. It appears that the study of Jun et al. (2004) met the criteria of relevance to this
research and the clarity/robustness of their methodology
In this process, all the barriers reported in these 5 empirical studies were extracted.
The author then matched up the first set of 55 common barriers with the barriers identified in
these five empirical studies and only those barriers from the first set of 55 common barriers
were retained that appeared in at least three of the five selected empirical studies also. This
set constituted a more robust set of common/significant barriers as filtered through more
stringent criteria. Table 2.7 present the final set of 32 barriers along with the studies that
identified that barrier.
Table 2.7 List of 32 barriers identified in 5 studies
TQM barrier statements
Seb
asti
anel
li
& T
amim
i
(2003)
Sal
egna
&
Faz
el (
2000)
Ngai
& C
hen
g
(1996)
Bhat
& R
aj
(2009)
Jun e
t al
.
(2004)
Fre
q
1 Lack of visible commitment and support to
quality by senior managers 4
2 Senior managers don’t communicate quality
awareness within the organisation 3
3 Senior managers do not allocate adequate
resources for employees' training 4
4 Management style slows down learning
culture 3
5 Frequent turnover of managers 3
6 Excess layers of management in the
organisation 3
7 Employees are not empowered to implement
quality improvement effort 4
8 Employee are not involved in improvement
projects 3
9 Employees are not trained in quality
improvement skills 4
10 Training employees in group discussion and
communication techniques is not considered
necessary
3
11 Employees and teams are not recognized for
achievements in quality improvement 4
12 Employee's satisfaction across the 3

66
organisation is low
13 Employees tend to be resistant to change 3
14 No effective system to measure customer
satisfaction 3
15 Customers' needs and expectations are not
assessed 3
16 Lack of effective customer feedback system 3
17 Close contact with key customers is not
considered necessary 3
18 The strategic plans are not customer driven 4
19 The organisation's strategic plans do not
include quality goals 3
20 There are no specific ways of
institutionalizing new approaches/ tools/
techniques
3
21 There are no joint planning activities with
suppliers 3
22 Lack of a comprehensive quality programme 4
23 Quality is treated as a separate initiative (not
everyone's responsibility) 4
24 Communication with our external network of
stakeholders is not ineffective 3
25 Adequate resources to effectively employ
TQM are not available 3
26 Cross functional teams are not used 3
27 Poor inter-organisational communication 3
28 Individuals don’t liaise with people outside of
their own departments 3
29 Quality and performance information is not
disseminated widely in the organisation 3
30 Quality performance is not effectively and
frequently measured 3
31 The best practices / or products of other
companies are not benchmarked 3
32 Not enough time to implement quality
programme 3
Step1 and step 2 of the process provided the author with a list of 32 common barriers
found to be significant in five empirical studies and also reported in a wider set of 15 studies.
Hence, the final barrier list derived from the studies considered to be those that are from high
quality journals and also exhibit the most focused and robust methodological approach.
67
2.7.3 Identification of the barrier constructs
In step 3 of the process the barriers were organised into a systemic typology of barrier
constructs. As mentioned previously, this was crucial in order to derive a set of TQM barrier
constructs and hence be able subsequently (see chapter 3) to identify and define the set of
hypotheses describing the relationship between organisational culture and TQM barriers.
Each of the final 32 items (see table 2.8 below) represented a TQM barrier indicator.
Organising them into TQM barrier constructs involved an iterative process of logically
grouping the barriers according to their nature and area of influence within the broad TQM
framework. This helped to ensure that the implementation barrier constructs remained
consistent with established TQM theory. This was further guided by those studies that had
previously attempted to put forward higher level barrier constructs, namely the study by Ngai
and Cheng (1997) which identified four barrier categories. The result of these iterative
processes was the derivation of six TQM implementation barrier constructs: top management
barriers, employee barriers; customer barriers; planning barriers; process management
barriers; and information management barriers.
An objective of this categorization was that the resulting barrier constructs should
closely mirror a generally accepted taxonomy of TQM principles identified in the Baldrige
framework. This was done for three reasons: first, according to Curkovic et al. (2000), the
wide adoption of Baldrige criteria in many countries around the world strongly suggests that
the Baldrige criteria have comprehensively captured the major dimensions of TQM practices
as envisioned by its proponents, such as Deming, Juran, and Crosby. Second, the Baldrige
criteria are applicable to both manufacturing and non-manufacturing firms, which were the
focus of this study. Third, categorization of TQM implementation barriers according to
taxonomy of six main TQM principles in Baldrige criteria would enable practitioners to
identify what barriers are expected in implementing a TQM principle and to avoid
unexpected barriers to surface in the midst of the implementation process. Therefore, this
unique categorization of TQM implementation barriers guided by an established taxonomy of
TQM principles has both theoretical and practical significance. Table 2.8 shows the 6 TQM
implementation barrier constructs with their indicators.

68
Table 2.8 Categorizing identified TQM implementation barrier indicators into higher order
barriers constructs
Barrier
construct
S# Barrier indicator
Top
Management
Barriers
1 Lack of visible commitment and support to quality by senior managers
2 Senior managers don’t communicate quality awareness within the
organisation
3 Senior managers do not allocate adequate resources for employees'
training
4 Management style slows down learning culture
5 Frequent turnover of managers
6 Excess layers of management in the organisation
Employee
Barriers
7 Employees are not empowered to implement quality improvement effort
8 Employee are not involved in improvement projects
9 Employees are not trained in quality improvement skills
10 Training employees in group discussion and communication techniques is
not considered necessary
11 Employees and teams are not recognized for achievements in quality
improvement
12 Employee's satisfaction across the organisation is low
13 Employees tend to be resistant to change
Customer
Barriers
14 No effective system to measure customer satisfaction
15 Customers' needs and expectations are not assessed
16 Lack of effective customer feedback system
17 Close contact with key customers is not considered necessary
Planning
Barriers
18 The strategic plans are not customer driven
19 The organisation's strategic plans do not include quality goals
20 There are no specific ways of institutionalizing new approaches/ tools/
techniques
21 There are no joint planning activities with suppliers
Process
Management
Barriers
22 Lack of a comprehensive quality programme
23 Quality is treated as a separate initiative (not everyone's responsibility)
24 Communication with our external network of stakeholders is not effective
25 Adequate resources to effectively employ TQM are not available
26 Cross functional teams are not used
Information
Management
Barriers
27 Poor inter-organisational communication
28 Individuals don’t liaise with people outside of their own departments
29 Quality and performance information is not disseminated widely in the
organisation
30 Quality performance is not effectively and frequently measured
31 The best practices / or products of other companies are not benchmarked
32 Not enough time to implement quality programme
The literature confirms that potential TQM implementation barriers specific to
organisations exist in many types of organisations in many regions of the world (Angell and
69
Corbett, 2009). Hence, Bahraini industries are no exception. These barriers need to be
identified and addressed to help develop high-performance management practices in Bahraini
industries. These barriers needed to be further investigated in a target population in Bahrain
in order to empirically verify the existence of the barriers, and hence direct effort to build
strategies for overcoming them.
2.7.4 Review of the most common/significant barriers
In this section, the 32 TQM implementation barriers making up the six
implementation barrier constructs identified through the process described in the previous
sections are reviewed. In each case, the literature supporting the significance of each of the
barriers is identified.
2.7.4.1 Top management barriers
1. Lack of visible commitment and support to quality by senior managers
Researchers agree that the leadership and commitment of top management is a key
driver of TQM (Powell, 1995; Black and Porter, 1996; Ahire et al., 1996; Flynn et al., 1994;
Samson and Terziovski, 1999). In a study of Malcolm Baldrige National Quality Award
(MBNQA) winners, Matta et al., (1996), found that the only factor that 100 percent of the
MBNQA winners considered critical to the success of TQM was top management’s
commitment and involvement. In a study of companies that won the Australia Quality
Award, Abraham et al. (1999) found the key factor in achieving a successful change to a
quality culture was management support. They stated that “managers must be clearly
perceived to support the change through communication, resource allocation and
recognition/reward” (p. 127). Research by TQM scholars (e.g. Wilkinson et al., 1993; Dale &
Cooper, 1994; Lakhe & Mohanty, 1994; Gudim & Meer, 1995; Soltani et al., 2003) has
identified low commitment of senior management as a roadblock and major challenge to
TQM success. Accordingly to Glover (1993), TQM definitely fails when it becomes so much
extra work for management instead of a new way of doing things.
The importance of top management commitment and support to quality for TQM
implementation is emphasized by many researchers such as Gobadian and Gallear (1996);

70
Flynn et al., (1994), Hellsten, (2000); Ahire,(1998); Ahire et al., (1996); Motwani, (2001).
Hence, lack of top management commitment and support to quality is a significant TQM
implementation barrier and is frequently reported in several previous studies (Sebastianelli
and Tamimi, 2003; Salegna and Fazel, 2000; Ngai and Cheng, 1997; Bhat & Raj, 2009; Jun
et al., 2004; Amar and Zain, 2002; Amaral and Sousa 2009; Master, 1996; and Zeng et al.,
2007). In addition to the TQM barrier studies selected in this research, there are several other
previous studies that have indicated the significance of this TQM implementation barrier
(Lua and Idris, 2001; Al-Khalifa and Aspinwall, 2000; Al-Zamani et. al, 2002; Dale, 1994;
MacDonald, 1992;, Bhanugopan, 2002; and Soltani et al., 2008).
2. Senior managers don’t communicate quality awareness within the organisation
The quality goals and objectives can only be set when managers recognize the
importance of quality improvement for the success of their organisation and this
understanding would develop through quality awareness (Oakland, 2003). More successful
companies create this awareness through development of information systems, fliers,
bulletins, notices, and, of course, through education and training (Huq, 2005). However,
according to Jones and Seraphim (2008), creating TQM awareness by defining the
company’s strategy, mission and vision are also highly successful approaches in TQM
implementation. Additionally, raising an awareness of the benefits of TQM is foremost
crucial action required in TQM implementation (Bardoel and Sohal, 1999). Furthermore, the
diffusion of TQM can also raise awareness of TQM among employees (Rogers, 1995).
Any lack of insight about the importance of quality awareness is considered a significant
barrier in TQM implementation. This barrier indicator is evaluated as critical for TQM
implementation in several previous studies (Salegna and Fazel, 2000; Ngai and Cheng, 1997;
Bhat & Raj, 2009). The significance of this barrier is complemented by the results of many
other previous studies on TQM implementation barriers (Shaohan and Robin, 2004; Kotey
and Slade, 2005; Thomas and Armstrong, 2004; Tannock et al., 2002; Soltani et al, 2008;
Zairi et al., 2008 ; Walsh et al., 2002). For example, according to Tannock et al (2002),
management and information issues (awareness) are vital barriers in TQM implementation.
Similarly, Lau and Idris (2001) concluded that lack of organisational information (awareness)
and data on the critical success factors is an obstacle in implementing TQM effectively and
comprehensively.

71
3. Senior managers do not allocate adequate resources for employees' training
The importance of skilled employees for the success of any organisation can’t be
overstated (Rice and Simard, 1996; Lau and Idris, 2001; Huq, 2006; Amar and Zain, 2002;
Oakland, 1997; Master, 1996; Adebanjo and Kehoe, 1998; Al-zamani et al., 2002; Sayle,
1994; Whalen and Rahim, 1994; Shaohan and Robin, 2004; Kotey and Slade, 2005). These
studies also found that inadequate resources for training is an obstacle for employee training
programmes that in turn adversely affects effective TQM implementation. The significance of
the barrier of inadequate resources for training in TQM implementation is verified in four
empirical studies (Ngai and Cheng, 1997; Sebastianelli and Tamimi, 2003; Jun et al., 2004;
and Bhat and Raj, 2009), which is consistent with the previous findings of Tamimi and
Sebastianelli (1998) who found several factors working against TQM implementation, one of
them was inadequate resources for employee training
The significance of this barrier in TQM implementation is also consistent with the
findings of Masters (1996) who found that insufficient training resources were working as a
factor leading to ineffective TQM implementation. Al-Khalifa and Aspinwall (2000)
mentioned that an obstacle faced in implementing quality in Qatar was limited resources to
implement change, including employee training. In addition many other authors such as
Oakland (1997), Amar and Zain (2002), Whalen and Rahim (1994), Sayle (1994), and
MacDonald (1992) have reported that a lack of resources for employee training is considered
to hinder quality management implementation. Finally, Yusof and Aspinwall (1999)
identified training resources as a critical factor, unique to organisations, that impacts TQM
implementation. They argued that if all TQM practices are considered important, then limited
resources have to be spread out across all of them.
4. Management style slows down learning culture
Manager's management skills should enhance the learning experience of employees in
order to keep them engaged and on-task. Managers can develop a learning culture by actively
observing the employees' progress through the activity and participating in the learning
process. Such kind of management style speeds up learning culture. Developing a learning
culture is critical for organisational growth as reported by previous studies (Amaral and
Sousa 2009; Angell and Corbett 2009).
72
Based on several company case studies, Kanji (1996) compiled a list of 12 poor
management practices that are key contributors to failed TQM initiatives and these included
“management style that inhibits a learning culture”. Hence, management style that inhibits a
learning culture is a significant TQM implementation barrier and is frequently reported in
several empirical studies (Sebastianelli and Tamimi, 2003; Salegna and Fazel, 2000; Jun et
al., 2004). Ghobadian and Gallear (1996) observe that the biggest obstacle to the introduction
of TQM is the inability of management to modify their management style to one that would
facilitate TQM implementation.
5. Frequent turnover of managers
Frequent turnover of managers is reported as a high level barrier in many previous
studies. The frequent turnover of executives adversely affects the consistency of policies and
consequently overall performance (Ngai and Cheng, 1997; Sebastianelli and Tamimi, 2003;
Jun et al., 2004). For example, changes in key executives (high turnover), is one of the key
barriers in the study by Ngai and Cheng (1997). While evaluating the relative significance of
management-related obstacles to TQM success, Deming (1986) listed the turnover of
management as the fourth deadly disease that impedes transition to a stable total quality
environment. Turnover of managers is perhaps the simplest and yet one of the most deadly
diseases because frequent changes in top management means continuous improvement efforts
will be broken and disjointed as the new leaders come on board because with changes in
leadership, there is frequently a change in management philosophy (Deming, 1986; Schwinn,
2002). Supporting this argument, Sebastianelli and Tamimi (2003) argued that one of the
critical potential barriers to TQM implementation is frequent turnover of management
because it breaks down or slows down the momentum of the change process.
Several other researchers have argued that frequent turnover of managers is not a
healthy precursor for TQM implementation and its development (Amaral and Sousa 2009;
Bhat and Raj, 2009; Angell and Corbett, 2009; McFadden et al., 2006). Given that the top
management is considered to be the necessary driver for any quality initiative, leadership
instability can only lead to unfavourable outcomes (Tamimi and Sebastianelli,1998 and
Salegna and Fazel, 2000).

73
6. Many layers of management
In flat organisations with very few layers of management, top management is highly
visible and close to the point of delivery. This kind of faster communication line helps to
faster a quick decision-making process and faster implementation due to short decision-
making chain. The system with fewer layers of management allows flexibility and fast
response to customer needs which is important in TQM (Powell, 1995; Black and Porter,
1996; Ahire et al., 1996; Samson and Terziovski, 1999). Excessive layers of management
can create communication gaps and are a potential cause of delayed decision processes
which result in missing opportunities, particularly in fast paced business activities
(Sebastianelli and Tamimi, 2003; Bhat and Raj, 2009; and Jun et al., 2004). Therefore, the
TQM implementation barrier “existence of many layers of management” is significant
and frequently reported in TQM literature.
2.7.4.2 Employee barriers
1. Lack of empowerment to apply quality improvement efforts
The Concept of employee empowerment has almost become synonymous with TQM
(Reed et al. 2000). The Extant TQM literature has identified employee empowerment as a
critical factor of TQM implementation (Li et al., 2001; Claver et al., 2001; Davidson et al.,
2001; Dale et al., 2001; Zhang et al., 2000; Rao et al., 1999). Among the founders of TQM,
the idea of empowerment was highlighted by Feigenbaum and then supported by Deming but
only Juran (1995) promoted the concept of empowerment more forcefully. Acknowledging
some differences among quality award models, there is complete convergence in their content
about empowerment. Hence, empowerment of employees in terms of delegating them more
responsibility is recognized as a key source of giving them a greater sense of confidence and
self-esteem (Zu et al., 2010). As defined by Huq, (2005), empowerment means respecting the
employees and their ideas; as well as drawing upon their expertise and talents to meet the
objectives of organisations.
Therefore, the barrier indicator “lack of empowerment of employees to apply quality
improvement efforts” is a reflection of centralized control in decision making and other job
related functions which adversely affects organisation goals. Several previous studies on
TQM implementation barriers have identified this barrier as significant (Huq, 2005; Rad,
74
2004; Amar and Zain, 2002; Amaral and Sousa 2009; and McFadden et al., 2006). This
barrier is also considered significant in the findings of four empirical studies on TQM
implementation barriers (Sebastianelli and Tamimi, 2003; Salegna and Fazel, 2000; Bhat and
Raj, 2009; and Jun et al., 2004).
2. Lack of involvement in improvement projects
TQM is an integrated management philosophy that emphasizes increased employee
involvement and teamwork (Ross, 1993). Employee involvement in the TQM implementation
process is critical to TQM success (McAdam and Kelly, 2002; Lawler et al., 1995; Buch and
Rivers, 2002). Full involvement of the entire workforce is essential if TQM is to be
successfully implemented (McAdam et al., 2004). An open culture that encourages
employees to participate in development of visions, strategies, and plans has to be created by
management to increase employee involvement (Rad, 2005). Employees won’t feel that they
are responsible for customer satisfaction if they are excluded from such decision making
activities.
Therefore, lack of involvement of employees in improvement projects reflects
centralized control in decision making and other job related functions. If there is a lack of
involvement of employees in organisation activities, employees can feel neutral to the
organisation’s mission, aim and objectives (Lawler et al., 1995). The findings of three
empirical studies on TQM implementation barriers have identified this barrier as significant
(Sebastianelli and Tamimi, 2003; Salegna and Fazel, 2000; Bhat and Raj, 2009).
3. Lack of training in quality improvement skills
Quality experts universally agree that training of management, supervisors, and hourly
workers greatly enhances the chances of success in implementing a TQM strategy (Kassicieh
and Yourstone, 1998). Training can move an organisation beyond preventing errors to a point
at which breakthrough achievements are realized (Juran and Frank, 1993). Easton (1993) stated
that organisations receiving high scores on TQM award applications have delivered basic
quality training to all their employees. The implementation of most, if not all quality
programmes means more involvement and teamwork, which require more responsibility and
a greater level of skill and knowledge by the employees (Ross, 1993). This should be
achieved through proper, formal and systematic training and education (Brown et al., 1994).

75
Depending on the needs of a particular organisation, training and education should cover the
entire workforce as part of an ongoing process and more attention should be attributed to
management techniques and quality management issues (Yusof and Aspinwall, 2000).
Tamimi and Sebastianelli (1998) confirmed the presence of two major barrier
indicators in their study of US firms - “employees are not trained in quality improvement
skills” and “employees are not trained in problem identification and problem solving
techniques”. An associated resource factor limiting effective TQM is the lack of sufficient
funds to mobilize TQM driven activities such as instituting training programmes, and
providing quality resources,. The significance of this barrier is consistent with the studies of
Oakland (1997), Masters (1996), Adebanjo and Kehoe (1998), Amar Mohd Zain (2002), Al-
Zamani et al. (2002), Sayle (1994), and Whalen Rahim (1994) who found identical results.
The significance of this barrier is also supported by the findings of many authors in
the wider TQM literature, such as Sebastianelli and Tamimi (2003); Ngai and Cheng (1997);
Bhat and Raj (2009); and Jun et al. (2004). All these authors insist that there is a need for
training programmes in any business and advocate that the lack of sufficient quality training
and education has a negative effect on the quality of business. They also conclude that lack of
quality training and education programmes are the main obstacles that many organisation
face in establishing an improvement ethos.
4. Lack of employee training in group discussion and communication techniques
Employees need to be trained in group discussion and communication techniques, as
these are regarded as the basic tools of quality and process improvement, and problem
identification/Problem-solving skills (Sebastianelli and Tamimi, 2003). Ghobadian and
Gallear (1996) reported ineffective communication as a main obstacle in TQM
implementation. Similarly, Gunasekaran (1999) examined the enablers of TQM
implementation in a British manufacturing company using structured interviews of
employees and found that major enabler of TQM implementation was communication
between managers/supervisors and staff, and that poor communication between departments
was a real barrier to implementing TQM. It has been observed in many organisations that
supervisors and workers possess technical skills, but lack the communication skills to ensure
success in today's complex operations (Dale, 2007). A good balance of technical skills and
managerial skills is required for success which can be done through specific training
programmes for improvement of group discussion and communication techniques (Oakland,

76
2003). Lack of training in group discussion and communication techniques adversely affects
TQM implementation as reported by four empirical studies that identified this barrier as
significant (Sebastianelli and Tamimi, 2003; Salegna and Fazel, 2000; Angell and Corbett
2009; and Minjoon et al., 2004).
5. Lack of recognition for achievements in quality improvement
Recognition for achievements in quality improvement is usually facilitated through
performance appraisal and reward system. During performance appraisal management sets
priorities and goals for individual employees, provides performance feedback, identifies
individual strengths and weaknesses; and identifies training needs (Murphy and Cleveland,
1991). Based on performance appraisal, employees are rewarded for improvement that can
positively affect employee morale and loyalty. Glover (1993) argues that without a change in
management evaluation and reward policy, TQM cannot be taken seriously. He advocated
that “managers will need to know that their evaluations, and subsequent pay increases and
bonuses, are dependent on having high levels of quality, satisfied staff and consumers, and
effective TQM implementation in their respective areas of responsibility” (p. 63). In an
empirical study by Rad (2005), the performance appraisal and reward system problems were
found significant barriers of TQM implementation. The study found that the problems in
these organisations were due to lack of mechanisms for measuring organisation’s activities,
lack of continuous quality control, and lack of feedback from customers. Subsequent
research, based on both case studies and surveys, has led to similar conclusions regarding the
performance evaluation and reward system in the success of TQM (Powell, 1995; Black and
Porter, 1996; Ahire et al., 1996; Flynn et al., 1994; Samson and Terziovski, 1999).
Employees need to be empowered to implement quality improvement efforts, and, when
successful, they need to receive appropriate recognition for their achievements (Oakland,
2003). Without such opportunities and a supportive environment, employees might feel
frustrated, thereby contributing to more frequent turnover (Ngai and Cheng, 1997). A critical
lack of recognition of employees for achievements in quality improvement affects morale and
motivation (Kassicieh and Yourstone, 1998). The findings of various previous studies have
verified the significance of lack of recognition for achievements in quality improvement as a
significant TQM implementation barrier (Lau and Idris, 2001; Oakland, 1997; Adebanjo and
Kehoe, 1998; Al-zamani et al., 2002; Sayle, 1994; Whalen and Rahim, 1994; Shaohan and
Robin, 2004; Kotey and Slade, 2005; Huq, 2006; Amar and Zain, 2002; Amaral and Sousa

77
2009). The significance of this barrier is also established by four of the five selected
empirical studies namely Sebastianelli and Tamimi (2003), Ngai and Cheng (1997), Bhat and
Raj (2009), and Jun et al. (2004).
6. Lack of job satisfaction
According to Rad, (2004a), optimum outcome quality is linked with job satisfaction.
When employees are not satisfied with their job, there will be frequent cases of employee
turnover (Oakland, 1997; Al-zamani et al., 2002; Dale, 2007; Shaohan and Robin, 2004;
Kotey and Slade, 2005; Huq, 2006; Amaral and Sousa 2009). Various studies have used
employee turnover rate (lack of job satisfaction) to measure TQM success (Ahmadi and
Helms 1995; Guimaraes 1997). TQM creates an environment that requires and nurtures job
satisfaction (Gunasekaran, 1999; Youssef et al., 1996; Rad, 2003, 2004c). Hence, lack of job
satisfaction inhibits the TQM implementation process. The lack of job satisfaction can occur
due to multiple factors such as inappropriate performance evaluation and reward system
(Sebastianelli and Tamimi, 2003; Salegna and Fazel, 2000); lack of empowerment and
participation (Ngai and Cheng, 1997; Amaral and Sousa 2009; and Angell and Corbett 2009);
low motivation (Salegna and Fazel, 2000); poor work environment and lack of incentives
(McFadden et al., 2006).
7. Resistance to change
The TQM implementation barrier resistance to change is frequently reported in the literature.
Comparing the results with previous studies in TQM implementation, Bhat and Raj, (2009)
found that “employees are resistant to change” was a main barrier in Indian industries.
According to Amar and Zain (2002), TQM programmes are often viewed with scepticism,
and are destined to fail if they do not get the full support of the entire work force. They
argued that organisations that score highly on items such as “employees are resistant to
change” and “quality is not everyone’s responsibility” most likely have leaders who have
failed at communicating their commitment to quality in concrete ways (for example,
preparing employees for changing roles and job responsibilities in a TQM environment). In
such environments, managers might see little possibility of success, leading eventually to
more frequent employee turnover (Ali et. al., 2008). In change management, the attitude of
employees towards quality is seen to be one of the greatest barriers in many organisations. It
has been reported that it is very difficult to change the mindset of the employees with regards

78
to quality (Oakland, 2003). If employees believe that quality is a needless task and added
cost, they are unlikely to accept it as an integral part of the job (Dale, 2007).
Buchanan (1989) argued that it is the lack of sufficient training in TQM techniques
due to which people will resist or at least be less committed to any change initiatives.
Employees’ resistance to change or low commitment can be justified on human
considerations (Crosby, 1979; Deming, 1986; Ishikawa, 1985). Wilkinson et al. (1998) argues
that the emphasis of TQM is on autonomy, creativity, active cooperation and self-control for
employees, with employee involvement a key theme, but the evidence overwhelmingly
shows that managers do not take action to engage the employees to recognize the TQM
philosophy and its benefits – that consequently results in resistance to change and failure of
TQM. Soltani et al. (2008), refers to a 2002 article in Gallup Management Journal that
concludes that more than half of the employees may not be engaged with their work.
According to Wilkinson et al. (1998), management is charged with ultimate responsibility for
quality because 85 percent of failures are reckoned to be the fault of inadequate management
systems that generate employee resistance. Therefore, employee resistance is relative rather
than absolute, and whatever the roots of this barrier might be, it is a significant barrier in
TQM implementation. This barrier is found significant in three empirical studies
(Sebastianelli and Tamimi, 2003; Ngai and Cheng, 1997; Jun et al., 2004).
2.7.4.3 Customer barriers
1. Lack of effective system to measure customer satisfaction
Total quality management (TQM) is philosophy which aims to provide organisations
with a template for success through customer satisfaction (Rad, 2004a). Many TQM
researchers have concluded that core objective of TQM is to delight the customers.
According to Kanji and Asher (1996), the first one of eight core concepts of TQM is
customer satisfaction. Many other researchers have identified customer satisfaction as a core
factor of TQM implementation (Deming, 1986; Crosby, 1989; Oakland and Porter, 1994; Rao
et al., 1996; Spring et al., 1998; Oakland, 2000; Kanji, 1998a, b; Zairi, 1999a, b, 2000;
Winser and Corney, 2001; Li et al., 2001; Nakata, 2002; Hitchcock and Willard, 2002).
Adebanjo and Kehoe (1998), who studied TQM implementation in UK manufacturing
organisations, identified upper management not insisting on the systematic measuring of
customer satisfaction as a key quality problem. Customer satisfaction is generally measured

79
by direct contact with customers, e.g. using surveys or focus groups, or indirect inferences
about customer satisfaction from the complaint data or measurement of repeat business. The
main problem appears to be associated with lack of measurement of key indicators (i.e.
measuring customer satisfaction) and the absence of information infrastructures which enable
senior executives to understand the effectiveness of their TQM implementations (Taylor,
1997). Lack of such measurement has adverse implications on TQM implementation and its
success.
Grant et al. (1994) point out that customer focus and the measurement of customer
satisfaction has a vital implication on long-run profitability of an organisation. The barrier
“lack of effective system to measure customer satisfaction” is thus highly significant, as has
been established by Sebastianelli and Tamimi,(2003); Salegna and Fazel(2000), Bhat and Raj
(2009) and Jun et al. (2004).
2. Needs and expectations of customer not assessed
The business environment is getting more and more dynamic and the future is full of
challenges for managers because it is getting difficult to manage competition and customer
expectations. Quality has moved from exceeding customer expectations (Parasuraman et al.,
1985) towards delighting the customer (Peters, 1989) but needs and expectations of customer
are scantly assessed in order to find ways and means to delight the customer. Flynn et al.
(1994) defined the main TQM objective as to “meet or exceed customer expectations”.
Deming (1986) stressed that quality should be aimed at the needs of the consumer, both
present and future. Quality then is simply meeting the customer requirements and this has
been expressed in many ways by many other authors as well.
Reviewing the theories of three quality gurus (Deming, Juran, and Ishikawa),
Hackman and Wageman (1995) identified six interventions as the core of TQM and first and
foremost was the “explicit identification and measurement of customer wants and needs”. For
TQM implementation, it is recommended that particular attention is given to customer
expectation and the benefits to be gained (Ghobadian and Gallear, 2001). An organisation
cannot be said to be truly practicing total quality if it is not actually measuring important
attributes such as customer satisfaction (Taylor, 1997), organisations such as these ought to
focus on developing their knowledge infrastructure by providing knowledge of customer

80
needs and expectations, customer satisfaction levels and business performance relative to
competitors.
The barrier indicator “needs and expectations of customer not assessed” thus also has
a high significance, as has been established by Bhat and Raj, (2009) Angell and Corbett
(2009) Sebastianelli and Tamimi, (2003) Salegna and Fazel (2000) and Jun et al., (2004).
3. Lack of effective customer feedback system
Oakland (2003) suggests that implementing an effective and efficient system of
quality management, continuous monitoring and evaluation of processes and getting good
feedbacks from customers are the most important factors in success of TQM. Getting the
feedback is a process of self-assessment that highlights strengths and improvement
opportunities, and drives continuous improvement (Oakland, 2000; Conti, 1999). The works
of two of five TQM gurus, Feigenbaum and Ishikawa mainly concentrate on feedback and
control. However, Deming also argues for continuous process improvement based on
feedback and measurement system (plan do check act) and the same idea is implicit in
Crosby's 14th step which exhorts managers to ensure that the quality process never ends.
Kearney (1991) underlined the importance of measurement to get feedback from customers
and give feedback to employees about how the organisation is doing and to engender
employee involvement. However, in a later report the same author highlighted the absence of
feedback and measurement system in a large number of TQM organisations (Kearney, 1992).
Therefore, the barrier indicator of lack of effective customer feedback system exists in TQM
organisations with all its harmful implications.
A major underlying principle of customer focus in TQM is the requirement to collect
customer information and analyze their feedback (Powell, 1995; Black and Porter, 1996;
Ahire et al., 1996; Flynn et al., 1994; Samson and Terziovski, 1999). The findings of some
previous studies such as Tamimi and Sebastianelli (1998), Nagi and Cheng (1997), and
Adebanjo and Kehoe (1998) concerning customers' requirements and feedback signify this
barrier. Many authors have considered the “lack of customer requirements and feedback
system” as one of the very important barriers facing the organisations in their pursuit of TQM
(Bhat and Raj, 2009; Angell and Corbett 2009; Sebastianelli and Tamimi, 2003; Salegna and
Fazel; and Jun et al., 2004).

81
4. Lack of contact with key customers
Customers’ real requirements and future needs should be determined as a goal, and
close contact with the customers should be maintained to identify their changing needs and
requirements regularly via such methods as focus groups, and customer site visiting, and
performance should be measured against those requirements on a continuous base (Deming,
1986; Johston and Daniel, 1991; Hackman and Wageman 1995; Bullington et al., 2002). A
number of scholars have found that maintaining vibrant contact with customer is significantly
and positively related to customer satisfaction (Grandzol and Gershon, 1997; Forza and
Flippini, 1998; Nair, 2006). According to Chong and Rundus’s (2004), and Fuentes’s et al.
(2004) studies, it is imperative that organisations know their customers’ current and future
needs and are in close contact with their customers to enhance TQM improvement in TQM
implementation.
According to Zehir and Sadikoglu (2007), customer satisfaction is the extent of the
perceptions of the customers in meeting their needs and requirements by the products and
services. An example of this is “customer-driven focus” as the customer is the “final arbiter
of quality” and the attributes of the product and service determine customer satisfaction and
demand (Anderson et al. 1994; Evans and William, 1993). Deming (1994, 1981-82, 1986)
claims that dissatisfied customers can be harmful to the company performance so the workers
who are in contact with the customers should be given high priority to satisfy the customer.
Satisfied customers can become loyal and thus improve well-being of the company. Internal
customers, whose work depends on the prior work, are also important and employees must
view themselves as customers of and suppliers to other employees (Evans and William, 1993;
Dean and Bowen, 1994).
An organisation can establish a good understanding of what the customer wants
through keeping close customer contact and obtaining customer feedback. Furthermore, it
should be recognized that customers are not only those to whom organisations sell
products/services but are also their internal staff (Deming, 1986). The significance of this
barrier was established by Bhat and Raj, (2009); Angell and Corbett (2009); Sebastianelli and
Tamimi(2003); Salegna and Fazel(2000); and Jun et al.(2004).

82
2.7.4.4 Planning barriers
1. Strategic plans are not customer driven
Among the quality gurus, with the exception of Crosby, all pay substantial attention to
customer driven quality planning, but their emphases are very different; where Juran covers
all aspects of quality planning, Deming is mostly concerned with action planning. Planning is
one of the key stepping stones to accomplish any task while strategic planning is one of the
key factors of TQM practices (Wilson and Collier, 2000; Sadikoglu and Zehir, 2007; Parast et
al., 2006). Feng et al. (2006) in their comparative study found that customer driven strategic
planning in TQM practice does have significant impact on organisational performance.
Quality gurus and writers strongly emphasize the importance of customer driven strategic
planning process based on total quality (Deming, 1986; Zairi, 1994, 1999a; Oakland, 1993;
Ahire et al., 1996; Sinclair and Zairi, 2001; Dayton, 2001; Martinez-Lorente et al., 1998;
Sureshchandar et al., 2001; Crepin, 2002; Hitchcock and Willard, 2002).
There appears to be a multitude of reasons why companies fail in their effort to
implement a quality management system, however, a common problem appears to be a lack
of customer driven strategic planning (Sebastianelli and Tamimi, 2003). The TQM barrier
“strategic plans are not customer driven” is widely cited in the literature, as established by
Sebastianelli and Tamimi, (2003); Salegna and Fazel, (2000); Ngai and Cheng, (1997);
Amaral and Sousa (2009); Bhat and Raj, (2009); Whalen and Rahim, (1994); Rad, (2004);
McFadden et al., (2006); and Jun et al., (2004).
2. Strategic plans don't include quality goals
Developing strategic planning without considering quality goals is reported as
important barriers of TQM success in various previous studies (Shaohan and Robin, 2004;
Kotey and Slade, 2005; Thomas and Armstrong, 2004; Tannock et al., 2002; Soltani et al,
2008; Zairi et al., 2008 ; Walsh et al., 2002). These barriers included lack of planning and
long-term quality policies, lack of mechanisms for formulating strategic quality plan, non-
clarity of quality objectives, inflexibility of organisation toward environment and technology
change and lack of legal elements for providing quality services. In order to meet quality
goals of the organisation, strategic quality planning, customer-driven quality, aligning
process to improve customer satisfaction, and monitoring and evaluation of quality are all

83
necessary (Lau and Idris, 2001; Oakland, 1997; Adebanjo and Kehoe, 1998; Al-zamani et al.,
2002; Sayle, 1994; Whalen and Rahim, 1994; Shaohan and Robin, 2004; Kotey and Slade,
2005; Huq, 2006; Amar and Zain, 2002; Amaral and Sousa 2009). Therefore, strategic plans
that don't include quality goals are likely not to be successful and act as barrier to TQM
implementation.
The TQM barrier indicator of “strategic plans don't include quality goals” is highly
significant. As established by Ngai and Cheng (1997); Amar and Zain (2002); Amaral and
Sousa (2009); Bhat and Raj (2009); McFadden et al. (2006); Jun et al. (2004); Ali et al.
(2008); and Zeng et al. (2008).
3. Lack of institutionalizing new approaches/tools/techniques
According to Sousa-Poza (2000), implementation of the ``philosophy'' of TQM is
more difficult because it requires alignment in the way the members of the organisation think
and behave. However, application of the management tools can be relatively straightforward,
since it requires limited modification in attitude and behavior. TQM is associated with a
number of management tools or methodologies, such as statistical process control (SPC),
quality circles (QC), just-in-time (JIT), and benchmarking. According to Shaba et al (1993)
TQM is not merely ``an abstract philosophy'' but includes both concepts (a philosophy) and
practices (tools). These tools are evolving with respect to change in business environment and
change in technology. Therefore, organisations need to institutionalize new
approaches/tools/techniques.
Katter (1995) identified eight common management errors and “not institutionalizing
new approaches” was one of them. The TQM barrier “lack of institutionalizing new
approaches /tools /techniques” has been reported as significant in many previous studies
(Keya and Zain, 2002; Amaral and Sousa 2009; Whalen and Rahim, 1994; Angell and
Corbett 2009; Huq, 2005; Rad, 2004; McFadden et al., 2006). Furthermore, three of the
selected empirical studies support the significance of this barrier (Sebastianelli and Tamimi,
2003; Salegna and Fazel, 2000; Bhat and Raj, 2009).

84
4. Not enough joint planning activities with suppliers
The TQM barrier indicator of “not enough joint planning activities with suppliers” is
reported as significant in literature. TQM is an integrated management philosophy and set of
practices that emphasizes increased closer relationship with suppliers (Ross, 1993; Brown,
1992). The focus on suppliers and partners and their involvement is critical for TQM success
(Rad, 2003, 2004b). TQM demands improved relations with suppliers, a true working
partnership (Gunasekaran, 1999; Youssef et al., 1996). In the case of TQM, firms' actions are
driven by the relationships with suppliers (Reed at al., 2000). According to Taylor (1997),
improvement of any business is dependent to some extent on the quality of its suppliers and
sub-contractors (Taylor, 1997). The involvement of external suppliers in TQM development
efforts is reported as an important TQM success factor (Kanji, 1998). Lack of long-term
supplier relationship is reported as a barrier impeding the implementation of TQM
(Rajashekhar, 1999). Bhat and Raj (2009) reported in their study that lack of joint planning
with suppliers was assessed as a critical TQM implementation barrier in Indian industries.
This indicator was found significant in many previous studies (Sebastianelli and
Tamimi, 2003; Salegna and Fazel, 2000; Ngai and Cheng, 1998; Kifyah and Zain, 2002;
Amaral and Sousa 2009; Bhat and Raj, 2009; Whalen and Rahim, 1994; Angell and Corbett
2009; Huq, 2005; Rad, 2004; McFadden et al., 2006; Minjoon et al., 2004).
2.7.4.5 Process management barriers
1. Lack of a comprehensive quality programme
The TQM barrier indicator of lack of a comprehensive quality programme means that
quality initiatives do not include all organisational functions/departments. A quality
management system in any form is all inclusive, and quality initiatives should include all
organisational functions/departments. TQM implementation spans the entire range of
activities deemed critical by TQM authors (e.g. Saraph et al., 1989; Flynn et al., 1994;
Powell, 1995; Ahire et al., 1996; Black & Porter, 1996; Zeitz et al., 1997). These authors
suggest that in a comprehensive quality programme, there are no short-cuts to quality, no
quick fixes, and that improvement requires full commitment and support from the top,
extensive training and participation of all employees. Lakhe and Mohanty (1994); Macdonald
(1995); and Kanji (1995) suggest the lack of comprehensive quality improvement programme
is a roadblock and major challenge to TQM implementation efforts in organisations. The
TQM implementation barrier of lack of a comprehensive quality programme was found

85
significant in many previous studies (Sebastianelli and Tamimi, 2003; Salegna and Fazel,
2000; Ngai and Cheng, 1997; Kifyah and Zain, 2002; Amaral and Sousa 2009; Bhat and Raj,
2009; Whalen and Rahim, 1994; Angell and Corbett 2009; Huq, 2005; Rad, 2004; McFadden
et al., 2006; Jun et al., 2004).
2. Quality initiative is delegated to selected individuals only
When the TQM initiative is only delegated to selected individuals, it loses its
momentum. Therefore, TQM is best developed in a team environment through organisation-
wide effort, which involves the entire workforce to concentrate on continuous improvements
(Bounds et al., 1994). TQM is associated with a single “homogeneous” culture and TQM is
promoted as a set of organisation-wide practices that unify mindsets and perceptions among
members of an organisation (Prajogo and McDermott, 2005). Hence, it is imperative that the
existing quality management system is all-encompassing and pervasive. TQM is more
successful when top management, the middle management, and the workforce at every level
participate as a team in decisions affecting their work (Crosby, 1989; Kanji and Asher, 1993;
Cebeci and Beskese, 2002; McAdam and Kelly, 2002; Everett, 2002; Mehra et al., 1998). A
participative work culture is developed when quality becomes everybody’s responsibility by
involving everyone in improving the way things are done (Ho and Fung, 1994).
TQM barrier indicator of “quality initiative is delegated to selected individuals only”
is found significant in previous studies (Sebastianelli and Tamimi, 2003; Salegna and Fazel,
2000; Ngai and Cheng, 1997; Kifyah and Zain, 2002; Amaral and Sousa 2009; Bhat and Raj,
2009; Whalen and Rahim, 1994; Angell and Corbett 2009; Huq, 2005; Rad, 2004; McFadden
et al., 2006; Minjoon et al., 2004).
3. Ineffective communication with stakeholders
Emphasizing people-oriented factors, such as teamwork and empowerment,
Gunasekaran (1999), found that poor communication between departments was a real barrier
to implementing TQM in a British manufacturing company. Poor inter organisational
communication was found to be a critical barrier to TQM implementation by Salegna and
Fazel (2000). Ngai and Cheng (1997) found that organisational issues such as ineffective
internal and external communication network were significant barriers in TQM
implementation. According to Soltani et al. (2008), ineffective internal communication
86
between management and employees (poor managerial systems), and low engagement of
other levels of management within the organisation is a significant obstacle in TQM
implementation. Effective communication is important for the success of any quality
initiative and is critical from the beginning of a change effort (Martinez-Lorente et al., 1998;
Sureshchandar et al., 2001; Magurez et al., 2001). According to Ghobadian and Gallear
(2001), the vast majority of references to the implementation initiative emphasize the need to
develop communication channels. These authors further state that solving quality problems
requires cross-functional communication at various levels throughout the organisation, which
typically means establishing and using teams. Similarly, Sebastianelli and Tamimi (2003);
Kifyah and Zain (2002); Amaral and Sousa (2009); Bhat and Raj (2009); Huq (2005); Rad
(2004); and Jun et al. (2004) have also demonstrated that ineffective communication with
stakeholders is a valid barrier in TQM implementation.
4. Inadequate resources to effectively deploy TQM
While identifying the constraints on resources available for effectively implementing
TQM, Sebastianelli and Tamimi (2003) concluded that “inadequate resources for TQM” is a
major obstacle to TQM implementation. One of such resources is inadequate human resource
development and management. These authors argue that organisations that wish to pursue
TQM and be successful in its implementation need to develop their employees by providing
training in group discussion and communication techniques, the basic tools of quality and
process improvement, and problem identification/ problem-solving skills. Similarly, it is
difficult for managers to implement TQM practices without top management devoting the
necessary tangible resources such as time and money (Sebastianelli and Tamimi, 2003). They
further argue that an environment that does not invest in the resources necessary to make the
implementation of TQM successful undoubtedly sends the message that the benefits derived
from TQM are not worth the cost, representing a short-term focus. In short-term thinking, the
leaders are viewing the allocation of resources to TQM as “cost” rather than “investment” in
the future viability of the organisation. Management must provide adequate resources in
every aspect of TQM to ensure effective and efficient use of all available resources (Zadry
and Yosuf, 2006). These authors argue that most of the TQM training programmes fail due to
lack of financial resources. Ghobadian and Gallear (1996) also argued that the extent of
training in organisations is limited because of financial constraints.
87
TQM barrier indicator of “inadequate resources to effectively employ TQM” is also
reported as common barrier other researchers (Salegna and Fazel, 2000; Ngai and Cheng,
1997; Kifyah and Zain, 2002; Amaral and Sousa 2009; Bhat and Raj, 2009; Whalen and
Rahim, 1994; Angell and Corbett 2009; Huq, 2005; Rad, 2004; McFadden et al., 2006;
Minjoon et al., 2004).
5. Cross functional teams are not used
Sebastianelli and Tamimi (2003) found that “Cross functional teams are not
employed” is a critical barrier in TQM implementation. The management literature tells us
that teams are appropriate when there is a need for the coordination of activities, where work
needs to be creative, or where major breakthroughs in performance are required (Reed, et al.,
2000). Creation of cross-functional teams with the goals to ensure that jobs, systems, and
roles in quality improvement are understood help eliminate other barriers (Rad, 2005). This
author further states that these cross-functional teams continuously evaluate systems and
processes to ensure that they work efficiently and effectively. Also, research has shown that
in addition to providing an innovative approach to solving production problems, cross-
functional teams also can help reduce product development times (Eisenhardt and Tabrizi,
1995). It has been argued that team composition, the demographic and functional diversity of
team members, affects performance and outcomes (Bettenhausen, 1991). When teams are
composed of members with varying organisational perspectives, there should be better
information available about potential future problems (Eisenhardt and Tabrizi, 1995; Gold,
1987; Imai et al., 1985). It has also been concluded that heterogeneity in teams is related to
creativity and, ultimately, to decision-making effectiveness (Jackson et al., 1991). Bantel and
Jackson (1989) found that organisational innovations were positively associated with the
increased functional heterogeneity of teams. The ability to generate better solutions to
problems, creativity, better decision-making, and organisational innovation are all difficult (if
not impossible) to codify. The literature implies that they emerge from the chemistry among
team members which, if correct, represents a strong form of tacitness.
The TQM barrier indicator of “cross functional teams are not used” is a significant
barrier as identified by Sebastianelli and Tamimi, (2003); Salegna and Fazel, (2000); Ngai
and Cheng, (1997); Kifyah and Zain, (2002); Amaral and Sousa (2009); Bhat and Raj,
(2009); Whalen and Rahim, (1994); Angell and Corbett (2009); Huq, (2005); Rad, (2004);
McFadden et al., (2006); and Minjoon et al., (2004).
88
2.7.4.6 Information management barriers
1. Poor inter-organisational communication
There is an increasing recognition that non-technical skills such as delegation of tasks,
communication, management and leadership are all important within organisations. As Al-
Khalifa (2000) highlighted , regular and effective communication is necessary for all phases
of the change process, as this will enable the new change to be clarified and to ensure that
those who will be affected by the change are kept informed from the early stages, about
progress and about their particular role in the process. Communication therefore needs to be
managed coherently and honestly.
Salegna and Fazel (2000) argued that inter organisational communication plays an
important role in TQM implementation. Inter organisational communication is maintained by
high use of user manuals, technical documentations, media, corporate portal to disseminate
the TQM ideas and an effective feedback/suggestion system (Huq, 2004). Maleyeff (2006)
found that internal communication systems have numerous common structural characteristics,
including the importance of information, process flows across functions, many hand-offs of
information and that lack of such characteristics results in communication breakdowns.
Maleyeef (2006) further emphasized that poor coordination and communication between
functions; for example, lack of understanding between functions, lack of information from
other departments especially when trying to solve problems for the customers or silo
mentality - focus on just own bit are critical inter organisational communication barriers.
Masters (1996) emphasized that open, non-threatening communication is critical for TQM
implementation and required everyone in the organisation to work to implement TQM
principles by communicating company vision, mission, and goals; and providing open
communication about the company's new focus. Kassicieh and Yourstone (1998) reported
that a significant barrier to quality improvement is a lack of communication throughout the
organisation, arguing that lack of communication of the need to change the organisation is
likely to negatively affect the outcome and only training can be a very effective means by
which to communicate the tools and strategy for change.
The TQM barrier indicator of “poor inter-organisational communication” in Bahraini
industries is highly significant. This indicator was also found significant in many previous
studies (Sebastianelli and Tamimi, 2003; Salegna and Fazel, 2000; Ngai and Cheng, 1997;

89
Kifyah and Zain, 2002; Amaral and Sousa 2009; Bhat and Raj, 2009; Whalen and Rahim,
1994; Angell and Corbett 2009; Huq, 2005; Rad, 2004; McFadden et al., 2006; Jun et al.,
2004).
2. Individuals do not liaise with other departments
Lacking a good communication and information system negatively affects the
industry operation. This implies that co-ordination and co-operation both internal and
external are essential. This argument is consistent with some authors' opinion such as
Oakland (1997), Ngai and Cheng (1997), Salegna and Fazel (2000) and Al-Zamani et al
(2002). These authors also mentioned that ineffective internal and external communication
networks in an organisation put a lot of barriers in the way of improving business.
The attributes of practices and information that act as diffusion barriers within
organisations are its leakiness and stickiness - information travels more easily between
organisations (information is leaky) than within organisational departments (information is
sticky) (Brown and Duguid, 1991). Organisational practices are difficult to replicate across
departments and individuals do not frequently liaise with other departments because diffusing
information among groups with similar professions is easier than moving it across heterogeneous
departments within a firm (Brown and Duguid, 1991; Davenport and Prusak, 1998). However,
TQM demands individuals to liaise with other departments in order that all departments have the
same direction and same objectives. For example, HR department and engineering department do
have employees with different academic qualification and technical skills sets but they have
identical objective of TQM implementation. Therefore liaison among different departments in
terms of process flow across departments is very critical. The TQM barrier indicator of
“individuals do not liaise with other departments” was found to be significant in many
previous studies (Sebastianelli and Tamimi, 2003; Salegna and Fazel, 2000; Ngai and Cheng,
1997; Kifyah and Zain, 2002; Amaral and Sousa 2009; Bhat and Raj, 2009; Whalen and
Rahim, 1994; Angell and Corbett 2009; Huq, 2005; Rad, 2004; McFadden et al., 2006;
Minjoon et al., 2004).
3. Lack of disseminating quality and performance information
Disseminating quality and performance information has been identified as one of the
most important managerial issues of the late 1990s (Szulanski, 1996). Successful companies

90
are those that consistently create new knowledge, disseminate it through the organisation, and
embody it in technologies, products, and services (Earl and Scott, 1999). The proliferation of
information and communication technologies has fuelled organisational interest in the
possibilities of knowledge management (Chumer, et al. 2000). Indeed, there is a growing
importance of being able to identify and transfer knowledge in organisations. Disseminating
quality and performance information is an important aspect of organisational improvement
(O'Dell and Grayson, 1998). However, organisations often fail to “know what they know”
(Huber, 1991; O’Dell and Grayson, 1998). Grant (1996) states that knowledge should be
disseminated throughout the organisation at the direction of top management through
education and training programmes that goes with activities such as the setting up of teams
and provides cues for individuals to react to the problems. Top managers believe that
awareness and understanding of TQM would transfer gradually to the employees through
their managers and supervisors, however these people themselves need to have more
understanding of quality issues to be able to educate or train the others in order to create
awareness about quality needs. The TQM barrier indicator of “lack of disseminating quality
and performance information” was found significant in many previous studies (Kifyah and
Zain, 2002; Amaral and Sousa 2009; Whalen and Rahim, 1994; Angell and Corbett 2009;
Huq, 2005; Rad, 2004; McFadden et al., 2006). This indicator was also found significant in
three of the selected empirical studies (Sebastianelli and Tamimi, 2003; Bhat and Raj, 2009;
Jun et al., 2004).
4. Quality performance is not measured
There are many reasons for the poor implementation of TQM initiatives but the
barrier of lack of performance measurement has received very wide support from researchers
(Johnson, 1992; Johnson and Kaplan, 1987; Wruck and Jensen, 1994). Performance
measurement systems are the means of gathering data to support and co-ordinate the process
of making decisions and taking action throughout the organisation (Schalkwy, 1998).
Appropriate measurement systems are crucial to ensure the successful implementation and
execution of strategies such as TQM, since measurement provides the link between strategy
and action (Sinclair and Zairi, 1995). What you measure is what you get – measures … drive
what people do and shape the results they achieve (Johnson, 1992, p. 105).
Many companies that have implemented TQM strategies are using traditional
performance measurement systems that rely heavily on financial and accounting data for
91
monitoring and controlling the processes in the company. However, financial data often does
not identify complex issues that affect performance because poor financial results may
indicate the existence of problems, but offer no insights into the sources of waste or the
opportunities for improvements and cost savings through continuously linking and improving
processes (Johnson and Kaplan, 1987). Many traditional performance systems completely
ignore measuring the client satisfaction, employee motivation, and employee training. The
performance measurement system must place significant emphasis on the quality strategies of
the company such as total customer satisfaction and continuous improvement in quality,
flexibility and responsiveness throughout the organisation. Every company needs to identify a
unique set of key indicators which will measure its performance in terms of overall success as
strategic quality goals (Hodgetts, 1993). And finally, employees should be given access to all
the information they need to carry out their tasks as far as possible (McNerney, 1996). The
TQM barrier indicator of “quality performance is not measured” is a significant barrier. This
indicator was found significant in across many previous studies (Sebastianelli and Tamimi,
2003; Salegna and Fazel, 2000; Ngai and Cheng, 1998; Kifyah and Zain, 2002; Amaral and
Sousa 2009; Bhat and Raj, 2009; Whalen and Rahim, 1994; Angell and Corbett 2009; Huq,
2005; Rad, 2004; McFadden et al., 2006; Jun et al., 2004).
5. The best practices/products of others are not benchmarked
Benchmarking is a powerful management concept that is usually linked to TQM. It is
seen within the context of TQM as an accelerator towards achieving TQM by learning from
the best (Al-Khalifa, 2000). Benchmarking is more than a way of gathering data on ones’
own company and comparing it with others to improve processes and hence meeting
customers' expectations. Its processes provide a management tool for measuring and
comparing parts of an organisation against the best which leads to excellent performance on a
continuous basis.
Organisations are using quality management frameworks as a benchmark to compare
their products, services, and processes against those of the toughest competitors or those of
organisationally renowned world class or industry leaders (Camp, 1989). Hence,
benchmarking is a key component of the TQM (Whiting, 1991).
The TQM barrier indicator of “the best practices/products of others are not
benchmarked” is significant. This indicator was found to be significant by Sebastianelli and
Tamimi, (2003); Salegna and Fazel, (2000); Ngai and Cheng, (1997); Kifyah and Zain,

92
(2002); Amaral and Sousa (2009); Bhat and Raj, (2009); Whalen and Rahim, (1994); Angell
and Corbett (2009); Huq, (2005); Rad, (2004); McFadden et al., (2006); and Jun et al., 2004).
6. Lack of enough time to implement quality initiatives
It has been observed that many TQM organisations are looking for the “short cut” to
success without investing the time and costs associated with full-fledged TQM (Huq, 2004).
Author further argues that the root problems with this myopic view appear to be twofold:
insisting on viewing TQM from a limited, industry specific perspective rather than a generic
perspective; and overvaluing past experience and success – corporate and individual – so that
they take precedence over desired TQM behavior. As a result, many of the key precepts and
demands of TQM, and their inherent benefits, are rationalized away.
The TQM barrier indicator of “lack of enough time to implement quality initiatives”
is significant. Lack of time to devote to quality initiative is found critical by Salegna and
Fazel, 2000. This indicator was also found significant in many previous studies (Kifyah and
Zain, 2002; Amaral and Sousa 2009; Bhat and Raj, 2009; Whalen and Rahim, 1994; Angell
and Corbett 2009; Huq, 2005; Rad, 2004; McFadden et al., 2006). Other empirical studies
also verified the significance of this barrier (Sebastianelli and Tamimi, 2003; Salegna and
Fazel, 2000; Ngai and Cheng, 1997; Jun et al., 2004).
Summary
This section (2.7) has identified and examined the obstacles and inhibitors to TQM success
and has developed and explained a systematically argued typology of common/significant
TQM implementation barriers. The next section extends this analysis in relation to
organisational culture.
2.8 Relationships between organisational culture and TQM implementation
barriers
This section reviews the nature of the relationships between organisational culture and
TQM implementation barriers. The section provides an overview of these relationships found
in the literature. In chapter 3, more detailed evidence from the literature on these relationships
is provided, during the formulation of the study hypotheses.
As discussed in chapter one, one of the proposed flaws in TQM implementation plans
is that the implementers of TQM haven’t considered the impact of underlying cultural

93
characteristics and TQM implementation barriers during the implementation cycle, and
consequently any remedial strategies that are be needed to overcome such barriers are not
introduced. In order to better understand this fact the aim of this research was to empirically
examine the relationship between the two sets of core elements of TQM implementation
(culture and barriers) to better understand their influence towards the effective TQM
implementation. Thus far in this chapter, a suitable framework for assessing organisational
culture in this context has been identified; and the prevalent TQM implementation barriers
have been identified. Therefore, this section examines what type of organisational culture is
associated with what type of barriers. Knowledge of these relationships is needed in order to
help implementers of TQM to develop a model for TQM implementation that extends present
knowledge by integrating an understanding of prevalent barriers within the context of specific
culture types. This review starts with a discussion of the proposed relationships found in
literature between organisational culture and TQM implementation barriers. The
characteristics of these relationships according to the works of previous researchers are
discussed. This part of the review sets the foundation for the aforementioned more detailed
review of the relationships underpinning the presentation of the study’s hypothesis, and
consequently the theoretical framework, in chapter 3.
As mentioned earlier, many studies are found in the literature in the context of
culture-TQM relationships but no study is found that specifically addresses culture-barrier
relationships. Therefore, the predicted relationships in this study are largely and necessarily
based on inference drawn from culture-TQM relationships that have been investigated in
many previous works. In this context, the researcher constructed TQM implementation
barriers on the typical structure of TQM principles, (see section 2.7) therefore empirical
findings on culture-TQM relationships are also applied in building culture-barrier
relationships through implied logic. For example, by assuming that group culture will
increase implementation of the TQM factor of employee focus, one logically justified or
assumed (through formal assumptions) interpretation could be that group culture will
decrease employee barriers. Such interpretations, assumptions, logic and predictions are
frequently used in justifying the rationale behind the development of relationships and hence
hypotheses.
Having established the distinction between TQM practices and organisational culture,
the discussion now focuses on the relationship between the two. The first issue in this context
is the causal direction of the relationship between TQM and organisational culture, and which
94
one is the antecedent of the other. A review of the literature suggests that there is a substantial
disagreement on the nature of this relationship with one group arguing that TQM practices
bring cultural change, and the other that it is organisational culture that affects TQM
implementation and its results (Prajogo and McDermott, 2005). Some researchers have
supported the first argument stating that TQM can have a dramatic impact on the culture of
an organisation (Deming, 1986; Juran, 1989; Hackman and Wageman, 1995; Lawler et al.,
1998; and Flood, 1993). That is, that the application of TQM practices results in cultural
transformation, and involves a major cultural change in the organisation (Entrekin and
Pearson, 1995). According to Schein (1997) an underlying requirement for TQM
interventions to take root is a fundamental transformation of the organisation’s culture. This
includes the transformation of the organisation’s culture, processes, and beliefs, among
employees. Therefore, TQM is a complete change in an organisation’s culture and the way
people behave at work.
On the other hand, many researchers (Maull et al., 2001; McNabb and Sepic, 1995;
Westbrook and Utley, 1995) argue that organisational culture determines the results of TQM
implementation rather than the TQM implementation bringing about cultural change.
Organisational culture appears to be a crucial factor in understanding the ability of any
organisation to perform and compete (Peters and Waterman, 1982; Cicmil and Kekale, 1997;
and Deal and Kennedy, 1982). This study is based on the latter argument, suggesting that it is
the organisational culture that will determine the progress and possibly the outcome of TQM.
The few studies that have attempted to examine the TQM-culture relationship, such as those
by Chang and Wiebe (1996), Zeitz et al. (1997), Dellana and Hauser (1999), Prajogo and
McDermott (2005) and Zu et al. (2010), all place organisational culture as the antecedent of
TQM practices.
According to Alkhalifa and Aspinwall (2000), organisational culture is a set of
commonly held attitudes, values, and beliefs that guide the behaviour of an organisation’s
members. Since these attributes differ from place to place, therefore each organisation will
have a unique type of organisational culture and each type of organisational culture will have
a specific set of associated TQM constructs that need to be empirically measured. In this
context, Dellana and Hauser (1999) undertook a significant study on the culture-TQM
relationship and concluded that a high TQM “score” is significantly related to group and
developmental culture. They suggested that managers faced with implementing TQM should
focus on participation, teamwork and a sense of belonging to ensure TQM success. The

95
empirical evidence presented by these authors suggests that attributes of developmental
culture generally engender a more suitable environment for TQM success. However, there are
many controversial findings in the literature on relationships between culture and TQM. For
example Deshpande et al. (1993) found that no such relationship exists while Westbrook and
Utley (1995) claim the existence of strong relationship. This controversy is further
aggravated in many other studies but is limited to selected constructs only.
According to Zu et al., (2010) the group culture is significantly related to top
management, employee focus and process management. Rational culture supports top
management, customer focus, employee focus, information management, and process
management. The TQM practice of employee focus is found to be supported by the group and
rational cultures and TQM core practice of information management is supported by the
rational culture, whereas process management is supported by the rational culture as well as
the group culture. However, no significant relationship was found between developmental
and hierarchical cultural constructs and any of the TQM constructs. Specifically, the
hierarchical culture was found to have no significant links to TQM constructs. The lack of
significance of hierarchical culture for organisational effectiveness has been noticed in prior
studies as well. For example, Cameron and Freeman (1991) found that the hierarchical
culture was not related to any measures of organisational effectiveness in US higher
education institutions. Also, Yeung et al. (1991) and Quinn and Spreitzer (1991) found that
those organisations that over emphasized the hierarchical culture were the worst performers
and their employees reported a low quality of work life. This literature evidence supports the
argument that compared with the other three CVF culture types; the hierarchical culture is the
least influential for implementing TQM practices. However, the findings by Prajogo and
McDermott (2005) suggest that hierarchical culture does have a high correlation with
strategic planning, information and analysis, and process management. Such controversy
over hierarchical culture in literature is found in a few other studies, such as Stock et al.
(2006).
Prajogo and McDermott (2005) also found that six TQM variables correlate at fairly
similar degrees to group, developmental and rational culture, and less strongly with
hierarchical culture, although all correlation coefficients were significant. The variables such
as leadership, customer focus, and people management showed a relatively stronger
correlation with all culture types than the other TQM practices.
96
Despite a few controversies, there are many studies that support the proposition that
organisational culture has an impact on TQM implementation and consequently the
performance of an organisation. McNabb and Sepic (1995) place extreme importance on the
influence of corporate culture on the effective implementation of TQM. In their conclusion of
a study on the effects of culture on TQM implementation, Sousa-Poza, et al (2001) report that
TQM implementation is a complex programme that has a strong relationship with the
organisation's corporate culture. Many TQM implementations have failed, preventing
companies from realizing its potential benefits because of the ignorance of the cultural
barriers (Becker, 1993; Dale and Cooper, 1992; Oakland, 1995; Thomas, 1995; van Donk and
Sanders, 1993; Wilkinson et al., 1998).
Culture influences the understanding of TQM in a country and it also affects the
operationalisation of TQM in a country (Kumar, 2006; Tan et al., 2003). Corporate culture
has been frequently blamed for TQM-implementation failures (Utley et al., 1997; Bowen and
Lawler, 1992). TQM is directly influenced by organisational culture (Zeitz 1997; Jabnoun
2001; Hyland et al. 2000). Collins (1994) considers TQM to be a culture-based approach to
quality. It is generally believed that culture change or at least culture awareness is a necessary
prerequisite for “excellence” and “quality” (Lewis, 1998). Some even argue that
organisations achieve acceptable business results just by instilling an appropriate quality
culture without formally adopting TQM programmes (Smith, et al., 2002; Kanji and Yui,
1997).
A number of studies have highlighted that cultural variables drive TQM success (Katz
et al., 1998; Nasierowski and Coleman, 1997; Tata and Prasad, 1998; Dean and Bowen,
1994; Hackman and Wageman, 1995; Powell, 1995; Sahney and Warden, 1991; and Metri,
2005). TQM programmes are more likely to succeed if the prevailing organisational culture is
compatible with the values and basic assumptions proposed by the TQM discipline.
Organisational culture is a major variance-causing factor in TQM implementation
programmes that inhibits or allows the success of such a programme and the success of TQM
as an organisational change will depend a lot on the organisational culture (Rad, 2006).
Effective implementation of TQM requires a significant change in values, attitudes and
culture of the organisation and thus many organisations attempt to shape their cultures as a
means of improving organisational fitness (Deal and Kennedy, 1999).
For implementation of TQM, an organisation must have a culture that is capable of
fully supporting it (Kerlavaj et al., 2008). Dellana and Hauser (1999) have termed it as TQM

97
culture. They state that embracing a TQM philosophy requires a shift from current culture to
TQM culture. Many reports claim that TQM culture is the main ingredient in implementing a
TQM programme (Saraph and Sebastian, 1993). A further review of TQM literature shows
that TQM culture can be considered to be one which uses teams, promotes pride in
workmanship, drives out fear, allows participative management, promotes leadership in place
of supervision and promotes long term orientation among the members of the organisation
(Al-Khalifa and Aspinwall, 2000; Saha and Hardie, 2005).
2.9 Chapter summary
In the context of this research thesis, the literature review is a critical synthesis of
previous research and the evaluation of the literature that leads logically to the research
questions discussed and addressed. It provides a comprehensive synthesis of available
literature with a critical evaluation of previous works using rigorous and consistent method of
review. Previous research on TQM implementation reflects that one of the major sources of
barriers is unfavourable organisational culture (Prajogo and McDermott, 2005). Therefore,
author has carefully examined the TQM literature, and on the bases of the findings it is
reasonable to conclude that TQM can be successfully achieved with a favourable culture.
It began with an overview of TQM and its origins, various definitions of TQM, core
constructs and principles underlying TQM and quality award frameworks based on TQM.
Additionally, the scope and the bespoke nature of TQM and core elements of TQM
implementation were reviewed. After a description of organisational culture, various
theoretical frameworks to identify type of existing organisational culture were examined.
This included Denison’s research, which was adopted as the framework for this thesis. The
end result of the literature review is that it has been demonstrated that past research suggests
that improvements in key traits of organisational culture can improve TQM implementation
by eliminating TQM implementation barriers. However, there is a substantial lack of research
specifically on impact of organisational culture on TQM implementation barriers. In this
context, author has reviewed the existing literature on how previous research suggests an
association between organisational culture and TQM implementation. This investigation
shows a positive and strong relationship between culture and TQM implementation and hence
an inferentially negative relationship of culture with TQM implementation barriers. To this
end, this literature review predicts how each characteristic of culture is associated with each
98
barrier indicator by examining the strength and direction of relationship between both
variables in order to determine which type of culture supports TQM implementation and
which one inhibits the implementation process. As mentioned previously, this is done in
chapter 3, as an integrated part of developing the study hypotheses. The outcome of this
review is development of a set of hypothesized relationships between the constructs of
culture and TQM implementation barriers used in subsequent empirical testing.
In this research, existing organisational culture is determined using CVF (competing
values framework). TQM implementation barriers were derived from an extensive review of
the literature. The relationships between organisational culture types and TQM
implementation barriers are predicted based on evidence in order to determine type of
organisational culture having a specific set of associated TQM implementation barriers.
Establishing this relationship will enable the researcher to determine the type of
organisational culture that would support implementation of TQM. For effective TQM
implementation, the identified TQM implementation barriers need to be overcome by
deploying appropriate strategies to obtain favourable culture.
From the discussion in this chapter, one can infer that organisational culture and TQM
implementation barriers are two very important factors that influence the success of TQM
implementation. This is particularly true in the case of Gulf countries such as Bahrain as they
differ much from the industrialised countries in terms of organisational culture. The skills and
attitudes of employees in a professional setting mark this difference. Therefore, organisations
in these countries should judge what areas of their organisational culture to emphasize
depending on what aspects of TQM they wish to improve. This might be done by identifying
existing organisational culture so that favourable cultural characteristics are adopted and
strengthened, and unfavourable ones are addressed, consequently reducing barriers in the
TQM implementation. It is reasonable to propose that the removal or reduction of negative
impacts of barriers would lead to facilitate the swift implementation process towards
successful adoption of the TQM approach. As mentioned earlier, many studies are found in
the literature in the context of culture-TQM relationships but no study is found that
specifically addresses culture-barrier relationships.
99
Chapter Three: Conceptual Framework
3.1 Introduction
The literature review indicated that previous studies on TQM implementation
fundamentally suggest two findings. Firstly, that TQM is often not implemented properly and
secondly, that when properly implemented, TQM undeniably improves performance (Dellana
and Hauser 1999). This study has found evidence in the literature suggesting that adopting
and developing specific characteristics of organisational culture may facilitate enhancing
TQM implementation, by reducing the barriers associated with TQM implementation (Chang
and Wiebe, 1996; Zeitz et al., 1997; Dellana and Hauser, 1999; Prajogo and McDermott,
2005; Naor et al., 2008; Zu et al., 2009).
In this context, in this chapter the author has developed a framework that describes
the proposed relationships between culture and TQM barrier variables. This framework
incorporates four constructs of organisational culture as conceptualised by Denison and
Spreitzer, (1991) and six constructs of TQM implementation barriers derived from the
literature (section 2.7) Following the findings of Prajogo and McDermott (2005), this study
positions organisational culture as an antecedent of TQM implementation barriers influencing
TQM implementation in an organisation, and assumes TQM implementation barriers are largely
the consequences of the type of dominant culture.
This chapter first revisits key findings and concepts from the literature review that are
concerned with identifying the type of existing organisational culture and the TQM
implementation barriers in an organisation. Evidence from the literature on the proposed
relationships between types of organisational culture and TQM implementation barriers is
evaluated and presented. Based on this evidence, the conceptual framework is proposed and
the hypotheses are developed.
3.2 Key concepts from the literature review
TQM is a proven and useful philosophy for management if properly used and
implemented (Oakland, 2004). The widespread success of TQM in Japan, and in many other
organisations around the world is evidence of this statement. According to Bowen and Lawler
(1992), Japan has used TQM principles successfully primarily because of a supportive culture
that helped to remove TQM implementation barriers. It is reasonable to argue that all

100
organisations planning to successfully adopt a TQM approach need to consider the impact of
underlying cultural factors that either create or reduce TQM implementation barriers during
the implementation process.
In the context of TQM implementation, several researchers have recognized (a) the
critical role of organisational culture (Chang and Wiebe, 1996; Zeitz et al., 1997; Dellana and
Hauser, 1999; Prajogo and McDermott, 2005; Naor et al., 2008; Zu et al., 2010) and (b) the
influence of TQM implementation barriers (Amaral and Sousa 2009; Bhat and Raj, 2009;
Angell and Corbett 2009; McFadden et al., 2006). Nevertheless, to date, each of these two
sets of variables have been examined in the literature largely separately, as was noted in
section 2.8. There is a scarcity of existing research that investigates the impact of underlying
cultural characteristics on TQM implementation barriers. Thus, there is a need to examine
these relationships to gain a better understanding of the factors affecting TQM
implementation. This research has attempted to address this critical gap, and can thus help in
developing more informed TQM implementation frameworks based on empirical evidence,
concept and theory.
The extant TQM literature suggests that TQM implementation barriers inhibit the
effective implementation of TQM (Sebastianelli and Tamimi, 2003; Salegna and Fazel, 2000;
Ngai and Cheng, 1997; Amar and Zain, 2002). In order to address these barriers, many
strategies have been suggested in the literature (Rad, 2005; Huq, 2005; Oakland, 1995; Kotey
and Slade, 2005), but the role of existing organisational culture in addressing these barriers
has not so far been investigated analytically. As discussed in the literature review (section
2.3), TQM implementation is broadly based on three foundations:
1. The TQM philosophy that comprises a set of TQM principles;
2. The organisational culture - the antecedent that influences TQM implementation; and
3. TQM implementation barriers – that hamper effective implementation of TQM
A number of studies have investigated each of these foundations and associated
variables individually but none of the studies have related these sets with each other. The
underlying assumption in the proposed conceptual framework presented in this chapter is that
TQM implementation is influenced by the existing characteristics of organisational culture
that is to say, that the culture factors shape the TQM implementation approach and not vice
versa.

101
The main motivation for this research was that despite differences in cultural
background and implementation barriers, the literature supports the proposition that
organisations can enhance the likelihood of an effective implementation of TQM by
understanding the impact of organisational culture on TQM implementation barriers. In order
to accomplish this task, organisations need to know which type of culture can help to remove
which barriers. Therefore, the need to identify variables of organisational culture and TQM
implementation barriers and to establish the relationships between these two variables
through empirical evidence, so that they can be built into implementers models for TQM
implementation, forms the specific rationale for this study.
3.2.1 Identifying type of existing organisational culture
Identifying and understanding the organisational culture is necessary before TQM
implementation as there is a clear indication of a positive relationship in the literature stating
that an appropriate culture is vital to the success of TQM. In order to empirically examine the
relationship between organisational culture and TQM implementation barriers, it was
necessary to select a suitable model of organisational culture. Hence, in this study, the author
used the competing values framework (CVF) proposed and tested by Denison and Spreitzer
(1991), to identify the type of organisational culture present in Bahraini industries. This
model was deemed to have the capacity to provide an understanding of the culture in the
organisations under study. Following the works of Chang and Wiebe (1996), Dellana and
Hauser (1999), Prajogo and McDermott (2005); and Alkhalifa and Aspinwal (2000), the
competing values model developed by Denison and Spreitzer (1991) was selected as the
organisational culture model to operationalise the measurement of four types of
organisational culture, namely group culture, developmental culture, hierarchical culture, and
rational culture.
The CVF has proven to be a useful framework for assessing and profiling the
dominant cultures of organisations because it helps identify the underlying cultural
characteristics that exist in organisations (Cameron, 2004). Most studies that adopted the
CVF have used a survey questionnaire to empirically profile the types of organisational
culture and operationalise its measurement. The author has used the research methodologies
of Dellana and Hauser (1999) and Prajogo and McDermott (2005) for guidance. In the survey
questionnaires used in these studies, each respondent selects the level of his/her
agreement/disagreement on a set of 24 statements for measuring the 4 types of culture. Each
102
type of culture is measured on six dimensions. The six dimensions are defined as
organisational character; leadership demonstration; management style; binding force;
organisational emphasis; and success criteria. The score on each dimension is aggregated, in
turn, for each of the four types of culture, resulting in a single overall measure for each of the
four organisational culture constructs.
3.2.2 Identifying existing TQM implementation barriers
Many organisations earnestly commit to quality by implementing the TQM practices
but usually overlook potential implementation barriers of TQM (Oakland, 2004). Therefore,
it is important for all organisations to understand and avoid these barriers as far as is possible
both before and during TQM implementation (Masters, 1996).
A comprehensive review of the literature revealed many TQM implementation
barriers identified in various studies (section 2.7). Despite this large body of literature, there
appeared to be little consensus amongst the researchers on what comprised a definitive set of
the prevalent TQM implementation barrier constructs. In order to examine the relationship
between organisational culture and TQM implementation barriers, it was therefore necessary
first to develop a set of TQM implementation barrier constructs and associated measures.
These TQM implementation barriers were investigated through a systematic analysis of
secondary data in order to derive an understanding of the most significant barriers, as
discussed in detail in chapter two (section 2.7). In this regard, empirical studies were
explored to identify - commonly cited TQM implementation barriers. This process resulted in
identifying 32 significant barriers. As will be discussed later in chapter 4, five more barriers
were added specific to Bahraini industries, as suggested by practitioners and academia during
a phase of refining the survey instrument through structured interviews, making a total of 37
barriers. The studies used in identifying the significant TQM implementation barriers were
discussed in section 2.7. The barriers identified in these studies were then grouped into the
following barrier constructs (section 2.7.3 and table 3.1):
1 Top management barriers ( comprising 9 barriers items)
2 Employees barriers (comprising 8 barriers items)
3 Customer barriers (comprising 4 barrier items)
4 Process management barriers (comprising 6 barriers items)

103
5 Planning barriers (comprising 4 barriers items)
6 Information management barriers (comprising 6 barrier items)
Table 3.1 Constructs of barriers
3.3 Proposed conceptual framework and hypotheses development
Based on the review of TQM and the TQM implementation literature, the following
conceptual framework was proposed. As shown in Figure 3.1, a set of four antecedents
(organisational culture constructs) are hypothesized to be related to a set of six consequences
(TQM implementation barriers constructs).
Figure 3.1 Conceptual framework and hypothesised relationships

104
As stated earlier, each of the 4 constructs of organisational culture comprise 6
measurement dimensions (thus, 24 indicators in total) and each TQM implementation barrier
construct has multiple measurement indicators (37 indicators in total). In total, eleven
relationships (regression paths) were identified based on examination of the literature.
According to the theory underpinning the conceptual framework, the hypothesised regression
paths of all the hypotheses are negative. This means that when the score on any type of
organisational culture goes up (i.e. stronger presence of that culture) then the score on the
barriers goes down (i.e. the presence of the barrier reduces), thus showing a negative
(negatively signed) relationship.
3.4 Developing research hypotheses
A hypothesis is a suggested explanation of a phenomenon, or a reasonable
explanation of a correlation between phenomena (Hair et al., 2010). It is a statement that a
researcher can test/prove. This statement can be adjusted, refined or changed based on the
research findings. In this research, the hypothesis is a concept that has yet to be verified, but
if found true would explain certain facts associated with the implementation of TQM. Table
3.2 lists the eleven hypotheses identified in the conceptual framework that were derived from
the TQM literature presented in chapter 2.
Table 3.2 list of hypotheses
H#
Hypothesis description
H1 Group culture decreases top management barriers
H2 Group culture decreases employee barriers
H3 Group culture decreases customer barriers
H4 Group culture decreases information barriers
H5 Developmental culture decreases employee barriers
H6 Developmental culture decreases customer barriers
H7 Rational culture decreases top management barriers
H8 Rational culture decreases employee barriers
H9 Rational culture decreases customer barriers
H10 Hierarchical culture decreases planning barriers
H11 Hierarchical culture decreases process barriers
This list constitutes the set of hypotheses that describes the relationship between TQM
implementation barriers and type of organisational culture. As is evident from figure 3.1 and
table 3.2 the literature review indicated that group culture was associated with the
reduction/removal of four barrier constructs, that developmental culture was associated with
105
the reduction/removal of two barrier constructs, that rational culture was associated with the
reduction/removal of three barrier constructs, and that hierarchical culture was associated
with the reduction/removal of two barriers constructs.
3.5 Examining relationships between organisational culture and TQM
implementation barriers and formulating hypotheses
Organisational culture, as previously defined in section 2.6.1, is a set of commonly
held attitudes, values, and beliefs that guide the behaviour of an organisation’s members.
Each organisation will have a unique type of organisational culture and each type of
organisational culture will have a specific set of associated TQM implementation barriers.
Denison and Spreitzer (1991) state that the four cultures in their typology can be viewed as
ideal types of cultures which means that organisations can be characterized by some
combination of these four cultures, although some cultures can be more dominant than the
others. In this context, in the hypothesis articulation sections that follow (3.5.1 to 3.5.4) the
author first briefly recaps on the salient characteristics of each type of culture in the CVF and
then examines how these characteristics are believed to decrease the presence of the various
TQM implementation barrier constructs identified in table 3.1.
As mentioned earlier, many studies are found in the literature in the context of
culture-TQM relationships but there are no studies that were found that explicitly discuss or
measure culture-TQM barrier relationships. Therefore, the formulation of the hypotheses in
this study had to be based on logical inferences drawn from the culture-TQM relationships
that have been investigated in many previous works. For example, taking the literature
finding that group culture helps to facilitate the implementation of the TQM element of
employee focus, it is logical therefore to propose that the presence of group culture will [also]
help to decrease employee barriers. Such interpretations, logic and predictions are frequently
used in constructing and justifying the rationale behind the development of hypotheses in this
study. This concept is precisely stated by Wacker (2004) as follows:
According to Wacker (2004), there are three theoretical justifications for formulation
of the hypotheses (conceptual relationships): interpretive, logical, and predictive. Interpretive
conceptual relationships are those relationships that can be directly interpreted from the
formal conceptual definition. For example, TQM factor of workforce development demands
delivering education and training to employees using diverse modern methods. However, a
large number of unskilled employees in an organisation may indicate lack of employee
training, which can further be interpreted as lack of resources for training – a barrier to TQM
106
implementation. Similarly, logical conceptual relationships are deduced from the interpretive
relationships and the formal conceptual definition, therefore logically deduced relationships
may also be assumed to be true (Wacker, 2004).For example, a visible commitment and
support to quality by senior managers is required for TQM implementation. Since lack of
commitment and support to quality by senior managers is related to the implementation
concept, it is a logical relationship (an empirically testable relationship). According to
Wacker (2004), logical relationships are those relationships that are analytically tied to other
concepts and must be analytically justified or assumed (through formal assumptions). The
predictive relationships are similar to the logical relationships but give predictions if the
theory conditions are fulfilled. However, predictive relationships differ from the logical
properties since they typically build on the logical properties of the theory to predict specific
outcomes (Wacker, 2004).
The interpretive, logical, and predictive theoretical justification for formulation of the
hypotheses (conceptual relationships) is deductive in nature. It allows deriving TQM barriers
from TQM implementation status. In other words, deduction is the process of deriving the
consequences of what is assumed. Given the truth of the assumptions, a valid deduction
guarantees the truth of the conclusion. For example, if an organisation continuously seeks to
build active relationships with customers, but that customer satisfaction is very low, it can be
deduced that customer barriers still exist in that organisation.
In the next four sections (3.5.1 to 3.5.4), each type of culture is taken in turn and each
of the associated hypotheses is presented. In each section, the author first briefly describes the
salient characteristics of the culture type, and then examines, using the literature as described
above, how these characteristic are related to the presence of the TQM implementation
barriers.
3.5.1 Group culture and TQM barriers – hypotheses 1, 2, 3 and 4
The main emphasis of group culture is on flexibility and internal integration.
According to Denison and Spreitzer (1991), group culture values belonging, trust, and
participation, and its strategies are oriented toward developing human relations through
cohesiveness, openness, commitment, and attachment. These characteristics of group culture
can help to decrease communication barriers between top management and employees, and
encourage a participative structure that avoids many layers of management.

107
In the group culture, the leaders tend to be supportive and participative, encourage
empowerment and interaction through teamwork, and have concern for employees’ ideas.
This supportive and participative leadership style provides the organisation with top
management support necessary for its quality improvement (Cameron and Quinn, 1999). As
such, these characteristics can decrease the management barrier of lack of commitment and
support to quality. By creating a climate of open communication about the implementation
progress, group culture will enable learning and further change, and can help to appropriately
direct the needed investment in training to help employees increase their knowledge, skills
and ability (Beer, 2003). Therefore group culture will also help to remove the common top
management barrier of inadequate resources for employee training.
Group culture is characterized by teamwork, consensus and participation. It promotes
leadership in place of supervision, and promotes long term orientation among the members of
the organisation (AlKhalifa and Aspinwall, 2000; Saha and Hardy, 2005). This orientation
can create attachment, a sense of commitment, and involvement of each employee in the
problems faced by the organisation. Leaders act as mentors, coaches, and, perhaps, even as
parent figures (Denison, and Spreitzer, 1991). These characteristics of group culture will thus
help to decrease the prevalence of a management style of leaders that slows down learning
culture. Participation, cohesiveness and openness help middle managers to provide an
effective link between the top managers and junior operatives and communicate quality
awareness and support improvement.
Group culture, helps remove TQM implementation barriers through personal
participation of top management in TQM implementation. These arguments from the
literature support the presentation of the following hypothesis:-
H1 – Group culture decreases top management barriers.
In a successful quality management implementation organisation, employees are
valued and empowered. Therefore, effective organisations empower and engage their people,
build their organisation around teams, and develop human capability at all levels (Cameron
and Quinn, 1999). By promoting group culture, such organisations give empowerment to
individuals to have the authority, initiative, and ability to manage their own work that creates
a sense of ownership and responsibility toward the organisation (Denison et al., 2005).
Logically therefore, employees empowerment can be achieved through prevalence of group
108
culture, that will eventually decrease the TQM barrier of employees are not being empowered
to implement quality improvement effort.
Due to open and participative nature of group culture, organisational members feel
that they have at least some input into decisions that will affect their work and feel that their
work is directly connected to the goals of the organisation. This high involvement of
employees allows organisations to rely on informal, voluntary and implicit control systems
(Denison et al., 2005). The group culture’s emphasis on cohesion, morale and the long-term
benefit of human resource development are consistent with establishing the organisational
environment supporting employee learning, collaboration, and involvement for the effective
implementation of quality initiatives (Cameron and Quinn, 1999; Detert et al., 2000; Naor et
al., 2008; Ouchi, 1981). The main emphasis of group culture is on flexibility and internal
integration and it would create attachment, a sense of commitment, faith, and involvement of
each employee in the general and strategic issues of organisation (Denison and Spreitzer,
1991). Accordingly, group culture can help to motivate employees to work at their full
capacity by decreasing employee barriers of lack of employee involvement in improvement
projects.
Organisations with group culture continually invest in the development of employee’s
skills in order to stay competitive and meet on-going business needs. Denison and Spreitzer,
(1991) argue that a major concern of firms emphasizing the group culture is the development
of human potential, teamwork and member commitment as a means towards better decisions
and overall output. The organisation would be investing in training to help employees
increase their knowledge, skills and ability and help them in their career development. These
characteristics of group culture will help decrease TQM implementation barriers of
employees not trained in quality improvement skills and lack of training in group discussion
and communication techniques.
The organisations having dominant group culture focus on developing human
relations through participation, cohesiveness and openness. Top management encourages
employees to bring innovative ideas for organisational development and participate in the
decision making process (Denison and Spreitzer, 1991). This strategy brings about a sense of
belonging and employees feel they are doing something for themselves. Their devotion to
work is high and they are ready to take on extensive obligations, as one would do for his/her
family (Cameron and Quinn, 1999). These characteristics of group culture will induce in
employees the commitment to organisational goals. In this way, group culture helps to
109
remove TQM implementation barriers such as lack of workforce participation, lack of
workforce empowerment, and lack of involvement and communication.
Organisations with group culture stress the need for training of employees, employee
involvement in decision-making, communicating with them consistently in order to create
awareness of organisational goals for quality improvement and rewarding employees for
quality performance (Kaynak, 2003). Therefore the group culture would help decrease
employee barriers of lack of recognition for achievements in quality improvement, lack of
appropriate performance evaluation and reward system, and consequently, the lack of
employee satisfaction across the organisation.
TQM is a philosophy of change and resistance to change by employees and even
management is not unexpected. Inadequate communications of the intended changes in the
organisation may result in resistance expressed through resentment about management’s
approach, doubts and uncertainty, and fear that employees may lose their jobs (Huq,
2004).One of the characteristics of group culture of establishing the communications to create
awareness of organisational goals for quality improvement (Flynn et al., 1994) will help to
decrease employee resistance to change.
Effective implementation of TQM in an organisation demands building teamwork,
providing employees with appropriate training, involving them in decision-making and
rewarding them for quality performance (Dale, 2007). The literature supports the propositions
that group culture helps to address each of these elements. Therefore:
H2 – Group culture decreases employee barriers
One of the founders of the TQM concept Feigenbaum (1957) stated TQM is an
effective system when it ensures full customer satisfaction. Many TQM researchers have
concluded that a core objective of TQM is to delight the customers. According to Kanji and
Asher (1996), the first one of eight core concepts of TQM is `customer satisfaction`.
Hackman and Wageman (1995) argued that “explicit identification and measurement of
customer wants and needs” is the first and foremost of six TQM interventions. Flynn et al.
(1994) defined the main TQM objective as “meeting or exceeding customer expectations”.
Deming (1986) similarly stressed that quality should be aimed at the needs of the consumer,
present and future. Many authors have considered the lack of attention to customer
requirements and feedback system as one of the very common barriers facing the
110
organisations, and hence in the way of adopting quality management system techniques (Bhat
and Raj, 2009; Angell and Corbett 2009; Sebastianelli and Tamimi, 2003; Salegna and Fazel;
and Jun et al., 2004).
These customer barriers can be effectively addressed by the presence of group culture
because the management style in the group culture is characterized by teamwork, consensus,
participation, open communication and empowering employees to deal with customers
(Yeung et al., 1991; Denison and Spreitzer, 1991; Prajogo and McDermott, 2005; Zu et al.,
2009). These characteristics of group culture facilitate identifying customer concerns through
open communication in order to seek feedback and measure customer satisfaction level
(Quinn and Kimberly, 1984; Quinn, 1988; Cameron and Freeman, 1991). As the group
culture stresses commitment, cooperation and open communication, therefore it results in
building strong relationships with customers and suppliers (Denison and Spreitzer, 1991).
Consequently it can help to decrease TQM implementation barriers such as lack of effective
system to measure customer satisfaction, lack of feedback system from customers, lack of
assessment of customers' needs and expectations and lack of close contact with key
customers.
Naor et al. (2008) suggests that an emphasis on group culture may enhance the
involvement of customers and suppliers in organisational activities. Customers (and
suppliers) are outside the boundary of the organisation, but they are the key parties of the
overall supply chain of the products and services delivered to the end users (Zu et al., 2009).
One of the characteristics of group culture is that customers are best thought of as
partners (Cameron and Quinn, 1999). Authors propose that measuring customer preferences
before and after product/service delivery; creating partnerships with customers; and
enhancing competitiveness by involving customers in planning and design are all supported
by group culture. According to Alkhalifa and Aspinwall (2000), group culture tends to be
flexible and customer oriented. Jabnoun and Sedrani (2005) concluded that customer
oriented TQM practices with the infusion and reinforcement of employ oriented culture (i.e.
group culture) will significantly increase the performance of a company. Therefore, the group
culture will decrease customer barriers associated with these traits.
In group culture, success is defined in terms of sensitivity to customers and concern
for people (Denison and Spreitzer, 1991). Some of the activities encouraged by group culture,
such as empowerment, team building, employee involvement, human resource development,

111
and open communication are indirectly related with customer satisfaction because the
products and services that delight customers are delivered by employees. Similarly, a
participative management style empowers employees to take any necessary action to ensure
customer satisfaction (Rad, 2004).
Hackman and Wageman (1995) suggest that in quality management, it is essential to
maintain close links with customers and suppliers. The internal focus of continuous
improvement, characterized in a group culture belongs to improvement in internal processes
and environment that directly affect external relationship. For organisations emphasizing the
group culture, they would apply their belief in trust, commitment and open communication to
their relationship with their customers and suppliers (Zu et al., 2010). An organisation should
have a good understanding of what the customer wants through keeping customer contact and
obtaining customer feedback. It should be recognized that customers are not only those to
whom organisations sell products/services but are also their internal staff. In this context,
Naor et al., (2008) emphasizes the ability of group culture to enhance the involvement of
customers in organisational activities. Consequently group culture can help to decrease TQM
implementation barriers such as lack of effective system to measure customer satisfaction,
lack of feedback system from customers, lack of assessment of customers' needs and
expectations and lack of close contact with key customers. It is then proposed that:
H3 – Group culture decreases customer barriers.
Identifying quality problems and solving them comprehensively through exchange of
ideas is the key to effective TQM implementation. Group culture fosters the exchange of
ideas through its focus on participation and communication. Employees will be more willing
to make efforts in identifying and solving problems, and to take more responsibility for
improvement projects when they know that their ideas and thoughts will be valued by
management (Naor, 2008). This process can generate useful data on quality and performance
that can be used for improvement.
Regular and effective communication is necessary for all phases of change processes
and communication therefore needs to be managed coherently and honestly. Gunasekaran
(1999) found that a major enabler of TQM implementation was communication between
managers/supervisors and staff, and that poor communication between departments was a real
barrier to implementing TQM. Hence, ineffective internal and external communication

112
networks and lack of information exchange in an organisation put a lot of barriers in the way
of improving business.
The intent of information exchange in group culture is to foster an environment where
individuals feel comfortable in discussing TQM related problems, and then information and
knowledge is shared freely (Stock et al.2006). This can therefore help to decrease the barriers
of poor inter-organisational communication and lack of disseminating quality and
performance information. According to Kaynak (2003), inter-organisational communication
can further enhance cooperation between departments through teamwork to exchange ideas;
enhance joint efforts of management and employees in process management activities;
identification and solving quality problem; effective measurement of process and product
performance; and project coordination. However, without a systematic method for
discovering and identifying TQM related problems, TQM implementation is generally
doomed to failure (Naor et al., (2008). This systematic method may include reporting TQM
problems, open discussion about TQM problems and statistical analysis of TQM
implementation data. Group culture supports the development of these characteristics through
participation, involvement, empowerment and communication. Therefore, group culture may
help to decrease the information management barrier of lack of information on quality and
performance.
Open communication fostered by the group culture is also expected to facilitate the
liaison with people outside of their own departments (Klein et al., 1995). This will help
decrease the information management barrier of lack of disseminating quality and
performance information. According to Hackman and Wageman (1995), openness in the
group culture is consistent with the principle of management by fact in quality management
through systematic quality data collection, reporting, analysis and measurement in a problem-
solving cycle. Accordingly, this will help to remove information management barrier of lack
of measuring quality. The preceding arguments support the presentation of the following
hypothesis:
H4 – Group culture decreases information management barriers.
113
3.5.2 Developmental culture and TQM barriers - hypotheses 5 and 6
The organisation character in the developmental culture type is very dynamic and
entrepreneurial - people take risks by trying new things that promote innovation (Denison and
Spreitzer, 1991). Organisations with a developmental culture emphasize acquiring new
resources and creating new challenges by trying new things and prospecting for opportunities
that can result in the identification of unique or new products/services, and the organisation
becoming a product leader and innovator (Cameron and Quinn, 1999). These authors further
argue that organisations with developmental culture support adaptation and innovation
activities that may lead to product and service advantage and profitability. Developmental
culture allows employees to bring innovative ideas for organisational development and to
participate in decision making processes. Detert et al. (2000) state that in such innovative
organisations, there is a push for constant, continuous improvement and doing things better,
thus they encourage the behaviour of constantly studying the processes for improvement. As
these processes and products belong to an employee domain, developmental culture therefore
is genuinely associated with employee barriers, or more precisely with helping to remove
them.
In order to be a product leader and innovator, an organisation needs more involvement
and teamwork, which requires more responsibility and a greater level of employee skill and
knowledge. This can be achieved through proper, formal and systematic training and
education. Therefore, lack of employee training in quality improvement skills is a major
TQM barrier. Developmental culture, through its focus on innovation, gives importance to
employee training. Hence, the organisations with developmental culture insist on the need for
comprehensive training programmes because the lack of sufficient quality training and
education has a negative effect on the quality of business and as such is the main obstacle any
organisation faces in the way of getting improvement. Developmental organisations invest in
training programme to take the lead in market share and hence decrease (or remove) the
employee barrier of lack of training.
Any training programme needs resources and developmental culture tends to focus on
providing necessary resources to execute innovative projects. Yeung et al. (1991) assert that
focus on innovation and adaptation increases the allocation of organisational resources for
employee training so as to improve their knowledge and skills to meet the changing
requirements of customers. Therefore, empowered, involved and well-trained employees,

114
who in turn are more satisfied and less resistant to change, help remove employee barriers in
a developmental culture.
Denison and Spreitzer (1991) argue that the developmental culture is always looking
for new resources and external support for growth. Therefore, developmental culture will
focus on adoption of new tools, technology and other improvement approaches. But, such
adoption is only possible through training, empowerment, participation and involvement.
Therefore developmental culture will also help to remove barriers such as lack of skills,
participation, involvement and empowerment of employees. It is therefore proposed that:
H5 – Developmental culture decreases employee barriers.
While describing the developmental culture, Cameron and Quinn (1999) state that
flexibility and change according to those in the external environment (figure 2.2) is a main
characteristic of developmental culture, which has a focus on innovation, resource
acquisition, and the development of new markets, and fosters the activities that can help to
delight customers, anticipate customers’ needs, and implement creative solutions to problems
and produce new customer preferences. Customers demand quality products/services and
companies who can meet this demand equitably are likely to obtain larger market shares
because high quality of products/services can result in loyalty and satisfaction of customers
and eventually increase in sales. The increased contact with customers provides better
information about the market or greater brand loyalty, which in turn leads to a rise in sales
and margins (Tena, 2003). A focus on customers’ needs and expectations is one of the
fundamental principles of TQM and there should be a mechanism of information exchange to
obtain the necessary information for identifying customer requirements and feedback on the
quality of products/services (Dellana and Hauser, 1999). Developmental culture emphasizes
adapting to changing customer demands over time and thus it helps to remove the TQM
barrier of lack of feedback system from customers/stakeholders.
In a developmental culture, an external focus of innovation on customer desires is
highly evident (Choi and Behling, 1997). Organisations with a developmental orientation
tend to lead their companies to long-term quality programme success because they treat
future customers just as important as their current customers, and guide the company in the
direction of future customers through product innovation (Dellana and Hauser, 1999).
Organisations with developmental culture also direct internal efforts toward their customers

115
through an increasingly external focus (Chang and Wiebe, 1996). As stated earlier, customers
demand quality products/services and organisations who can meet this demand equitably
would obtain larger market shares, thus creating a drive for companies to invest in quality
improvement to achieve market advantage (Zu et al., 2009). This is a major characteristic of
developmental culture, which is heavily focusing on customer satisfaction and development
of new markets and thus decreasing the TQM implementation barriers of lack of effective
system to measure customer satisfaction, lack of assessment of customers' needs and
expectations, lack of an effective customer feedback system and lack of close contact with
key customers.
In organisations emphasizing the developmental culture, the belief in external
adaptation and development of flexibility and diversity stimulates the members’ interests in
pursuing and understanding customer needs and market requirements and brings them into
frequent and close contact with their customers (Denison and Spreitzer, 1991). Such
organisations tend to build a strong relationship with customers because customer focus is
well developed throughout the organisation, supported by effective customer satisfaction
tracking (Al-khalifa and Aspinwall, 2001). The developmental culture type, which
emphasizes a more external focus characterized by change and risk-taking, could decrease
customer barriers such as lack of effective system to measure customer satisfaction, lack of
assessment of customers' needs and expectations, and lack effective customer feedback
system and close contact with key customers, consequently improving customer focus of
organisation. These arguments support the presence of the following hypothesis:
H6 – Developmental culture decreases customer barriers.
3.5.3 Rational culture and TQM barriers - hypotheses 7, 8 and 9
According to Denison and Spreitzer (1991), organisations with a rational culture are
very result oriented places - a major concern is with getting the job done through competitive
and achievement oriented people. The leadership can be aggressive and result-oriented and its
management style is characterized by, high demands, and achievement. There is an emphasis
on achievement and goal accomplishment by hitting stretch targets and winning in the
marketplace (Denison and Spreitzer, 1991).

116
Many researchers (Powell, 1995; Black and Porter, 1996; Ahire et al., 1996; Flynn et
al., 1994; and Samson and Terziovski, 1999) broadly agree that the leadership and
commitment of top management is a key driver of TQM. Rational culture is goal-oriented
and demands a challenge focused leadership to achieve those goals. Leaders are expected to
build up comprehensible objectives and strategies to realize procedures and traditions that
would lead to high levels of productivity and profitability. Leaders are required to provide
guidance and control to realize the corporate vision and goals that demand a high level of
commitment throughout the organisation. Therefore, it is reasonable to argue that rational
culture would help remove the barrier of lack of commitment by top management to achieve
quality goals by taking responsibility for quality (Denison and Spreitzer, 1991).
The goals and objectives of quality improvement can only be set and achieved when
managers recognize the importance of quality improvement for the success of their
organisation and this understanding would develop through quality awareness. The focus of
rational culture to achieve competitiveness through quality improvement can therefore help to
decrease the lack of quality awareness barrier within the organisation.
Similarly, the barrier indicator of the lack of allocation of adequate resources for
employees training by managers is also very significant. This top management barrier
indicator has been evaluated as critical for TQM implementation in several previous studies
(Minjoon et al., 2004; Kotey and Slade, 2005; Tannock et al., 2002; Soltani et al, 2008;
Walsh et al., 2002). Since the major concern of leadership in rational culture is getting the job
done through competitive and achievement oriented people, therefore leadership in rational
culture is highly likely to focus on quality improvement by allocating adequate resources for
employees' training, thus decreasing the TQM implementation barrier of lack of allocating
adequate resources for employees' training.
As stated before, many layers of management in any organisation can create
communication gaps and are a potential cause of delayed decision processes and decision
making which can result in missing opportunities, particularly in fast paced business
activities. The importance of addressing this barrier for TQM implementation is emphasized
by many researchers such as Ghobadian and Gallear (1996); Flynn et al. (1994), Hellsten
(2000); Ahire(1998); Ahire et al., (1995) and Motwani (2001). The aggressive and result-
oriented nature of rational culture demands an instantaneous and swift management style that
characterizes the high demands and achievement of a rational organisation, thus breaking
through the barrier of many layers of management.
117
Kaynak (2003) states that top management demonstrates its commitment to the
achievement of the quality goals by taking responsibility for quality and being evaluated
based on quality performance. This statement is also supported by Cameron and Quinn
(1999) and Denison and Spreitzer (1991). They argue that leaders in the goal-oriented
rational culture are tough and demanding in achieving competitiveness, they tend to develop
clear objectives and aggressive strategies to drive practices and behaviours leading to
productivity and profitability. It is therefore proposed that:
H7 – Rational culture decreases top management barriers.
Naor et al. (2008) argues that rational culture regards incentives as an integral tool
used to motivate the workforce to pursue better performance and achieve organisational
goals. Such incentives and rewards delivered by management are used to increase employee
participation in continuous improvement and to enhance employees’ ownership in their jobs
and quality improvement activities. Therefore, rational culture would help remove TQM
implementation barrier of lack of recognition of employees and teams for achievements in
quality improvement. Employees need to be empowered to implement quality improvement
efforts, and, when successful, they need to receive appropriate recognition for their
achievements. Without such opportunities and a supportive environment, employees might
feel frustrated, thereby contributing to more frequent turnover (Ngai and Cheng, 1997). The
lack of recognition for achievements in quality improvement is reported as significant barrier
in the literature (Ngai and Cheng, 1997; and Amaral and Sousa 2009). A lack of recognition
of employees for achievements in quality improvement affects morale and motivation. Flynn
et al. (1995) and Henderson and Evans (2000) argue that TQM uses the compensation
policies including incentives for group performance, quality-based incentives and
compensation based on breadth of skills. Authors further argue that compensation of
executives for the achievement of TQM goals and rewards is given based on the outcomes of
the improvement projects that they are accountable for. Naor et al. (2008) states that such
incentives and rewards delivered by management are used to increase employee participation
in continuous improvement and to enhance employees’ ownership in their jobs and quality
improvement activities. These performance-contingent compensation policies are compatible
with the strategies characterizing the rational culture (Cameron and Quinn, 1999).
118
The barrier indicator of lack of empowerment of employees to apply quality
improvement efforts is a reflection of centralized control in decision making and other job
related functions. Empowerment to employees in terms of delegating them more
responsibility would give them a greater sense of confidence and self-esteem. Similarly, the
barrier indicator of lack of involvement of employees in improvement projects also reflects
centralized control in decision making and other job related functions. The control-oriented
characteristic of rational culture doesn’t enhance empowerment and involvement of
employees and if there is a lack of involvement of employees in organisation activities,
employees can feel neutral to organisation’s mission, aim and objectives (Naor et al., 2008).
However, empowerment and involvement of unqualified employees is unlikely to bring with
it useful results. Therefore, the implementation of any quality programme means more
involvement and empowerment, which require more responsibility coupled with greater level
of skill and knowledge of the employees. Depending on the needs of a particular
organisation, training and education should cover the entire workforce as part of an ongoing
process. This should be achieved through proper, formal and systematic training and
education which is salient characteristics of rational culture (Denison and Spreitzer, 1991).
By focusing on training, rational culture decreases TQM implementation barriers of lack of
employees training in quality improvement skills and lack of employee training in group
discussion and communication techniques.
If employees are not satisfied with their job, there is likely to frequent cases of
turnover. A lack of satisfaction can occur due to multiple factors such as inappropriate
performance evaluation and reward system (Sebastianelli and Tamimi, 2003; Salegna and
Fazel, 2000); lack of empowerment and participation (Ngai and Cheng, 1997; Amaral and
Sousa 2009; and Angell and Corbett 2009); low motivation (Salegna and Fazel, 2000); poor
work environment and lack of incentives (McFadden et al., 2006). According to Amar and
Zain (2002), TQM programme are often viewed with scepticism, and are destined to fail if
they do not get the full support of the entire workforce. Authors further argue that
organisations that score highly on item such as “employees are resistant to change” and
“employee's satisfaction across the organisation is low” most likely have leaders who have
failed at communicating their commitment to quality in concrete ways. According to Denison
and Spreitze (1991), in the rational culture, the leaders are hard-driving producers, directors,
and competitors. They are tough and demanding. They emphasize productivity, performance
and goal achievement as one of the primary motivating factors. These characteristics of
119
rational culture will therefore be highly likely to help decrease employee barriers such as
employee satisfaction across the organisation and employee resistance to change”. In change
management, the attitude of employees towards quality is seen to be one of the greatest
barriers in many organisations. It has been reported that it is very difficult to change the
mindset of the employees with regards to quality because employees may believe that quality
is a needless task and added cost, and hence may not accept it as an integral part of the job
(Oakland, 2004). Rational culture has the potential to ensure change management that can
happen effectively by virtue of its results-oriented characteristic.
The preceding discussion supports the proposition that rational culture would help
remove TQM implementation barriers of lack of empowerment to employees to implement
quality improvement effort, employee are not involved in improvement projects, employees
are not trained in quality improvement skills, training employees in group discussion and
communication techniques is not considered necessary, employees and teams are not
recognized for achievements in quality improvement, employee's satisfaction across the
organisation is low and employees tend to be resistant to changes. It is then proposed that:
H8 – Rational culture decreases employee barriers
The creation of partnerships with customers (and suppliers) in a TQM environment is
compatible with the rational culture because organisations emphasizing the rational culture
pursue productivity, profit and impact supported by the measurement of customer preferences
(Denison and Spreitzer, 1991). According to Flynn et al. (1994), the focus of rational culture
on customers supports the organisations to work closely with their customers to understand
their needs and expectations so as to better position their products and services in the market.
Hence, top management needs to establish close contact with key customers to achieve
desired quality objective.
As mentioned previously, one of the founders of TQM concept Feigenbaum (1957)
stated that “TQM is an effective system when it ensures full customer satisfaction”. As also
mentioned previously, many TQM researchers have concluded that the core objective of
TQM is to delight the customers, such as Kanji and Asher (1996) and Adebanjo and Kehoe
(1998). Many other researchers have identified achieving customer satisfaction as a core
factor in TQM implementation, for example, through the identification and measurement of
customer wants and needs (Hackman and Wageman, 1995) and meeting or exceeding

120
customer expectations (Flynn et al., 1994). Deming (1986) stresses that quality should be
aimed at the present and future needs of the consumer. Since in the rational culture, the
organisation focuses on winning in the marketplace and outpacing the competition, it is
highly focused on expanding the customer base through competitive market leadership driven
by understanding customer needs and expectations.
The major principle of customer focus in TQM requires collection of customer
information and analyzing their feedback. Previous studies such as Tamimi and Sebastianelli
(1998), Nagi and Cheng (1997), and Adebanjo and Kehoe (1998) all emphasize on collecting
customers' requirements and feedback. Many authors have considered the “lack of customer
requirements and feedback system” as one of the very important barriers facing
organisations, and hampering adopting quality management system techniques (Bhat and Raj,
2009; Angell and Corbett 2009; Sebastianelli and Tamimi, 2003; Salegna and Fazel; and
Minjoon et al., 2004). Therefore, an organisation should have a good understanding of what
the customer wants through keeping customer contact and obtaining customer feedback.
Since, the organisations with rational culture have one of their primary focuses on customer
orientation, such organisations, according to Bowersox and Cooper (2007), seek
opportunities to collaborate with key customers and suppliers through strategic partnerships
to leverage strategic position and improve operating efficiency and productivity. The focus of
rational culture on the external market/resources can help to develop close relationships with
customers.
Consequently, the focus of rational culture on the external market/resources would
develop close relationships with customers and suppliers that would help remove the TQM
implementation barriers of lack of effective system to measure customer satisfaction, lack of
assessment of customers' needs and expectations, lack of effective customer feedback system
and lack of customer focus. It is then proposed that:
H9 – Rational culture decreases customer barriers.
3.5.4 Hierarchical culture and TQM barriers –hypotheses 10 and 11
According to Denison and Spreitzer (1991), an organisation with hierarchical culture
is a very controlled and structured place with formal procedures for coordinating, organizing
and smooth-running efficiency. There is security of employment, conformity, predictability,

121
and stability in relationships that ensures permanence, stability, efficiency, control and
smooth operations. The outcome of these characteristics is dependable delivery, smooth
scheduling and low-cost production (Denison and Spreitzer, 1991).
Further describing the characteristics of hierarchical culture, Cameron and Quinn
(1999) state that the hierarchical culture tends to use strategies of clear rules, close control,
and routinisation, and clear lines of decision making authority, standardized rules and
procedures, and control and accountability mechanisms are valued as the keys to success.
Correspondingly, TQM planning practices require using the formalized problem-solving
approach to plan and conduct projects with clear steps. Therefore, planning activities are
likely to truly flourish in a hierarchical culture.
Quinn and Kimberly (1984) state that in organisations with hierarchical culture, individuals
and departments will abide by organisational polices (plans) when formally stated and
enforced through rules and regulations. Supporting this statement, Cameron and Quinn
(1999) argue that organisations emphasizing the hierarchical culture are characterized by a
formalized and structured place to work where procedures govern what people do. Therefore,
employees of organisations with hierarchical culture will feel secure to use the prescribed
tools to plan well. Thus, the inherent characteristics of hierarchical culture such as predictable
outcomes, consistency and adherence to standardized guideline are expected to facilitate
organisations to put planning procedures to good effect. However, the strategic plans should
be customer driven and should include quality goals by institutionalizing new
approaches/tools/techniques (Bhat and Raj, 2009; McFadden et al., 2006; Jun et al., 2004;
Zeng et. al., 2008). Therefore, the hierarchical culture is highly likely to decrease planning
barriers such as: strategic plans are not customer driven, organisation's strategic plans do not
include quality goals, there are no specific ways of institutionalizing new approaches/ tools/
techniques and there are no joint planning activities with suppliers. It is then proposed that:
H10 – Hierarchical culture decreases planning barriers.
Quality of product/service can be improved through process management that would
result in less scrap and rework, less production costs and hence lower price for the consumer.
The bottom-line results of this practice would be the improved quality performance and
higher efficiency and productivity, and in turn better financial and market performance,
higher customer satisfaction, and competitive advantage (Kaynak, 2003). Hierarchical culture
122
values these bottom-line results and hence emphasizes system policy to improve process
management and thus would help remove the TQM implementation barrier of inefficient
process management due to lack of a comprehensive quality programme.
The main characteristics of hierarchical culture are control, centralization,
routinisation, formalization and structure, stability, continuity, order and predictable
performance outcomes (Naor, 2008). Organisations with hierarchical culture have rules and
regulations with a focus on control and stability, achieved through stability of processes.
Predictable work loads, scheduled production and statistical process control would increase
efficiency. Therefore, it is reasonable to argue that hierarchical culture would capitalize on
process control and help remove TQM implementation barrier of lack of a comprehensive
quality programme.
The hierarchical culture tends to have fixed organisational structure, with formal
rules, close control, clear lines of decision-making authority and a mechanism for
accountability (Dension and Spreitzer 1991). Departments work in harmony using the
formalized problem-solving approach. There are clear step-by step instructions, prescribed
tools and laid down procedures. The Quality management system in such organisations tends
to be all inclusive and quality initiatives include all organisational functions/departments.
Therefore, it is imperative that the existing quality management system is all-encompassing
and pervasive because TQM is promoted as a set of organisation-wide practices that unify
mindsets and perceptions among members of an organisation (Prajogo and McDermott,
2005). This ethos will help remove TQM implementation barriers of lack of a comprehensive
quality programme. The TQM barrier indicator of “lack of a comprehensive quality
programme” was found significant in many previous studies (Sebastianelli and Tamimi,
2003; Salegna and Fazel, 2000; Ngai and Cheng, 1997; Amaral and Sousa 2009; Huq, 2005;
Rad, 2004; McFadden et al., 2006; Jun et al., 2004).
Similarly, the TQM” barrier indicator of “quality is treated as a separate initiative” is
also found significant in previous studies (Amaral and Sousa 2009; Bhat and Raj, 2009;
Whalen and Rahim, 1994; Angell and Corbett 2009; Huq, 2005; Rad, 2004; McFadden et al.,
2006). These authors also state that ineffective communication with stakeholders is also a
significant barrier in TQM implementation. Other researchers such as Sebastianelli and
Tamimi, 2003; Salegna and Fazel, 2000; Ngai and Cheng, 1997; Kifyah and Zain, 2002; Jun
et al., 2004, also report the TQM barrier indicator of “inadequate resources to effectively
employ TQM’ as significant. Another TQM barrier indicator of “cross functional teams are
123
not used” is a identified as significant barrier (Sebastianelli and Tamimi, 2003; Salegna and
Fazel, 2000; Ngai and Cheng, 1997; Kifyah and Zain, 2002; Amaral and Sousa 2009; Bhat
and Raj, 2009; Whalen and Rahim, 1994; Angell and Corbett 2009; Huq, 2005; Rad, 2004;
McFadden et al., 2006; Jun et al., 2004).
The hierarchical culture emphasizes control and stability and its main focus is
internal. The emphasis on internal efficiency is achieved through standardization of
procedures and a strict observance of rules and regulations (McDermott and Stock, 1999).
Cameron and Quinn, (1999) suggest that in order to achieve a high level of quality,
organisational environment of hierarchical culture is favourable as it adequately supports the
process control. Kaynak (2003) asserts that process management in TQM focuses on
improving internal process stability (or to say reducing process variability) through
preventive maintenance, production schedules, and statistical process control. These process
management techniques are more likely to be implemented and maintained in the
organisations having dominant hierarchical culture because this culture pursues efficiency
and stability through error detection and measurement. Therefore, it is proposed that the
hierarchical culture will help decrease the process barriers of lack of a comprehensive quality
programme, quality being treated as a separate initiative (not everyone's responsibility), and
ineffective communication with external network of stakeholders, adequate resources to
effectively employ TQM not being available, and cross functional teams not being used. It is
then proposed that:
H11 – Hierarchical culture decreases process management barriers.
3.6 Chapter summary
Evidence in the literature suggests that the type of existing organisational culture has
an impact on TQM implementation barriers. A conceptual framework has been developed
that presents proposed relationships between the variables of organisational culture and TQM
implementation barriers incorporating four constructs of organisational culture
conceptualized by Denison and Spreitzer, (1991) and six constructs of TQM implementation
barriers derived from extant literature (chapter 2 section 2.6 and 2.7). This proposed structure
suggests 24 possible relationships, but only 11 relationships are hypothesized because these
are the only ones that are strongly supported based on close examination of TQM
implementation literature.

124
Following the findings of Prajogo and McDermott, (2005), this study assumes that
organisational culture is an antecedent of the TQM implementation barriers influencing TQM
implementation. In other words it assumes TQM implementation barriers are largely a
consequence of certain types of culture. The hypotheses were therefore developed to test
negative relationships between the variables. For example high score on group culture in an
organisation indicates that this organisation emphasises suitable training of employees,
employee involvement in decision-making, rewarding employees for quality performance and
communicating with them consistently in order to create awareness of organisational goals
for quality improvement. Therefore, theoretically, an increasing score on group culture is
hypothesized to result in decreasing score on employee barriers of lack of participation, lack
of empowerment and involvement and lack of employee motivation. These hypotheses are
stated to indicate the direction and significance of the relationships to be measured. The
structural parameter estimates in the subsequent analysis should be less than zero to show a
negative relationship.

125
Chapter Four: Research Methodology
4.1 Introduction
The main aim of this chapter is to outline the detailed methodologies implemented in
the research process that was adopted in this study. This research broadly aims to investigate
the factors that influence TQM implementation. The extant TQM literature suggests that TQM
implementation barriers will inhibit the effective implementation of TQM. In order to address
these barriers, many strategies have been suggested, but the role of existing organisational
culture to address these barriers has, to date, not been investigated systematically. In the
previous chapter the author proposed a number of relationships between organisational
culture and TQM barriers. In this context, the author proposed a framework that integrates
four constructs of organisational culture as conceptualised by Denison and Spreitzer, (1991)
and six constructs of TQM implementation barriers derived from a systematic review of the
literature. In order to examine its validity in the Bahraini context, the proposed framework
was empirically tested using a robust methodology as outlined in this chapter. The
considerations and steps involved in selecting and justifying the research methods were
discussed. Consequently, this chapter explains how this study was conducted and why it was
conducted in this way. Accordingly, the chapter is broadly divided into and structured
according to the following elements of the overall research design:
- Selection of research method and its major elements;
- Deriving a sample;
- Designing a data collection instrument;
- Reliability and validity test of the designed research instrument;
Selecting data analysis tools and methods
4.2 Selection and rationalization of the research process
This section discusses the selection and rationalization of the research process
adopted in this research. The areas discussed here are therefore: research philosophy,
specifically positivism; research approach which refers to deduction or induction; research
method, that is to say quantitative or qualitative; research strategy, for example survey or case
study; data collection methods, including mono, mixed and, multi methods; time horizons
(cross sectional or longitudinal); and techniques and procedures for data collection and data
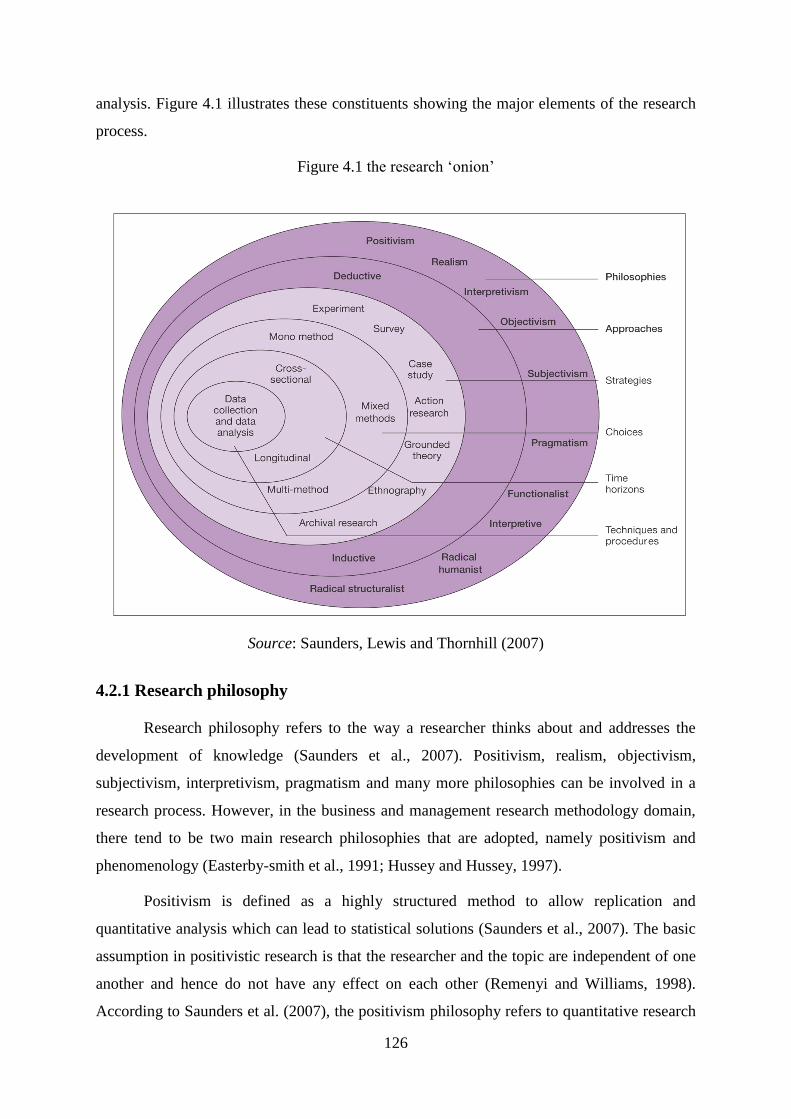
126
analysis. Figure 4.1 illustrates these constituents showing the major elements of the research
process.
Figure 4.1 the research ‘onion’
Source: Saunders, Lewis and Thornhill (2007)
4.2.1 Research philosophy
Research philosophy refers to the way a researcher thinks about and addresses the
development of knowledge (Saunders et al., 2007). Positivism, realism, objectivism,
subjectivism, interpretivism, pragmatism and many more philosophies can be involved in a
research process. However, in the business and management research methodology domain,
there tend to be two main research philosophies that are adopted, namely positivism and
phenomenology (Easterby-smith et al., 1991; Hussey and Hussey, 1997).
Positivism is defined as a highly structured method to allow replication and
quantitative analysis which can lead to statistical solutions (Saunders et al., 2007). The basic
assumption in positivistic research is that the researcher and the topic are independent of one
another and hence do not have any effect on each other (Remenyi and Williams, 1998).
According to Saunders et al. (2007), the positivism philosophy refers to quantitative research

127
which is the systematic empirical investigation of quantitative properties and phenomena and
their relationships which develops and employs mathematical models, theories and/or
hypotheses pertaining to phenomena. Authors further explain that positivism is based on
scientific methods, a body of techniques that investigates phenomena; develops new
knowledge; and corrects and integrates previous knowledge. In scientific methods, data is
collected through observation; experimentation; and formulation and testing of hypotheses.
According to Gilbert (2001), the positivist philosophy is used to develop valid and reliable
ways of collecting “facts” about society that can then be statistically analysed in order to
produce explanations about how the social world operates. The positivist researcher will
likely use a highly structured methodology in order to facilitate replication (Gill and Johnson,
2002).
As the positivist philosophy almost always involves numerical data collection, the
emphasis of the researcher is on quantifiable results by means of statistical analysis. In this
paradigm, researchers apply theories and hypotheses. A theory is conceptually defined as a
fully explained set of conceptual relationships that can be used for empirical tests. All theory
has four essential earmark properties: formal conceptual definitions, theory domain,
explained relationships, and predictions (Wacker, 2004). Research hypotheses are predictive
statements about the relationship between variables in quantitative research.
From a philosophical stance, a positivism paradigm uses deduction - beginning with
theory, and ending with drawing inference for supporting or revising a theory. The positivism
paradigm initiates a quantitative design to accept or reject hypotheses. The process of
deduction as described by Lee and Lings (2008) is illustrated in figure 4.2.
Figure 4.2 the process of deduction in positivism paradigm
Source: Lee and Lings (2008)
Step 1
•Theory (search for ideas)
Step 2
•Hypothesis - (conceptual development)
Step 3
•Data collection
Step 4
• Analysis & Findings
Step 5
•Hypotheses confirmed/rejected - (interpretation)
Step 6
•Revision/support of theory

128
In the present research, the researcher has reviewed the extant TQM literature that
suggests that TQM implementation barriers impede effective implementation of TQM. Many
strategies to address these barriers were reviewed which revealed that there is a lack of
research on the role of existing organisational culture to address TQM implementation
barriers. It was observed that some characteristics of organisational culture may facilitate
reducing these barriers and therefore a framework that integrates organisational culture and
TQM implementation barriers was developed from the literature. This framework was
empirically validated in the context of Bahraini industries by testing the stated hypotheses
and a predetermined structured research instrument was required. This main research process
in this study, that is to say the testing of the proposed conceptual framework, therefore
replicated a positivism philosophy.
It helps reveal people’s values, interpretive schemes and belief systems by gaining
understanding of human behaviours (Cavana et al., 2001). As mentioned earlier, a positivism
paradigm uses quantitative design that initiates from theory, developing hypotheses,
collecting and analyzing data and then accepting or rejecting hypotheses. In this context,
deductive approach represents the positivistic paradigm (Saunders et al., (2007). The features
of both positivistic paradigm are presented by Hussey and Hussey (1997) given in table 4.1.
Table 4.1 Features of the positivistic paradigms, source: Hussey and Hussey (1997)
Positivistic (quantitative) paradigm
Tends to produce quantitative data
Uses large samples
Concerned with hypothesis testing
Data is highly specific and precise
The location is artificial
Reliability is high
Validity is low
Generalizes from sample to population
According to the research questions given in Chapter 1, the best choice was to follow
the positivistic paradigm. Since this study uses deduction that starts with theory, developing
hypotheses based on theory and collecting data to support the hypothesis, therefore a
positivism research philosophy is appropriate for this research. However, the rationale to
select this positivism paradigm was also based on the following considerations recognized by
Hussey and Hussey (1997) and listed in table 4.1.
- produces quantitative data that would fit well with the survey strategy (explained in
section 4.2.3);

129
- enables large samples to be included for hypothesis testing that corresponds with
sampling method (discussed in section 4.3);
- is concerned with hypothesis testing that fits well with deductive approach (discussed
in section 4.2.2);
- data is highly specific and precise because of well structured survey questionnaire;
- high reliability of data enhances the reliability of results;
Low validity of data can be countered (and was) by structured interviews to validate
the survey instrument, validity tests of measurement model and validity test of the
constructs that constitute measurement model including face validity, convergent
validity, discriminant validity and nomological validity (explained in section 5.3.2.2).
4.2.2 Research approach
Research approach refers to the broad approach that has been adopted to conduct the
research. It involves selection of an appropriate path of research that can be taken to build or
to test the phenomena, concept, theory or framework under study (Saunders et al., 2007).
Approach essentially refers to whether the research involves a deductive or an inductive
approach. If the researcher uses the deductive approach, he/she develops a theory and
hypotheses, and designs a research strategy to test these hypotheses. As shown in figure 4.3,
deduction starts with theory, then moves on to observations/findings. Induction on the other
hand, starts with observations/findings and then moves on to theory. The complete process of
deduction includes: developing a theory, constructing hypotheses, collecting data, analyzing
data, testing the hypotheses, establishing the main findings, drawing conclusions and
presenting the results, in order to develop knowledge (Lee and Lings, 2008).
The features of positivistic/deductive paradigm are identified by Saunders et al.
(2007) and Hussey and Hussey (1997), as given in table 4.2.
Table 4.2 Features of positivistic/deductive paradigm
Positivism Deductive
A highly structured approach that moves from theory to data
using scientific principles
The collection of quantitative data
The application of controls to ensure validity of data
Selection of samples of sufficient size in order to generalize
conclusions
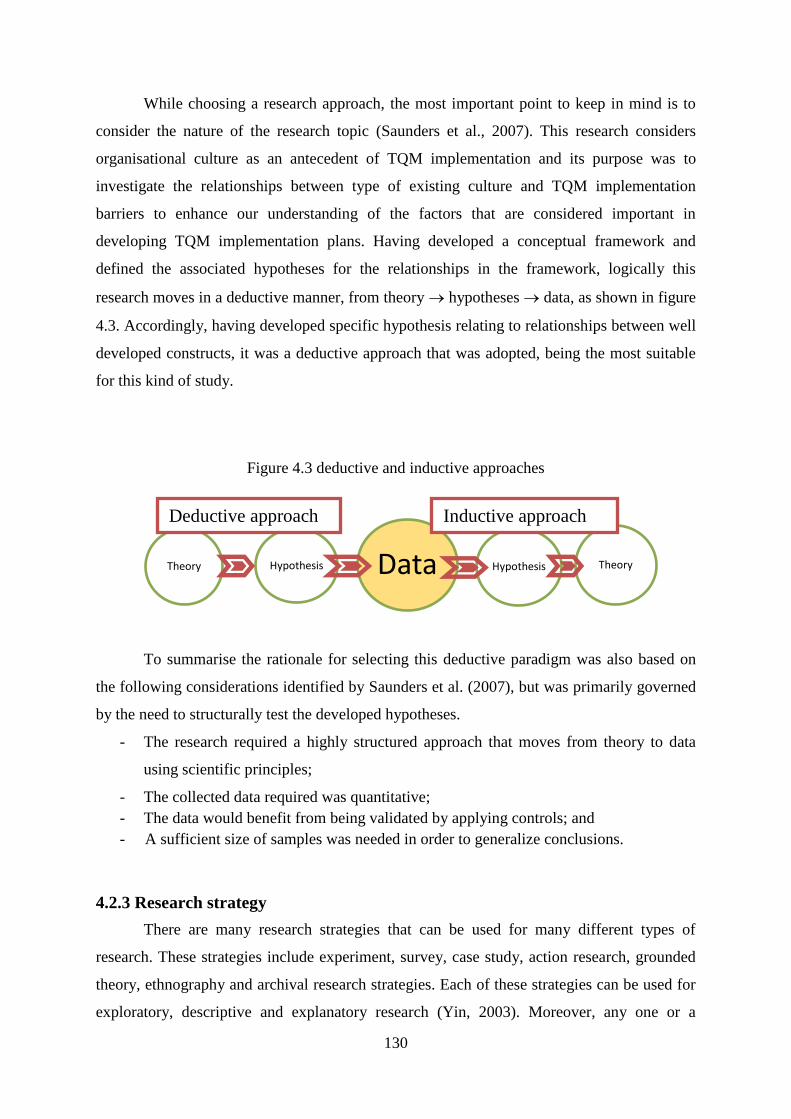
130
While choosing a research approach, the most important point to keep in mind is to
consider the nature of the research topic (Saunders et al., 2007). This research considers
organisational culture as an antecedent of TQM implementation and its purpose was to
investigate the relationships between type of existing culture and TQM implementation
barriers to enhance our understanding of the factors that are considered important in
developing TQM implementation plans. Having developed a conceptual framework and
defined the associated hypotheses for the relationships in the framework, logically this
research moves in a deductive manner, from theory hypotheses data, as shown in figure
4.3. Accordingly, having developed specific hypothesis relating to relationships between well
developed constructs, it was a deductive approach that was adopted, being the most suitable
for this kind of study.
Figure 4.3 deductive and inductive approaches
To summarise the rationale for selecting this deductive paradigm was also based on
the following considerations identified by Saunders et al. (2007), but was primarily governed
by the need to structurally test the developed hypotheses.
- The research required a highly structured approach that moves from theory to data
using scientific principles;
- The collected data required was quantitative;
- The data would benefit from being validated by applying controls; and
- A sufficient size of samples was needed in order to generalize conclusions.
4.2.3 Research strategy
There are many research strategies that can be used for many different types of
research. These strategies include experiment, survey, case study, action research, grounded
theory, ethnography and archival research strategies. Each of these strategies can be used for
exploratory, descriptive and explanatory research (Yin, 2003). Moreover, any one or a
Data Theory Hypothesis Theory Hypothesis
Inductive approach Deductive approach

131
combination of more than one can be used according to the needs of the researcher, the
research questions and objectives, the extent of existing knowledge, the amount of time and
other resources available and the philosophical stance of researcher. To determine the
appropriate research strategy, the focus of this research needs to be reviewed with regards to
its stated aims and objectives.
Identifying the relationship between the organisational culture and TQM
implementation barriers would add an additional and important level of understanding that
can help in facilitating TQM implementation. This is the main premise on which the
proposed conceptual framework (chapter 3) was based. Three main research questions as
stated in chapter one are to: 1) find out the type of existing culture, 2) find out the barriers
inhibiting the implementation of TQM and 3) investigate the relationships between the types
of existing culture and TQM implementation barriers to enhance our understanding of the
factors that are considered important in developing TQM implementation. This would help to
determine the type of supportive culture which can either reduce these barriers or offset the
effects of these barriers. These data collection and hypotheses testing needs pointed strongly
to the need for a positivism research philosophy and deductive research approach that in turn
pointed strongly towards the need for a survey based methodology. Therefore, the survey
research strategy was appropriate to be used in this research process, mainly because of the
deductive approach requirement.
The survey strategy allows collection of large amount of data from a sizable
population in a highly economic way. Often obtained by using a questionnaire administered
to a sample, these data are standardized, allowing easy comparison (Saunders et al., 2007).
The authors further stated that the survey strategy is authoritative in general and is both
comparatively easy to explain and understand. This strategy can provide robust results when
the sample is representative of the population under study, the data collection instrument is
effective and the response rate is acceptable. The following excerpt from Saunders et al.
(2007, p 138) explains this strategy very effectively:
The survey strategy allows you to collect quantitative data which can be analyzed quantitatively
using descriptive and inferential statistics. In addition, data collected using a survey strategy can
be used to suggest possible reasons for particular relationships between variables and to produce
models of these relationships. Using a survey strategy should give you more control over the
research process and when sampling is used, it is possible to generate findings that are
representative of the whole population at a lower cost than collecting the data for the whole
population.
132
In line with the above statement that corresponds closely to the aim, objectives and
research questions of this research, it was logically appropriate to use the survey strategy in
this research. The survey methodology has been extensively applied in research examining
aspects of TQM (Tamimi and Gershon 1995; Black and Porter 1996; Wilson and Collier,
2000; Kaynak, 2003), organisational culture (Chang and Wiebe, 1996; Al-Khalifa and
Aspinwall, 2000; Dellana and Hauser, 1999) and relationships between different TQM
constructs (Prajogo and McDermott, 2005, Stock et al., 2006; Zu et al., 2010).
4.2.4 Research method
Tashakkori and Teddlie (1998) propose that there are three methods in research:
quantitative, qualitative and mixed methods. The quantitative method collects numeric data
through experimentation or survey strategy. The qualitative approach collects open ended
textual data using case study strategy through interviews. The mixed methods involve
collecting data one time or one at a time using a mixture of both quantitative and qualitative
methods. According to Matveev (2002), quantitative methods can provide a high level of
measurement precision, statistical power, and high levels of reliability of data, while
qualitative methods can supply a greater depth of information about the nature of data. In
order to utilize the statistical power of the quantitative method the data is analyzed using
statistical (quantitative) analysis procedure. Therefore, the research method used in this study
was a single quantitative data collection method in the form of survey questionnaire along
with quantitative data analysis procedures.
Being a deductive study, this research study followed the process of scientific studies
where causal relations can be established between different variables. This was suitably
achieved by quantitative data analysis that enabled the author to formulate and to understand
the relationships, and hence impact of the variables in the proposed framework. As the
hypotheses were stated and tested in their operational form, the outcome allowed the author
to infer the central meaning, directions and strengths of relationships between culture and
TQM implementation barriers.
4.2.5 Data collection method
According to Saunder et al., (2007, p 145), quantitative (method) is predominantly
used as a synonym for any data collection technique (such as questionnaire) or data analysis
133
procedure (such as graphs and statistics) that generates or uses numeric data. In quantitative
studies, paper-based survey instruments or electronic survey instruments are generally used
for data collection. Data obtained through paper-based surveys can be collected through
personal interviews, telephone interviews or by sending the survey questionnaire through
postal mail. Electronic surveys are commonly administered via the web or through email.
In this research, an electronic survey method was selected and a survey questionnaire
was administered via a web-based technique. According to Cobanoglu et al. (2001), the cost
savings associated with eliminating the printing and mailing of survey instruments as well as
time and cost savings of having returned survey data already in an electronic format are the
possible advantages of using web-based surveys. Karakoyun and Kurt (2010) argue that the
advantages of web surveys are: a fast response rate; ease of sending notification to users
through group emails; the option of putting questions in a random order; and the ease of
importing responses into database applications. The main reasons for selecting a web mode of
survey in this study was the ease of internet survey design, ease of management and
administration of the survey, straightforward implementation, lower cost and potentially
faster results. This kind of survey is beneficial for studying populations with full access to
the Internet and respondents having essential Internet browsing skills (Dillman, 2009).
Considering the literacy rate of 91% and internet usage of 52% (World Bank report, 2008),
the population of Bahrain was considered to be well-resourced for web-based surveys.
Furthermore as explained in the following sections, the sample consists of highly educated
respondents, therefore issues of access to the Internet and respondents having essential
Internet browsing skills were not deemed to be prohibitive using a web-based survey.
Nevertheless, there are some issues such as SPAM/Privacy of respondents, some technical
issues in submitting multiple submissions and not having an expert present to clarify
questions that represent acknowledged potential disadvantages. Despite these disadvantages,
web-based surveys are cost efficient with faster delivery, having many design options, having
dynamic controls, have the ability to track, quick response time and above all have many
design options with response error control options (Dillman, 2009). It may be argued that the
most desirable aspect of web survey from a researcher’s perspective is that data is collected
in an electronic format that can be employed for analysis straight away.
134
4.3 Sampling method
A sample is a subset or relatively small fraction of the total elements in the population
(Zikmund, 2003) and is a crucial function of the research methods selection. In this study, as
in most business research studies, analysing all elements of the population is not possible
therefore the use of a sample was the most practical research approach. It was necessary to
select the sample in order that it provides enough primary data for analysis of the fact under
inquiry and represent the targeted population. Therefore, it was planned to obtain responses
from many types of organisations from manufacture/service industries within Bahrain so that
generalisation of the findings could be established.
Two major classifications of sampling design are probability and non-probability
methods. Probability sampling permits specifying the probability that each sampling unit will
be included, and the non-probability sample is a sampling method in which there is no way of
specifying the probability of each unit’s inclusion in the sample (Neuman, 2004). Based on
criterion such as analysis tests; research approach; data availability; expected response rate;
data restriction; randomness; sampling stratum; population clusters; and probability, samples
can be drawn with a central characteristic. This kind of non-probability sampling involves a
procedure that uses a small number of items or a portion of the population to make a
conclusion regarding the whole population (Zikmund, 2003). Therefore it is very seldom that
the sample has exactly the same characteristics as the population.
The target respondents for this survey were managers, directors, quality managers and
operations managers who are decision makers, policy implementers and policy receivers in
both manufacturing and service industries of Bahrain. The respondents were selected based
on relevance, qualification and experience. Therefore the probability that each sampling unit
would be included was not possible because selection was partly judgemental. According to
the nature of this research, therefore non-probability sampling was particularly relevant and
suitable and was the approach used.
Nevertheless, the data was collected as per the following stratification based on non-
probability sampling theory to achieve as best as possible representation of the industry
population, and to ensure reliability and validity of the data. The target sample was divided
into ten segments of service industry and eight segments of manufacturing industries. This
stratification was based on categories (service, manufacturing) and sizes of the organisations
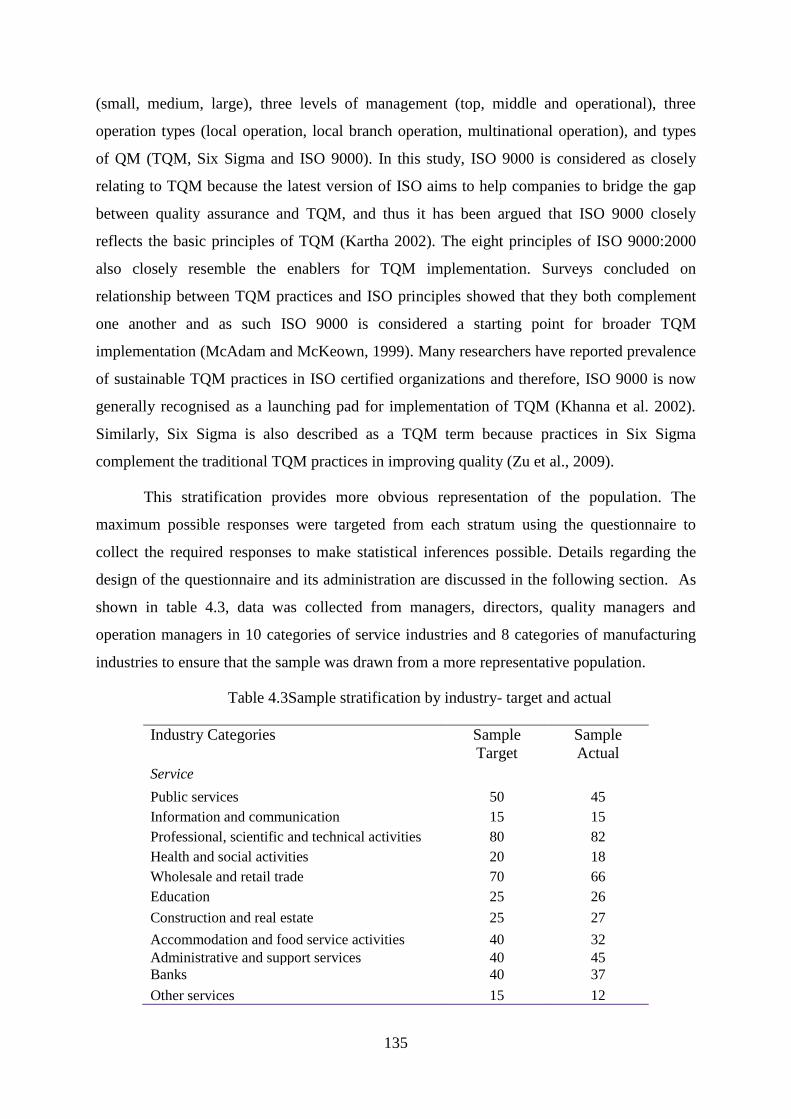
135
(small, medium, large), three levels of management (top, middle and operational), three
operation types (local operation, local branch operation, multinational operation), and types
of QM (TQM, Six Sigma and ISO 9000). In this study, ISO 9000 is considered as closely
relating to TQM because the latest version of ISO aims to help companies to bridge the gap
between quality assurance and TQM, and thus it has been argued that ISO 9000 closely
reflects the basic principles of TQM (Kartha 2002). The eight principles of ISO 9000:2000
also closely resemble the enablers for TQM implementation. Surveys concluded on
relationship between TQM practices and ISO principles showed that they both complement
one another and as such ISO 9000 is considered a starting point for broader TQM
implementation (McAdam and McKeown, 1999). Many researchers have reported prevalence
of sustainable TQM practices in ISO certified organizations and therefore, ISO 9000 is now
generally recognised as a launching pad for implementation of TQM (Khanna et al. 2002).
Similarly, Six Sigma is also described as a TQM term because practices in Six Sigma
complement the traditional TQM practices in improving quality (Zu et al., 2009).
This stratification provides more obvious representation of the population. The
maximum possible responses were targeted from each stratum using the questionnaire to
collect the required responses to make statistical inferences possible. Details regarding the
design of the questionnaire and its administration are discussed in the following section. As
shown in table 4.3, data was collected from managers, directors, quality managers and
operation managers in 10 categories of service industries and 8 categories of manufacturing
industries to ensure that the sample was drawn from a more representative population.
Table 4.3Sample stratification by industry- target and actual
Industry Categories Sample
Target
Sample
Actual
Service
Public services 50 45
Information and communication 15 15
Professional, scientific and technical activities 80 82
Health and social activities 20 18
Wholesale and retail trade 70 66
Education 25 26
Construction and real estate 25 27
Accommodation and food service activities 40 32
Administrative and support services 40 45
Banks 40 37
Other services 15 12

136
The questionnaires were administered to both organisations who have already adopted
TQM successfully or unsuccessfully, and also to organisations yet to use the TQM concept
explicitly. Therefore, one segment of the sampling frame was the data collection from
organisations yet to explicitly use TQM concept. The argument for including these firms
draws upon literature evidence. The company leaders and quality managers of such
organisations may not be specifically familiar with TQM but may be practicing TQM
principles routinely without even knowing it (Oakland, 2004). This would mean that their
frame of reference in answering the survey questionnaire about TQM barriers would be their
practical experience of quality rather than necessarily their knowledge of a defined quality
standard. Therefore, data from all three categories of organisation strata (organisations with
successful TQM, organisations with unsuccessful TQM and organisations not yet explicitly
claiming to use the TQM concept) was collected through the same survey questionnaire.
Another sampling issue concerned the size of the sample. Typically, large samples are
more precise than small samples, but if proper sampling is implemented, a small proportion
of the total population will give a reliable measure of the whole (Zikmund, 2003). There are
two types of sample sizes to determine:
Sample size determination used to find the number to have enough participants to be
representative of a population; and
Sample size determination to achieve statistical power.
Population representation is determined through many variables such as population
size, estimated variance in population and desired precision level based on confidence level
(Dillman et al., 2009 p-56). The population size from which this study’s sample was to be
Total service response 420 405
Manufacture
Chemicals and chemical products 30 31
Food product 20 18
Metal and fabricated metal products 20 20
Non-metallic products 30 26
Oil & Gas 10 9
Paper, wood product 10 11
Textile products 10 12
Other products 10 8
Total manufacturer response 140 135
Total Number 560 540
137
drawn was 2000 service and manufacturing companies of Bahrain. According to Dillman et
al. (2009 p-57), the completed sample size needed for the above population parameters was
therefore at least 219 responses. Therefore, a minimum number of 219 responses were
required to get reliable statistics on prevalence of culture and barriers; and represent
population. However, for a more precise representation of a population, sample stratification
was used to include respondents from all population segments.
Other sample size determination is to achieve statistical power. In order to assess this
type of sample size the researcher needs to know what type of statistical analysis will be
conducted because, for example, the sample size calculation for an ANOVA is different than
the sample size for a correlation or factor analysis. Tabachnick and Fidell (2007) recommend
that for SEM, sample size depends on the number of independent variables available for
testing in the proposed theoretical framework that the author wishes to apply. According to
this method, it is N > 50 + (8 x m) where m = number of independent variables and N is the
size of the sample. Considering all of the variables as per the theoretical framework described
in chapter 3, this study required more than 50 + (8x24) =242 respondents. To reduce any
errors arising out of data insufficiency, the author targeted twice this number of responses
that is to say 484 (further rounded up to 500).
4.4 Survey instrument and measurement scale
In order to measure the impact of underlying cultural characteristics on TQM
implementation barriers, the author needed to collect information on the type of
organisational culture and the significant TQM implementation barriers that exist in Bahraini
industries. This section explains the design of the survey instrument including the associated
measurement scales. This operationilsation of the survey instrument provided the empirical
evidence from the sample population.
A questionnaire is the set of questions arranged in a specific structure to extract
information (Dillman, 2009). These can be self-completion or personally administered.
According to Bryman and Bell (2007), survey questionnaires are very popular among
researchers because:
- they take less time to administer and less cost to carry out,
- they enable quick extraction from respondents,
- they permit flexibility of time and place arrangements when used online or in a mail
survey,
138
- software tools are readily available for data analysis, for example SPSS,
- large sampling frames are possible through World Wide Web, and
- they can limit the effects of biases compared to observation and interviewing methods
A poorly designed questionnaire can’t provide good data because it may increase
respondents’ bias and it might have not addressed the research questions or hypotheses in its
structure (Saunders et al., 2007). To prepare the questionnaire to be fit for purpose, one must
consider how the collected information is to be used and analysed. The tests and analysis to
be performed should be known in advance before finalizing and launching the questionnaire.
4.4.1 Survey questionnaire design
The following best practice criteria were followed while designing the questions (Kline,
2005):
- no negatively worded questions;
- no jargon or double meaning words used;
- no cultural or abbreviated words applied no emotionally loaded questions; and
- to the point and direct questions
Based on the construction of the theoretical framework with its underlying proposed
hypotheses, the questionnaire was designed to ascertain the current personal and
organisational profile of the respondents; type of existing organisational culture; and existing
TQM implementation barriers. Accordingly, the questionnaire was structured into the
following three sections in order to provide empirical evidence to test the hypotheses and
answer the research questions given in chapter 1. The full questionnaire is provided in
Appendix A.
4.4.1.1 Part I – survey questions on organisational and respondent profile
The first section of the survey instrument consisted of questions gathering personal
and organisational profile information of the respondents.
- Questions 1-5 included job title to verify relevance; qualification to verify ability of
respondent to understand and respond to the questions rationally; work experience to
verify familiarity and understanding of the respondent; and quality experience to verify
the practice of respondent.

139
- Questions 6-11 included size of the organisation, type of industry, type of operation,
service provided, type of product, type of quality programme in place, duration of
programme, and whether the firm was explicitly using TQM or not.
The questions on personal and organisational profile provided data on demographics
and magnitude and distribution of TQM practices within the sample. This data has thus
provided current knowledge of the status of organisational culture and TQM barriers in
organisations in Bahrain.
4.4.1.2 Part II – survey questions on organisational culture
The objective of this section of the questionnaire was to identify type of dominant
culture in the organisations and its characteristics. In this context, and as referred to in section
2.6.3, there are many models for the assessment of organisational culture but three have been
frequently used by researchers and practitioners. These were given in chapter 2, table 2.3.
As shown in table 2.3, researchers have developed their instruments for assessing the
organisational culture profile based on the definition of culture types. This was efficiently
done by Cameron and Quinn (1999) when they designed the Organisational Culture
Assessment Instrument (OCAI). Although types of culture were named differently than those
put forward by Denison and Spreitzer, (1991), the content was according to the definitions of
Denison and Spreitzer (1991). Denison and Neale (2000) later developed the Denison
Organisational Culture Survey (DOCS), renaming the culture types as shown in table 2.3.
This instrument was also mostly based on the same content as Denison and Spreitzer (1991).
In this model, each of these orientations of culture represents one of the four models of
organisational theory, comprehensively defining the characteristics of each type of culture
along with underlying assumptions like motivation, leadership and effectiveness. The main
assumption in this framework is that an organisation can be characterized according to
cultural traits or dimensions. In this study, the competing values model used by Chang and
Wiebe (1996) and Dellana and Hauser (1999) was selected as the organisational culture
model. However, in order to operationalise the measurement of four types of culture (group,
developmental, hierarchical and rational) the model developed by Denison and Spreitzer
(1991) was used and operationalised with the corresponding measurement items in the OCAI
(Cameron and Quinn, 1999). The same instrument was used by Al-Khalifa and Aspinwall,
(2000), Prajogo and McDermott, 2005, Stock et al., (2007) and Zu et al., (2009).

140
The CVF is used for assessing and profiling the dominant cultures in organisations
because it helps individuals to identify the underlying cultural factors that exist in their
organisations. CVF is used to measure the four types of organisational culture from six
underlying dimensions (organisational character, leadership character, management style,
binding force, emphasis of organisation and success criteria). Question 12-17 were developed
to measure the score on each of the four cultures types from these six dimensions. The
respondents were asked to select the level of his/her agreement/disagreement in each case.
Following the work by Chang and Wiebe (1996) and McDermott and Stock (1999) the
measurement scale used was a Likert type scale 1 to 5 (1- Strongly disagree to5- Strongly
agree).
4.4.1.3 Part III – survey questions for identifying significant TQM implementation barriers
The questions in Part III covered the TQM implementation barriers. As already
discussed in section 2.7, in order to develop survey questionnaire, the author identified
studies related to TQM barriers from good quality academic journals and made a master set
of all cited barriers in all selected studies. From this list, the author derived a more robust set
of common barriers as filtered through more stringent criteria. The derived set of TQM
barriers was organized into a systemic topology of barrier constructs through logically
grouping the barriers according to their nature and area of influence within the broad TQM
framework. This ensured that the TQM implementation barrier constructs were consistent
with established TQM theory and very closely mirrored the general taxonomy of the six main
TQM principles given in the Baldrige framework.
Thus, the author derived barrier constructs comprising thirty two individual indicators
and sought to find their level of existence in the target population. Six main questions (18-23)
were composed on barriers in which respondents to the survey questionnaire were asked to
indicate their agreement/disagreement on the existence of the TQM implementation barriers
in their organisations. A Likert-type (1 to 5) scale with end points of “strongly disagree’’ and
‘‘strongly agree’’ was used. In order to calculate an overall score for each barrier construct,
the score of each of its barrier indicators was summed and then averaged.
4.4.2 Summary of measurement scales
Thus, in this research, independent and dependent variables were used to measure the
organisational culture profile and TQM implementation barrier profile respectively. One
validated existing scale of 24 items was adopted for measuring the organisational culture

141
profile. This survey instrument for assessment of organisational culture used in this study was
a tried and tested instrument in the organisational culture arena (Al-Khalifa and Aspinwall
(2000); Prajogo and McDermott (2005); Stock et al. (2007); and Zu et al. (2009).The other
measurement scale for measuring the TQM implementation barrier profile, originally
consisting of thirty two items was developed from previous studies by Sebastianelli and
Tamimi (2003); Salegna and Fazel (2000); Ngai and Cheng (1997); Bhat and Raj (2009); and
Jun et al. (2004). The measurement scale and survey instrument was validated for
comprehensiveness through structured interviews before administering the main survey.
4.4.3 Pilot structured interviews to validate the survey instrument
Pilot structured interviews are a good way of testing and taking feedback on content,
clarity and style of the questionnaire (Dilman et al., 2009). Therefore, the adapted scales were
tested through structured interview from quality practitioners and academics in Bahrain. The
validity of these questions in terms of content, clarity and structure was sought from
researchers and academia with 12 selected prominent quality practitioners and academics.
The targeted quality practitioner respondents for the structured interviews were selected
based on their industry experience. Managers, directors, quality managers, operation
managers who were decision makers, policy implementers and policy receivers were the
respondents of the structured interviews. In addition to these practitioners, the views of
academics with experience in quality management and TQM were also sought. These
reviewers were chosen because they were experienced quality/TQM practitioners and/or
experienced quality/TQM researchers. Feedback on the survey questionnaire was thus taken
from field experts and quality professionals, who were similar to the target population (Fink
and Kosecoff, 1998; Nunnally and Bernstein, 1994), for their comments on clarity, structure
and validity of the content. The aim was to establish whether the questionnaire measured
what it intended to measure (Saunders et al., 2007).
The purpose of the structured interviews was to enable the researcher to identify any
deficiencies in the survey questionnaire. Questions relating to personal and organisational
profile were located in many previous studies in different formats. In addition, question banks
such as the ESRC Question Bank were searched to find questions and coding schemes in
order to appropriately design and word these questions. Using these sources for guidance
questions on personal and organisational demographic related profile were developed. The
questions on organisational culture profile were adopted from other studies and thus were
142
already assessed for ‘content validity, criterion-related validity and construct validity’
(Blumberg et al., 2005). Conversely, the questions on TQM implementation barriers were
developed by the author thus testing the internal validity was ensured through a pilot test of
the survey questionnaire in structured interviews. Suggestions on leading, offending,
ambiguous or misunderstood questions were sought. The following checklist (partially taken
from Saunders et al., 2007) was provided to help the scrutinizers undertake their task.
Overall questionnaire
- Instruction set with questionnaire is understood;
- Questionnaire measures what it intends to measure;
- Is there any area not addressed in questionnaire that should be;
- Coding of questionnaire is appropriate;
- The order and flow of questionnaire is logical;
- Layout of questionnaire is friendly and attractive;
- Measurement scales are understood and valid;
- How well each scale captures the construct that it intended to measure; and
- Structure of the questionnaire.
Individual questions
- Wording is familiar, unambiguous and not confusing the respondent;
- Wording is not offensive and doesn’t embarrass the respondent;
- Questions are not longer than necessary and easy to answer;
- Questions are not ‘double-barrelled’ or double negative;
- Questions or not biased and not leading to correct answer or prevent certain answers;
and
- Categories of options (where needed) are appropriate.
Using their feedback, the instrument was revised further to ensure that the
questionnaire was comprehensive, understandable and valid from these experts’ perspective.
The respondents provided useful information on the design of the questionnaire and
recommended to add 5 more indicators in the barriers that they deemed to be critically
important in light of the target Bahrain population. After discussion with the academics and
other quality professionals, the suggested additional 5 barrier indicators were added in the
survey instrument to make it more comprehensive. Table 4.4 lists these 5 additional barrier
indicators along with the associated barrier constructs. It also provides references to studies

143
where they have been mentioned once or twice and as such were not included in the original
selection. These references do however add extra weight to including these barriers as
advised by the pilot interviewees.
Table 4.4: List of 5 barriers indicators suggested by structured interviews
Construct S# Barriers Indicators
Top management
barriers
1 The leaders in our organisation don’t set goals and objectives for
quality improvement (Sebastianelli and Tamimi, 2003; Minjoon
et al., 2004)
2 Middle managers don’t provide an effective link between top
manager and operators (Thomas and Armstrong, 2004)
Employees barrier 3 Lack of internal TQM expertise (Ngai and Cheng, 1998; Amaral
and Sousa, 2009)
4 Lack of an appropriate performance evaluation and reward
system (Ngai and Cheng, 1998; McFadden et al., 2006)
Process management
barriers
5 Organisation tends to have many uncoordinated (ad hoc) quality
initiatives (Huq, 2005; Amaral and Sousa, 2009)
The final survey instrument used in this research is given in appendix A.
4.5 Data collection
Secondary data from literature was initially required in this research by the author to
gain initial insight into the research problem and identify key issues that would be addressed
by the research. Secondary research consisted of investigation of quality and its movement;
TQM origin and concept; TQM standards, TQM Award models; cultural perspective of
TQM; TQM principles; and TQM implementation barriers. This secondary data collection
was taken mainly from paper based books, magazines, journals, periodicals, industry research
papers and conference papers. Electronic online databases like Emerald, Elsevier Science,
and ABI Inform Global (ProQuest Direct) and many other internet sources were used to aid
the search for the relevant literature. The findings from this literature review led to the
specification of the conceptual framework and the research hypothesis.
In order to collect primary data, 560 target respondents were selected but only 540
questionnaires were delivered. For ascertaining the target respondent contact information, all
available resources were used to select the respondents based on relevance, qualification and
experience. The email and phone numbers were collected in a database with stratification
details. The Dillman (2009) “tailored design” approach was used to administer the survey.
Four emails (pre-notice email, survey release email, reminder email and follow-up survey
email thanking both the respondents and the non-respondents) were sent at appropriate
144
intervals. Before the survey release the targeted respondents were sent an email message to
seek their approval. Subject to their approval, the URL address of the online survey
questionnaire was sent to them.
The participation was voluntary through the invitational and reminder emails given in
the appendix A. A total number of 325 respondents (60%) responded to the survey. It should
be noted that although internet access and computer skills of the target respondents were
adequate, as Dillman (2009) explains, there is always the possibility that wide-spread distrust
of internet communication and increased occurrence of cyber crimes such as phishing scams,
identity theft, potential virus threat, and unwanted and offensive email ads, may limit online
survey response especially when the respondent is asked to click to another website link.
Nevertheless, the benefits of the web survey approach took precedence. In a similar study
done in the USA by Dellana and Hausser (1999), the response rate was just 21.9%. Another
study on TQM-culture relationship was performed in Australia by Prajogo and McDermott
(2005) and yielded a 22.8% response rate. In this context, the 60% response rate in this study
is considered excellent and quite acceptable for this type of survey (Dilman, 2009).
4.6 Data analysis
This section provides details of the data management, data screening prior to analysis,
treatment of missing data, outlier examination, normality test and reliability analysis tests and
selection of statistical analysis tools for data analysis.
4.6.1 Data management
Once the survey was administered and the data were collected from the 325
respondents, the data was downloaded from the online survey website in CSV format. Data
was converted to MS Excel (XLS) format and merged into an SPSS database to be analyzed.
The dataset exported to SPSS didn’t include any information (e.g., name, e-mail address,
home or office address) that could identify the individual respondent who provided the
information. The only link to respondent information was a reference code that was known
by the researcher in case of a need to contact the respondent for any verification. Further to
this, all data would be reported in aggregate to avoid any identification of individual
responses.

145
4.6.2 Data management in MS Excel
Q 17.5 and Q 25.7 were deleted because there was no data in these 2 columns. These
columns were used as place holders of notes to respondents. Job title was an open ended
question and respondents provided various job titles. In order to manage this, answers were
scanned for common themes and the given job titles were categorized into 4 groups by the
researcher - top management, middle management, quality professionals, and supervisors. In
education level, some respondents didn’t use the education level categories given in the
questionnaire (HSSC, Diploma, Bachelor, Masters and PhD). Instead they gave this
information in others field by writing their education level in an open ended text box
provided for this purpose. This information was matched with the 5 existing educational level
categories for equivalence and the appropriate level was assigned.
4.6.3 Data management in SPSS
The format of the Data file was first prepared in SPSS according to the required data
formats. All data elements were completed such as Variable Name, Data Type (numeric,
string), width (number of characters), decimals (decimal places), Labels (short description of
variables), Values (descriptive value labels of numeric codes to represent non-numeric
categories), missing (data missing because the question didn't apply to that respondent),
columns (width), alignment, and Measures (scale, nominal, ordinal). Using the SPSS data
editor, the data file was prepared defining and labelling the variables and assigning numerical
format to each of the questionnaire responses, such as assigning short names to variables;
assigning descriptive labels to variables (descriptive labels are self explanatory and act as
code book); assigning numerical values to categorical variables (value label e.g. 0=No,
1=yes); and assigning type of measures to each variable (scale, ordinal, nominal).
Once the formatting of the data file structure was prepared, the Data was copied from the
Excel sheet and pasted into SPSS. A careful process of sampling was undertaken then to
verify the data in the columns and rows for accuracy during the transfer. It was confirmed
that all data was in the correct positions.
4.6.4 Data screening prior to analysis
A general precondition of analyzing the data is the accuracy of data. Data errors can
occur at both respondent and researcher level - where a respondent may key wrong
information e.g. (10 instead of 1) or where the researcher may enter erroneous data (enter the

146
data in the wrong column/row). Although minimal data entry errors were expected as a result
of using the web based survey technique, data screening was undertaken thoroughly,
including error checks, handling of missing data, and checking outliers and normality, as any
of these may impact on the analysis and hence findings.
4.6.4.1 Checking data for errors
Error checks were made by looking for values that were out of range for a defined
value of categorical variables. Using descriptive statistics, frequencies were checked using
central tendency, distribution and dispersion methods and no out of range values were
detected. Descriptive statistics was also performed to find mean, sum, minimum and
maximum by using distribution and dispersion methods. No out of range values were
detected. More errors were searched for by selecting and displaying specific pieces of
information for each case by summarizing the cases. In addition errors were searched for by
sorting cases by each variable in ascending/descending order of their data values. No errors
were detected. Duplicate cases were searched for and no duplicate cases were found.
4.6.4.2Missing data
Missing data is the second critical issue in data analysis. It is a fairly common
occurrence in certain areas of research which can affect the results (Tabachnick and Fidell,
2007). In part I of the survey (demographics) there was no missing data observed in the work
experience and quality management experience field. However, some data was missing in
terms of number of employees. Instead of using statistical techniques to replace this missing
data, the researcher used a more proactive and realistic strategy. Respondents were contacted
by phone and asked about the number of employees in their company. The number of
employees provided by them was used to replace missing data. Some missing data was
observed in company type, operation type and QM type. This missing data was carefully
replaced using information in ‘others’ text box where the respondent had supplied an open
ended answer (free text). However, some missing data was expected in production process
type and product type because these two questions were specific to manufacturers and were
not applicable to service industries. Questions on existing organisation culture and TQM
implementation barriers were on a likert scale (1 to 5) and answers to these questions were
mandatory. Therefore, no missing data error was found in these questions.
147
4.6.4.3Checking for Outliers
Outliers are the cases with a value well above or below the majority of cases in the
respondent sample (Pallant, 2007 p.62). They occur with an extreme value on one variable or
a combination of scores on two or more variables to deviate the statistics (Tabachnick and
Fidell, 2007). According to Hair et al (2006, p.73) an outlier is judged to be an unusually high
or low value on a variable, or a unique combination of values across several variables that
make the observation stand out from the others. As many statistical techniques are sensitive
to outliers and an outlier is a score with a distinct characteristic from the rest of the data,
therefore the potential outliers need to be checked and assessed.
The web survey software used for data collection had the characteristic to get
mandatory response (however, to avoid the bias respondents were provided the option to stay
neutral if he/she was not sure of the answer). This strategy circumvented possible outliers to a
great degree. Only one response set that involved numeric data was left open and that was for
the number of employees in the organisation. Possible outliers were checked using
descriptive statistics and selecting histogram plots. All relevant variables were checked and
the scores appeared to be reasonably normally distributed. Normal probability plots also
supported this result. (The tables and plots of relevant variables are not shown in this thesis
for space issues, but are available upon request).
In this study, outliers were assessed using descriptive statistics in SPSS. First all
variable of organisational culture were selected and checked for outliers. In the histogram of
each variable given in appendix D (figure D1), tails of distribution have no data points sitting
on extremes and score drops in an even slope. As shown in the box plots given in the
appendix, there were no extreme points. If the boxes in the box plots extend more than 1.5
box-lengths from the edge of the box then it is a sign of potential outliers. Seven such outliers
were identified and four of them were marked with asterisks as extreme points that extend
more than three box-lengths from the edge of the box. The data file was first checked, and it
was found that their scores were genuine and not errors. In addition, the scores were within
the range of possible specified scores of the associated variables (mean value and 5%
Trimmed Mean value are similar) and as such would not distort the statistics. The same check
was undertaken on all variables of TQM barriers. In the histogram of each variable given in
appendix D (figure D2), two such outliers were identified, in case number C004 and C013.
148
The data file was checked and it was found that the scores were genuine and not errors. In
addition, the scores were within the range of specified score of these variables.
In order to assess how problematic these few outliers could be, descriptive statistics
were run again and a 5% trimmed mean was checked. It was observed that there was no
significant difference between the trimmed mean and mean value of these variables.
Therefore the identified outlier cases were retained in data file.
4.6.4.4 Normality check
Normality in the distribution of scores is another key assumption in measuring variables. For
analysing the data, it is not always required, but is generally regarded as preferable if the
variables are normally distributed (Tabachnick and Fidell, 2007). Normality of data can be
assessed by statistical methods (Tabachnick and Fidell, 2007 and Hair et al., 2007). It can be
measured by Kurtosis and Skewness test and Kolmogorov and the Shapiro method (Field,
2005; Tabachnick and Fidell, 2007; Hair et al., 2007). Initially descriptive statistics were
applied in SPSS to assess the skewness and kurtosis (Table D7 – Appendix D). Skewness
provides an indication of symmetry of distribution while Kurtosis shows the peakedness of
distribution. If the skewness is positive then the scores will be clustered in the left side of
graph and if it is negative then scores will be clustered in the right side of graph. Positive
Kurtosis scores will be clustered in the centre. If Kurtosis values are below zero then the
distribution is flat – having cases in the extremes. Furthermore, the skewness and kurtosis test
are sensitive to sample size and therefore researchers suggest inspecting the shape of the
distribution using a histogram (Tabachnick and Fidell, 2007). All variables were found to be
normally distributed but values for skewness were found mostly negative indicating
clustering of scores on right hand side of graph. However, with a large sample like in this
study, skewness will not make any substantive difference in the analysis process (Tabachnick
and Fidell, 2007 p80). Kurtosis values were mixed negative and positive. Positive Kurtosis
means that distribution is peaked (clustered in the centre). Negative Kurtosis indicates a
distribution that is flat (too many cases in the extremes). Both negative and positive Kurtosis
can result in an underestimate of the variance, therefore Kurtosis score clustered in the centre
is desirable. However, this risk is reduced with a large sample (N=325) like this study
(Tabachnick and Fidell, 2007 p80 recommends 200+ cases). In addition, Kolmogorov and
Shapiro test (Field, 2005) was applied to find the data normality. Results of this test (Table
D1 and D2 in appendix C) were found significant for all variables, which might be due to
149
large sample size (e.g. n=325 in this study) because this test is very sensitive to large sample
size and minor deviation from normality show this test as significant, hence the significant K-
S test does not reveal departure from normality of data (Field, 2005, p. 93).
4.6.4.5 Main analysis
First part of main analysis consists of analysis of personal and organization
demographics; profile of culture; and profile of barriers. Descriptive statistics in SPSS is used
for this analysis. Second part of analysis is measuring relationships between organisational
culture and TQM implementation barriers.
Generally researchers use regression analysis to examine the relationship between a
dependent variable and one or more independent variables. More specifically, regression
analysis can be used to understand which independent variables are related to the dependent
variable, and to explore the forms of these relationships. This study uses Structural Equation
Modelling (SEM) to measure the relationships between the constructs. SEM has become
more and more a recognized method for examining the hypotheses and has additional
functionality and power over and above regression analysis. The choice of SEM as the
analytical tool for this study was based on two major reasons. First, in this study TQM
implementation barriers were considered as constructs (or latent variables) that cannot be
measured directly or represented by a single metric unit. To the best of knowledge of author,
only SEM allows the explicit representation of a distinction between observed and latent
variables. Secondly, because it was important to examine several structural relationships
between multiple dependent and independent variables simultaneously (i.e. between the four
measures of organisational culture and the six constructs of TQM), and this can be done only
by using SEM. Due to this characteristic of SEM, it is frequently used in popular, high
academic journals as a method of choice because it simultaneously handles multiple
dependent variables. It also empirically examines the relationship between many dependent
variable and many independent variables of a structural model by combining both
measurement model and structural model in one analysis. It will take information about
measurement into account while testing the structural relationships. Therefore the design of
structural model emerges from measurement model which is latest technique and more
reliable.

150
4.7 Chapter summary
This chapter has presented an overview of the research methodology, the design of
which was driven by the research objectives. Various research approaches, strategies,
processes and methods were considered, selected and analysed. The population and sample
were carefully chosen and the questionnaire was designed to ensure that the maximum
response rate was received. The survey instrument was reviewed and tested to ensure validity
and reliability. The scales for the study were developed primarily on the basis of a thorough
literature review. The item pool for the barriers scale was subjected to quantitative
refinement. Content and face validity was assessed in structured interviews in which
participants were asked to give their opinions about the items. The participants of the
structured interviews were top professionals, and academics who had substantial experience
in the area of TQM research. The survey instrument was assessed through participants of the
structured interviews for the clarity, comprehensiveness and relevance of the scale items, and
items were refined. Data error checks, treatment of missing data, outlier examination,
normality test and reliability analysis tests were all carried out. Statistical analysis tools were
considered and selected for data analysis. The summary of each research element selected for
this study is summarised below in table 4.5.
Table 4.5Summary of selected research design elements
Research
element
Selected type Reasons for selection
Method Quantitative The study measures the relationships between the variables
which can be effectively accomplished through quantitative
methods.
Philosophy Positivism The positivism paradigm initiates a quantitative design to
accept or reject hypotheses. This philosophy was replicated in
this research by testing the hypotheses to validate theory
Approach
Deductive Research begins with theory, developing hypotheses,
collecting data, analyzing data, presenting findings and
drawing inference for supporting a theory. This theory to data
approach is deductive
Strategy Survey The survey strategy was used in this research because it
allows quantitative data to be collected which can be analyzed
quantitatively using descriptive and inferential statistics. Data
collected using a survey strategy can then be used to suggest
possible reasons and produce models for particular
relationships between variables
Time Cross Single data collection using primary and secondary data

151
horizon Sectional
Sampling Non-
probability
The criteria of including population in this survey were based
on relevance, qualification and experience of industry leaders
who were decision makers and policy
designers/implementers. Therefore non-probability sampling
was used because selection was judgmental and probability
that each sampling unit would be included was not possible.
Data
Collection
Survey
questionnaires/
interviews
Online questionnaire was sent to quality practitioners,
managers and leaders of organisations through web survey
and data was collected online. Structured interviews were
conducted with academia and quality professionals
Data
Analysis
Quantitative Descriptive statistics done in SPSSTM
15.0. CFA and SEM
undertaken using AMOSTM
version 16.0
The web based survey mode administered in this study was inspired by the book
“Internet, mail and mixed-mode survey - The tailored design method” by Dillman et al.
(2009). This text book was frequently used by author to design and administer the web based
survey, increase response rate and design questionnaire.
The next chapter presents the context for the research and details the data analysis and
results generated from the methodology described above. Results of analysis are used in
testing hypotheses and consequently answering the research questions.
152
Chapter Five: Data Analysis and Findings
5.1 Introduction
This chapter analyses and examines the relationships between the constructs of
organisational culture (independent variable) and TQM implementation barrier (dependent
variable). A full account of the research methodology was provided in the previous chapter.
A quantitative method was applied and data was collected through a survey questionnaire.
This data is analyzed in this chapter and findings are presented for further discussion. The
analysis comprises data analysis results of descriptive statistics, reliability coefficients for the
instrument scales and statistical procedures performed to answer the research questions. As
such, the reported results include descriptive statistics of the demographic characteristics of
the respondents and their organisations, confirmatory factor analysis (CFA) of the proposed
measurement model, and structural equation modelling (SEM) of the construct relationships.
The proposed measurement model is assessed on the basis of overall model fit, construct
validity and reliability. The structural model is assessed using overall model fit. SEM is used
to investigate the relationships between independent variables of organisational culture
constructs (group culture, developmental culture, rational culture, and hierarchical culture)
and dependent variables of TQM implementation barrier constructs (top management
barriers, employee barriers, customer barriers, planning barriers, information management
barriers, and process management barriers). The chapter comprises six sections –
introduction; analyzing data using descriptive statistics; conducting CFA to validate
measurement model; conducting SEM to validate structural model; measuring relationships
and summary of the chapter. The overall data analysis process is illustrated in Figure 5.1.
Figure 5.1Flow chart of data analysis process (Source: author)
1 • Analyze data using descriptive statistics
2 • Conduct CFA to validate measurement model
3 • Conduct SEM to validate structural model
4 • Conduct statistical analysis to measure relationships
5 • Summary

153
5.2 Analyzing data by descriptive statistics
This section will present findings on the demographics of the respondents and their
associated organisations; the organisational culture profile of the respondent organisations
and the TQM implementation barrier profile of the respondent organisations. The
organisational culture and TQM implementation barrier profiles are also examined in relation
to the respondent organisation demographics.
5.2.1 Demographic of the respondents
Demographic statistics include personal information, such as job level, education
level, work experience and quality experience of respondents. Some demographics relating to
organisational information are also included such as number of employees, company type,
operation type, production type, production process type and QM type. Many researchers
have measured multiple demographic variables (e.g. age, education level, marital status and
gender) and used them as control variables, particularly in regression analyses. However, in
this study the effects of personal and organisational characteristics are removed from the
regression analysis because these variables may undesirably impact on the core relationship
examination, that is, the effects of the independent variable of organisational culture on the
dependent TQM implementation barriers. Therefore, data on these variables was collected
and analyzed only for descriptive purposes. For exploratory purposes, data related to
organisational demographics is however, explored to investigate any relationship between the
main study variables and organisational demographics which might be of interest for future
researchers.
5.2.2 General demographic profile of the respondents
Table 5.1 shows the number of respondents and percentage response rate according to
the service and manufacturing sectors that the respondents represent.
Table 5.1Categories of respondent organisations in service and manufacturing sector
Industry Categories Questionnaires
sent
Questionnaires
received
Percentage
Service
Public services 45 21 47%
Information and communication 15 10 67%
Professional, scientific and technical
activities 82 52 63%
Health and social activities 18 12 67%

154
Wholesale and retail trade 66 39 59%
Education 26 17 65%
Construction and real estate 27 15 56%
Accommodation and food service activities 32 18 56%
Administrative and support services 45 25 56%
Banks 37 22 59%
Other services 12 9 75%
Total service response 405 240 59%
Manufacture
Chemicals and chemical products 31 20 65%
Food product 18 10 56%
Metal and fabricated metal products 20 14 70%
Non-metallic products 26 18 69%
Oil & Gas 9 5 56%
Paper, wood product 11 6 55%
Textile products 12 7 58%
Other products 8 5 63%
Total manufacturer response 135 85 63%
Grand total
540
325
60%
As shown in table 5.1, data was collected from managers, directors, quality managers and
operation managers of 10 categories of service industries and 8 categories of manufacturing
industries to ensure that the sample was drawn from a representative population of Bahraini
industries and commerce. The sample size of 325 respondents (with a very healthy response
rate of 60%) was large enough to represent the population for reliably examining the
correlations and prediction power of factors in the measurement models (Tabachnick and
Fidell, 2007; Hair et al., 2007).
Table 5.2 illustrates the general demographic profile of the respondents by management level,
education level, work experience level and quality experience level. The table also shows
findings relating to organisation size, company type and company operation type.
Table 5.2 General demographic profile
Category Sub category N %
Management level
Top management 68 20.9
Middle Management 106 32.6
Quality Professional 140 43.1
Supervisor 11 3.4
Total 325 100

155
Education level
HSSC 2 .6
Diploma 34 10.5
Bachelor 94 28.9
Masters 163 50.2
PhD 32 9.8
Total 325 100
Work experience level
Less than 1 year 2 0.6
1 to 3 years 8 2.5
4 to 7 years 29 8.9
8 to 15 years 137 42.2
More than 15 years 149 45.8
Total 325 100
Quality experience level
Less than 1 year 31 9.5
1 to 3 years 50 15.4
4 to 7 years 137 42.2
8 to 15 years 69 21.2
More than 15 years 38 11.7
Total 325 100
Organisation size
Small 132 40.6
Medium 133 40.9
Large 60 18.5
Total 325 100
Company type
Primary Manufacturer 92 28.3
Professional Service 112 34.5
Mass service 121 37.2
Total 325 100
Company operation type
Single 208 64.0
Branch 57 17.5
Multinational 60 18.5
Total 325 100
Table 5.2 shows that the respondents represent different management levels (20.9%
belonged to top management, 32.6% to middle management and 43.1% to quality
professionals). In terms of their qualification, the respondents are very well educated (9.8%
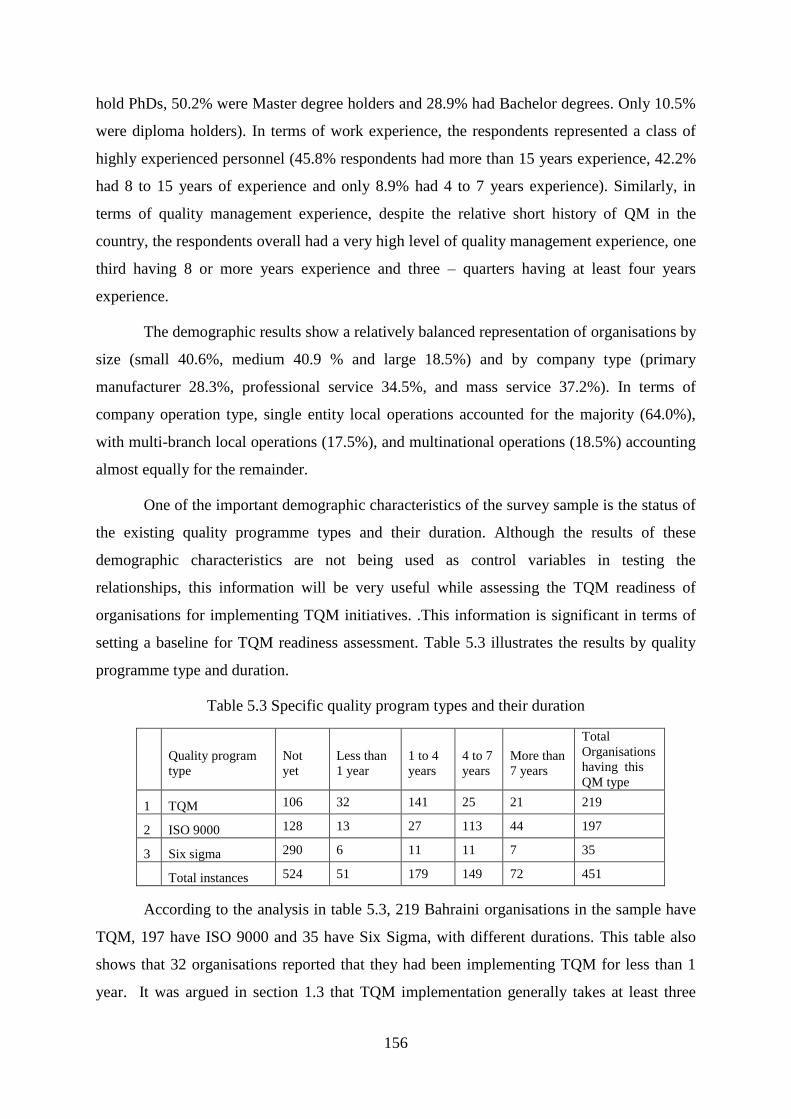
156
hold PhDs, 50.2% were Master degree holders and 28.9% had Bachelor degrees. Only 10.5%
were diploma holders). In terms of work experience, the respondents represented a class of
highly experienced personnel (45.8% respondents had more than 15 years experience, 42.2%
had 8 to 15 years of experience and only 8.9% had 4 to 7 years experience). Similarly, in
terms of quality management experience, despite the relative short history of QM in the
country, the respondents overall had a very high level of quality management experience, one
third having 8 or more years experience and three – quarters having at least four years
experience.
The demographic results show a relatively balanced representation of organisations by
size (small 40.6%, medium 40.9 % and large 18.5%) and by company type (primary
manufacturer 28.3%, professional service 34.5%, and mass service 37.2%). In terms of
company operation type, single entity local operations accounted for the majority (64.0%),
with multi-branch local operations (17.5%), and multinational operations (18.5%) accounting
almost equally for the remainder.
One of the important demographic characteristics of the survey sample is the status of
the existing quality programme types and their duration. Although the results of these
demographic characteristics are not being used as control variables in testing the
relationships, this information will be very useful while assessing the TQM readiness of
organisations for implementing TQM initiatives. .This information is significant in terms of
setting a baseline for TQM readiness assessment. Table 5.3 illustrates the results by quality
programme type and duration.
Table 5.3 Specific quality program types and their duration
Quality program
type
Not
yet
Less than
1 year
1 to 4
years
4 to 7
years
More than
7 years
Total
Organisations
having this
QM type
1 TQM 106 32 141 25 21 219
2 ISO 9000 128 13 27 113 44 197
3 Six sigma 290 6 11 11 7 35
Total instances 524 51 179 149 72 451
According to the analysis in table 5.3, 219 Bahraini organisations in the sample have
TQM, 197 have ISO 9000 and 35 have Six Sigma, with different durations. This table also
shows that 32 organisations reported that they had been implementing TQM for less than 1
year. It was argued in section 1.3 that TQM implementation generally takes at least three
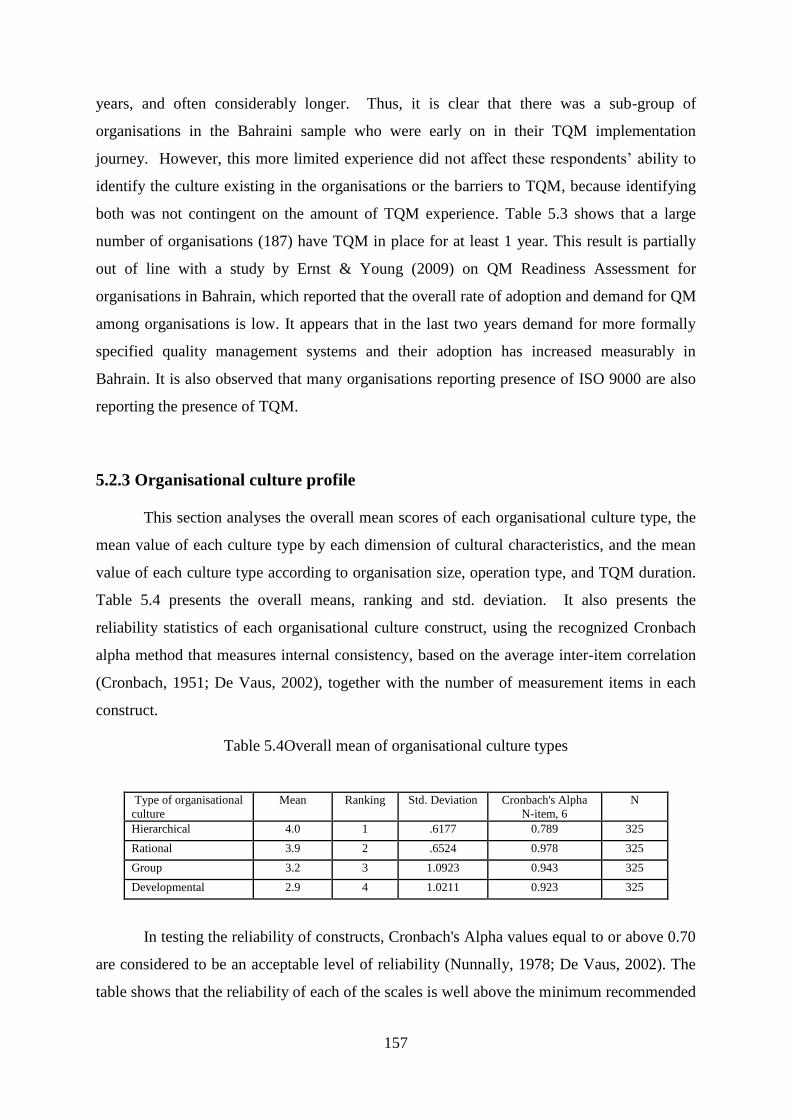
157
years, and often considerably longer. Thus, it is clear that there was a sub-group of
organisations in the Bahraini sample who were early on in their TQM implementation
journey. However, this more limited experience did not affect these respondents’ ability to
identify the culture existing in the organisations or the barriers to TQM, because identifying
both was not contingent on the amount of TQM experience. Table 5.3 shows that a large
number of organisations (187) have TQM in place for at least 1 year. This result is partially
out of line with a study by Ernst & Young (2009) on QM Readiness Assessment for
organisations in Bahrain, which reported that the overall rate of adoption and demand for QM
among organisations is low. It appears that in the last two years demand for more formally
specified quality management systems and their adoption has increased measurably in
Bahrain. It is also observed that many organisations reporting presence of ISO 9000 are also
reporting the presence of TQM.
5.2.3 Organisational culture profile
This section analyses the overall mean scores of each organisational culture type, the
mean value of each culture type by each dimension of cultural characteristics, and the mean
value of each culture type according to organisation size, operation type, and TQM duration.
Table 5.4 presents the overall means, ranking and std. deviation. It also presents the
reliability statistics of each organisational culture construct, using the recognized Cronbach
alpha method that measures internal consistency, based on the average inter-item correlation
(Cronbach, 1951; De Vaus, 2002), together with the number of measurement items in each
construct.
Table 5.4Overall mean of organisational culture types
Type of organisational
culture
Mean Ranking Std. Deviation Cronbach's Alpha
N-item, 6
N
Hierarchical 4.0 1 .6177 0.789 325
Rational 3.9 2 .6524 0.978 325
Group 3.2 3 1.0923 0.943 325
Developmental 2.9 4 1.0211 0.923 325
In testing the reliability of constructs, Cronbach's Alpha values equal to or above 0.70
are considered to be an acceptable level of reliability (Nunnally, 1978; De Vaus, 2002). The
table shows that the reliability of each of the scales is well above the minimum recommended
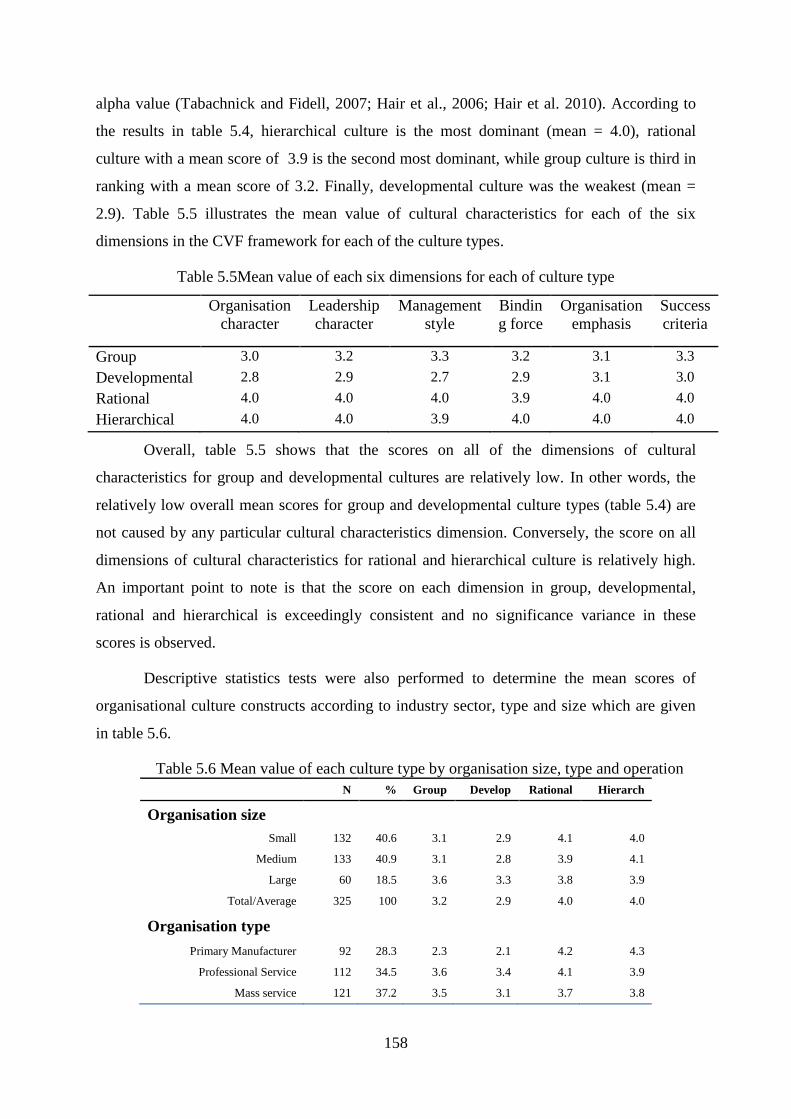
158
alpha value (Tabachnick and Fidell, 2007; Hair et al., 2006; Hair et al. 2010). According to
the results in table 5.4, hierarchical culture is the most dominant (mean = 4.0), rational
culture with a mean score of 3.9 is the second most dominant, while group culture is third in
ranking with a mean score of 3.2. Finally, developmental culture was the weakest (mean =
2.9). Table 5.5 illustrates the mean value of cultural characteristics for each of the six
dimensions in the CVF framework for each of the culture types.
Table 5.5Mean value of each six dimensions for each of culture type
Organisation
character
Leadership
character
Management
style
Bindin
g force
Organisation
emphasis
Success
criteria
Group 3.0 3.2 3.3 3.2 3.1 3.3
Developmental 2.8 2.9 2.7 2.9 3.1 3.0
Rational 4.0 4.0 4.0 3.9 4.0 4.0
Hierarchical 4.0 4.0 3.9 4.0 4.0 4.0
Overall, table 5.5 shows that the scores on all of the dimensions of cultural
characteristics for group and developmental cultures are relatively low. In other words, the
relatively low overall mean scores for group and developmental culture types (table 5.4) are
not caused by any particular cultural characteristics dimension. Conversely, the score on all
dimensions of cultural characteristics for rational and hierarchical culture is relatively high.
An important point to note is that the score on each dimension in group, developmental,
rational and hierarchical is exceedingly consistent and no significance variance in these
scores is observed.
Descriptive statistics tests were also performed to determine the mean scores of
organisational culture constructs according to industry sector, type and size which are given
in table 5.6.
Table 5.6 Mean value of each culture type by organisation size, type and operation
N % Group Develop Rational Hierarch
Organisation size
Small 132 40.6 3.1 2.9 4.1 4.0
Medium 133 40.9 3.1 2.8 3.9 4.1
Large 60 18.5 3.6 3.3 3.8 3.9
Total/Average 325 100 3.2 2.9 4.0 4.0
Organisation type
Primary Manufacturer 92 28.3 2.3 2.1 4.2 4.3
Professional Service 112 34.5 3.6 3.4 4.1 3.9
Mass service 121 37.2 3.5 3.1 3.7 3.8

159
Total/ Average 325 100 3.2 2.9 4.0 4.0
Operation type
Single 208 64.0 2.9 2.7 4.0 4.1
Branch 57 17.5 3.5 3.1 3.7 3.8
Multinational 60 18.5 3.8 3.5 4.1 3.9
Total/ Average 325 100 3.2 2.9 4.0 4.0
For comparative purpose there was no previous study found that had measured the
cultural profile of Bahraini industries, therefore the results in tables 5.4 and 5.6 couldn’t be
compared to any previous findings from Bahrain, however, Al-Khalifa and Aspinwall (2001)
investigated the cultural profile of Qatar industries, using the CVF framework and the same
survey instrument. Additionally, Qatar is an Arab country in Middle East, a Gulf state very
close to Bahrain both culturally and geographically. Therefore, comparing results of the
present study with Al-Khalifa and Aspinwall (2001) study is valuable. Largely, the results of
both studies are the same; however there are slight differences as explained below.
According to results of this study given in the table 5.6, for group culture, the primary
manufacturing sector has a low score (2.3) but professional services and mass services sectors
have comparatively higher scores (3.6, 3.5). Single local organisations also have a low score
(2.9) but local branches that are part of a larger branch network and multinational
organisations have significantly higher scores (3.5, 3.8). Small and medium size
organisations have relatively low scores (3.1, 3.1) while large size organisations have a
higher score (3.6). The study conducted by Alkhalifa and Aspinwall (2001) didn’t reveal any
difference in score between manufacturing and service industries of Qatar (3.1, 3.0) or
between small, medium and large size industries (3.1, 3.2 and 3.0). However, the overall
score on group culture of organisations is low (3.1, 3.2) in both Alkhalifa and Aspinwall
(2001) study and this study respectively.
In this study, for developmental culture, the primary manufacturing sector has the
lowest score (2.1) while the professional services and mass services sector have
comparatively higher scores (3.4, 3.1). The mean score is low for single local organisations
(2.7), higher in organisations being part of a local branch network (3.1) and significantly
higher in multinational organisations (3.5). Small and medium size organisations have
relatively low scores (2.9, 2.8) but large size organisations have a higher score (3.3). The
study conducted by Alkhalifa and Aspinwall (2001) didn’t reveal any difference in score for
manufacturing and service industries of Qatar (2.9, 3.0) or for small, medium and large

160
industries (2.9, 3.1 and 2.9). However, the overall score on developmental culture in both the
Alkhalifa and Aspinwall (2001) and this study is relatively low (3.0, 2.9 respectively).
In this study, for rational culture, the primary manufacturing and professional services
sectors have high scores (4.2, 4.1) while the mass services sector has a lower but still
relatively high score (3.7). The mean score is observed to be high in single local
organisations (4.0), a little lower in organisations that are one part of a local branch network
(3.7) and highest in multinational organisations (4.1). Small organisations also have a high
score (4.1), medium size organisations a little lower (3.9), and large size organisations have a
little lower but still relatively high score (3.8) . The study conducted by Alkhalifa and
Aspinwall (2001) didn’t reveal any difference in score in manufacturing and service
industries of Qatar (3.4, 3.4) but found a slight difference between small, medium and large
size industries (3.4, 3.6 and 3.3 respectively). However, the overall score on rational culture
in both studies is relatively high, but higher in the Bahraini sample (4.0) than the Qatar
sample (3.4).
For hierarchical culture, the primary manufacturing sector had the highest score (4.3)
while the professional services and mass services sector had comparatively lower but
nevertheless still high scores (3.9, 3.8). The Score is high in single local organisations (4.0),
and a little lower in both organisations that are one part of a local branch network and
multinational organisations (3.8, 3.9). Small organisations had a high score (4.0), with
medium size organisations a little higher (4.1) and large size organisations a little lower (3.9).
As was the case for group, developmental and rational culture types, the study conducted by
Alkhalifa and Aspinwall (2001) didn’t show any difference in score for manufacturing and
service industries of Qatar (3.4, 3.4) and no difference between small, medium and large
industries (3.4, 3.4 and 3.4). The overall score on hierarchical culture in their study and this
study is relatively high, however it was found to be quite higher in this study (4.0) compared
to Qatar’s 3.4 (table 5.4).
According to Bardoel and Sohal (1999), attention to the organisational culture is a key
requirement for the effective implementation of TQM. It is therefore imperative that
organisations understand what cultural make up they have in the first place. It is reasonable to
argue therefore that measurement, using CVF, of the different types of culture in each
organisation, and of the culture profile across different sectors and types of organisations, and
comparison of any differences is valuable to generating a clearer understanding of factors
affecting TQM implementation. The preceding analysis provides such an understating for

161
practitioners and future researchers. In summary, this analysis indicates that in Bahraini
industry and commerce, hierarchical and rational culture types dominate the organisational
culture profiles, but the difference between these and group and developmental culture is less
pronounced in large, or mass service, or multinational organisations.
5.2.4 TQM implementation barriers profile
Table 5.7 presents ranking, overall mean, and std. deviation of the TQM barrier
constructs. It also presents the reliability statistics of each barrier construct, using recognized
Cronbach’s alpha method that measures internal consistency, based on the average inter-item
correlation (Cronbach, 1951; De Vaus, 2002).
Table 5.7 Overall mean and std. deviation of TQM barrier constructs
Barrier Construct Ranking Mean
Std.
Deviatio
n
Cronbach's
Alpha
N items
In
construct
N
Top Management barriers 1 4.3 .5729 0.921 8 325
Employees barriers 2 3.7 .5609 0.850 9 325
Customer barriers 3 3.7 .8461 0.960 4 325
Information Management barriers 4 3.6 .5214 0.769 6 325
Planning barriers 5 3.6 .6560 0.928 4 325
Process management barriers 6 2.2 .7511 0.969 6 325
Mean of all constructs 3.5
Difference between maxim and minimum
value 2.0
As mentioned previously, in testing the reliability of constructs, Cronbach's Alpha
values equal to or above 0.70 are considered to be an acceptable level of reliability
(Nunnally, 1978; De Vaus, 2002). The table shows that the reliability of each of the scales is
well above the minimum recommended alpha value (Tabachnick and Fidell, 2007; Hair et al.
2010). Overall, the results show relatively high mean scores on five of the TQM
implementation barrier constructs (top management barriers, employee barriers, customer
barriers, planning barriers and information barriers), reflecting the perceived existing barriers
in the survey population. It is reasonable to propose that the existence of these barriers may
hamper the full implementation of TQM in the survey population. However, the score was
lower on the process management barrier construct suggesting good process management
efforts and outcomes within the survey population.
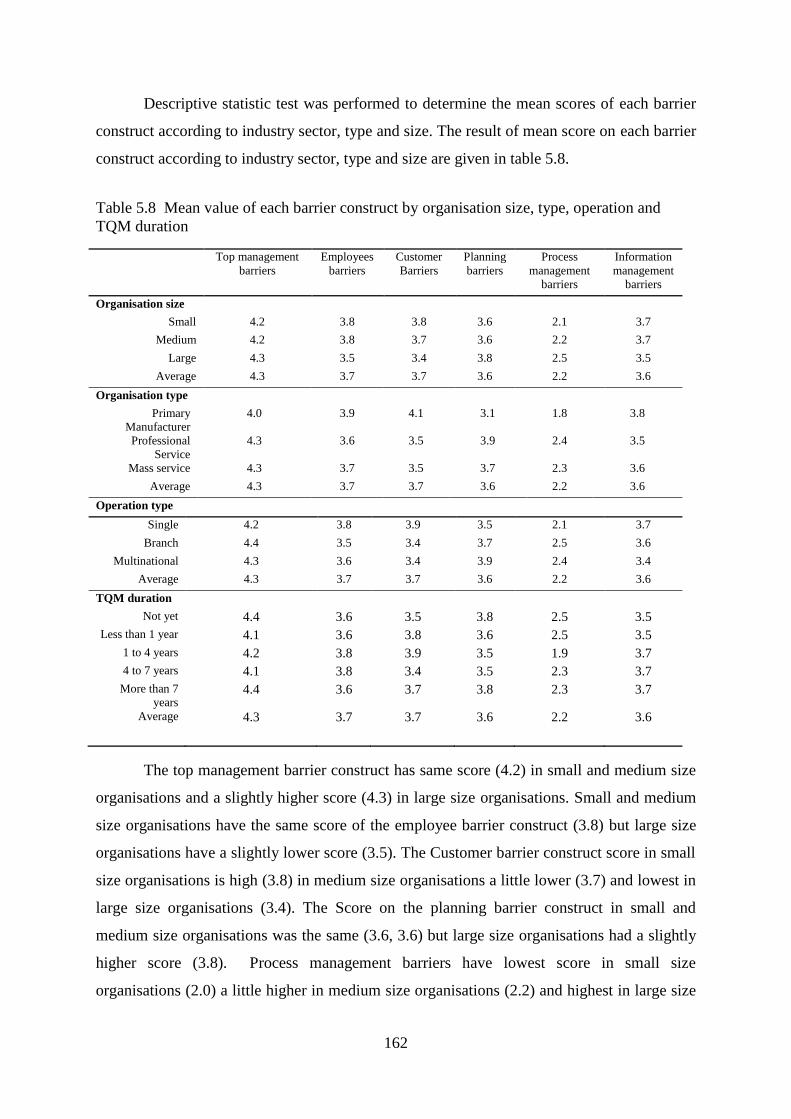
162
Descriptive statistic test was performed to determine the mean scores of each barrier
construct according to industry sector, type and size. The result of mean score on each barrier
construct according to industry sector, type and size are given in table 5.8.
Table 5.8 Mean value of each barrier construct by organisation size, type, operation and
TQM duration
Top management
barriers
Employees
barriers
Customer
Barriers
Planning
barriers
Process
management
barriers
Information
management
barriers
Organisation size
Small 4.2 3.8 3.8 3.6 2.1 3.7
Medium 4.2 3.8 3.7 3.6 2.2 3.7
Large 4.3 3.5 3.4 3.8 2.5 3.5
Average 4.3 3.7 3.7 3.6 2.2 3.6
Organisation type
Primary
Manufacturer
4.0 3.9 4.1 3.1 1.8 3.8
Professional
Service
4.3 3.6 3.5 3.9 2.4 3.5
Mass service 4.3 3.7 3.5 3.7 2.3 3.6
Average 4.3 3.7 3.7 3.6 2.2 3.6
Operation type
Single 4.2 3.8 3.9 3.5 2.1 3.7
Branch 4.4 3.5 3.4 3.7 2.5 3.6
Multinational 4.3 3.6 3.4 3.9 2.4 3.4
Average 4.3 3.7 3.7 3.6 2.2 3.6
TQM duration
Not yet 4.4 3.6 3.5 3.8 2.5 3.5
Less than 1 year 4.1 3.6 3.8 3.6 2.5 3.5
1 to 4 years 4.2 3.8 3.9 3.5 1.9 3.7
4 to 7 years 4.1 3.8 3.4 3.5 2.3 3.7
More than 7
years 4.4 3.6 3.7 3.8 2.3 3.7
Average 4.3 3.7 3.7 3.6 2.2 3.6
The top management barrier construct has same score (4.2) in small and medium size
organisations and a slightly higher score (4.3) in large size organisations. Small and medium
size organisations have the same score of the employee barrier construct (3.8) but large size
organisations have a slightly lower score (3.5). The Customer barrier construct score in small
size organisations is high (3.8) in medium size organisations a little lower (3.7) and lowest in
large size organisations (3.4). The Score on the planning barrier construct in small and
medium size organisations was the same (3.6, 3.6) but large size organisations had a slightly
higher score (3.8). Process management barriers have lowest score in small size
organisations (2.0) a little higher in medium size organisations (2.2) and highest in large size
163
organisations (2.5). The information barrier construct score was highest in medium size
organisations (3.7), slightly lower in small size organisations (3.6) and lowest in large size
organisations (3.5).
Comparing the barrier score by organisation type in table 5.8, mass services and
professional service organisations had the highest top management barrier construct score
(4.3) whilst primary manufacturing organisations had a slightly lower score (4.0). Employee
barrier construct was the highest in primary manufacturers (3.9); slightly lower in mass
services organisations (3.7) and lowest in professional services organisations (3.6). The
customer barrier construct score in primary manufacturers was high (4.1) but a little lower
(3.5) in mass services organisations and professional services organisations. The score on
planning barrier construct was highest in professional services organisations (3.9), lower in
mass services organisations (3.7) and lowest in manufacturing organisations (3.1). The
process management barrier construct had the lowest score in primary manufacturing
organisations (1.8); slightly higher in mass services organisations (2.3) and highest in
professional services organisations (2.4). The information management barrier construct
score was highest in primary manufacturing organisations (3.8), slightly lower in mass
services (3.6) and lowest in professional services (3.5).
Comparing the barrier score by operation type in table 5.8, organisations that are part
of a larger branch network had the highest top management barrier construct score (4.4),
multinational organisations had slightly lower (4.3) and single entity local organisations had
the lowest (4.2). The employee barrier construct score was highest in single entity local
organisations (3.8), lower in multinational organisations (3.6) and lowest in organisation that
are part of a larger branch network (3.5). The customer barrier construct score was high (3.9)
in organisations that are one part of a larger branch network organisations, but lower (3.4) in
multinational and single entity local organisations. The score on the planning barrier
construct was highest in multinationals organisations (3.9), lower in organisations that are
one part of a larger branch network (3.7) and lowest in single entity local organisations (3.5).
The Process management barrier construct had lowest score in single entity local
organisations (2.1); slightly higher in multinational organisations (2.4) and highest in
organisations that are one part of a larger branch network organisations (2.5). The
Information management barrier construct score was highest in single entity local
organisations (3.7), lower in organisations that are one part of a larger branch network (3.6)
and lowest in multinational organisations (3.4).

164
Comparing the barrier score by TQM duration in table 5.8, companies not yet having
TQM deployed and those with more than 7 years TQM experience were found to have the
highest top management barrier construct score (4.4), 1 to 4 years slightly lower (4.2), less
than 1 year slightly lower still (4.1), and 4 to 7 years had the lowest score (4.0). One notable
observation in these results is that logically organisations with more TQM duration might be
expected to have a low score on TQM barriers, however the result indicate that organisations
with more than 7 years TQM duration have a higher top management barrier construct score
than organisations with 4 to 7 years TQM duration. The reasons for this observation are not
immediately clear. In employee barrier construct, the score is: not yet (3.6), less than 1 year
(3.6), 1 to 4 years (3.8), 4 to 7 years (3.8), and More than 7 years (3.6). This is another
unexpected finding showing that organisations with less than 1 year duration have a lower
employee barrier construct score than organisations with 4 to 7 years duration. Again, the
reasons for this are not immediately obvious. However, this may be due to the waning of
TQM momentum (and organisations may need to refresh their TQM initiatives) (Oakland,
2003). In customer barrier construct: not yet is low (3.5), less than 1 year has high (3.8), 1 to
4 years has the highest (3.9), the 4 to 7 years has the lowest score (3.4) and more than 7 years
has high (3.7). In planning barrier construct the companies having TQM not yet has high
(3.8), less than 1 year has low (3.6), 1 to 4 years has low (3.5), 4 to 7 years having the lowest
score (3.5), for more than 7 years have the highest score (3.8). In process management barrier
construct, the companies not yet deployed TQM are having the highest score (2.5), less than 1
year (2.5), the lowest score in 1 to 4 years (1. 9), and 4 to 7 years and more than 7 years (2.3).
In information management barrier construct, companies having lowest score in companies
not yet deployed TQM (3.5), less than 1 year (3.5), 1 to 4 years of TQM duration have the
highest score (3.7), 4 to 7 years (3.7), More than 7 years (3.7).
Summarizing the barrier score, in terms of organisation size, in small size
organisations employee and customer barrier constructs are higher in score than in medium
size organisations, information management barrier construct are higher in score than large
size organisations, but top management, planning and process management barrier constructs
are highest in large organisations. According to organisation type, in primary manufacturing,
employee, customer and information barriers construct are higher, in professional service
organisations, planning and process barriers are higher and in mass service organisations top
management barriers are higher. According to organisation operation type, in single entity
local operation organisations; employee, customer and information management barriers

165
construct are higher, in local multi-branch organisations, top management and process
management barriers construct are higher and in multinationals planning management barrier
construct are higher. According to TQM duration, companies that have not yet deployed
TQM have the highest score on top management and process management barrier construct,
the companies having 1 to 4 years have the highest score on employee, customer and
information management barriers and companies having more than 7 years of TQM duration
have high score on planning barrier construct.
For completeness, tables 5.9 through 5.14 show the mean scores for each of the
individual barrier measurement items for each of the six barriers constructs.
Table 5.9Individual barrier results of top management barrier construct
Top management barriers
Mean Std.
Deviation
Variance Valid
N
-lack of commitment and support to quality 4.3 0.70 0.48 325
-inadequate resources for employee training 4.4 0.72 0.52 325
-lack of goals and objectives for quality improvement 4.3 0.67 0.45 325
-frequent turnover of managers 4.1 0.74 0.55 325
-many layers of management 4.2 0.73 0.53 325
-management style slows down learning culture 4.2 0.74 0.54 325
-ineffective link of middle management 4.3 0.68 0.46 325
-lack of quality awareness and improvement by
managers
4.2 0.73 0.53 325
Overall Mean 4.3
Table 5.9 shows the mean, standard deviation, and variance of the individual barrier
indicators for the top management barrier construct in the Bahraini sample. The results show
that all the barrier indicators have a high score, thus showing a lack of commitment and
support to quality (4.3), inadequate resources for employee training (4.4), lack of goals and
objectives for quality improvement (4.3), frequent turnover of managers (4.1), many layers of
management (4.2), management style that slows down learning culture (4.2), ineffective link
of middle management (4.3) and lack of creating quality awareness and improvement by
middle managers (4.2). Therefore, there is a consensus in the sample population that all
indicators of the top management barrier construct are equally high in Bahraini industries.

166
Table 5.10 shows the results of individual barrier indicators for the employee barriers
construct.
Table 5.10 Individual barrier results of employee barrier construct
The individual indicators mean scores will not be repeated here in the text, however,
as can be seen, each of the nine individual barrier indicators are thought to contribute largely
equally in the organisations sampled in this study. Gauging from these responses there is little
doubt as to why Bahraini industries and commerce’s quality performance is perceived to lag a
significant way behind other countries (Ernst & Young, 2009). Table 5.11 shows the
individual barrier indicator results for customer barrier construct.
Table 5.11 Individual barrier results of customer barrier construct
Customer barriers Mean Std.
Deviation
Varianc
e
Valid
N
-lack of effective system to measure customer
satisfaction
3.7 0.90 0.80 325
-needs and expectations of customer not assessed 3.7 0.88 0.77 325
-lack of effective customer feedback system
-lack of contact with key customers
3.7
3.7
0.90
0.91
0.81 325
0.82 325
Overall Mean 3.7
Employee barriers
Mean Std.
Deviation
Variance Valid
N
-lack of empowerment to apply quality improvement
efforts
3.8 0.86 0.73 325
-lack of involvement in improvement projects 3.7 0.85 0.73 325
-lack of training in quality improvement skills 3.6 0.76 0.58 325
-lack of employee training in group discussion and
communication techniques
3.8 0.87 0.76 325
-lack of recognition for achievements in quality
improvement
3.6 0.77 0.59 325
-lack of job satisfaction 3.8 0.84 0.71 325
-resistance to change 3.8 0.84 0.71 325
-lack of internal TQM expertise 3.7 0.83 0.70 325
-Inappropriate performance evaluation and reward
system
3.8 0.85 0.73 325
Overall Mean 3.7

167
All four individual barrier indicators have the same mean score of (3.7), indicating
that each contributes equally. The results show that customer satisfaction still has not been
addressed properly in the organisations in the survey population. It appears that the
organisations in the survey population haven’t yet fully grasped the importance of customer
focus in doing business. These organisations appear not to be adequately measuring customer
satisfaction, assessing the needs and expectations of customers, or gathering customer
feedback, and have insufficient frequent contact with key customers. Table 5.12 shows the
individual barrier indicator results for the planning barrier construct.
Table 5.12 Individual barrier results of planning barrier construct
Planning barriers Mean Std.
Deviation
Variance Valid
N
-strategic plans are not customer driven 3.7 0.69 0.48 325
-strategic plans don't include quality goals 3.6 0.74 0.54 325
-lack of institutionalizing new
approaches/tools/techniques
3.6 0.72 0.52 325
-not enough joint planning activities with suppliers 3.6 0.74 0.55 325
Overall Mean 3.6
The barrier indicator “strategic plans are not customer driven” has the highest score of
(3.7); with the other three very slightly lower (3.6). The results show that in the planning
barrier construct all individual barrier indicators have a relatively high score. The result
suggests that planning processes are underdeveloped and have not been given sufficient
attention by the leaders of Bahraini organisation. It is reasonable to argue that these high
scores on all barrier indicators of the planning barrier construct should be a source of
apprehension for leaders in these firms. Table 5.13 presents the results of mean scores of
individual barrier indicator for the process management barrier construct.
Table 5.13 Individual barrier results of process management barrier construct
Process management barriers Mean Std.
Deviation
Variance Valid
N
-quality initiatives do not include all organisational
functions/departments
2.2 1.17 1.36 325
-quality initiative is delegated to selected individuals
only
2.2 1.18 1.40 325
-ineffective communication with stakeholders 2.2 1.10 1.20 325
-inadequate resources to effectively employ TQM 2.3 1.18 1.40 325
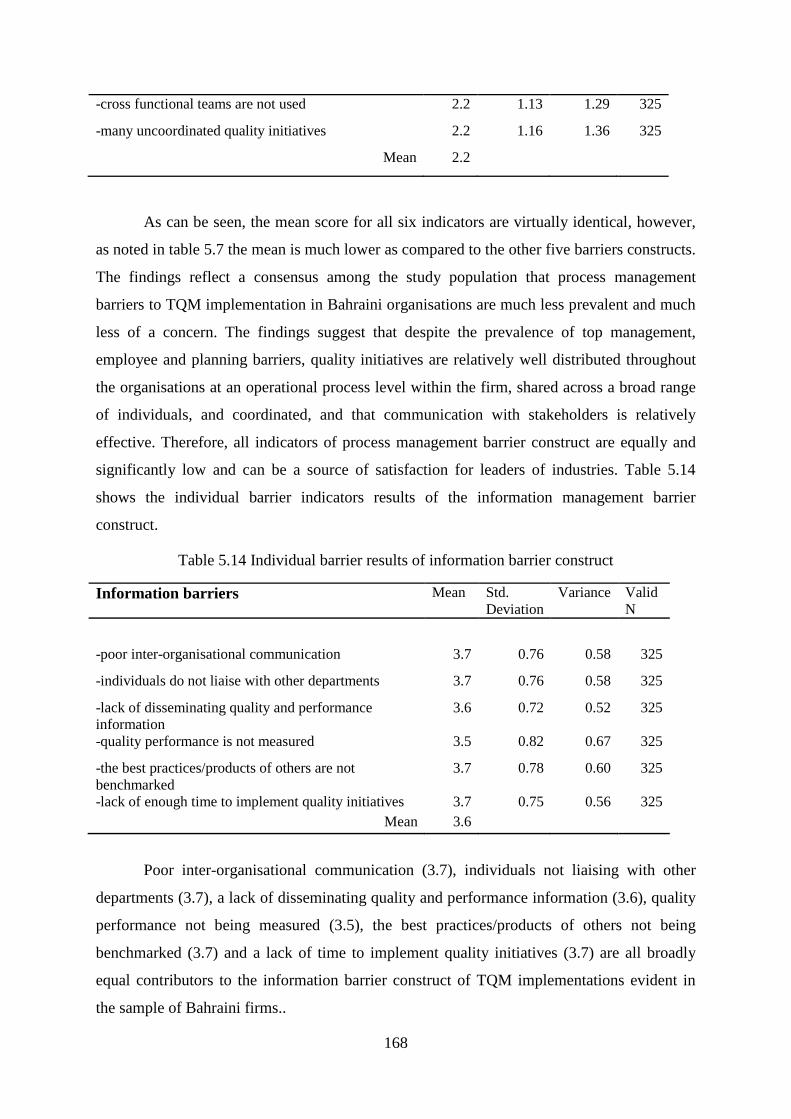
168
-cross functional teams are not used 2.2 1.13 1.29 325
-many uncoordinated quality initiatives 2.2 1.16 1.36 325
Mean 2.2
As can be seen, the mean score for all six indicators are virtually identical, however,
as noted in table 5.7 the mean is much lower as compared to the other five barriers constructs.
The findings reflect a consensus among the study population that process management
barriers to TQM implementation in Bahraini organisations are much less prevalent and much
less of a concern. The findings suggest that despite the prevalence of top management,
employee and planning barriers, quality initiatives are relatively well distributed throughout
the organisations at an operational process level within the firm, shared across a broad range
of individuals, and coordinated, and that communication with stakeholders is relatively
effective. Therefore, all indicators of process management barrier construct are equally and
significantly low and can be a source of satisfaction for leaders of industries. Table 5.14
shows the individual barrier indicators results of the information management barrier
construct.
Table 5.14 Individual barrier results of information barrier construct
Information barriers Mean Std.
Deviation
Variance Valid
N
-poor inter-organisational communication 3.7 0.76 0.58 325
-individuals do not liaise with other departments 3.7 0.76 0.58 325
-lack of disseminating quality and performance
information
3.6 0.72 0.52 325
-quality performance is not measured 3.5 0.82 0.67 325
-the best practices/products of others are not
benchmarked
3.7 0.78 0.60 325
-lack of enough time to implement quality initiatives 3.7 0.75 0.56 325
Mean 3.6
Poor inter-organisational communication (3.7), individuals not liaising with other
departments (3.7), a lack of disseminating quality and performance information (3.6), quality
performance not being measured (3.5), the best practices/products of others not being
benchmarked (3.7) and a lack of time to implement quality initiatives (3.7) are all broadly
equal contributors to the information barrier construct of TQM implementations evident in
the sample of Bahraini firms..
169
Overall, the preceding analysis of the individual barrier indicators shows that each
contributes virtually equally to their respective barrier constructs. No single individual barrier
indicator was significantly more prevalent than the others making up the construct. This
observation adds weight to the robustness of each of the six barrier constructs systematically
developed in the preceding phase of this study (section 2.7).
5.3 Data analysis of hypothesized model using CFA/SEM
In chapter 2 and chapter 3, the researcher specified the factor structure of
organisational culture and TQM implementation barriers on the basis of extant literature
theory. This factor structure firstly depicts the first part of the measurement model relating to
organisational culture that consists of a set of 4 constructs (group, developmental, rational
and hierarchical) as the independent variable. As mentioned previously, each construct is
made up of six dimensions of organisational characteristics. These constructs have been
previously validated by many researchers (Chang and Wiebe, 1996; Zeitz et al., 1997;
Dellana and Hauser, 1999; Alkhalifa and Aspinwall, 2001; Prajogo and McDermott, 2005;
Naor et al., 2008; Zu et al., 2009). However, further validation was required in this research
as is protocol in all such studies before attempting to examine the hypothesised relationship
between the independent and dependent variables. The measurement model has another set of
6 constructs. These are the TQM implementation barrier constructs (top management
barriers, employee barriers, customer barriers, planning barriers, process management
barriers, information management barriers) which are the dependent variables. Each barrier
construct has multiple indicators as discussed in section 2.7, 3.2.2 and 5.2.4.
Therefore, the model has two sets of constructs – organisational culture (4 constructs)
and TQM implementation barriers (6 constructs). The hypothesized relationships between
these two sets of constructs were developed in chapter 3 and based on the theoretical
background reviewed in chapter 2. In order to determine whether the hypothesized
relationships exist between the two sets of constructs, the model was tested as is explained in
the next two sections (5.3.1 and 5.3.2). The data analysis in this research used AMOS 16.0
software in a two-step process following Hair et al., (2006):
Step 1: Validate Measurement Model of two sets of constructs using CFA (Confirmatory
Factor Analysis) – section 5.3.1; and
Step 2: Evaluate Structural Model and examine hypothesized relationships between two
sets of constructs using CFA/SEM (Structured Equation Modelling) – Section 5.3.2.

170
5.3.1 Validating the Measurement Model using CFA
Before evaluating the hypothesized relationships between the two sets of constructs, it
was first necessary to validate the constructs. Construct validity is the extent to which a set of
measured items actually reflect the theoretical latent construct they are designed to measure.
Confirmatory Factor Analysis (CFA) is an appropriate tool to quantitatively assess the
construct validity of a proposed measurement theory (Hair et al., 2010). Many researchers
have used CFA to determine whether there is empirical support for the proposed theoretical
factor structure of constructs or not. CFA provides quantitative measures that assess the
construct validity and construct reliability of the theoretical model (Hair et al., 2010).
Following the guidelines of Hair et al. (2010), the stages of validating the
measurement model were performed in the following order:
1. Specifying a measurement theory;
2. Constructing the measurement model for two-dimensional measurement structure for
a set of six and another set of four constructs ;
3. Performing assessment of the measurement model for overall fit using CFA; and
analyzing the reliability and validity of the constructs using CFA.
5.3.1.1 Measurement theory
Generally, two types of measurement theories are used in designing a CFA/SEM
model – reflective measures theory and formative measures theory (Hair et al., 2010). In this
model, two sets of latent constructs have path estimates that represent the relationships
between constructs, similar to beta weights in regression analysis. The measured variables are
represented by loadings (termed as standardized regression weights in AMOS) that
correspond to the relationships from constructs to variables as in factor analysis.
The model assumes that the constructs cause the measured indicator variables. For
example, that top management causes the TQM barrier indicators such as lack of
commitment and support to quality and the employees cause barriers like resistance to
change. Therefore the measurement theory applied in this model is reflective because:
the indicators are the reflection of constructs, and arrows are drawn from the latent
construct to the measured indicators ;
all indicators of the constructs reflect a common conceptual base;
all indicators of the constructs highly covary with each other ;
all indicators of the constructs relate to each other in a similar way; and

171
the direction of relationship from constructs to variables also causes an error term that is
the direct result of the inability of the construct to fully explain the indicators (Hair et. al.,
2010)
5.3.1.2 Constructing the model
Figure 5.2 below shows the 10 construct measurement model of culture and barriers.
The measured variables are shown as a box with labels corresponding to those shown in the
questionnaire. Latent constructs are an oval. Each measured variable has an error term. Two
headed connectors indicate covariance between constructs. One headed connectors indicate a
causal path from a construct to an indicator (measured) variable without cross-loadings. The
assumption of no cross-loadings is based on the fact that the existence of significant cross-
loadings is the evidence of a lack of unidimensionality and therefore a lack of construct
validity, i.e. discriminant validity. However, in the measurement model all connectors
between constructs are two-headed covariances/correlations (Hair et al., 2010.
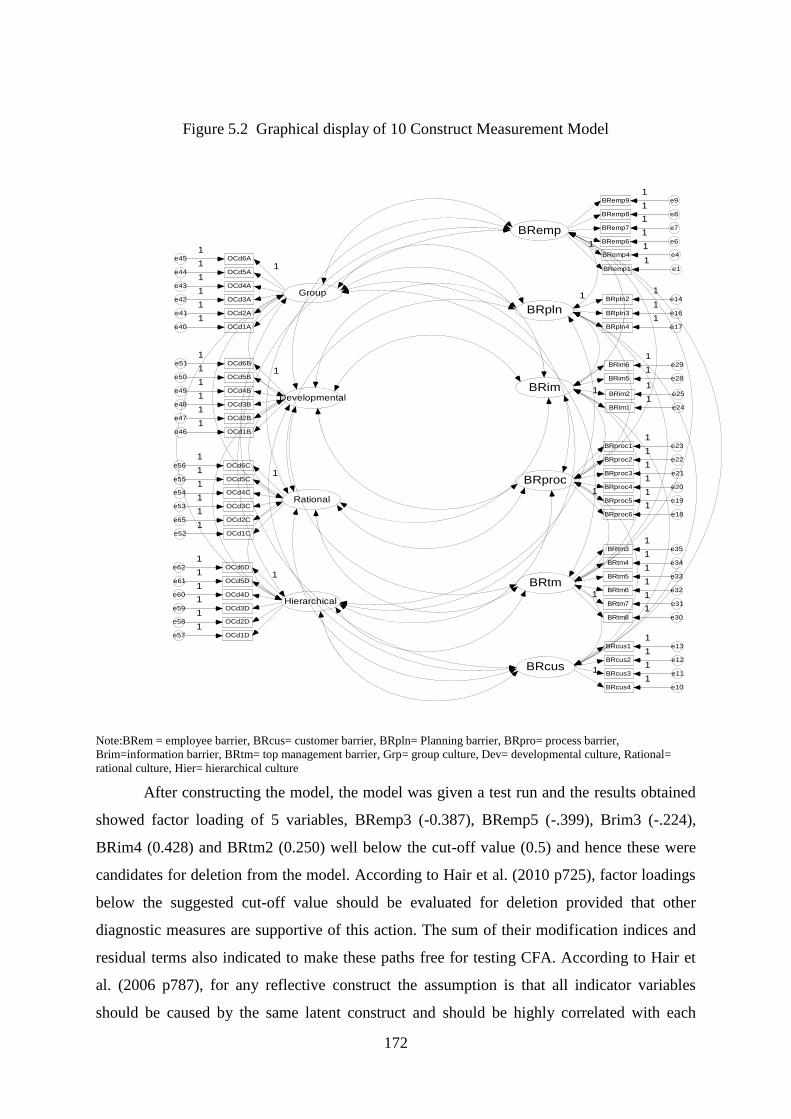
172
Figure 5.2 Graphical display of 10 Construct Measurement Model
Note:BRem = employee barrier, BRcus= customer barrier, BRpln= Planning barrier, BRpro= process barrier,
Brim=information barrier, BRtm= top management barrier, Grp= group culture, Dev= developmental culture, Rational=
rational culture, Hier= hierarchical culture
After constructing the model, the model was given a test run and the results obtained
showed factor loading of 5 variables, BRemp3 (-0.387), BRemp5 (-.399), Brim3 (-.224),
BRim4 (0.428) and BRtm2 (0.250) well below the cut-off value (0.5) and hence these were
candidates for deletion from the model. According to Hair et al. (2010 p725), factor loadings
below the suggested cut-off value should be evaluated for deletion provided that other
diagnostic measures are supportive of this action. The sum of their modification indices and
residual terms also indicated to make these paths free for testing CFA. According to Hair et
al. (2006 p787), for any reflective construct the assumption is that all indicator variables
should be caused by the same latent construct and should be highly correlated with each
BRemp
BRemp1 e1
1
1BRemp4 e4
1BRemp6 e6
1BRemp7 e7
1BRemp8 e8
1BRemp9 e9
1
BRcus
BRpln
BRcus4 e10
11
BRcus3 e11
1BRcus2 e12
1BRcus1 e13
1
BRpln2 e1411
BRpln3 e16
1
BRpln4 e17
1
BRproc
BRim
BRproc6 e18
1
1BRproc5 e19
1BRproc4 e20
1BRproc3 e21
1BRproc2 e22
1BRproc1 e23
1
BRim1 e24
11
BRim2 e25
1BRim5 e28
1BRim6 e29
1
BRtm
BRtm8 e30
1
1BRtm7 e31
1BRtm6 e32
1BRtm5 e33
1BRtm4 e34
1BRtm3 e35
1
Group
OCd6Ae45
OCd5Ae44
OCd4Ae43
OCd3Ae42
OCd2Ae41
OCd1Ae40
1
1
1
1
1
1
1
Developmental
OCd6Be51
OCd5Be50
OCd4Be49
OCd3Be48
OCd2Be47
OCd1Be46
1
1
1
1
1
1
1
Rational
OCd6Ce56
OCd5Ce55
OCd4Ce54
OCd3Ce53
OCd2Ce65
OCd1Ce52
1
1
1
1
1
1
1
Hierarchical
OCd6De62
OCd5De61
OCd4De60
OCd3De59
OCd2De58
OCd1De57
1
1
1
1
1
1
1
173
other. Theoretically then, the individual items are interchangeable and any single item can be
left out without changing the construct as long as two conditions are met: 1) the construct
must have sufficient reliability and 2) at least three items must be specified to avoid a model
identification problem in each latent construct. Therefore, items with low factor loading can
be dropped in reflective model without serious consequences as long as the associated
construct retains a sufficient number of indicators (Hair et al., 2006). Therefore, the 5
indicators above were removed for testing the CFA model and achieving an acceptable fit.
However, further investigation of the modification index and Standardized Residual
Covariance matrix revealed that Emp2, BRtm1 and BRpln1 are the most offending variables
having high modification index and residual error and therefore these also needed to be
removed from the model. Therefore, a total of 8 items were candidates for deletion. Hair et
al., (2006 p797) recommend dropping a maximum of 2 out of 15 items. That means in a 60
item model as in this study, the researcher can delete 8 items. This model had 61 items and 8
items were removed from the model (BRemp2, BRemp3, BRemp5, BRim3, BRim4, BRtm1,
BRtm2 and BRpln1). Dropping 8 items from such a large battery of items is less
consequential (Hair et al., 2006). After modifying the measurement model, accordingly the
test was run again, which showed a CFA result above the cut-off value.
So far in this section the author has constructed the measurement model, tested and
modified four constructs of TQM implementation barrier by dropping the items with low-
factor loadings using standardized estimates and modification indices.
In order to perform assessment of the measurement model, Maximum Likelihood
Estimation (MLE) was used for model fit with output of minimization history, standardized
estimates, squared multiple correlations and modification indices. The Full AMOS output of
CFA is given in Appendix 4, tables 4A, 4B, 4C and 4D.
5.3.1.3 Overall fit test
CFA output includes many fit indices. Table 5.15 presents selected fit statistics from
the CFA output. The literature suggests that for model fit, at least one absolute fit index and
one incremental fit index is required, in addition to χ 2
results (Hair et al., 2010). Based on
the results in Table 5.15, key fit indices including χ2 measures, absolute fit measures and
incremental fit measures are discussed below.
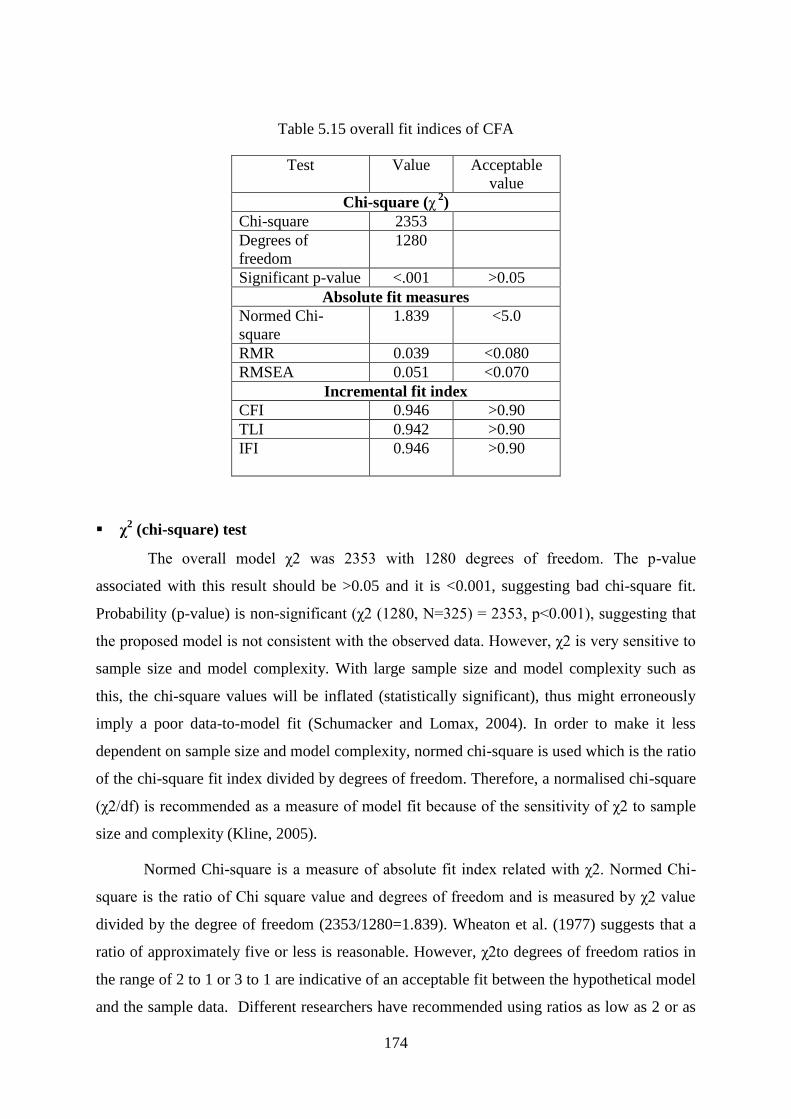
174
Table 5.15 overall fit indices of CFA
Test Value Acceptable
value
Chi-square (χ 2
)
Chi-square 2353
Degrees of
freedom
1280
Significant p-value <.001 >0.05
Absolute fit measures
Normed Chi-
square
1.839 <5.0
RMR 0.039 <0.080
RMSEA 0.051 <0.070
Incremental fit index
CFI 0.946 >0.90
TLI 0.942 >0.90
IFI
0.946 >0.90
χ2 (chi-square) test
The overall model χ2 was 2353 with 1280 degrees of freedom. The p-value
associated with this result should be >0.05 and it is <0.001, suggesting bad chi-square fit.
Probability (p-value) is non-significant (χ2 (1280, N=325) = 2353, p<0.001), suggesting that
the proposed model is not consistent with the observed data. However, χ2 is very sensitive to
sample size and model complexity. With large sample size and model complexity such as
this, the chi-square values will be inflated (statistically significant), thus might erroneously
imply a poor data-to-model fit (Schumacker and Lomax, 2004). In order to make it less
dependent on sample size and model complexity, normed chi-square is used which is the ratio
of the chi-square fit index divided by degrees of freedom. Therefore, a normalised chi-square
(χ2/df) is recommended as a measure of model fit because of the sensitivity of χ2 to sample
size and complexity (Kline, 2005).
Normed Chi-square is a measure of absolute fit index related with χ2. Normed Chi-
square is the ratio of Chi square value and degrees of freedom and is measured by χ2 value
divided by the degree of freedom (2353/1280=1.839). Wheaton et al. (1977) suggests that a
ratio of approximately five or less is reasonable. However, χ2to degrees of freedom ratios in
the range of 2 to 1 or 3 to 1 are indicative of an acceptable fit between the hypothetical model
and the sample data. Different researchers have recommended using ratios as low as 2 or as

175
high as 5 to indicate a reasonable fit (Marsh and Hocevar, 1985). However, Hair et al. (2010,
p721) suggests that the cut-off value of normed chi-square is 5.0, suggesting any value less
than 5.0 is acceptable. Hair et al. (2010) further suggest that a number smaller than 2.0 is
considered very good and between 2.0 and 5.0 is acceptable. In this case the normed chi-
square value of 1.839 indicates a very good fit.
Absolute fit measures
RMSEA (root mean square error of approximation): The RMSEA is a BOF (badness
of fit) measure. According to the guidelines provided by Hair et al. (2010), in terms of an
absolute fit index, RMSEA provides a reasonable assessment of fit. A value of the RMSEA
of about 0.05 or less would indicate a close fit of the model in relation to the degrees of
freedom (Browne and Cudeck, 1993). However, the authors further state that this value is
based on subjective judgment and it cannot be regarded as infallible or correct, but it is more
reasonable than the requirement of exact fit with the RMSEA = 0.0. In this context, a value of
about 0.08 or less for the RMSEA would indicate a reasonable error of approximation, and
any researcher would not want to employ a model with RMSEA greater than 0.1 (Browne
and Cudeck, 1993). Thus, authors suggest that a RMSEA value of 0.08 or less would indicate
an acceptable model fit. However, models with error values less than 0.05 would indicate an
excellent fit (Jöreskog and Sörbom, 2001). Hair et al. (2010 -p721) suggest that the cut-off
value of RMSEA should be <0.070 for sample of the size and with the number of observed
variables as there are in this study. RMSEA is an absolute fit index and its value in this model
is 0.051. This value is well below the cut-off line of 0.070, set by Hair et al. (2010) and 0.080
set by Browne and Cudeck (1993). Thus, RMSEA provides additional support for model fit.
RMR (root mean square residual): The root mean square residual (RMR) is also a
badness of fit (BOF) measure. Simply stated, it is the difference between the observed
correlation and the predicted correlation. Therefore, the smaller the RMR is the better. An
RMR of zero indicates a perfect fit. According to table 5.15, results show an RMR value of
0.039. The cut-off value of RMR is <0.08 (Hair et al., 2010 -p721). In this case the RMR
value of 0.039 is considerably less than the cut-off value of 0.080, and thus RMR provides
additional support for model fit.
In summary, both absolute fit indices (RMSEA and RMR) signify a very good fit of
the measurement model.
176
Incremental fit measures
One key GOF measure CFI (comparative fit index) is a very widely used index for
incremental fit index (Hair et al., 2010). CFI compares the discrepancy, the degrees of
freedom and the non-centrality parameter estimate for the model being evaluated, and the
baseline model. The CFI is identical to the McDonald and Marsh (1990) relative non-
centrality index (RNI), except that the CFI is truncated to fall in the range from 0 to 1. CFI
values close to 1 indicate a very good fit. However, CFI values less than 0.90 are not usually
associated with a model that fits well (Hair et al., 2010). In this CFA model, CFI was found
to be 0.946 – higher than the cut-off line of 0.90 set by Hair et al. (2010) for a model of this
complexity and sample size. Two other associated incremental fit indices, the TLI (Tucker-
Lewis coefficient index) and IFI (incremental fit index) were also found to have value of
0.942 and 0.946 respectively - both higher than the cut-off line of 0.90. Thus, three
incremental fit tests also provide reasonable evidence of good fit of measurement model.
In summary, GOF (goodness of fit) measures CFI, TLI, IFI and Factor loading were
all found to be in the acceptable range and three BOF (badness of fit) measures (Normed Chi-
square, RMSEA and RMR) were also acceptable. Therefore, the CFA results suggest that this
measurement model provides good fit and that it is suitable to proceed to further tests such as
construct validity of the model.
In this section the results have confirmed one of the major validity tests of overall fit
of the measurement model. The second major validity test of construct validity of the
measurement model is discussed in the next subsections.
5.3.1.4Construct validity
Construct validity has four main components, face validity, convergent validity,
discriminant validity and nomological validity, along with reliability statistics (Hair et al.,
2010).
Face validity
Face validity is widely considered to be the most important validity test (Tabachnick
and Fidell, 2007). Face validity is the extent to which the content of the item is consistent
with the construct definition, based solely on researcher’s judgment and it must be
established before theory testing (Hair et al., 2010). Without an understanding of an item’s

177
content and meaning, it is impossible to express and specify a measurement theory (Hair et
al, 2010 p 710). According to Wacker (2004), face validity is a logical test to determine if the
measures are accurate representations of the properties of the formal conceptual definition. If
these measures do not make sense, then they do not accurately represent the concept.
The measurement model has two sets of constructs – organisational culture (4
constructs) and TQM implementation barriers (6 constructs). The set of 4 constructs of
organisational culture is developed from the CVF framework. This framework has been
validated and used by many researchers and has been proved as a reliable framework for
determining organisation culture as explained in chapter 2, section 2.6.3. Therefore, there is
no need to revalidate this set of constructs. However, the 6 constructs of TQM
implementation barriers did require a consideration of face validity test.
The systematic methodology adopted in this study for deriving the commonly cited
significant TQM implementation barriers from literature is a unique contribution. The author
performed systematic secondary research on the potential barriers that inhibit the process of
TQM development. The study focused on identifying the barriers that plague organisations in
relation to TQM implementation, and used a three step process as discussed in chapter 2,
section 2.7 to identify the most commonly cited barriers from the literature. In addition to the
above validation through the literature, the content validity of the constructs was ensured
through the pilot testing of the survey questionnaire through structured interviews with 12
selected prominent quality practitioners and academics, taking their feedback on content,
clarity and style of the questionnaire (chapter 4, section 4.4.3). This feedback on the survey
questionnaire was taken from field experts, quality professionals and TQM managers and
who were similar to the target population. The aim was to establish whether the content of the
items was consistent with the construct definition or not. The targeted respondents for the
structured interviews were selected based on relevance, qualification and experience. The
structured interviews confirmed the content validity of items and face validity of the
constructs.
Convergent validity
A Convergent validity test ensures that the items are indicators of a specific construct
and converge or share a high proportion of variance in common (Hair et al., 2010). The
model has 10 constructs, each having multiple indicators and therefore, needed to be tested
for convergent validity. Convergent validity can be estimated by three measures – factor
loading, AVE (average variance extracted) and reliability.

178
Table 5.16 shows loading estimates, AVE and reliability for measurement model
using following three cut-off values:
1. Standardized loading estimates should be 0.5 or higher and ideally 0.7 or higher;
2. AVE of >0.5 indicates adequate convergence; and
3. Reliability should be 0.7 or higher.
- Factor loading
High loadings on a factor indicate that they converge on a latent construct. At a
minimum, all factor loadings should be statistically significant. Nevertheless, even a
significant loading could also be fairly weak in strength. Therefore standardized loading
estimates should be 0.5 or higher and ideally 0.7 or higher. Table 5.16 presents the
Standardized Regression Weights of each construct. It shows high factor loadings, mostly >
0.7 with none less than 0.5. Therefore, factor loading confirmed convergent validity. (As a
reminder, the AMOS output of CFA is given in Appendix 4, table 4A, 4B, 4C and 4D.)
- Average Variance Extracted (AVE)
With CFA, AVE is calculated as the mean variance extracted for the items loading on
a construct. AVE is calculated as the total of all squared standardized factor loadings
(squared multiple correlations) divided by the number of items. An AVE of >0.5 indicates an
adequate convergence. In table 5.16, AVE for 9 out of 10 constructs is > 0.6 and one
construct is slightly less than 0.5. Therefore, AVE strongly confirms convergent validity.

179
Table 5.16 Convergent Validity – AVE and reliability for CFA model
Note:BRem = employee barrier, BRcus= customer barrier, BRpln= Planning barrier, BRpro= process barrier,
Brim=information barrier, BRtm= top management barrier, Grp= group culture, Dev= developmental culture, Rational=
rational culture, Hier= hierarchical culture

180
- Construct reliability
Reliability is computed from the squared sum of factor loadings for each construct
and the sum of error variance terms for the construct:
( )
( ) ( )
Where F is the value of each factor loading and SE is the error variance term for each factor
loading value. Reliability should be 0.7 or higher to indicate adequate convergence or internal
consistency (Tabachnick and Fidell, 2007; Hair et al., 2006). Table 5.16 shows reliability of 8
constructs >0.9 and 2 constructs > 0.8, indicating a high degree of reliability of constructs.
The high construct reliability indicates that internal consistency exists and the measures
consistently represent the same latent construct.
- Discriminant validity
Discriminant validity is the extent to which a construct is truly distinct from other
constructs (Hair et al., 2006). The main attribute of discriminant validity is that individual
items should represent exactly one latent construct without having cross-loading. Thus any
indication of cross-loading, points towards a discriminant validity problem. The most
rigorous test of discriminant validity is by comparing the average of variance extracted
(AVE) for any two constructs with the square of correlation estimates between them.
Table 5.17 examines the inter-construct covariance, but after standardization the
covariances are expressed in correlations. For establishing the discriminant validity AVE
estimates are compared with the squared inter-construct correlations of each factor. For
discriminant validity, the AVE estimates should be greater than the squared correlation
estimates (Hair et al., 2006). In this research, the AVE (shown in bold italics in table 5.17) is
larger than any squared correlation of the constructs, which significantly supports
discriminant validity. In addition, all correlations confirm the discriminant validity (see table
5.17). Secondly, estimated correlations among factors are less than or very close to the
recommended value of 0.85 (Kline, 2005), which also supports discriminant validity.
Therefore, the adopted measurement model appears to exhibit discriminant validity and does
not feature any cross-loading among measured variables.

181
Table 5.17Discriminant validity
Hierarchical Rational Developmental Group BRtm BRim BRproc BRpln BRcus BRemp
Hierarchical 0.40
Rational 0.268 0.88
Development 0.008 0.022 0.67
Group 0.002 0.021 0.231 0.74
BRtm 0.016 0.013 0.073 0.092 0.67
BRim 0.003 0.016 0.213 0.237 0.013 0.76
BRproc 0.046 0.000 0.106 0.095 0.002 0.036 0.84
BRpln 0.007 0.000 0.265 0.259 0.059 0.095 0.020 0.76
BRcus 0.028 0.003 0.116 0.130 0.024 0.047 0.059 0.047 0.86
BRemp 0.024 0.000 0.123 0.126 0.017 0.058 0.054 0.048 0.375 0.72
Note:BRemp = employee barrier, BRcus= customer barrier, BRpln= Planning barrier, BRproc= process barrier,
Brim=information barrier, BRtm= top management barrier, Group= group culture, Developmental= developmental culture,
Rational= rational culture, Hierarchical= hierarchical culture
Nomological validity
For nomological validity, the constructs are expected to relate to one another
significantly in the predicted direction (Hair et al., 2006). Nomological validity demonstrates
that empirical findings match hypothesised patterns. In order to ensure nomological validity
of the measurement model, the correlations between the factor scores for each construct
should relate to one another significantly in the predicted direction. In the table 5.18 the
correlation between hypothesized factor scores for 11 hypothesised relationships is
highlighted showing the direction and significance of relationships. The results support that
these constructs are related to one another as hypothesized theoretically in the chapter 3
(section 3.4) and thus provide evidence of nomological validity.
Table 5.18 Nomological validity
Hierarchical Rational Developmental Group BRtm BRim BRpro
c BRpln BRcus BRemp
Hierarchical 1
Rational 0.518 1
Development -0.092 0.148 1
Group -0.04 0.146 0.265 1
BRtm -0.126 -0.115**- 0.271 0.303*** 1
BRim 0.051 -0.125 -0.461
-
0.487*** -0.115 1
BRproc -0.215*** -0.021 0.325 0.308 -0.045 -0.191 1
BRpln -0.083*---- 0.021 0.515 0.509 0.242 -0.308 0.14 1
BRcus 0.166 0.054**- -0.341*--
-
0.360*** -0.156 0.217 -0.242 -0.216 1
BRemp 0.154 -0.007*-- -0.351*--
-
0.355*** -0.13 0.241 -0.233 -0.218 0.612 1

182
***Significant at 0.001 level. ** Significant at 0.01 level. * Significant at 0.05 level.
Note:BRemp = employee barrier, BRcus= customer barrier, BRpln= Planning barrier, BRproc= process barrier,
Brim=information barrier, BRtm= top management barrier, Group= group culture, Developmental= developmental culture,
Rational= rational culture, Hierarchical= hierarchical culture
5.3.1.5 Summary of assessment of measurement model
In this section, the author has confirmed the validity of the measurement model of two
sets of constructs using CFA by drawing the measurement model with the six and four
constructs respectively, assessing the goodness of fit by performing CFA on the data and
analyzing and assessing the reliability and construct validity of the measurement model.
Moreover, the empirical results suggest that a 2-set construction of the model comprising 10
constructs (4 constructs of organisational culture as independent variable and 6 constructs of
TQM implementation barrier as dependent variable) provide the best fit for the data,
supporting a two-dimensional measurement structure. As a result, the measurement model
shows a reasonable fit for the data collected in the target population (see table 5.16, 5.17 and
5.18). Thus, this model can be used for all subsequent analysis and hypotheses testing.
After successful assessment of the measurement model through CFA, in the next
stage of data analysis the evaluation of the structural model and investigation of hypothesized
relationships between the two sets of constructs was performed using SEM.
5.3.2 Testing the structural model using SEM
The measurement model provides the foundation for all further theory testing and
provides a basis for assessing the validity of the structural model (Tabachnick and Fidell,
2007; Hair et al., 2006). The measurement model was developed based on theory and then
tested with CFA. Therefore, in the second step, the structural theory was tested.
The structural theory is a conceptual representation of structural relationships between
both sets of constructs. It is expressed in terms of a structural model that represents the theory
with structural equations, and is depicted with a visual diagram (Figure 5.3). The structural
relationships between any two constructs from each set of constructs are represented
empirically by the structural parameter estimates or path estimates. The structural model
applies structural theory by specifying which constructs are related to each other and the
nature of the relationship. These relationships can be expressed as regression coefficients.
183
SEM is used to estimate an empirical measure of the relationships between both sets of
constructs to assess how well the theory fits the data (Tabachnick and Fidell, 2007; Hair et
al., 2006). The results of this model fit allow us to contrast theory against reality in terms of
the data collected from the target population.
For testing the structural theory, structural parameter estimates should be statistically
significant in the predicted direction (Tabachnick and Fidell, 2007; Hair et al., 2006). They
should be greater than zero for a positive relationship and less than zero for a negative
relationship. According to the theory in this research (see conceptual framework in section
3.4) each type of organisational culture (group, developmental, rational and hierarchical)
existing in an organisation has an impact on certain TQM implementation barriers. Following
the guidelines of Hair et al. (2010), the next stages of validating the structural model were
performed in the following order:
1. Constructing a structural model,
2. Validating structural model for overall fit using CFA/SEM, and
3. Investigating hypothesized relationships between two sets of constructs using SEM.
5.3.2.1 Constructing a structural model
In testing the structural model, the primary focus shifts to the relationships between
constructs. SEM empirically examines the structural model by combining both measurement
model and structural model in one analysis. In SEM, the correlational relationships are
replaced with dependence relationships. Therefore the design of the structural model emerges
from the measurement model. It takes information about measurement into account while
testing the structural model (Hair et al., 2006).
The path diagram in figure 5.3 is a graphical representation that employs arrows and
parameters to depict the relationships that link both sets of constructs. In this model, there are
two types of free parameter connections – exogenous constructs and endogenous constructs.
The four exogenous constructs of organisational culture (group culture, developmental
culture, rational culture and hierarchical culture) appear on the left-hand side of the model
(fig 5.4) and are represented as independent variables. Endogenous constructs in this model
are considered as outcome of exogenous constructs as hypothesized. The six endogenous
constructs of TQM implementation barriers (top management barrier, employee barriers,
customer barrier, planning barriers, process management barrier and information
management barrier) appear on the right-hand side of the model (see Figure 5.3).

184
Figure 5.3 Graphical display of 10 construct structural model
Note:BRem = employee barrier, BRcus= customer barrier, BRpln= Planning barrier, BRpro= process barrier,
Brim=information barrier, BRtm= top management barrier, Grp= group culture, Dev= developmental culture, Rational=
rational culture, Hier= hierarchical culture
BRemp
BRemp1 e1
1
1BRemp4 e4
1BRemp6 e6
1BRemp7 e7
1BRemp8 e8
1BRemp9 e9
1
BRcus
BRpln
BRcus4 e10
11
BRcus3 e11
1BRcus2 e12
1BRcus1 e13
1
BRpln2 e141
1
BRpln3 e16
1
BRpln4 e17
1
BRproc
BRim
BRproc6 e18
1
1BRproc5 e19
1BRproc4 e20
1BRproc3 e21
1BRproc2 e22
1BRproc1 e23
1
BRim1 e24
11
BRim2 e25
1BRim5 e28
1BRim6 e29
1
BRtm
BRtm8 e30
1
1BRtm7 e31
1BRtm6 e32
1BRtm5 e33
1BRtm4 e34
1BRtm3 e35
1
Group
OCd6Ae45
OCd5Ae44
OCd4Ae43
OCd3Ae42
OCd2Ae41
OCd1Ae40
1
1
1
1
1
1
1
Developmental
OCd6Be51
OCd5Be50
OCd4Be49
OCd3Be48
OCd2Be47
OCd1Be46
1
1
1
1
1
1
1
Rational
OCd6Ce56
OCd5Ce55
OCd4Ce54
OCd3Ce53
OCd2Ce65
OCd1Ce52
1
1
1
1
1
1
1
Hierarchical
OCd6De62
OCd5De61
OCd4De60
OCd3De59
OCd2De58
OCd1De57
1
1
1
1
1
1
1
e66
1
e67
1
e68
1
e69
1
e70
1
e71
1

185
5.3.2.2 Assessment of structural model (SEM)
The Structural model is tested in the same way as the CFA model (previous section
5.3.2). More than one fit indices were used to test the model. In this assessment, one absolute
fit index, one incremental index and χ2 was used as a minimum.
- Overall model fit
The SEM output includes many fit indices. This research checked key fit indices
including χ2 statistics, the CFI and the RMSEA to provide an assessment of fit. Table 5.19
presents the selected fit statistics from the SEM output.
Table 5.19 Overall fit indices – hypothesized structural model
Test Value SEM Acceptable
value
Chi-square (χ 2
)
Chi-square 3275
Degrees of freedom 1314
Significant p-value <0.001 >0.05
Absolute fit measures
Normed Chi-square 2.493 <5.0
RMSEA 0.068 <0.070
Incremental fit index
CFI 0.901 >0.90
TLI 0.902 >0.90
IFI 0.901 >0.90
- χ 2 (chi-square) test
The overall model χ2 was 3275 with 1314 degrees of freedom. The p-value associated
with this result should be >0.05 and it is <0.001, suggesting bad chi-square fit. Probability (p-
value) is non-significant (χ2 (1314, N=325) = 3275, p<0.001), suggesting that the proposed
model is not consistent with the observed data. As explained in section 5.3.2.1, in large
complex samples with many variables and degrees of freedom such as this sample, the
observed chi-square will nearly always be statistically significant, even when there is a
reasonably good fit to the data. Therefore, chi-square statistic is used more as a descriptive
index of fit, rather than as a statistical test. In order to make it less dependent on sample size
and complexity, normed chi-square is used which is the ratio of the chi-square fit index
divided by degrees of freedom. Therefore, a normalised chi-square (χ2/df) is recommended as
a measure of model fit because of the sensitivity of χ2 to sample size and complexity (Kline,
2005).

186
Normed Chi-square is the ratio of Chi square value and degrees of freedom and is
measured by χ2 value divided by the degree of freedom (3275/1314=2.493). Hair et al. (2010,
p721) suggests that the cut-off value of normed chi-square is 5.0, suggesting any value less
than 5.0 is acceptable. Authors further suggest that a number smaller than 2.0 is considered
very good and between 2.0 and 5.0 is acceptable. In this case the normed chi-square value of
2.493 indicates an acceptable fit.
Absolute fit measures
As discussed in section 5.3.1.3, for model fit at least one absolute fit index and one
incremental fit index is required, in addition to the normed chi-square results (Hair et al.,
2010). RMSEA is an absolute fit index and its value was found to be 0.068 (table 5.19). This
value is below the cut-off line of 0.070 as recommended by Hair et al., (2010). Thus, the
RMSEA provides additional support for model fit. More literature evidence regarding the
cut-off value for RMSEA was provided in section 5.3.1.3.
Incremental fit measures
In the incremental fit indices, CFI is the most widely used index. In this SEM model,
CFI is 0.901 – higher than the recommended cut-off line of 0.90 for a model of this
complexity and sample size (Hair et al., 2010). As given in table 5.19, two other incremental
fit indices TLI and IFI also returned values of 0.902 and 0.901 respectively, both higher than
the cut-off line of 0.90. More literature evidence regarding cut-off value was provided in
section 5.3.1.3.
As structural model is based on CFA therefore, if the structural model test results are
substantially different than those of CFA, then it is argued that the structural theory lacks
validity (Hair et al., 2006). In this context, the results of the CFA and the structural model
were also compared, as shown in table 5.20.
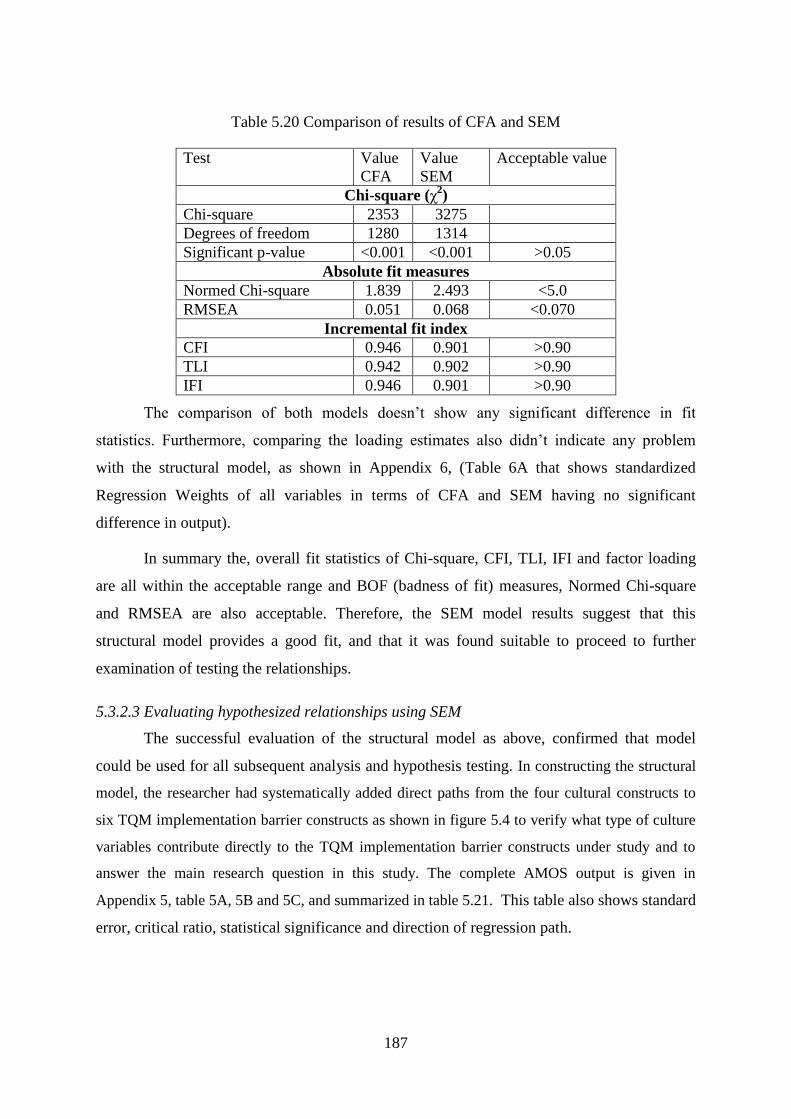
187
Table 5.20 Comparison of results of CFA and SEM
Test Value
CFA
Value
SEM
Acceptable value
Chi-square (χ2)
Chi-square 2353 3275
Degrees of freedom 1280 1314
Significant p-value <0.001 <0.001 >0.05
Absolute fit measures
Normed Chi-square 1.839 2.493 <5.0
RMSEA 0.051 0.068 <0.070
Incremental fit index
CFI 0.946 0.901 >0.90
TLI 0.942 0.902 >0.90
IFI 0.946 0.901 >0.90
The comparison of both models doesn’t show any significant difference in fit
statistics. Furthermore, comparing the loading estimates also didn’t indicate any problem
with the structural model, as shown in Appendix 6, (Table 6A that shows standardized
Regression Weights of all variables in terms of CFA and SEM having no significant
difference in output).
In summary the, overall fit statistics of Chi-square, CFI, TLI, IFI and factor loading
are all within the acceptable range and BOF (badness of fit) measures, Normed Chi-square
and RMSEA are also acceptable. Therefore, the SEM model results suggest that this
structural model provides a good fit, and that it was found suitable to proceed to further
examination of testing the relationships.
5.3.2.3 Evaluating hypothesized relationships using SEM
The successful evaluation of the structural model as above, confirmed that model
could be used for all subsequent analysis and hypothesis testing. In constructing the structural
model, the researcher had systematically added direct paths from the four cultural constructs to
six TQM implementation barrier constructs as shown in figure 5.4 to verify what type of culture
variables contribute directly to the TQM implementation barrier constructs under study and to
answer the main research question in this study. The complete AMOS output is given in
Appendix 5, table 5A, 5B and 5C, and summarized in table 5.21. This table also shows standard
error, critical ratio, statistical significance and direction of regression path.

188
Table 5.21Hypothesis test results
Structural Relationship
(Regression path)
Standardized
Regression Weights (β) S.E. C.R.
(t- value) ρ
BRtm Group +.323 .034 5.918 ***
BRemp Group -.316 .039 -5.716 ***
BRcus Group -.362 .040 -6.569 ***
BRim Group -.489 .028 -8.406 ***
BRemp Developmental -.073 .046 -1.318 .187
BRcus Developmental -.030 .046 -.558 .577
BRtm Rational -.159 .053 -3.007 .003**
BRemp Rational +.048 .060 0.901 .368
BRcus Rational +.110 .061 2.079 .038*
BRpln Hierarchical -.086 .019 -7.895 ***
BRproc Hierarchical -.215 .168 -3.301 ***
***Significant at 0.001 level, ** Significant at 0.01 level, * Significant at 0.05 level.
Note:BRem = employee barrier, BRcus= customer barrier, BRpln= Planning barrier, BRpro= process barrier,
Brim=information barrier, BRtm= top management barrier
After running the model in AMOS, the results as presented graphically in Figure 5.4
were obtained showing the hypothesised structural model of the antecedent and consequences
of the TQM implementation related constructs. In addition to fit indices, the structural model
needs further evidence to support the theory proposed. One of the fundamental conditions in
hypothesis testing of this nature is that the parameter estimates should be statistically
significant and in the predicted direction.
As shown in figure 5.4, the path coefficients (highlighted in yellow) were not as
comprehensively conclusive as those regarding the fit indices. For example, the direction of
correlation parameter estimations between group culture and the top management barrier
construct; rational culture and the customer barrier construct; and rational culture and the
employee barrier construct are not as was originally predicted. Nevertheless, despite these
unexpected outcomes, the rest of the variables in the standardised solution show reasonable
correlation parameter estimates in the predicted direction. As such, these findings support the
vast majority of the hypotheses. Additionally, most of the parameter estimates are statistically
significant at the 0.001, 0.01 and 0.05 levels of significance, as shown in table 5.21. Figure
5.4 below shows the path diagram of constructs, estimates of standardized regression weight
with significance and direction.
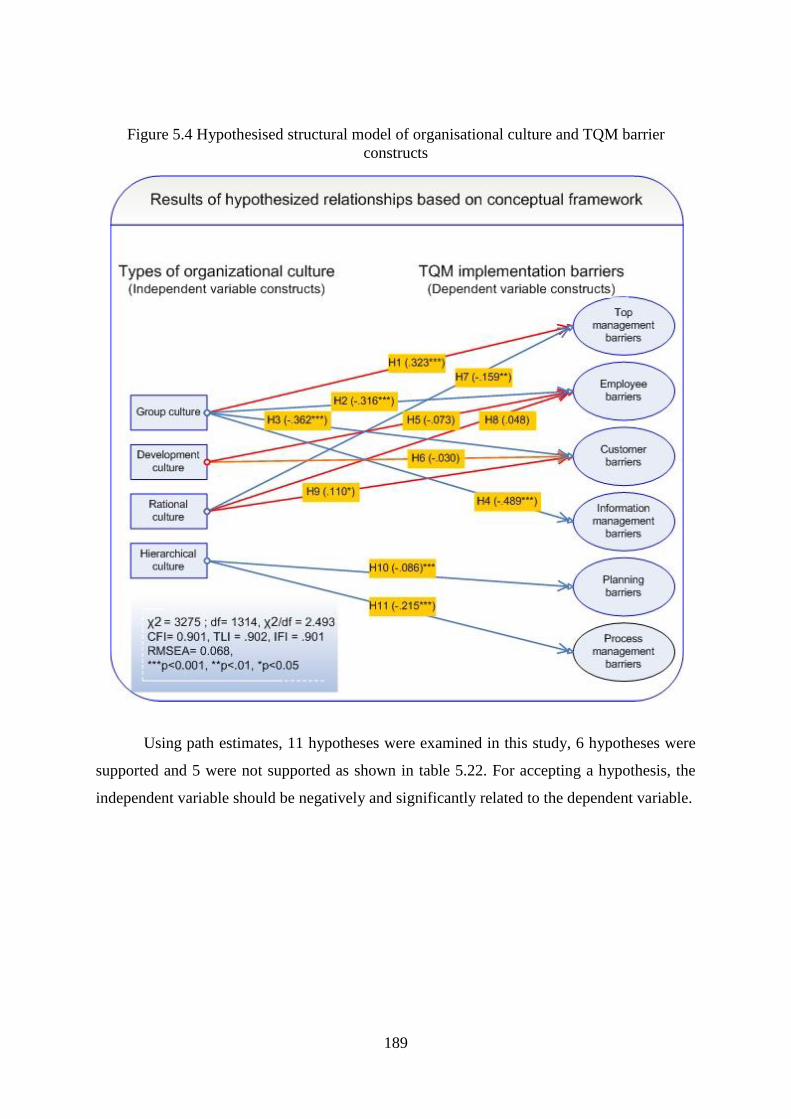
189
Figure 5.4 Hypothesised structural model of organisational culture and TQM barrier
constructs
Using path estimates, 11 hypotheses were examined in this study, 6 hypotheses were
supported and 5 were not supported as shown in table 5.22. For accepting a hypothesis, the
independent variable should be negatively and significantly related to the dependent variable.

190
Table 5.22 Summary of Results of Hypotheses Testing
Hypotheses Result
H1- Group culture decreases top management barriers Not Supported
H2- Group culture decreases employee barriers Supported
H3- Group culture decreases customer barriers Supported
H4- Group culture decreases information barriers Supported
H5- Developmental cultures decreases employee barriers Not Supported
H6- Developmental culture decreases customer barriers Not Supported
H7- Rational culture decreases top management barriers Supported
H8- Rational culture decreases employee barriers Not Supported
H9- Rational culture decreases customer barriers Not Supported
H10- Hierarchical culture decreases planning barriers Supported
H11- Hierarchical culture decreases process barriers Supported
The findings for each hypothesis are presented in turn below:
- Group culture and TQM implementation barriers
H1. Hypothesis H1 proposed that the presence of group culture decreases top management
barriers. Figure 5.4 and table 5.21 show that the independent predictor variable of group
culture to top management barriers was found to be positively and significantly related
to the dependent variable (β= +.323, P<0.01, t= 5.918). Hypothesis H1 therefore is not
supported because the regression path is positive (+.323). This means that when group
culture goes up by 1 standard deviation, top management barriers also go up by 0.323
standard deviations, showing a positive relationship, contrary to the hypothesized
direction. Therefore hypothesis H1 was not supported.
H2. Hypothesis H2 proposed that group culture decreases employee barriers. Figure 5.4 and
table 5.21 show that the independent predictor variable of group culture to employee
barriers was negatively and significantly related to the dependent variable (β= -.316,
P<0.01, t= 5.716). All the statistics are within acceptance thresholds and the regression
path is negative (-.316). This means that when group culture goes up by 1 standard
deviation, employee barriers go down by 0.316 standard deviations, showing a negative
relationship in accordance with the hypothesis. Therefore hypothesis H2 was strongly
supported.
191
H3. Hypothesis H3 proposed that group culture decreases customer barriers. Figure 5.4 and
table 5.21 show that the independent predictor variable of group culture to customer
barriers was found to be negatively and significantly related to the dependent variable
(β= -.362, P<0.01, t= 6.569). All statistics are within acceptance thresholds and the
regression path is negative (-.362). This means that when group culture goes up by 1
standard deviation, customer barriers go down by 0.362 standard deviations, showing a
negative relationship as hypothesized. Therefore hypothesis H3 was strongly supported.
H4. Hypothesis H4 proposed that group culture decreases information barriers. Figure 5.4
and table 5.21 show that the independent predictor variable of group culture to
information barriers was negatively and significantly related to the dependent variable
(β= -.489, P<0.01, t= 8.406), with all statistics within acceptance threshold and the
regression path is negative (-.489). This means that when group culture goes up by 1
standard deviation, information management barriers goes down by 0.489 standard
deviations, showing a negative relationship as hypothesized. Therefore hypothesis H4
was also strongly supported.
- Developmental culture and TQM implementation barriers
H5. Hypothesis H5 proposed that the presence of developmental culture decreases employee
barriers. Figure 5.4 and table 5.21 show that the independent predictor variable of
developmental culture to employee barriers was negatively but less significantly related
to the dependent variable (β= -.073, P=0.187, t= 1.318). All statistics are within
acceptance thresholds except the p-value which is >0.05. However, the regression path
is negative (-.073). This means that when developmental culture goes up by 1 standard
deviation, employee barriers go down by 0.073 standard deviations, showing a negative
relationship as was hypothesized. However, because estimates have significance below
the critical t-value for a type I error of 0.05, therefore, although the estimate is found to
be in the hypothesized direction, it cannot be supported due to non-significant p-value
(>0.05).
H6. Hypothesis H6 proposed that developmental culture will decrease customer barriers.
According to Figure 5.4 and table 5.21, the independent predictor variable of
developmental culture to the customer barrier construct was found to be negatively
related to the dependent variable (β= -.030, P=0.557, t= .558). All statistics are within
acceptance thresholds except the p-value which is >0.05. However, the regression path
192
is negative (-.030) indicating that when developmental culture goes up by 1 standard
deviation, customer barriers go down by 0.030 standard deviations, showing a negative
relationship as was hypothesized. Again, because estimates have significance below the
critical t-value for a type I error of 0.05, therefore, although the estimate is in
hypothesized direction, it cannot be supported due to non-significant p-value (>0.05).
- Rational culture and TQM implementation barriers
H7. Hypothesis H7 proposed that the presence of rational culture decreases top management
barriers. According to Figure 5.4 and table 5.21, the independent predictor variable of
developmental culture to top management barriers was found to be negatively related to
the dependent variable (β= -.159, P<0.01, t= 3.053) and all statistics were within
acceptance thresholds with a regression path that is negative (-.159). This means that
when developmental culture goes up by 1 standard deviation, customer barriers go
down by 0.159 standard deviations, showing a negative relationship as was
hypothesised. Therefore hypotheses H7 was strongly supported.
H8. Hypothesis H8 proposed that rational culture decreases employee barriers. According to
Figure 5.4 and table 5.21, the independent predictor variable of developmental culture to
the employee barrier construct was found to be positively related to the dependent
variable (β= +.048, P=0.368, t= 0.901). All statistics were not within acceptance
thresholds and the regression path was found to be positive (+0.048). In other words,
when rational culture goes up by 1 standard deviation, employee barriers also go up by
0.048 standard deviations, showing a positive relationship contrary to the proposed
theory. Therefore hypotheses H8 was not supported.
H9. Hypothesis H9 proposed that rational culture decreases customer barriers. According to
Figure 5.4 and table 5.21, the independent predictor variable of developmental culture to
customer barriers was found to be positively related to the dependent variable (β=
+.110, P<0.05, t= 2.079). This means that when rational culture goes up by 1 standard
deviation, customer barriers also go up by 0.110 standard deviations, showing a positive
relationship contrary to the hypothesis. Therefore hypotheses H9 was not supported.
193
- Hierarchical culture and TQM implementation barriers
H10. Hypothesis H10 proposed that hierarchical culture decreases planning barriers.
According to Figure 5.4 and table 5.21, the independent predictor variable of
developmental culture to planning barriers was negatively related to the dependent
variable (β= -.086, P<.001, t= 7.895). This means that when hierarchical culture goes up
by 1 standard deviation, planning barriers go down by 0.086 standard deviations. All
statistics are within acceptable range and there is a negative regression path (-.086), thus
a negative relationship was found as hypothesized with statistical significance, and
hypothesis H10 was supported.
H11. Hypothesis H11 proposed that hierarchical culture decreases process management
barriers. According to Figure 5.4 and table 5.21, the independent predictor variable of
developmental culture to planning barriers was found to be negatively related to the
dependent variable (β= -.215, P<.001, t= 3.301). All statistics were within acceptance
threshold and the regression path is negative (-.215). When hierarchical culture goes up
by 1 standard deviation, process barriers go down by 0.215 standard deviations,
showing a negative relationship as was hypothesized. Therefore hypothesis H11 was
strongly supported.
5.4 Chapter summary
In this chapter, the survey data was analyzed using statistical tools, and the findings
were presented. The next chapter provides a discussion of these results. In order to answer the
research questions, statistical procedures were performed to ascertain descriptive statistics of
the demographic characteristics and the existing organisational culture and TQM
implementations barriers. The results provide evidence on the magnitude of the culture types
and the magnitude of the barriers to the TQM implementations that exist in the organisations
in the survey sample.
The proposed measurement model was assessed on the basis of overall model fit,
validity and reliability. The measurement model was validated through confirmatory factor
analysis (CFA) and several statistical tests including convergent validity (CV), discriminant
validity, (DV), reliability and average variance extracted (AVE). As a result, theoretically and
operationally valid and reliable scales were developed and subsequently testing of the
measurement model was performed with these scales. Overall, the finalised scales were found
194
to possess satisfactory validity and reliability and were consequently employed in the
hypotheses testing.
The structural model was assessed for overall model fit using SEM, which was also
used to investigate the relationships between the independent variables of organisational
culture constructs and independent variables of TQM implementation barrier constructs. For
testing the structural theory the direction and significance of the structural parameter
estimates for the majority of the hypotheses were as predicted, and correlation parameter
estimates were greater than zero for a positive relationship and less than zero for negative
relationship.
The findings showed that the direction and size of the correlation parameter
estimations in the model were generally consistent with the extant TQM implementation
theory. However, the findings regarding the path coefficients were not entirely conclusive in
relation to the proposed hypotheses. For example, the direction of correlation parameter
estimations between group culture and top management barriers; rational culture and
customer barrier; and rational culture and employee barriers were not as predicted.
Nevertheless, despite these unexpected outcomes the findings overall support the majority of
the hypotheses. The standardised solution showed sound estimates with the predicted
direction of correlations and parameter estimation. Further discussion on interpretation of
these results is provided in the next chapter.
195
Chapter Six: Discussion
6.1 Introduction
The Quality management literature has thrived with diverse TQM definitions,
explanations of the content of TQM, TQM implementation models, quality award models,
standards, empirical studies and theories. Nevertheless, this literature is in broad agreement
on the theory that with proper implementation of TQM an organisation can achieve cost
effective and optimum utilization of resources to achieve performance excellence. Since its
development, TQM has proved its capability to affect positively on performance outcomes,
such as financial performance and profitability as well as with human outcomes, such as
employee satisfaction, employee relations, and customer satisfaction (Zeitz et al., 1997;
Black and Porter, 1996; Flynn and Saladin, 2006; Dayton, 2001; Stephens et al, 2005; Wilson
and Collier, 2000; Paul et al, 2005), however, in practice, these TQM benefits are not easy to
achieve (Oakland, 2003). Despite its theoretical premise and the enthusiastic response to
TQM, the literature reports many cases of TQM implementation failure (Smith et al., 1994;
Wilkinson et al., 1998; Harari, 1993a; Fuchsberg, 1992; Brown, 1993; Jacob, 1993; Shin et
al., 1998; Ackoff, 1993; Becker, 1993; Bemowski, 1993; Jacob, 1993; Kunst and Lemmink,
2000; Walsh et al., 2002; Taylor and Wright, 2003; and Sila, 2007). Researchers have
generally attributed these failures to implementation, not to TQM theory and method (Huq,
2005). Therefore, following a careful review of the literature, this study is based upon the
prevalent argument that TQM implementation barriers are one of the prime causes of failure
of TQM (Ngai and Cheng, 1997; Salegna and Fazel, 2000; Sebastianelli and Tamimi, 2003;
Huq, 2005; Zeng et. al., 2008; Amaral and Sousa, 2009; Bhat and Raj, 2009; Taylor and
Wright, 2003), and that these barriers can be addressed by developing characteristics of
organisational culture that support TQM implementation and moderating characteristics of
organisational culture that impede TQM implementation (Chang and Wiebe, 1996; Zeitz et
al., 1997; Dellana and Hauser, 1999; Prajogo and McDermott, 2005; Naor et al., 2008; Zu et
al., 2009).
Therefore, this study has empirically examined evidence on the impact of
characteristics of organisational cultural on TQM implementation barriers. The main purpose
of this study was to examine the relationship between organisational culture and TQM
implementation barriers to gain a better understanding of the factors affecting TQM
196
implementation. It is expected that replication of this study in other organisations with
different culture and context may further help in developing an improved model of TQM
implementation. In this context, the study has first identified the type of organisational
culture and secondly identified significant TQM implementation barriers existing in the target
population of Bahraini organisations, and has investigated what type of organisational culture
is associated with what type of barrier. This study attracted 325 responses from key
organisational informants constituting a response sample that provided a substantive
representation of the total population of service and manufacturing organisations of Bahrain
as shown in table 5.1 in chapter 5. The summary of the demographics of respondents in table
5.2 (chapter 5) supports the fact that all three criteria of relevance, qualification and
experience of respondents were met and that the data was obtained from highly dependable
professionals. Similarly, the demographic of the participant organisations in table 5.2 (chapter
5) show a balanced representation of organisations (by size, company type and company
operation type) Therefore, the following preconditions of coverage and sampling suggested
by Dillman et al., (2009 p-43) were satisfactorily met:
- include a survey population of all organisations to which results will be generalized; and
- draw a sample that represents the survey population
Another important consideration was the validity of the survey instrument used in this
study. According to Singh (1995), when a scale is adapted and applied to specific culture and
region, it is necessary to assess the relevance of the context of the scale to achieve the validity
of inferences. Therefore, the instrument was revised further through pilot structured
interviews with quality practitioners and academics from the same context and background as
the target sample population to ensure that the questionnaire was relevant, comprehensive,
understandable and valid. The survey instrument was modified based on their input. The
survey was administered online and answers to culture and barriers related questions were
mandatory. As a result, there was no missing data found. Some missing data was observed in
open ended general demographic questions and was easily filled by contacting the
respondents. Values of scales were fixed and thus no chance of outliers was there in data.
Finally, the reliability and validity of the adapted scales was assessed through construct
validity and goodness of fit which is an essential condition for further theory testing and
development (Bagozzi et al., 1991). Both the measurement model and the structural model
were assessed using CFA/SEM (sections 5.3.1 and 5.3.2). All the steps mentioned above
demonstrate the validity of the survey instrument, construct validity, and salience of the data

197
collected. Therefore, the few unexpected results that were observed can be considered to be
realistic and based on fact.
This chapter discusses the findings presented in chapter 5 and systematically reviews
how this research has addressed the research questions formulated in chapter 1. First, the state
of existing organisational culture in the survey population is discussed in section 6.2 by
looking at the characteristics of each type of organisational culture in the context of TQM
implementation. Then, the state of significant TQM implementation barriers in the survey
population is examined in section 6.3. Finally, the impact of organisational culture on TQM
implementation barriers is discussed in section 6.4 by examining the observed relationships
between the two.
6.2 Organisational culture
Development of quality and business excellence can’t be achieved merely by
rudimentary improvement strategies but by fostering capability to do the right things through
a persistent and lasting set of norms and values (Oakland, 2003). Such built in norms, values,
beliefs, behaviours and climate are referred by many scholars as an organisational culture
(Denison and Spreitzer, 1991; McDermott and Stock, 1999; Cameron and Quinn, 1999;
Prajogo and McDermott, 2005; Al-khalifa and Aspinwall, 2001). Therefore, understanding
the cultural profile of an organisation and mapping this profile to the steps needed to
accomplish a change is an important part of the TQM journey (Cameron and Quinn, 1999). In
this context, the organisational culture profile observed in the survey population is discussed
from two perspectives:
Data was collected on four types of culture - group, developmental, rational and
hierarchical. Therefore, in the first step, the overall cultural profile is discussed based on
each type of culture.
The score for each type of culture emerges from six underlying dimensions
(organisational character, leadership character, management style, binding force,
emphasis of organisation and success criteria) that contribute to the overall score.
Therefore, in the second step, further investigation based on the mean score of each
dimension for each type of organisation culture and the implications of this score on the
overall results is discussed.

198
6.2.1 Organisational culture profile by type of culture
Table 5.4 in chapter 5 illustrates the overall mean and std. deviation of each
organisational culture types. The findings in table 5.4 show that the organisations in the
survey population are predominantly inclined towards a mix of hierarchical and rational
culture types. The general tendency is therefore towards control, centralization, stability, and
predictable performance outcomes (hierarchical culture); and task focus, goal achievement,
efficiency, productivity and profitability (rational culture).
The graphical presentation of results in figure 6.1 below, displays an organisational
culture profile. Both of the prevailing cultures with the highest scores (hierarchical 4.0 and
rational 3.9) are oriented towards centralization which reflects stability and control, while
both of the weaker cultures (group culture with a medium score 3.2 and developmental also
with a medium (but the lowest score 2.9) are oriented towards decentralization which reflects
flexibility and spontaneity. This indicates that the focus of the organisations in the survey
population is a lot more on stability, order, and control, rather than flexibility, discretion, and
dynamism.
As illustrated in figure 6.1, the organisational focus of one of the prevailing cultures
(hierarchical) is internal and oriented towards maintenance and improvement of the existing
organisation, while that of other (rational) is externally focused on adaptation and interaction
with the external environment. This indicates that the organisations in survey population have
an internal focus on integration and unity along with an external focus on differentiation, and
rivalry. The organisations have harmonious internal characteristics together with a focus on
interacting or competing with others outside their boundaries. The score for both hierarchical
and rational cultures in the survey population is quite high, reflecting the dominant role of
both types of culture in the sample organisation. Due to the dominant role of control oriented
culture types, organisations in this survey population show a propensity for a stable,
predictable, and mechanistic character while TQM is more perceived to need a changing,
adaptable, and organic character to fully flourish (Naor, 2008). Supporting this argument,
Dellana and Hausser (1999) assert that those cultures which are characterized by flexibility
rather than control are most likely to be able to implement TQM comprehensively. In
particular, these authors proposed that group culture, characterized by “teamwork,
participation, and a mentoring leadership” on the one hand, and “developmental” culture
characterized by “creativity, risk taking, and a creative leadership” on the other, provide the
most favourable conditions for TQM. Ironically, both of these culture types are weaker in the

199
survey population. Therefore it is reasonable to argue that the less significant role of the more
favourable culture types and the more dominant role of the less favourable culture types in
the survey population is a potential obstacle in any TQM intervention. This result was
anticipated because of the controlled and centralized organisational structures in the region.
Figure 6.1 Mean score of each culture type
The majority of the organisations in the survey population have a ‘medium’ score (on
5-point likert scale) in group culture which is a sign of a potentially considerable lack of
employee participation in decision making; open discussion and communication;
empowerment of employees to act; value of human relations, teamwork and cohesion; and
developing human resources through training. Under such conditions, employees may find it
difficult to justify their commitment and contribute whole-heartedly to the production of
quality products and services, or to the improvement of the business operations (Gallear and
Gobadian, 2004). Perhaps the most central prerequisite of successful TQM programme is
good communication between top management and employees, mentioned explicitly by most
of the authors, while a second important dimension is employee involvement or
0
1
2
3
4
Internal focus External focus
Stability & control
Change & flexibility
2.9
3.9 4.0
3.2
Group culture
Rational culture Hierarchical culture
Developmental culture

200
empowerment (Zeitz et al., 1997). According to the findings, both of these critical
characteristics are somewhat deficient in the survey population. Similarly the low score on
developmental culture also suggests that the organisations in the survey population lack
flexibility and decentralization that in turn is likely to curb expansion, growth and
development due to lack of innovation and creative problem solving processes (Cameron and
Quinn, 1999; Prajogo and McDermott, 2005). In today’s changing marketplace, lack of
flexibility in organisational culture limits an organisation’s ability to innovate. Therefore, the
low score on developmental culture indicates that organisations in the survey population may
presently lack the potential to grow and compete globally. According to Zeitz et al., (1997),
innovation refers to the climate that supports new ideas concerning work methods as well as
products. They report that most authors imply that any climate orientation toward innovation
is consistent with, and conceptually overlaps continuous improvement, a feature of TQM. On
the other hand, the overall high score in rational culture suggests that a focus of the
organisations in the survey population is on task accomplishment, goal achievement,
efficiency, productivity and profitability. Likewise, the overall high score in hierarchical
culture reveals a controlled and centralized structure to ensure stability, continuity, order and
predictable performance outcomes. As both dominant cultures (rational and hierarchical) are
control-oriented, the similarity in score of both cultures in the survey population is consistent
with existing theory.
These overall results are very similar when compared to the results of other studies
made in Eastern cultures, particularly Middle Eastern cultures. In the context of Middle
Eastern cultures, the results of this research support past research that reported similar results in
terms of scores on the same four types of organisational culture. While investigating the culture
of Qatar organisations (Qatar is an Arab country in the Middle East, a Gulf state very close to
Bahrain both culturally and geographically) Alkhalifa and Aspinwall (2001) found that
hierarchical culture score (3.4) and rational culture (3.4) were the prevailing types of cultures
and group culture (3.1) and developmental culture (2.9) were the weaker cultures. It is
reasonable to conclude that these results are quite similar to this study because of commonly
held attitudes, values, and beliefs that guide the behaviour of the organisation members of
both countries (Martin, 1985).
When comparison is made with the studies in western cultures the results are
different. As an example of the cultural profile of western organisations, the study of Zu et
al., (2009) is used. The study was conducted in US organisations and Zu et al. (2009) found

201
that group, developmental and hierarchical culture types had equal score of 3.5, while rational
culture had a higher score of 3.8. Compared to the present study, group and developmental
culture in the study of Zu et al. (2009) had higher scores, while rational and hierarchical
culture had a slightly lower score. The findings of Zu et al., (2009) indicate a much stronger
hold of TQM culture in the US organisation sample compared to the Bahrain and Qatari
samples. The results of another study conducted in Australian organisations by Prajogo and
McDermott (2005) are also fairly different to those of this study. The score on group culture
was 3.7, developmental 3.6, rational 3.8 and hierarchical 3.5. As such, the high score on
group and developmental culture and lower score on hierarchical culture compared to this
study also reflects a more dominant ‘TQM culture’ in Australian organisations. However, one
common pattern in all four studies that is observed is that the rational culture score is high
(the highest in three out of four studies) indicating a trend of prioritizing control and external
focus. Thus, organisations in these three regions and cultures (USA, Australia and the Middle
East) have relatively more focus on task accomplishment, goal achievement, efficiency,
productivity and profitability rather than employee empowerment, employee participation
and human resource development. Figure 6.2 summarizes the results of each culture type in
the four different studies.
Figure 6.2 Results of each culture in four different studies
Figure 6.2 provides a slightly more detailed picture and also reveals some other
interesting facts. The score of group culture in Bahraini organisations (3.2) is a little higher
than Qatar organisations (3.1) but much lower than US (3.5) and Australian organisations
(3.7). Qatar organisations (3.1) have been found to be the lowest and Australian organisations
BahrainPresent study
QatarAlkhalifa &
Aspinwall, 2001
USAZu et al., 2010
AustraliaPrajogo &
McDermott, 2005
3.2 3.1
3.5 3.7
2.9 2.9
3.5 3.6
3.9
3.4
3.8 3.8 4.0
3.4 3.5 3.5
Comparison of results by each study
group developmental rational hierarchical
202
(3.7) the highest in score on group culture. The organisations in the present survey population
are lowest in developmental culture score (2.9) but have the highest score on rational (3.9)
and hierarchical (4.0) cultures, again reflecting a strong hold of culture that is generally
considered to be less favourable to TQM implementation.
Denison and Spreitzer (1991) argue that none of the cultural types are wholly good or
bad in essence, because any type of culture can be useful based on the organisational goals.
They further state that the four cultures in their typology should be viewed as ideal types,
meaning that organisations are characterized by some combination of these four culture types
– although some types could be more dominant than the others. Thus, a particular
organisation need not be classified exclusively as having one type of culture, but can be
considered as containing elements from the four culture types, where one type may be more
dominant (Quinn and Spreitzer, 1991, Cameron and Freeman, 1991, Yeung et al., 1991). As
McDermott and Stock (1999) noted “as such, a high rating on one dimension (e.g. internal
orientation) does not exclude a high rating at the opposite end (e.g. external orientation)”.
Quinn (1988) explained this more clearly, arguing that “we want our organisations to be
adaptable and flexible, but we also want them to be stable and controlled. We want growth,
resource acquisition, and external support, but we also want positive information
management and formal communication. We want an emphasis on the value of human
resource but we also want an emphasis on planning and goal setting.” The implication here is
that given TQM’s characteristics, a mix of organisational culture types that is most
favourable to these characteristics is required in order to support TQM and its
implementation. A balance is required that meets the competing demands of change and
stability - one that will provide enough flexibility to accommodate innovation and growth but
won’t jeopardize stability, control, and order (Cameron and Quinn, 1999). Likewise,
potentially conflicting requirements produced by internal and external organisational
environment need to be balanced as well. Consequently, by employing a trade-off between
stability and flexibility and a trade-off between internal and external focus, organisation can
determine either to have only one of two entities, or determine the degree to which
organisations can have both (Denison et al., 2006).
Summarizing the discussion, thus organisations are unlikely to reflect only one culture
type but to be effective the adoption of some elements of each of the four cultural ideal types
is necessary (Zammuto and Krakower, 1991; Cameron and Quinn, 1998). Different cultures
may fit different organisations and their environments, and the desirability of a strong
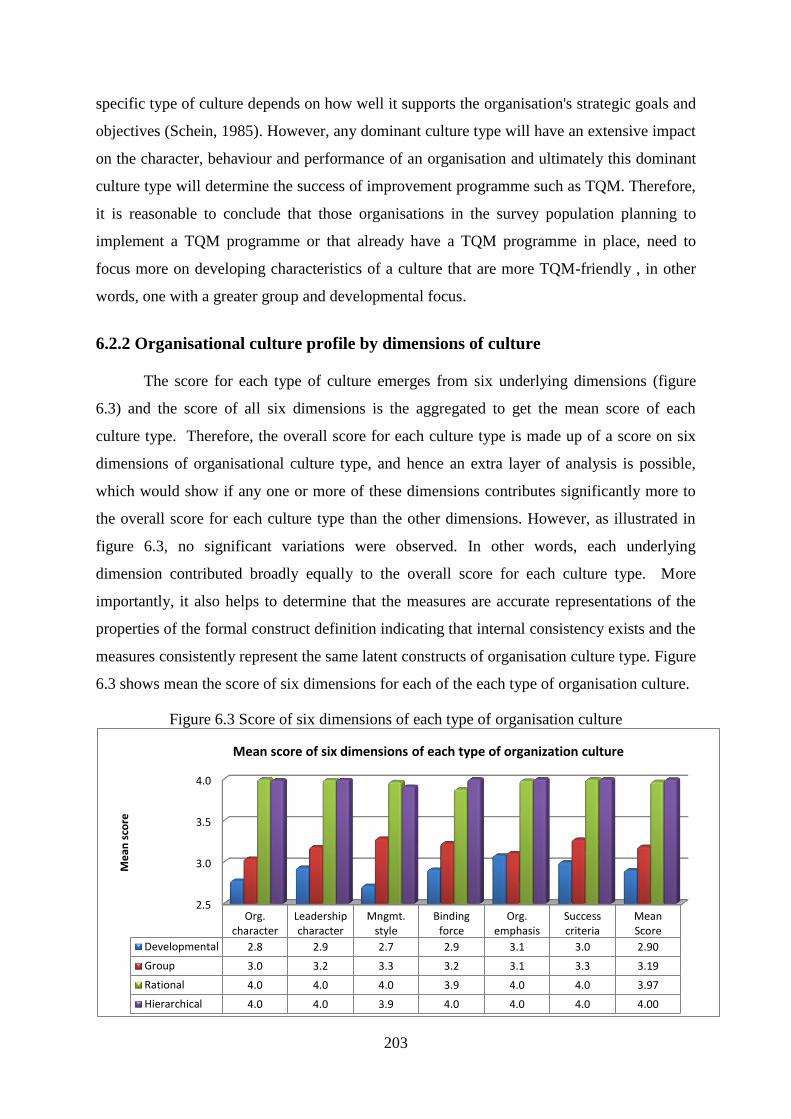
203
specific type of culture depends on how well it supports the organisation's strategic goals and
objectives (Schein, 1985). However, any dominant culture type will have an extensive impact
on the character, behaviour and performance of an organisation and ultimately this dominant
culture type will determine the success of improvement programme such as TQM. Therefore,
it is reasonable to conclude that those organisations in the survey population planning to
implement a TQM programme or that already have a TQM programme in place, need to
focus more on developing characteristics of a culture that are more TQM-friendly , in other
words, one with a greater group and developmental focus.
6.2.2 Organisational culture profile by dimensions of culture
The score for each type of culture emerges from six underlying dimensions (figure
6.3) and the score of all six dimensions is the aggregated to get the mean score of each
culture type. Therefore, the overall score for each culture type is made up of a score on six
dimensions of organisational culture type, and hence an extra layer of analysis is possible,
which would show if any one or more of these dimensions contributes significantly more to
the overall score for each culture type than the other dimensions. However, as illustrated in
figure 6.3, no significant variations were observed. In other words, each underlying
dimension contributed broadly equally to the overall score for each culture type. More
importantly, it also helps to determine that the measures are accurate representations of the
properties of the formal construct definition indicating that internal consistency exists and the
measures consistently represent the same latent constructs of organisation culture type. Figure
6.3 shows mean the score of six dimensions for each of the each type of organisation culture.
Figure 6.3 Score of six dimensions of each type of organisation culture
2.5
3.0
3.5
4.0
Org.character
Leadershipcharacter
Mngmt.style
Bindingforce
Org.emphasis
Successcriteria
MeanScore
Developmental 2.8 2.9 2.7 2.9 3.1 3.0 2.90
Group 3.0 3.2 3.3 3.2 3.1 3.3 3.19
Rational 4.0 4.0 4.0 3.9 4.0 4.0 3.97
Hierarchical 4.0 4.0 3.9 4.0 4.0 4.0 4.00
Me
an s
core
Mean score of six dimensions of each type of organization culture
204
6.3 TQM implementation barriers
This section discusses the TQM implementation barrier constructs and their individual
indicator results, with reference to previous studies on TQM implementation barriers.
Although the objective of this study of identifying significant TQM implementation barriers
is similar to other previous studies, a key difference lies in the demography of the respective
samples. This difference is used to make a comparison between organisations with different
demographic characteristics, that is, between organisations of developed countries such as
Europe and USA and organisations of developing countries such as Bahrain. Similarities and
contradictions with previous studies are discussed along with the relevance of the results for
future researchers and implications of results for TQM practitioners.
6.3.1 Profile of TQM implementation barrier constructs
In this section the results for the TQM implementation barrier constructs and their
constituent indicators are discussed. Table 5.7 in chapter 5 illustrates the mean, standard
deviation and total number of respondents for each TQM implementation barrier construct.
Based on the results given in table 5.7, TQM implementation barriers related to top
management have the highest score (4.3). Second highest is the score on employee barrier
and customer barriers (3.7). The score on information management barriers and planning
barriers was slightly lower (3.6). However, process management barriers have the lowest
score (2.2). A unique outcome from these results that seems to be new in TQM
implementation research is that barrier constructs having more human involvement (i.e.
leaders, employees and customers) have higher barrier score than those with less human
involvement (i.e. information, process and planning). Therefore, the results of this study also
substantiate the importance of the human dimension in quality management, highlighting the
need for a strong drive for the education and training of managers and employees in quality
management. Figure 6.4 below is constructed from table 5.7 in chapter 5 which illustrates the
overall score of TQM implementation barrier constructs.

205
Figure 6.4 Mean score on TQM implementation barriers
The Overall mean score of the constructs is 3.5, well above the middle value 3 on the
liker scale of 1 to 5, an indication of high overall score of barriers in the survey population
and that organisations in Bahrain are beset with all kinds of TQM implementation barriers.
In chapter 5, the score of each indicator of the six TQM barrier constructs was
presented in six tables (table 5.9 through table 5.14). Overall, the preceding brief analysis of
the individual barrier indicators (section 5.2.4) showed that each contributes virtually equally
to their respective barrier constructs. No single individual barrier indicator was significantly
more prevalent than the others making up the construct.
4.3
3.7 3.7 3.6 3.6
2.2
2.0
2.5
3.0
3.5
4.0
4.5
TopManagement
barriers
Employeesbarriers
Customerbarriers
InformationManagement
barriers
Planningbarriers
Processmanagement
barriers
Mean score on TQM implementation barriers
Mean
206
6.3.2 TQM implementation barrier constructs/constituent indicators
This section will discuss the results based on constructs of TQM implementation
barriers and their constituent indicators.
6.3.2.1 Top management barriers
In the top management barrier construct, the barrier indicator of “lack of top
management commitment and support to quality” has a very high score (4.3), revealing the
fact that any quality management system applied in Bahraini industries has minimal support
from top management. Researchers agree that the leadership and commitment of top
management is the driver of TQM (Powell, 1995; Black and Porter, 1996; Ahire et al., 1996;
Flynn et al., 1994; Samson and Terziovski, 1999). The importance of addressing this barrier
for TQM implementation is emphasized by many researchers such as Gobadian and Gallear
(1996); Flynn et al., (1994), Hellsten, (2000); Ahire,(1998); and Motwani, (2001). These
results should be a matter of concern for leaders of industries in survey population.
Commitment and support to quality by top management is a vital factor that is proved
to be important in TQM effectiveness (Soltani et al., 2006). Lack of commitment and support
to quality by top management is found a significant TQM implementation barrier in previous
studies such as Sebastianelli and Tamimi (2003), Salegna and Fazel (2000), Ngai and Cheng
(1997), Kifyah and Zain (2002), and Whalen and Rahim (1994). The significant high score of
this barrier in the present study is consistent with, and validates the results of previous
studies. Furthermore, some more recent studies have also identified the lack of top
management support to quality as significant barrier in TQM implementation process. These
studies include: Amaral and Sousa (2009); Bhat and Raj (2009); Angell and Corbett (2009);
Huq (2005); Rad (2004); McFadden et al. (2006); and Jun et al. (2004).
Similarly, the barrier indicator of lack of allocating resources for training is highly
prevalent in this study. This finding is supported by all studies mentioned above except
Salegna and Fazel (2000) who emphasized more on failures that involve the TQM
implementation process rather than lack of resources. The study by Salegna and Fazel (2000)
and Bhat and Raj (2009) also specifically mentioned the adverse role of excessive layers of
management in TQM implementation process. This study verifies the results of previous
studies that the barrier of lack of resources for training is a significant TQM implementation
barrier. This barrier has the highest score in the present study. It appears that in the Bahrain
207
sample, there exist obstacles to quality improvement i.e. with management, rather than the
works.
In the light of the evidence provided above, it is reasonable to argue that top
management is the primary TQM factor. The high level of existing barriers in implementing
this TQM factor in organisations in the survey population is a challenge for leaders of these
industries. It is difficult for managers of these companies to implement TQM practices
without top management devoting the necessary resources to the effort. Without commitment
from above, commitment that translates into tangible resources such as time and money, most
employees would find it impossible to carry out a TQM directive (Angell and Corbett 2009).
Top management needs to initiate management practices that lead to minimizing the barriers
in TQM implementation. The results of this study evidently show that barriers are emerging
from the existing management culture which is unfavourable to TQM implementation.
Leaders of the companies in survey population are encouraged to set existing management
culture as the starting point for building a quality improvement process based on TQM from
that baseline.
6.3.2.2 Employee barriers
According to the results in table 5.10 (section 5.2), all barrier indicators of employees
barrier construct have a relatively high score, and the mean score of all employee barrier
indicators was 3.7. Therefore, all indicators of the employee barrier construct are equally high
in companies of the survey population. These factors are thought to contribute significantly
toward the ineffectiveness of TQM implementation in the organisations sampled in this
study. Gauging from these findings, there is little doubt as to why the Bahraini worker’s
quality performance lags a significant way behind other countries (Ernst & Young 2009).
Organisations that wish to pursue TQM and be successful in its implementation need
to develop their employees accordingly by minimizing employee barriers. Employees need to
be trained in group discussion and communication techniques, the basic tools of quality and
process improvement, and problem identification/problem-solving skills. Employees need to
be empowered to implement quality improvement efforts, and, when successful, they need to
receive appropriate recognition for their achievements. Without such opportunities and a
supportive environment, employees might feel frustrated, thereby contributing to more
frequent turnover (Ngai and Cheng, 1997). Studies by Tamimi and Sebastianelli (1998) and

208
Salegna and Fazel (2000) also place human resource issues as the single most significant
contributor in assuring effective TQM implementation. It is reasonable to argue therefore,
that a focus on mobilizing (empowering and involving) employees is a second critical
requirement in Bahrain organisations, once the top management barriers have been
sufficiently addressed.
6.3.2.3 Customer barriers
According to results in table 5.11, customer satisfaction still has not been addressed
properly in the organisation's policy in the companies of survey population. In the customer
barrier construct, all four barrier indicators had similar scores (and mean score was 3.7). The
Results show that the companies in the survey population haven’t yet realized the importance
of customer focus in doing business. These companies are not measuring customer
satisfaction, not assessing the needs and expectations of customers enough, not taking
customer feedback enough and have insufficient contact with key customers.
Quality has travelled well beyond the dictum of meeting standards and conformance
to specifications. Meeting and or exceeding customer’s requirements and preferences has
become the norm. The new quality slogan of “delight the customer” has led to the belief that
customer satisfaction is the most important requirement for long term success and
sustainability of any organisation. Thus the basic rationale of TQM is valuing the customer
by understanding the basic customer needs and by maximizing customer satisfaction. A focus
on customer needs and expectations is identified as the core factor of TQM by many TQM
scholars (Dean and Bowen, 1994; Juran, 1995; Black and Porter, 1996; Ahire et al., 1996;
Evans and Lindsay, 1999; Samson and Terziovski, 1999; Soltani et al., 2003; Yang, 2003;
Flynn and Saladin, 2006; Yasin and Alavi, 2007). Total quality management is a philosophy
which aims to provide organisations with a template for success through customer
satisfaction. TQM has been described as the development of an organisational culture, which
is defined by, and supports, the constant attainment of customer satisfaction through an
integrated system of tools, techniques and training (Bounds et al., 1994).
It is clearly that Bahraini organisations need to implement TQM practices that satisfy
customers. This is likely to be dependent however, on their progress in first addressing the
top management and employee barriers that exist.
209
6.3.2.4 Planning barriers
According to table 5.12, in the planning barrier construct all barrier indicators have a
relatively high score. The mean score is 3.6 and the difference between the maximum and
minimum score is 0.10, showing consensus among the respondents on the severity of each
barrier indicator. This study has thus observed that planning has not been taken seriously by
leaders of companies in the survey population which should be a cause for apprehension for
these leaders of these industries.
Planning is a necessary stepping stone to accomplish must tasks. Strategic planning
provides the guidelines for the execution of TQM initiatives. Lack of planning a TQM
initiative is an important barrier of TQM success. Furthermore, organisations need to plan
their TQM initiatives according to changes in the environment and also emerging
technologies for example. Planning provides clarity of organisation objectives and a
formulated plan on board creates awareness among all stakeholders about quality initiatives
of the organisation and provides clarity of organisation policy about TQM programme.
Writers strongly emphasize the importance of strategic planning process based on total
quality (Deming, 1986; Ahire et al., 1996; Zairi, 1999; Sinclair and Zairi, 2001; Dayton,
2001; Oakland, 2003). Whalen and Rahim (1994) cited poor planning as number one barrier
in the implementation of TQM improvement activities. A 21 step TQM implementation
approach by Goetsch and Davis (1995) used in many research studies had three phases
(preparation, planning, and execution) and notably, 15/21 of these steps are related to
planning. Therefore, given planning’s centrality to providing the direction and guidance
upon which the organisations efforts to address the employee and customer barriers
effectively is likely to rest, it appears that one of managements priorities in Bahrain
organisations must be on critically evaluating and revising accordingly, the organisations
strategic plans to include an explicit focus on customer and quality goals.
6.3.2.5 Process management barriers
According to table 5.13 in chapter 5, results of individual barrier indicator of process
management barrier construct in the industries of survey population have a low mean score of
2.2 and furthermore the difference between the highest and lowest score of the indicators is
minimal (.08) reflecting consensus among population that process management barriers in
survey population are not prevalent. Therefore, all indicators of process management barrier

210
construct are equally and significantly low and can be a source of satisfaction for leaders of
companies.
A fundamental principle of TQM is that mistakes may be made by people, but most of
them are caused, or at least permitted, by faulty systems and processes. This means that the
root cause of such mistakes can be identified, eliminated, and prevented by changing the
process. Process management can have many bottlenecks such as delays, reviews, mistakes,
duplication, movement, processing inefficiencies, and resource inefficiencies. Lack of
standard procedures, long turn-around times and communication breakdowns can also
contribute to poor process management. Customer satisfaction is the ultimate goal of a TQM
initiative which is achieved by product/service quality that depends largely on the quality of
the processes. When organisations pay attention to their processes they are able to take proper
quality control in the key steps of the operations procedures to prevent defects (Yang, 2003).
The absence of process management barriers, and by implementation the presence of well
developed process, is something that can be built on where addressing the other barriers, and
also something that needs to be carefully preserved and not inadvertently undone.
6.3.2.6 Information management barriers
According to results in table 5.14, the individual barrier indictor results of the
information management barrier construct present high score on this construct have very
similar scores, with an overall mean score of 3.6. Organisations that wish to pursue TQM and
be successful in its implementation need to develop their communication techniques in order
to improve on the basic tools of quality and process improvement, and problem
identification/problem-solving skills. Employees need to be aware of quality improvement
efforts. Without such opportunities and a supportive environment, TQM may not flourish
(Ngai and Cheng, 1997). To gain competitive advantage, organisations should have the
capacity to collect new information and transfer it into action faster than a competitor (Singh,
2010). Information is an essential resource for setting and meeting management objectives,
and the role it plays within the organisation is of vital importance as it helps to build
knowledge and measure the overall performance of the organisation. For a company to
achieve successes in the quality management it needs a robust information system for
reporting the changes in key performance parameters, and in the shortest possible time.
Therefore, information system (IS) contributes greatly in the success of the quality
programme.

211
Decisions that are made based on accurate data are likely to produce better results
than decisions that are based on a hunch or intuition (Lai, 2003). For example, with data
based decisions, the needs and the desires of the customer are well known and as a result they
can be incorporated into the product or service design. This can greatly enhance customer
satisfaction in the product and or service and can improves the quality and efficiency of the
company itself.
6.4 Impact of organisational culture on TQM implementation barriers
In order to address research question 3 (measuring the impact of organisational
culture on TQM implementation barriers), hypotheses were developed on the basis of
relationships between independent constructs of organisational culture and dependent
constructs of TQM implementation barriers. Largely, the findings in this study show that
group culture which is believed to be an ideal culture for TQM implementation (Cameron and
Quinn, 1999) does help to decrease employee barriers, information barriers and customer
related barriers as was predicted but doesn’t help decrease top management barriers. Rational
culture does decrease top management barriers as predicted, but it doesn’t help decrease
employee and customer barriers, contrary to the hypothesized predictions. The results
confirm the prediction that hierarchical culture decreases planning and process management
barriers significantly. However, developmental culture also decreases employees and
customer barriers as predicted but not significantly. An examination of these mixed results is
provided in the following sections.
6.4.1 Impact of group culture on TQM implementation barriers
The data analysis shows that group culture decreases employee, customer and
information management barriers as hypothesised but doesn’t decrease top management
barriers as predicted. Therefore H1 is not supported while H2, H3, and H4 are supported.
H# Hypothesis statement Result
H1 Group culture decreases top management barriers Not supported
H2 Group culture decreases employee barriers Supported
H3 Group culture decreases customer barriers Supported
H4 Group culture decreases information barriers Supported
Table 6.1 Result of hypothesis test related to group culture
212
The literature review in chapter 2 suggested that group culture is the key factor in
decreasing TQM implementation barriers (e.g., Dellana and Hauser, 1999; Prajogo and
McDermott, 2005; Naor et al., 2008; and Zu et al., 2009). Dellana and Hausser (1997) argued
that less resistance (barriers) in TQM implementation may exist in flexibility-oriented
organisations having a dominant group culture. Group culture focuses on flexibility and
internal maintenance by emphasizing strong human relations, unity, and participation of
members (Zu et al., 2009). According to Denison and Speitzer (1991), human development is
the main emphasis of organisations with group culture. In the TQM literature these
characteristics of group culture are found to be important for implementing TQM by
decreasing overall TQM implementation barriers. In this study, the construct of group culture
was found to be a validated predictor variable to examine its relationship with TQM
implementation barrier constructs. The result of each hypothesis related to group culture is
discussed in the following sections.
6.4.1.1 Relationship of group culture and top management barrier construct (H1)
H1 Group culture decreases top management barriers - Not supported
In hypothesis H1, it was proposed that group culture decreases top management
barriers but while examining this relationship, contrary results were revealed. The result of
the SEM in chapter 5 (section 5.3.2.3) indicated a positive loading of the independent
variable of group culture construct on the dependent variable of top management barrier
construct (β= +.323, ρ<0.01, t= 5.918) which was contrary to the predicted direction.
Therefore, hypothesis H1 is not supported because the regression path is positive (+.323).
However, the prior literature suggests that group culture, having an internal and flexible
orientation would be associated with decreasing top management barriers.
The primary task of managers is to keep the workforce unified - thinking, moving,
and operating in one direction. The organisations with group culture are very personal places
and people are united like an extended family (Dension and Spreitzer, 1991), therefore group
culture is an ideal culture from the top management perspective. The study by Prajogo and
McDermott (2005) also concluded that group and developmental culture have a strong
correlation with the TQM principles of top management, customer focus, and people
management. Similarly, the TQM-culture model of Zu et al. (2009) shows that the group

213
culture was significantly related to the top management TQM factor. Specifically, the top
management support in terms of investing in training to help employees increase their
knowledge, skills and ability is considered to be facilitated by group culture. The significance
of this relationship is also supported by Naor et al. (2008). Dellana and Hauser (1999) used
TQM principles of the Baldrige criteria that include top management support as an
elementary factor. These authors concluded that less resistance to TQM implementation
should be encountered in organisations with group culture and developmental culture. The
resistance to TQM implementation generally occurs when top management doesn’t build
consensus through exchanging its vision with employees and fails to establish the
communications to create awareness of organisational goals for quality improvement and
disseminate TQM implementation progress to employees (Beer, 2003; Lee and Choi, 2006;
Kaynak, 2003). Accordingly, group culture, through its characteristics of open
communication, would be expected to help decrease the barrier of “lack of communicating
quality awareness within the organisation”.
The above mentioned studies present empirical evidence that prevalence of group
culture reduces top management barriers. However, many other studies that although not
having a specific focus on culture and TQM relationship, have nevertheless suggested a
logical relationship between group culture and top management barriers. For example, one of
the characteristics of group culture is that the leadership in this type of culture is supportive
and values employees’ ideas. As such, these characteristics would be expected to decrease the
top management barrier of lack of commitment and support to quality. As leadership in group
culture is participative and it encourages empowerment and teamwork, therefore, leaders
would be expected to actively support the quality programme and direct the needed
investment in training to help employees increase their knowledge, skills and ability (Beer,
2003). Therefore group culture would also be expected to help remove the common top
management barrier of inadequate resources for employee training. Similarly, when
employees are not involved in improvement projects, they feel detached from organisation
goals and ultimately, this negatively affects the employees' attitude, which, in turn, impacts
performance. In such cases, top management can help create a feeling of attachment of
employees to the goals of the organisation by teamwork, consensus and participation which
the characteristics of group culture (Cameron and Quinn, 1999).
According to Dension and Spreitzer (1991), in group culture, leaders are thought of as
mentors, coaches, and, perhaps, even as parent figures. Therefore, the main role of top
214
management in TQM implementation is creating a shared vision and unifying mindset of all
the members within the organisation in order to break down barriers between departments
(Prajogo and McDermott, 2005). The group culture values participation and openness and
thus would be expected to decreases communication barriers between top management and
employees, and through its participative structure reduce the undesirable effects of excessive
layers of management.
Theoretically, the studies mentioned above show a positive and strong relationship
between group culture and top management practices and hence inferentially, a negative
relationship between group culture and top management barriers, suggesting that group
culture will decrease top management barriers. However, a statistically significant
relationship in the predicted direction between group culture and top management barriers
was not found in the present study of Bahraini organisations. The reasons for this unexpected
finding are not immediately clear. However, one possible explanation may be that the
relatively high prevalence of hierarchical and rational culture (oriented towards centralisation
and control as illustrated in figure 6.1), might have limited the extent to which the presence of
group culture encourages top managers to engage, empower and communicate with
employees. This may even be to the extent that the top managers in the Bahraini firms
become uncomfortable when they observe too much of a flexible and dynamic internal
orientation (i.e. group culture) emerging, and may actually hold back on expending
empowerment and openness and thus inadvertently create rather than remove barriers to
effective TQM implementation.
6.4.1.2 Relationship of group culture and employee barrier construct (H2)
H2 Group culture decreases employee barriers - Supported
The result of SEM in chapter 5 (section 5.3.2.3) show that the independent predictor
variable of group culture was negatively and significantly related to the dependent variable of
employee barriers (β= -.316, P<0.01, t= 5.716) and regression path is negative (-.316). A
negative loading of group culture on the employee barrier construct is in line with the
predicted direction, therefore hypothesis H2 is supported.
The influence of the group culture on the TQM factor of employee focus has been
investigated by several researchers (e.g., Zu et al., 2009; Naor et al., 2008; Prajogo and

215
McDermott, 2005; and Dellana and Hauser, 1999). Largely, these studies highlighted the
significant impact that group culture can have on the employee factor. The results of these
studies thus inferentially support the argument that promoting group culture will help to
effectively decrease employee barriers. The study by Zu et al. (2009) established a significant
relationship between group culture and the TQM factor of employee focus. Zu et al. (2009)
stated that the TQM factor of employee focus is found to be supported by the group and
rational cultures whose core values are consistent with the application of organisational
development techniques such as investment in employee training and education, employee
involvement and participation, and the performance-based policy of rewards and recognition.
Similar result were reported by Prajogo and McDermott (2005), stating that there is a
significant relationship between group culture and employee focus. According to Naor
(2008), an organisational culture which supports a cordial and cohesive environment results
in higher level of trust which can ensure enthusiasm and willingness of the employees to
work together to meet the organisation’s goals. Naor (2008) further asserts that in a culture in
which there is value for the employees’ work, objective feedback, a cordial-cohesive
environment and high flexibility, employees have the tendency to stay with the organisation.
These attributes can also lead to lower employee absenteeism/turnover, lower levels of stress,
and higher product and service quality for the customers they serve. All these characteristics
of participation, trust, and a concern for human development are the core values of group
culture (Denison and Spreitzer, 1991; Cameron and Quinn, 1999; Denison and Neale, 2000),
and therefore by developing a group culture, organisations promote the TQM principle of
employee focus thus decreasing employee related barriers of TQM implementation.
The studies mentioned above provide empirical support for the relationship between
group culture and reducing employee barriers. In addition, many other studies that although
not having a specific focus on culture and TQM, have nevertheless also suggested a logical
relationship between group culture and reducing employee barriers. For example, Denison et
al. (2006) states when employees are empowered they have the authority, initiative, and
ability to manage their own work that creates a sense of ownership and responsibility toward
the organisation. Logically therefore, employee empowerment can be achieved through
prevalence of group culture, that would be expected to eventually decrease the TQM barrier
of ‘employees are not empowered to implement quality improvement’. In the supportive
environment of group culture, employees are not only encouraged to participate in continuous
improvement teams and are rewarded for their contribution to better quality, but also receive

216
the training and education to be successful in their jobs. In this context, the development of
human resources by empowering and engaging the employees helps organisations to be
effective and competitive (Buckingham and Coffman, 1999). Supporting this argument,
Denison and Spreitzer (1991) argue that group culture emphasizes employee education and
training because education and training can change values such as employees’ beliefs,
behaviour, and attitudes; and enhance employees’ abilities in carrying out their duties. In
order to meet varying business needs and stay competitive, organisations with group culture
persistently invest to develop the skills of the employees. This training is focused to increase
knowledge, skills and ability of employees and help them in their career development. These
characteristics of group culture would be expected to help decrease the TQM implementation
barriers of “employees not trained in quality improvement skills” and are supported by the
findings of this study.
Likewise, Quinn (1988) asserts that employees are the pool of experience, knowledge
and information and they want to share this knowledge and experience to feel that they are
making significant contributions in their workplaces. As the orientation of group culture is
open and participative in nature, therefore employees do have a feeling that they have at least
some contribution into decisions that will affect their work and hence feel attached to the
goals of the organisation. A key emphasis of group culture is on flexibility and internal
integration which in turn can create attachment, a sense of commitment, faith, and
involvement of each employee in the general and strategic issues of the organisation
(Denison and Spreitzer, 1991). The characteristic of group culture of a friendly place to work
can create an environment without fear and compulsion. Because employees are intrinsically
motivated to do a good job when working in such environment (Detert et al., 2000; Hackman
and Wageman, 1995), therefore the need for properly motivated employees for quality
improvement is realized by group culture.
Taylor and Wright (2003) infer that TQM programmes fail because of TQM
implementation barriers such as lack of involvement of employees in the TQM programme.
Deming (1986) also emphasized the importance of participation of employees in quality
programme. According to Juran (1995), TQM is the system of activities directed at achieving
empowered employees and delighted customers. Therefore, creating culture where employees
are valued and empowered leads to successful quality management implementation
(Westbrook and Utley, 1995). The group culture’s emphasis on employees’ involvement and
empowerment are consistent with and should facilitate the process of establishing the
217
organisational environment supporting employee involvement and empowerment for the
effective implementation of quality initiatives (Cameron and Quinn, 1999; Detert et al., 2000;
and Naor et al., 2008). Accordingly, group culture can help to motivate employees to work at
their full capacity by decreasing the employee barriers of lack of workforce participation,
lack of communication and lack of employee involvement in improvement projects.
Accordingly, in organisations having dominant group culture top management is
likely to persuade its employees to bring innovative ideas for organisational development and
participate in the decision making process. Employees feel that they are appreciated and
treated with respect. This strategy brings about a sense of belonging and employees feel they
are doing something for themselves (Cameron and Quinn, 1999). Organisations with group
culture stress the need for training of employees, employee involvement in decision-making,
rewarding employees for quality performance and communicating with them consistently in
order to create awareness of organisational goals for quality improvement (Kaynak, 2003;
Lee and Choi, 2006; Pande et al., 2002). Therefore the group culture would help decrease
employee barriers of lack of recognition for achievements in quality improvement, lack of
appropriate performance evaluation and reward system, and consequently, the lack of
employee satisfaction across the organisation.
TQM is a philosophy of change, and hence resistance to change by employees and
even management is not unexpected. Inadequate communications of the intended changes in
the organisation may result in resistance expressed through resentment about managements
approach, doubts and uncertainty, and fear that employees may lose their jobs (Huq, 2004).
The characteristics of group culture of establishing the communications to create awareness
of organisational goals for quality improvement (Flynn et al., 1994) would therefore be
expected to help decrease employee resistance to change barrier.
Effective implementation of TQM in an organisation demands building teamwork,
providing employees with appropriate training, involving them in decision-making and
rewarding them for quality performance (Dale, 2007). The literature supports the propositions
that group culture helps to address each of these elements. Based on this finding of the study,
it can be stated that group culture can play an important role in effective TQM since it has
been shown to have a direct and significant influence on decreasing employee barriers.

218
6.4.1.3 Relationship of group culture and customer barrier construct (H3)
H3 Group culture decreases customer barriers - Supported
Hypothesis H3 proposed that group culture decreases customer barriers. According to
the result of structural parameter estimates of the SEM model in chapter 5 (section 5.3.2.3)
the independent predictor variable of the group culture construct was negatively and
significantly related to the dependent variable of customer barrier construct (β= -.362,
P<0.01, t = 6.569) and regression path was negative (-.362). A negative loading of group
culture on the customer barrier construct is in line with the predicted direction, and therefore
hypothesis H3 is supported.
This finding is similar to the previous studies on the relationship of group culture and
the TQM factor of customer focus (Dellana and Hauser, 1999; Prajogo and McDermott,
2005; Naor et al., 2008). In a study of 194 Australian organisations, Prajogo and McDermott
(2005) found that group culture and customer focus had a relatively stronger correlation than
the other TQM practices examined in the same way. The study by Zu et al. (2009) couldn’t
establish any relationship between group culture and customer focus, however Naor et al.
(2008) found a significant relationship between both variables. The study by Dellana and
Hauser (1999) also found a significant relationship between the two variables. The results of
these empirical studies support and validate the results of this study.
The aforementioned studies demonstrate that there is empirical support that
prevalence of group culture reduces customer barriers. In addition to these empirical studies,
the wider extant literature provides plenty of anecdotal and evidence on the significance of
this relationship. Although, these studies do not have a specific focus on culture and TQM
relationship, they have suggested a logical relationship between group culture and reducing
customer barriers. For example, Jacobson and Aaker (1987) propose that market share will be
larger for the companies investing in quality improvement and hence providing quality
products to customers. Logically it is expected that TQM will attract more satisfied customers
(Kaynak, 2003). Because the satisfaction of customers is the key to organisation success,
therefore the entire organisation should focus on customers’ needs and expectations (Dean
and Bowen, 1994). To do so, organisations need to possess a high level of group culture in
order to be able to be flexible and to adapt to changing customer demands over time (Naor et
al., 2008).

219
Similarly, an effective customer feedback system and frequent contact with key
customers can provide value for customers by taking information from the external
environment into internal systems and analyzing it for informed decision making on customer
oriented policies (Denison, 2006). The assessment of customer needs, expectations and
satisfaction will enable an organisation to understand and react to their customers and
anticipate their future needs. In this context external feedback from customers is the ‘acid
test' for determining whether organisations are doing the right things (Zairi, 2000). Group
culture fosters these activities through its characteristics of open communication and better
contact with customers, creating an effective system to measure customer satisfaction and
ascertain customer needs and expectations. Such an environment promoted by group culture
can boost innovative and creative ideas for the ultimate benefit of customers.
As was argued by Deming (1986) (in chapter 3), the core objective of TQM is to
delight the customers. Therefore, identifying and determining what customers want is a
central concern in TQM (Hackman and Wageman, 1995). Many authors have considered the
lack of attention to customer requirements and feedback system as one of the very common
barriers facing organisations realising adoption of quality management system techniques
(Sebastianelli and Tamimi, 2003; Salegna and Fazel; and Jun et al., 2004). These customer
barriers can be effectively addressed by the presence of group culture because the
management style in the group culture is characterized by teamwork, consensus,
participation, open communication and empowering employees to deal with customers
(Yeung et al., 1991; Denison and Spreitzer, 1991; Prajogo and McDermott, 2005; Zu et al.,
2009). These characteristics of group culture facilitate identifying customer concerns through
open communication in order to seek feedback and measure customer satisfaction (Quinn and
Kimberly, 1984; Quinn, 1988; Denison, 1990; Cameron and Freeman, 1991). As the group
culture stresses commitment, cooperation and open communication, therefore it can result in
building strong relationships with customers (Denison and Spreitzer, 1991). Consequently it
can help to decrease TQM implementation barriers such as lack of an effective system to
measure customer satisfaction, lack of feedback system from customers, lack of assessment
of customers' needs and expectations and lack of close contact with key customers.
Furthermore, an emphasis on group culture has been suggested as enhancing the
involvement of customers in organisational activities (Naor et al., 2008). TQM is based on
the premise that customers (the internal and external) are the focus of all activities of an
organisation, and all improvements in quality must be directed toward customer satisfaction
220
(Ahire et al., 1995). According to Juran (1995), quality on one hand, could mean features of
products that should meet customer needs and thereby provide customer satisfaction.
Measuring customer preferences before and after product/service delivery; creating
partnerships with customers; and enhancing competitiveness by involving customers in
planning and design are all supported by group culture. Similarly, a participative management
style empowers employees to take any necessary action to ensure customer satisfaction (Rad,
2004). In quality management, it is essential to maintain close links with customers and
suppliers (Dean and Bowen, 1994; Hackman and Wageman, 1995).
The strength of relationship between group culture and reducing customer barriers
found in this study strongly reflects the degree to which Bahraini organisations could be
driven to satisfy their customers by taking steps to develop and enhance the prevalence of
group culture. The results for hypothesis H3 confirm the fact that the influence of group
culture on reducing customer barriers is significant. Based on the findings, it can be stated
that promoting and developing group culture traits can play an important role on the success
of TQM since it has a direct and significant influence on decreasing customer barriers.
6.4.1.4 Relationship of group culture and information barrier construct (H4)
H4 Group culture decreases information management barriers –Supported
This study found a significant negative relationship between the group culture
construct and information management barrier construct as was predicted. The results of the
SEM (section 5.3.2.3) show that the independent predictor variable of group culture construct
was negatively and significantly related to the dependent variable of information
management barrier construct (β= -.489, P<0.01, t= 8.406), with a negative regression path.
Therefore hypothesis H4 was supported.
This finding is in line with the results of previous studies that have addressed the
relationship of group culture and the TQM factor of information management. The study by
Prajogo and McDermott (2005) confirmed a positive relationship between group culture and
information management. Zu et al. (2009), in his study of US companies, also found that
group culture was a strong predictor of the TQM factor of information management. Dellana
and Hauser (1999) found that there was a strong relationship between group culture and the
221
Baldrige criteria relating to information management. Similar results were reported by Naor
et al. (2008).
Various other studies incorporating TQM factors and organisation culture have
highlighted the significance of this relationship, even though these studies were not designed
to measure the relationship. For example, Powell (1995) concluded that TQM practices had
to be implemented within a suitable environment (i.e. culture) that emphasized inter-
organisational communication so that individuals can liaise with other departments freely and
share and disseminate quality and performance information. Other researchers too have
emphasized that an appropriate organisational culture based on group values is necessity for
obtaining, storing and analyzing information (Buch and Rivers, 2002; Lagrosen, 2003; Lewis,
1996). Likewise, a focus on customers’ needs and expectations is a fundamental principle of
TQM and there should be a mechanism of information exchange to obtain the necessary
information for identifying customer requirements and feedback on the quality of
products/services (Flynn et al., 1995; Hackman and Wageman, 1995). When information
management barriers are addressed properly, it can help to create an effective system to
measure customer satisfaction through an effective information management system. Group
culture helps to foster these requirements through its characteristic of open communication.
According to Roger et al. (2008), effective TQM implementation can be achieved by
identifying quality problems and solving them comprehensively through the exchange of
ideas. Through its focus on participation and communication, group culture supports the
discussion of ideas. Furthermore, employees can be motivated to speed their efforts in
identifying and solving problems, and to take more responsibility for improvement projects
(Naor, 2008). This process in turn, can generate useful data on quality and performance that
can be used for further improvement. Gunasekaran (1999) found that a major enabler of
TQM implementation was communication between managers/supervisors and staff, and that
poor communication between departments was a real barrier to implementing TQM. Oakland
(1997), Nagi and Cheng (1997), Salegna and Fazel (2000) and Al-Zamany et al (2002) all
state that ineffective internal and external communication networks and lack of information
exchange in an organisation are significant barriers in the way of improving business.
The intent of information exchange in a group culture is to foster an environment
where individuals feel comfortable in discussing TQM related problems, so that information
and knowledge is shared freely (Stock et al., 2006). Group culture can therefore help to
decrease the barriers of poor inter-organisational communication and a lack of disseminating
222
quality and performance information. As observed by Kaynak (2003), Lee and Choi (2006)
and Schroeder et al. (2008), group culture can further enhance cooperation between
departments through teamwork to exchange ideas; enhance joint efforts of management and
employees in process management activities; quality problem identification and solving;
effective measurement of process and product performance; and project coordination.
Without a systematic method for discovering and identifying TQM related problems, TQM
implementation is generally doomed to failure (Naor et al., 2008). This systematic method
may include reporting TQM problems, open discussion about TQM problems and statistical
analysis of TQM implementation data. Group culture supports the development of these
characteristics through participation, involvement, empowerment and communication
(Cameron and Freeman, 1991). Therefore, group culture is highly likely to help to decrease
the information management barrier of lack of information on quality and performance.
Open communication fostered by the group culture is also expected to facilitate
liaison between people from different departments (Klein et al., 1998) and the timely sharing
of quality data throughout the ranks of the organisation. This can help decrease the
information management barrier of lack of disseminating quality and performance
information. Openness in group culture is consistent with the principle of management by
fact in quality management achieved through systematic quality data collection, reporting,
analysis and measurement in a problem-solving cycle (Hackman and Wageman, 1995).
Accordingly, this will help to remove information management barrier of lack of measuring
quality.
The result relating to hypothesis 4 confirms the fact that the influence of group culture
on information management barriers is significant. It can be stated that group culture plays an
important role in the success of TQM since it has a direct and significant influence on
decreasing information management barriers.
6.4.2 Impact of developmental culture on TQM implementation barrier
constructs
The data analysis showed that developmental culture decreases employee and
customer barriers but not significantly. Nevertheless the regression path was observed to be
in the predicted direction. However due to the lack of statistical significance both hypotheses
(H5 and H6) cannot be said to be fully supported.

223
H.No. Hypothesis statement Result
H5 Developmental culture decreases employee barriers Not Supported
H6 Developmental culture decreases customer barriers Not Supported
Table 6.2 Result of hypotheses test related to developmental culture
The results of each hypothesis related to developmental culture are discussed in
following sub sections.
6.4.2.1 Impact of developmental culture on employee barrier construct (H5)
H5 Developmental culture decreases employee barriers- Not supported
According to hypothesis H5, developed based on theory as discussed in chapter 2,
developmental culture should help to decrease employee barriers. The result of the SEM
model (section 5.3.2.3) shows that the independent predictor variable of developmental
culture was negatively but not significantly related to the dependent variable of employee
barriers (β= -.073, ρ=0.187, t= 1.318). However, the ρ-value which was >0.05 means that the
estimate has the significance below the critical t-value for a Type 1 error of 0.05. Therefore,
due to lack of statistical significance it is reasonable to propose that hypothesis H5 is not fully
supported.
This finding is similar to previous studies in terms of the direction of the path
estimates but the level of significance was higher in previous studies (Dellana and Hauser,
1999; Prajogo and McDermott, 2005; Naor et al., 2008; Zu et al., 2009). The SEM results are
in line with the predicted direction and support the argument in the literature that for
effectively decreasing employee barriers, the presence of a developmental culture is
supportive. Like group culture, developmental culture also emphasizes flexibility, but in this
case with more focus on the external environment (Cameron and Quinn, 1999). According to
Denison and Spreitzer (1991), the orientation of organisations with a developmental culture is
towards growth, resource acquisition, innovation, and continual adaptation to the external
environment; and such organisations are characterized as creative workplaces where people
are free to experiment and take risks. With visionary leadership and creative employees,
organisations with a developmental culture can realize rapid growth by producing unique and
original products/services targeting new markets (Denison and Spreitzer, 1991; Cameron and
Quinn, 1999; Denison and Neale, 2000). The main emphasis of developmental culture is on

224
decentralization, freedom of action, growth, innovation and creative problem solving
processes (Cameron and Quinn, 1999).
The studies mentioned above provide support for the relationship between
developmental culture and reducing employee barriers as do other studies in the wider TQM
literature. For example, Zammuto and Krakower (1991) assert that most workers are
inherently motivated to do a good job when working in an environment free of compulsion
and fear which is provided by the developmental culture by virtue of its characteristic of
freedom of action. This environment can create affection, a sense of obligation, trust, and
contribution of each employee in organisational issues. The freedom of action allows
employees to bring innovative ideas for organisational development and participate in
decision making processes (Cameron and Quinn, 1999). Therefore the developmental culture
would be expected to help remove TQM implementation barriers such as lack of employee
participation, empowerment, involvement and communication. It would also help to address
barriers of inappropriate performance evaluation and reward systems; insufficient teamwork
facilitators and team building techniques; and finally employees’ resistance to change.
Likewise, the entrepreneurial character of the developmental culture encourages
employees to try new things that promote innovation, acquiring new resources, prospecting
for opportunities, identifying unique or new products/services and becoming a product leader
and innovator (Cameron and Quinn, 1999). In such innovative organisations, there is a drive
with incentives for constant, continuous improvement and doing things better (Detert et al.,
2000). As these processes and products belong to an employee domain, developmental
culture therefore is genuinely associated with decreasing employee barriers.
Similarly, in order to be a product leader, organisations need more involvement and
teamwork, which require more responsibility and a greater level of employee skill and
knowledge than can be achieved through, formal and systematic training and education
(Oakland, 1997). Developmental culture gives high importance to employee training. Al-
Zamani et al. (2002) insist that quality training and education programme are the main
obstacles any organisation faces in the way of getting improvement and it is the
developmental culture oriented organisations that invest more in training programme.
Any training programme needs resources and the developmental culture tends to
focus on providing appropriate and necessary resources (Denison and Spreitzer, 1991). The
focus on innovation and adaptation also increases the allocation of organisational resources
225
for employee training so as to improve their knowledge and skills to meet the changing
requirements of customers (Yeung et al., 1991). Empowered, involved and well trained
employees, who in turn are more satisfied and less resistant to change (Cameron and Quinn,
1999), help decrease employee barriers in an organisation. Since the developmental culture is
oriented to looking for new resources and external support for growth (Denison and Spreitzer,
1991), it promotes a focus on adoption of new tools, technology and other improvement
approaches. Therefore, developmental culture will also help remove barriers such as lack of
skills, participation, involvement and empowerment of employees.
Theoretically, the studies mentioned above show a positive and strong relationship
between developmental culture and employee focus and hence inferentially, a negative
relationship between developmental culture and employee barriers, suggesting that
developmental culture will decrease employee barriers. A statistically significant relationship
in the predicted direction between developmental culture and employee barriers was not
found in the present study therefore this hypothesis cannot be fully supported in the survey of
Bahraini organisations. However, the regression path is negative which means that when
developmental culture goes up, employee barriers go down, showing a negative relationship
in accordance with the hypothesis. The reasons for this unexpected lack of significance are
not immediately clear. However, one possible explanation may be that developmental culture
has external focus and employees are internal to an organisation, therefore a relatively low
incidence of developmental culture in the survey population might have affected the results.
Secondly, the developmental culture is oriented to change and flexibility and strongly
supports employee empowerment in order to promote innovation and creativity. But, the high
prevalence of hierarchical and rational culture in Bahraini organisations (figure 6.1) might
have influenced them to resist empowering employees due to the centralization and control
orientation. Additionally, empowerment is a management concept of relatively recent origins,
and it may be that this concept hasn’t yet gained full appreciation by the leaders of Bahraini
organisations. TQM is still at an initial stage in many of the Bahraini organisations and it may
take some time to establish itself and change the perception of leaders. Another characteristic
of developmental culture is trying new products/services by taking risks, which may not be
encouraged by Bahraini managers due to the prevalence of the more mechanistic type of
culture (hierarchical and rational).
226
6.4.2.2 Impact of developmental culture on customer barrier construct (H6)
H6 Developmental culture decreases customer barriers – Not supported
The customer barrier construct in this study was represented by four constituent
variables, all closely related to customer satisfaction: customer needs and expectations;
effective customer feedback system; and frequent contact with key customers. According to
the theory in chapter 2, the characteristics of developmental culture were hypothesized to
help decrease the customer barriers. The results of the structural parameter estimates (SEM)
(section 5.3.2.3) show that the independent predictor variable of developmental culture was
negatively but not significantly related to the dependent variable of customer barriers (β= -
.030, ρ=0.557, t= .558). All the statistics were within acceptance threshold except the ρ-value
which was >0.05 which means that the estimate has significance below the critical t-value for
a Type 1 error of 0.05. Therefore, due to lack of statistical significance the hypothesis H6
cannot technically be fully supported.
The finding, despite the lack of significance, that developmental culture has a
negative relationship with customer barriers is in line with the predicted hypothesis and is
similar to the finding of previous studies, notably Dellana and Hauser (1999); Prajogo and
McDermott (2005); Naor et al. (2008) and Zu et al. (2010). In their Australian study Prajogo
and McDermott (2005) found that there was an influential relationship between
developmental culture and the TQM factor of customer focus. Developmental culture has an
external focus, and customers are outside the boundary of the organisation. Such a
relationship was also substantiated by Zu et al. (2009) in the US study. The study by Naor et
al. (2008) also supports the validity of this relationship.
The empirical studies mentioned above maintain the argument that the relationship
between developmental culture and customer barriers reduces the effects of customer barriers
on TQM implementation. Denison and Spreitzer (1991) argued that through its external
orientation, developmental culture supports organisations in acquiring real time customer
feedback and improving their ability to connect with key customers. This activity helps to
anticipate customers’ needs and implement creative solutions to customer needs or problems

227
(Cameron and Quinn, 1999). Customers are always looking for products/services of good
quality and large market share has been shown to go to those organisations who win the
loyalty and satisfaction of their customers (Dale, 2007). Increased contact with key customers
in turn provides better information about the market or greater brand loyalty, which in turn
can lead to a rise in sales and margins (Tena, 2003). A focus on customers’ needs and
expectations is one of the fundamental principles of TQM and TQM seeks to ensure
information exchange to get customer feedback on the quality of products/services (Dellana
and Hauser, 1999). Developmental culture emphasizes adapting to changing customer
demands over time and thus it would be expected to help to remove the TQM barrier of lack
of feedback system from customers/stakeholders.
In a developmental culture, an external focus on customer desires is highly evident
(Choi and Behling, 1997). Organisations with a developmental orientation tend to secure
long-term quality programme success because they treat future customers as important as
their current customers (Dellana and Hauser, 1999). Organisations with a developmental
culture direct internal efforts toward their customers through an increasingly external focus
(Chang and Wiebe 1996). This orientation creates a drive for companies to invest in quality
improvement to achieve market advantage (Zu et al., 2009). Efforts in quality improvement
are expected to bring in more satisfied customers with greater loyalty and increased sales
(Kaynak, 2003). This is a major characteristic of developmental culture, which is heavily
focused on customer satisfaction and development of new markets, and thus reducing TQM
implementation barriers such as lack of effective systems to measure customer satisfaction
and assess customers' needs and expectations and lack of, effective customer feedback system
and close contact with key customers.
In order to meet customer and market needs, organisations need to possess a high
level of developmental culture in order to be flexible and to adapt to changing customer
demands over time (Naor et al., 2008). Such kind of external adaptation and development of
flexibility and diversity can stimulate employees’ interests in pursuing and understanding
customer needs and markets (Denison and Spreitzer, 1991). Such organisations tend to build
a strong relationship with customers because customer focus is well developed throughout the
organisation, supported by effective customer satisfaction tracking (Al-khalifa and
Aspinwall, 2000). The developmental culture type, which emphasizes a more external focus
characterized by change and risk-taking, would therefore be expected to decrease customer
barriers such as lack of effective system to measure customer satisfaction, assessment of
228
customers' needs and expectations, effective customer feedback system and close contact
with key customers, consequently improving the customer focus of the organisation. Finally,
it is important to note that the employee barriers and customer barriers are very closely
related. Organisations interact with their customers through employees. Therefore logically, a
motivated employee will help to ensure a satisfied customer. When employee barriers are
addressed properly, customer satisfaction could also be enhanced.
Theoretically, the studies mentioned above show a positive and strong relationship
between developmental culture and customer focus and hence inferentially, a negative
relationship between developmental culture and customer barriers, suggesting that
developmental culture will decrease customer barriers. However, a statistically significant
relationship in the predicted direction between developmental culture and customer barriers
was not found in present study, therefore this hypothesis was not supported in the survey of
Bahraini organisations. A detailed examination of this unexpected finding is left for future
research, but again some possible explanations can be explored. One possible explanation
may be that the relatively low score of developmental culture in survey population (the
lowest act of the four culture types) (figure 6.1) might have affected the significance of the
relationship. The relatively low score on developmental culture shows lack of flexibility and
change in favour of stability and a control orientation of managers of Bahraini organisations.
Additionally, the majority of Bahraini industries are supporting functional products that
satisfy basic needs. There are very few industries in Bahrain that develop highly innovative
products such as cutting edge technology. Hence there is no fierce competition in industries
for `revolutionizing’ products. Therefore, emphasis on developmental culture that promotes
innovation and creativity is low. Similarly, due to this probable lack of focus on high end
competitiveness, the need to be responsive to customer needs may be low. These realities
appear to have affected the results of hypothesis 6. However, it is important to remember that
the regression path is negative, which means that when developmental culture goes up,
customer barriers go down; showing negative relationship in accordance with the prediction,
implying that investing in nurturing a developmental culture is a highly worthwhile
investment in pursuit of helping to remove TQM customer barriers.
6.4.3 Impact of rational culture on TQM implementation barriers
The data analysis shows that rational culture decreases top management barriers but
has no effect on employee barriers and customer barriers. Therefore hypothesis H7 is

229
supported but hypotheses H8 and H9 are not supported. The model shows that the rational
culture is negatively related to the top management barrier construct as predicted and
positively related to the employee and customer barrier constructs, contrary to the original
prediction. The results for each hypothesis related to rational culture are discussed in turn
below.
H.No. Hypothesis statement Result
H7 Rational culture decreases top management barriers Supported
H8 Rational culture decreases employee barriers Not supported
H9 Rational culture decreases customer barriers Not supported
Table 6.3 result of hypothesis test related to rational culture
6.4.3.1 Impact of rational culture on top management barrier construct (H7)
H7 – Rational culture will decrease top management barriers - Supported
According to hypothesis H7, the characteristics of rational culture are expected to
help decrease top management barriers. The results of the structural parameter estimates
show that the independent predictor variable of rational culture was negatively and
significantly related to the dependent variable of top management barriers (β= -.159, ρ<0.01,
t= 3.053), and regression path is negative (-.159). Therefore, hypothesis H7 is supported.
This finding is supported by previous empirical studies that have examined the
relation between characteristics of rational culture and the TQM factor of top management
commitment (Dellana and Hauser, 1999; Prajogo and McDermott, 2005; Naor et al., 2008;
Zu et al., 2009). The rational culture is goal-oriented and associated with more of a hard-
hitting and challenging leadership approach. Leaders are expected to build up comprehensible
objectives and forceful strategies to realize procedures and processes that can lead to a high
level of productivity and profitability (Cameron and Quinn, 1999). Leaders are required to
provide guidance and control to realize the corporate vision and goals that demand a high
level of commitment. The rational culture therefore would be expected to help remove the
barrier of lack of commitment by top management to achieve quality goals by taking
responsibility for quality (Denison and Spreitzer, 1991).
The empirical studies mentioned above provide evidence that the relationship between
rational culture and reducing top management barriers is significant. Furthermore, many
other studies that, although not having a specific focus on culture and TQM, have also
230
suggested logical relationships between rational culture and top management barriers. For
example, according to Denison and Spreitzer (1991), organisations with a rational culture are
very result oriented places - a major concern is with getting the job done through competitive
and achievement oriented people. There is an emphasis on achievement and goal
accomplishment by hitting stretch targets and winning in the marketplace, therefore, the
management style is characterized by high demands and achievement. Researchers agree that
the leadership and commitment of top management is a key driver of TQM (Powell, 1995;
Black and Porter, 1996; Ahire et al., 1996; Flynn et al., 1994; Samson and Terziovski, 1999).
The goals and objectives of quality improvement can only be set and achieved when
managers recognize the importance of quality improvement for the success of their
organisation and this understanding would develop through quality awareness (Huq, 2005;
Rad, 2004; McFadden et al., 2006; Jun et al., 2004). The focus of rational culture to achieve
competitiveness through quality improvement can help decrease the lack of quality awareness
barrier within the organisation.
The top management barrier of lack of allocation of adequate resources for
employees' training by managers is evaluated as a critical factor hindering TQM
implementation in several previous studies (Minjoon, 2004; Kotey and Slade, 2005; Thomas
and Armstrong, 2004; Tannock et al., 2002; Soltani et al, 2008; Walsh et al., 2002). Since the
major concern of leadership in rational culture is getting the job done through competitive
and achievement oriented people, leadership in a rational culture focuses on quality
improvement by allocating adequate resources for employees' training (Denison and
Spreitzer, 1991).
As stated before, many layers of management in any organisation can create
communication gaps and are a potential cause of delayed decision processes and decision
making which can result in missing opportunities. The importance of addressing this barrier
for TQM implementation is emphasized by many researchers such as Ghobadian and Gallear
(1996); Flynn et al. (1994), Hellsten (2000); Ahire(1998); and Motwani (2001). The result-
oriented nature of rational culture demands an instantaneous and swift management style
breaking through the barrier of many layers of management (Soltani et al., 2006). Top
management demonstrates its commitment to the achievement of the quality goals by taking
responsibility for quality and being evaluated based on quality performance (Anderson et al.,
1994; Flynn et al., 1994; Kaynak, 2003). As leaders in the goal-oriented rational culture are
demanding in achieving competitiveness, they tend to develop clear objectives and aggressive
231
strategies to drive practices and behaviours leading to productivity and profitability (Cameron
and Quinn, 1999; Denison and Spreitzer, 1991).
The result for hypothesis 7 confirms that the influence of rational culture on top
management barriers is significant and in the predicted direction. Based on the findings, it is
clear that rational culture can play an important role in the success of TQM since it has a
direct and significant influence on decreasing top management barriers. The findings
therefore indicate that through the mechanisms discussed above, Bahraini organisations
should be able to enhance their existing TQM implementation strategies or approach by
safeguarding, for the short term of least, their rational culture orientation.
6.4.3.2 Impact of rational culture on employee barrier construct (H8)
H8 – Rational culture will decrease employee barriers - not supported
The SEM results indicated a positive loading of rational culture on the employee
barrier construct (β= +.048, ρ=0.368, t= 0.901). This was contrary to the predicted direction.
Therefore, hypothesis H8 is not supported because the regression path is positive (+.048), and
moreover the estimate of standardized regression weight is also not significant. This means
that based on the Bahraini sample context, a high score on rational culture in an organisation
won’t help to decrease employee barriers.
The prior literature suggested that rational culture, having an external orientation
would be associated with decreasing employee barriers. However, the finding in this study is
contrary to those in previous studies (Naor et al., 2008; Prajogo and McDermott, 2005) on
culture and quality management. These studies showed a positive and strong relationship
between rational culture and the TQM employee factor and therefore suggested an
inferentially negative relationship of rational culture with employee barriers. One
fundamental principle of TQM is an employee focus (Black and Porter, 1996; Sousa and
Voss, 2002; Kaynak, 2003; Nair, 2006; Flynn and Saladin, 2006). The results of previous
studies support the argument in the literature that in order to effectively decrease employee
barriers organisations require an environment with specific cultural characteristics that
include those associated with the rational culture type. Organisations with a prevalent rational
culture are result oriented places, people are very competitive and achievement oriented.
These characteristics of organisational culture are related to employee barriers.
232
Rational culture regards incentives as an integral tool to motivate the workforce to
pursue better performance and achieve organisational goals (Naor, 2008). Such incentives
and rewards delivered by management are used to increase employee participation in
continuous improvement and to enhance employees’ ownership in their jobs and quality
improvement activities (Naor, 2008). Therefore, rational culture would be expected to help
remove TQM implementation barrier of lack of strong motivation of employees through
performance based reward policies. Employees need to be empowered to implement quality
improvement efforts, and, when successful, they need to receive appropriate recognition for
their achievements. Without such opportunities and a supportive environment, employees
might feel frustrated, thereby contributing to more frequent turnover (Ngai and Cheng, 1997).
The lack of recognition for achievements in quality improvement is reported as a significant
barrier in the literature (Ngai and Cheng, 1997; and Amaral and Sousa 2009). A critical lack
of recognition of employees for achievements in quality improvement affects morale and
motivation. Therefore, rational culture would help remove TQM implementation barrier of
employees and teams are not recognized for achievements in quality improvement.
TQM uses compensation policies including incentives for group performance, quality-
based incentives and compensation based on breadth of skills (Flynn et al., 1995; Henderson
and Evans, 2000). Compensation of executives for the achievement of TQM goals and
rewards is given based on the outcomes of their improvement projects that they are
accountable for (Henderson and Evans, 2000). Such incentives and rewards delivered by
management are used to increase employee participation in continuous improvement and to
enhance employees’ ownership in their jobs and quality improvement activities (Ahire et al.,
1996; Naor et al., 2008). These performance-contingent compensation policies are
compatible with the strategies characterizing the rational culture, which regard incentives as
an integral tool used to motivate employees to pursue better performance and achieve
organisational goals (Naor et al., 2008).
The implementation of any quality programme means more involvement and
empowerment, which require more responsibility and a greater level of skill and knowledge
by the employees. The control-oriented characteristic of rational culture doesn’t promote such
level of empowerment and involvement of employees, but instead provides training for
employees through formal and systematic training and mechanisms of education. Depending
on the needs of a particular organisation, training and education should cover the entire
workforce as part of an ongoing process and more attention should be given to management

233
techniques and quality management issues. By focusing on training, rational culture was
expected to help decrease the TQM implementation barriers of lack of employees training in
quality improvement skills and lack of employee training in group discussion and
communication techniques.
If employees are not satisfied with their job, there will be frequent cases of turnover.
The lack of satisfaction can occur due to multiple factors such as inappropriate performance
evaluation and reward system (Sebastianelli and Tamimi, 2003; Salegna and Fazel, 2000);
lack of empowerment and participation (Ngai and Cheng, 1997; Amaral and Sousa 2009; and
Angell and Corbett 2009); low motivation (Salegna and Fazel, 2000); poor work
environment; and or lack of incentives (McFadden et al., 2006). According to Amar and Zain
(2002), TQM programme are often viewed with scepticism, and are destined to fail if they do
not get the full support of the entire work force. Organisations that score highly on items such
as “employees are resistant to change” and “employee's satisfaction across the organisation is
low” most likely have leaders who have failed at communicating their commitment to quality
in concrete ways. In rational culture, the leaders are demanding, and emphasize productivity,
performance and goal achievement as one of the primary motivating factors (Cameron and
Quinn, 1999). These characteristics of rational culture would be expected to help decrease
employee barriers such as “employee's satisfaction across the organisation is low” and
“employees are resistant to change”.
In change management, the attitude of employees towards quality is seen to be one of
potentially the greatest barriers in many organisations. It has been reported that it is very
difficult to change the mindset of the employees with regards to quality (Oakland, 2003).
Employees believe that quality is a needless task and added cost, and hence could not accept
it as an integral part of the job. Rational culture has the potential to ensure the change
management by virtue of its results-oriented characteristic. Therefore, rational culture would
be expected to help remove TQM implementation barrier of employees tend to be resistant to
changes.
Theoretically, the studies mentioned above show a positive and strong relationship
between rational culture and employee focus and hence inferentially, a negative relationship
between rational culture and employee barriers, suggesting that rational culture will decrease
employee barriers. This hypothesis was not supported in the survey of Bahraini organisations.
Despite a careful re-examination of the literature the reasons for this unexpected finding are
not immediately clear and future research is needed to explore possible explanations.

234
6.4.3.3 Impact of rational culture on customer barriers (H9)
H9 – Rational culture will decrease customer barriers - Not supported
According to hypothesis H9, the characteristics of rational culture were expected to
help decrease customer barriers. However a positive loading of rational culture on the
customer barriers construct (β= +.110, ρ<0.05, t= 2.079) was contrary to the predicted
direction, and therefore hypothesis H9 is not supported.
The findings of this study are therefore not in line with findings of previous studies
(Dellana and Hauser, 1999; Prajogo and McDermott, 2005; Zu et al., 2010) which suggest that
there is a strong relationship between rational culture and decreasing customer barriers. The
prior literature suggests that rational culture, having external and control orientations would
be associated with reducing customer barriers.
The empirical studies mentioned above provide evidence that the relationship between
rational culture and customer barriers is significant. Many studies in the wider TQM
literature, in addition to those already mentioned above have suggested a logical relationship
between rational culture and customer barriers (Cameron and Quinn, 1999, Mohrman et al.,
1995, Bowersox et al., 2007). Rational culture’s external orientation emphasizes customer
focus. In the context of TQM, Cameron and Quinn (1999) suggest that the rational culture
orientation would enable external partnerships and measuring customer preferences, and thus
rational culture orientation would be likely to decrease customer barriers. The results of this
study don’t support this proposition and therefore a future research in this area is deemed
necessary.
Cameron and Quinn (1999) suggest that the creation of partnerships with customers
(and suppliers) in a TQM environment is highly compatible with the rational culture.
Organisations emphasizing the rational culture pursue productivity, profit and impact
supported by the measurement of customer preferences (Denison and Spreitzer, 1991). The
focus of rational culture on customers supports the organisations to work closely with their
customers to understand their needs and expectations so as to better position their products
and services in the market (Flynn et al., 1994). More direct contact of organisational
members, including line workers, to customers can motivate continuous improvement efforts
(Mohrman et al., 1995). Similarly, when rational culture is present, organisations seek
opportunities to collaborate with key customers through for example, strategic partnerships

235
(Bowersox et al., 2007). Achieving the improvements necessary to gain competitive
advantage requires effectively integrating with customers (Kaynak and Hartley, 2008; Naor et
al., 2008). Hence, top management needs to establish close contact with key customers to
achieve desired quality objective.
The focus of rational culture on the external market/resources would be expected to
help develop close relationships with customers that would help remove the TQM
implementation barriers of lack of joint planning with customers, lack of strong motivation of
customers and lack of customer focus. Building close contacts with customers is aimed to
provide managers and employees a better understanding of customer needs and expectations
in order to assess current quality level, control quality conformance, and set goals for future
improvement (Flynn et al., 1994; Hackman and Wageman, 1995).
Theoretically, the studies mentioned above show a positive and strong relationship
between rational culture and customer focus and hence inferentially, a negative relationship
between rational culture and employee barriers would be expected, suggesting that rational
culture will decrease employee barriers. A statistically significant relationship in the
predicted direction between rational culture and employee barriers was not found in the
present study therefore this hypothesis was not supported in the survey of Bahraini
organisations. The reasons for this unexpected finding are not immediately clear but there
may be some possible explanation for this result. The rational culture is distinguished by its
major characteristics of the goal achievement and profitability. The profitability is largely an
outcome of customer satisfaction which is achieved through an effective system to measure
customer satisfaction, assessment of customer needs and expectations through customer
feedback and keeping contact with key customers. The relatively high score on customer
barriers with the Bahraini sample indicates that such a system is not effectively present in
Bahraini organisation which may be neutralizing the focus of rational culture on customers.
Another possible explanation may be that Bahraini organisations actually place too much
emphasis on bottom line profit (because of dominant rational culture) and therefore follow
the strategies that meet the short term goals at the expense of establishing long term goals of
customer relationship. In doing so, Bahraini organisations lose focus on customers. Future
research is needed to explore possible explanations.

236
6.4.4 Impact of hierarchical culture on TQM implementation barriers
The data analysis shows that hierarchical culture decreases planning barriers and process
management barriers. Therefore both hypotheses are supported.
H.No. Hypothesis statement Result
H10 Hierarchical culture decreases planning barriers Supported
H11 Hierarchical culture decreases process barriers Supported
Table 6.4 results of hypothesis test related to hierarchical culture
6.4.4.1 Impact of hierarchical culture on planning barriers (H10)
H10 – Hierarchical culture will decrease planning barriers - Supported
The results of structural parameter estimates of the SEM model (section 5.3.2.3,
figure 5.7 and table 5.18) show that the independent predictor variable of hierarchical culture
is found to be negatively related to the dependent variable of planning barriers (β= -.086,
ρ<.001, t= 7.895) and the regression path is negative (-.086). Therefore, hypothesis H10 is
supported. This finding is consistent with findings of previous studies (Dellana and Hauser,
1999; Prajogo and McDermott, 2005), although it is worth noting that the study by Zu et al.
(2009) didn’t find such a relationship. Cameron and Quinn (1999) stated that the main
characteristics of hierarchical culture are control, centralization, routinisation, formalization,
structure, stability, continuity, order and predictable performance outcomes. Therefore,
organisations with a hierarchical culture are run more by rules and regulations with a focus
on control and stability that would be achieved through stable processes, predictable
workloads and scheduled production (for example, supported by statistical process control)
and thus high efficiency (Naor, 2008). The hierarchical culture points to more fixed
organisational structures with formal rules, close control, clear lines of decision-making
authority and a mechanism for accountability, therefore departments in hierarchical culture
tend to be working in harmony using formalized problem-solving approaches, clear step-by
step instructions, prescribed tools and laid down procedures (Cameron and Freeman, 1991;
Cameron and Quinn, 1999; Denison and Spreitzer, 1991). Hence, hierarchical culture is very
conducive for institutionalizing new approaches; and introducing new tools and techniques
for performance excellence.
Due to centralized control in the hierarchical culture, there is a level of stability that
ensures security of employment and steadiness in relationships with customers that, in turn
237
ensures smooth scheduling in accordance with customer driven plans (Denison and Spreitzer,
1991). The outcome of these characteristics is efficient production and dependable delivery to
customers. The hierarchical culture tends to use strategies of standardized rules and
procedures. Correspondingly, TQM planning practices also require the use of the formalized
approach to plan and conduct a project with clear steps, instruction and tools prescribed at
each step of the procedure. Schroeder et al. (2008) suggested that from the perspective of the
organisational routines theory, problem solving can follow predicable planned steps.
Therefore, planning activities can truly flourish in a hierarchical culture.
The belief underlying the hierarchical culture is that individuals and departments will
abide by organisational plans and polices when formally stated and enforced through rules
and regulations (Quinn and Kimberly, 1984). Organisations emphasizing the hierarchical
culture are characterized by a formalized and structured place to work where procedures
govern what people do (Cameron and Quinn, 1999). In such organisations, employees will
feel comfortable about complying with the formal steps of the planning procedure and they
will be more willing to follow the rigorous steps and use the prescribed tools to plan well
(Denison and Spreitzer, 1991). Thus, the concern for predictability, uniformity and formality
of rules and procedures inherent in the hierarchical culture is expected to facilitate
organisations to put systemic planning procedures into effect. Therefore, the hierarchical
culture can help to decrease planning barriers such as strategic plans not being customer
driven, organisation's strategic plans not including quality goals and lack of specific ways of
institutionalizing new approaches / tools / techniques.
The results of this empirical study confirm the fact that the influence of hierarchical
culture on decreasing planning barriers is significant. Based on the findings, it can be stated
that hierarchical culture can play an important role on the success of TQM since it has a
direct and significant influence on decreasing planning barriers. Bahraini organisations
should therefore be mindful not to inadvertently compromise the value of hierarchical culture
in removing TQM barriers by, for example de-emphasising it in their effort to develop a
greater component of group or developmental culture.
6.4.4.2 Impact of hierarchical culture on process management barriers (H11)
H11 – Hierarchical culture will decrease process management barriers - Supported
According to hypothesis H11 the characteristics of hierarchical culture are expected to
help decrease process management barriers. The results of the SEM (section 5.3.2.3, figure
238
5.7 and table 5.18) show that the independent predictor variable of hierarchical culture is
negatively related to the dependent variable of process management barriers (β= -.215,
ρ<.001, t= 3.301), and the regression path is negative (-.215), supporting hypotheses 11. This
study found that hierarchical culture had the highest score in its survey population and was
significantly related with process management barriers. It is worth noting that the culture and
barrier profile results of the Bahrain survey population show hierarchical culture as the highest
scoring culture type and process management barriers as the lowest scoring barriers, inferring
that a dominant hierarchical culture has already helped to decrease process management
barriers in the survey population.
The finding for hypotheses 11 is consistent with the findings of previous studies such
as (Dellana and Hauser, 1999; Prajogo and McDermott, 2005). It is generally accepted that
organisations can improve quality of product/service through good process management that
would result in less scrap and rework, less production cost and even less price for consumer
(Walsh et al. 2002). The bottom-line results of this practice would be improved quality
performance and higher efficiency and productivity, and in turn better financial and market
performance, higher customer satisfaction, and competitive advantage (Kaynak, 2003).
Hierarchical culture values these bottom-line results and thus would help decrease many
TQM implementation barriers associated with inefficient process management.
Organisations with hierarchical culture are run by rules and regulations with a focus
on control and stability, achieved through stability of processes (Dension and Spreitzer 1991).
Predictable workloads and, scheduled production can increase efficiency (Naor, 2008).
Stability, continuity and order help to ensure predictable performance outcomes. The
hierarchical culture has fixed organisational structure, therefore departments and people work
in a unified manner following formal rules, close control, clear lines of decision-making
authority and a mechanism for accountability (Dension and Spreitzer 1991). There are clear
step-by step instructions, prescribed tools and laid down procedures. Quality management
systems in such organisations tend to be all inclusive and quality initiatives include all
organisational functions/departments. Therefore, hierarchical culture would capitalize on
process control and help remove the TQM implementation barrier of lack of a comprehensive
quality programme and also treating quality as a separate initiative (not everyone's
responsibility).
The hierarchical culture is characterized by uniformity, internal efficiency, and a close
adherence to rules and regulations (McDermott and Stock, 1999). To achieve a high quality
239
level, it is important to have an organisational environment valuing the hierarchical culture in
order to support the use of tools in process control and improvement (Cameron and Quinn,
1999). Process management in TQM focuses on improving internal process stability (or
reducing process variability) through, for example preventive maintenance, production
schedules, and statistical process control (Flynn et al., 1994, 1995; Kaynak, 2003). As the
hierarchical culture pursues efficiency, stability and error detection and measurement, these
process management techniques are more likely to be implemented and maintained in the
organisation (Dension and Spreitzer 1991). Therefore, the hierarchical culture will decrease
process barriers such as lack of a comprehensive quality programme.
The results of this empirical study confirm the fact that hierarchical cultures influence
on reducing process barriers is significant. Based on the findings, it can be concluded that
hierarchical culture plays an important role on the success of TQM since it has a direct and
significant influence on decreasing process barriers. Similarly to what was argued in the
previous sections it is important that Bahraini organisations do not lose sight of the
importance of maintaining the presence of hierarchical culture as they go about planning and
developing their TQM implementation approach.
6.5 Summary of discussion
The study findings points toward the fact that most of the organisations in Bahrain are
not typified by a single cultural type, but have a tendency to be influenced mainly by a mix of
hierarchical and rational characteristics. It indicates that the focus of the organisations in the
survey population is on stability (hierarchical culture) and performance/profitability (rational
culture). This tendency is not desirable, because theoretically the cultural profile that supports
TQM implementation should have a dominant group culture that focuses on human
development and a dominant developmental culture that focuses on customer satisfaction.
In order to measure the impact of organisational culture on TQM implementation
barriers), hypotheses were developed on the basis of relationships between independent
constructs of organisational culture and dependent constructs of TQM implementation
barriers. Largely, the findings in this study show that group culture which is believed to be an
ideal culture for TQM implementation helps to decrease employees barriers, information
barriers and customer related barriers as predicted but doesn’t help decrease top management
barriers.. Rational culture decreases top management barriers as predicted but it doesn’t help
decrease employee and customer barriers, contrary to the hypothesized prediction. The results

240
confirm the predictive power of hierarchical culture in decreasing planning and process
management barriers significantly. Developmental culture also decreases employees and
customer barriers as predicted but not significantly.
The empirical results of this study reveal that different culture types influence
different constructs of TQM implementation barriers. The model shows that the group culture
is significantly related to 3 of the 6 TQM implementation barrier constructs. This finding
confirms the importance of group culture for quality management as suggested in prior
studies (Naor et al., 2008; Prajogo and McDermott, 2005). The results show that the
developmental culture is not significantly related to the TQM implementation barriers related
to customers and employees. The rational culture was found to have a significant effect on 1
of the 3 hypothesised TQM barrier constructs. The rational culture is the second most
prevalent culture in this study and this culture is quite dominant. However, only 1 out of 3
hypotheses is supported. A focus on task achievement is observed as common theme of
management style in this study. The empirical results reflect that this culture will help to
decrease top management barriers but have opposite effect on employee and customer
barriers. Although understanding the customer and developing close relationships with them
are key strategies for gaining competitive advantage and ingrained in the rational culture the
study found no significant relationship with reducing customer barriers.
The hierarchical culture has significant links to reducing process management and
planning barrier in this study but no such links were found in previous studies. This is
therefore a very important contribution of this study. For example, Cameron and Freeman
(1991) found that the hierarchical culture was not related to any measures of organisational
effectiveness in US higher education institutions. Also, Yeung et al. (1991) and Quinn and
Spreitzer (1991) found that those organisations that overemphasized the hierarchical culture
were the worst performers and their employees reported a low quality of work life. However,
the results of this study showed that hierarchical culture has the highest score in survey
population and is significantly related with process management barriers and planning
barriers.
In the context of the survey population, a lack of skilled employees and training has
been previously identified as a key challenge to the economy of Bahrain (D&B, 2008). A
better trained and motivated workforce is considered an urgent need for the sustainable
development of the economy of Bahrain. The result of this study infer that this objective can
be achieved by addressing employees barriers through granting empowerment to employee to
241
apply quality improvement efforts; employee involvement in improvement projects;
providing training in quality improvement skills, and training in group discussion and
communication techniques; recognizing employees for achievements in quality improvement;
and following an appropriate performance evaluation and reward system. Such TQM
practices are consistent with the dimensions of group culture. Promoting the characteristics of
group culture in the target population may thus significantly reduce employee barriers in the
implementation of the above TQM practices.
In this study five out of eleven hypotheses are either not or not fully supported. It
should be remembered that if a hypothesis is not supported, it should not be considered as
absolute scientific proof that prediction is wrong (Jaynes, 2003). Rejecting a hypothesis is
also very useful, informative and worth knowing because often, data that initially may seem
to be inconsistent with a theory may in fact lead to new important predictions (Royall, 1997).
In this study, the real world data did not fully agree with some of the hypothesized
predictions indicating that the implications of theory were not totally supported by the facts in
this study’s context. Nevertheless, overall the majority of predicted relationships were
supported. Whatever the reason for rejecting a hypothesis, it triggers a need for further
inquiry and testing. Whether a hypothesis is supported or rejected, the best course of action in
academic research is to test it again and again with different settings.

242
Chapter Seven: Conclusion
7.1 Introduction
In this chapter, the author briefly summarises the findings of the research. Issues that
emerge from the main findings of the study are presented. The research implications are
discussed from theoretical and practical perspectives. First, the theoretical contributions of
the thesis, in terms of the gap in the TQM implementation knowledge domain that has been
addressed are discussed. Second, the practical/managerial implications of the study’s findings
are described. This is followed by a discussion of the methodological and theoretical
limitations of the research. Finally, some possible directions for future research are
recommended.
7.2 Main outcomes of study
This research was partly inspired by the objective of the government of Bahrain to
shift from an economy built on oil wealth, to a productive, globally competitive economy
through its economic Vision 2030 programme. In order to transform Bahrain’s economic
offering to a multi-industry global contender, the country needs to produce high quality
products/services. In its Vision 2030 programme, Bahrain has identified the need for
extensive quality and cultural improvement that can be supported by the appropriate use of
tools such as TQM (http://www.bahrainedb.com/economic-vision.aspx). Furthermore,
although much research has been undertaken in the area of TQM, relatively little research has
explicitly and systematically examined the influence of organisational culture on key aspects
of the TQM implementation process. In particular, despite widespread acknowledgement of
the importance of culture in TQM, and widespread acknowledgement of the existence of
barriers to the implementation of TQM, the literature to date indicates that there is no
systematic study that has specifically investigated the relationship between organisational
culture and TQM implementation barriers. This thesis, therefore, has the central theme of
examining characteristics of organisational culture that would help overcome TQM
implementation barriers and consequently help in developing an improved understanding of
factors affecting TQM implementation. This in turn would help in informing the development
of improved models of TQM implementation that can be used by practitioners with a view to
helping them to implement successful and sustainable TQM management approaches. The
study has empirically examined evidence on the influence of organisational culture on TQM
implementation barriers to better understand how different culture types are likely to affect
TQM implementation.

243
Accordingly, based on a thorough review of TQM literature, a framework was
developed that describes proposed relationships between organisational culture and TQM
implementation barriers. This framework incorporated four independent variables of
organisational culture (group culture, developmental culture, rational culture, and hierarchical
culture) and six dependent variables of TQM implementation barrier constructs (top
management barriers, employee barriers, customer barriers, planning barriers, information
management barriers, and process management barriers). Following the findings of Prajogo
and McDermott (2005), this study positions organisational culture as an antecedent of TQM
implementation in an organisation, and thus assumes that TQM implementation barriers are
largely the consequences of the type of existing culture. The implication of this stance on
directions for future research is discussed in section 7.4.
The study applied a quantitative method with a positivist approach in which an online
survey questionnaire was used to obtain quantitative data to test the stated hypotheses. The
data for this study was obtained from service and manufacturing industries in Bahrain. The
sample consisted of 325 usable responses. The SEM (Structural Equation Modelling)
technique was used to test the hypothesised relationships using analysis of moment structure
(AMOS) software. SPSSTM
15.0 was used to analyse demographic statistics. The main
conclusion of this study is summarized in section 7.4 by answering each research question
raised in chapter one of this thesis. But before bringing up the conclusion, it would be
appropriate to mention a few limitations of this study to ensure that the value and importance
of the drawn conclusion is not compromised because of these limitations.
7.3 Limitations of the study
This research has a few methodological limitations:
1. One is the possibility of self-reporting bias. Ahire and Golhar (1996) point out that “when
one collects data from managers about their own organisations, and specifically about
managerial issues with which they are closely associated, there is a potential for self-
reporting bias.” To help counteract any such bias, it has been suggested that multiple
responses from each organisation can be obtained. In this study, because the target
respondents were quality practitioners, top managers and leaders of organisations who are
very few in each organisation, the identification of multiple respondents at such a level in
each organisation was difficult to guarantee in the Bahrain sample. However, using the
perceptions of single respondent from each organisation is a justified approach, as this

244
approach is highly common in high impact research (e.g. Zu et al., 2009 and Prajogo and
McDermott, 2005).
2. Self-reported data has also been associated with social desirability bias. In some
situations, the respondent may be tempted to give a socially desirable response to a
survey question rather than expressing what is really happening in the organisation.
Alreck and Settle (1995) state that “when personal preferences, opinions, or behavior
deviate from what’s socially prescribed, respondents are very prone to report what’s
socially acceptable, rather than the true answers.” Some of cultural and barrier questions
had this potential weakness and it may be argued that they were therefore prone to such
bias. Also, when self-reported data is taken on one occasion only, concerns over common
method bias influencing the recorded responses may arise (Hair et al, 2009).
Nevertheless, the author took steps to mitigate against this happening, notably by
clarifying this possibility in the survey instructions to reduce this bias. Furthermore, each
question was a constituent of the larger construct that was to be aggregated in the
analysis, and thus a specific response on a specific question was not used to draw any
inferences. Therefore, the potential problem of “social desirability” was further
moderated. It should also be noted that cross-section studies appear to remain one of the
most prevalent and respected methodological approaches in TQM and more widely in
operations management research.
3. The author tried to maintain a reasonable length of survey questionnaire but due to the
complex nature of the questions on TQM implementations barrier and cultural profile
questions based on CVF framework, the length of the survey questionnaire was larger
than desirable. However, the online administration of survey had the option to save the
answers and continue and complete the survey at a later time. This would compensate the
potentially strenuous affect of a long questionnaire on the respondents.
4. Although the results of this study are useful points of departure for other organisations
globally, the results can’t be fully generalized to other countries around the globe because
culture is unpredictable and varies from place to place. Schwartz (1994) and Hofstede
(1991) strongly argue that it is crucial to measure the cultural values of the particular
sample being studied and not to rely on reported values for other samples, even if they are
for the same cultural area or grouping. Similarly, the result of TQM implementation
barriers found in the survey population can’t be generalized to other places/regions. In
this context, the results are more suggestive for countries beyond Bahrain than
conclusive, but will act as valuable groundwork for later research in the TQM
245
implementation domain. Therefore, an empirical investigation is required to identify the
type of culture and barriers existing in other industries where future study would take
place. However, the validated and empirically tested framework, along with the survey
instrument may be used anywhere, conveniently.
5. A further limitation is the cross-sectional design of the study, collecting data at a single
point in time. Future researchers are encouraged to consider longitudinal designs which
can establish the effect of culture on implementation barriers over time.
Despite the limitations discussed above, the study achieved its objectives, and its overall aim
of empirically examining evidence on the impact of cultural characteristics on TQM
implementation barriers to better understand their influence towards the effective and
comprehensive implementation of TQM.
7.4 Conclusion
The conclusions drawn from this study are firstly presented in relation to each of the research
questions raised in chapter one of this study:
Research Question 1. What are the types of existing organisational culture in the
industries of Bahrain?
From the culture perspective, the findings of this study indicate the existence of the
mechanistic-type culture within Bahraini organisations, represented by the hierarchical and
rational culture. The mean score of both hierarchical and rational cultures in the survey
population indicates their prevalence which, in turn, reflects a strong hold of culture that,
according to the literature (Dellana and Hausser, 1999; Cameron and Quinn, 1998) is not in
line with what may be considered to be an ‘ideal’ TQM culture. TQM, according to the
literature, primarily needs a changing, adaptable, and organic character to flourish but
companies in the survey population showed an orientation more towards a stable, predictable,
and mechanistic character. Previous research suggests that those cultures which are
characterized by flexibility (group and developmental) rather than control (hierarchical and
rational) are most likely to support the implementation of TQM effective. This cultural
profile in the survey population appears partly unfavourable for TQM interventions because
of the dominant existence of rational and hierarchical culture types.
However, some characteristics of hierarchical culture such as routinisation,
formalization and step-by-step task procedures and processes are supported in the literature to

246
obtain the requisite degree of stability, continuity and order. The literature also indicates that
such characteristics of hierarchical culture are also needed in TQM implementation. For
example, in order to maintain stability and order, Deming (1986) and many other TQM
scholars emphasized to establish clear standards for employees work and methods to achieve
those standards. Supporting the need of routinisation and formalization, Feigenbaum (1991)
stressed that employees should clearly know their duties and responsibilities. Similarly, there
is convincing evidence in literature that many successful organisations in developed and
developing countries have more focus on the characteristics of rational culture such as task
accomplishment, goal achievement, efficiency, productivity and profitability, rather than
characteristics of group culture such as employee empowerment, employee participation and
human resource development (Zu et al. (2009) in the USA; Prajogo and McDermott (2005) in
Australia; and Alkhalifa and Aspinwall (2000) in the Middle East). Since evidence in the
literature suggests that many organisations in developed countries such as the USA and
Australia that have a dominant rational culture also have successful TQM programme,
therefore it is reasonable to imply that rational culture also supports TQM.
While acknowledging the prevalence of hierarchical and rational culture types, the
findings of this study substantiate the idea of the concurrent coexistence of organic and
mechanistic types of culture in Bahraini organisations. Such contradictory combination of
cultures is consistent with the findings of previous studies on the composition of
organisational culture (Buenger et al., 1996; Kalliath et al., 1999; Zammuto and Krakower,
1991). In the context of combinations of cultures as found in this study, the previous research
on organisational culture suggests that organisations are unlikely to reflect only one culture
type and that to be effective, the adoption of some elements of each of the four ideal culture
types (group, developmental, rational and hierarchical) is necessary. Therefore, a favourable
mix of characteristics of organisational culture is desired, that not only meets the competing
demands of change and stability but also provides enough flexibility to accommodate
innovation and growth (Prajogo and McDermott, 2005). Nevertheless, the dominant culture
will have an extensive impact on the character, behaviour and performance of an organisation
and ultimately this dominant culture is likely to be a major determinant of the success of
improvement programme such as TQM (Prajogo and McDermott (2005).

247
Research Question 2. What are the significant TQM implementation barriers in the
industries of Bahrain?
Lack of understanding and not addressing TQM implementation barriers is considered
a prime cause of failures of TQM (Ngai and Cheng, 1997; Sebastianelli and Tamimi, 2003;
Jun et al., 2004; and Bhat and Raj, 2009). One of the inherent characteristics of TQM is that it
takes considerable time to mature and bring results. If TQM implementation barriers are not
identified before implementation then considerable resources can be wasted during the
implementation process. This study found that TQM implementation barriers are prevalent in
companies in Bahrain. It is important for organisations in Bahrain to understand the presence
of these barriers both before and during TQM implementation, such that where possible,
steps can be taken to address them. The study found that the TQM implementation barrier
related constructs of top management, employees, customers, information management and
planning had a relatively high score in Bahraini companies, while process management
barriers had a much lower score. It is interesting to note that the three high scoring barrier
constructs were those more associated with human involvement (i.e. leaders, employees and
customers), while those arguably more concerned with the organisational infrastructure and
practices had lower scores (i.e. information, and planning had slightly lower scores and
process management barriers had the lowest score). The results of this study therefore also
substantiate the importance of the human dimension in quality management, and it is
reasonable to conclude that they therefore highlight the need for a strong drive for the
education and training of managers and employees in quality management.
Research Question 3. What is the relationship between organisational culture and TQM
implementation barriers, based on the culture profile and barriers that exist?
The study also reveals a disparity in the effects of culture types on the TQM
implementation barriers. The study found that group culture helps decrease employees
barriers, information barriers and customer related barriers significantly but it doesn’t help
decrease top management barriers. On the other hand, rational culture helps decrease top
management barriers as predicted but it doesn’t help decrease employee and customer
barriers, contrary to the hypothesized prediction. The results confirm that hierarchical culture
helps to decrease planning and process management barriers significantly. Developmental
culture also helps to decrease employee and customer barriers as predicted, but not
significantly.
248
The findings substantiate the importance of progressively building a cultural
environment that will decrease barriers to TQM implementation in order to support the
comprehensive implementation of various TQM practices and hence increase the possibility
of success with quality management initiatives. The different practices are driven by and
reflect multiple dimensions of organisational culture (Prajogo and McDermott, 2005). As
recognized in the literature (e.g., Cameron and Freeman, 1991; Quinn and Spreitzer, 1991;
Smart and St. John, 1996; Wilkins and Ouchi, 1983; Yeung et al., 1991), the unique
advantage of different culture types indicates that an emphasis on one single culture type is
not the best approach for overall organisational effectiveness. The results of this study
suggest that in order to seek maximum benefits from implementing multiple TQM practices,
it is important to develop not only flexibility and people-oriented culture values (i.e., the
group and developmental culture) but also control and external oriented values (i.e., the
rational and hierarchical culture).
This study is based on the argument that it is the organisational culture that will
impact TQM Implementation barriers. The findings of this study also suggest that
organisation culture has a significant impact on TQM implementation barriers. For example,
group culture significantly relates to the three constructs of TQM implementation barriers i.e.
barrier constructs of employees, customers and information management. This is followed by
hierarchical culture that relates to two barrier constructs i.e. process management and
planning barrier constructs. Rational culture constructs relates to one but the most important
barrier construct of top management barriers. However, developmental culture doesn’t relate
to any hypothesized barrier construct significantly.
The findings suggest that the group, hierarchical and rational culture correlate at fairly
similar degrees with TQM implementation barrier variables but developmental culture
correlates less strongly. These finding verify the findings of few previous studies that have
attempted to examine the culture-TQM relationship, such as those by Chang and Wiebe
(1996), Zeitz et al. (1997) and Dellana and Hauser (1999) who always place organizational
culture as the antecedent of TQM practices. Therefore, based on the empirical findings of this
research, the causal direction between Culture and TQM can be concluded by stating that it is
the organizational culture that will determine the results of TQM implementation rather than
the TQM implementation bringing about cultural change. This statement is supported by
many previous researchers (Maull et al., 2001; McNabb and Sepic, 1995; Westbrook and
Utley, 1995).

249
7.5Contributions of the study
In this section, the research implications are discussed, from both the theoretical and
practical perspectives (section 7.3.1 and 7.3.2). Firstly though, three overarching
contributions are presented:
First and foremost this study adds to the existing knowledge on TQM and its
implementation as it is the first study, both in a western and non-western context that has
explicitly and empirically examined the influence of organisational culture on TQM
implementation barriers. Thus, the findings of this research provide for a deeper and richer
understanding of the factors affecting the implementation of TQM.
Secondly, given that the theoretical model was based on literature developed mainly
in western contexts (such as the U.S., Europe and Japan), the test of the theoretical model in
the context of Bahraini firms has also provided a good opportunity for the researcher to
evaluate the applicability of culture/TQM barrier theory in a different, non-western national
context.
Thirdly, this study has also developed and initially validated a scale to measure TQM
barriers based on the synthesis of prior work that can be used by practitioners and researchers
in their effort to advance the theory and practice of the TQM approach.
7.5.1 Specific theoretical and methodological implications
1. Although it was not the intention of this research to develop a model (or revised model)
of TQM implementation, this study has contributed a new dimension to our
understanding of factors affecting the implementation of TQM. It thus provides future
researchers with a wider and deeper understanding of these factors that can inform the
development of more effective and empirically grounded models for TQM
implementation that explicitly take account of organisational culture and TQM
implementation barriers.
2. The findings indicate that organisational culture can have a positive effect on TQM
implementation by helping to decrease the prevalence of the very commonly observed
types of TQM barriers. Three of the four culture types (group, rational and hierarchical
culture), in the Bahrain context, have been shown to have the capacity to have such an
effect. This finding substantiates the importance of an explicit consideration of
organisational culture in TQM implementation research. Furthermore, each of the six
barrier constructs has been shown to be associated with a culture orientation that helps to
250
remove it. As such, it is reasonable to argue that it is important that future research work
relating to specific elements of TQM such as leadership, employee focus, customer focus,
information management, strategic planning and process management, takes into account
and is informed by the corresponding organisational culture connection.
3. Despite the global perception of the TQM concept, its worldwide reach and its use by
many quality and excellence awards, there was found to be hardly any research attempts
to study TQM implementation issues in the context of developing countries. In addition to
that, there was a lack of theoretical frameworks that would deal with the TQM failure
issues in developing countries. The work in this thesis has made a new contribution to the
field of TQM implementation with a focus on supporting TQM’s effective
implementation in developing countries. This study recognized the need to address TQM
implementation in developing countries through examining the relationship between
organisational culture and TQM implementation barriers in Bahrain. Such an attempt is
believed to provide a better knowledge and a wider vision for implementing TQM
successfully in developing countries, for ‘local’ organisations as well as for multinational
organisations that operate in this part of the world.
4. The findings provide evidence of the need for managing the multidimensional elements of
TQM implementation barriers through corresponding characteristics of organisational
culture. The methodology used in this study is believed to enable practitioners to assess
the readiness of the organisation's culture to embrace a formal TQM approach. It provides
baseline measures of the extent of TQM implementation barriers that can be used to track
obstructions in TQM implementations. The survey instrument measures the distinct
dimensions of both culture and TQM implementation barriers. This allows the
practitioners to target those features that require attention, thus enabling them to more
effectively deploy the resources available to them.
5. The research identified types of organisational culture that exist in Bahraini industries and
explored the characteristics of each type of culture in the context of TQM implementation
using an established and validated CVF framework for organisational culture.
Revalidation and testing the usefulness of the CVF framework in the context of Bahraini
industries is also a contribution.
6. This study also identified TQM implementation barriers that exist in Bahraini industries
and it is the first study to do so, thus providing future researchers investigating TQM in a
GCC context with an empirical platform. It is expected that this research will provide a

251
much needed impetus for further research on TQM implementation and barriers in the
GCC context.
7. The design and the conduct of study that included the development of a survey
questionnaire for identifying significant TQM implementation barriers is a valuable
foundation for later research. During the literature review, it was found that there was a
lack of a good diagnostic questionnaire in the literature on TQM implementation barriers
that could be easily administered. Therefore a systematic methodology was adopted in
this study for deriving the commonly cited significant TQM implementation barriers from
the literature and validating them through structured interviews.
8. Largely, previous surveys in the GCC region have been paper based or email based. The
survey questionnaire in this study was administered online via a web-based survey. The
use of online survey for fielding the survey questionnaire has proved very successful,
hence validating the utility of web-based surveys for future researchers. This may
encourage future researchers on using online survey based approaches which are fast,
easy, economical, and reliable.
9. Finally the Structured Equation Modelling (SEM) in Amos 16 was used to measure
structural relationships between constructs of organisational culture and TQM
implementation barriers. Amos can present a model in an intuitive graphical interface to
show hypothesized relationships among variables and SEM in Amos empirically
examines a theoretical model by combining both measurement model and structural
model in one analysis. Because it takes information about measurement into account
while testing the structural model, therefore, the design of the structural model emerging
from the measurement model results in a more precise measurement of dependence
relationships between constructs.
7.5.2 Specific practical/managerial implications
1. The findings of the study substantiate the argument in the literature that organisations
seeking to improve their fortunes through a TQM approach need to work with culture
(Schein, 1985; Chang and Wiebe, 1996; Zeitz et al., 1997; Dellana and Hauser, 1999;
Prajogo and McDermott, 2005; Naor et al., 2008; Zu et al., 2009). Extending this, the
finding that culture can help to address the removal of TQM implementation barriers
leads to the conclusion that assessing the culture profile of the organisation is an

252
extremely worthwhile, if not crucial step, that organisations should take as early in their
TQM journey as possible.
2. For Bahraini managers tasked with the introduction or rejuvenation of TQM specifically
(and possibly managers in other GCC countries), this study augments and extends the
existing understanding of TQM implementation factors that has predominantly been
derived in the western context, thus providing a directly relevant foundation on which to
build their own understanding of how to approach TQM.
3. It can be concluded from the findings that in the Bahraini context, group culture is the
most dominant of the four culture types in terms of helping to remove barriers to TQM
implementation. Furthermore, the findings also indicate that group culture has this effect
even when it is not the most prevalent type of culture in the organisation, in other words,
when other culture types are actually more dominant. In this sense, the results of this
study strongly support the findings of previous studies (Chang and Wiebe, 1996;, Zeitz et
al., 1997; Dellana and Hauser, 1999; Alkhalifa and Aspinwall, 2000; Prajogo and
McDermott, 2005; and Zu et al. 2010) that argue for group culture as a mainstay of
facilitating effective TQM implementation.
4. In the Bahrain context, the next most dominant culture type for helping to remove TQM
barriers is hierarchical culture, which was shown to have the capacity to help decrease
two types of TQM barrier constructs. This finding is perhaps even more salient,
particularly when considered in conjunction with the finding that developmental culture
was not shown to help remove TQM barriers, since it demonstrates that the tendency in
the literature to focus primarily on group and developmental culture attributes as
facilitators of TQM implementation may be misplaced and needs to be re-evaluated. This
study counters that argument, suggesting that the more mechanistic culture types,
particularly hierarchical, have a role to play. Consequently, Bahraini managers should
embrace the existence of hierarchical culture when developing their quality management
and TQM ethos, and not necessarily seek to reduce or sideline it, as might be the case in
western based TQM interventions.
5. The findings suggest that any efforts that can be made to increase the presence of group
culture and hierarchical culture prior to commencing the formal implementation of TQM
would be highly beneficial. Alternatively, the findings indicate that such efforts would be
highly beneficial as part of the ongoing implementation, or as part of a rejuvenation of
TQM efforts should a loss of momentum occur during TQM implementation as has been

253
reported in the literature as a common occurrence as implementation progresses and
matures (Oakland, 2004).
6. The findings indicated that the removal of top management barriers in the Bahraini
organisations is underpinned by rational culture. The leaders in rational culture believe in
competitive market leadership and profitability. In order to win in the marketplace and
outpace competition, they need quality of products/services. Therefore, they hire
competitive and achievement oriented people, provide them with continual training, and
achieve their goals through hard driving and aggressive strategy. Hence, the leaders are
highly committed; provide resources for training; communicate quality awareness directly
with employees by cutting management layers; and set goals and objectives for quality
improvement. Therefore, rational culture adequately addresses most of the top
management barriers and should be promoted to decrease top management barrier in
TQM implementation. Therefore this finding would be very helpful for the leaders in
Bahraini organisations, which need to familiarize themselves with the characteristics of
rational culture and its impact on TQM implementation.
7. The removal of employee barriers, customer barriers and information barriers in the
Bahraini organisations is underpinned by group culture. Organisations with group culture
believe in the development of human resources, teamwork, employee commitment, and
concern for people. Hence group culture decreases employee barriers. Similarly, the
characteristics of loyalty and mutual trust in group culture decrease customer barriers and
the characteristics of communication, openness, and participation in group culture
decrease information barriers. Such information would be very supportive for the leaders
in Bahraini organisations, specifically when they identify characteristics of organisational
culture and make themselves acquainted with these characteristics of culture.
8. The removal of planning barriers and process management barriers in the Bahraini
organisations is underpinned by hierarchical culture. In hierarchical organisations, control
and efficient operations are ensured by proper planning, coordinating and organizing.
Efficiency is achieved through planning and smooth scheduling resulting in low-cost
production. Therefore, planning barriers are decreased in organisations with hierarchical
culture. Hierarchical organisations are controlled and structured places with formal
procedures, rules and policies that give predictable outcomes, permanence and stability.
Hence, process management barriers are decreased. This kind of information would be
very convenient in practice for the leaders of Bahraini organisations when evaluating and
improving their planning approaches.

254
9. The results, overall, indicate that the removal of TQM barriers is dependent on both the
more people oriented culture type (represented here by group culture) and the more
mechanistic culture type (represented here by hierarchical and rational culture).
10. Given the specific culture mix that has shown to exist in Bahraini organisations, and the
specific ways in which the different types of culture support decreasing the existing TQM
barriers, a number of recommendations for Bahraini organisations on implementing TQM
as per the vision 2030 programme has endorsed, can be put forward:
a. Firstly, identifying and understanding the organisational culture is necessary before
TQM implementation as there is a clear indication of a positive relationship in the
literature stating that an appropriate culture is vital to the success of TQM.
b. Secondly, the literature indicates that many organisations do an excellent job of
committing to total quality by implementing the TQM practices but neglect to address
potential implementation barriers of TQM. Therefore, it is important for all
organisations to understand and avoid these barriers as far as is possible both before
and during TQM implementation.
c. Thirdly, organisations can enhance the likelihood of a effective implementation of
TQM by understanding the impact of organisational culture on TQM implementation
barriers. In order to accomplish this task, organisations need to know which type of
culture can help to remove which barriers. Therefore, there is a need to identify
variables of organisational culture and TQM implementation barriers and to establish
the relationships between these two variables through empirical evidence, so that they
can be built into implementers’ models for TQM implementation. Hence, during the
process of TQM implementation, Bahraini organisations should investigate the impact
of underlying cultural characteristics on TQM implementation barriers.
11. The contribution that this research has made is extremely timely for two reasons. Firstly,
in the context of this study, companies in Bahrain who may have limited experience of
establishing TQM have realized the need, supported by Bahrain government policy
implementation, to more holistically address quality management through the TQM
approach. Secondly, in the wider context, it is apparent that despite the reported failures,
TQM is still a popular management approach that organisations are turning to, often
through their adoption of one of the national or international business excellence
approaches, to help develop their organisational performance (Dale et al., 2007; Oakland,
2003). The research thus provides Bahraini organisations with an empirically based
assessment of organisational culture in Bahrain, an empirically based examination of the

255
relative strength of the common impediments and pitfalls to the effective implementation
of TQM existing generally in Bahraini industry and commerce, and an empirically based
examination of how culture may or may not influence these likely barriers to TQM
implementation that Bahraini companies are likely to face.
12. Although it was not the intention of this research to develop a `model` for TQM
implementation in Bahraini organisations, the research instrument used in this study
readily lends itself for use by manufacturing or service organisations of all sizes as either
a pre-TQM audit tool, or as the basis for periodic/continuous self-assessment, that can be
used by the management of the organisation to inform the nature, timing and priorities
amongst its TQM implementation activities.
13. Whilst individual Bahraini organisations are advised (as above) to carefully examine the
findings of this research in the context of their specific organisation, it is the Bahraini
government that represents Bahraini industry and commerce as a whole, and as far as is
possible is encouraged to (some would argue it must) provide relevant context specific
advice and guidance to the country’s companies. While not underestimating the value that
the Bahraini government can take from the existing, mainly Western-developed
knowledge base on implementing TQM, this study immediately provides them, as policy
makers and in their efforts to advise and support companies as part of their vision 2030
programme, with (a) an empirically derived understanding of the general pattern of
organisational culture existing in Bahrain, (b) an empirically derived understanding of the
breadth and relative intensity of the barriers to TQM existing in Bahrain, and (c) an
empirically derived understanding of the linkages between the former and the latter in
Bahrain, that can therefore directly and with a very high degree of relevance inform the
advice and support they provide.
14. The conceptual framework and survey instrument tested and validated in this study, will
help organisations of Bahrain to identify the appropriate emphasis on TQM
implementation based on their organisational culture and subsequently identify TQM
implementation barriers. The Research will benefit organisations who have not been able
to implement TQM effective, or who are in the process of planning the introduction of the
TQM approach. More specifically, the development of a deeper understanding of TQM
implementation would meet the long term objectives of Bahrain centre of excellence and
the Vision 2030 programme of government of Bahrain. Furthermore, it is reasonable to
propose that the conceptual framework and survey instrument can be used in any

256
organisational environment in any country or region. Therefore, it is envisaged that this
study will help enhance the success rate of TQM implementation on a large scale.
15. As identified in this study, the co-existence of all four types of culture within the survey
population has reaffirmed the proposition by Denison and Spreitzer (1991) who have
specifically affirmed the need to incorporate and balance all four cultural types. The
instrument devised in this study would facilitate managing this cultural inconsistency
which seems to be one of the major issues of TQM and the main challenge for
organisations that implement it (Prajogo and McDermott, 2005). The major implication of
this finding is that organisations need to accommodate divergent goals by developing a
system and/or structure that allows enough flexibility for adapting different (even
contrasting) management styles, hence, swinging comfortably between control and
flexibility and between internal and external orientation (Tushman and O'Reilly, 1996).
16. By and large, the coexistence of the control and flexible models implies that these
antagonistic elements are there within an organisation and need to be managed tactfully
(Prajogo and McDermott, 2005). However, there are many trade-offs in the deployed
strategies in cultural context - like discarding some characteristics of existing type of
culture, preserving some characteristics of existing culture and adopting some attributes
of another type of culture. It is believed that by using the survey instrument and
conceptual framework, organisations can know very clearly what is required to change
and what is not. It will provide practitioners more informed understanding to manage the
cultural paradox in the context of implementing TQM.
17. Previous studies on TQM implementation reveal two related aspects. Firstly, that TQM is
often not implemented properly and secondly that when properly implemented TQM
undeniably improves performance. To this end, this study has provided an empirically
grounded framework that can be used alongside other pertinent advice as a tool for
helping practitioners to implement TQM effectively.
7.6 Directions for future research
In this section, future research directions are suggested.
1. This study has examined for the first time a `new` relationship in the TQM
implementation domain, and has done so in a Bahrain context. It is important that other
researchers now examine the relationship between organisational culture and TQM not
only in other GCC or non-Western contexts, but perhaps most importantly in western

257
contexts, where the vast majority of TQM theory development and examination of TQM
practice to date has taken place.
2. It is expected that this study will help to foster a formal discussion especially between
researchers taking opposing stances on whether culture is an antecedent of TQM or vice
versa. That is to say, whether TQM implementation determines organisational culture or
organisational culture promotes/inhibits TQM implementation. This research attempted to
explore these and other relationships between TQM and culture. Our results support the
view that organisational culture promotes/inhibits TQM implementation, yet it still opens
further debate in this area, particularly the recursive and reciprocal effect of both
variables need to be explored further. One of the assumptions may be that adoption of a
TQM perspective could have positive effect on organisational culture and reciprocally
such transformation of organisational culture would sustain further implementation of
TQM - generating a recursive effect.
3. In this study, the data on organisational culture profile was collected only at the
organisational level, but in the case of large organisations each department/division or
function may have subgroups of culture which are more homogenous within the
department/division but are heterogeneous with respect to overall organisational culture
because of the varied nature of their function. For example, an IT department in a large
aluminium factory may have developmental culture as more prevalent, but the production
division may have rational or hierarchical culture more dominant. Similar speculations
can apply to TQM implementation barriers that may vary due to the specific tasks of each
department/division. Future research may investigate this fact at root level.
4. Another research domain may be regarding the most appropriate combination of cultures
that will promote/inhibit TQM implementation barriers. The question whether this
combination will differ with respect to industry sector, strategic goals of the organisations
and business environment, remains open. Organisations operating in a stable industry
might be expected to emphasize more on control elements of organisational culture such
as the characteristics of hierarchical or rational culture, while organisations operating in a
dynamic environment might be more expected to put more emphasis on group and
developmental culture. Further examination of this phenomena is required to inquire
whether adding such variables as control variables into the existing conceptual framework
will affect the results or not.
5. According to the theory in the literature, group culture would minimize top management
barriers. The results of this empirical study demonstrate that the influence of group

258
culture on top management barriers is uncertain, which is contradictory to the theory-
based prediction, and also contradictory to the results of some previous empirical studies,
prompting a call for further investigation. This same implication can apply to the other
four hypotheses that were not fully supported. In this study, real world data did not agree
with hypothesized predictions about these five relationships, indicating that the
implications of theory is not supported by the facts. Whatever the reason for rejecting a
hypothesis triggers a need of further inquiry and testing. Accordingly, the following five
hypothesis need to be tested using the same methodology, but with research samples from
different study populations.
H1 Group culture decreases top management barriers
H5 Developmental culture decreases employee barriers
H6 Developmental culture decreases customer barriers
H8 Rational culture decreases employee barriers
H9 Rational culture decreases customer barriers.

259
References
Abraham, M., Crawford, J. & Fisher, T. (1999) "Key factors predicting effectiveness of
cultural change and improved productivity in implementing total quality management",
International Journal of Quality & Reliability Management, vol. 16, no. 2, pp. 112-132.
Ackoff, R.L., (1993), “Beyond total quality management”, Journal for Quality and
Participation”. Vol.16, no.2, pp. 66–78
Adebanjo, D. & Kehoe, D. (1998) "An evaluation of quality culture problems in UK
companies", International Journal of Quality Science, vol. 3, no. 3, pp. 275-286.
Ahire, S.L. & Golhar, D.Y. (1996) "Quality management in large vs small firms", Journal of
Small Business Management, vol. 34, no. 2, pp. 1-13.
Ahire, S.L., Landeros, R. & Golhar, D.Y. (1995) "Total quality management: a literature
review and an agenda for future research", Production and Operations Management, vol.
4, no. 3, pp. 277-306.
Ahire, S.L. & O’shaughnessy, K. (1998) "The role of top management commitment in quality
management: an empirical analysis of the auto parts industry", International Journal of
Quality Science, vol. 3, no. 1, pp. 5-37.
Ali, A. (2008) Business and management environment in Saudi Arabia: Challenges and
opportunities for multinational corporations, Taylor & Francis.
Ali, N.A., Zairi, M. & Mahat, F. (2008) "People resistance in TQM implementation: a
qualitative study on Malaysian universities", International Journal of Productivity and
Quality Management, vol. 3, no. 1, pp. 1-11.
Al-Khalifa, K.N. & Aspinwall, E.M. (2001) "Using the competing values framework to
investigate the culture of Qatar industries", Total Quality Management, vol. 12, no. 4,
pp. 417-428.
Al-khalifa, K.N. and Aspinwall, E.M. (2000) ‘Using the Competing Values Framework to
identify the ideal culture profile for TQM: a UK perspective’, Int. J. Manufacturing
Technology and Management, Vol. 2, Nos. 1–7, pp.1024–1040.
Alreck, P.L. (1995) The survey research handbook: Guidelines and strategies for conducting
a survey, Irwin.
Al-Zamany Y., Stephen H. and Barbara S. (2002),’Understanding the difficulties of
implementing quality management in Yemen’, The TQM Magazine, vol.14, no.4, pp. 240-
247.
Amaral, P. & Sousa, R. (2009) "Barriers to internal benchmarking initiatives: an empirical
investigation", Benchmarking: An International Journal, vol. 16, no. 4, pp. 523-542.
Amar, K. & Zain, Z.M. (2002) "Barriers to implementing TQM in Indonesian manufacturing
organisations", The TQM Magazine, vol. 14, no. 6, pp. 367-372.
260
Ana Bele´n Escrig-Tena, (2003), TQM as a competitive factor: A theoretical and empirical
analysis, International Journal of Quality & Reliability Management
vol. 21 ,no. 6, pp. 612-637.
Anderson, J.C., Rungtusanatham, M. & Schroeder, R.G. (1994) "A theory of quality
management underlying the Deming management method", Academy of Management
Review, pp. 472-509.
Angell, L.C. & Corbett, L.M. (2009) "The quest for business excellence: evidence from New
Zealand's award winners", International Journal of Operations & Production
Management, vol. 29, no. 2, pp. 170-199.
Bagozzi, R.P., Yi, Y. & Phillips, L.W. (1991) "Assessing construct validity in organisational
research", Administrative Science Quarterly, , pp. 421-458.
Bahrain Economic Development (http://www.bahrainedb.com/economic-vision.aspx).
Bardoel, E.A. & Sohal, A.S. (1999) "The role of the cultural audit in implementing quality
improvement programs", International Journal of Quality & Reliability Management,
vol. 16, no. 3, pp. 263-277.
Beach, L., Flynn, G., Schroeder and S. Sakakibara, (1994) ‘A framework for quality
management research and an associated measurement instrument’, Journal of
Operations Management, vol.26, no.4, pp.468-489.
Beer, M. (2003) "Why total quality management programs do not persist: the role of
management quality and implications for leading a TQM transformation*", Decision
Sciences, vol. 34, no. 4, pp. 623-642.
Becker, W. (1993) ‘TQM does work: ten reasons why misguided attempts fail’,
Management Review, vol.82, no.5, pp.30-2.
Bemowski, K. (1995) "TQM: flimsy footing or firm foundation?”Quality Progress, vol. 28,
no. 7, pp. 27-30.
Bendell, T. (1989) The Quality Gurus: What can they do for your company? London:
Department of Trade and Industry.
Bhat, K.S. & Rajashekhar, J. (2009) "An empirical study of barriers to TQM implementation
in Indian industries", The TQM Journal, vol. 21, no. 3, pp. 261-272.
Black, J.S. & Mendenhall, M. (1989) "A practical but theory‐based framework for selecting
cross‐cultural training methods", Human resource management, vol. 28, no. 4, pp. 511-
539.
Black, S.A. & Porter, L.J. (1996) "Identification of the Critical Factors of TQM*", Decision
Sciences, vol. 27, no. 1, pp. 1-21.
Blumberg, B., Cooper, D.R. & Schindler, P.S. (2005) Business research methods,
McGraw-hill education.
261
Bounds, G., Yorks, L. & Adams, M. (1994) Beyond total quality management: toward the
emerging paradigm, McGraw-Hill College.
Bowen, D.E. & Lawler, E.E. (1992) "Total quality-oriented human resources management",
Organisational dynamics, vol. 20, no. 4, pp. 29-41.
Bowersox, C. and Cooper B. (2007) Supply Chain Logistics Management.2nd Ed. New
York: McGraw-Hill.
Brown, M.G. (1993) "Why does total quality fail in two out of three tries?” Journal for
Quality and Participation, vol. 16, pp. 80-80.
Browne, M. and Cudeck, R.(1993): Alternative Ways of Assessing Model Fit", KA Bollen
J.Scott Long (Eds.): Testing structural equation models, pp. 136-162.
Bryman, A. & Bell, E. (2007) Business research methods, Oxford University Press, USA.
Buch, K. & Rivers, D. (2002) "Sustaining a quality initiative", Strategic Direction, vol. 18,
no. 4, pp. 15-17.
Buenger, V., Daft, R.L., Conlon, E.J. & Austin, J. (1996) "Competing values in
organisations: Contextual influences and structural consequences", Organisation
Science, pp. 557-576.
Buckingham, M. and Coffman, C. (1999), First, Break All the Rules, Simon &Schuster, New
York, NY.
Cameron, K.S. & Freeman, S.J. (1991) "Cultural congruence, strength, and type:
Relationships to effectiveness", Research in organisational change and development,
vol. 5, no. 1, pp. 23-58.
Cameron, K.S. and Quinn, R.E. (1999), “Diagnosing and Changing Organisational
Culture: Based on the Competing Values Framework”, Addison-Wesley Serieson
Organisational Development, Addison Wesley Press, Reading, MA.
Capon, N., Kaye, M. & Wood, M. (1995) "Measuring the success of a TQM programme",
International Journal of Quality & Reliability Management, vol. 12, no. 8, pp. 8-22.
Cavana, R.Y., Delahaye, B.L. & Sekaran, U. (2001) Applied business research: Qualitative
and quantitative methods, Wiley and Sons.
Chang, S. and Wiebe, A. (1996)’the ideal culture profile for total quality management:
a competing values perspective, Engineering Management Journal, vol.8, no.2,
pp. 19-26.
Chatman, J.A. & Jehn, K.A. (1994) "Assessing the relationship between industry
characteristics and organisational culture: how different can you be?”Academy of
Management Journal, , pp. 522-553.

262
Choi, T.Y. & Behling, O.C. (1997) "Top managers and TQM success: One more look after
all these years", The Academy of Management Executive (1993-2005), pp. 37-47.
Choi, T.Y. & Eboch, K. (1998) "The TQM paradox: relations among TQM practices, plant
performance, and customer satisfaction", Journal of Operations Management, vol. 17,
no. 1, pp. 59-75.
Chumer, M., Hull, R., & Prichard, C. (2000).'Introduction: Situating discussions about
knowledge''. In C. Prichard, R. Hull, M. Chumer & H. Willmott (eds), Managing
knowledge: Critical investigations of work and learning. New York: St. Martin's
Press.
Cicmil, S. & Kekäle, T. (1997) "Implications of organisational and individual learning for
effective change management in education-an exploratory study of management
practices in elementary schools in England and Finland", Journal of Workplace
Learning, vol. 9, no. 5, pp. 169-176.
Clemmer, J. (1991), “How total is your quality management?”, The Canadian Business
Review, Vol. 18 No. 1, pp. 38-41.
Cobanoglu, C., Warde, B. & Moreo, P.J. (2001) "A comparison of mail, fax and web-based
survey methods", International journal of market research, vol. 43, no. 4, pp. 441-452.
Collins, P. (1994) "Approaches to quality", The TQM Magazine, vol. 6, no. 3, pp. 39-43.
Cooke S. and Slack, N. (1991) Making Management Decisions. 2nd Ed, London: Prentice
Hall.
Cooke, R., and J. Lafferty. (1987). Organisational Culture Inventory (OCI). Plymouth,
MI: Human Synergistic.
Corbett, L.M. & Rastrick, K.N. (2000) "Quality performance and organisational culture: A
New Zealand study", International Journal of Quality & Reliability Management, vol.
17, no. 1, pp. 14-26.
Corbett, L.M. (2011) "Lean Six Sigma: the contribution to business excellence",
International Journal of Lean Six Sigma, vol. 2, no. 2, pp. 118-131.
Craig, C. and Douglas, S. (1982). “Strategic factors associated with market share and
financial performance”. Quarterly Review of Economics and Business, pages 101– 111.
Cronbach, L.J. (1951) "Coefficient alpha and the internal structure of tests", Psychometrika,
vol. 16, no. 3, pp. 297-334.
Coulson-Thomas, C.J. (1992) "Surveying the scene", The TQM Magazine, vol. 4, no. 1.
Crépin, D. (2002) "From design to action: developing a corporate strategy", Quality
Progress, vol. 35, no. 2, pp. 49-56.
263
Crosby, P.B. (1989) Let's talk quality: 96 questions you always wanted to ask Phil Crosby,
McGraw-Hill.
Crosby, P.B. (1979) "Quality is free: The art of making quality certain", New York, .
Curkovic, S., Vickery, S. & Dröge, C. (2000) "Quality‐related Action Programs: Their
Impact on Quality Performance and Firm Performance", Decision Sciences, vol. 31, no.
4, pp. 885-902.
Dale, B., Zairi, M., Van der Wiele, A. & Williams, A. (2000) "Quality is dead in Europe–
long live excellence-true or false?", Measuring Business Excellence, vol. 4, no. 3, pp. 4-
10.
Dale, B., Zairi, M., Williams, A. & Van Der Wiele, T. (2001) "Total quality management and
theory: An exploratory study of contribution", Total Quality Management, vol. 12, no. 4,
pp. 439-449.
Dale, G. and Cooper, C., (1992) ‘Introducing TQM: the role of senior management’
Management Decision. 32 (91) pp. 20-60
Dale, B.G., A. Van der Wiele V. and J.D. van Iwaarden (2007) Managing Quality. (fifth
edition): Blackwell Publisher, Oxford.
D&B, Bahrain Economic Development Report , (2008) , Kingdom Of Bahrain .
Davidson, A., Chelsom, J., Stern, L. & Janes, F. (2001) "A new tool for assessing the
presence of total quality", The TQM Magazine, vol. 13, no. 1, pp. 12-25.
Davenport, T.H. and Prusak, L. (1998), Working Knowledge - How Organisations
Manage What They Know, Harvard Business School Press, Boston, MA.
Dayton, N.A. (2001) "Total quality management critical success factors, a comparison: The
UK versus the USA", Total Quality Management, vol. 12, no. 3, pp. 293-298.
De Vaus, D.A. (2002) Surveys in social research, Psychology Press.
Deal, T. & Kennedy, A. (1982) "Corporate cultures: The rites and rituals of organisational
life", MA: Addison-Wesley Reading, .
Deal, T.E. and Kennedy, A.A. (1999), “The New Corporate Cultures”, Perseus,
London.
Dean Jr, J.W. & Bowen, D.E. (1994) "Management theory and total quality: improving
research and practice through theory development", Academy of management review, ,
pp. 392-418.
Dedoussis, E. (2004) "A cross-cultural comparison of organisational culture: Evidence from
universities in the Arab world and Japan", Cross Cultural Management: An International
Journal, vol. 11, no. 1, pp. 15-34.

264
Dellana, S. & Hauser, R. (1999) "Toward defining the quality culture", Engineering
Management Journal-Rolla-, vol. 11, pp. 11-16.
Deming, W. E., 1993: “The New Economics for Industry, Government Education", .
Deming, W.E. (1986) "Out of the crisis Cambridge", MA: Massachusetts Institute of
Technology, , pp. 182.
Deming, W.E. (1982) "Quality productivity and competitive position. Massachusetts Institute
of Technology", Center for Advanced Engineering Study, Cambridge, MA, vol. 2139, pp.
373.
Denison, D.R., Janovics, J., Young, J. & Cho, H.J. (2005) "Diagnosing organisational
cultures: Validating a model and method", Documento de trabajo.Denison Consulting
Group, .
Denison, D.R. & Spreitzer, G.M. (1991) "Organisational culture and organisational
development: A competing values approach", Research in organisational change and
development, vol. 5, no. 1, pp. 1-21.
Denison, R. and Neale, W. (2000) Denison Organisational Culture Survey. Ann Arbor,
MI: Denison Consulting.
Deshpandé, R., Farley, J.U. & Webster Jr, F.E. (1993) "Corporate culture, customer
orientation, and innovativeness in Japanese firms: a quadrad analysis", The Journal of
Marketing, , pp. 23-37.
Detert, J.R., Schroeder, R.G. & Mauriel, J.J. (2000) "A framework for linking culture and
improvement initiatives in organisations", Academy of management Review, , pp. 850-
863.
Dianne L., (1996) ‘The organisational culture saga - from OD to TQM: a critical review of
the literature. Part 2 – applications’, Leadership &Organisation Development Journal,
vol.17, no.2, pp.9–16.
Dillman, D.A., Smyth, J.D. & Christian, L.M. (2009) "Internet, mail, and mixed-mode
surveys: The tailored design method.",
Don D. , Jolene S. and Leah M. (2009) Christian Internet, Mail, and Mixed-mode Surveys:
The Tailored Design Method .Third Edition.
Dow, D., Samson, D. & Ford, S. (1999) "Exploding the myth: do all quality management
practices contribute to superior quality performance?” Production and Operations
Management, vol. 8, no. 1, pp. 1-27.
Earl, M.J. & Scott, I.A. (1999) "What is a chief knowledge officer", Sloan management
review, vol. 40, no. 2, pp. 29-38.
Easterby-Smith, M., Thorpe, R. & Lowe, A. (2002) Management research: An introduction,
Sage Publications Ltd.

265
Easton, G.S. (1993) "The 1993 State of US Total Quality Management: A Baldridge
Examiner&# 039; s Perspective", California management review, vol. 35, no. 3, pp. 32-
54.
Easton, G.S. & Jarrell, S.L. (1998) "The effects of total quality management on corporate
performance: an empirical investigation", Journal of Business, vol. 71, no. 2, pp. 253.
Ebrahimpour, M. & Withers, B. (1992) "Employee involvement in quality improvement: a
comparison of American and Japanese manufacturing firms operating in the US",
Engineering Management, IEEE Transactions on, vol. 39, no. 2, pp. 142-148.
Ebrahimpour, M. and Cullen, B. (1993) ‘TQM in Japanese and American firms operating in
the United States: a comparative study of styles and motivational beliefs’.
Ebrahim S., Robert M. , John G. and Terry W. (2003) ‘A TQM Approach to HR
Performance Evaluation Criteria’, European Management Journal, vol.21, no.3, pp. 323-
337.
Eisenhardt, K.M. & Tabrizi, B.N. (1995) "Accelerating adaptive processes: Product
innovation in the global computer industry", Administrative Science Quarterly, , pp. 84-
110.
Entrekin, L. & Pearson, C. (1996) "A comparison of values espoused by quality and other
managers", Asia Pacific Journal of Human Resources, vol. 33, no. 3, pp. 130.
Eskildson, L. (1995) "TQM's role in corporate success: Analyzing the evidence", National
Productivity Review, vol. 14, no. 4, pp. 25-38.
Ernst & Young Report ( 2009) , Kingdom Of Bahrain.
Evans, J.R. & Lindsay, W.M. "The Management and Control of Quality. (1999)", South-
Western College Publishing, Cincinnati, .
Evans, R., Lindsay, M., (1995) The management and control of quality. 3rd
edn. New
York: West Publishing.
Evans J, Lindsay WM (2001). The Management and Control of Quality, South-Western,
Cincinnati, OH, 60-190.
Everett, C.L. (2002) "Penn State's Commitment to quality improvement", Quality Progress,
vol. 35, no. 1, pp. 44-48.
Feigenbaum, A.V. (1999) "The new quality for the twenty-first century", The TQM
magazine, vol. 11, no. 6, pp. 376-383.
Feigenbaum, A.V. (1991) "Total quality control", New York: McGraw-Hill, 1991, 3rd
ed./rev.40th anniversary ed., vol. 1.
Feigenbaum, V. (1957) ‘Total quality control’, Harvard Business Review, pp. 93-101.
266
Field, A. P. (2005) Discovering statistics using SPSS: 2nd edn. London: Sage.
Fine, C. (1985) "Managing Quality: A Comparative Assessment", Manufacturing Issues,
Booz Allen and Hamilton, New York, NY, .
Fink, A. & Kosecoff, J. (1998) "How to conduct surveys: A step-by-step guide. Beverly
Hills", .
Fitz-Enz, J. (1986), “White-collar effectiveness: Part I: the employees’ side”,
Management Review, Vol. 75 No. 5, pp. 52-5.
Fleming, J.H., Coffman, C. & Harter, J.K. (2005) "Manage your human sigma", Harvard
business review, vol. 83, no. 7, pp. 106.
Flood, R.L. (1993) Beyond TQM, John Wiley & Sons Inc.
Flynn, B.B. & Saladin, B. (2006) "Relevance of Baldrige constructs in an international
context: A study of national culture", Journal of Operations Management, vol. 24, no. 5,
pp. 583-603.
Flynn, B.B., Schroeder, R.G. & Sakakibara, S. (1995) "The impact of quality management
practices on performance and competitive advantage", Decision Sciences, vol. 26, no. 5,
pp. 659-691.
Flynn, B.B., Schroeder, R.G. & Sakakibara, S. (1994) "A framework for quality management
research and an associated measurement instrument", Journal of Operations
Management, vol. 11, no. 4, pp. 339-366.
Forza, C. & Filippini, R. (1998) "TQM impact on quality conformance and customer
satisfaction: a causal model", International Journal of Production Economics, vol. 55,
no. 1, pp. 1-20.
Fuchsberg, G. (1992) "Quality programs show shoddy results", Wall Street Journal, vol. 14,
pp. B1.
Gallear, D. & Ghobadian, A. (2004) "An empirical investigation of the channels that facilitate
a total quality culture", .
Galperin, B.L. & Lituchy, T.R. (1999) "The implementation of total quality management in
Canada and Mexico: a case study", International Business Review, vol. 8, no. 3, pp. 323-
349.
Gary S. and Farzaneh F. (2000) ‘Obstacles to Implementing Quality’, Quality
Progress. Milwaukee: vol.33,no.7, pp. 53 .
Germain, R. & Spears, N. (1999) "Quality management and its relationship with
organisational context and design", International Journal of Quality & Reliability
Management, vol. 16, no. 4, pp. 371-392.

267
Gerowitz, M.B. (1998) "Do TQM interventions change management culture? Findings and
implications", Quality Management in Healthcare, vol. 6, no. 3, pp. 1.
Gerowitz, M.B., Lemieux-Charles, L., Heginbothan, C. & Johnson, B. (1996) "Top
management culture and performance in Canadian, UK and US hospitals", Health
services management research : an official journal of the Association of University
Programs in Health Administration / HSMC, AUPHA, vol. 9, no. 2, pp. 69-78.
Gerald, V. (1984), Three of Kind: A Reflection on the Approach to Quality. Eindhoven:
Corporate Quality Bureau, Philips Group N.V.
Ghobadian, A. & Gallear, D. (2001) "TQM implementation: an empirical examination and
proposed generic model", Omega, vol. 29, no. 4, pp. 343-359.
Ghobadian, A., Gallear, D. & Hopkins, M. (2007) "TQM and CSR nexus", International
Journal of Quality & Reliability Management, vol. 24, no. 7, pp. 704-721.
Ghobadian, A. & Gallear, D. (1996) "Total quality management in SMEs", Omega, vol. 24,
no. 1, pp. 83-106.
Ghobadian, A. & Woo, H.S. (1996) "Characteristics, benefits and shortcomings of four major
quality awards", International Journal of Quality & Reliability Management, vol. 13, no.
2, pp. 10-44.
Giek, D.G. & Lees, P.L. (1993) "On massive change: using the competing values framework
to organize the educational efforts of the human resource function in New York state
government", Human resource management, vol. 32, no. 1, pp. 9-28.
Gill, J. & Johnson, P. (2002) Research methods for managers, Sage Publications Ltd.
Gilbert, N. (2001) .Researching social life. London: Sage.
Glaser, S.R., Zamanou, S. & Hacker, K. (1987) "Measuring and interpreting organisational
culture", Management Communication Quarterly, vol. 1, no. 2, pp. 173.
Glover, J. (1993), “Achieving the organisational change necessary for successful TQM”,
International Journal of Quality & Reliability Management, Vol. 10 No. 6, pp. 47-64.
Goetsch, D. and Davis, S. (1995) Implementing Total Quality. New York : Prentice-
Hall.
Gold, B. (1987) "Approaches to accelerating product and process development", Journal of
Product Innovation Management, vol. 4, no. 2, pp. 81-88.
Gopal K. and Mike A. (1996) 100 Methods for Total Quality Management. SAGE.
Gopal K. (1998) ‘Measurement of business excellence’, Total Quality Management, vol.9,
no.7, pp. 633-43.
Government Accounting Office (1991), "Management practices: US companies

268
improve performance through quality efforts", Report No. GAO/NSIAD-91-190.
Grant, R.M. (1996) "Toward a knowledge-based theory of the firm", Strategic Management
Journal, vol. 17, pp. 109-122.
Gudim, M. Meer, R.vd B.(1995) Issues surrounding the implementation of TQM: The Scottish
experience, University of Strathclyde, Department of Management Science,.
Gunasekaran, A. (1999) "Enablers of total quality management implementation in
manufacturing: a case study", Total Quality Management, vol. 10, no. 7, pp. 987-996.
Hackman, J.R. & Wageman, R. (1995) "Total quality management: Empirical, conceptual,
and practical issues", Administrative Science Quarterly, , pp. 309-342.
Hall, E.T. & Hall, M.R. (1990) Understanding cultural differences, Intercultural Pr.
Hair, Joseph F., Barry, B. ( 2007) Multivariate Data Analysis.(6th
Edition).
Hair, J.F., Anderson, R.E., Tatham, R. L., and Black, W. C. (1998). Multivariate
Data Analysis.5th
edition. Upper Saddle River, NJ: Prentice Hall.
Hair, Joseph F, William C. Black, Barry J. Babin, and Ronald L.Tatham, (2006)
Multivariate Data Analysis. 6th
edn. New Jersey: Pearson Education, Inc.
Hair, Joseph F, William C. Black, Barry J. Babin, and Rolph E. Anderson (2010)
Multivariate Data Analysis. A Global Perspective.7th
edn. New Jersey:
Pearson Education, Inc.
Hair, Joseph F., Black, William , Babin, Barry , Anderson, Rolph E. and Tatham, Ronald
(2007) . Multivariate Data, 6TH edition .Englewood Cliffs, N.J.:Prentice Hall.
Hansson, J. And Klefsjo, B. (2003) ‘A core value model for implementing total quality
management in small organisations’, TQM Magazine, no.13 pp. 71-81.
Harris, P.R., Moran, R.T., Moran, S.V. & NetLibrary, I. (1996) Managing cultural
differences, Gulf Publishing Company Houston, Tex.
Harari, O. (1993a), ``Ten reasons why TQM doesn’t work’’, Management Review,
January, pp. 33-8.
Harvey, F., Brown, R. (1992) The Experimental Approach to Organisation Development.
4th
edn. London: Prentice-Hall.
Hellsten, U. & Klefsjö, B. (2000) "TQM as a management system consisting of values,
techniques and tools", The TQM magazine, vol. 12, no. 4, pp. 238-244.
Henderson, K.M. & Evans, J.R. (2000) "Successful implementation of six sigma:
benchmarking General Electric Company", Benchmarking: An International Journal,
vol. 7, no. 4, pp. 260-282.
269
Hendricks, K.B. & Singhal, V.R. (1997) "Does implementing an effective TQM program
actually improve operating performance? Empirical evidence from firms that have won
quality awards", Management Science, , pp. 1258-1274.
Hitchcock, D. & Willard, M. (2002) "Sustainability: enlarging quality's mission", Quality
Progress, vol. 35, no. 2, pp. 43-47.
Ho, D., Duffy, V. & Shih, H. (2001) "Total quality management: an empirical test for
mediation effect", International Journal of Production Research, vol. 39, no. 3, pp. 529-
548.
Ho, S.K.M. & Fung, C.K.H. (1994) "Developing a TQM excellence model", The TQM
Magazine, vol. 6, no. 6, pp. 24-30.
Hodgetts, R.M. (1993) Blueprints for continuous improvement: lessons from the Baldrige
winners, AMA Membership Publications Division, American Management Association.
Hofstede, G. (2001) "Culture’s consequences: Comparing values, behaviors, institutions, and
organisations across nations. Thousand Oaks", Cal.: Sage Publications, .
Hofstede, G. (1991) Cultures and organisations: Software of the mind. London:
McGraw-Hill UK.
Hooijberg, R. & Petrock, F. (1993) "On cultural change: Using the competing values
framework to help leaders execute a transformational strategy", Human resource
management, vol. 32, no. 1, pp. 29-50.
Huber, G.P. (1991) "Organisational learning: The contributing processes and the literatures",
Organisation science, , pp. 88-115.
Huq, Z. (2005) "Managing change: a barrier to TQM implementation in service industries",
Managing Service Quality, vol. 15, no. 5, pp. 452-469.
Huq, Z., Huq, F. & Cutright, K. (2006) "BPR through ERP: Avoiding change management
pitfalls", Journal of Change Management, vol. 6, no. 1, pp. 67-85.
Huq, Z. & Martin, T.N. (2000) "Workforce cultural factors in TQM/CQI implementation in
hospitals", Health care management review, vol. 25, no. 3, pp. 80.
Hussey, J. & Hussey, R. (1997) Business research, Macmillan.
Huse, E. (1985) Organisation Development and Change.3rd
edn. London:
West Publishing.
Hyland, P., Mellor, R., O’Mara, E. & Kondepudi, R. (2000) "A comparison of Australian
firms and their use of continuous improvement tools", The TQM Magazine, vol. 12, no.
2, pp. 117-124.

270
Imai, K., Nonaka, I. & Takeuchi, H. (1985) "Managing the new product development
process: how Japanese companies learn and unlearn", The uneasy alliance: Managing
the productivity-technology dilemma, pp. 337–375.
Ingersoll, G.L., Kirsch, J.C., Mark, S.E. & Lightfoot, J. (2000) "Relationship of
organisational culture and readiness for change to employee commitment to the
organisation", Journal of Nursing Administration, vol. 30, no. 1, pp. 11.
Inglehart, R., Basáñez, M.E. & Moreno, A.M. (1998) Human values and beliefs: A cross-
cultural sourcebook, University of Michigan Press Ann Arbor, MI.
Irani, Z., Beskese, A. & Love, P. (2004) "Total quality management and corporate culture:
constructs of organisational excellence", Technovation, vol. 24, no. 8, pp. 643-650.
Ishikawa, K. (1976) "Guide to Quality Control; Asian Productivity Organisation", Hong
Kong: Nordica International, .
Ishikawa, K. & Lu, D.J. (1985) What is total quality control?: the Japanese way, Prentice-
Hall Englewood Cliffs, NJ.
ISO, E. (1994) "8402 “Quality Management and Quality assurance-Vocabulary", The
International Organisation for Standardization, .
Jabnoun, N. (2001) "Values underlying continuous improvement", The TQM Magazine, vol.
13, no. 6, pp. 381-388.
Jabnoun, N. & Sedrani, K. (2005) "TQM, culture, and performance in UAE manufacturing
firms", Quality management journal, vol. 12, no. 4, pp. 8-20.
Jackson, S.E., Brett, J.F., Sessa, V.I., Cooper, D.M., Julin, J.A. & Peyronnin, K. (1991)
"Some differences make a difference: Individual dissimilarity and group heterogeneity as
correlates of recruitment, promotions, and turnover.",Journal of Applied Psychology,
vol. 76, no. 5, pp. 675.
Jacob, R. (1993) "TQM: More than a dying fad", Fortune, vol. 124, pp. 66-72.
Jacobson, R. & Aaker, D.A. (1987) "The strategic role of product quality", The Journal of
Marketing, , pp. 31-44.
Jaeger, A.M. (1986) "Organisation development and national culture: Where's the fit?",
Academy of Management Review, , pp. 178-190.
Jaynes, T. (2003) Probability Theory: The Logic of Science Bretthorst. G. L.Edition Ed.
Cambridge: Cambridge University Press.
Jefferey P. Jones, Daniele Seraphim, (2008) "TQM implementation and change management
in an unfavourable environment", Journal of Management Development, Vol. 27,no.3,
pp.291 – 306.
271
Johnson, H.T. & Kaplan, R.S. (1987) Relevance lost: The rise and fall of management
accounting, Harvard Business School Pr.
Johnson, Eleanor ( 1992).”Federal sector TQM: A Question of Leadership”. Paper presented
at the 53rd National Conference of the Association for public Administration, Chicago.
Jöreskog, K.G. & Sörbom, D. (2001) LISREL 8: New statistical features, Scientific Software
International.
Jun, M., Cai, S. & Peterson, R. (2004) "Obstacles to TQM implementation in Mexico's
maquiladora Industry", Total Quality Management & Business Excellence, vol. 15, no. 1,
pp. 59-72.
Jung, J., Su, X., Baeza, M. & Hong, S. (2008) "The effect of organisational culture stemming
from national culture towards quality management deployment", The TQM Journal, vol.
20, no. 6, pp. 622-635.
Juran, J. (1995) A history of managing for quality: The evolution, trends, and future
directions of managing for quality, ASQC Quality Press, Milwaukee, Wis.
Juran, J.M. and Gryna, F.M. (1980), Quality Planning and Analysis, 2nd ed., McGraw-Hill,
New York, NY
Juran, M. and Frank G. (1993) Quality Planning and Analysis.3rd edn. New York :
McGraw-Hill Book Company.
Kalliath, T.J., Bluedorn, A.C. & Gillespie, D.F. (1999) "A confirmatory factor analysis of the
competing values instrument", Educational and Psychological Measurement, vol. 59, no.
1, pp. 143.
Kanji, G.K. (1998a) "Measurement of business excellence", Total Quality Management, vol.
9, no. 7, pp. 633-643.
Kanji, G. (1998b) "An innovative approach to make ISO 9000 standards more effective",
Total Quality Management, vol. 9, no. 1, pp. 67-78.
Kanji, G.K. & Asher, M. (1996) 100 methods for total quality management, Sage
Publications Ltd.
Kanji, G.K. & Yui, H. (1997) "Total quality culture", Total Quality Management, vol. 8, no.
6, pp. 417-428.
Karakoyun, F. & Kurt, A.A. (2010) "Web survey design and usability", .In proceeding of
world conference on Educational Multimedia, Hypermedia and Telecommunications.
Khanna, V.K., Vrat, P., Shankar, R.& Sahay, (2002), ‘Developing casual relationship for a
TQM index for the Indian automobile sector’, Work Study, vol. 51, no. 7, pp. 364-73.
Kassicieh, S.K. & Yourstone, S.A. (1998) "Training, performance evaluation, rewards, and
TQM implementation success", Journal of Quality Management, vol. 3, no. 1, pp. 25-38.

272
Katz, K. (1998) "de Czege (1998) JP Katz, DW Krumwiede and MW de Czege", Total
quality management in the global marketplace: The impact of national culture on TQM
implementation, International Journal of Management, vol. 15, pp. 349–356.
Kaynak, H. (2003) "The relationship between total quality management practices and their
effects on firm performance", Journal of Operations Management, vol. 21, no. 4, pp.
405-435.
Kaynak, H. & Hartley, J.L. (2008) "A replication and extension of quality management into
the supply chain", Journal of Operations Management, vol. 26, no. 4, pp. 468-489.
Kennedy, A. & Deal, T. (1982) "Corporate cultures: The rites and rituals of corporate life",
Reading, Massachusetts: Addisson-Wesley Publishing Company, .
Kerlavaj, M (2007) ‘Organisational learning culture – The missing link between business
process change and organisational performance’, International of production
Economics, vol.106,no.2, pp. 346-367.
Kifayah A. and Zuraidah Z. (2002) ‘Barriers to implementing TQM in Indonesian
manufacturing organisations’, The TQM Magazine, vol.4, no.6, pp. 367-372.
Kingdom of Bahrain (2007). Labour Fund Strategic Plan Report. Manama: Kingdom
of Bahrain.
Kim, P.S., Pindur, W. & Reynolds, K. (1995) "Creating a new organisational culture: the key
to total quality management in the public sector", International Journal of Public
Administration, vol. 18, no. 4, pp. 675-709.
Kline, T. (2005) Psychological testing: A practical approach to design and evaluation, Sage
Publications, Inc.
Kotey, B. & Slade, P. (2005) "Formal Human Resource Management Practices in Small
Growing Firms*", Journal of Small Business Management, vol. 43, no. 1, pp. 16-40.
Krishnan, R., AB (Rami) Shani, Grant, R. & Baer, R. (1993) "In search of quality
improvement: problems of design and implementation", The Academy of Management
Executive (1993-2005), , pp. 7-20.
Krüger, V. (2001) "Main schools of TQM: the big five”", The TQM magazine, vol. 13, no. 3,
pp. 146-155.
Kujala, J. (2004) "Total quality management as a cultural phenomenon", Quality
Management Journal Citeseer, .
Kumar, M.R. & Sankaran, S. (2007) "Indian culture and the culture for TQM: a comparison",
The TQM Magazine, vol. 19, no. 2, pp. 176-188.
Kunst, P. & Lemmink, J. (2000) "Quality management and business performance in
hospitals: a search for success parameters", Total Quality Management, vol. 11, no. 8,
pp. 1123-1133.
273
Kumar, R. (2006). TQM as the basis for organisational transformation of Indian
railways: a study in action research. (DBA thesis, Southern Cross University,
Tweed Heads).
Lagrosen, S. (2003) "Exploring the impact of culture on quality management", International
Journal of Quality & Reliability Management, vol. 20, no. 4, pp. 473-487.
Lai, K.H. (2003) "Market orientation in quality-oriented organisations and its impact on their
performance", International Journal of Production Economics, vol. 84, no. 1, pp. 17-34.
Lakhe, R. & Mohanty, R. (1994) "Total quality management: concepts, evolution and
acceptability in developing economies", International Journal of Quality & Reliability
Management, vol. 11, no. 9, pp. 9-33.
Lau, H. & Idris, M. (2001) "The soft foundation of the critical success factors on TQM
implementation in Malaysia", The TQM Magazine, vol. 13, no. 1, pp. 51-62.
Lee, K.C. & Choi, B. (2006) "Six sigma management activities and their influence on
corporate competitiveness", Total Quality Management & Business Excellence, vol. 17,
no. 7, pp. 893-911.
Lee, N. & Lings, I. (2008) Doing business research: a guide to theory and practice, Sage.
Lewis, D. (1998) "How useful a concept is organisational culture?", Strategic Change, vol. 7,
no. 5, pp. 251-260.
Lewis, D. (1996a) "The organisational culture saga-from OD to TQM: a critical review of the
literature. Part 1- concepts and early trends", Leadership &Organisation Development
Journal, vol. 17, no. 1, pp. 12-19.
Li, E.Y., Zhao, X. & Lee, T. (2001) "Quality management initiatives in Hong Kong’s
banking industry: A longitudinal study", Total Quality Management, vol. 12, no. 4, pp.
451-468.
Longenecker, C.O. & Scazzero, J.A. (1993) "Total quality management from theory to
practice: a case study", International Journal of Quality & Reliability Management, vol.
10, no. 5.
Lundquist, R. (1995) "Quality Related Costs in Higher Education-A Tool for Improvements",
Research Report, vol. 4.
Mackenzie, S. (1995) "Surveying the organisational culture in an NHS trust", Journal of
management in medicine, vol. 9, no. 6, pp. 69-77.
McConnel, C. (1995) „Total Quality and the Shifting Management, Paradigm. Health
Supervisor, P. 71-79
Maleyeff, J. (2006) "Exploration of internal service systems using lean principles",
Management Decision, vol. 44, no. 5, pp. 674-689.
274
Mallinger, M. (1993) "Ambush along the TQM trail", Journal of Organisational Change
Management, vol. 6, no. 4, pp. 30-42.
Mann, R. & Kehoe, D. (1994) "An evaluation of the effects of quality improvement activities
on business performance", International Journal of Quality & Reliability Management,
vol. 11, no. 4, pp. 29-44.
Marsh, H.W. & Hocevar, D. (1985) "Application of confirmatory factor analysis to the study
of self-concept: First-and higher order factor models and their invariance across
groups.", Psychological bulletin, vol. 97, no. 3, pp. 562.
Martin, H.J. (1985) "Managing specialized corporate cultures", Gaining control of the
corporate culture. San Francisco: Jossey-Bass, .
Martínez-Lorente, A.R., Dewhurst, F. & Dale, B.G. (1998) "Total quality management:
origins and evolution of the term", The TQM Magazine, vol. 10, no. 5, pp. 378-386.
Marsh and D. Hocevar,(1985).” Applications of confirmatory factor analysis to the
study of self concept: first-and higher order factor models and their invariance
across groups”. Psychological Bulletin, Vol. 97 , pp. 562–582.
Masters, R.J. (1996) "Overcoming the barriers to TQM's success", Quality Progress, vol. 29,
no. 5, pp. 53.
Matta, K., Davis, J., Mayer, R., and Conlon, E. (1996) ‘Research questions on the
implementation of total quality management’, Total Quality Management,vol.7,
no.1, pp. 39-49.
Matveev, A.V. (2002) "The Advantages of employing quantitative and qualitative methods in
intercultural research: practical implications from the study of the perceptions of
intercultural communication competence by American and Russian managers", Bulletin
of Russian communication, Institute of Management, Business & Law Publications, , pp.
59-67.
Maull, R., Brown, P. & Cliffe, R. (2001) "Organisational culture and quality improvement",
International Journal of Operations & Production Management, vol. 21, no. 3, pp. 302-
326.
McAdam R. and McKeown M. (1999), ‘Life after ISO 9000: An analysis of the impact of
ISO 9000 and total quality management on small businesses in Northern Ireland’, Total
Quality Management, 10(2): 229-241
McAdam, R. & Kelly, M. (2002) "A business excellence approach to generic benchmarking
in SMEs", Benchmarking: An International Journal, vol. 9, no. 1, pp. 7-27.
McAdam, R., McConvery, T. & Armstrong, G. (2004) "Barriers to innovation within small
firms in a peripheral location", International Journal of Entrepreneurial Behaviour &
Research, vol. 10, no. 3, pp. 206-221.

275
McConnell, C.R. (1995) "Total quality and the shifting management paradigm", The health
care manager, vol. 13, no. 3, pp. 71.
McDermott, C.M. & Stock, G.N. (1999) "Organisational culture and advanced manufacturing
technology implementation", Journal of Operations Management, vol. 17, no. 5, pp.
521-533.
McDonald, J. (1992) "Reasons for failure", The TQM Magazine, vol. 4, no. 4.
McDonald, R.P. & Marsh, H.W. (1990) "Choosing a multivariate model: Noncentrality and
goodness of fit.", Psychological bulletin, vol. 107, no. 2, pp. 247.
McEvoy, G.M. (1984) "Small business personnel practices", Journal article by Glenn
M.Mcevoy; Journal of Small Business Management, vol. 22.
McFadden, K.L., Stock, G.N. & Gowen III, C.R. (2006) "Implementation of patient safety
initiatives in US hospitals", International Journal of Operations & Production
Management, vol. 26, no. 3, pp. 326-347.
McNabb, D.E. & Sepic, F.T. (1995) "Culture, climate, and total quality management:
Measuring readiness for change", Public Productivity & Management Review, , pp. 369-
385.
McNerney, D. (1996) "The link to customer satisfaction", HR Focus, vol. 73, no. 9, pp. 1-4.
Mehra, S., Sirias, D. and Hoffman, J.M. (1998), “A critical analysis of total quality
management implementation”, International Journal of Applied Quality
Management, Vol. 1 No. 1.
Metri, B.A. (2005) "TQM Critical Success factors for Construction Firms", Education and
Training, vol. 13, pp. 1.
Minjoon, J. & Shaohan, C. (2001) "The key determinants of Internet banking service quality:
a content analysis", International Journal of Bank Marketing, vol. 19, no. 7, pp. 276-
291.
Minjoon J., Shaohan C. and Robin P. (2004) ’Obstacles to TQM Implementation in Mexico’s
Maquiladora Industry’, Total Quality Management, vol.15, no.1, pp. 59–72.
Mohrman, S.A., Cohen, S.G. & Morhman Jr, A.M. (1995) Designing team-based
organisations: New forms for knowledge work. Jossey-Bass.
Motwani, J. (2001) "Critical factors and performance measures of TQM", The TQM
Magazine, vol. 13, no. 4, pp. 292-300.
Munter, M. (1995) "Cross-cultural communication for managers", IEEE Engineering
Management Review, vol. 23, no. 1, pp. 60-68.

276
Nair, A. (2006) "Meta-analysis of the relationship between quality management practices and
firm performance--implications for quality management theory development", Journal of
Operations Management, vol. 24, no. 6, pp. 948-975.
Nakata, C. (2002) "Activating the marketing concept in a global context: An MNC country
managers’ perspective", International Marketing Review, vol. 19, no. 1, pp. 39-64.
Naor, M., Goldstein, S.M., Linderman, K.W. & Schroeder, R.G. (2008) "The Role of Culture
as Driver of Quality Management and Performance: Infrastructure Versus Core Quality
Practices*", Decision Sciences, vol. 39, no. 4, pp. 671-702.
Nasierowski, W. & Coleman, D. (1997) "Lessons learned from unsuccessful transfers of
managerial techniques: cultural impediments to the transfer of TQM practices",
International journal of management., .
Neuman, W.L. (2003) Social research methods: Qualitative and quantitative approaches,
Allyn and Bacon.
Newall, D. and Dale, B. G. (1991), "The introduction and development of a quality
improvement process: a study", International Journal of Production Research,
Vol.29 No. 9, pp. 1747-1760.
Ngai, E. & Cheng, T. (1997) "Identifying potential barriers to total quality management using
principal component analysis and correspondence analysis", International Journal of
Quality & Reliability Management, vol. 14, no. 4, pp. 391-408.
Noor A., Mohamed Z. and Fauziah M. (2008) ‘People resistance in TQM implementation: a
qualitative study on Malaysian universities’, International Journal of Productivity and
Quality Management, vol.3, no.1, pp. 1-11.
Nunnally, J. (1978), Psychometric theory, Mc Graw Hill, New York.
Nunnally, J.C. & Bernstein, I.H. "Psychometric Theory. (1994)", McGraw, New York, .
Nwabueze, U. (2001) "How the mighty have fallen: the naked truth about TQM", Managerial
Auditing Journal, vol. 16, no. 9, pp. 504-513.
Oakland, J.S. (2004) Oakland on quality management, Elsevier Butterworth-Heinemann,
Oxford UK.
Oakland, J.S. (2001) Total organisational excellence, Butterworth-Heinemann.
Oakland, J.S. & Porter, L.J. (2003) TQM: Text with cases, Butterworth-Heinemann Oxford.
Oakland, J., (2000) Total quality management – Text with cases. 2nd edn. Oxford:
Butterworth Heinemann.
Oakland, S. (1995) Total Quality Management: The Route to Improving Performance.
Oxford: Butterworth-Heinemann.

277
Oakland, S. (1993), Total Quality Management. Oxford: Butterworth-Heinemann.
Oakland, S., Peter M. (1997) TQM : a Pictorial Guide for Managers. Oxford
Butterworth-Heinemann.
O'Dell, C.S., Grayson, C.J. & Essaides, N. (1998) If only we knew what we know: The
transfer of internal knowledge and best practice, Free Pr.
O'Reilly III, C.A., Chatman, J. & Caldwell, D.F. (1991) "People and organisational culture: A
profile comparison approach to assessing person-organisation fit", Academy of
management Journal, , pp. 487-516.
Ouchi, W. (1981) "Theory Z: How American Business Can Meet the Japanese Challenge,
Adison-Wesley", Reading (MA), .
Pallant, J. (2007) "SPSS survival guide", Berkshire: McGraw-Hill, .
Pande, P.S., Neuman, R.P. & Cavanagh, R.R. (2002) The Six Sigma way team fieldbook: an
implementation guide for project improvement teams, McGraw-Hill Companies.
Pannirselvam, G.P., Siferd, S.P. & Ruch, W.A. (1998) "Validation of the Arizona Governor's
Quality Award criteria: a test of the Baldrige criteria", Journal of Operations
Management, vol. 16, no. 5, pp. 529-550.
Parasuraman, A., Zeithaml, V.A. & Berry, L.L. (1985) "A conceptual model of service
quality and its implications for future research", The Journal of Marketing, , pp. 41-50.
Parker, A.J. & Porter, L.J. (1993) "Total quality management--the critical success factors",
Total Quality Management, vol. 4, no. 1, pp. 13-22.
Amaral, P., Sousa, R. (2009) "Barriers to internal benchmarking initiatives: an
empirical investigation", Benchmarking: An International Journal, Vol. 16,
no. 4, pp.523 – 542.
Peters, T. (1989) "Thriving on chaos: Handbook for a managerial revolution", London: Pan
Book, .
Peters, T.J. & Waterman Jr, R.H. (1982) "In Search of Excellence–Lessons from America’s
Best-Run Companies New York, 1982", .
Pheng, L.S. (1996) "Total quality facilities management: a framework for implementation",
Facilities, vol. 14, no. 5/6, pp. 5-13.
Powell, T.C. (1995) "Total quality management as competitive advantage: a review and
empirical study", Strategic Management Journal, vol. 16, no. 1, pp. 15-37.
Prajogo, D.I. & McDermott, C.M. (2005) "The relationship between total quality
management practices and organisational culture", International Journal of Operations
& Production Management, vol. 25, no. 11, pp. 1101-1122.

278
Prusak, L. & Davenport, T.H. (1998) "Working Knowledge–How Organisations Manage
What They Know", Harvard Business School Press, Boston, USA, .
Quinn, R.E. (1988) Beyond rational management: Mastering the paradoxes and competing
demands of high performance. Jossey-Bass.
Quinn, R.E. & Cameron, K. (1983) "Organisational life cycles and shifting criteria of
effectiveness: Some preliminary evidence", Management science, , pp. 33-51.
Quinn, R.E. and Hall R.H. (1983). Environments, organisations and policymakers: Towards
an integrative framework. In R.E. Quinn and R.H. Hall (Eds.), Organisational theory
and public policy, Beverly Hills, CA: Sag .
Quinn, R.E. & Kimberly, J.R. (1984) "Paradox, planning, and perseverance: Guidelines for
managerial practice", Managing organisational transitions, vol. 295, pp. 313.
Quinn, R.E. & Rohrbaugh, J. (1983) "A spatial model of effectiveness criteria: Towards a
competing values approach to organisational analysis", Management science, , pp. 363-
377.
Quinn, R.E. (1984), applying competing value approach in leadership. In J.G. Hunt, R.
Stewart, C.A. Schriessheim and D. Hoskins (Eds.), Managerial work and leadership:
International perspectives. New York: Pergamon
Quinn, E., and Spreitzer, M. (1991) ‘The psychometrics of the competing values culture
instrument and an analysis of the impact of organisational culture on quality of life’,
Research in Organisational Change and Development, vol.5, pp.115-142.
Rad, A.M.M. (2006) "The impact of organisational culture on the successful implementation
of total quality management", The TQM Magazine, vol. 18, no. 6, pp. 606-625.
Rad, A.M.M. (2005) "A survey of total quality management in Iran: Barriers to successful
implementation in health care organisations", Leadership in Health Services, vol. 18, no.
3, pp. 12-34.
Radovilsky, Z.D., Gotcher, J.W. & Slattsveen, S. (1996) "Implementing total quality
management: statistical analysis of survey results", International Journal of Quality &
Reliability Management, vol. 13, no. 1, pp. 10-23.
Rao, S.S., Raghunathan, T. & Solis, L.E. (1997) "A comparative study of quality practices
and results in India, China and Mexico", Journal of Quality Management, vol. 2, no. 2,
pp. 235-250.
Rao, S.S., Solis, L.E. & Raghunathan, T. (1999) "A framework for international quality
management research: development and validation of a measurement instrument", Total
Quality Management, vol. 10, no. 7, pp. 1047-1075.
Redman, T. & Wilkinson, A. (2002) The informed student guide to human resource
management, Cengage Learning.

279
Reed, R., Lemak, D.J. & Mero, N.P. (2000) "Total quality management and sustainable
competitive advantage", Journal of Quality Management, vol. 5, no. 1, pp. 5-26.
Redding, G. (1994) ‘Comparative management theory: jungle, 200 or fossil bed?’,
Organisation Studies, vol.15 ,no.3, pp. 323–359.
Reger, R.K., Gustafson, L.T., Demarie, S.M. & Mullane, J.V. (1994) "Reframing the
organisation: Why implementing total quality is easier said than done", Academy of
Management Review, , pp. 565-584.
Remenyi, D. & Williams, B. (1998) Doing research in business and management: an
introduction to process and method, Sage Publications Ltd.
Rice E. and Caroline S. (1996) .” The Practice gap Barriers to the diffusion of Best
practices”. Department of Communication, Stanford University.
Revere, L., Black, K. & Huq, A. (2004) "Integrating Six Sigma and CQI for improving
patient care", The TQM Magazine, vol. 16, no. 2, pp. 105-113.
Roger S., Kevin L., Charles L. and Adrian C.(2008) ‘Six Sigma: Definition and underlying
theory ‘, Journal of Operations Management, vol.26 , no.4, pp. 536-554.
Ross, J. (1993), Total Quality Management: Text Cases and Readings, St Lucie Press, Delray
Beach, FL.
Ross, J. & Baker, R. (1995) "Total Quality Management: Text, Cases and Readings (2nd
edn)", International Journal of Project Management, vol. 13, no. 4, pp. 271.
Rousseau, D.M. (1990).” Assessing organisational culture: The case for multiple
methods”, in Schneider, B. (ed.) Organisational Climate and Culture, pp. 153-192.
San Francisco, CA,.Jossey-Bass.
Roufaiel, N.S. & Meissner, M. (1995) "Self-managing teams: A pipeline to quality and
technology management", Benchmarking: An International Journal, vol. 2, no. 1, pp. 21-
37.
Royall, R.M. (1997) Statistical evidence: a likelihood paradigm, Chapman & Hall/CRC.
Saha, S. & Hardie, M. (2005) "Culture of quality and the Australian construction industry",
13th International Group for Lean Construction Conference: Proceedings International
Group on Lean Construction, , pp. 531.
Sahney, V.K. & Warden, G.L. (1991) "The quest for quality and productivity in health
services.", Frontiers of health services management, vol. 7, no. 4, pp. 2.
Salegna, G. & Fazel, F. (2000) "Obstacles to implementing TQM", Quality Progress, vol. 33,
no. 7, pp. 53-64.

280
Samson, D. & Terziovski, M. (1999) "The relationship between total quality management
practices and operational performance", Journal of Operations Management, vol. 17, no.
4, pp. 393-409.
Samuel H. and Christopher F. (1994) ‘Developing a TQM Excellence Model’, The TQM
Magazine, vol.6, no.6, pp. 24-30.
Saraph, J.V., Benson, P.G. & Schroeder, R.G. (1989) "An instrument for measuring the
critical factors of quality management", Decision sciences, vol. 20, no. 4, pp. 810-829.
Saraph, J.V. & Sebastian, R.J. (1993) "Developing a quality culture.", Quality Progress, vol.
26, no. 9, pp. 73-78.
Sathe, V. (1985) Culture and related corporate realities, Irwin.
Sayle, A.J. (1994), Meeting ISO 9000 in a TQM World, 2nd ed., AJSL, Hampshire.
Saunders, M. "Lewis P & Thornhill A. (2007): Research Methods for Business Students",
Fourth Edition, Pearson Education Limited, Harlow UK..
Saunders, M., Lewis, P. & Thornhill, A. (2003) “Research Methods for Business Students, 3rd
Edition, Pearson Education Limited, Harlow UK.
Saunders, M., Lewis, P. & Thornhill, A. (2010) "Research Methods for Business Students, 5th
Edition" Prentice Hall
Schein, E. (2005) Organisational Culture and Leadership. San Francisco, CA: Jossey-Bass.
Publishers, San Francisco, CA
Schein, E.H., 1985. Organisational Culture and Leadership: A Dynamic View. Jossey-Bass
Publishers, San Francisco, CA.
Schein, E. (1997), “Organisational Culture and Leadership, 2nd rev ed., Jossey-Bass,
San Francisco, CA.
Schniederjans, M.J., Parast, M.M., Nabavi, M., Rao, S.S., & Raghunathan, T.S. (2006).
Comparative analysis of Malcolm Baldrige National Quality Award criteria: An
empirical study of India, Mexico, and the United States. Quality Management Journal,
Vol.13, no.4, 7–21.
Schroeder, R.G., Linderman, K., Liedtke, C. & Choo, A.S. (2008) "Six Sigma: Definition and
underlying theory", Journal of Operations Management, vol. 26, no. 4, pp. 536-554.
Schumacker, R.E. & Lomax, R.G. (2004) A beginner's guide to structural equation modeling,
Lawrence Erlbaum
Schwartz, S.H. (1994) Beyond individualism/collectivism: New cultural dimensions of values.
Sage Publications, Inc.

281
Schwartz, S.H. (1990) "Individualism-collectivism", Journal of cross-cultural psychology,
vol. 21, no. 2, pp. 139
Schalkwyk, J. (1998), ``Total quality management and the performance measurement
barrier'', The TQM Magazine, vol. 10 no.. 2, pp. 124-31.
Schwinn, D. (2002) Six Sigma and More,[Online], Quality e–line, Vol.4, No.7, .
Scott, T., Mannion, R., Davies, H. & Marshall, M. (2003) "The quantitative measurement of
organisational culture in health care: a review of the available instruments", Health
services research, vol. 38, no. 3, pp. 923-945.
Seago, J.A. (1997) "Organisational culture in hospitals: issues in measurement", Journal of
nursing measurement, vol. 5, no. 2, pp. 165-178
Sebastianelli, R. & Tamimi, N. (2003) "Understanding the obstacles to TQM success",
Quality Management Journal, vol. 10, no. 3, pp. 45-56
Shiba, S., Graham, A. & Walden, D. (1993) A new American TQM: four practical
revolutions in management (Portland, OR: Productivity Press
Sekaran, U. (2006) Research methods for business: A skill building approach, Wiley-India.
Sekaran, U. (2003) Research Methods for Business.4th ed. Hoboken, NJ: John
Wiley & Sons.
Shiba, S., Graham, A., Walden, D. & Bodek, N. (1993) "A New American TQM–Four
Practical Revolutions in Management", Cambridge, Mass,
Shin, D. Kalinowski, J.G. & Abou El-Enein, G. (1998) "Critical implementation issues in
total quality management", SAM Advanced Management Journal, vol. 63, pp. 10-14
Shortell, S.M., O'Brien, J.L., Carman, J.M., Foster, R.W., Hughes, E., Boerstler, H. &
O'Connor, E.J. (1995) "Assessing the impact of continuous quality improvement/total
quality management: concept versus implementation.", Health services research, vol. 30,
no. 2, pp. 377
Sila, I. (2007) "Examining the effects of contextual factors on TQM and performance through
the lens of organisational theories: An empirical study", Journal of Operations
Management, vol. 25, no. 1, pp. 83-109
Simard, C. & Rice, R.E. (2007) "The Practice Gap: Barriers to the Diffusion of Best
Practices", Rethinking knowledge management: from knowledge artifacts to knowledge
processes, vol. 12, pp. 87.
Sinclair, D. & Zairi, M. (2001) "An empirical study of key elements of total quality-based
performance measurement systems: A case study approach in the service industry
sector", Total Quality Management, vol. 12, no. 4, pp. 535-550.

282
Sinclair, J. & Collins, D. (1994) "Towards a quality culture", International Journal of Quality
& Reliability Management, vol. 11, no. 5, pp. 19-29.
Singh, N. (2010) "Adoption of industry-specific quality management system standards:
determinants for auto component firms in India", International Journal of Productivity
and Quality Management, vol. 5, no. 1, pp. 88-107.
Skerlavaj, M., Dimovski, V., Mrvar, A. & Pahor, M. (2008) "Intra-organisational learning
networks within knowledge-intensive learning environments", Interactive Learning
Environments, vol. 1, pp. 24.
Skerlavaj, M., Stemberger, M.I., Skrinjar, R. & Dimovski, V. (2007) "Organisational learning
culture--the missing link between business process change and organisational
performance", International Journal of Production Economics, vol. 106, no. 2, pp. 346-
367.
Smart, J.C. & St John, E.P. (1996) "Organisational culture and effectiveness in higher
education: A test of the “culture type” and “strong culture” hypotheses", Educational
Evaluation and Policy Analysis, vol. 18, no. 3, pp. 219.
Smith, C., Barnes, R. & Townsend, M. (2002) "Culture surveys: monitoring and enhancing
the impact of change program", Total Quality Management, vol. 13, pp. 855-861.
Smith, S., Tranfield, D., Foster, M. & Whittle, S. (1994) "Strategies for managing the TQ
agenda", International Journal of Operations & Production Management, vol. 14, no. 1,
pp. 75-88.
Solis, L.E., Rao, S., Raghu-Nathan, T., Chen, C.Y. & Pan, S.C. (1998) "Quality management
practices and quality results: a comparison of manufacturing and service sectors in
Taiwan", Managing Service Quality, vol. 8, no. 1, pp. 46-54.
Soltani, E., Sayed Javadin, R. & Lai, P. (2008) "A review of the theory and practice of
quality management: an integrative framework", Total Quality Management & Business
Excellence, vol. 19, no. 8, pp. 461–479.
Soltani, E., Van der Meer, R., Gennard, J. & Williams, T. (2003) "A TQM approach to HR
performance evaluation criteria", European Management Journal, vol. 21, no. 3, pp.
323-337.
Soltani, E., Van Der Meer, R. & Williams, T.M. (2005) "A Contrast of HRM and TQM
Approaches to Performance Management: Some Evidence*", British Journal of
Management, vol. 16, no. 3, pp. 211-230.
Soltani, E. (2003) Issues surrounding performance management in organisations with a TQM
orientation, Proceedings of the 6th International Conference of QMOD, 1–3 October,
2003, Paris, France.
Sousa, R. & Voss, C.A. (2002) "Quality management re-visited: a reflective review and
agenda for future research", Journal of Operations Management, vol. 20, no. 1, pp. 91-
109.

283
Sousa-Poza, A., Nystrom, H. & Wiebe, H. (2001) "A cross-cultural study of the differing
effects of corporate culture on TQM in three countries", International Journal of Quality
& Reliability Management, vol. 18, no. 7, pp. 744-761.
Steele, J. (1993) "Implementing total quality management for long‐and short‐term
bottom‐line results", National Productivity Review, vol. 12, no. 3, pp. 425-441.
Steingard, D.S. & Fitzgibbons, D.E. (1993) "A postmodern deconstruction of total quality
management (TQM)", Journal of Organisational Change Management, vol. 6, no. 5, pp.
27-42.
Stephens, P.R. , evans.,J.R. & Mathews, CH. (2005).”Importance and implementation of
Baldrige practices for small Businesses”, The Quality Management Journal, Vol.12,
no3,pp.21.
Stock G.N, McFadden, K. L. & Gowen G. R, 2006.Organisational culture, critical success
factors, and the reduction of hospital errors. Int. J. Production Economics 106 (2007)
368–392
Summers, B. (1993) "Total quality management: what went wrong", Corporate Board, vol.
14, no. 79, pp. 20-25.
Sunday, J.L. & Liberty, L. (1992) "Benchmarking the Baldrige Award", Quality Progress,
vol. 25, no. 9, pp. 75-77.
Sureshchandar, G., Rajendran, C. & Anantharaman, R. (2001) "A holistic model for total
quality service", International Journal of Service Industry Management, vol. 12, no. 4,
pp. 378-412.
Szulanski, G. (1996) "Exploring internal stickiness: Impediments to the transfer of best
practice within the firm", Strategic Management Journal, vol. 17, pp. 27-43.
Tabachnick, B. & Fidell, L. (2007) "Using Multivariate Statistics., 5th edn.(Allyn and Bacon:
Boston, MA.)", .
Tamimi, N. & Sebastianelli, R. (1998) "The barriers to total quality management", Quality
Progress, vol. 31, no. 6, pp. 57-60.
Tamimi, N. and Sebastianelli R. (2003) ‘Understanding the obstacles to TQM success’, The
Quality Management Journal. Vol.10, no.3, pp 45.
Tamimi, N. and Gershon, M. (1995), “A tool for assessing industry TQM practice versus the
Deming philosophy”, Production & Inventory Management Journal, vol. 36, no. 1, pp.
27-32.
Tan, K.C., Wong, M.F., Mehta, T. & Khoo, H.H. (2003) "Factors affecting the development
of national quality awards", Measuring Business Excellence, vol. 7, no. 3, pp. 37-45.
284
Tannock, J., Krasachol, L. & Ruangpermpool, S. (2002) "The development of total quality
management in Thai manufacturing SMEs: A case study approach", International
Journal of Quality & Reliability Management, vol. 19, no. 4, pp. 380-395.
Tashakkori, A., & Teddlie, C. (1998). Mixed methodology: Combining qualitative and
quantitative approaches (Applied Social Research Methods, No.46). Thousand
Oaks, CA: Sage.
Tata, J. & Prasad, S. (1998) "Cultural and structural constraints on total quality management
implementation", Total Quality Management, vol. 9, no. 8, pp. 703-710.
Taylor, W. & Wright, G. (2003) "A longitudinal study of TQM implementation: factors
influencing success and failure", Omega, vol. 31, no. 2, pp. 97-111.
Teddlie, C. & Tashakkori, A. (1998) "Mixed methodology: Combining qualitative and
quantitative approaches".
Thomas, B. (1994) The human dimension of quality, McGraw-Hill New York.
Thomas, C., Ward, M., Chorba, C. & Kumiega, A. (1990) "Measuring and interpreting
organisational culture", The Journal of nursing administration, vol. 20, no. 6, pp. 17-24.
Thomas M., Gren A. and Rodney M. (2004) ‘Barriers to innovation within small firms in a
peripheral location’, International Journal of Entrepreneurial Behaviour & Research,
vol.10 , no.3, pp.206-221.
Thompson, J.D. (1967) "Organisations in action", New York, NY : McGraw- Hill.
Thompson, K.R. (1998) "Confronting the paradoxes in a total quality environment",
Organisational dynamics, vol. 26, no. 3, pp. 62-74.
Tolchinsky, P. & Ranney, J. (1994) "Preventing TQM crash landings", Journal for Quality
and Participation, , pp. 50-50.
Trompenaars, F. (1994) Riding the waves of culture: Understanding diversity in global
business, Irwin New York.
T, Paul, H., & Speece, M.W. (2003). Evaluation of new manufacturing technology
implementation: And empirical study in the Thai automotive industry.
Technovation, vol.23, pp321–331.
Tushman, M. L. and O'Reilly, IIIC (1996), California management review, 38(4), 8 - 29
Tucker, R.W., McCoy, W.J. & Evans, L.C. (1990) "Can questionnaires objectively assess
organisational culture?", Journal of Managerial Psychology, vol. 5, no. 4, pp. 4-11.
Ulrika H. and Bengt K. (2000) ‘TQM as a management system consisting of values,
techniques and tools’, The TQM Magazine, vol.12, no.4, pp. 238 – 244.
US Department of Commerce. (2006). Baldrige National Quality Program – Criteria for
285
Performance Excellence”, National Institute of Standards and Technology.
Washington, DC: Government Printing Office.
Utley, D., Westbrook, J. & Turner, S. (1997) "The relationship between Herzberg's two-
factor theory and quality improvement implementation", Engineering Management
Journal-Rolla-, vol. 9, pp. 5-14.
Van der Wiele, A., Williams, A., Dale, B., Carter, G., Kolb, F., Luzon, D., Schmidt, A. &
Wallace, M. (1996) "Quality management self-assessment: an examination in European
business", Journal of General Management, vol. 22, pp. 48-67.
Van Donk, D.P. & Sanders, G. (1993) "Organisational culture as a missing link in quality
management", International Journal of Quality & Reliability Management, vol. 10, no.
5.
Van Schalkwyk, J.C. (1998) "Total quality management and the performance measurement
barrier", The TQM Magazine, vol. 10, no. 2, pp. 124-131.
Vorley, G. & Tickle, F. (2001) Quality Management: Principles and Techniques, Quality
Management & Training.
Vuppalapati, K., Ahire, S.L. & Gupta, T. (1995) "JIT and TQM: a case for joint
implementation", International Journal of Operations & Production Management, vol.
15, no. 5, pp. 84-94.
Wacker, J.G. (2004) "A theory of formal conceptual definitions: developing theory-building
measurement instruments", Journal of Operations Management, vol. 22, no. 6, pp. 629-
650.
Walker, H., Symon, G. & Davies, B. (1996) "Assessing organisational culture: a comparison
of methods", International Journal of Selection and Assessment, vol. 4, pp. 96-105.
Wallach, E.J. (1983) "Individuals and organisations: The cultural match.", Training &
Development Journal, .
Walsh, A., Hughes, H. & Maddox, D.P. (2002) "Total quality management continuous
improvement: is the philosophy a reality?", Journal of European Industrial Training,
vol. 26, no. 6, pp. 299-307.
Westbrook, J. & Utley, D. (1995) "TQM-The effect of culture on implementation",
Engineering Management Journal-ROLLA-, vol. 7, pp. 31-34.
Whalen, M.J. & Rahim, M.A. (1994) Common barriers to implementation and development
of a TQM program, .
Wheaton, B., Muthen, B., Alvin, D.F. & Summers, G.F. (1977) "Assessing reliability and
stability in panel models", Sociological methodology, vol. 8, pp. 84-136.
Whiteley, R.C. (1993) The customer-driven company: Moving from talk to action, Basic
Books.
286
Whiting, R. (1991) "Lessons from the best in class", Electronic Business, vol. 17, no. 19.
Wilkins, A.L. & Ouchi, W.G. (1983) "Efficient cultures: Exploring the relationship between
culture and organisational performance", Administrative Science Quarterly, , pp. 468-
481.
Wilkinson, A., Redman, T. & Snape, E. (1993) "Quality and the Manager", .
Wilkinson, A., Redman, T., Snape, E. & Marchington, M. (1998) Managing with total quality
management: theory and practice, Macmillan London.
William N. (2004) Basics of Social Research. Pearson publish.
Wilson, D.D., & Collier, D.A. (2000).An empirical investigation of the Malcolm Baldrige
National Quality Award casual model. Decision Sciences, vol.31, pp361–390.
Winser, J. and Corney, W. (2001), ``Comparing practices for capturing bank customer
feedback: Internet versus traditional banking?’’, Benchmarking: An International
Journal, vol. 8 ,no. 3, pp. 240-50.
Withers, B.E. & Ebrahimpour, M. (2001) "Impacts of ISO 9000 registration on European
firms: a case analysis", Integrated Manufacturing Systems, vol. 12, no. 2, pp. 139-151.
Wruck, K.H. & Jensen, M.C. (1994) "Science, specific knowledge, and total quality
management", Journal of Accounting and Economics, vol. 18, no. 3, pp. 247-287.
www.bahrainedb.com/economic-vision.aspx ,(2009)
Yasin, M.M. & Alavi, J. (2007) "The effectiveness of quality improvement initiatives in
service operational context", The TQM Magazine, vol. 19, no. 4, pp. 354-367.
Yeung, K., Brockbank, J. & Ulrich, D. (1991) "Organizatinal cultures and human resource
practices: An empirical assessment.", Research in organisational change and
development, 5 (??), 59-81., .
Yang, C.C. (2003) "The establishment of a TQM system for the health care industry", The
TQM Magazine, vol. 15, no. 2, pp. 93-98.
Yin Robert, K. (1994) "Case study research: Design and methods", Sage publications, Inc.,
thousuand Oaks, USA, .
Yin, R.K. (2003) "Case study research (Vol. 5)", Thousand Oaks, California, .
Youssef, M.A., Boyd, J. & Williams, E. (1996) "The impact of total quality management on
firms responsiveness: an empirical analysis", Total Quality Management, vol. 7, no. 1,
pp. 127-144.
Yusof, S. & Aspinwall, E. (1999) "Critical success factors for total quality management
implementation in small and medium enterprises", Total Quality Management, vol. 10,
no. 4, pp. 803-809.

287
Zairi, M. (2000) "Managing customer satisfaction: a best practice perspective", The TQM
Magazine, vol. 12, no. 6, pp. 389-394.
Zairi, M. (1999a) "Managing excellence: leadership", The TQM Magazine, vol. 11, no. 4, pp.
215-224.
Zairi, M. (1999b) "Managing excellence: policy and strategy", The TQM Magazine, vol. 11,
no. 2, pp. 74-79.
Zairi, M., Letza, S. & Oakland, J. (1994) "Does TQM impact on bottom-line results?", The
TQM Magazine, vol. 6, no. 1, pp. 38-43.
Zairi, M. & Youssef, M.A. (1995) "Benchmarking critical factors for TQM: Part I: Theory
and foundations", Benchmarking: An International Journal, vol. 2, no. 1, pp. 5-20.
Zammuto, R. & Krakower, J. (1991) "Quantitative and qualitative studies of organisational
culture.", Research in organisational change and development, vol.5, pp83-114..
Zeitz, G., Johannesson, R. & Ritchie, J.E. (1997) "An employee survey measuring total
quality management practices and culture", Group &Organisation Management, vol. 22,
no. 4, pp. 414.
Zeng, S., Tian, P. & Tam, C. (2007) "Overcoming barriers to sustainable implementation of
the ISO 9001 system", Managerial Auditing Journal, vol. 22, no. 3, pp. 244-254.
Zikmund, W.G. (2003) "Business Research Methods. 7th", Oklahoma, EUA: Thomson,
Zu, X., Fredendall, L.D. & Douglas, T.J. (2008) "The evolving theory of quality
management: the role of Six Sigma", Journal of Operations Management, vol. 26, no. 5,
pp. 630-650.
Zu, X., Robbins, T.L. & Fredendall, L.D. (2009) "Mapping the critical links between
organisational culture and TQM/Six Sigma practices", International Journal of
Production Economics, vol. 123, no. 1, pp. 86-106.
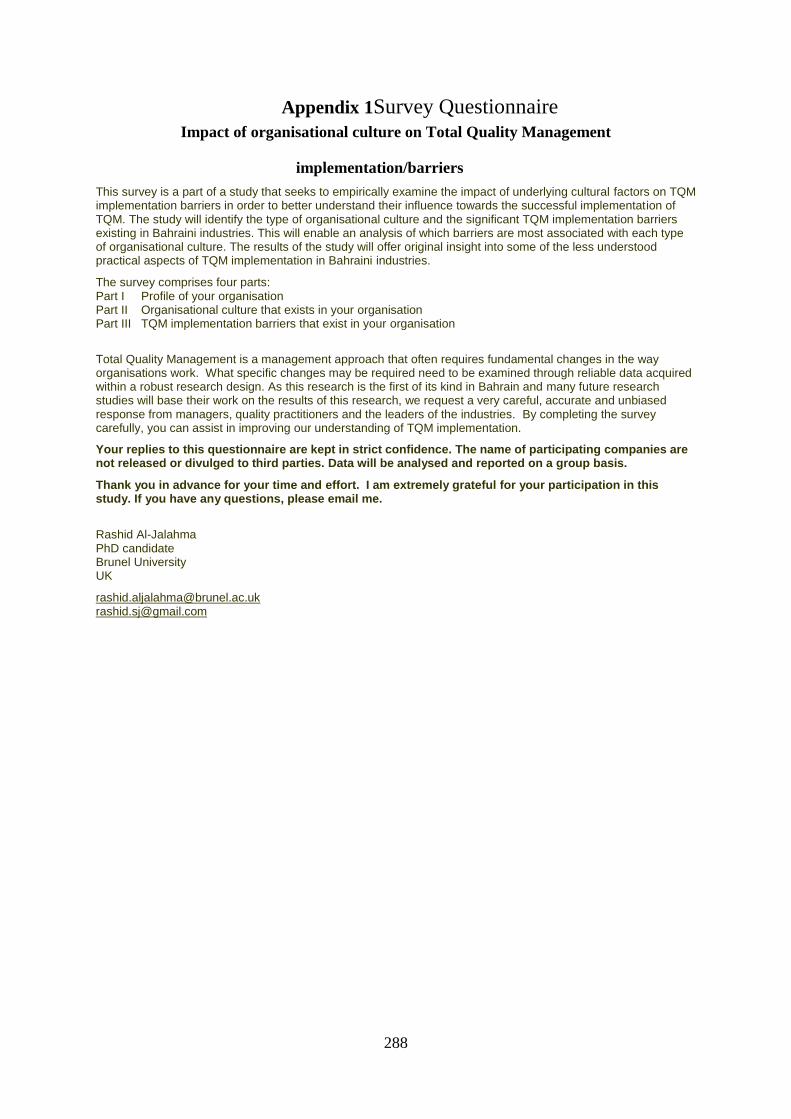
288
Appendix 1Survey Questionnaire Impact of organisational culture on Total Quality Management
implementation/barriers
This survey is a part of a study that seeks to empirically examine the impact of underlying cultural factors on TQM implementation barriers in order to better understand their influence towards the successful implementation of TQM. The study will identify the type of organisational culture and the significant TQM implementation barriers existing in Bahraini industries. This will enable an analysis of which barriers are most associated with each type of organisational culture. The results of the study will offer original insight into some of the less understood practical aspects of TQM implementation in Bahraini industries.
The survey comprises four parts: Part I Profile of your organisation Part II Organisational culture that exists in your organisation Part III TQM implementation barriers that exist in your organisation
Total Quality Management is a management approach that often requires fundamental changes in the way organisations work. What specific changes may be required need to be examined through reliable data acquired within a robust research design. As this research is the first of its kind in Bahrain and many future research studies will base their work on the results of this research, we request a very careful, accurate and unbiased response from managers, quality practitioners and the leaders of the industries. By completing the survey carefully, you can assist in improving our understanding of TQM implementation.
Your replies to this questionnaire are kept in strict confidence. The name of participating companies are not released or divulged to third parties. Data will be analysed and reported on a group basis.
Thank you in advance for your time and effort. I am extremely grateful for your participation in this study. If you have any questions, please email me.
Rashid Al-Jalahma PhD candidate Brunel University UK

289
TQM Survey – Part I
Personal and Organisational profile
Listed below are questions about yourself and the profile of your organisation. Please provide as much detail as possible.
1. Job title: ____________________________________________
2. Highest level of education:
HSSC
Diploma
Bachelor
Masters
PhD
Other, please specify:
3. Professional qualification: ___________________________________________
4. Quality Management experience
Less than 1 year
1 to 3 years 4 to 7 years 8 to 15 years
More than 15 years
Choose one that applies
5. Work experience
Less than 1 year
1 to 3 years 4 to 7 years 8 to 15 years
More than 15 years
Choose one that applies
6. Number of employees in your organisation: ____________________________________
7. Type of company
(Please indicate which one or more of the following apply)
Primarily manufacturing
Professional service (i.e. customized service for individual customers, e.g. consultancy)
Mass service (i.e. standardized services for mass consumption, e.g. retail banking)
Other, please specify:
8. Type of operation/establishment
(Please tick the ONE that best describes your establishment)
A single independent local establishment
A branch of a local establishment
Part of a multi-national establishment
Other, please specify:

290
9. If a manufacturer, which of the following
describes your production process - (Please
tick any that apply)
Make-to-order
Make-to-inventory
Other, please specify:
10. If a manufacturer, which of the following describes your products - (Please tick any that
apply)
End user products
Parts/components
Other, please specify:
11. Type of Quality Management in your organisation and their duration
(Please select the duration for each of the following as they apply in your organisation)
Not yet
Less than 1 year
1 to 4 years 4 to 7 years More than 7
years
TQM
Six Sigma
ISO 9000
QFD
Kaizen
Lean manufacturing
BPR
Other
Others - please specify here

291
TQM Survey – Part II
IDENTIFYING ORGANISATIONAL CULTURE PROFILE
Founders of Total Quality Management (TQM) and many other researchers have described TQM as a universal philosophy that can fit anywhere. However, they argue that the business environment and organisational culture have a great influence on successful TQM implementation. This research is an attempt to explore the nature of this influence in Bahraini organisations. Organisational culture is examined through six dimensions (questions 12 - 17 below). For each four statements (A, B, C & D) relate to the type of ORGANISATION that yours is most like.
Please select the appropriate response (from Strongly disagree, Disagree, Neutral, Agree, Strongly agree) for each statement (A, B, C & D) depending on how similar the statement is to your ORGANISATION. None of the statements are any better than the others; they are just different.
12. The organisation is a very
Strongly disagree
1
Disagree 2
Neutral 3
Agree 4
Strongly agree 5
A: Personal place - it is like an extended family. People seem to share a lot of themselves
B: Dynamic and entrepreneurial place - people are willing to stick their necks out (try new things) and take risks
C: Result oriented - a major concern is with getting the job done. People are very competitive and achievement oriented
D: Controlled and structured place - formal procedures generally govern what people do
13. The leadership in the organisation is considered to exemplify
Strongly disagree
1
Disagree 2
Neutral 3
Agree 4
Strongly agree 5
A: Mentoring, facilitating or nurturing

292
B: Entrepreneurship, innovating, or risk taking
C: A no-nonsense, aggressive, results-oriented focus
D: Coordinating, organizing, or smooth-running efficiency
14. The management style in the organisation is characterized by
Strongly disagree
1
Disagree 2
Neutral 3
Agree 4
Strongly agree 5
A: Teamwork, consensus, and participation
B: Individual risk-taking, innovation, freedom, and uniqueness
C: Hard-driving competitiveness, high demands, and achievement
D: Security of employment, conformity, predictability, and stability in relationships
15. The glue (binding force) that holds the organisation together is
Strongly disagree 1
Disagree 2
Neutral 3
Agree 4
Strongly agree 5
A: Loyalty and mutual trust - commitment to this organisation runs high
B: Commitment to innovation and development - there is an emphasis on being on the cutting edge
C: Emphasis on achievement and goal accomplishment - aggressiveness and winning are common themes
D: Formal rules and policies - maintaining a smooth-running organisation is important
293
16. The organisation emphasizes
Strongly disagree
1
Disagree 2
Neutral 3
Agree 4
Strongly agree 5
A: Human development - high trust, openness, and participation persist
B: Acquiring new resources and creating new challenges - trying new things and prospecting for opportunities are valued
C: Competitive actions and achievements – hitting stretch targets and winning in the marketplace are dominant
D: Permanence and stability - efficiency, control and smooth operations are important
17. The organisation defines success on the basis of
Strongly disagree 1
Disagree 2
Neutral 3
Agree 4
Strongly agree 5
A: The development of human resources, teamwork, employee commitment, and concern for people
B: Having the most unique or newest products. It is a product leader and innovator
C: Winning in the marketplace and outpacing the competition - competitive market leadership is the key
D: Efficiency - dependable delivery, smooth scheduling and low-cost production are critical
Source: Organisational Culture Assessment Instrument (OCAI) developed by Cameron and Quinn (1999)

294
TQM Survey – part III
TQM IMPLEMENTATION /BARRIERS
The main focus of the Total Quality Management (TQM) concept is to create the conditions for continuous improvement of products, services and processes. TQM has the potential to integrate many improvement philosophies proposed over the last few decades. However, TQM can prove difficult to achieve if it is not implemented well. One of the possible flaws in the TQM implementation approach is that implementers of TQM don’t consider the possible impact of underlying implementation barriers during the implementation effort. This study seeks to explore this impact.
Please read the following statements carefully and indicate how true each is about your organisation (Strongly disagree, Disagree, Neutral, Agree, Strongly agree)
18. Top management barriers
Strongly disagree 1
Disagree 2
Neutral 3
Agree 4
Strongly agree 5
18.1 - Senior managers in our organisation show visible commitment and support to quality
18.2 - Senior managers allocate inadequate resources for employee training
18.3 - The leaders in our organisation frequently set goals and objectives for quality improvement
18.4 - In our organisation there is frequent turnover of managers
18.5 - There are many layers of management in the organisation
18.6 - Management style slows down learning culture
18.7 - Middle managers provide an effective link between top manager and operators
18.8 - Quality awareness and improvement is championed by middle managers
295
19. Employee barriers
Strongly disagree
1
Disagree 2
Neutral 3
Agree 4
Strongly agree 5
19.1 - Our employees are rarely empowered to apply quality improvement efforts in their area
19.2 - Employee involvement in improvement projects is a common practice in our organisation
19.3 - Our employees are trained in quality improvement skills
19.4 - Training employees in group discussion and communication techniques is given low priority in our organisation
19.5 - Employees and teams are often recognized for achievements in quality improvement
19.6 - Employee satisfaction across the organisation is low
19.7 - In our organisation employees tend to be resistant to change
19.8 - There is a lack of internal TQM expertise in our organisation
19.9 - We have an appropriate performance evaluation and reward system
20. Customer barriers
Strongly disagree
1
Disagree 2
Neutral 3
Agree 4
Strongly agree 5
20.1 - The organisation has an effective system to measure customer satisfaction
296
20.2 - Customers' needs and expectations are rarely assessed in our organisation
20.3 - The organisation lacks an effective customer feedback system
20.4 - In our organisation, contact with key customers could be much closer
21. Planning barriers
Strongly disagree
1
Disagree 2
Neutral 3
Agree 4
Strongly agree 5
21.1 - The strategic plans of our organisation are customer driven
21.2 - The organisation's strategic plans don't include quality goals
21.3 - We have specific ways of institutionalizing new approaches/ tools/ techniques in our organisation
21.4 - There are not enough joint planning activities with our suppliers
22. Process management barriers
Strongly disagree
1
Disagree 2
Neutral 3
Agree 4
Strongly agree 5
22.1 -The quality initiatives in our organisation do not include all organisational functions/ departments
22.2 - Quality is treated as a separate initiative in our organisation (i.e. it is delegated to selected

297
individuals only)
22.3 - Communication with our external network of stakeholders tends to be ineffective
22.4 - Adequate resources to effectively employ TQM are not available in our organisation
22.5 - Cross functional teams are not used in our organisation
22.6 - Organisation tends to have many uncoordinated (ad hoc) quality initiatives
23. Information management barriers
Strongly disagree
1
Disagree 2
Neutral 3
Agree 4
Strongly agree 5
23.1 - There tends to be poor inter-organisational communication in our organisation
23.2 - There is no need for individuals to liaise with people outside of their own departments
23.3 - Quality and performance information is disseminated widely in the organisation
23.4 - Our organisation effectively and frequently measures its quality performance
23.5 - The best practices / or products of other companies are benchmarked by our organisation
23.6 - Our organisation would like to implement quality initiatives but there is not enough time to do this
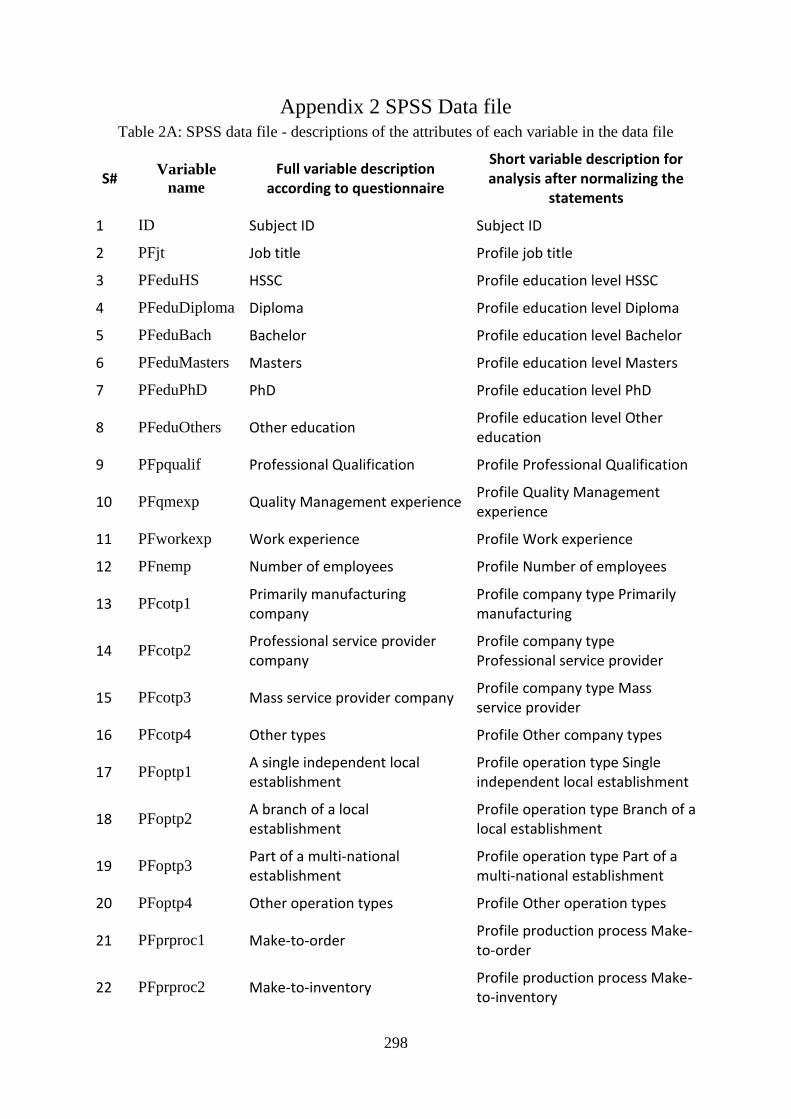
298
Appendix 2 SPSS Data file Table 2A: SPSS data file - descriptions of the attributes of each variable in the data file
S# Variable
name
Full variable description according to questionnaire
Short variable description for analysis after normalizing the
statements
1 ID Subject ID Subject ID
2 PFjt Job title Profile job title
3 PFeduHS HSSC Profile education level HSSC
4 PFeduDiploma Diploma Profile education level Diploma
5 PFeduBach Bachelor Profile education level Bachelor
6 PFeduMasters Masters Profile education level Masters
7 PFeduPhD PhD Profile education level PhD
8 PFeduOthers Other education Profile education level Other education
9 PFpqualif Professional Qualification Profile Professional Qualification
10 PFqmexp Quality Management experience Profile Quality Management experience
11 PFworkexp Work experience Profile Work experience
12 PFnemp Number of employees Profile Number of employees
13 PFcotp1 Primarily manufacturing company
Profile company type Primarily manufacturing
14 PFcotp2 Professional service provider company
Profile company type Professional service provider
15 PFcotp3 Mass service provider company Profile company type Mass service provider
16 PFcotp4 Other types Profile Other company types
17 PFoptp1 A single independent local establishment
Profile operation type Single independent local establishment
18 PFoptp2 A branch of a local establishment
Profile operation type Branch of a local establishment
19 PFoptp3 Part of a multi-national establishment
Profile operation type Part of a multi-national establishment
20 PFoptp4 Other operation types Profile Other operation types
21 PFprproc1 Make-to-order Profile production process Make-to-order
22 PFprproc2 Make-to-inventory Profile production process Make-to-inventory

299
23 PFprproc3 Other process types Profile Other production process types
24 PFprtp1 End user products Profile product type End user products
25 PFprtp2 Parts/components Profile product type Parts/components
26 PFprtp3 Other product types Profile Other product types
27 PFqmdur1 TQM duration Profile QM type TQM duration
28 PFqmdur2 Six sigma duration Profile QM type Six sigma duration
29 PFqmdur3 ISO 9000 duration Profile QM type ISO 9000 duration
30 PFqmdur4 QFD duration Profile QM type QFD duration
31 PFqmdur5 Kaizen duration Profile QM type Kaizen duration
32 PFqmdur6 Lean manufacturing duration Profile QM type Lean manufacturing duration
33 PFqmdur7 BPR duration Profile QM type BPR duration
34 PFqmdur8 Others duration Others duration
35 PFqmOthr Other QM type Profile Other QM types
36 OCd1A
The organisation is a very personal place - it is like an extended family. People seem to share a lot of themselves
Organisation character in group culture
37 OCd1B
The organisation is a very dynamic and entrepreneurial place - people are willing to stick their necks out (try new things) and take risks
Organisation character in developmental culture
38 OCd1C
The organisation is a very result oriented place - a major concern is with getting the job done. People are very competitive and achievement oriented
Organisation character in rational culture
39 OCd1D
The organisation is very controlled and structured place - formal procedures generally govern what people do
Organisation character in hierarchical culture
40 OCd2A The leadership in the organisation exemplifies mentoring, facilitating or
Leadership character in group culture

300
nurturing
41 OCd2B
The leadership in the organisation exemplifies entrepreneurship, innovating, or risk taking
Leadership character in developmental culture
42 OCd2C
The leadership in the organisation exemplifies a no-nonsense, aggressive, results-oriented focus
Leadership character in rational culture
43 OCd2D
The leadership in the organisation exemplifies coordinating, organizing, or smooth-running efficiency
Leadership character in hierarchical culture
44 OCd3A
The management style in the organisation is characterized by teamwork, consensus, and participation
Management style in group culture
45 OCd3B
The management style in the organisation is characterized by individual risk-taking, innovation, freedom, and uniqueness
Management style in developmental culture
46 OCd3C
The management style in the organisation is characterized by hard-driving competitiveness, high demands, and achievement
Management style in rational culture
47 OCd3D
The management style in the organisation is characterized by security of employment, conformity, predictability, and stability in relationships
Management style in hierarchical culture
48 OCd4A
The binding force that holds the organisation together is loyalty and mutual trust - commitment to this organisation runs high
Binding force in group culture
49 OCd4B
The binding force that holds the organisation together is commitment to innovation and development - there is an emphasis on being on the cutting edge
Binding force in developmental culture
50 OCd4C The binding force that holds the organisation together is
Binding force in rational culture
301
emphasis on achievement and goal accomplishment - aggressiveness and winning are common themes
51 OCd4D
The binding force that holds the organisation together is formal rules and policies - maintaining a smooth-running organisation is important
Binding force in hierarchical culture
52 OCd5A
The organisation emphasizes on human development - high trust, openness, and participation persist
Organisation emphasis in group culture
53 OCd5B
The organisation emphasizes on acquiring new resources and creating new challenges - trying new things and prospecting for opportunities are valued
Organisation emphasis in developmental culture
54 OCd5C
The organisation emphasizes on competitive actions and achievements - hitting stretch targets and winning in the marketplace are dominant
Organisation emphasis in rational culture
55 OCd5D
The organisation emphasizes on permanence and stability - efficiency, control and smooth operations are important
Organisation emphasis in hierarchical culture
56 OCd6A
The organisation defines success on the basis of development of human resources, teamwork, employee commitment, and concern for people
Success criteria in group culture
57 OCd6B
The organisation defines success on the basis of having the most unique or newest products. It is a product leader and innovator
Success criteria in developmental culture
58 OCd6C
The organisation defines success on the basis of winning in the marketplace and outpacing the competition - competitive market leadership is the key
Success criteria in rational culture
59 OCd6D The organisation defines success on the basis of efficiency -
Success criteria in hierarchical culture

302
dependable delivery, smooth scheduling and low-cost production are critical
60 BRtm1
Senior managers in our organisation show visible commitment and support to quality
Top management barrier - lack of commitment and support to quality
61 BRtm2
Senior managers allocate inadequate resources for employee training
Top management barrier - inadequate resources for employee training
62 BRtm3
The leaders in our organisation frequently set goals and objectives for quality improvement
Top management barrier - lack of goals and objectives for quality improvement
63 BRtm4 In our organisation there is frequent turnover of managers
Top management barrier - frequent turnover of managers
64 BRtm5 There are many layers of management in the organisation
Top management barrier - many layers of management
65 BRtm6 Management style slows down learning culture
Top management barrier - management style slows down learning culture
66 BRtm7
Middle managers provide an effective link between top manager and operators
Top management barrier - ineffective link of middle management
67 BRtm8
Quality awareness and improvement is championed by middle managers
Top management barrier - lack of creating quality awareness and improvement by middle managers
68 BRemp1
Our employees are rarely empowered to apply quality improvement efforts in their area
Employee barrier - lack of empowerment to apply quality improvement efforts
69 BRemp2
Employee involvement in improvement projects is a common practice in our organisation
Employee barrier - lack of involvement in improvement projects
70 BRemp3 Our employees are trained in quality improvement skills
Employee barrier - lack of training in quality improvement skills
71 BRemp4 Training employees in group discussion and communication techniques is given low priority
Employee barrier - lack of employee training in group discussion and communication

303
in our organisation techniques
72 BRemp5
Employees and teams are often recognized for achievements in quality improvement
Employee barrier - lack of recognition for achievements in quality improvement
73 BRemp6 Employee satisfaction across the organisation is low
Employee barrier - lack of satisfaction
74 BRemp7 In our organisation employees tend to be resistant to change
Employee barrier - resistantance to change
75 BRemp8 There is a lack of internal TQM expertise in our organisation
Employee barrier - lack of internal TQM expertise
76 BRemp9
We have an appropriate performance evaluation and reward system
Employee barrier - Inappropriate performance evaluation and reward system
77 BRcus1
The organisation has an effective system to measure customer satisfaction
Customer barrier - lack of effective system to measure customer satisfaction
78 BRcus2
Customers' needs and expectations are rarely assessed in our organisation
Customer barrier - needs and expectations not assessed
79 BRcus3
The organisation lacks an effective customer feedback system
Customer barrier - lack of effective customer feedback system
80 BRcus4
In our organisation, contact with key customers could be much closer
Customer barrier - lack of contact with key customers
81 BRpln1
The strategic plans of our organisation are customer driven
Planning barrier - strategic plans are not customer driven
82 BRpln2 The organisation's strategic plans don't include quality goals
Planning barrier - strategic plans don't include quality goals
83 BRpln3
We have specific ways of institutionalizing new approaches/ tools/ techniques in our organisation
Planning barrier - lack of institutionalizing new approaches/tools/techniques
84 BRpln4
There are not enough joint planning activities with our suppliers
Planning barrier - not enough joint planning activities with suppliers
85 BRproc1
The quality initiatives in our organisation do not include all organisational functions/ departments
Process barrier - quality initiatives do not include all organisational functions/departments

304
86 BRproc2
Quality is treated as a separate initiative in our organisation (i.e. it is delegated to selected individuals only)
Process barrier - quality initiative is delegated to selected individuals only
87 BRproc3
Communication with our external network of stakeholders tends to be ineffective
Process barrier - ineffective communication with stakeholders
88 BRproc4
Adequate resources to effectively employ TQM are not available in our organisation
Process barrier - inadequate resources to effectively employ TQM
89 BRproc5 Cross functional teams are not used in our organisation
Process barrier - cross functional teams are not used
90 BRproc6
Organisation tends to have many uncoordinated (ad hoc) quality initiatives
Process barrier - many uncoordinated quality initiatives
91 BRim1
There tends to be poor inter-organisational communication in our organisation
Information barrier - poor inter-organisational communication
92 BRim2
There is no need for individuals to liaise with people outside of their own departments
Information barrier - individuals do not liaise with other departments
93 BRim3
Quality and performance information is disseminated widely in the organisation
Information barrier - lack of disseminating quality and performance information
94 BRim4
Our organisation effectively and frequently measures its quality performance
Information barrier - quality performance is not measured
95 BRim5
The best practices / or products of other companies are benchmarked by our organisation
Information barrier - the best practices/products of others are not benchmarked
96 BRim6
Our organisation would like to implement quality initiatives but there is not enough time to do this
Information barrier - lack of enough time to implement quality initiatives
97 PRipm1 Our staff turnover rate is increasing
Internal performance - low staff turnover rate
98 PRipm2 Rate of defects/errors in our products/services is increasing
Internal performance - Rate of defects/errors in our products/services is increasing
305
99 PRipm3
Our employees promptly respond to customers orders, complaints and enquiries
Internal performance - prompt response to customers
100 PRipm4 Productivity rate is increasing Internal performance - productivity rate is increasing
101 PRepm1
The number of repeat customers for our products/services is continually increasing
External performance - repeat customers continually increasing
102 PRepm2
The number of customer complaints about our products/services is increasing
External performance - customer complaints decreasing
103 PRepm3 Our gross profit rate is continually increasing
External performance - gross profit rate is continually increasing
104 PRepm4 Our market share is growing External performance - market share is growing
105 PRepm5 Our competitive position is improving
External performance - competitive position is improving
106 PRepm6 The number of successful new products/services is increasing
External performance - number of new products/services is increasing

306
Table 2B: Constructs of culture types and their dimensions
Variable Description New
composite
variable
OCd1A Organisation character in group culture Group
(group culture) OCd2A Leadership character in group culture
OCd3A Management style in group culture
OCd4A Binding force in group culture
OCd5A Organisation emphasis in group culture
OCd6A Success criteria in group culture
OCd1B Organisation character in developmental
culture
Develop
(developmental
culture) OCd2B Leadership character in developmental
culture
OCd3B Management style in developmental culture
OCd4B Binding force in developmental culture
OCd5B Organisation emphasis in developmental
culture
OCd6B Success criteria in developmental culture
OCd1C Organisation character in rational culture Rational
(rational
culture) OCd2C Leadership character in rational culture
OCd3C Management style in rational culture
OCd4C Binding force in rational culture
OCd5C Organisation emphasis in rational culture
OCd6C Success criteria in rational culture
OCd1D Organisation character in hierarchical culture Hierarch
(hierarchical
culture) OCd2D Leadership character in hierarchical culture
OCd3D Management style in hierarchical culture
OCd4D Binding force in hierarchical culture
OCd5D Organisation emphasis in hierarchical culture
OCd6D Success criteria in hierarchical culture
Variable Description New
composite
variable
OCd1A Organisation character in group culture Group
307
OCd2A Leadership character in group culture (group culture)
OCd3A Management style in group culture
OCd4A Binding force in group culture
OCd5A Organisation emphasis in group culture
OCd6A Success criteria in group culture
OCd1B Organisation character in developmental
culture
Develop
(developmental
culture) OCd2B Leadership character in developmental
culture
OCd3B Management style in developmental culture
OCd4B Binding force in developmental culture
OCd5B Organisation emphasis in developmental
culture
OCd6B Success criteria in developmental culture
OCd1C Organisation character in rational culture Rational
(rational
culture) OCd2C Leadership character in rational culture
OCd3C Management style in rational culture
OCd4C Binding force in rational culture
OCd5C Organisation emphasis in rational culture
OCd6C Success criteria in rational culture
OCd1D Organisation character in hierarchical culture Hierarch
(hierarchical
culture) OCd2D Leadership character in hierarchical culture
OCd3D Management style in hierarchical culture
OCd4D Binding force in hierarchical culture
OCd5D Organisation emphasis in hierarchical culture
OCd6D Success criteria in hierarchical culture
Table 2B Constructs of TQM implementation barriers and their respective indicators
Variable Description New
composite
variable
BRtm1 lack of commitment and support to quality BRtm
(top
management
barrier)
BRtm2 inadequate resources for employee
training
BRtm3 lack of goals and objectives for quality
308
improvement
BRtm4 frequent turnover of managers
BRtm5 many layers of management
BRtm6 management style slows down learning
culture
BRtm7 ineffective link of middle management
BRtm8 lack of creating quality awareness and
improvement by middle managers
BRemp1 lack of empowerment to apply quality
improvement efforts
BRemp
(employees
barrier) BRemp2 lack of involvement in improvement
projects
BRemp3 lack of training in quality improvement
skills
BRemp4 lack of employee training in group
discussion and communication techniques
BRemp5 lack of recognition for achievements in
quality improvement
BRemp6 lack of satisfaction
BRemp7 resistance to change
BRemp8 lack of internal TQM expertise
BRemp9 Inappropriate performance evaluation and
reward system
BRcus1 lack of effective system to measure
customer satisfaction
BRcus
(customer
barrier) BRcus2 needs and expectations not assessed
BRcus3 lack of effective customer feedback
system
BRcus4 lack of contact with key customers
BRpln1 strategic plans are not customer driven BRpln
(Planning
barriers) BRpln2 strategic plans don't include quality goals
BRpln3 lack of institutionalizing new
approaches/tools/techniques
BRpln4 not enough joint planning activities with
suppliers
BRproc1 quality initiatives do not include all
organisational functions/departments
BRproc
(process
barriers) BRproc2 quality initiative is delegated to selected
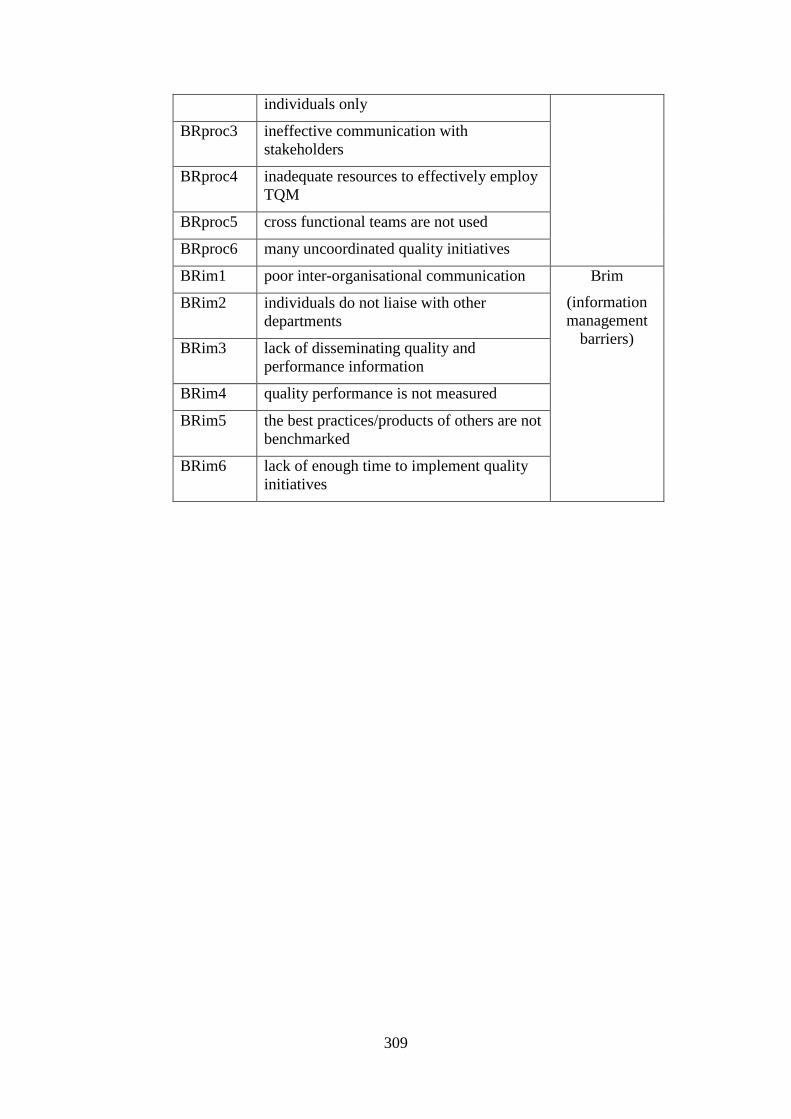
309
individuals only
BRproc3 ineffective communication with
stakeholders
BRproc4 inadequate resources to effectively employ
TQM
BRproc5 cross functional teams are not used
BRproc6 many uncoordinated quality initiatives
BRim1 poor inter-organisational communication Brim
(information
management
barriers)
BRim2 individuals do not liaise with other
departments
BRim3 lack of disseminating quality and
performance information
BRim4 quality performance is not measured
BRim5 the best practices/products of others are not
benchmarked
BRim6 lack of enough time to implement quality
initiatives
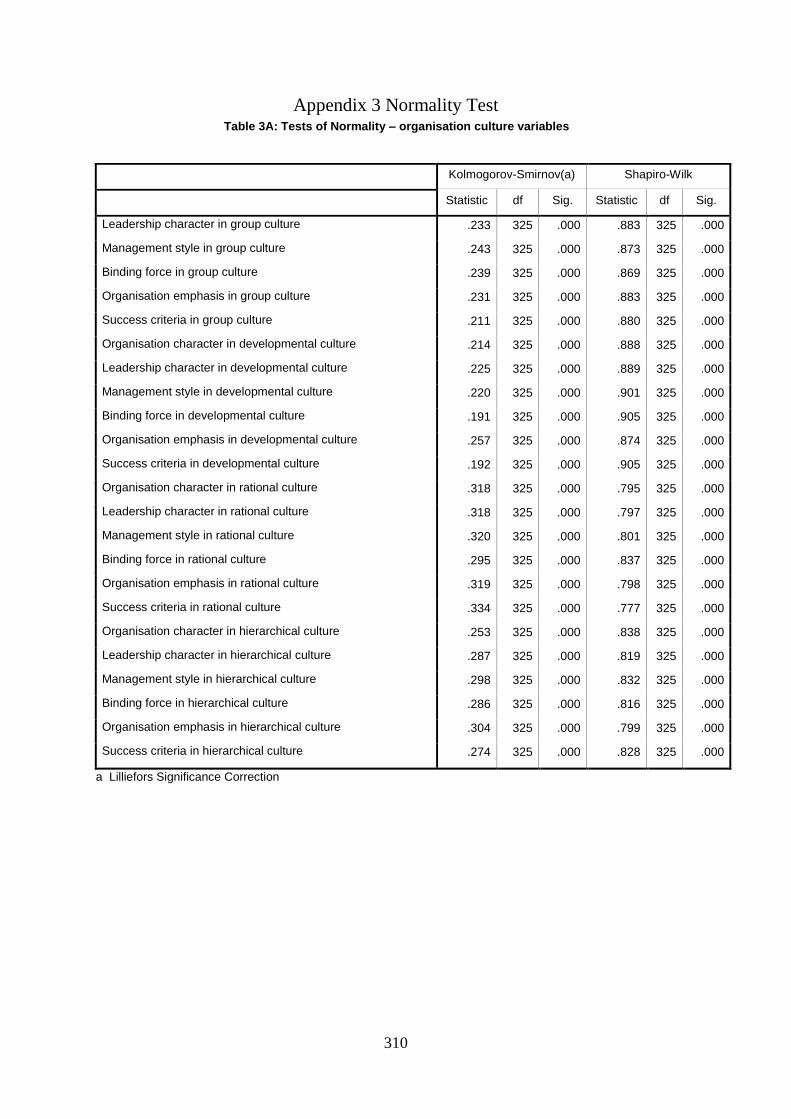
310
Appendix 3 Normality Test Table 3A: Tests of Normality – organisation culture variables
Kolmogorov-Smirnov(a) Shapiro-Wilk
Statistic df Sig. Statistic df Sig.
Leadership character in group culture .233 325 .000 .883 325 .000
Management style in group culture .243 325 .000 .873 325 .000
Binding force in group culture .239 325 .000 .869 325 .000
Organisation emphasis in group culture .231 325 .000 .883 325 .000
Success criteria in group culture .211 325 .000 .880 325 .000
Organisation character in developmental culture .214 325 .000 .888 325 .000
Leadership character in developmental culture .225 325 .000 .889 325 .000
Management style in developmental culture .220 325 .000 .901 325 .000
Binding force in developmental culture .191 325 .000 .905 325 .000
Organisation emphasis in developmental culture .257 325 .000 .874 325 .000
Success criteria in developmental culture .192 325 .000 .905 325 .000
Organisation character in rational culture .318 325 .000 .795 325 .000
Leadership character in rational culture .318 325 .000 .797 325 .000
Management style in rational culture .320 325 .000 .801 325 .000
Binding force in rational culture .295 325 .000 .837 325 .000
Organisation emphasis in rational culture .319 325 .000 .798 325 .000
Success criteria in rational culture .334 325 .000 .777 325 .000
Organisation character in hierarchical culture .253 325 .000 .838 325 .000
Leadership character in hierarchical culture .287 325 .000 .819 325 .000
Management style in hierarchical culture .298 325 .000 .832 325 .000
Binding force in hierarchical culture .286 325 .000 .816 325 .000
Organisation emphasis in hierarchical culture .304 325 .000 .799 325 .000
Success criteria in hierarchical culture .274 325 .000 .828 325 .000
a Lilliefors Significance Correction

311
Table 3B - Tests of Normality – TQM implementation barrier variables
Kolmogorov-Smirnov(a) Shapiro-Wilk
Statistic df Sig. Statistic df Sig.
BRtm1 .271 325 .000 .785 325 .000
BRtm2 .331 325 .000 .743 325 .000
BRtm3 .264 325 .000 .785 325 .000
BRtm4 .238 325 .000 .822 325 .000
BRtm5 .261 325 .000 .795 325 .000
BRtm6 .260 325 .000 .799 325 .000
BRtm7 .260 325 .000 .785 325 .000
BRtm8 .263 325 .000 .795 325 .000
BRemp1 .281 325 .000 .857 325 .000
BRemp2 .259 325 .000 .866 325 .000
BRemp3 .278 325 .000 .850 325 .000
BRemp4 .277 325 .000 .858 325 .000
BRemp5 .279 325 .000 .851 325 .000
BRemp6 .287 325 .000 .853 325 .000
BRemp7 .279 325 .000 .858 325 .000
BRemp8 .272 325 .000 .861 325 .000
BRemp9 .287 325 .000 .853 325 .000
BRcus1 .257 325 .000 .870 325 .000
BRcus2 .276 325 .000 .862 325 .000
BRcus3 .271 325 .000 .863 325 .000
BRcus4 .270 325 .000 .864 325 .000
BRpln1 .294 325 .000 .824 325 .000
BRpln2 .252 325 .000 .841 325 .000
BRpln3 .260 325 .000 .837 325 .000
BRpln4 .261 325 .000 .845 325 .000
BRproc1 .275 325 .000 .818 325 .000
BRproc2 .244 325 .000 .841 325 .000
BRproc3 .237 325 .000 .845 325 .000
BRproc4 .254 325 .000 .835 325 .000
BRproc5 .258 325 .000 .822 325 .000
BRproc6 .252 325 .000 .836 325 .000
BRim1 .298 325 .000 .841 325 .000
BRim2 .317 325 .000 .831 325 .000
BRim3 .259 325 .000 .837 325 .000
BRim4 .233 325 .000 .867 325 .000
BRim5 .307 325 .000 .838 325 .000
BRim6 .326 325 .000 .822 325 .000
a Lilliefors Significance Correction

312
Table 3C – Checking normality of data distribution by Kurtosis and Skewness
Variables N
Statistic
Range
Statistic
Mean
Statistic
Skewness Kurtosis
Statistic Std. Error Statistic Std. Error
OCd1A 325 4 3.04 -.051 .135 -1.120 .270
OCd2A 325 4 3.18 -.078 .135 -1.141 .270
OCd3A 325 4 3.29 -.193 .135 -1.245 .270
OCd4A 325 4 3.23 -.072 .135 -1.274 .270
OCd5A 325 4 3.11 -.083 .135 -1.250 .270
OCd6A 325 4 3.27 -.148 .135 -1.283 .270
OCd1B 325 4 2.78 .032 .135 -1.137 .270
OCd2B 325 4 2.94 -.083 .135 -1.168 .270
OCd3B 325 4 2.72 .227 .135 -.937 .270
OCd4B 325 4 2.91 .028 .135 -1.071 .270
OCd5B 325 4 3.08 -.161 .135 -1.187 .270
OCd6B 325 4 3.00 .038 .135 -1.095 .270
OCd1C 325 4 4.00 -1.155 .135 1.782 .270
OCd2C 325 4 3.99 -1.143 .135 1.682 .270
OCd3C 325 4 3.97 -1.111 .135 1.626 .270
OCd4C 325 4 3.88 -.875 .135 .949 .270
OCd5C 325 4 3.98 -1.132 .135 1.601 .270
OCd6C 325 4 4.01 -1.194 .135 2.192 .270
OCd1D 325 4 3.99 -.833 .135 .185 .270
OCd2D 325 4 3.99 -.995 .135 1.546 .270
OCd3D 325 4 3.91 -.898 .135 .623 .270
OCd4D 325 4 4.02 -1.032 .135 .980 .270
OCd5D 325 4 4.04 -1.084 .135 2.025 .270
OCd6D 325 3 4.03 -.650 .135 .073 .270
BRtm1 325 3 4.29 -.516 .135 -.616 .270
BRtm2 325 2 4.39 -.738 .135 -.753 .270
BRtm3 325 3 4.27 -.435 .135 -.511 .270
BRtm4 325 3 4.09 -.287 .135 -.709 .270
BRtm5 325 3 4.24 -.451 .135 -.831 .270
BRtm6 325 3 4.24 -.558 .135 -.492 .270
BRtm7 325 3 4.28 -.465 .135 -.544 .270
BRtm8 325 3 4.24 -.455 .135 -.851 .270
BRemp1 325 3 3.76 -.410 .135 -.369 .270
BRemp2 325 3 3.74 -.277 .135 -.504 .270
BRemp3 325 3 3.63 -.187 .135 -.275 .270
BRemp4 325 3 3.77 -.419 .135 -.413 .270

313
BRemp5 325 3 3.62 -.209 .135 -.281 .270
BRemp6 325 3 3.77 -.426 .135 -.291 .270
BRemp7 325 3 3.76 -.377 .135 -.350 .270
BRemp8 325 3 3.74 -.323 .135 -.391 .270
BRemp9 325 3 3.77 -.440 .135 -.320 .270
BRcus1 325 3 3.68 -.289 .135 -.634 .270
BRcus2 325 3 3.70 -.362 .135 -.501 .270
BRcus3 325 3 3.70 -.372 .135 -.580 .270
BRcus4 325 3 3.70 -.367 .135 -.602 .270
BRpln1 325 3 3.66 -.094 .135 -.174 .270
BRpln2 325 3 3.60 .103 .135 -.368 .270
BRpln3 325 3 3.55 .020 .135 -.268 .270
BRpln4 325 3 3.62 -.016 .135 -.328 .270
BRproc1 325 4 2.17 .389 .135 -1.208 .270
BRproc2 325 4 2.21 .457 .135 -1.043 .270
BRproc3 325 4 2.18 .370 .135 -1.063 .270
BRproc4 325 4 2.25 .326 .135 -1.183 .270
BRproc5 325 4 2.22 .233 .135 -1.378 .270
BRproc6 325 4 2.23 .331 .135 -1.177 .270
BRim1 325 3 3.66 -.314 .135 -.152 .270
BRim2 325 3 3.68 -.445 .135 -.017 .270
BRim3 325 3 3.58 .044 .135 -.293 .270
BRim4 325 3 3.54 .022 .135 -.514 .270
BRim5 325 3 3.66 -.400 .135 -.133 .270
BRim6 325 3 3.69 -.488 .135 .082 .270
Valid N (listwise)
325
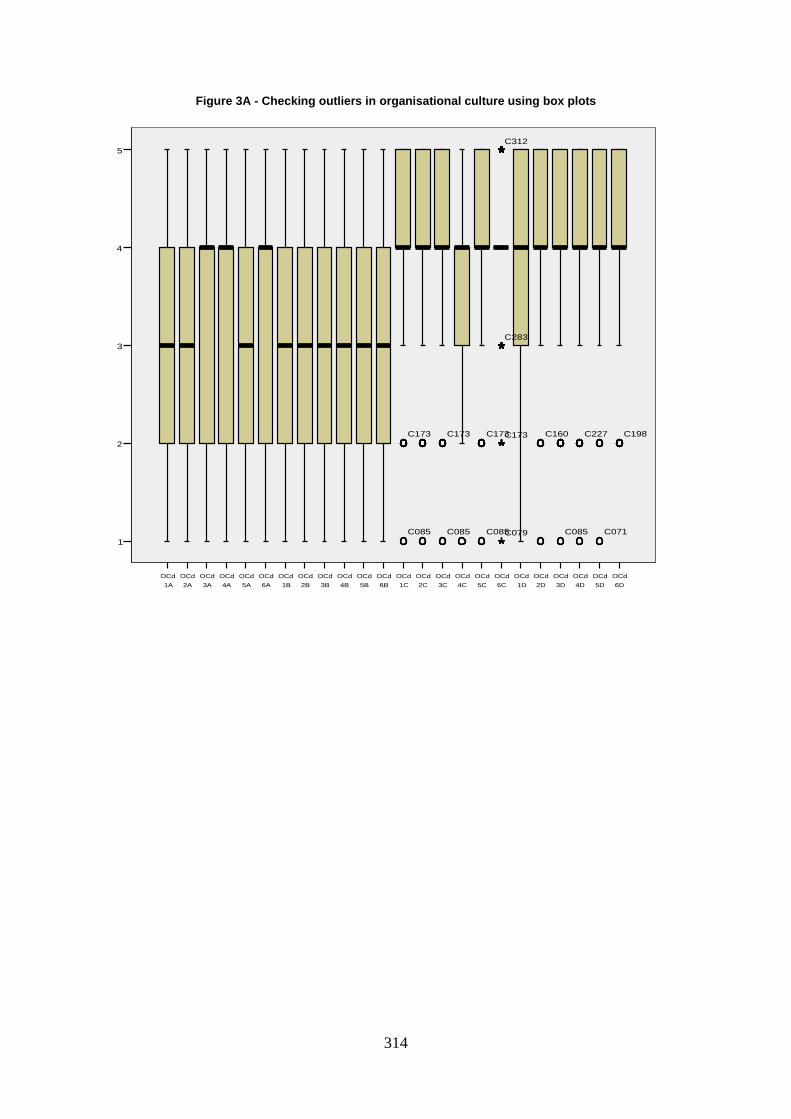
314
Figure 3A - Checking outliers in organisational culture using box plots
OCd
6D
OCd
5D
OCd
4D
OCd
3D
OCd
2D
OCd
1D
OCd
6C
OCd
5C
OCd
4C
OCd
3C
OCd
2C
OCd
1C
OCd
6B
OCd
5B
OCd
4B
OCd
3B
OCd
2B
OCd
1B
OCd
6A
OCd
5A
OCd
4A
OCd
3A
OCd
2A
OCd
1A
5
4
3
2
1
C198
C071
C227
C085
C160C173
C085
C173
C085
C173
C085
C312
C283
C173
C079
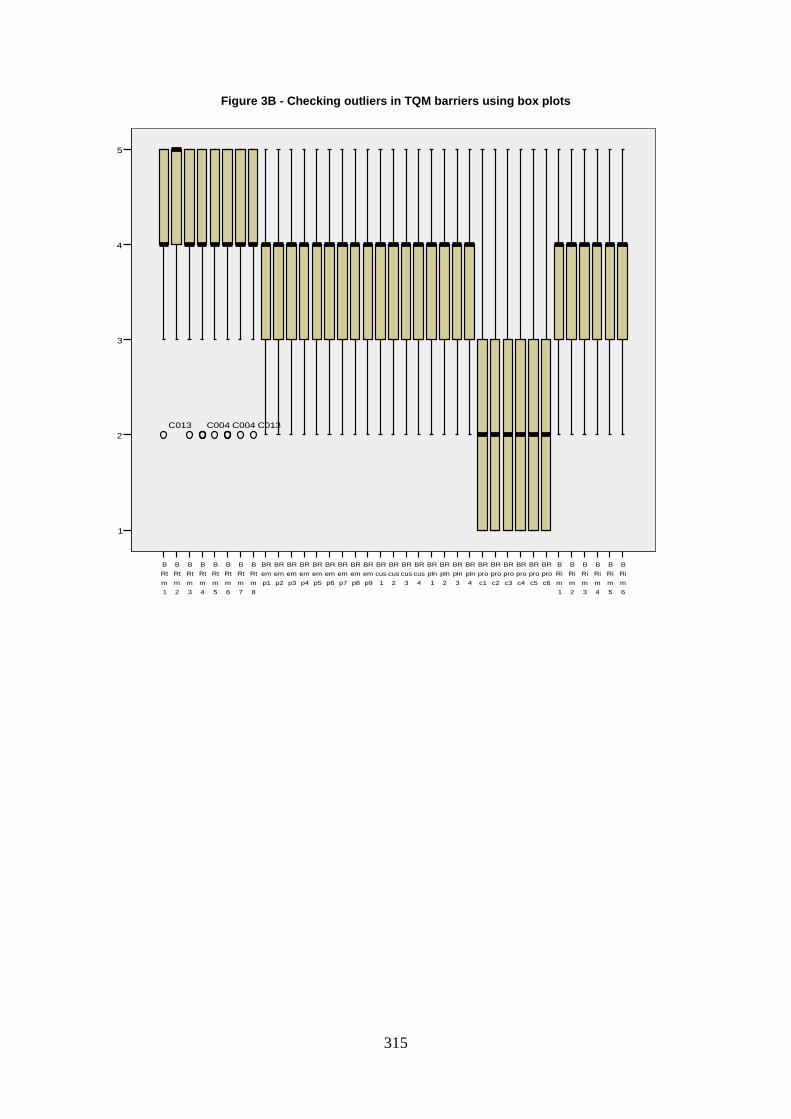
315
Figure 3B - Checking outliers in TQM barriers using box plots
B
Ri
m
6
B
Ri
m
5
B
Ri
m
4
B
Ri
m
3
B
Ri
m
2
B
Ri
m
1
BR
pro
c6
BR
pro
c5
BR
pro
c4
BR
pro
c3
BR
pro
c2
BR
pro
c1
BR
pln
4
BR
pln
3
BR
pln
2
BR
pln
1
BR
cus
4
BR
cus
3
BR
cus
2
BR
cus
1
BR
em
p9
BR
em
p8
BR
em
p7
BR
em
p6
BR
em
p5
BR
em
p4
BR
em
p3
BR
em
p2
BR
em
p1
B
Rt
m
8
B
Rt
m
7
B
Rt
m
6
B
Rt
m
5
B
Rt
m
4
B
Rt
m
3
B
Rt
m
2
B
Rt
m
1
5
4
3
2
1
C013C004C004C013

316
Appendix 4 AMOS Output CFA
Table 4A: AMOS output for CFA model - GOF statistics
Model Fit Summary
CMIN
Model NPAR CMIN DF P CMIN/DF
Default model 151 2353.552 1280 .000 1.839
Saturated model 1431 .000 0
Independence model 53 21222.594 1378 .000 15.401
RMR, GFI
Model RMR GFI AGFI PGFI
Default model .039 .799 .775 .715
Saturated model .000 1.000
Independence model .331 .161 .128 .155
Baseline Comparisons
Model NFI
Delta1
RFI
rho1
IFI
Delta2
TLI
rho2 CFI
Default model .889 .881 .946 .942 .946
Saturated model 1.000
1.000
1.000
Independence model .000 .000 .000 .000 .000
Parsimony-Adjusted Measures
Model PRATIO PNFI PCFI
Default model .929 .826 .879
Saturated model .000 .000 .000
Independence model 1.000 .000 .000
NCP
Model NCP LO 90 HI 90
Default model 1073.552 941.233 1213.659
Saturated model .000 .000 .000
Independence model 19844.594 19376.411 20319.199
FMIN
Model FMIN F0 LO 90 HI 90
Default model 7.264 3.313 2.905 3.746
Saturated model .000 .000 .000 .000

317
Model FMIN F0 LO 90 HI 90
Independence model 65.502 61.249 59.804 62.714
RMSEA
Model RMSEA LO 90 HI 90 PCLOSE
Default model .051 .048 .054 .324
Independence model .211 .208 .213 .000
AIC
Model AIC BCC BIC CAIC
Default model 2655.552 2715.952 3226.909 3377.909
Saturated model 2862.000 3434.400 8276.654 9707.654
Independence model 21328.594 21349.794 21529.137 21582.137
ECVI
Model ECVI LO 90 HI 90 MECVI
Default model 8.196 7.788 8.629 8.383
Saturated model 8.833 8.833 8.833 10.600
Independence model 65.829 64.384 67.294 65.894
HOELTER
Model HOELTER
.05
HOELTER
.01
Default model 188 193
Independence model 23 23

318
Table 4B: AMOS output for CFA model - Regression Weights
Estimate S.E. C.R. P Label
BRemp <--- Group1 -.223 .039 -5.716 ***
BRim <--- Group1 -.240 .028 -8.406 ***
BRtm <--- Group1 .203 .034 5.918 ***
BRcus <--- Group1 -.262 .040 -6.569 ***
BRemp <--- Rational1 .054 .060 .901 .368
BRtm <--- Rational1 -.159 .053 -3.007 .003
BRcus <--- Rational1 .126 .061 2.079 .038
BRproc <--- Hierarchical1 -.553 .168 -3.301 ***
BRemp <--- Developmental1 -.060 .046 -1.318 .187
BRcus <--- Developmental1 -.026 .046 -.558 .577
BRpln <--- Hierarchical1 -.150 0.19 -7.895 ***
BRemp1 <--- BRemp 1.000
BRemp4 <--- BRemp .908 .032 28.405 ***
BRemp6 <--- BRemp .997 .017 59.999 ***
BRemp7 <--- BRemp .900 .029 31.219 ***
BRemp8 <--- BRemp .912 .027 33.987 ***
BRemp9 <--- BRemp .987 .021 47.463 ***
BRcus4 <--- BRcus 1.000
BRcus3 <--- BRcus 1.057 .026 40.006 ***
BRcus2 <--- BRcus .896 .036 24.989 ***
BRcus1 <--- BRcus .983 .032 30.922 ***
BRpln2 <--- BRpln 1.000
BRpln3 <--- BRpln .751 .042 18.057 ***
BRpln4 <--- BRpln .958 .034 28.214 ***
BRproc6 <--- BRproc 1.000
BRproc5 <--- BRproc .941 .037 25.121 ***
BRproc4 <--- BRproc 1.033 .035 29.102 ***
BRproc3 <--- BRproc .940 .034 27.484 ***
BRproc2 <--- BRproc 1.025 .036 28.225 ***
BRproc1 <--- BRproc 1.047 .033 31.734 ***
BRim1 <--- BRim 1.000
BRim2 <--- BRim 1.314 .069 19.168 ***
BRim5 <--- BRim 1.081 .072 15.026 ***
BRim6 <--- BRim 1.262 .067 18.801 ***
BRtm8 <--- BRtm 1.000
BRtm7 <--- BRtm .626 .039 15.907 ***
BRtm6 <--- BRtm .856 .032 26.854 ***
BRtm5 <--- BRtm .996 .013 74.716 ***
BRtm4 <--- BRtm .583 .047 12.387 ***
BRtm3 <--- BRtm .722 .033 21.781 ***
OCd6A <--- Group1 1.000
OCd5A <--- Group1 .972 .043 22.792 ***
OCd4A <--- Group1 .926 .040 23.103 ***

319
Estimate S.E. C.R. P Label
OCd3A <--- Group1 .959 .042 22.622 ***
OCd2A <--- Group1 .867 .039 21.999 ***
OCd1A <--- Group1 .769 .047 16.524 ***
OCd6B <--- Developmental1 1.000
OCd5B <--- Developmental1 1.050 .060 17.627 ***
OCd4B <--- Developmental1 1.077 .060 17.876 ***
OCd3B <--- Developmental1 .836 .061 13.650 ***
OCd2B <--- Developmental1 1.048 .061 17.309 ***
OCd1B <--- Developmental1 .947 .059 16.176 ***
OCd6C <--- Rational1 1.000
OCd5C <--- Rational1 1.170 .040 29.625 ***
OCd4C <--- Rational1 1.154 .041 27.915 ***
OCd3C <--- Rational1 1.159 .039 29.704 ***
OCd2C <--- Rational1 1.131 .041 27.394 ***
OCd1C <--- Rational1 1.108 .042 26.512 ***
OCd6D <--- Hierarchical1 1.000
OCd5D <--- Hierarchical1 1.597 .189 8.441 ***
OCd4D <--- Hierarchical1 1.443 .187 7.717 ***
OCd3D <--- Hierarchical1 1.188 .173 6.868 ***
OCd2D <--- Hierarchical1 1.449 .181 8.005 ***
OCd1D <--- Hierarchical1 1.370 .187 7.318 ***
Table 4C: AMOS output for CFA model - Standardized Regression Weights
Estimate
BRemp1 <--- BRemp .973
BRemp4 <--- BRemp .868
BRemp6 <--- BRemp .987
BRemp7 <--- BRemp .891
BRemp8 <--- BRemp .909
BRemp9 <--- BRemp .963
BRcus4 <--- BRcus .928
BRcus3 <--- BRcus .989
BRcus2 <--- BRcus .861
BRcus1 <--- BRcus .923
BRpln2 <--- BRpln .961
BRpln3 <--- BRpln .752

320
Estimate
BRpln4 <--- BRpln .934
BRproc6 <--- BRproc .911
BRproc5 <--- BRproc .881
BRproc4 <--- BRproc .928
BRproc3 <--- BRproc .910
BRproc2 <--- BRproc .918
BRproc1 <--- BRproc .952
BRim1 <--- BRim .747
BRim2 <--- BRim .978
BRim5 <--- BRim .791
BRim6 <--- BRim .957
BRtm8 <--- BRtm .987
BRtm7 <--- BRtm .666
BRtm6 <--- BRtm .839
BRtm5 <--- BRtm .989
BRtm4 <--- BRtm .569
BRtm3 <--- BRtm .777
OCd6A <--- Group1 .887
OCd5A <--- Group1 .881
OCd4A <--- Group1 .891
OCd3A <--- Group1 .877
OCd2A <--- Group1 .861
OCd1A <--- Group1 .738
OCd6B <--- Developmental1 .788
OCd5B <--- Developmental1 .879
OCd4B <--- Developmental1 .861
OCd3B <--- Developmental1 .705
OCd2B <--- Developmental1 .848
OCd1B <--- Developmental1 .809
OCd6C <--- Rational1 .881
OCd5C <--- Rational1 .966
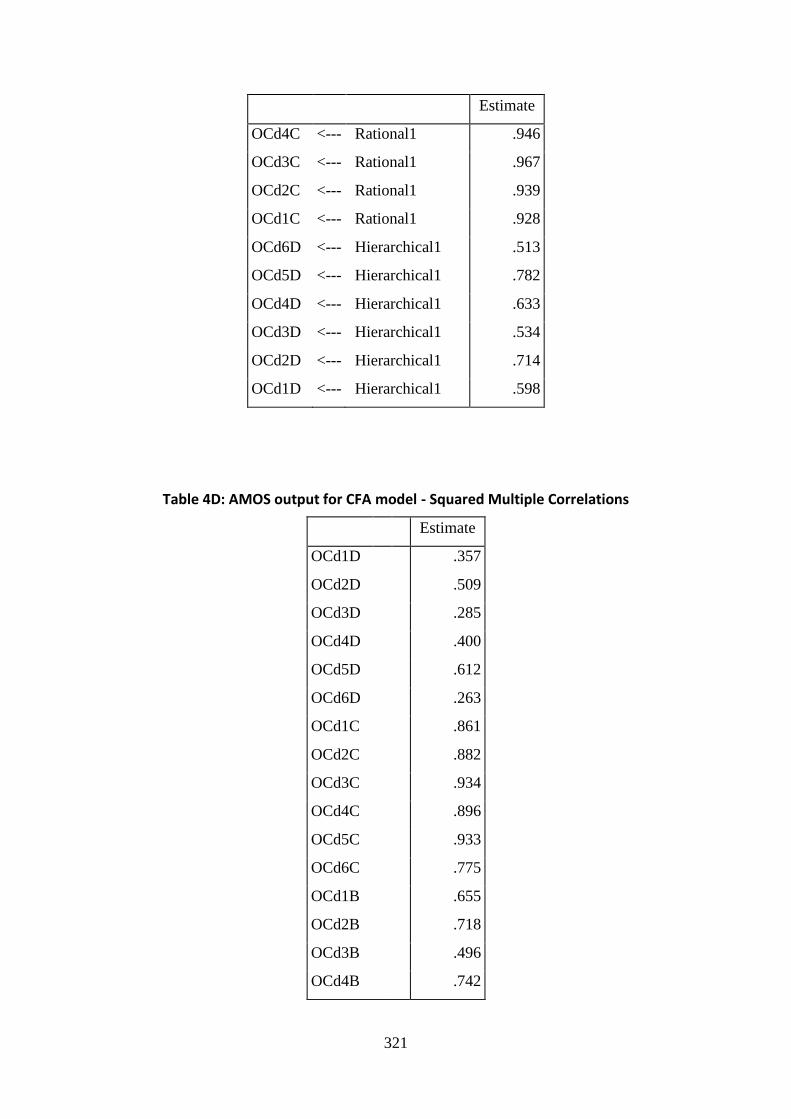
321
Estimate
OCd4C <--- Rational1 .946
OCd3C <--- Rational1 .967
OCd2C <--- Rational1 .939
OCd1C <--- Rational1 .928
OCd6D <--- Hierarchical1 .513
OCd5D <--- Hierarchical1 .782
OCd4D <--- Hierarchical1 .633
OCd3D <--- Hierarchical1 .534
OCd2D <--- Hierarchical1 .714
OCd1D <--- Hierarchical1 .598
Table 4D: AMOS output for CFA model - Squared Multiple Correlations
Estimate
OCd1D
.357
OCd2D
.509
OCd3D
.285
OCd4D
.400
OCd5D
.612
OCd6D
.263
OCd1C
.861
OCd2C
.882
OCd3C
.934
OCd4C
.896
OCd5C
.933
OCd6C
.775
OCd1B
.655
OCd2B
.718
OCd3B
.496
OCd4B
.742

322
Estimate
OCd5B
.772
OCd6B
.620
OCd1A
.544
OCd2A
.742
OCd3A
.769
OCd4A
.794
OCd5A
.775
OCd6A
.787
BRtm3
.604
BRtm4
.324
BRtm5
.978
BRtm6
.704
BRtm7
.444
BRtm8
.974
BRim6
.915
BRim5
.625
BRim2
.957
BRim1
.558
BRproc1
.907
BRproc2
.844
BRproc3
.828
BRproc4
.861
BRproc5
.776
BRproc6
.830
BRpln4
.873
BRpln3
.565
BRpln2
.924
BRcus1
.853
BRcus2
.741
BRcus3
.979
BRcus4
.861

323
Estimate
BRemp9
.927
BRemp8
.826
BRemp7
.794
BRemp6
.974
BRemp4
.754
BRemp1
.946

324
Appendix 5 AMOS Output SEM
Table 5A: AMOS output for SEM model - GOF statistics
Model Fit Summary
CMIN
Model NPAR CMIN DF P CMIN/DF
Default model 117 3275.411 1314 .000 2.493
Saturated model 1431 .000 0
Independence model 53 21222.594 1378 .000 15.401
RMR, GFI
Model RMR GFI AGFI PGFI
Default model .220 .750 .728 .689
Saturated model .000 1.000
Independence model .331 .161 .128 .155
Baseline Comparisons
Model NFI
Delta1
RFI
rho1
IFI
Delta2
TLI
rho2 CFI
Default model .846 .838 .901 .896 .901
Saturated model 1.000
1.000
1.000
Independence model .000 .000 .000 .000 .000
Parsimony-Adjusted Measures
Model PRATIO PNFI PCFI
Default model .954 .806 .859
Saturated model .000 .000 .000
Independence model 1.000 .000 .000
NCP
Model NCP LO 90 HI 90
Default model 1961.411 1796.827 2133.602
Saturated model .000 .000 .000
Independence model 19844.594 19376.411 20319.199
FMIN
Model FMIN F0 LO 90 HI 90
Default model 10.109 6.054 5.546 6.585
Saturated model .000 .000 .000 .000
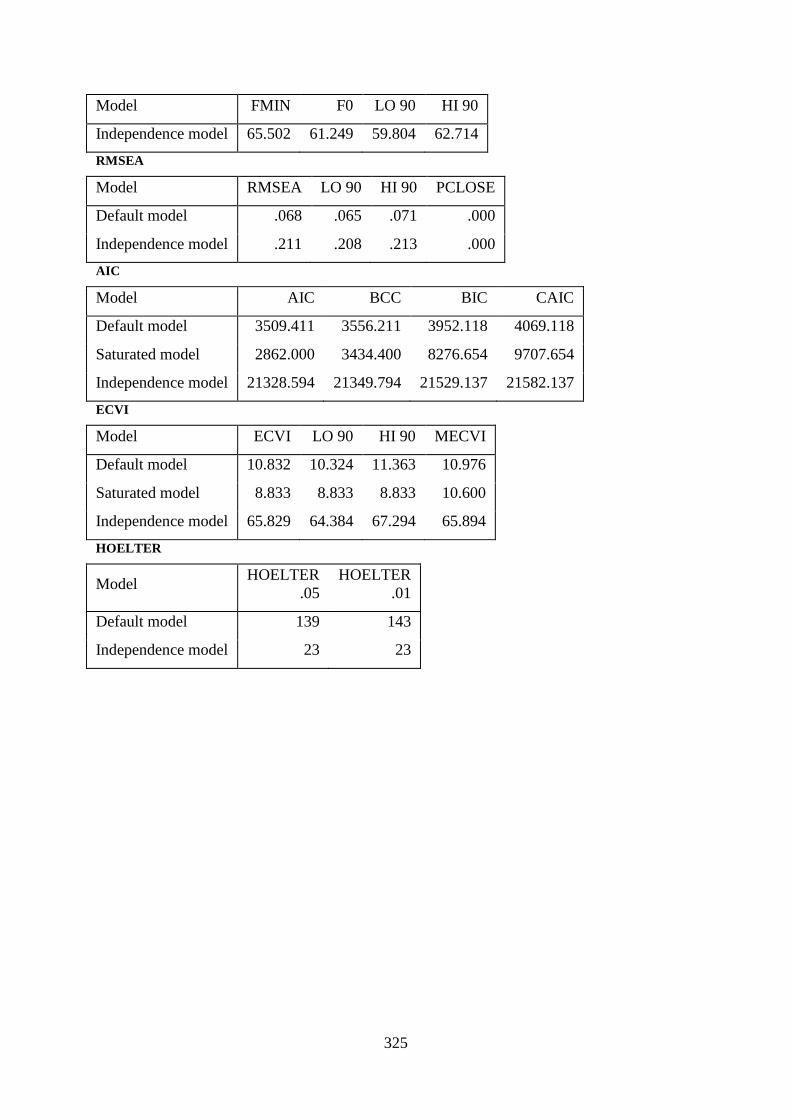
325
Model FMIN F0 LO 90 HI 90
Independence model 65.502 61.249 59.804 62.714
RMSEA
Model RMSEA LO 90 HI 90 PCLOSE
Default model .068 .065 .071 .000
Independence model .211 .208 .213 .000
AIC
Model AIC BCC BIC CAIC
Default model 3509.411 3556.211 3952.118 4069.118
Saturated model 2862.000 3434.400 8276.654 9707.654
Independence model 21328.594 21349.794 21529.137 21582.137
ECVI
Model ECVI LO 90 HI 90 MECVI
Default model 10.832 10.324 11.363 10.976
Saturated model 8.833 8.833 8.833 10.600
Independence model 65.829 64.384 67.294 65.894
HOELTER
Model HOELTER
.05
HOELTER
.01
Default model 139 143
Independence model 23 23
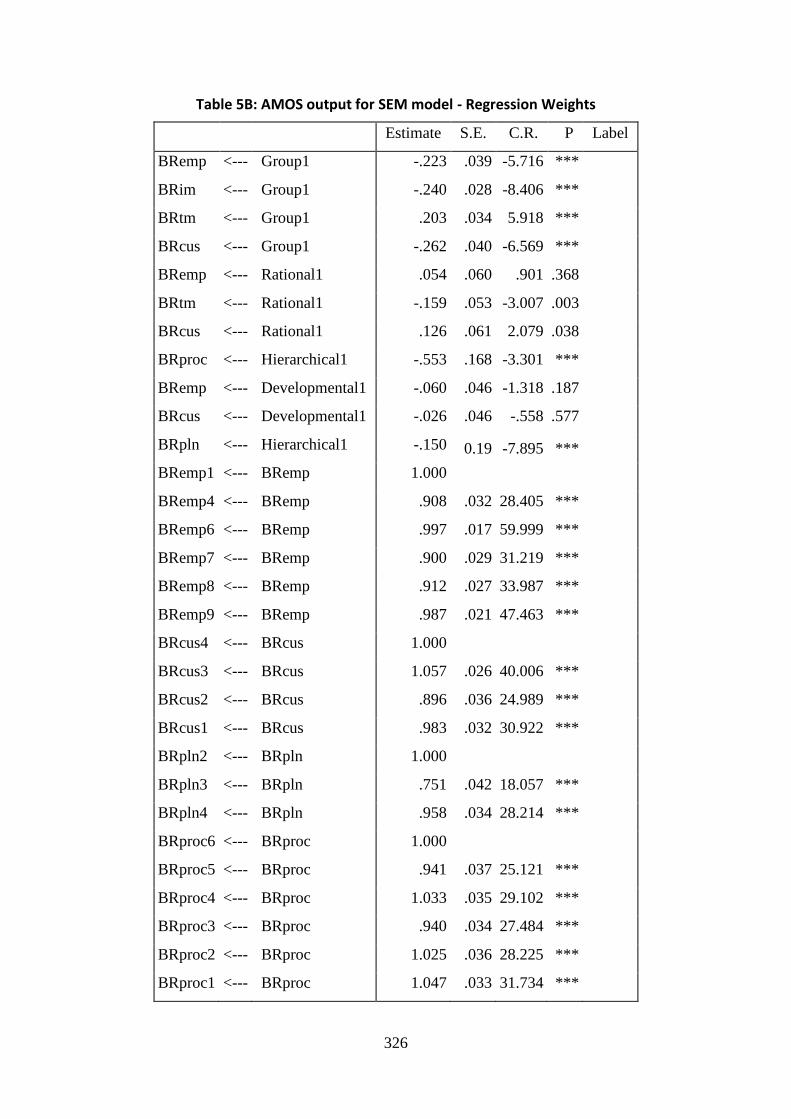
326
Table 5B: AMOS output for SEM model - Regression Weights
Estimate S.E. C.R. P Label
BRemp <--- Group1 -.223 .039 -5.716 ***
BRim <--- Group1 -.240 .028 -8.406 ***
BRtm <--- Group1 .203 .034 5.918 ***
BRcus <--- Group1 -.262 .040 -6.569 ***
BRemp <--- Rational1 .054 .060 .901 .368
BRtm <--- Rational1 -.159 .053 -3.007 .003
BRcus <--- Rational1 .126 .061 2.079 .038
BRproc <--- Hierarchical1 -.553 .168 -3.301 ***
BRemp <--- Developmental1 -.060 .046 -1.318 .187
BRcus <--- Developmental1 -.026 .046 -.558 .577
BRpln <--- Hierarchical1 -.150 0.19 -7.895 ***
BRemp1 <--- BRemp 1.000
BRemp4 <--- BRemp .908 .032 28.405 ***
BRemp6 <--- BRemp .997 .017 59.999 ***
BRemp7 <--- BRemp .900 .029 31.219 ***
BRemp8 <--- BRemp .912 .027 33.987 ***
BRemp9 <--- BRemp .987 .021 47.463 ***
BRcus4 <--- BRcus 1.000
BRcus3 <--- BRcus 1.057 .026 40.006 ***
BRcus2 <--- BRcus .896 .036 24.989 ***
BRcus1 <--- BRcus .983 .032 30.922 ***
BRpln2 <--- BRpln 1.000
BRpln3 <--- BRpln .751 .042 18.057 ***
BRpln4 <--- BRpln .958 .034 28.214 ***
BRproc6 <--- BRproc 1.000
BRproc5 <--- BRproc .941 .037 25.121 ***
BRproc4 <--- BRproc 1.033 .035 29.102 ***
BRproc3 <--- BRproc .940 .034 27.484 ***
BRproc2 <--- BRproc 1.025 .036 28.225 ***
BRproc1 <--- BRproc 1.047 .033 31.734 ***

327
Estimate S.E. C.R. P Label
BRim1 <--- BRim 1.000
BRim2 <--- BRim 1.314 .069 19.168 ***
BRim5 <--- BRim 1.081 .072 15.026 ***
BRim6 <--- BRim 1.262 .067 18.801 ***
BRtm8 <--- BRtm 1.000
BRtm7 <--- BRtm .626 .039 15.907 ***
BRtm6 <--- BRtm .856 .032 26.854 ***
BRtm5 <--- BRtm .996 .013 74.716 ***
BRtm4 <--- BRtm .583 .047 12.387 ***
BRtm3 <--- BRtm .722 .033 21.781 ***
OCd6A <--- Group1 1.000
OCd5A <--- Group1 .972 .043 22.792 ***
OCd4A <--- Group1 .926 .040 23.103 ***
OCd3A <--- Group1 .959 .042 22.622 ***
OCd2A <--- Group1 .867 .039 21.999 ***
OCd1A <--- Group1 .769 .047 16.524 ***
OCd6B <--- Developmental1 1.000
OCd5B <--- Developmental1 1.050 .060 17.627 ***
OCd4B <--- Developmental1 1.077 .060 17.876 ***
OCd3B <--- Developmental1 .836 .061 13.650 ***
OCd2B <--- Developmental1 1.048 .061 17.309 ***
OCd1B <--- Developmental1 .947 .059 16.176 ***
OCd6C <--- Rational1 1.000
OCd5C <--- Rational1 1.170 .040 29.625 ***
OCd4C <--- Rational1 1.154 .041 27.915 ***
OCd3C <--- Rational1 1.159 .039 29.704 ***
OCd2C <--- Rational1 1.131 .041 27.394 ***
OCd1C <--- Rational1 1.108 .042 26.512 ***
OCd6D <--- Hierarchical1 1.000
OCd5D <--- Hierarchical1 1.597 .189 8.441 ***
OCd4D <--- Hierarchical1 1.443 .187 7.717 ***

328
Estimate S.E. C.R. P Label
OCd3D <--- Hierarchical1 1.188 .173 6.868 ***
OCd2D <--- Hierarchical1 1.449 .181 8.005 ***
OCd1D <--- Hierarchical1 1.370 .187 7.318 ***

329
Table 5C: AMOS output for SEM model - Standardized Regression Weights
Estimate
BRemp <--- Group1 -.316
BRim <--- Group1 -.489
BRtm <--- Group1 .323
BRcus <--- Group1 -.362
BRemp <--- Rational1 .048
BRtm <--- Rational1 -.159
BRcus <--- Rational1 .110
BRproc <--- Hierarchical1 -.215
BRemp <--- Developmental1 -.073
BRcus <--- Developmental1 -.030
BRpln <--- Hierarchical1 -.086
BRemp1 <--- BRemp .972
BRemp4 <--- BRemp .865
BRemp6 <--- BRemp .987
BRemp7 <--- BRemp .888
BRemp8 <--- BRemp .907
BRemp9 <--- BRemp .962
BRcus4 <--- BRcus .929
BRcus3 <--- BRcus .988
BRcus2 <--- BRcus .861
BRcus1 <--- BRcus .924
BRpln2 <--- BRpln .973
BRpln3 <--- BRpln .747
BRpln4 <--- BRpln .924
BRproc6 <--- BRproc .911
BRproc5 <--- BRproc .881
BRproc4 <--- BRproc .928
BRproc3 <--- BRproc .910
BRproc2 <--- BRproc .918
BRproc1 <--- BRproc .953
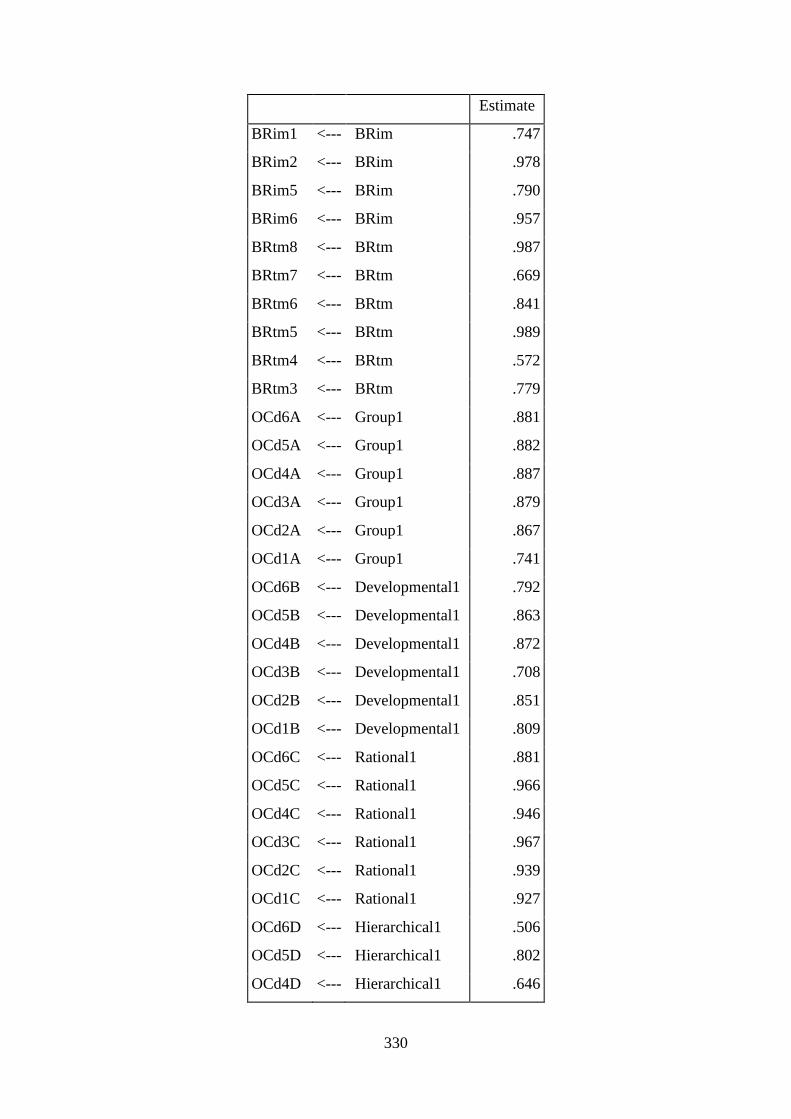
330
Estimate
BRim1 <--- BRim .747
BRim2 <--- BRim .978
BRim5 <--- BRim .790
BRim6 <--- BRim .957
BRtm8 <--- BRtm .987
BRtm7 <--- BRtm .669
BRtm6 <--- BRtm .841
BRtm5 <--- BRtm .989
BRtm4 <--- BRtm .572
BRtm3 <--- BRtm .779
OCd6A <--- Group1 .881
OCd5A <--- Group1 .882
OCd4A <--- Group1 .887
OCd3A <--- Group1 .879
OCd2A <--- Group1 .867
OCd1A <--- Group1 .741
OCd6B <--- Developmental1 .792
OCd5B <--- Developmental1 .863
OCd4B <--- Developmental1 .872
OCd3B <--- Developmental1 .708
OCd2B <--- Developmental1 .851
OCd1B <--- Developmental1 .809
OCd6C <--- Rational1 .881
OCd5C <--- Rational1 .966
OCd4C <--- Rational1 .946
OCd3C <--- Rational1 .967
OCd2C <--- Rational1 .939
OCd1C <--- Rational1 .927
OCd6D <--- Hierarchical1 .506
OCd5D <--- Hierarchical1 .802
OCd4D <--- Hierarchical1 .646

331
Estimate
OCd3D <--- Hierarchical1 .527
OCd2D <--- Hierarchical1 .696
OCd1D <--- Hierarchical1 .586
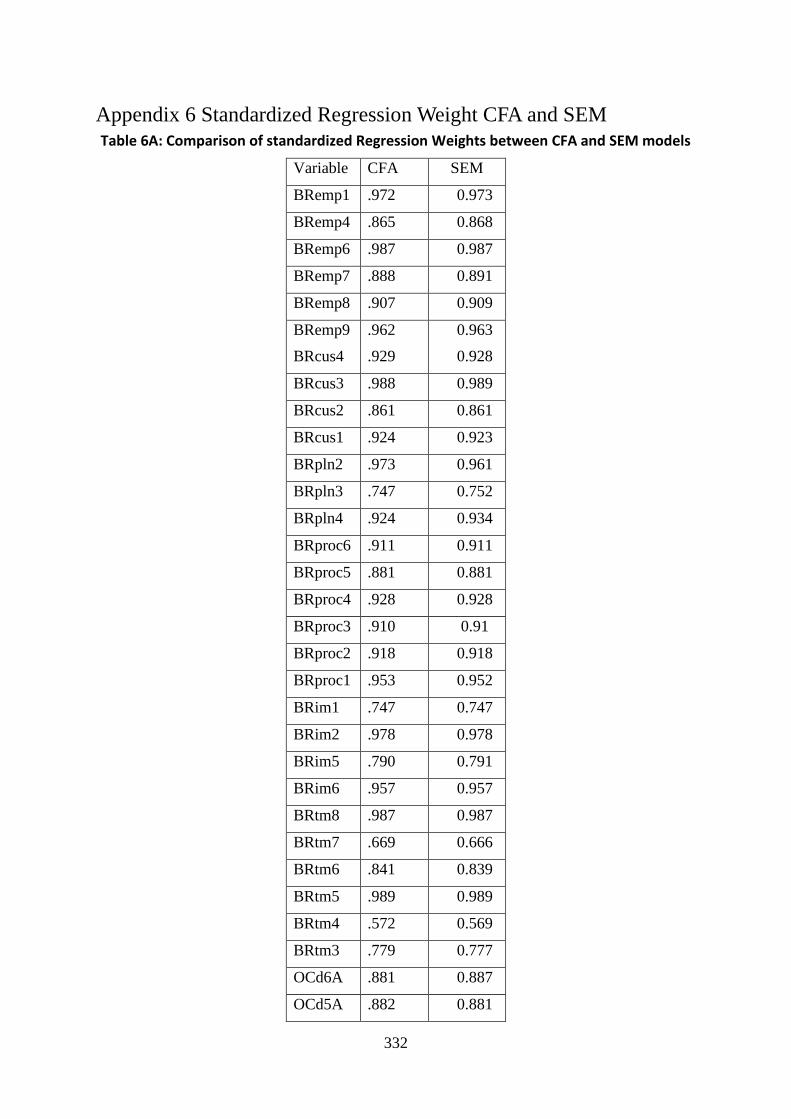
332
Appendix 6 Standardized Regression Weight CFA and SEM
Table 6A: Comparison of standardized Regression Weights between CFA and SEM models
Variable CFA SEM
BRemp1 .972 0.973
BRemp4 .865 0.868
BRemp6 .987 0.987
BRemp7 .888 0.891
BRemp8 .907 0.909
BRemp9 .962 0.963
BRcus4 .929 0.928
BRcus3 .988 0.989
BRcus2 .861 0.861
BRcus1 .924 0.923
BRpln2 .973 0.961
BRpln3 .747 0.752
BRpln4 .924 0.934
BRproc6 .911 0.911
BRproc5 .881 0.881
BRproc4 .928 0.928
BRproc3 .910 0.91
BRproc2 .918 0.918
BRproc1 .953 0.952
BRim1 .747 0.747
BRim2 .978 0.978
BRim5 .790 0.791
BRim6 .957 0.957
BRtm8 .987 0.987
BRtm7 .669 0.666
BRtm6 .841 0.839
BRtm5 .989 0.989
BRtm4 .572 0.569
BRtm3 .779 0.777
OCd6A .881 0.887
OCd5A .882 0.881

333
OCd4A .887 0.891
OCd3A .879 0.877
OCd2A .867 0.861
OCd1A .741 0.738
OCd6B .792 0.788
OCd5B .863 0.879
OCd4B .872 0.861
OCd3B .708 0.705
OCd2B .851 0.848
OCd1B .809 0.809
OCd6C .881 0.881
OCd5C .966 0.966
OCd4C .946 0.946
OCd3C .967 0.967
OCd2C .939 0.939
OCd1C .927 0.928
OCd6D .506 0.513
OCd5D .802 0.782
OCd4D .646 0.633
OCd3D .527 0.534
OCd2D .696 0.714
OCd1D .586 0.598