impact of mineralogy on potassium...
TRANSCRIPT

IMPACT OF MINERALOGY ON POTASSIUM DYNAMICS AND
RETENTION BEHAVIOR IN BANGLADESH SOILS USED IN RICE
CROPPING SYSTEMS
A Thesis
by
SUMITRA BOSE BISWAS
Submitted to the Office of Graduate Studies of Texas A&M University
in partial fulfillment of the requirements for the degree of
MASTER OF SCIENCE
May 2008
Major Subject: Soil Science

IMPACT OF MINERALOGY ON POTASSIUM DYNAMICS AND
RETENTION BEHAVIOR IN BANGLADESH SOILS USED IN RICE
CROPPING SYSTEMS
A Thesis
by
SUMITRA BOSE BISWAS
Submitted to the Office of Graduate Studies of Texas A&M University
in partial fulfillment of the requirements for the degree of
MASTER OF SCIENCE
Approved by: Co-Chairs of Committee, Charles T. Hallmark Frank M. Hons Committee Members, Bruce Herbert Richard H. Loeppert Head of Department, David D. Baltensperger
May 2008
Major Subject: Soil Science
iii
ABSTRACT
Impact of Mineralogy on Potassium Dynamics and Retention Behavior in Bangladesh
Soils Used in Rice Cropping Systems. (May 2008)
Sumitra Bose Biswas, B.S., National University, Bangladesh
Co-Chairs of Advisory Committee: Dr. Charles T. Hallmark Dr. Frank M. Hons
The combination of rising population and increasing food demand has placed
tremendous pressure on the soil resource in Bangladesh, especially floodplain soils
where rice may be grown year round. Although these floodplain soils contain minerals
high in potassium (K) such as micas, K deficiency in rice paddy soils is increasing
throughout Bangladesh. Harvesting of straw from fields exacerbates the removal of
nutrients including K, and intensive cropping with unbalanced fertilizer has resulted in
depletion of “readily available” K in large areas.
Five representative floodplain soils in rice production were sampled by horizon
to determine physical, chemical and mineralogical properties, assess soil K, investigate
plant available K, and understand impacts of redox on K fixation and release.
Total and nonexchangeable K were determined using concentrated hydrogen
fluoride (HF) digestion and 1.0 M HNO3 digestion, respectively, along with NH4OAc-
extractable K. Cation exchange capacity under both oxidized and reduced conditions
was determined. Assessment of adsorption and release of K as a function of redox was

iv
done in conjunction with seven different concentrations of potassium chloride (KCl)
solution and three different soils.
Significant amounts of K were present in all fractions of silts and clays.
Potassium concentration was greatest in the coarse clay fraction. High HNO3-
extractable K suggested that much of the K in soils was from mica interlayers. Acidic
soils contained less K in all fractions than the less weathered, calcareous soils. The clay
fractions exhibited mostly mica, vermiculite, smectite and kaolinite. The cation
exchange capacity (CEC) of reduced soils was less under oxidized condition, due to
collapse of the interlayer in response to increased layer charge upon structural Fe
reduction.
The adsorption of K was greater for calcareous soils under both oxidized and
reduced conditions than for the acidic soils. Less native K was extracted under oxidized
conditions than under reduced conditions. Less adsorption under reduced conditions may
be due to an increase in solution Fe2+ which can compete with K+ for exchange sites on
clays.

v
DEDICATION
To my husband (Bhajan), who gave unconditional support and love.
To my two precious children, Saptarshi (Beau) and Soumyajit.

vi
ACKNOWLEDGEMENTS
I’m greatly thankful for the advice, support, and encouragement of many people
during my M.S. program at Texas A&M University. I’m truly thankful to Dr. Charles T.
Hallmark who has guided me to achieve my academic accomplishments at Texas A&M.
I truly appreciate the support and encouragement (whenever needed) of Dr. Richard H.
Loeppert who has been a mentor to me and helped me to solve my research problem. I’m
also greatful to Dr. Frank M. Hons, who had faith in me and gave me confidence. I also
sincerely thank Dr. Bruce Herbert for his friendly help and support at any time. I would
also like to thank C.W. Smith for guidance throughout my studies at A&M. During my
research, the following people provided support and I acknowledge and thank them for
their contributions to our work: Donna Prochaska, Ines Kannewischer, Maria Guadalupe
Tenorio Arvide, and Lea D. Morris. I would like to thank my entire family members in
the USA (my husband, daughter, and son) and in Bangladesh who have given me
unconditional love and support during the study.
I want to thank all my fellow graduate students, who contributed greatly to the
fact that I had a great time studying in the Soil and Crop Sciences Department.

vii
TABLE OF CONTENTS
Page
ABSTRACT ..................................................................................................................... iii
DEDICATION ...................................................................................................................v
ACKNOWLEDGEMENTS ..............................................................................................vi
TABLE OF CONTENTS .................................................................................................vii
LIST OF TABLES ............................................................................................................ix
LIST OF FIGURES............................................................................................................x
CHAPTER
I INTRODUCTION..................................................................................................1
II LITERATURE REVIEW.......................................................................................3
Forms of Soil K....................................................................................................3 Soil Solution K ...........................................................................................4 Exchangeable K..........................................................................................5 Nonexchangeable K ...................................................................................6 Mineral K ...................................................................................................8
Factors Affecting Potassium Availability............................................................9 Dynamics of Solution and Exchangeable K...............................................9 Retention of K ..........................................................................................10 Potassium Leaching from soil ..................................................................11 Release of K from soil minerals ...............................................................12
Mineralogy of the Bengal Basin ........................................................................15 Mineralogy of the Indo-Gangetic Alluvial Basin ..............................................16 K-status in Soils of Bangladesh and Other Asian Countries .............................17
III MATERIALS AND METHODS .........................................................................24
Soils and Routine Analyses ...............................................................................24 Clay Mineralogy ................................................................................................27 Total Potassium..................................................................................................28
viii
CHAPTER Page Nitric Acid Extractable K ..................................................................................28 Soil Cation Exchange Capacity in an Oxidized Condition................................29 Soil Cation Exchange Capacity in a Reduced Condition...................................29 Adsorption Isotherm of Three Selected Soils (Oxidized)..................................30 Adsorption Isotherms of Three Selected Soils (Reduced).................................31
IV RESULTS AND DISCUSSIONS ........................................................................32
Selected Properties of the Study Soils ...............................................................32 Clay Mineralogy of the Study Soils...................................................................34 Total K by HF Digestion....................................................................................36 Nitric Acid Extractable K ..................................................................................39 Cation Exchange Capacity of the Study Soils in Reduced and Oxidized Conditions ..........................................................................................................42 Adsorption of K in Oxidized and Reduced Soils...............................................46
V CONCLUSIONS..................................................................................................58
Future Research................................................................................................59
REFERENCES.................................................................................................................60
APPENDIX A ..................................................................................................................71
APPENDIX B ..................................................................................................................77
APPENDIX C ..................................................................................................................83
VITA ................................................................................................................................88
ix
LIST OF TABLES
Page
Table 1 Selected properties of the study soils. ............................................................33
Table 2 Mineral composition of the coarse and fine clay fractions of selected surface horizons of the study soils...................................................................35
Table 3 Total potassium (K) as determined by HF digestion in the bulk soils, silt, fine and coarse clay fractions. .........................................................................38
Table 4 Status of total K nitric acid extractable K for selected soil horizons. .............41
Table 5 Exchangeable K and cation exchange capacity (CEC) of selected soil horizons in reduced and oxidized conditions. .................................................45
x
LIST OF FIGURES
Page
Fig. 1 Interrelationships of various forms of soil K (from Sparks and Huang, 1985)..................................................................................................................4
Fig. 2 Model of 2:1 layer silicate with planar (p), edge (e), interlayer (i), wedge (w), crack (c), and step (s) potassium exchange sites (Goulding 1987)............7
Fig. 3 Soil sampling sites in four selected thanas. .....................................................25
Fig. 4 The relationship of CEC of the oxidized soils to clay content. .......................43
Fig. 5 The relationship of CEC of the reduced soils to clay content. ........................43
Fig. 6 Adsorption isotherm for K for the Ap1 horizon of Tala-3 ..............................47
Fig. 7 Adsorption isotherm for K for the Ap1 horizon of Paba-4 .............................47
Fig. 8 Adsorption isotherm for K for the Ap1 horizon of Senbag-6 .........................48
Fig. 9 Adsorption isotherm for K for the Ap1 horizon of Tala-3 ..............................48
Fig. 10 Adsorption isotherm for K for the Ap1 horizon of Paba-4 .............................49
Fig. 11 Adsorption isotherm for K for the Ap1 horizon of Senbag-6 .........................49
Fig. 12 Comparison of the amount of K adsorbed in oxidized condition by three study soils expressed as a function of added K per quantity of clay. ....50
Fig. 13 Comparison of the amount of K adsorbed in reduced condition by three study soils expressed as a function of added K per quantity of clay. .....50
Fig. 14 Potassium isotherm for the Paba-4 soil in oxidized and reduced conditions and expressed as a function of added K per quantity of clay. ......52
Fig. 15 Potassium isotherm for the Tala-4 soil in oxidized and reduced conditions and expressed as function of added K per quantity of clay. ..........52
Fig. 16 Potassium isotherm for the Senbag-6 soil in oxidized and reduced conditions and expressed as function of added K per quantity of clay. ..........53

xi
Page Fig. 17 Equilibrium K Status in different extraction solutions of Senbag-6 soil in
the oxidized condition. ....................................................................................55
Fig. 18 Equilibrium K status in different extraction solutions of Senbag-6 soil in the reduced condition ......................................................................................56
Fig. 19 Equilibrium K status in different extraction solutions of Tala-3 soil in the oxidized condition. ..........................................................................................56
Fig. 20 Equilibrium K status in different extraction solutions of Tala-3 soil in the reduced condition. ...........................................................................................57
Fig. C- 1 X-ray diffractograms for the fine clay (<0.2 µ) of the Ap1 horizon of Tala-2...............................................................................................................84
Fig. C- 2 X-ray diffractograms for the coarse clay (<0.2 µ) of the Ap1 horizon of Tala-3...............................................................................................................85
Fig. C- 3 X-ray diffractograms for the fine clay (<0.2 µ) of the Ap1 horizon of Tala-3...............................................................................................................85
Fig. C- 4 X-ray diffractograms for the coarse clay (<0.2 µ) of the Ap1 horizon of Paba-4..........................................................................................................86
Fig. C- 5 X-ray diffractograms for the fine clay (<0.2 µ) of the Ap1 horizon of Paba-4..........................................................................................................86
Fig. C- 6 X-ray diffractograms for the coarse clay (<0.2 µ) of the Ap1 horizon of Senbag-6......................................................................................................87

1
CHAPTER I
INTRODUCTION
Potassium (K) plays an important role in rice production in the Indo-Gangetic
Plain (IGP) of South Asia. This macronutrient is extracted in large quantities by
intensive cropping systems (Panaullah et al., 2006). Rice production often removes large
quantities of K from soil, resulting in soils with a negative K balance even after the
application of recommended fertilizers (Bijay-Singh et al., 2004). The average ratio of
nitrogen (N)-phosphorus (P) - potassium (K) in fertilizer that is used in Bangladesh is
1:0.5:0.11 (BARC, 1998) and this ratio supplies less K than that required by modern rice
cultivars which is 1:0.26:0.33 (100 kg N, 26 kg P, 33 kg K ha-1 ). Inadequate and
unbalanced fertilizer application may be one reason for declining K nutrition in rice
fields that results in lower rice yield (Panaullah et al., 2006).
Soil K exists in soil solution, and in exchangeable and non-exchangeable (fixed
and structural) forms. The amount of solution and exchangeable potassium is usually a
small fraction of total K (1–2% and 1–10%, respectively). The bulk of soil K usually is
associated with K-bearing micas and feldspars (Sekhon, 1995).
_____________________ This thesis follows the style of Soil Science Society of America Journal.

2
Most soils in the IGP, including those in Bangladesh, are usually regarded as
high in K due to high rainfall, irrigation water and release from K-rich clay minerals
(Dobermann et al., 1996a, 1996b, 1999). Potassium removal is large in intensive rice
production due to the removal of straw along with grain from rice fields for easier tillage
(Timsina and Connor, 2001). Also, harvested straw is used as fuel, animal feed and
thatching (Panaullah et al., 2006).
Recent soil tests showed that the available K concentrations of soils from the IGP
are below 0.1 cmol/kg soil, indicating they are becoming K-deficient even though
regarded as high in K content (Dobermann et al., 1999, Regmi et al., 2002; Srivastava et
al., 2002; Bijay-Singh et al., 2003). As limited research results are available on the
uptake and balance of K for rice systems in Bangladesh, the objectives of this study were
to: 1) determine physical, chemical and mineralogical properties of five floodplain soils
of Bangladesh, 2) assess different types of K (total K, plant available K,
nonexchangeable K) in these soils, and 3) determine the influence of redox on K
adsorption and release.

3
CHAPTER II
LITERATURE REVIEW
Potassium is the seventh most common element in the Earth’s crust and is
essential for plant growth. Potassium, along with N and P, are the three major
macronutrients contributing to many functions in plants. The essentiality of this
macronutrient was known after Von Liebig’s published work in 1840 (Sparks, 2000).
The range of total K content in the upper 0.2 m of the soil profile usually ranges between
3000 and 100,000 kg ha-1. Ninety-eight percent of the total K is normally bound in
mineral form and only 2% is regarded to be in soil solution and exchangeable phases
(Schroeder, 1979; Bertsch and Thomas, 1985).
Potassium is the largest cation in nonhydrated from (0.133 nm), and has a higher
number of oxygen atoms (8-12) surrounding it in the mineral structure, suggesting that
the K-O bond is relatively weak (Sparks and Huang, 1985). Potassium has higher
polarizability (0.088 nm3) than Ca2+, Li+, Mg2+, and Na+ but lower than for Ba2+, Cs+,
NH4+, and Rb+ ions (Rich, 1968, 1972; Sparks and Huang, 1985). Ions having higher
polarizability are preferred in ion exchange reactions (Sparks, 2001).
FORMS OF SOIL K
There are four forms of K in soil: solution K, exchangeable K, fixed or
nonexchangeable K, and structural or mineral K. The bulk portion of total soil K is in the
mineral fraction, and exchangeable and nonexchangeable levels of K are regarded as a
small portion of the total (Sparks and Huang, 1985). The most important aspect of K

4
transformations in soils under rice cropping systems is the rate at which the non-
exchangeable portion is released to exchangeable and soluble forms. Kinetic and
equilibrium reactions between the four forms of soil K affect the level of K in soil
solution and readily available forms for plant uptake at any particular time (Fig. 1). The
four forms of K in the order of their availability to microbes and plants are solution >
exchangeable > fixed > mineral K (Sparks and Huang, 1985; Sparks, 1987; Sparks,
2000).
Fig. 1. Interrelationships of various forms of soil K (from Sparks and Huang, 1985).
Soil Solution K
Soil solution K is the form readily available for microbial and plant uptake. The
levels of soil solution K generally are low unless a recent application of a K-fertilizer has
been made. Thus, continuous renewal of K in the soil solution for adequate nutrition of

5
high yielding varieties of rice and wheat is obvious. The content of K in soil solution is
in the range of 2 to 5 mg K L-1 for agricultural soils of humid regions, and is an order of
magnitude higher in arid region soils (Haby et al., 1990). Solution K levels are affected
by equilibrium and kinetic reactions that occur between the forms of soil K, soil
moisture content, concentration of bivalent cations in solution, and the exchanger phase
(Sparks and Huang, 1985; Sparks, 2000). Potassium concentration in soil solution also
depends on the degree of replenishment of K in solution from nonexchangeable sites.
Factors that decrease the K concentration of soil solution influence the release of K from
the nonexchangeable K reserve (Hay et al., 1976). Buffering capacity of clay minerals
also affects the concentration of K in soil solution. Well-buffered clay minerals
containing mica and vermiculite maintain higher levels of K in the soil solution than
weakly-buffered allophanic soils (Parfitt, 1992).
Exchangeable K
The exchangeable form of K is readily available to plants, exchangeable with
other cations, and electrostatically bound as an outer-sphere complex to the surface of
clay minerals and humic substances. Exchangeable K is held by different bond strengths
at different adsorption sites on clay minerals. These adsorption sites can be planer or
edge positions of clay minerals or the negative charges created by carboxylic and
phenolic groups of humus colloids compared to pH-dependent negative charges on clay
(Kirkman et al., 1994). The number of exchange sites derived from isomorphic
substitution is constant, but the negative charge on humic and amorphous clay colloids
increases with increasing pH due to the dissociation of H+ from weak acid groups (Gast,

6
1977). Both kinetic and thermodynamic factors affect the amount of K+ held by clay
minerals at exchange sites (Parfitt, 1992). Other factors that affect the K+ concentration
on exchange sites are affinity of exchange sites for K+ in relation to the nature of the soil
surface and concentration of K+ compared to the concentration of other cations
especially bivalent cations, on exchange sites of clay minerals (Barber, 1984).
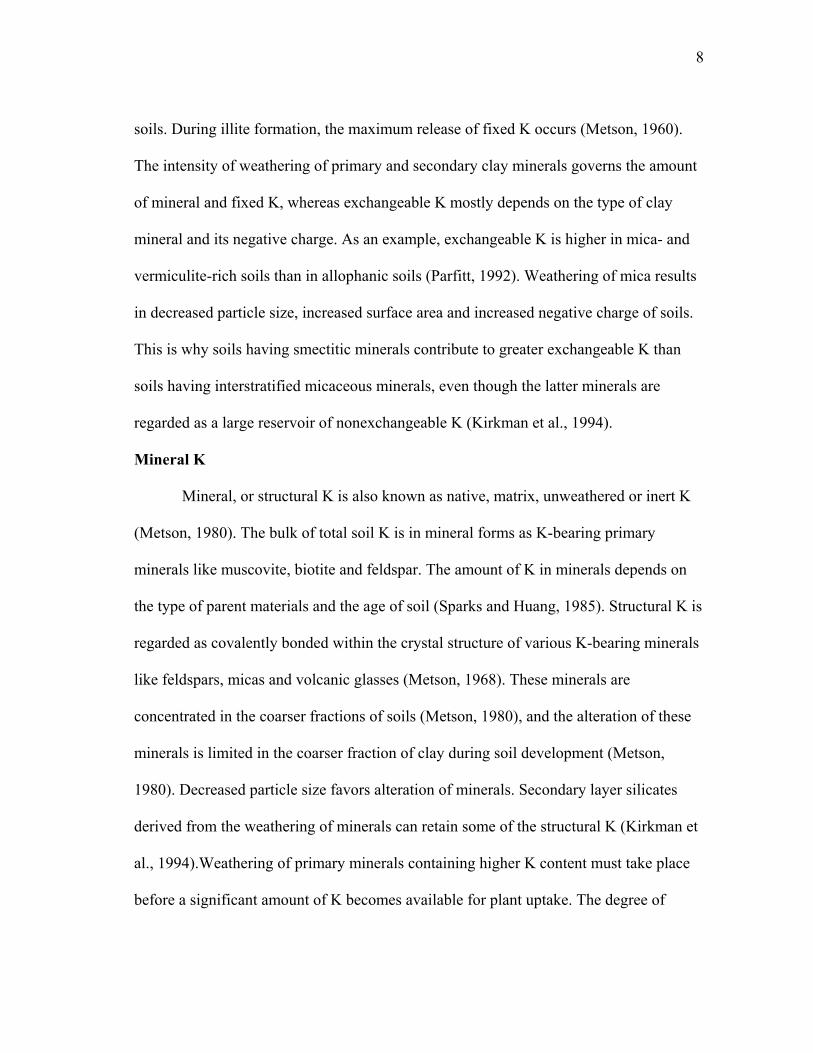
Nonexchangeable K
Potassium in nonexchangeable form is not fixed in the mineral crystal, but is held
between adjacent tetrahedral layers of dioctahedral and trioctahedral micas, vermiculites,
and intergrade clay minerals such as chloritized vermiculite (Rich, 1972; Sparks and
Huang, 1985; Sparks, 1987). This K is not readily accessible for exchange with other
exchangeable cations. According to Goulding (1987), there are several adsorption sites
for K+ on clay minerals (Fig. 2). Adsorption sites for K+ on planar surfaces (p-site) have
low K+ selectivity, those on wedge (w-site) and edge positions (e-site) have medium K+
selectivity, and sites at the interlayer (i-site) and crack positions (c-site) have high K+
selectivity. Potassium in wedge, edge, cracks and step positions is regarded as fixed
potassium. Such positions are between the crystal layers of mica, integrated mica-like
illite, and vermiculite.

7
Fig. 2. Model of 2:1 layer silicate with planar (p), edge (e), interlayer (i), wedge (w), crack (c), and step (s) potassium exchange sites (Goulding 1987).
The amount of fixed K in soils depends on the quantity and type of clay, particle
size distribution and addition and removal of K from minerals (Kirkman et al., 1994).
Nonexchangeable K is sparingly available to plants (Mengel, 1985; Sparks and Huang,
1985; Sparks, 1987). Soils having K+-depleted interlayer sites adsorb added K more
strongly (Metson, 1960). Potassium uptake by plants and microbes, or leaching of K+
from soils results in release of fixed K+ into soil solution. Mineral and fixed K are
regarded as the major reservoirs of soil K, but both forms are nonexchangeable, and
differ in K. Release of fixed K is reversible, whereas the release of mineral K is
irreversible (Kirkman et al., 1994). The release of nonexchangeable K replenishes the
exchangeable K pool when the latter pool is diminished due to leaching and crop
removal (Sparks et al., 1980). According to Metson (1960), degree of weathering has a
greater influence on the release of K from the nonexchangeable pool than the age of
8
soils. During illite formation, the maximum release of fixed K occurs (Metson, 1960).
The intensity of weathering of primary and secondary clay minerals governs the amount
of mineral and fixed K, whereas exchangeable K mostly depends on the type of clay
mineral and its negative charge. As an example, exchangeable K is higher in mica- and
vermiculite-rich soils than in allophanic soils (Parfitt, 1992). Weathering of mica results
in decreased particle size, increased surface area and increased negative charge of soils.
This is why soils having smectitic minerals contribute to greater exchangeable K than
soils having interstratified micaceous minerals, even though the latter minerals are
regarded as a large reservoir of nonexchangeable K (Kirkman et al., 1994).
Mineral K
Mineral, or structural K is also known as native, matrix, unweathered or inert K
(Metson, 1980). The bulk of total soil K is in mineral forms as K-bearing primary
minerals like muscovite, biotite and feldspar. The amount of K in minerals depends on
the type of parent materials and the age of soil (Sparks and Huang, 1985). Structural K is
regarded as covalently bonded within the crystal structure of various K-bearing minerals
like feldspars, micas and volcanic glasses (Metson, 1968). These minerals are
concentrated in the coarser fractions of soils (Metson, 1980), and the alteration of these
minerals is limited in the coarser fraction of clay during soil development (Metson,
1980). Decreased particle size favors alteration of minerals. Secondary layer silicates
derived from the weathering of minerals can retain some of the structural K (Kirkman et
al., 1994).Weathering of primary minerals containing higher K content must take place
before a significant amount of K becomes available for plant uptake. The degree of
9
weathering however depends on the environment and composition and structure of
primary minerals (Fieldes and Swindale, 1954). The order of plant available K from
common K-bearing minerals is biotite> muscovite >orthoclase and microcline (Huang et
al., 1968; Sparks, 1987). Mineral K is regarded as slowly available to plants and depends
on the degree of weathering (Sparks and Huang, 1985; Sparks 1987).
FACTORS AFFECTING POTASSIUM AVAILABILITY
Dynamics of Solution and Exchangeable K
The rate of reaction between soil solution and exchangeable K phases depends
largely on the type of clay minerals present (Sparks, 2001), and the method used to
measure the kinetics of K exchange (Sparks, 1989, 1995; Amacher, 1991; Sparks et al.,
1996). Kaolinite, hydrous mica, montmorillonite (smectite), and vermiculite vary
significantly in selectivity for ions, ion binding affinity, and the type of ion exchange
reaction. Fundamental differences in these clay minerals mentioned above result in
different kinetics of K exchange (Sparks, 2001).
The kinetics of K exchange on kaolinite and montmorillonite are more rapid than
with vermiculitic and micaceous minerals, where exchange is extremely slow. Adjacent
tetrahedral layers in kaolinitic clays are held by H bonds and, therefore, the only
available sites for ion exchange are on edge and planer surfaces. However, instead of
having H bonds within the inner peripheral space, montmorillonite can swell with
adequate hydration, allowing the exchange of ions into the interlayer space (Sparks,
2001). Vermiculitic and micaceous minerals are 2:1 phyllosilicates with peripheral
spaces that hinder many ion exchange reactions (Sparks, 2001). Micaceous minerals

10
have more restrictive interlayer spaces than vermiculite because the interlayer spaces of
micaceous minerals show selective affinity for certain cations such as K+ and Cs+
(Sparks, 2001). Bolt et al. (1963) recognized three types of binding sites for K exchange
in hydrous mica and hypothesized that the rapid kinetics are associated with external
planar sites, slower kinetics are due to edge sites, and the slowest kinetics are reactions
at internal exchange sites.
Retention of K
Retention behavior and dynamics of K play significant roles in soil fertility.
Many studies have inferred that a complex interaction of major and minor minerals in
soil control the fixation and release of applied and native K, in turn influencing the
availability of K to plants. Clay mineralogy of agriculturally important soils is usually
very diverse with respect to types of mineral species, their relative properties and
degrees of crystallinity, etc. Therefore, K fixation and release studies should give due
emphasis to the complex clay mineralogy of soils. It has also been reported that the
change in surface charge that occurs during Fe reduction increases the ability of minerals
to fix interlayer cations, including Na+ (Lear and Stucki, 1989), Ca++, Cu++, and Zn++
(Khaled and Stucki, 1991).
Many factors affect K+ fixation in clay minerals and soils, such as the type and
quantity of clay minerals, the charge density of clays and their capacity for interlayering,
soil moisture content, concentration of K+ along with the concentrations of other
competing cations, and pH of the soil solution (Rich, 1968; Sparks and Huang, 1985).

11
Weathered mica, vermiculite, and montmorillonite are common minerals that fix
K+. Dioctahedral vermiculite is the major mineral that fixes K+ in acid soils. Weathered
micas fix K+ under both dry and moist conditions, while montmorillonite generally fixes
K+ only under dry condition (Rich, 1968). Layer silicates with high charge density fix
more K+ than those with lower charge density (Walker, 1957).
Introduction of hydroxy Al3+ and Fe3+ interlayer groups into layer silicates can
decrease K fixation (Rich and Obenshain, 1955). Volk (1934) noted a marked increase in
K fixation in soil with a pH increased to about 9 or 10 by adding Na2CO3.
There was no fixation of K+ at pH around 2.5, but fixation increased rapidly
between pH 2.5 to 5.5. The rate of K+ fixed was slower above pH 5.5 (Martin et al.,
1946). Cations such as Al3+ precipitate as hydroxy polycations as pH increases above
5.5. The formation of hydroxyl polycations with increasing pH increases the number of
OH groups and the formation of gibbsite-like structures (Thomas, 1960). The charge on
clay cannot be neutralized by Al3+ at pH around 8.0, and K fixation cannot be prevented.
Trivalent Al and Al(OH)X are dominant species at pH around 5.5, but at a pH below 3.5,
H3O dominates (Coleman and Harward, 1953; Thomas and Hipp, 1968).
Potassium Leaching from Soil
Leaching of soil solution K can govern the release of K from soil minerals but
this type of mechanism largely depends on the soil pH, movement of K in soils, soil
cation exchange capacity (CEC), liming and rate of K uptake by plants and microbes
(Terry and McCants, 1968; Sparks, 1980 et al.; Sparks, 2000). Soils vary in CEC and
thus in retaining applied K. Leaching is also affected by the amount of clay in soils and
12
soil organic matter. Soils having higher CEC retain K more strongly than soils with
lower CEC (Sparks and Huang, 1985).
According to Sparks and Huang (1985), leaching of K from sandy soils is
regarded as a common problem. Retention of K can often be enhanced in sandy, Atlantic
Coastal Plain soils after application of lime, since in such variable charge soils, the CEC
is increased as soil pH is increased. Nolan and Pritchett (1960) observed increased
retention of K in a Lakeland fine sand (thermic, coated Typic Quartzipsamment) after
liming the soil to pH 6 to 6.5. They also found that less leaching occurred at pH 6.0 to
6.5 due to enhanced substitution of K for Ca than Al, which was more abundant at low
pH. Lutrick (1963) found that K leaching occurred on unlimed but not on limed areas
when 112 to 224 kg K ha–1 was applied on a Eustis loamy fine sand (sandy, siliceous,
thermic Psammentic Paleudult).
Release of K from Soil Minerals
Clay minerals retain the bulk of plant available K as exchangeable K and release
it when the concentration in soil solution decreases due to plant uptake or to an increase
in soil moisture. High K-saturation of the clay minerals with high CEC results in a high
soil solution K concentration, whereas low K-saturation is in equilibrium with low K
concentration.
Several processes govern the release of K+ from clay minerals. Dissolution of
micas followed by the formation of weathering products, and transformation of K-
bearing mica to 2:1 layer silicates by replacing the K+ with other hydrated cations are
assumed to be two processes. These processes are related to the soil environment and the

13
stability of micas, which influence the mechanisms of K release (Sparks and Huang,
1985; Sparks, 2000). Different physiological and mineralogical factors such as particle
size, chemical composition, physical imperfection, degree of tetrahedral tilting, hydroxyl
orientation, degree of K depletion, alteration of layer charge and associated reactions,
hydronium ions, biological activity, wetting and drying, inorganic cations and other
factors affect the release of K from clay minerals (Sparks and Huang, 1985). Biological
activities favor the release of K from micas and can become a complex process when
organic acids are formed (Mortland et al., 1956; Boyle et al., 1967; Weed et al., 1969;
Sawhney and Voight, 1969).
All soils contain relatively small but measurable quantities of biochemical
compounds like organic acids. Organic acids such as oxalic and citric acids can affect
the release of K from micas and feldspars (Song and Huang, 1988). According to their
observation, the order of ease of K+ release from different minerals by oxalic and citric
acids is biotite > microcline > orthoclase > muscovite.
The activity of K+ in solution surrounding mica particles greatly affects the
release of K+ by cation exchange from those minerals. Replacement of K+ from
interlayers by other cations from solution occurs when the level of K+ in solution is less
than the critical level. Potassium can also re-enter the interlayer of mica expansible 2:1
minerals if the critical K+ level in solution is sufficiently high. This critical level is
higher for trioctahedral minerals such as biotite and lower for muscovite (Scott and
Smith, 1967; Newman, 1969; von Reichenbach, 1973; Henderson et al., 1976).

14
Clay fractions influence the release of K+ from soils upon drying (Scott and
Hanway, 1960). Leaching and redox potential are two other factors that effect K+
release. Leaching can influence K+ release from minerals by carrying away reaction
products and converting micas to 2:1 expandible layer silicates if the leaching water
chemistry is favorable for this kind of reaction. Oxidation and reduction phenomena are
of great importance to soil fertility because the availability of plant nutrients depends in
large degree on the surface chemistry of soil minerals. Oxidation and reduction can also
induce K+ release from micas. In biotite K is held strongly upon oxidation of structural
Fe, thus, the release of K is less from this mineral if the soil environment favors the
oxidation of structural Fe, and it is the opposite if structural Fe is reduced. The in-place
reduction of Fe3+ to Fe2+ in secondary minerals (vermiculite, montmorillonite, illite) also
occurs, and creates an environment in which some of the beneficial effects of weathering
may be reversed, such as the retention of K+ (Sparks, 2001). Structural Fe reduction
increases K+ fixation in smectitic clay minerals (Stucki and Shen, 1993). This is due to
numerous changes that occur in the physical-chemical properties of the soil mineral,
including swelling capacity in water (Stucki et al., 1984), electrical charge (Stucki and
Roth, 1977; Lear and Stucki, 1985), and surface area (Lear and Stucki, 1989). Redox
potential, however, does not directly affect the chemical weathering of feldspars.
Complexing organic acids and oxidation state, however, can influence the chemical
alteration/weathering of feldspars (Sparks, 2001).
Increasing temperature can also increase K+ release from biotite (Rausell-Colom
et al., 1965) and K feldspars (Rasmussen, 1972). Scott et al. (1973) found that

15
tetraphenyl boron extraction of preheated mica (heated to 12730 K) resulted in increased
rate of K+ extraction from muscovite, but decreased the rate for biotite and had little
effect on phlogopite except at a very high temperature. Less K+ extraction from biotite
was due to the oxidation of Fe2+ at high temperature during heating before extraction.
The factors that affect the release of K+ from muscovite, however, are still not well
understood.
MINERALOGY OF THE BENGAL BASIN
The Bengal Basin in Bangladesh is regarded as one of the most densely
populated recent flood plains of the world (Datta and Subramanian, 1997). Bengal Delta,
one of the largest deltas in the world, is in the Bengal Basin. The Bengal Delta is situated
in the flow of the Ganges-Brahmaputra-Meghna(GBM) river system (Coleman, 1981).
According to Datta and Subramanian (1997), this alluvial basin is very important
because of its size, huge deposition of sediments, frequent siltation, and an elevation
lower than mean sea level.
The Bengal Basin, surrounded by the Indian shield on the west, and by the Naga-
Lusai orogenic belt on the east, is open to the Bay of Bengal on the south, and is
bordered by the Shillong shield on the north (Sengupta, 1966). Low feldspar and high
quartz content indicates the low relief tropical weathering condition in this basin (Potter,
1978). The significant occurrence of carbonate minerals in the Bengal Basin is
associated with the deposition of detrital carbonates on the upper reaches during
sediment drainage (Datta and Subramanian, 1997). Irion (1991) reported that the average
illite content of world river basin sediments is in the range of 40% to 60%, which is very

16
similar to that of the Bengal Basin. The abundance of illitic minerals in the Bengal Basin
is due to the presence of muscovite in the parent rocks (Griffin et al., 1968; Segall and
Kuehl, 1992). Kaolinite is the second most common clay mineral after illite. Sediments
may be the source of kaolinite (Brinkman 1977; Islam and Lotse, 1986), and is an
indication of rapid soil-forming process (kaolinization). Irion (1991) reported a low
content of chlorite in the basin due to the low quantity of minerals in the river sediments
draining exclusively lowland tropical areas. The presence of montmorillonite in this
basin is very low, indicating an insufficient amount of eruptive igneous rocks in the
drainage basin.
According to Naidu (1985) and others, 73% to 78% illite and 22% chlorite by
weight were found in the bed sediments of the Ganges River. Subramanian (1980)
observed 46% illite, 28.7% kaolinite, 22.8% chlorite and 2.5% montmorillonite in
suspended sediments from the Ganges River at Calcutta. Illite is one of the most
dominant clay minerals in the northeast Bay of Bengal, and this is also the location
where the Ganges-Brahmaputra River system drains the sediment load carried from the
Himalayas (Rao et al., 1988; Kolla and Rao, 1990; Segall and Kuehl, 1992; Wijayananda
and Cronan, 1994).
MINERALOGY OF THE INDO-GANGETIC ALLUVIAL BASIN
Potassium in soils of the Indo-Gangetic alluvial plains in India is derived from K
feldspars and micas (Sidhu, 1984). Microcline and orthoclase are representative of K
feldspars in these soils. Mica minerals present are muscovite and biotite in the coarser
fractions and illite in the finer fractions. Part of illite’s charge originates in the octahedral

17
layer, unlike muscovite. Sand fractions are dominated in decreasing order by quartz,
micas, and feldspars (Sidhu and Gilkes, 1977; Kapoor et al., 1982; Pundeer et al., 1978).
Silt fractions resemble the sand fraction in mineralogical assemblage. Illite, vermiculite,
and differing amounts of smectite, chlorite, and kaolinite are common clay minerals. The
illites are predominantly dioctahedral (Kapoor et al., 1981; 1982; Sidhu and Gilkes,
1977). Salt affected alluvial soils in the Indo-Gangetic Plain contain smectite–mica and
chlorite–vermiculite interstratified minerals. In the lower Gangetic Basin, illite and
smectite are the dominant clay minerals. Mishra et al. (1996) found that whereas
smectite–illite–chlorite is the most common clay mineral phase in the terraces, clays of
flood plain soils in the middle and lower Gangetic plains are dominated by an illite–
smectite–chlorite phase.
Dominant minerals in the silt fraction of soils in the entire Indo-Gangetic Plain
include quartz–feldspar, quartz–mica or quartz alone. In Pakistan, representing the
western part of the Indo-Gangetic Plains, soils under rice–wheat systems contain large
amounts of mica (about 50%) in sand and silt fractions and illite (about 50%) in clay
fractions (Akhtar and Jenkinson, 1999). Besides illite, the clay fraction also contains
kaolinite, montmorillonite, chlorite, and vermiculite (Bajwa, 1989). These soils
experience moderate levels of weathering of original K-minerals with a large amount of
applied K reportedly fixed (Ranjha et al., 1992).
K-STATUS IN SOILS OF BANGLADESH AND OTHER ASIAN COUNTRIES
The combination of rising population and increasing food demand has placed
tremendous pressure on the land resource of Bangladesh. The population of Bangladesh

18
is expected to reach 250 million by 2025. Expansion of cultivated land is hardly realistic
in this densely populated country, so crop intensification is the main vehicle for
increasing food output (Cassman et al., 2003). Rice is the staple food for millions of
people in Bangladesh. During the last 30 years of the 20th century, rice cropping was
intensified in Bangladesh along with other Asian countries. This intensification in
combination with unbalanced fertilization has resulted in depletion of K in soils over
large areas in China (Jiyun et al., 1999), India (Hasan, 2002) and other countries in
Southeast Asia (Dobermann et al., 1996b, 1998).
Improved farming practices and use of high yielding crop varieties, along with
fertilizer N application, increased crop production in China significantly in the 1960’s
(Jiyun et al., 1999). At the same time, soils were becoming more deficient in plant
nutrients, except N. Phosphorus became the next most deficient nutrient and yield-
limiting factor. Hence, P fertilizer application became important for further increases in
crop yield. Increased crop production together with increased use of N and P fertilizers
resulted in K-deficiency first in southern China in early 1970 and extended to northern
China (Hoa, 2003). Unbalanced fertilizer application, which has more N than P and K,
became very common during 1950 to 1980 in China. China attempted to use a more
balanced fertilizer beginning in the late 1980’s, but N was still applied at a rate
proportionally higher than P and K. Fertilizer use in China today is still not properly
balanced. Inadequate K application along with removal of straw from Chinese rice fields
has caused increased K-deficiency and significant responses of crop yield to K-fertilizer
application (Jiyun et al., 1999). In a similar fashion, Bangladeshi farmers use a large
19
amount of rice straw as animal feed and for domestic fuel thus removing a substantial
amount of soil K every year. They also use unbalanced fertilizer formulations, so K
deficiency may become widespread throughout the country.
Dobermann et al. (1998) reported that coarse-textured and highly weathered soils
(Oxisols, Ultisols) typically show K deficiency in South and Southeast Asia. They also
noted that most of the soils of the great alluvial floodplains were generally regarded as
high in extractable K. It was also thought that K addition through indigenous sources
such as irrigation and flood water would make K a rare limiting factor in irrigated rice
systems (Kawaguchi and Kyuma, 1977; De Datta and MIkkelsen, 1985; Bajwa, 1994).
Potassium inputs in irrigation water may be more than 30 kg ha-1 year-1 in rice-wheat
areas where ground water is used (Pasricha, 1998). However, widespread K-deficiency
has been observed on fine textured soils, which includes alluvial, illitic soils in India
(Tiwari et al., 1985), vermiculitic clay soils of central Luzon, Philippines (Oberthuer et
al., 1995), and lowland rice soils of Java (Scri Adiningsih et al., 1991).
Potassium nutrition has become a very important factor in increasing crop
production in Asia. Substantial applications of properly balanced fertilizer replenish the
soil K pool which is being removed by intensive cropping systems (Bijay-Singh et al.,
2004). Most soils in the Indo-Gangetic Plains are historically deficient in N. Potassium
deficiency is emerging in some Indo-Gangetic Plains soils due to the micaceous nature
of these soils (Ladha et al., 2002).
Several chemical and biochemical changes occur in rice soils during the flooding
season, which influences the transformation and availability of nutrients

20
(Ponnamperuma, 1972, 1985; Cao and Hu, 1995). Submerged soils are regarded as high
in exchangeable K+ and Na+ compared to upland soils, especially in the cultivated layer
(Bijay-Singh et al., 2004). Flooded soils are different in the control of acidity and
alkalinity due to the partial pressure of CO2 buffering carbonates in the flood water.
Thus, the changes in pH and redox influence the chemical equilibria and availability of
various nutrients to plants. Most chemical changes are reversed during draining (Bijay-
Singh et al., 2004).
Soil analysis is an important tool when evaluating soil nutrient status, and results
are often used as the basis for fertilizer recommendations. This practice is justified in
cases where a correlation between soil test results and crop response to fertilizer
applications has been established. Generally, crop responses to a fertilizer nutrient
should be lower the higher the content of the nutrient in a soil. A small proportion of the
K required by plants comes from direct contact through root interception, whereas the
largest fraction of the K needed by plants has to be transported from soil to roots via
diffusion. Transport happens mainly in soil solution, the liquid phase of the soil, by mass
flow (with the water moving to the plant roots) and diffusion along a concentration
gradient that is created by the absorbing roots. In the immediate proximity of roots, soil
solution is rapidly exhausted of nutrients due to uptake by plants. A continuous supply of
K to growing plants is only insured when the rate of K release to soil solution and
transport to roots keeps pace with the K uptake.
The rate and quantity of the release of non-exchangeable to exchangeable and
soluble K+ primarily depend on the level of K+ in the soil solution, the type and amount

21
of clay minerals present (Martin and Sparks, 1985; McLean, 1978), the degree of
exposure of edges of clay minerals to the soil solution, and the position of non-
exchangeable K+ with respect to outer edges. Soils therefore vary in releasing non-
exchangeable K+ rapidly enough to meet the needs of crop production and may be slow
enough to restrict the yield (Bijay-Singh et al., 2004).
Plant available K depends on the size of the available K pool in soil and transport
mechanisms of K from soil solution to the root zone and from the root zone into plant
roots (Barber, 1984). Many plant factors (e.g. variety, root system, antagonistic and
synergistic mechanisms in ion uptake) and soil factors (pH, organic materials) also affect
plant availability of K (Hoa, 2003). Dry lowland soils containing vermiculite, illite, or
other 2:1 layer clay minerals may result in increased K+ fixation and reduced solution
concentration during flooding, so that rice depends on non-exchangeable reserves for K+
uptake. Regmi (1994) observed in a long-term experiment with a rice–wheat rotation in
the Tarai plain of southern Nepal that the proportion of added K+ that was fixed ranged
from 46 to 56% in a wet/dry equilibration, and fixation was linear with addition rates of
up to 25 mM K kg-1 soil.
Scientists have a rather poor understanding of the behavior of K in soils
subjected to cycles of flooding. Iron is an important and abundant constituent and may
be present as Fe(II) (reduced form) or Fe(III) (oxidized form). Iron oxidation state within
crystal structures of soil minerals is an important factor in understanding K behavior
(Stuki and Shen, 1993). Soils containing appreciable quantities of mica (especially
biotite), illite, vermiculite and Fe-containing smectite, structural Fe may undergo

22
reduction during flooding and oxidation during periods of drainage. It has been reported
that Fe reduction from Fe+3 to Fe+2 plays a significant role in fixing K in smectite clay
minerals (Stucki and Shen, 1993). Weathering of primary minerals is regarded as an
oxidative process. In this process, Fe2+ converts to Fe3+ and soil minerals become
expansive types which release various nutrients including K (Stuki and Shen, 1993). But
according to Lear and Stucki (1989), surface charge density increases upon Fe reduction
and increases the ability of the minerals to fix K+ and other interlayer cations (Chen at
al., 1987; Khaled and Stucki, 1991). Stucki and Huo (1996) observed a strong direct
correlation between Fe(II) (reduced Fe) and K+ fixation in smectite minerals. But this
correlation was weaker and inverse in the case of illite minerals, probably due to the
change in electrostatic force between K and structural OH groups.
Stucki and Shen (1993) proposed a hypothesis on the behavior of illite in
releasing K during Fe reduction. The hypothesis was that Fe (II) is added to the
octahedral sheet of illite during reduction; the dipole moment of structural OH groups
becomes more canted to the c-axis and therefore creates a weaker attractive bond or
stronger repulsive force between clay layer and the interlayer K ions, resulting in release
of K to soil solution.
The behavior of clay minerals greatly depends on the type of clay mineral that is
present (Stucki and Shen 1993). According to their observation, if illite dominates,
reduction may enhance availability of K, whereas smectite domination may results in K
fixation during reducing conditions. If these minerals are precisely balanced, no net

23
change in K availability would occur, because the amount that one releases would be
fixed by the other.

24
CHAPTER III
MATERIALS AND METHODS
SOILS AND ROUTINE ANALYSES
Five soils from four different thanas of Bangladesh (Fig. 3) were described and
sampled by horizon from freshly exposed pits and auger borings in March 2005. Soil
samples for this study were selected from these soils. Soil samples were air-dried and
crushed to pass a 2-mm sieve.
Particle size distribution of these soils was assessed by the pipette method
described by Kilmer and Alexander (1949) and Steele and Bradfield (1934). Sands were
wet-sieved, dried at 1050C overnight, and dry sieved in a nest of sieves.
Soil pH was determined in distilled water in a 1:1 ratio (weight: volume) and
after an equilibration period of 1 hour. The pH was measured by a glass electrode
following method 8C1a (Soil Survey Laboratory Staff, 1996).
The CEC of the soils was determined at pH 8.2 as described by the Soil Survey
Laboratory Staff (1996) and using an automatic extractor (Holmgren et al., 1977). Soils
were saturated with 1N NaOAc at pH 8.2, washed with ethanol and the exchangeable Na
was replaced with 1N NH4OAc. Concentrations of Na were analyzed by flame emission
on the atomic absorption spectrometer.

25
Fig. 3. Soil sampling sites in four selected thanas.
4
2, 3
6
5
Site No. Thana 2 Tala 3 Tala 4 Paba 5 Brahmanbaria 6 Senbag

26
Bases extracted in 1M NH4OAc pH 7.0 were determined following extraction of
about 5 g samples with 50 ml of solution using an automatic extractor (Holmgren et al.,
1977). Extractable Ca and Mg were quantified by atomic adsorption using a N2O-
acetylene flame, while Na and K were analyzed by flame emission with an air-acetylene
flame.
Total C of the study soils was quantified using a medium-temperature resistance
furnace and scrubbing train as described by Nelson and Sommers (1982). The quantity
of inorganic C from CaCO3 equivalent was subtracted from the total C to give the
percentage of organic C.
The quantity of CaCO3 was determined using the Chittick procedure as described
by Dreimanis (1962). This method which measure the volume of CO2 released upon
reaction with carbonate with HCl allows the quantification of calcite and dolomite based
on reaction time. Results were used to calculate the CaCO3 equivalent.
All sixteen soil samples from the five profiles (surface and subsurface soils)
were used in the routine determination of the physical, chemical and mineralogical
properties described above. As described in a later section selected horizons were used
for nonexchangeable K, total K and cation exchange capacity (CEC) in both oxidized
and reduced condition. Three surface soils from three different profiles (Tala-2, Paba-4
and Senbag-6) with different pH and clay content were selected to determine the impact
of redox on CEC in different periods of time. Three other surface soils with different pH
and clay content from three different profiles (Tala-3, Paba-4 and Senbag-6) were used
to observe the release and retention of K from those soils as a function of redox.

27
CLAY MINERALOGY
For the separation of sand, silt and clay, about 50 g of sample were shaken
overnight with 50 ml of 5% Na2CO3 and 150 ml of deionized water to facilitate
dispersion. Sands were removed with a 300-mesh screen by wet sieving. Sands were
dried in a 1050C oven and weighed. Clays were separated from silts using an automatic
fractionator. Separated silts were dried at 1050C, while clays were concentrated by
flocculating with MgCl2, decantation and centrifugation. Clay fractions were further
separated into fine clay and coarse clay by centrifugation. Mineralogy of the clay
fractions was determined by X-ray diffraction on oriented samples. Clays were initially
saturated using 0.5 M MgCl2 and centrifugation. After removal of excess MgCl2 by
washing with water and water-ethanol mixtures, oriented clays were vacuum deposited
onto unglazed ceramic tiles. One oriented clay sample received about 3 ml of 10%
ethylene glycol treatment, while the other two oriented samples were X-rayed at room
temperature and after heating to 3500C and 5500C. Clay samples were scanned from 20
to 320 2θ using CuKα radiation.
Kaolinite was identified by a 0.7nm peak in all treatment but was destroyed when
heated to 5500C. Smectite was identified by the 1.8 nm peak upon expansion with
ethylene glycol but that was at 1.4 nm in the air-dry samples, and collapsed to 1.0 nm
upon heating. Vermiculite was identified by a 1.4 nm peak with ethylene glycol
treatment but that collapsed to 1.0 nm upon heating. Chlorite was identified as a 1.4 nm
peak that remained upon heating to 3500C and 5500C. A peak at 1.0 nm in the ethylene
glycol scan was identified as mica.
28
TOTAL POTASSIUM
Total K concentration was determined on selected whole soils and silt, coarse
clay, and fine clay samples following the procedure described by Bernas (1968). Where
needed, samples were ground to pass a 200-mesh sieve, and 50 mg (whole soil, silt, fine
clay and coarse clay samples) were placed into acid digestion vessels along with 0.5 ml
of aqua regia and 3 ml of HF. The closed vessels were placed into an oven at 1100C for
an hour. After cooling, decomposed samples were transferred to plastic beakers with the
aid of 4 to 6 ml of water. Then 2.8 g of H3BO3 acid were added immediately to the
decomposed samples and stirred with a Teflon magnetic stirrer for 15 minutes to
promote the formation of soluble fluoroborates from insoluble complex fluorides. About
40 ml of water and 5 ml of 2% NaCl were added to the clear homogenous sample
solution. The solution was transferred to a 100-ml volumetric flask and brought to
volume with deionized water. The sample solutions were analyzed for K by flame
emission using an air-acetylene flame.
NITRIC ACID EXTRACTABLE K
The procedure developed by Pratt and Morse (1954) for HNO3- extractable K
was modified by using a digestion block instead of a hot oil bath. Selected samples were
ground in a disc mill grinder for about 12 seconds, and 2.5 g of finely ground soil
samples were placed into digestion tubes. Twenty five ml of 1.0 N HNO3 were added,
and then tubes were placed into a preheated digestion block at 1130C for 25 minutes.
After removing tubes, the contents were filtered using number 42 Whatman filter paper
and filtrates were collected in 100-ml volumetric flasks. Residues were washed four
29
times with 15 ml of 0.1 N HNO3. After cooling, the solutions were brought to volume.
Concentrations of K were determined using flame emission.
SOIL CATION EXCHANGE CAPACITY IN AN OXIDIZED CONDITION
Five g of air-dried soil were placed into a 50-ml centrifuge tube. Samples were
ground to pass a 200-mesh sieve. Each sample was saturated with 40 ml of 0.1M MgCl2.
After 20 minutes of shaking, the suspension was centrifuged at 2000 rpm for 5 minutes
and the supernatant was decanted. The saturation step was repeated two more times.
After each centrifugation, a vortex stirrer was used to resuspend the soil.
After saturation with Mg2+, samples were washed with 40 of ml of deionized
water. Suspensions were centrifuged for 25 minutes at 2000 rpm, and supernatants were
decanted. These steps were repeated for two more times.
Magnesium was displaced from the exchange sites using Ca2+. Thirty ml of 0.1
M Ca(NO3)2 was added to each sample and were shaken for 20 minutes after the
washing. Sample suspensions were centrifuged at 2000 rpm for 5 minutes and
supernatants were poured into 100-ml volumetric flasks. The process was repeated twice
more, after which the solutions were brought to volume with distilled water. Displaced
Mg2+ was determined by atomic absorption using an acetylene-nitrous oxide flame.
SOIL CATION EXCHANGE CAPACITY IN A REDUCED CONDITION
Five g of air dried soil from each sample were placed into centrifuge tubes.
Twenty ml of deionized water were added to each along with 0.05 g of dried and finely
ground clover to serve as a C source for microbes. The tubes were shaken by vortex
stirrer and placed into a glove box in a reduced environment (chamber) where the
30
maximum concentration of O2 was less than 2 ppm. Samples were shaken very slowly
on a reciprocal shaker inside the glove box until reduction was achieved. The redox
potential was checked daily to make sure the samples were reduced. When the redox of
the soils ceased to decrease further, then the mean redox of the samples was measured.
The mean corrected redox of these samples was -38 mV. The samples were removed
from the glove box, centrifuged, and the water decanted. The samples were placed back
into the glove box for saturation with Mg2+. Reagents were placed into the glove box 2
to 3 days prior to saturation to remove O2 from reagent solutions used during the
washing and displacement procedure. Deionized water used to make the reagent was
boiled to reduce the concentration of O2 in the water.
The procedure previously described (saturation with 0.1M MgCl2, washing with
deionized water, displacement by 0.1 M Ca(NO3)2) was followed inside the glove box.
Samples in the capped centrifuge tubes were taken from the glove box during each
centrifugation period and were placed back after centrifugation. Supernatants were
decanted inside the glove box. Displaced Mg2+ was determined by atomic absorption as
described previously.
ADSORPTION ISOTHERM OF THREE SELECTED SOILS (OXIDIZED)
Five g of soil samples from Tala-3, Paba-4, Senbag-6 were placed into weighed
50 ml centrifuge tubes. Eight rates of K were used. Rates were based upon a percentage
of the soil CEC (0, 2, 5, 10, 20, 50, 100, and 150% of CEC) and corresponded to 0, 2.92,
7.30, 14.6, 29.2, 73.0, 146, and 219 mmol K kg-1 soil. Solutions were prepared that
would deliver the required level of K+ in 1 ml when diluted to 20 ml. Thus 1 ml for each
31
rate was added along with 19 ml of distilled water. Samples were equilibrated for 48
hours. Samples were also shaken on a reciprocal shaker during the equilibrium period,
then centrifuged at 2000 rpm for 10 minutes. The extracts were diluted and analyzed for
K+ in the equilibrium solution using flame emission. The soil samples were then
equilibrated again in 20 ml of 1M NH4OAc solution during four hours of shaking. Then
the samples were centrifuged at 2000 rpm for 10 minutes and the supernatants were
collected. This 1M NH4OAc step was done twice. The supernatants were diluted to
measure the K displaced from the colloid by atomic absorption spectrometer.
ADSORPTION ISOTHERMS OF THREE SELECTED SOILS (REDUCED)
The selected soils from Tala-3, Paba-4, Senbag-6 were incubated as described
for CEC in reduced condition. Twenty ml of deionized water were added along with
0.05 g of dried and finely ground clover to serve as a C source for microbes. The tubes
were shaken well by vortex stirrer and placed into a glove box in a reduced environment
(chamber) where the maximum concentration of O2 was less than 2 ppm. Samples were
shaken on a reciprocal shaker inside the glove box until the samples were reduced. The
redox potential was checked daily to make sure the samples were reduced. When the
redox of the soils ceased to decrease further, then the mean redox of the samples was
measured. Once a sustained mean redox potential of -60 mV was obtained, the samples
were centrifuged and solutions analyzed as described in the oxidized absorption isotherm
procedure except the procedure was performed in a glove box under very low O2 partial
pressure.

32
CHAPTER IV
RESULTS AND DISCUSSIONS
SELECTED PROPERTIES OF THE STUDY SOILS
The properties of soil horizons which were selected for detailed study are given
in Table 1. Complete data on all horizons are in Appendix A, and descriptions of the
soils are in Appendix B.
The soils developing from Ganges alluvium have distinctly different properties
from those developing from Meghna alluvium (Table 1). Calcium carbonate is absent in
the Meghna-alluvium derived soils (Brahmanbaria-5 and Senbag-6) and soil pH values
for these soils range from 5.0 to 7.6, while most horizons derived in Ganges alluvium are
calcareous (up to 84 g CaCO3 kg-1 ) and all are moderately alkaline (pH range of 7.7 to
8.3). The Meghna alluvium-derived soils have lower clay content (49 to 186 g kg-1) as
compared to the Ganges alluvium-derived soils (127 to 500 g kg-1). All soils have a high
silt content, and organic C tends to decrease with depth.

33
Table 1. Selected properties of the study soils.
Site Name Soil Horizon
Depth Texture* Soil pH
Total Clay
Organic C
CaCO3 Total Silt
Fine Clay
cm ----------------------- g/kg --------------------
------------------------------------------------- Ganges Alluvium ----------------------------------------------
Tala-2
Ap1
0-7
SiL
7.9
189
16.8
84
755
51
Ap2 7-10 SiL 8.1 193 8.5 69 769 73 Bw3 38-68 SiL 8.3 218 6.8 52 708 75 Tala-3 Ap1 0-6 SiL 7.9 239 9.6 ND** 605 92 Ap2 6-14 SiL 8.1 240 7.5 10 606 85 Bw2 30-40 SiL 8.1 127 3.2 62 716 48 Paba-4 Ap1 0-10 SiCL 8.0 332 12.6 51 616 117 Ap2 10-19 SiCL 8.0 355 9.4 40 601 134 2Bw1b 55-76 SiC 7.7 500 6.2 ND 471 220
-------------------------------------------- Meghna Alluvium ---------------------------------------- B.Baria-5 Ap1 0-8 SiL 5.5 142 18.3 ND 779 26 Ap2 8-14 SiL 7.0 158 9.1 ND 804 38 Bw4 44-78 Si 7.6 117 3.1 ND 848 39 Bw5 78-100 SiL 7.4 186 4.3 ND 804 58 Senbag-6 Ap1 0-10 Si 5.0 49 10.7 ND 913 13 Ap2 10-25 Si 6.6 69 5.4 ND 886 21 Bw3 42-52 Si 6.7 112 2.8 ND 811 31 *Si = silt, SiL =silt loam, SiCL = silty clay loam, SiC = Silty clay **ND- Not determined, as no reaction with HCl was noted.

34
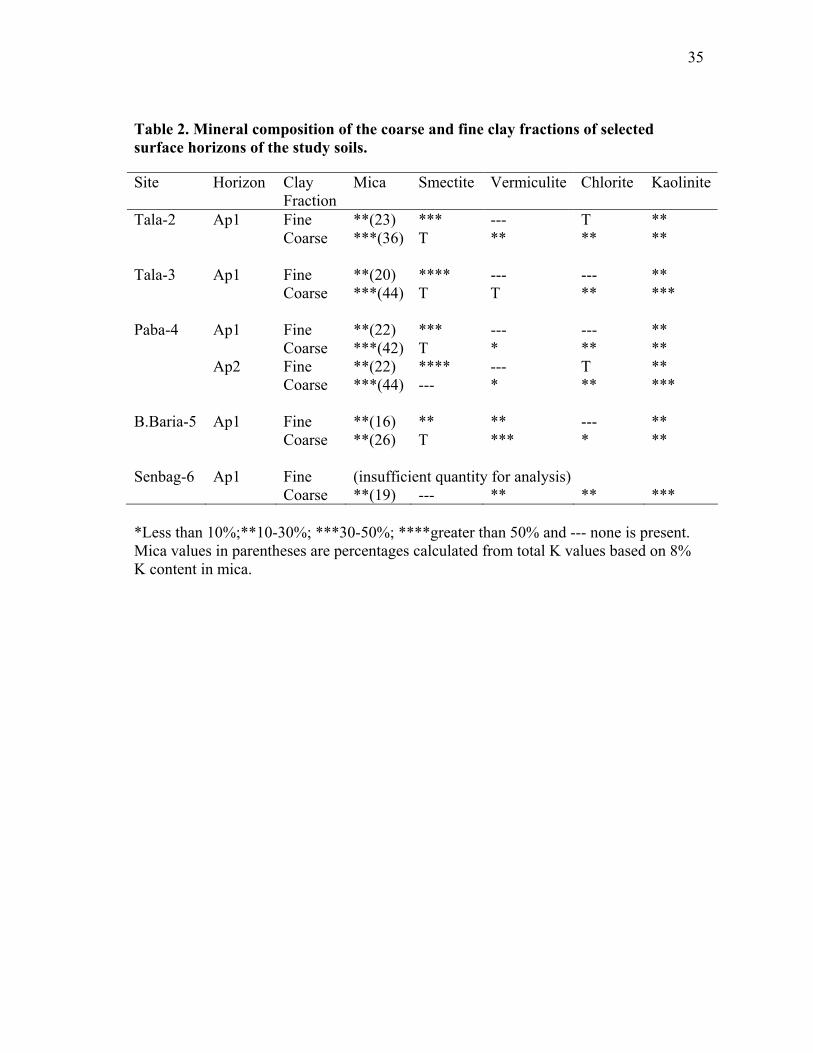
CLAY MINERALOGY OF THE STUDY SOILS
The clay fractions of the surface horizons of each study soil were further
separated into coarse and fine clays by centrifugation and subjected to X-ray diffraction
to identify and semi-quantify the clay mineralogy. Selected diffractograms are presented
in Appendix C, and the interpretations of the diffractograms are given in Table 2.
The coarse clay fraction of each horizon had a higher concentration of mica than
the fine clay in all of the surface horizons (Table 2), and substantial amounts of mica
were noted in all surface horizons. The presence of kaolinite was also significant in both
clay fractions of all soils. As these are relatively young soils, the kaolinite is believed to
be inherited from the parent alluvium rather than resulting from pedogenesis. The
Senbag and Brahmanbaria soils had more vermiculite than the three soils developing
from the Ganges alluvium, and only a trace amount of vermiculite was present in the
coarse clay fraction of Tala-3 soil. This suggests that the more acidic nature of the
Meghna alluvium soils (Brahmanbaria and Senbag) resulted in the weathering of some
mica to vermiculite, while the alkaline conditions for the three soils of Ganges alluvium
showed less weathering of mica to vermiculite. The fine clay fractions of the soils had
higher concentrations of smectite than the coarse fractions and only trace amounts or no
smectite was present in the coarse clay fractions. Chlorite was found in the coarse clay
fraction of all soils, and was almost absent in the fine clay fractions.
35
Table 2. Mineral composition of the coarse and fine clay fractions of selected surface horizons of the study soils.
Site Horizon Clay Fraction
Mica Smectite Vermiculite Chlorite Kaolinite
Tala-2 Ap1 Fine **(23) *** --- T ** Coarse ***(36) T ** ** ** Tala-3 Ap1 Fine **(20) **** --- --- ** Coarse ***(44) T T ** *** Paba-4 Ap1 Fine **(22) *** --- --- ** Coarse ***(42) T * ** ** Ap2 Fine **(22) **** --- T ** Coarse ***(44) --- * ** *** B.Baria-5 Ap1 Fine **(16) ** ** --- ** Coarse **(26) T *** * ** Senbag-6 Ap1 Fine (insufficient quantity for analysis) Coarse **(19) --- ** ** *** *Less than 10%;**10-30%; ***30-50%; ****greater than 50% and --- none is present. Mica values in parentheses are percentages calculated from total K values based on 8% K content in mica.

36
TOTAL K BY HF DIGESTION
The soil horizons selected for detailed study were fractionated into sand, silt, and
clay then clays were separated into fine (<0.2 µ) and coarse (2-0.2 µ) fractions. Total K
was determined on each fraction (excluding sands) and the bulk soils using HF
digestion. Results are given in Table 3.
Significant concentrations of K were present in all fractions of the clays and silts.
Potassium concentration was greatest in the coarse clays of all the soils studied (Table 2)
which is attributed to the high content of mica in this fraction, but significant
concentrations of K were also found in the fine clay and silt fractions. Soils from
Ganges alluvium (Tala-2, Tala-3, and Paba-4) had slightly higher total K in all fractions
throughout the profile than the soils from Meghna alluvium (Brahmanbaria-5 and
Senbag-6). This trend was most apparent in the clay fractions and was attributed to a
greater content of mica in Tala-2, Tala-3, and Paba-4 soils than the soils from
Brahmanbaria-5 and Senbag-6 (Table 2). The concentration of total K was greatest in the
Paba-4 soil (average of 23.3 g kg-1 total K throughout the profile) and was least in the
soil from Senbag-6. These difference are due to the different characteristics of these soils
such as the different parent materials, degree of leaching as inferred from soil pH or
draining condition (hydrological status), and the abundance of mica , and interstratified
1.0 nm/1.4 nm minerals.

37
The amount of K in each size fraction was calculated from K concentration in the
fraction (Table 3) and the particle size distribution (Table 1), and results are given in
Table 3. Clearly, silt contributed the most of total K to the whole soil, followed by the
clay fractions. Coarse clay contributed more total K to the bulk soil than fine clay. The
amount of K in the sand fraction was calculated as the difference between bulk soil total
K and silt plus clay contributions. As a result, all analytical errors accumulated in this
function and values ranged from -1.5 to 6.3 g kg-1 soil. Clearly, the sand contribution of
K to soil total K was substantially less than the contributions from the silt and clay
fractions.
The total K values in the coarse and fine clay fractions were used to calculate the
mica content in each horizon, and results are presented in Table 2. Assumptions in these
calculations were that all the K was from mica and that the mica had a K-concentration
of 8%. The calculated mica contents generally agreed with the estimates from the X-ray
diffractogram interpretations.

38
Table 3. Total potassium (K) as determined by HF digestion in the bulk soils, silt, fine and coarse clay fractions.
Total K in Fraction Total K Contribution to Soil
Site Name
Horizon Bulk Soil
Silt Fine Clay
Coarse Clay Silt Fine
Clay Coarse Clay
Total Clay Sand*
---------------------------------- g kg-1------------------------------------------- Tala-2 Ap1 21.9 19.2 19.4 30.3 14.5 1.0 4.2 5.2 2.2
Ap2 21.9 20.5 19.3 37.0 15.8 1.4 4.4 5.8 0.3 Bw3 23.2 19.6 5.6 29.9 15.1 0.4 4.3 4.7 3.0
Tala-3 Ap1 19.5 19.6 16.8 36.5 11.9 1.5 5.4 6.9 0.7 Ap2 20.1 18.7 18.0 34.0 11.3 1.5 5.3 6.8 2.0 Bw2 19.9 15.3 4.3 30.5 11.0 0.2 2.4 2.6 6.3
Paba-4 Ap1 22.6 21.5 18.1 34.7 13.2 2.1 7.5 9.6 -0.2 Ap2 22.4 22.2 18.3 36.8 13.3 2.5 8.1 10.6 -1.5 2Bw1
b 24.9 27.4 4.6 32.0 12.9 1.0 9.0 10.0 2.0
BBaria-5 Ap1 17.7 18.3 13.6 22.0 14.3 0.4 2.6 3.0 0.4
Ap2 17.7 17.7 13.4 23.6 14.2 0.5 2.8 3.3 0.2 Bw4 21.4 18.7 3.5 23.6 15.9 0.1 1.8 1.9 3.6 Bw5 22.1 21.0 8.3 23.5 16.9 0.5 3.0 3.5 1.7
Senbag-6 Ap1 15.8 16.3 10.3 15.4 14.9 0.1 0.6 0.7 0.2 Ap2 15.9 17.2 12.9 16.5 15.2 0.3 0.8 1.1 -0.4 Bw3 20.2 19.2 5.4 24.5 15.6 0.2 2.0 2.2 2.4
*Calculated as difference in bulk soil K and sum of silt and clay K.

39
NITRIC ACID EXTRACTABLE K
The non-exchangeable K pool is in dynamic equilibrium with the plant-available
K pool and acts as an important source of slow release K (De Datta, 1985), and HNO3-
exctractable K represents a more active portion of the non-exchangeable K pool.
Soils having a higher rate of release of non-exchangeable K have a predominance
of K-bearing minerals such as mica and illite in the clay fraction compared to soils
which are low in non-exchangeable K (Table 4) (Metson, 1968). The rate decreases in
proportion to a lower abundance of micaceous clays and increasing abundance of 1:1
layer and oxide clays (Metson and Lee, 1977; Metson, 1980). The K removed by 1M
boiling nitric acid increases with clay concentration and with a decrease in the degree of
weathering (McLean and Watson, 1985).
Higher concentrations of HNO3-exctactable K were present in the soils from
Tala-2, Tala-3, and Paba-4 (Ganges alluvium) than in the Brahmanbaria-5 and Senbag-6
soils (Table 4). This result suggested that soils developed in the more acidic and lower
clay content Meghna alluvium have a lower content of micaceous minerals, or that the K
in micas has been completely or partially weathered from the mica interlayer by
weathering. Since the quantity of exchangeable K would also be a constituent of the
HNO3-extractable K, the difference in this was reported in table-4 as non-exchangeable
K. This fraction would be most related to the amount of K that was associated with mica
interlayers. Since the exchangeable K values are quite small compared to the HNO3
extractable K, the distribution of non-exchangeable K is almost identical to that of
HNO3-extractable K.

40
Feldspar was not identified in the clay fraction using X-ray diffraction, so all
HNO3-extractable K is likely from mica, except for the minor contribution from
exchangeable K. These results reflected the mineralogy of the study soils and indicated
that the rate of release of less soluble forms of non-exchangeable K would be expected
higher in soils developed in Meghna alluvium. The non-exchangeable pool is also higher
in calcareous soils than the acidic soils.
The ratio of HNO3-extractable K to total K presented in Table 4 suggests that the
soils of the Meghna alluvium (Brahmanbaria-5, Senbag-6) have lower amounts of K in
micas and a greater proportion in forms that are released more slowly (i.e., feldspars)
compared to the soils of the Ganges alluvium. The X-ray analysis (Table 2) also
suggested the loss of K from micas resulting in formation of more vermiculite in the
acidic Meghna alluvium.

41
Table 4. Status of total K and nitric acid extractable K for selected soil horizons.
Site Name
Horizon Total K
HNO3 Extractable
K
ExchangeableK
Non-exchangeable
K
HNO3 - Extractable K to
Total K Ratio
--------------------------- g kg-1 ------------------------------------ Tala-2 Ap1 21.9 18.7 0.12 18.6 0.86 Ap2 21.9 21.0 0.16 20.8 0.96 Bw3 23.2 20.7 0.16 20.5 0.89 Tala-3 Ap1 19.5 12.1 0.08 12.0 0.62 Ap2 20.1 11.9 0.08 11.8 0.59 Bw2 19.9 13.3 0.04 13.3 0.67 Paba-4 Ap1 22.6 16.6 0.16 16.5 0.74 Ap2 22.4 21.5 0.16 21.4 0.96 2Bw1b 24.9 23.5 0.23 23.2 0.94 B.Baria-5 Ap1 17.7 5.6 0.04 5.6 0.32 Ap2 17.7 5.7 0.04 5.7 0.32 Bw4 21.4 7.7 0.04 7.7 0.36 Bw5 22.1 7.3 0.04 7.3 0.33 Senbag- 6 Ap1 15.8 2.0 0.04 1.9 0.13 Ap2 15.9 2.2 0.00 2.2 0.14 Bw3 20.2 10.7 0.04 10.7 0.53
42
CATION EXCHANGE CAPACITY OF THE STUDY SOILS IN REDUCED AND
OXIDIZED CONDITIONS
Cation exchange capacity and exchangeable K are important tools to assess
plant-available K. Soils under study are from rice fields and undergo flooding for several
months each year, so it is useful to observe the charge characteristics of the soils under
contrasting oxidized and reduced conditions.
Readily plant-available K comes from two sources, exchangeable K and soluble
K. The exchangeable form of soil K is exchangeable with other cations and is in
dynamic equilibrium with solution phase K. Commonly, the quantity of exchangeable K
is much greater than the solution phase of K. The quantity of exchangeable K is given in
Table 5 for the horizons that were studied for CEC in oxidized and reduced conditions.
Additional exchangeable K data are included in Appendix A. Results indicate that
exchangeable K is greater in soils developed from Ganges alluvium than in Meghna
alluvium.
The CEC of the oxidized soils ranged from 4.1 to 26.8 cmol(+) kg-1 for the
surface and subsurface soils, while the CEC of the same horizons when reduced ranged
from 2.4 to 26.1 cmol(+) kg-1 (Table 5). The average CEC of these soils in oxidized
condition was 14.6 cmol(+) kg-1 and that in reduced condition was 12.2 cmol(+) kg-1.
Although both sets of CEC data tended to be lower for the soils with lower pH and was
higher for the soils with higher pH, the relationship between the soil clay content and
CEC was more apparent. Since CEC increases with an increase in layer charge, a greater
clay content results in more layer charge per unit of soil. Regression analysis for total

43
clay with CECox (Fig. 4) and total clay vs. CECred (Fig. 5) indicated significant
relationships exist (r2 for clay vs. CECox, 0.719 and r2 for clay vs. CECred, 0.828). The r2
values were significant at the 95% confidence level.
y = 0.0387x + 6.82r2 = 0.7194
0
5
10
15
20
25
30
0 200 400 600
Clay g kg-1
CE
Cox
(cm
ol(+
)kg-1
)
Fig. 4. The relationship of CEC of the oxidized soils to clay content.
y = 0.045x + 3.13r2 = 0.8279
0
5
10
15
20
25
30
0 100 200 300 400 500 600
Clay g kg-1
CE
Cre
d(cm
ol(+
)kg-1
)
Fig. 5. The relationship of CEC of the reduced soils to clay content.

44
A comparison of the CEC values in oxidized and reduced conditions (Table 5)
suggests that the soils generally exhibit lower CEC when reduced. To statistically
confirm this, the data were subjected to a paired comparison analysis of CEC in oxidized
condition vs. CEC in reduced condition. The statistical analysis showed that the mean
decrease in CEC upon reduction was 2.43 cmol(+) kg-1, had a standard error of 0.5739,
and that the decrease was statistically significant at the 99% confidence level (p = 0.003,
n = 16).
Results of this CEC study were somewhat unexpected. The literature that was
reviewed indicated that, upon reduction, the Fe3+ in clay octahedral layers is reduced to
Fe2+, increasing the layer charge of the clay. Surface charge of a soil in a reduced
condition is usually greater than in an oxidized condition (Stucki and Roth, 1977; Stucki
et al., 1984b; Komadel et al., 1995), but the data in Table 5 showed the study soils had
lower CEC in the reduced condition. Further review of the literature recovered an article
by Stucki and Huo (1996) where they observed the same results as obtained in this
study. Apparently, increasing the layer charge upon reduction of octahedral Fe3+ results
in clay layer collapse, trapping cations in the interlayer, and thus in less exchangeable
cations including K+.
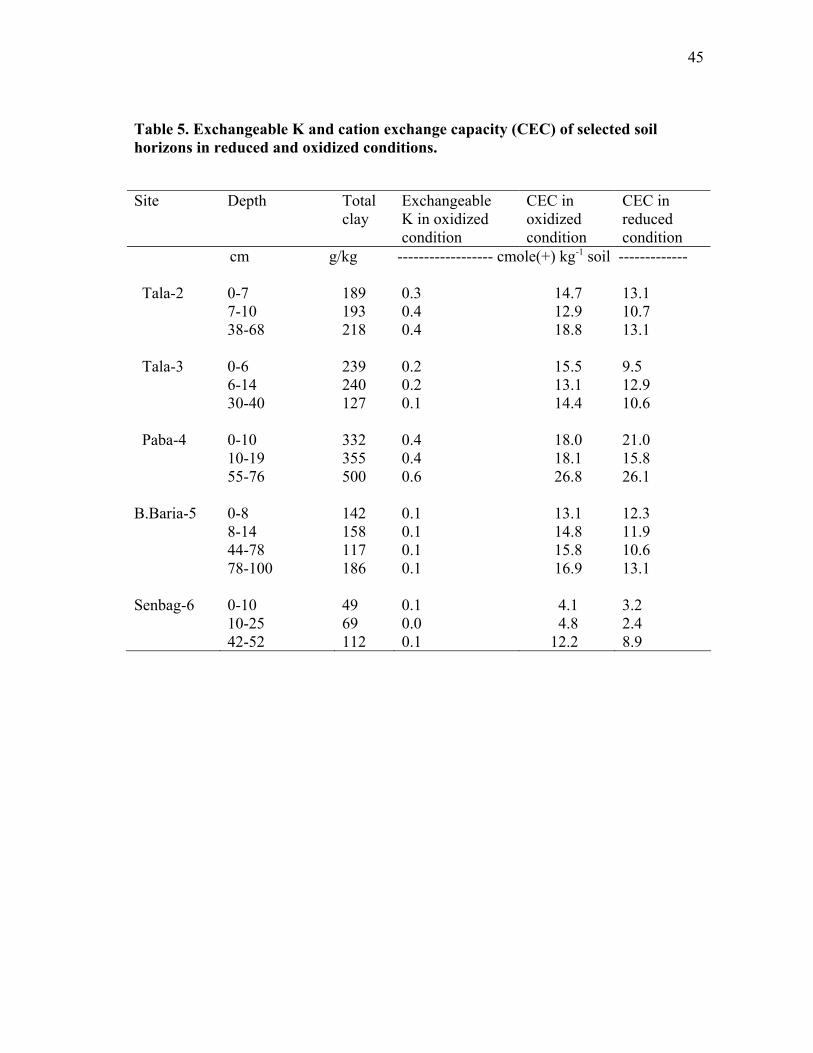
45
Table 5. Exchangeable K and cation exchange capacity (CEC) of selected soil horizons in reduced and oxidized conditions.
Site Depth Total
clay Exchangeable K in oxidized condition
CEC in oxidized condition
CEC in reduced condition
cm g/kg ------------------ cmole(+) kg-1 soil ------------- Tala-2 0-7 189 0.3 14.7 13.1 7-10 193 0.4 12.9 10.7 38-68 218 0.4 18.8 13.1 Tala-3 0-6 239 0.2 15.5 9.5 6-14 240 0.2 13.1 12.9 30-40 127 0.1 14.4 10.6 Paba-4 0-10 332 0.4 18.0 21.0 10-19 355 0.4 18.1 15.8 55-76 500 0.6 26.8 26.1 B.Baria-5 0-8 142 0.1 13.1 12.3 8-14 158 0.1 14.8 11.9 44-78 117 0.1 15.8 10.6 78-100 186 0.1 16.9 13.1 Senbag-6 0-10 49 0.1 4.1 3.2 10-25 69 0.0 4.8 2.4 42-52 112 0.1 12.2 8.9
46
ADSORPTION OF K IN OXIDIZED AND REDUCED SOILS
Potassium fixation and release play an important role in agriculture and K release
and fixation mechanisms are generally affected by the nature of soil colloids, wetting
and drying, lime content and Fe content of the soil (Sparks, 2001). However,
mechanisms governing the fixation and release of K+ in flooded soils are still not well
understood. Therefore, the adsorption of K from solution by selected surface soils under
both oxidized and reduced conditions was studied.
Three surface soils were selected from different sites, one with an acidic pH
(Senbag-6) and two (Tala-3 and Paba-4) with a moderately alkaline reaction. In the first
effort, when high concentration rates of K were added, the soils exhibited very little
difference to added K (Figs. 6, 7, and 8). The difference in the adsorption or release was
not clear. Additional adsorption isotherms were developed for the soils at much lower
rates of K addition, because soils quickly became saturated when the higher rates of K
were added. The rates of K addition used to develop Fig. 6 through 8 corresponded to
the percent CEC of these soils, i.e., enough K to equal 0%, 2%, 5%, 10%, 20%, 50%,
100%, or 150% of the soils’ CEC.
When lower rates (0, 2.92, 7.30, and 14.6 mmol K kg-1) of K were added to soils,
differences in release and adsorption at equilibrium of K were noted (Figs. 9, 10, and
11). All soils adsorbed more K from solution in oxidized than in reduced conditions.
Also, the concentration of equilibrium K in solution was higher for the acidic soil in both
oxidized and reduced conditions than for the soils of alkaline pH (p< 0.05 by ANOVA),
while the behavior of the alkaline soils (Fig. 9 and 10) were similar.

47
0.00
0.02
0.04
0.06
0.08
0.10
0.12
0.0 5.0 10.0 15.0 20.0 25.0 30.0
Solution equilibrium K (mmol L-1)
K a
dsor
bed
(mm
ol g-1
)
oxidized soilreduced soil
Fig. 6. Adsorption isotherm for K for the Ap1 horizon of Tala-3.
0.0000.0200.0400.0600.0800.1000.1200.1400.160
0.0 5.0 10.0 15.0 20.0 25.0
Solution equilibrium K (mmol L-1)
K a
dsor
bed
(mm
ol g-1
)
oxidized soil
reduced soil
Fig. 7. Adsorption isotherm for K for the Ap1 horizon of Paba-4.

48
-0.020
0.000
0.020
0.040
0.060
0.080
0.100
0.0 10.0 20.0 30.0 40.0
Solution equilibrium K (mmol L-1)
K a
dsor
bed
(mm
ol g-1
)
oxidized soil
reduced soil
Fig. 8. Adsorption isotherm for K for the Ap1 horizon of Senbag-6.
0.000
0.005
0.010
0.015
0.020
0.025
0.0 0.5 1.0 1.5 2.0 2.5 3.0
Solution equilibrium K (mmol L-1)
K a
dsor
bed
(mm
ol g-1
)
oxidized soilreduced soil
Fig. 9. Adsorption isotherm for K for the Ap1 horizon of Tala-3.

49
0.000
0.005
0.010
0.015
0.020
0.025
0.0 0.5 1.0 1.5 2.0
Solution equilibrium K( mmol L-1)
K a
dsor
bed
(mm
ol g-1
)
oxidized soil
reduced soil
Fig. 10. Adsorption isotherm for K for the Ap1 horizon of Paba-4.
-0.004
-0.002
0.000
0.002
0.004
0.006
0.008
0.010
0.0 1.0 2.0 3.0 4.0 5.0 6.0
Solution equilibrium K (mmol L-1)
K a
dsor
bed
(mm
ol g-1
)
oxidized soil
reduced soil
Fig. 11. Adsorption isotherm for K for the Ap1 horizon of Senbag-6.

50
-0.020.000.020.040.060.080.100.120.14
0.0 0.1 0.2 0.3
added K (mmol g-1)
K a
dsor
bed
(mm
ol g-1
)
Tala-3 ( pH 7.9)Paba-4 (pH 8.0)Senbag-6 (pH 5.0)
Fig. 12. Comparison of the amount of K adsorbed in oxidized condition by three study soils expressed as a function of added K per quantity of clay.
-0.02
0.00
0.02
0.04
0.06
0.08
0.10
0.12
0.14
0.16
0.00 0.05 0.10 0.15 0.20 0.25
Added K (mmol g-1)
K a
dsor
bed
(mm
ol g-1
)
Tala-3 (pH 7.9)Paba-4 (pH 8.0)Senbag-6 (pH 5.0)
Fig. 13. Comparison of the amount of K adsorbed in reduced condition by three study soils expressed as a function of added K per quantity of clay.

51
Considering the low concentration points of added K, it was observed that the
alkaline soils (Tala-3 and Paba-4) adsorbed slightly more K (0.124 mmol g-1 for the soil
with pH 8.0 and 0.113 mmol g-1 for the soil with pH 7.9) than the acidic soil (Senbag-6)
(0.088 mmol g-1) in the oxidized condition (Fig 12). Potassium adsorption in reduced
condition was also a little higher (0.127 mmol g-1 for the soil with pH 8.0 and 0.113
mmol g-1 for the soil with pH 7.9) for both alkaline soils than the acid soil (0.069 mmol
g-1) (Fig. 13). The ANOVA test was also significant in reduced condition (α= 0.05). The
relationship is significant at 95% confidence level. The overall average adsorption was
slightly higher in calcareous soils (0.328 mmol g-1) than the acidic soil (0.304 mmol g-1)
(Figs. 12 and 13).
Negative adsorption (release) of K was observed when adsorption isotherms
were constructed with just the first few quantities of added K (Figs. 14, 15, 16 ) which
was hardly visible when considering all eight concentration points. Desorption was more
pronounced in the acidic soil (Fig. 16) than the two alkaline soils (Figs. 14, 15), and the
Paba-4 soil was the only alkaline soil that showed K release, although the release was at
the lowest of concentrations and very small. Release of native K was significant under
the reduced condition in the acidic Senbag-6 soil.
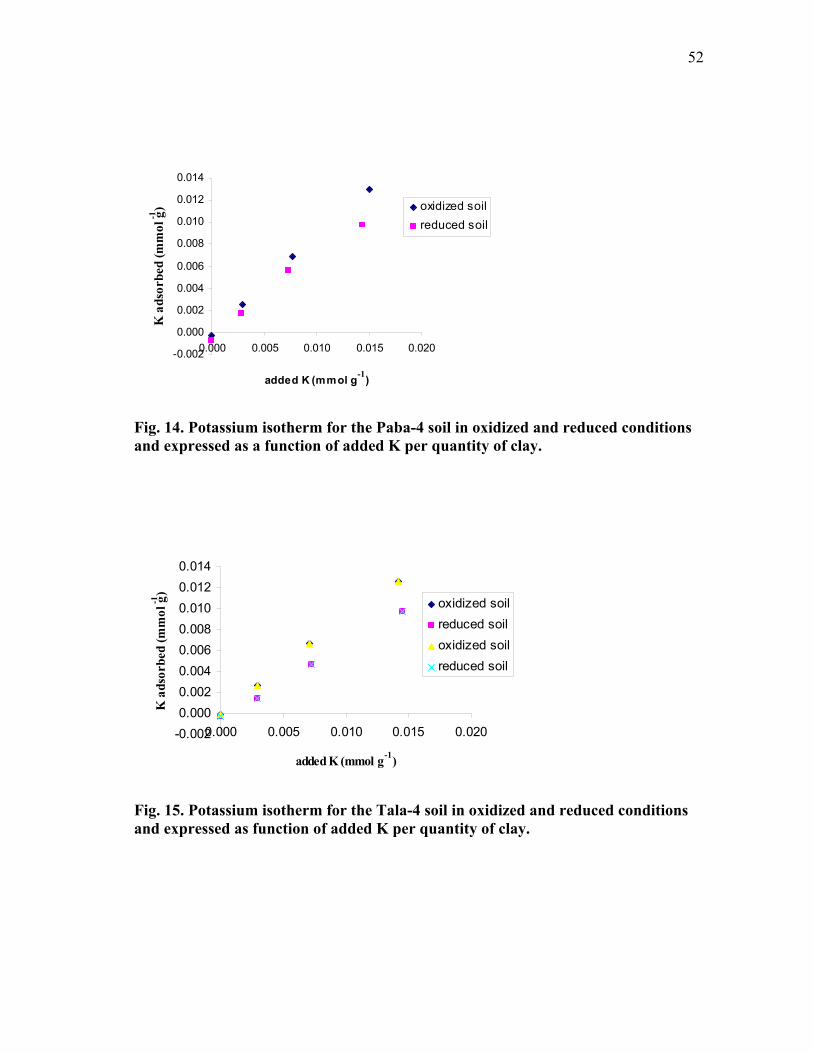
52
-0.002
0.000
0.002
0.004
0.006
0.008
0.010
0.012
0.014
0.000 0.005 0.010 0.015 0.020
added K (mmol g-1)
K a
dsor
bed
(mm
ol g-1
) oxidized soilreduced soil
Fig. 14. Potassium isotherm for the Paba-4 soil in oxidized and reduced conditions and expressed as a function of added K per quantity of clay.
-0.0020.0000.0020.0040.0060.0080.0100.0120.014
0.000 0.005 0.010 0.015 0.020
added K (mmol g-1)
K a
dsor
bed
(mm
ol g-1
)
oxidized soilreduced soiloxidized soilreduced soil
Fig. 15. Potassium isotherm for the Tala-4 soil in oxidized and reduced conditions and expressed as function of added K per quantity of clay.

53
-0.004
-0.002
0.000
0.002
0.004
0.006
0.008
0.010
0.00 0.01 0.02 0.03 0.04
added K (mmol g-1)
K a
dsor
bed
(mm
ol g-1
)
oxidized soilreduced soil
Fig. 16. Potassium isotherm for the Senbag-6 soil in oxidized and reduced conditions and expressed as function of added K per quantity of clay.

54
The diagonal straight lines mmol g-1 in Figs. 17 to 20 are hypothetical lines
which were plotted assuming that the amount of K in equilibrium solution was equal to
the amount of K added to the soil. This line allows a comparison of whether there is a
net release of native K, if the analytically determined concentration is above the line, or
adsorption of added K if the analytical concentration is below the straight line. Release
of native K was higher in the reduced condition than in the oxidized condition in acidic
soil (Figs. 17 and18). A similar trend was observed with alkaline soil (Figs. 19 and 20).
The status of equilibrium K was lower in H2O than the NH4OAC +H2O solution. This is
because H2O is extracting only the water soluble K in the solution while NH4OAC is
extracting the exchangeable and water soluble form of K.
The calcareous (Tala-3) soil exhibited slightly more adsorption than the acidic
soil (Senbag-6). This calcareous soil is higher in mica, and have higher CEC (18 cmol
(+) kg-1) and clay content (335 g kg-1) compare to the acidic soil (CEC of 4.1 cmol(+)
kg-1; clay content of 49 g kg-1) which might have resulted in more adsorption. In the
acidic soils, hydroxy-Al compounds might block exchange sites of the clay layer,
resulting in less adsorption. Less adsorption in the reduced condition could also be due
to the increase in Fe2+ which would compete with K+ for the exchange sites on the clay
layer (Personal comment from Dr. Richard H. Loeppert). Also an increased layer charge
in the reduced condition could influence the strength of cation retention on exchange
sites and might have restricted further cation exchange. The relatively small adsorption
or release of K in both calcareous or acidic soils in oxidized and reduced conditions may

55
be due to the presence of illitic material for which the retention and release of K is not
strongly impacted by added K+. These soils are relatively rich in K bearing minerals.
0.00
0.01
0.02
0.03
0.04
0.00 0.01 0.02 0.03 0.04
K added (mmol g-1)
Solu
tion
equi
libri
um (m
mol
g-1) K added
equilib. K in H2O
equilib. K in NH4+H2O
Fig. 17. Equilibrium K status in different extraction solutions of Senbag-6 soil in the oxidized condition.

56
0
0.01
0.02
0.03
0.04
0.05
0 0.01 0.02 0.03 0.04 0.05
K added (mmol g-1)
sol
utio
n eq
uilib
rium
K in
(mm
ol g
-1) K added
equilib. K in H2Oequilib. K in NH4+H2O
Fig. 18. Equilibrium K status in different extraction solutions of Senbag-6 soil in the reduced condition.
0.00
0.01
0.02
0.03
0.04
0.05
0.00 0.01 0.02 0.03 0.04 0.05K added (mmol g-1)
Solu
tion
equi
libri
um K
(mm
ol g-1
)
K added
equilib. K in H2O
equilib. K in H2O+NH4
Fig. 19. Equilibrium K status in different extraction solutions of Tala-3 soil in the oxidized condition.

57
0.00
0.01
0.02
0.03
0.04
0.05
-0.01 0.01 0.03 0.05
K added (mmol g-1)
Solu
tion
equi
libri
um K
( mm
ol g-1
)
K added mmo/g
equilib. K in H2O
equilib. K in H2O+NH4
Fig. 20. Equilibrium K status in different extraction solutions of Tala-3 soil in the reduced condition.
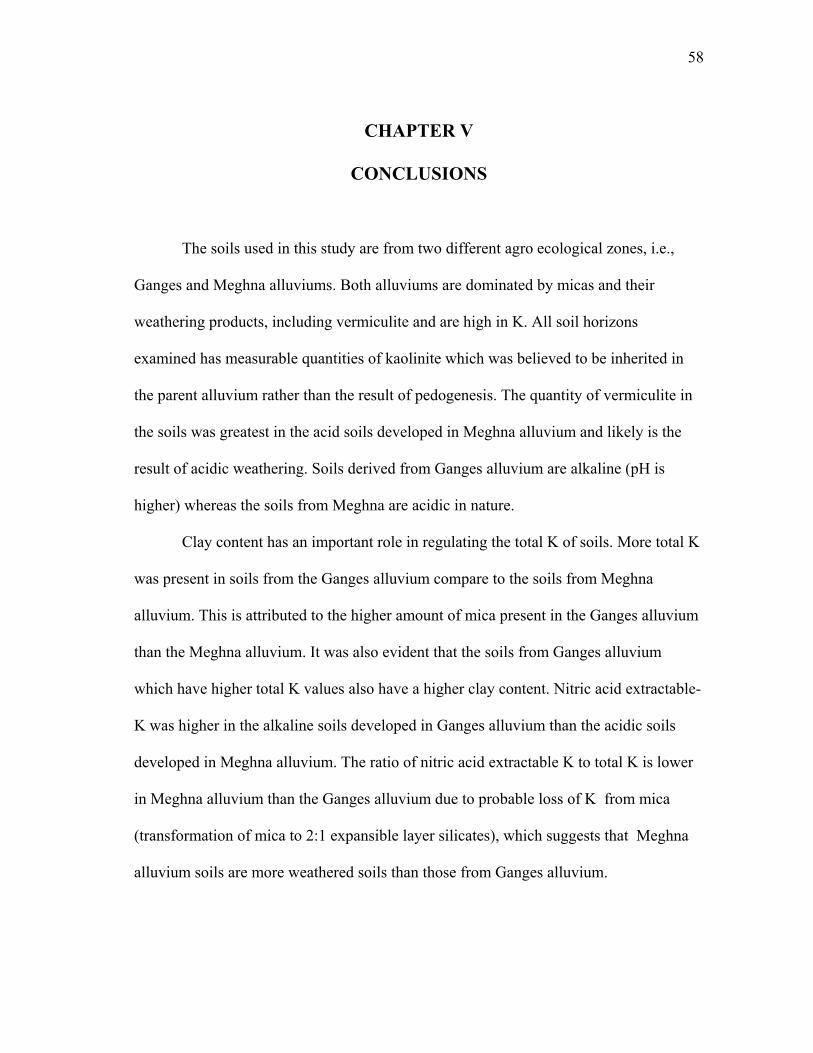
58
CHAPTER V
CONCLUSIONS
The soils used in this study are from two different agro ecological zones, i.e.,
Ganges and Meghna alluviums. Both alluviums are dominated by micas and their
weathering products, including vermiculite and are high in K. All soil horizons
examined has measurable quantities of kaolinite which was believed to be inherited in
the parent alluvium rather than the result of pedogenesis. The quantity of vermiculite in
the soils was greatest in the acid soils developed in Meghna alluvium and likely is the
result of acidic weathering. Soils derived from Ganges alluvium are alkaline (pH is
higher) whereas the soils from Meghna are acidic in nature.
Clay content has an important role in regulating the total K of soils. More total K
was present in soils from the Ganges alluvium compare to the soils from Meghna
alluvium. This is attributed to the higher amount of mica present in the Ganges alluvium
than the Meghna alluvium. It was also evident that the soils from Ganges alluvium
which have higher total K values also have a higher clay content. Nitric acid extractable-
K was higher in the alkaline soils developed in Ganges alluvium than the acidic soils
developed in Meghna alluvium. The ratio of nitric acid extractable K to total K is lower
in Meghna alluvium than the Ganges alluvium due to probable loss of K from mica
(transformation of mica to 2:1 expansible layer silicates), which suggests that Meghna
alluvium soils are more weathered soils than those from Ganges alluvium.
59
Lower CEC in reduced condition compared to the CEC in oxidized condition for
both alluviums indicated less available K or other exchangeable cations during flooded
or reduced conditions. This is an important factor for rice cultivation in Bangladesh,
because rice plants grow in submerged or flooded condition. These soils did not show a
significant response to added K under both oxidized and reduced conditions suggesting
that exchangeable K+ pool, non-exchangeable K pool or other K pools were replenishing
the depleted solution K pools.
FUTURE RESEARCH
Effects of variation in soil moisture regimes on K availability and rice production
have received little attention (Dobermann et al., 1998). Further study to investigate the
response of rice to added K fertilizer by adding a specific K isotope could provide
insight into fate of K added to soils. A more detailed understanding and development of
simple models to describe the recycling of K from crop residues would help in
recommendations of fertilizer application rates. Such research could provide basic
information about how different straw management and tillage practice influence the
amount of nutrient recycled and dynamics of the nutrient release (Dobermann et al.,
1998).
60
REFERENCES
Akhtar, M.S., and D.A. Jenkinson. 1999. Mineralogical characterization of the gluconitic sandstone from Chickal formation of Surghan range. Pakistan J. Sci. Ind. Res. 42:215–219.
Amacher, M.C. 1991. Methods of obtaining and analyzing kinetic data. p. 19-59. In D. L. Sparks, and D. L. Suarez (eds.) Rates of soil chemical processes. Soil Science Society of America Special Publication 27. Soil Science Society of America, Madison, WI.
Bajwa, M.F. 1989. Potassium mineralogy of Pakistani soils and its effect on potassium response. In Proc. of the Workshop on the Role of Potassium in Improving Fertilizer Use Efficiency. National Fertilizer Development Center, Islamabad, Pakistan, pp. 203–216.
Bajwa, M.I. 1994. Soil potassium status, potash fertilizer usage and recommendations in Pakistan. Potash Review No. 3/1994. Subject 1, 20th suite. International Potash Institute, Basel, Switzerland.
BARC (Bangladesh Agricultural Research Council). 1998. Report on land degradation situation in Bangladesh, Farmgate, Dhaka 1201. Dhaka, Bangladesh: BARC.
Barber, S.A. 1984. Soil nutrient availability: A mechanistic approach. John Wiley and Sons, New York.
Bernas, B. 1968. A new method for decomposition and comprehensive analysis of silicates by atomic absorption spectrometry. Anal. Chem. 40:1682-1686.
Bertsch, P.M., and G.W. Thomas. 1985. Potassium status of temperate region soils. p. 131-162. In R.D. Munson (ed.) Potassium in agriculture. American Society of Agronomy, Madison, WI.
Bijay-Singh, Yadvinder-Singh, P. Imas, and X. Jian-Chang. 2004. Potassium nutrition of the rice-wheat cropping system. Adv. Agron. 81:203–259.
Bolt, G.H., M.E. Sumner, and A. Kamphorst. 1963. A study between three categories of potassium in an illitic soil. Soil Sci. Soc. Am. Proc. 27:294-299.
Brinkman, R. 1977. Surface water gray soils in Bangladesh; Genesis. Geoderma 17:111–144.

61
Boyle, J.R., G.K. Voight, and B.L. Sawhney. 1967. Biotite flakes: Alteration by chemical and biological treatment. Science 155:193-195.
Cao, Z., and G. Hu. 1995. Potassium dynamics and availability in soils of subtropical (humid) regions of China. Potassium in Asia-balanced fertilization to increase and sustain agricultural production, International Potash Institute, Basel, Switzerland, p. 95–113.
Cassman, K.G., A. Dobermann, D.T. Walters, and H.S. Yang. 2003. Meeting cereal demand while protecting natural resources and improving environmental quality. Ann. Rev. of Environ. and Res. 28:315-358.
Chen, S. Z., P. F. Low, and C. B. Roth. 1987. Relation between potassium fixation and the oxidation state of octahedral iron. Soil Sci. Soc. Am. J. 41:82-86
Coleman, J.M.1981. Deltas: processes of deposition and models for exploration (2nd ed). Burgess Publishing Company, Minneapolis, MN.
Coleman, N.T., and M.E. Harward. 1953. The heats of neutralization of acid clays and cation-exchange resins. J. Am. Chem. Soc. 75:6045-6046.
Datta, D.K., and V. Subramaniam. 1997. Texture and mineralogy of sediments from the Ganges-Brahmaputra-Meghna river system in the Bengal Basin, Bangladesh and their environmental implications. Environ. Geol. 30:181-188.
De Datta, S.K., and D.S. Mikkelsen. 1985. Potassium nutrition of rice. p.665-699 In R.D. Munson, M.E. Sumner, and W.D. Bishop (eds). Potassium in agriculture. ASA, CSSA, SSSA, Madison,WI.
Dobermann, A., K.G. Cassman, C.P. Mamaril, and J.E. Sheehy. 1998. Management of phosphorus, potassium and sulfur in intensive, irrigated lowland rice. Field Crops Res. 56:113-138.
Dobermann A., K.G. Cassman, S. Peng, P.S. Tan, C.V. Phung, P.C. Sta.Cruz, J.B. Bajita, A.A.A. Adviento, and D.C. Olk. 1996a. Precision nutrient management in intensive irrigated rice systems. p. 113-154. In Proc. International Symposium on Maximizing Sustainable Rice Yields Through Improved Soil and Environmental Management, November 11-17, 1996, Khon Kaen, Thailand.
Dobermann, A., K.G. Cassman, P.C. Sta. Cruz, M.A.A. Adviento, and M.F. Pampolino.1996b. Fertilizer inputs, nutrient balance, and soil nutrient-supplying power in intensive, irrigated rice systems. II. Effective soil K-supplying capacity. Nutr. Cycl. Agroecosyst. 46:11-21.

62
Dobermann, A., K.G. Cassman, C.P. Mamaril, and J.E. Shesby. 1999. Management of phosphorus, potassium, and sulfur in intensive irrigated lowland rice. Field Crops Res. 56:113–118.
Dreimanis, A. 1962. Quantitative gasometric determination of calcite and dolomite by using the Chittick apparatus. J. Sed. Petrol. 32:520-529.
Fieldes, M., and L. D. Swindale. 1954. Chemical weathering of silicates in soil formation. New Zealand J. Sci. Tech. 36:140-154.
Gast, R.G. 1977. Surface and colloid chemistry. p. 27-73. In Dixon, J.B.; Weed, S.B. (eds.) Minerals in soil environments, SSSA, Madison,WI.
Goswami, N.N. and N.K. Banerjee. 1978. Phosphorus, potassium and other macroelements. Soils and rice. International Rice Research Institute. Manila, Philippines, p. 561-580.
Goulding, K.W.T. 1987. Potassium fixation and release. In Proc., 20th Colloquium of the International Potash Institute, Berne, Switzerland, 20:137-154.
Griffin J.J., H. Windom, and E.D. Goldberg. 1968. The distribution of clay minerals in the world ocean. Deep Sea Res. 15:433–459.
Haby, V.A., M.P. Russelle, and E.O. Skogley. 1990. Testing soils for potassium, calcium, and magnesium. p. 181-228. In R. L. Westerman (ed.) Soil testing and plant analysis. Soil Sci. Soc. Am., Madison, WI.
Hasan, R. 2002. Potassium status of soils in India. Better Crops Int. 16:3-5.
Hay, M. J. M., T.W. Walker, A.F.R. Adams, A. S. Campbell. 1976. The potassium status of six loessial soils of Canterbury, New Zealand, in relation to rainfall and rate of loess accumulation. J. Soil Sci. 27:227-236.
Henderson, J.H., H.E. Doner, R.M. Weaver, J.K. Syers, and M.L. Jackson. 1976. Cation and silica relationships of mica weathering to vermiculite in calcareous Harps soils. Clays Clay Miner. 24:93-100.
Hoa N.M. 2003. Soil potassium dynamics under intensive rice cropping. A case study in the Mekong Delta, Vietnam. Doctoral Dissertation, Wageningen University, The Netherlands.
Holmgren, G.S., R.L. Juve, and R.C. Geschwender. 1977. A mechanically controlled variable rate leaching device. Soil Sci. Soc. Am. J. 41:1207-1208.
63
Huang, P.M., L.S. Crossan, and D.A. Rennie. 1968. Chemical dynamics of Krelease from potassium minerals common in soils. Trans. 9th International Cong. Soil Sci. 2:705-712.
Irion G. 1991. Minerals in rivers. p 265–281. In Degens E.T., S. Kempe and J.F. Richey (Eds) Biogeochemistry of major world rivers, SCOPE 42. J. Wiley, New York.
Islam A., and E.G. Lotse. 1986. Quantitative mineralogical analysis of Bangladesh soils with X-ray, ion-exchange and selective dissolution techniques. Clay Miner. 21:31–42
Jiyun, J., B. Lin, and W. Zhang. 1999. Improving nutrient management for sustainable development of agriculture in China. p.157-174. In Smaling, E.M.A., O. Oenema and L.O. Fresco. (eds.) Nutrient disequilibria in agroecosystems. Concepts and case studies. CABI Publishing. University Press, Cambridge. UK.
Kapoor, B.S., S.C. Goswami, C.M. Padmini, and V.V. Laxmi. 1982. X-ray studies on the distribution and characterisation of layer silicates in some alluvial soils. J. Indian Soc. Soil Sci. 30:70–73.
Kapoor, B.S., H.B. Singh, and S.C. Goswami. 1981. Distribution of illite in some alluvial soils of the Indo-Gangetic Plain. J. Indian Soc. Soil Sci. 29:572–574.
Kawaguchi, K., and K. Kyuma. 1977. Paddy soils in tropical Asia. Their material nature and fertility. The University Press of Hawaii, Honolulu.
Khaled, E.M., and J.W. Stucki. 1991. Effects of iron oxidation state on cation fixation in smectites. Soil Sci. Soc. Am. J. 55:550-554.
Kilmer, V.H., and L.Z. Alexander. 1949. Methods for making mechanical analyses of soil. Soil Sci. 68:15-24.
Kirkman, J.H., A. Basker, A. Srapaneni, A.N. Macgregor. 1994. Potassium in the soils of New Zealand. New Zealand J. of Agric. Res. 37:207-227
Kolla, V., and N.M. Rao. 1990. Sedimentary sources in the surface and near-surface sediments of the Bay of Bengal. Geo-Mar. Lett. 10:129–136.
Komadel, P., J. Madejova, and J.W. Stucki. 1995. Reduction and reoxidation of nontronite: Questions of reversibility. Clays Clay Miner. 43:105-110.
64
Ladha, J. K., H. Pathak, A.T. Padre, D. Dawe, and R.K. Gupta., 2002. Productivity trends in intensive rice-wheat cropping systems in Asia. p. 45–76. In J. K. Ladha, J. E. Hill, J. M. Duxbury, R. K. Gupta, and R. J. Buresh( eds.) Improving the productivity and sustainability of rice-wheat systems: issues and impact. ASA, Madison, WI.
Lear, P.R., and J.W. Stucki. 1985. Role of structural hydrogen in the reduction and reoxidation of iron in nontronite. Clays Clay Miner. 33:539-545.
Lear, P.R., and J.W. Stucki, 1989. Effects of iron oxidation state on the specific surface area of nontronite. Clays Clay Miner. 37:547-552.
Lutrick, M.C. 1963. The effect of lime and phosphate on downward movement of potassium in Red Bay fine sandy loam. Proc. Soil Crop Sci. Soc. Florida. 23:90-94.
Marschner, H., 1988. Mineral nutrition of higher plants. Academic Press, London, 674
Martin, H.W., D.L. Sparks. 1985. On the behavior of non-exchangeable potassium in soils. Comm. Soil Sci. and Plant Anal. 16:133-162.
Martin, J.C., R. Overstreet, and D.R. Hoagland. 1946. Potassium fixation in soils in replaceable and nonreplaceable forms in relation to chemical reactions in the soil. Soil Sci. Soc.of Am. Proc. 10:94-101.
McLean, E.O., and M.E. Watson. 1985. Soil measurements of plant available potassium. p. 277–308. In. R.D. Munson. (ed.) Potassium in agriculture. ASA, CSSA, and SSSA, Madison, WI.
McLean, E. O. 1978. Influence of clay content and clay composition on potassium availability. Potassium in Soils and Crops Potash Research Institute of India, Gurgaon, Haryana, New Delhi, India, pp. 1–13.
Mengel, K. 1985. Dynamics and availability of major nutrients in soils. Adv. Soil Sci. 2:65-131.
Metson, A.J. 1960. Some factors affecting the potassium status of New Zealand soils. Potash Rev. 4:1-10.
Metson, A. J. 1968. Potassium. Soils of New Zealand. Part 2. New Zealand Soil Bureau Bulletin 26: 82-95. Wellington, New Zealand.
Metson, A.J., 1980. Potassium in New Zealand soils. New Zealand Soil Bureau Report 38. Department of Scientific and Industrial Research, Wellington.
65
Metson, A. J., R. Lee. 1977. Soil chemistry in relation to the New Zealand genetic soil classification. Soil Sci. 123: 347-352.
Mortland, M.M., K. Lawton, and G. Uehara. 1956. Alteration of biotite to vermiculite by plant growth. Soil Sci. 82:477-481.
Mishra, B.B., J. Mall, R.A. Singh, and J. Choudhary. 1996. Clay mineral associations occurring in major soil groups of Bihar. Clay Res. 15:15–24.
Naidu A.S., T.C. Mowatt, B.K.L. Somayajulu, and S. K. Rao. 1985. Characteristics of clay minerals in the bed loads of major rivers of India. p. 559–568. In Degens E.T., S. Kempe and R. Herrera (eds.) Transport of carbon and minerals in major world rivers, part 3, SCOPE/UNEP 58. Mitt. Geol. Palaont. Inst. Univ. Hamburg, Germany.
Nelson, D.W. and L.E. Sommers. 1982. p. 539-580. Total carbon, organic carbon and organic matter. In A.L. Page, R. H. Miller, and D.R. Keeney (eds.) Methods of soil analysis, Part II. (2nd ed.). Soil Sci. Soc. Am. Madison, WI.
Newman, A.C.D. 1969. Cation exchange properties of micas: I. The relation between mica composition and potassium exchange in solutions of different pH. J. Soil Sci. 20:357-373.
Nolan, C.N., and W.L Pritchett. 1960. Certain factors affecting the leaching of potassium from sandy soils. Proc. Soil Crop Sci. Soc. Florida 20:139-145.
Oberthuer T., A. Dobermann, and H.U. Neue. 1995. Spatial modeling of soil fertility. A case study in Nueva Ecija, Philippines. In Proceedings of the Interational Rice Research Conference, 13-17 February, 1995, Los Banos. International Rice Research Institute, Los Banos, Laguna, Philippines.
Panaullah, J. Timsina, M.A. Saleque, A.B.M.B.U. Pathan, D.J. Connor, P.K. Shaha, M.A. Quayyum, E. Humphreys, and C.A. Meisner. 2006. Nutrient uptake and apparent balances for rice-wheat sequences. III. Potassium. J. Plant Nutr. 29:173–187.
Parfitt, R.L. 1992. Potassium-calcium exchange in some New Zealand soils. Austr. J. Soil Res. 30:145-158.
Pasricha, N. S. 1998. Sulphur and potassium inputs through irrigation water in Indo-Gangetic alluvial soils under rice-wheat cropping systems. In Proc. of the 16th World Congress Soil Sciences. ISSS/CIRAD, Montpellier, France.
Ponnamperuma, F.N. 1972. The chemistry of submerged soils. Adv. Agron. 24:29– 96.

66
Ponnamperuma, F.N. 1985. Chemical kinetics of wetland rice soils relative to soil fertility. Wetland soils: characterization, classification, and utilization. International Rice Research Institute, Los Banos, Philippines, p. 71–90.
Pratt, P.F., and H.H. Morse. 1954. Potassium release from exchangeable and nonexchangeable forms in Ohio soils. Res. Bull. 747, Ohio Agric. Exp. Sta., Columbus, OH.
Potter P.E. 1978. Petrology and chemistry of modern big river sands. J. Geol. 86:423–449.
Pundeer, G.S., P.S. Sidhu, and G. F. Hall. 1978. Mineralogy of soils developed in two geomorphic surfaces on the Sutlej alluvium in the central Punjab, N.W. India. J. Indian Soc. Soil Sci. 26:151–159.
Ranjha, A. M., S.M. Mehdi, and R. H Qureshi. 1992. Potassium behaviour in some alluvial soil series of Pakistan. J. Agric. Res. Lahore 30:101–110.
Rao V.P., N.P. Reddy, and C.M. Rao. 1988. Clay mineral distribution in the shelf sediments off the northern part of the east coast of India. Cont. Shelf. Res. 8:145–151
Rasmussen, K. 1972. Potash in feldspars. Proc. Colloquim International Potash Instit. 9:57-60.
Rausell-Colom, J.A., T.R. Sweetman, L.B. Wells, and K. Norrish. 1965. Studies in the artificial weathering of micas. p. 40-70. In E.G. Hallsworth, and D.V. Crawford (ed.) Experimental pedology. Butterworths, London, UK.
Regmi, A.P. 1994. Long-term effects of organic amendments and mineral fertilizers on soil fertility in a rice-wheat cropping system in Nepal. Masters Thesis. University of Philippines, Los Banos, Philippines, p. 142.
Regmi, A. P., J. K. Ladha, E. Pasquin, H. Pathak, P. R. Hobbs, L. L. Shrestha,D. B. Gharti, and E. Duveiller. 2002. The role of potassium in sustainingyields in a long-term rice-wheat experiment in the Indo-Gangetic Plains of Nepal. Biol. and Fert. Soil 36: 240–247.
Rich, C.I. 1972. Potassium in minerals. Proceedings of Colloquim of International Potash Institute 9:15-31.
Rich, C.I. 1968. Mineralogy of soil potassium. p. 79-91. In V.J. Kilmer et al. (ed.) The role of potassium in agriculture. Am. Soc. Agro., Madison, WI.

67
Rich, C.I., and S.S Obenshain, 1955. Chemical and clay mineral properties of a red-yellow podzolic soil derived from mica schist. Soil Sci. Soc. Am. Proc. 19:334-339.
Saleque, M.A., P.K. Saha, G.M. Panaullah and N.I. Bhuiyan, 1998. Response of potassium in farmer’s field of Barind tract of Bangladesh. J. Plant Nutrition, 21:39-47.
Sawhney, B.L., and Voight, G.K. 1969. Chemical and biological weathering invermiculite from Transvaal. Soil Science Society of America Proceedings 33:625-629.
Schroeder, D. 1979. Structure and weathering of potassium containing minerals. Proc. Cong. International Potash Institute 11:43-63.
Scott, A.D., F.T. Ismail, and R.R. Locatis. 1973. Changes in interlayer potassium exchange-ability induced by heating micas. p. 467-479. In J. M. Serratosa (ed.) Proceedings of 4th International Clay Conference, Div. De Ciencias, Madrid, Spain.
Scott, A.D., and S.J. Smith. 1967. Visible changes in macro mica particles that occur with potassium depletion. Clays Clay Miner. 15:367-373.
Scott, A.D., and J.J. Hanway. 1960. Factors influencing the change in exchangeable soil K observed on drying. Trans. 7th International Cong. of Soil Sci. 4:72-79.
Scri Adiningsih, J., D. Santoso, and M. Sudjadi. 1991. The status of N, P, K and S of lowland rice soils in Java. In G. Blair (ed). Sulfur fertilizer policy for lowland and upland rice cropping systems in Indonesia. ACIAR, Melbourne.
Segall M.P. and S.A. Kuehl. 1992. Sedimentary processes on the Bengal Continental Shelf as revealed by clay-size mineralogy. Cont Shelf Res. 12:517–541.
Sekhon, G. S. 1995. Characterization of K availability in paddy soils-present status and future requirements. Potassium in Asia-balanced fertilization to increase and sustain agricultural production. International Potash Institute, Basel, Switzerland, pp. 115–133.
Sengupta S. 1966. Geological and geophysical studies in the western part of the Bengal Basin, India. AAPG Bull. 50:1001–1017.
Sidhu, P. S. 1984. Mineralogy of K in soils of Punjab. p. 6–14. In Mineralogy of Soil Potassium. PRII Research Review Series No. 1. Potash Research Institute of India, Gurgaon, Haryana, India.

68
Sidhu, P. S., and R. J. Gilkes. 1977. Mineralogy of soils developed on alluvium in the Indo-Gangetic plain (India). Soil Sci. Soc. Am. J. 41: 1194–1201.
Soil Survey Laboratory Staff. 1996. Soil survey laboratory methods and procedures for collecting soil samples. Soil Survey Investigations Report No. 42, USDA, SCS. U. S. Gov. Printing Office, Washington, D.C.
Song, S.K., and P.M. Huang. 1988. Dynamics of potassium release from potassium-bearing minerals as influenced by oxalic and citric acids. Soil Sci. Soc. of Am. J. 52:383-390.
Sparks, D.L. 1987. Potassium dynamics in soils. Adv. Soil Sci. 6:1-63.
Sparks, D.L. 1989. Kinetics of soil chemical processes. Academic Press, San Diego, CA.
Sparks, D.L. 1995. Environmental soil chemistry. Academic Press, San Diego, CA.
Sparks, D.L. 2000. Bioavailability of soil potassium, pp. D-38-D-52. In M.E. Sumner (ed.) Handbook of soil science, CRC Press, Boca Raton, FL.
Sparks D. L. 2001, Dynamics of K in soil and their role in management of K nutrition -Published by International Potash Institute online. Event: IPI PRII K in nutrient management for sustainable crop production in India, New Delhi, India; 03-05 December, 2001. Available at http://www.ipipotash.org/slides/kdits1.html. Accessed June 2005; Verified July 11, 2007.
Sparks, D.L., T.H. Carski, S.E. Fendorf, and C.V. Toner. 1996. Kinetic methods and measurements. p. 1275-1307. In D.L. Sparks (ed.) Methods of soil analysis: Chemical methods. Soil Science Society of America, Madison, WI.
Sparks, D. L., and P.M. Huang. 1985. Physical chemistry of soil potassium. p. 201-276. In Munson, R. D (ed.). Potassium in agriculture. SSSA, Madison, WI.
Sparks, D. L., D. C. Martens, L. W. Zelazny. 1980. Plant uptake and leaching of applied and indigenous potassium in Dothan soils. Agron. J. 72:551-555.
Srivastava, S., T. R. Rupa, A. Swarup, and D. Singh. 2002. Effect of longterm fertilization and manuring on potassium release properties in a Typic Ustochrept. J. Plant Nutr. and Soil Sci. 165:352–356.
Steele, J. G. and R. Bradfield. 1934. The significance of size distribution in the clay fraction. Report of the 14th Annual Meeting, Am. Soil Sci.. Assn. Bull. 15:88-93
Stucki J.W. and D. Huo. 1996. Effects of cation competition on potassium fixation. Illinois Fertilizer Conference Proceedings, Peoria, IL.
69
Stucki, J. W., P. F. Low, C. B. Roth, and D. C. Golden. 1984. Effects of oxidation state of octahedral iron on clay swelling. Clays Clay Miner. 32:357-362.
Stucki, J. W., and C. B. Roth. 1977. Oxidation-reduction mechanism for structural iron in nontronite. Soil Sci. Soc. Am. J. 41:808-814.
Stucki J.W. and S. Shen. 1993. Effects of iron oxidation state on potassium fixation. Illinois Fertilizer Conference Proceedings, Peoria, IL.
Subramanian, V. 1980. Mineralogical input of suspended matter by Indian rivers into the adjacent areas of the Indian Ocean. Marine Geol. 36:29–34.
Tandon, H. L. S., and G. S. Sekhon. 1998. Potassium research and agricultural production in India. New Delhi: Fertilizer Development and Consultation Organization.
Terry, D.L., and C.B. McCants. 1968. The leaching of ions in soils. North Carolina Agricultural Experiment Station Technical Bulletin 184.
Timsina, J., and D. J. Connor. 2001. Productivity and management of rice-wheat cropping systems: Issues and challenges. Field Crop Research 69:93–132.
Tiwari, K. N., V. Nigam, and A. N. Pathak. 1985. Studies on the potassium requirements of different crops. Fert. Res. 8:91–96.
Thomas, G.W. 1960. Forms of aluminum in cation exchangers. Trans. 7th International Cong. Soil Sci. 2:364-369.
Thomas, G.W., and B.W. Hipp. 1968. Soil factors affecting potassium availability. p. 269-291. In V.J. Kilmer et al. (ed.). The role of potassium in agriculture. American Society of Agronomy, Madison, WI.
Volk, N.J. 1934. The fixation of potash in difficultly available forms in soils.Soil Science 37: 267-287.
von Reichenbach, H.G. 1973. Exchange equilibria of interlayer cations in different particle size fractions of biotite and phlogopite. p. 480-487. In J. M. Serratosa (ed.) Proceedings of 4th International Clay Conf., Div. de Ciencias, Madrid, Spain.
Walker, G.F. 1957. On the differentiation of vermiculites and smectites inclays. Clay Miner. Bull. 3: 154-163.
Weed, S.B., Davey, C.B. and Cook, M.G. 1969. Weathering of mica by fungi. Soil Sci. Soc. Am. Proc. 33: 702-706.

70
Wijayananda, N.P., and D.S. Cronan. 1994. The geochemistry and mineralogy of marine sediments from the eastern Indian oceans. Mar. Geol. 117:275–285.
71
APPENDIX A
PHYSICAL AND CHEMICAL CHARACTERISTICS DATA FOR
THE FIVE STUDY SOILS
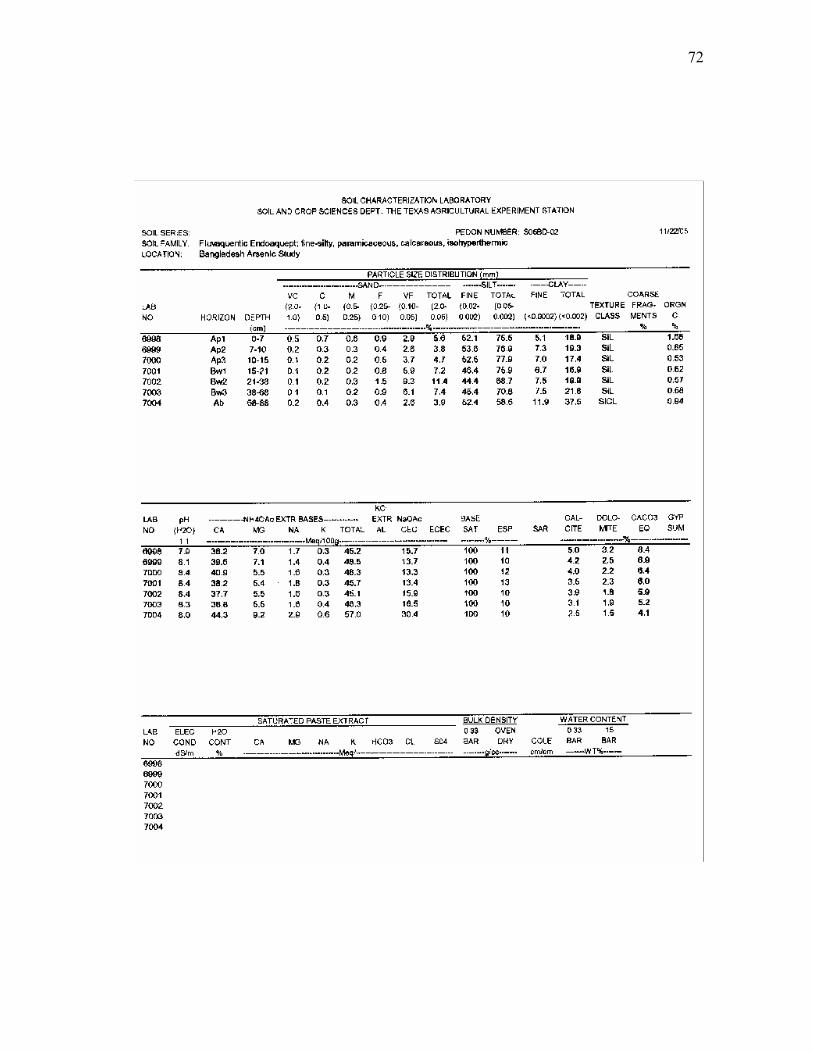
72

73

74

75
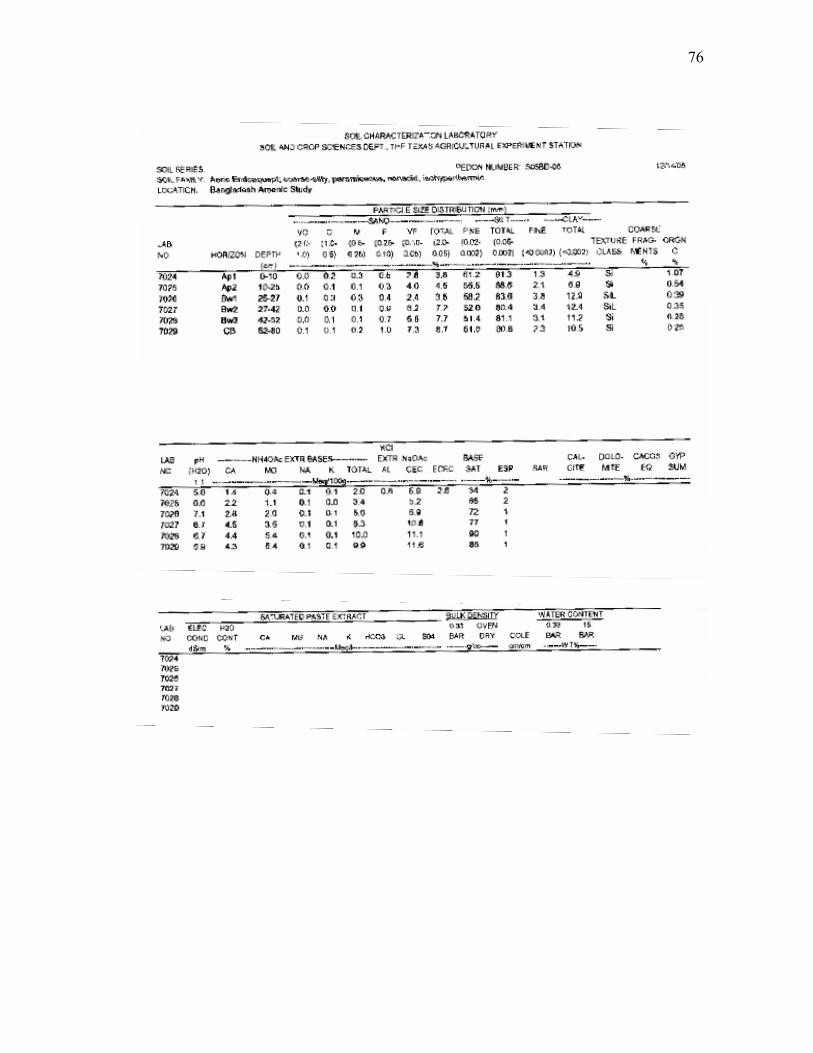
76

77
APPENDIX B
FIELD DESCRIPTION FOR THE FIVE STUDY SOILS

78

79

80
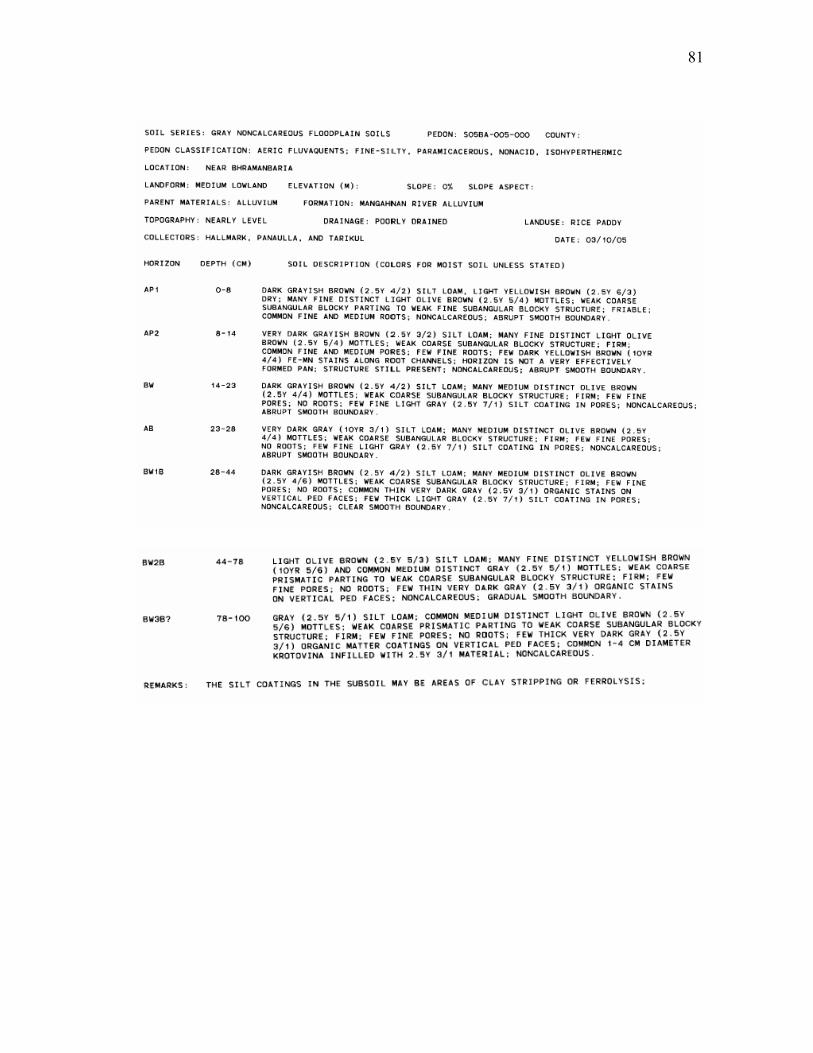
81

82

83
APPENDIX C
X-RAY DIFFRACTOGRAMS OF SELECTED SOIL HORIZONS
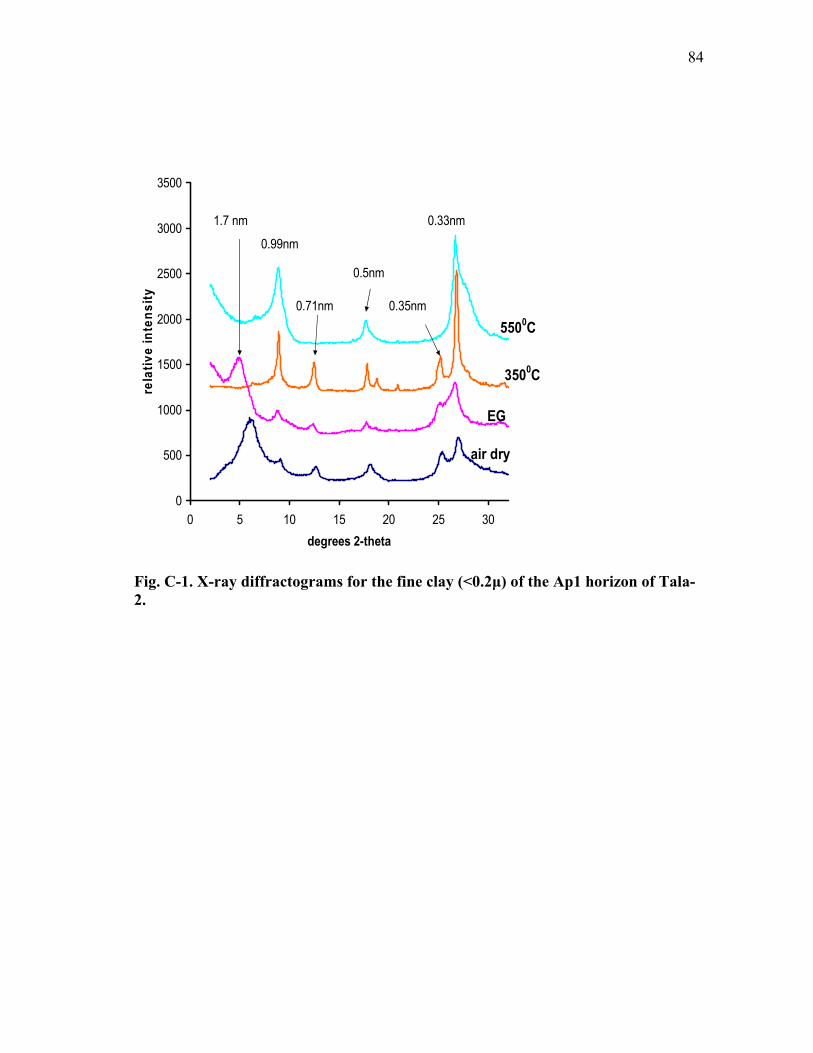
84
0
500
1000
1500
2000
2500
3000
3500
0 5 10 15 20 25 30degrees 2-theta
rela
tive
inte
nsity
0.99nm
1.7 nm
0.71nm
0.5nm
0.35nm
0.33nm
air dry
EG
3500C
5500C
Fig. C-1. X-ray diffractograms for the fine clay (<0.2µ) of the Ap1 horizon of Tala-2.

85
0
1000
2000
3000
4000
5000
6000
7000
8000
0 10 20 30 40
degree 2 theta
Rel
ativ
e In
tens
ity1.3nm 0.99nm
0.69nm0.49nm
0.33nm
5500C
3500C
EG
air dry
Fig. C-2. X-ray diffractograms for the coarse clay (<0.2 µ) of the Ap1 horizon of Tala-3.
0
1000
2000
3000
4000
5000
6000
0 10 20 30 40
degree 2 theta
Rel
ativ
e In
tens
ity
1.63nm0.99nm
0.49nm0.33nm
0.7nm0.48nm
5500 C
3500 C
EG
air dry
Fig. C-3. X-ray diffratograms for the fine clay (<0.2 µ) of the Ap1 horizon of Tala-3.

86
0
1000
2000
3000
4000
5000
6000
0 10 20 30 40
degree 2 theta
rela
tive
inte
nsity
1.3nm
0.98nm
0.69nm
0.49nm
0.35nm
0.33nm
5500C
3500C
EGair dry
Fig. C-4. X-ray diffractograms for the coarse clay (<0.2 µ) of the Ap1 horizon of Paba-4.
0
1000
2000
3000
4000
5000
6000
0 10 20 30 40
degree 2 theta
rela
tive
inte
nsity
0.17nm
1.3nm0.99nm0.49nm
0.33nm
0.7nm5500C
3500C
EG
air dry
Fig. C-5. X-ray diffratograms for the fine clay (<0.2 µ) of the Ap1 horizon of Paba-4.

87
0
1000
2000
3000
4000
5000
0 10 20 30 40
degree 2 theta
rela
tive
inte
nsity
1.3nm0.10nm
0.33nm0.5nm
0.70nm5500C
3500C
EGair dry
Fig. C-6. X-ray diffractograms for the coarse clay (<0.2 µ) of the Ap1 horizon of Senbag-6.
88
VITA
Sumitra Bose Biswas received her B.S. in Chemistry from the National
University in Bangladesh. She received her M.S. in Soil Science from Texas A&M
University, College Station, Texas, in May 2008. During her experience at Texas A&M
University she taught undergraduate laboratories in AGRO 301 (Soil Science) in
summer 2005 and summer 2006 and presented her thesis research poster in ASA-CSSA-
SSSA annual meeting in Indianapolis, IN, in 2006.
She may be contacted at: Department of Soil and Crop Sciences, 370 Olsen Blvd.
College Station, Texas 77843-2474, USA; or ([email protected]).