impact of inorganic fertilization on sorghum forage
TRANSCRIPT
Egyptian J. Nutrition and Feeds (2021), 24(1): 35-53
Issued by The Egyptian Society of Nutrition and Feeds
IMPACT OF INORGANIC FERTILIZATION ON SORGHUM FORAGE
QUALITY AND GROWTH PERFORMANCE OF BARKI LAMBS
K. Z. Kewan*1, I.M. Khattab
2, A.M. Abdelwahed
1, U.A. Nayel
3
1Department of Animal and Poultry Nutrition, Desert Research Center, El-Mataria, Cairo, Egypt.
2Department of Animal and Fish Production, Faculty of Desert and Environmental Agriculture,
Matrouh University, Matrouh, Egypt. 3Department of Animal Production, Faculty of Agriculture, Menoufia University, Shibin El-Kom,
Menoufia, Egypt.
*Corresponding author: [email protected]
(Received 28/2/2021, accepted 27/3/2021)
SUMMARY
he present study was conducted at Maryout Research Station, Desert Research Center. It was
applied in two experiments (Agronomy and fodder evaluation experiment and animal growth
experiment) to determine the response of sorghum quality and consequently the animal
performance to the application of combined N and P fertilizer in newly reclaimed soil. The first
experiment was for evaluating sorghum fodder (Sorghum bicolor L.) that sorted with nine treatment combinations
(from T1 up to T9) comprising of three nitrogen (N) and phosphorus (P) fertilizers levels (N80.4, N100.5 and N120.6
kg/feddan vs. P20.2, P30.2 and P40.3 kg/feddan) in factorial randomized block design with three replications. The
results of the agronomy experiment with considering the ISDMD, NEg and the cost of treatments, showed that
two treatments (N120P30 and N100P40) could be nominated to the second experiment which was their evaluation as
feeds for the growing Barki lambs as compared to control treatment (N80P20). So, two treatments and control were
sorting again in the next summer season to evaluate their nutritive values by using 15 growing Barki lambs (5
lambs/ treatment) in a completely randomized block design. Lambs were on average 22.83 ± 0.29 kg as the initial
body weight and aged 5 months. All animals fed concentrate feed mixture to cover 70% of their growth
requirements (Kearl, 1982). However, the experimental fodders were offered ad lib. So the experimental animal
groups were allowed for three rations for 85d as follows; R1: CFM + sorghum forage of T1 (N80P20) ad lib.,
(served as a control), R2: CFM + sorghum forage of T6 (N120P30) ad lib, and R3: CFM + sorghum forage of T8
(N100P40) ad lib. The results indicated that; Average daily gain differed significantly (P= 0.016) being values 158,
185 and 192g for lambs fed R1, R2 and R3, respectively. Animals in R2 and R3 consumed a higher (P=0.042)
amount of sorghum compared with the control one. There is a significant effect (P< 0.05) of sorghum treatments
on feed conversion ratio (FCR), where sheep fed R1 or R2 had better FCR as g DM/ g gain or g TDN/ g gain than
those fed control sorghum ration. However, R1 revealed better FCR as g DCP/g gain as compared with the other
groups. The digestibilities of DM, CP and CF were higher (P<0.05) for R2 and R3 compared to the control one.
However, digestibilities of EE and NFE were not affected (P>0.05) by the experimental rations. Both R2 and R3
were the better (P<0.05) for both TDN and DCP values as compared with the control ration. Higher (P<0.05) N
balance was observed with R2 than control. All lambs retained relatively similar (P>0.05) amounts of calcium.
However, higher P content in sorghum of R2 and R3 revealed significantly higher P intake (P<0.05) and also P
retained (P<0.05). The revealed insensible water loss (IWL) of the three groups was significantly different being
values 144, 172 and 176 g/kg0.82 for R1, R2 and R3, respectively. The rumen pH value of animal group fed
control ration (R1) was significantly (P≤0.001) higher than other groups at all the sampling time. Animals who
received R2 ration showed the highest NH3-N values at 3h (P<0.01) and 6h (P<0.05) post-feeding as compared to
the other groups; however R3 group showed the highest (P<0.05) value at zero hour post-feeding as compared to
the groups. At 6h post-feeding, animals fed R2 showed the highest (P<0.05) TVFA value (22.14meq/dl) as
compared to the other groups (19.68 and 21.45 meq/dl for R1 and R3, respectively).
It could be concluded that both of the sorghum treatments; N120P30 and N100P40 kg/fed; are in the same nutritive
values and similar growth rate for Barki lambs but because of higher P drain away to the land below in case of
N100P40 ration so it is recommended for N120P30 to be a better fertilizer rate for the fodder consumed by the Barki
T

Kewan et al.
36
lambs and also for its potential to reduce the environmental pollution with the high level of P compared to the other
treatment.
Keywords: Sorghum, fertilizer, gas production, lamb, growth, fermentation and blood parameters.
INTRODUCTION
The livestock production industry in Egypt relies on the availability and quality of green fodders as
feed for ruminants, which is strongly associated with the variety of plant and fertilizer applications during
the lifetime of the plant. Nitrogen expressed as digestible crude protein (DCP %( is one of the main
indicators of fodder quality. Meanwhile, phosphorus is extremely important in ruminant metabolic
processes as it is involved in the formation of energetic compounds (AMP, ADP and ATP), the growth of
living cells and the synthesis of microbial proteins which contributes about 40-80% of the amino acids
absorbed in the intestine )Karsil and Russell, 2001). Phosphorus is also considered an important mineral
element in plant nutrition, especially in calcareous soils that are always poor in this element because of
the high calcium carbonate content and alkalinity of the soil (Korkmaz et al., 2009). The calcareous lands
account for a large part of the reclaimed land in Egypt (Khattari and Tell, 1988).
The most important constraint for ruminant production in the tropic and sub-tropic areas is a shortage
of feed in terms of quality, especially in the dry season. When ruminants fed low-quality roughage, this
result in low milk and beef production as well as caused deterioration of animal health (Chakravarthi et
al., 2017). The forage Sorghum bicolor L. is a common perennial plant and is often grown in areas of
relatively low rainfall, high temperatures and with saline soils (Sanchez et al., 2002). Sorghum ranks fifth
among the world’s most important crops (Getachew et al., 2016). Chakravarthi et al. (2017) stated that
sorghum is considered one of the forage crops that withstand drought compared to corn. Besides, the
main advantages of sorghum are its uses in feeding ruminants in different forms, whether in the green
state, hay, or silage, as well as grains, which are almost similar to corn grains in their nutritional value.
However, there is a voracious need for nitrogen fertilization, which in turn is the cause of an increase in
crop yield from nitrates and prussic acid (Astuti et al., 2019), and these compounds are considered to be
toxic to ruminants at a certain level and are formed as a result of an imbalance between nitrogen and
phosphorus or a decrease in the phosphorus content of the soil, as is the case for calcareous soils. The
safe limit of hydrocyanic acid (HCN) in green forage for livestock is 500 ppm on a fresh weight basis
(Karthika and Kalpana, 2017). Thiex (2002) found that increased phosphorus resulted in a lower
concentration of prussic acid and nitrates in the plant, making its diet safe for ruminants. Singh et al.
(2008) indicated that the major factors limiting sorghum fodder production are related to specific growth
stages, insufficient fertilizer application, and high contents of HCN. To achieve a higher yield and quality
of crops, it is essential to provide them the optimum level of their nutrients requirements as fertilizers.
Therefore, the present study was conducted to determine the response of sorghum quality and
consequently the animal performance to the application of combined N and P fertilizers in newly
reclaimed soil.
MATERIALS AND METHODS
This study was carried out at Maryout Research Station, Desert Research Center (DRC), Egypt, and it
was applied in two experiments in two consecutive summer seasons. A part of the chemical analysis was
progressed in the Lab of Animal Production, Department of Animal Production, Faculty of Agriculture,
Menoufia University.
Agronomy experiment and fodder evaluation:
The forage sorghum (Sorghum bicolor L.) was cultivated during the summer season in reclaimed
calcareous soil. The flood irrigation system was followed throughout the lifetime (130d) of the
experimental crops. The experiment was laid out with nine treatment combinations (from T1 up to T9)
comprising of three nitrogen (N) and Phosphorus (P) fertilizers levels (N80.4, N100.5 and N120.6 kg/feddan
vs. P20.2, P30.2 and P40.3 kg/feddan) in factorial randomized block design with three replications using
forage Sorghum bicolor L. as a test crop. Ammonium nitrate (33.5 % N) and superphosphate (15.5%
P2O5) fertilizers were used as sources for N and P, respectively. Rates of nitrogenous and phosphorous

Egyptian J. Nutrition and Feeds (2021)
37
fertilizers and their contribution for N and P, respectively for sorghum forage as well as their costs are
shown in Table (1).
Table (1): Rate of fertilizers for sorghum fodder sorted in calcareous soil.
Item Fertilization treatment (kg/ feddan)1
T1 T2 T3 T4 T5 T6 T7 T8 T9
AN fertilizer 240 300 360 240 300 360 240 300 360
N element 80.4 100.5 120.6 80.4 100.5 120.6 80.4 100.5 120.6
SP fertilizer 130 130 130 195 195 195 260 260 260
P element 20.2 20.2 20.2 30.2 30.2 30.3 40.3 40.3 40.3
Cost (LE/ Tr./feddan) 1960 2320 2680 2220 2580 2940 2480 2840 3200
1AN: ammonium nitrate (600 LE/ 100 kg); N: nitrogen; CSP: super-phosphate (400 LE/ 100 kg) and P: phosphorus.
Fodder yield:
Fresh fodder yield in three cuttings was recorded and subsamples were dried at 70 °C to determine the dry
weight yield as ton/feddan.
Fodder composition:
Random plant samples from each plot were taken before harvest for analysis to p-hydroxybenzaldehyde
(p·HB) which converted to hydrocyanic acid (HCN) values in ppm as described by Gorz et al. (1977).
Dry sorghum samples were analyzed for crude protein (CP), crude fiber (CF), ether extract (EE) and ash
according to AOAC (2000). Nitrate content was determined according to Makkar et al. (2007). Calcium
and total phosphorus were determined according to VDLUFA (2007) using an Inductively Coupled
Argon Plasma Spectrometer, iCAP6500Duo, Thermo Scientific, England, by the Central Lab in the DRC.
Fodder evaluation trials:
In situ dry matter degradability (ISDMD): In situ bag technique allows intimate contact of the test
feed with the rumen environment. Nylon bags (17 cm×10 cm and 45μm of pore size) were filled with a
3g dry sorghum sample (1.0-mm) and incubated in the rumen for 72h. A total of 51bags were incubated
in three ruminally- cannulated Barki rams (3bags × 3 cuts × 9 treatments). All bags were placed in the
rumen just before the animals were offered their first meal of the morning. After removal from the rumen,
the bags were washed with tap water for 15 min until the washing water was clear. The same procedure
was used for two series of two bags to obtain the 0h value. Bags were dried at 65°C for 48 h and analyzed
for DM. The ISDMD was calculated as the loss in DM, represented as the difference between the
incubated DM and residual DM, corrected by blanks.
In vitro gas production: Each forage treatment was evaluated for gas production (GP) (Menke and
Steingass, 1988) as a composed dry sample formulated from the three cuts, so a total of nine samples was
assessed. An exact of 200 mg of each finely ground sorghum feed was placed into 100 ml glass bottles
containing 20 ml of a medium (pH 6.8) containing rumen liquor (10ml) that had been filtered through 4
layers of cheesecloth. The rumen liquor was collected from the ruminally- cannulated rams one hour
before the morning feeding. Five bottles were set up for each sorghum treatment. The gas volume was
recorded after 24h of incubation and the values were corrected for the blank value and GP values are
expressed in ml per 200 mg DM. After recording the final gas volume at 24h of incubation, 4 ml NaOH
(10 M) was injected in each bottle to measure methane volume as described by Demeyer et al. (1988).
The feeding values for green fodders (metabolizable energy, ME; digestible organic matter, DOM and
net energy for growth, NEg) were calculated by using the amount of gas produced (GP; ml/200 mg DM)
at 24h of incubation with supplementary analysis of CP (g/kg DM), ash (g/kg DM) and EE (g/kg DM) as
follows:
Kewan et al.
38
ME (MJ/kg DM) = 2.20 + 0.1357 × GP + 0.0057 × CP + 0.0002859 × EE² (Getachew et al., 2002).
DOM (% DM) = 9.00 + 0.9991GP + 0.0595CP + 0.0181Ash (Getachew et al., 2002).
NEg (MJ/kg DM) = 0.58 ME - 0.52 (NRC 1985).
Microbial protein (MCP) was calculated as 19.3 g microbial N/kg DOM according to Czerkawski (1985).
Animal growth experiment, samples and analysis:
By investigating the data of the agronomy experiment with considering the ISDMD, NEg and the cost
of treatments, two treatments (T6 & T8) could be nominated to the next evaluation as feeds for the
growing lambs as compared to control treatment (T1). So that T6 and T8 vs. T1 were sorting again in the
next summer season to evaluate their nutritive values by using 15 growing Barki lambs (5 lambs/
treatment) arranged in a completely randomized block design. Lambs were on average 22.83 ± 0.29 kg as
the initial body weight and aged 5 months. All animals fed concentrate feed mixture to cover 70% of their
growth requirement as recommended by Kearl (1982). However, the experimental fodders were offered
ad lib. So the experimental animal groups were allowed for three rations as follows:
R1: CFM + sorghum forage of T1 (N80P20) ad lib. (Served as a control).
R2: CFM + sorghum forage of T6 (N120P30) ad lib.
R3: CFM + sorghum forage of T8 (N100P40) ad lib.
Lambs were housed individually in shaded pens (1.5 × 1.7m). Along with 85d, the sorghum was
chopped before feeding to generate pieces of 1–5cm size to reduce feed selectivity by animals and also
maximize feed intake. Animals were fed twice a day (at 09:00 and 15:00 h) and they had free access to
fresh water. Lambs were weighed biweekly before the morning feeding throughout the experimental
feeding period (85d).
At the end of the feeding trial, 12 animals (4 lambs/ diet) were randomly selected and kept in
individual metabolic cages for conducting a digestibility trial. It prolonged for 10d of adaptation and a
subsequent 5d collection period for feces and urine then followed 2d for sampling rumen liquor and blood
serum. Composite samples of different forages and feces were dried at 60°C for 48h then milling to pass
through a 1 mm screen and stored for later chemical analysis. The chemical composition of representative
samples; CFM, sorghum forages, refusals and feces was determined according to AOAC (2000)
procedures.
At the end of the metabolism trial, rumen fluid samples were collected through a stomach tube from
each animal at zero time (before feeding), 3h and 6h post-feeding. These samples were filtered through
four layers of surgical gauze without squeezing. Ruminal pH was immediately recorded by a digital pH
meter. Rumen ammonia-N was determined according to Preston (1995) and total volatile fatty acids
(TVFAs) was determined by a Kjeldahl distillation method according to AOAC (1997).
Blood samples were collected from the jugular vein of each lamb of the digestibility trial. Blood was
collected into clean test tubes without anticoagulant and centrifuged at 3000 rpm for 20 minutes to obtain
serum that was frozen at -20ºC for later analysis. Serum concentrations of total protein (TP), albumin
(Alb), creatinine (Cr), ammonia (NH3), sodium (Na), potassium (K), calcium (Ca) and phosphorus (P)
were estimated Calorimetrically following protocols of commercial chemical reagent kits (Bio-diagnostic
product Kit, Egypt).
Statistical analysis:
The data of sorghum production, leaf to stem ratio, chemical composition of sorghum crops, and also
Ca and P contents were statistically analyzed by two-way analysis of variance using the General Linear
Model Procedure of the SAS software (SAS 2002). The model used is: Yijk = µ + Ti + Cj + (TC)ij + eijk
where: Yijk= individual observation; µ = the overall mean; Ti = the fixed effect of fertilizer treatments;
Cj = the fixed effect of cut number; (TC)ij= the interaction between the treatment and the cut number and
eijk = random error. But all the other data were statistically performed as a one-way factor and the
mathematical model was as follows: Yij = μ + Ti + eij. Where: Yij = Individual observation, μ=the
overall mean for the trial under consideration, Ti = the effect of the treatment and eij=Random residual
error. Mean comparisons were done using Tukey’s Honestly Significant Difference (HSD) test (Abdi and
Williams, 2010).
Egyptian J. Nutrition and Feeds (2021)
39
RESULTS AND DISCUSSION
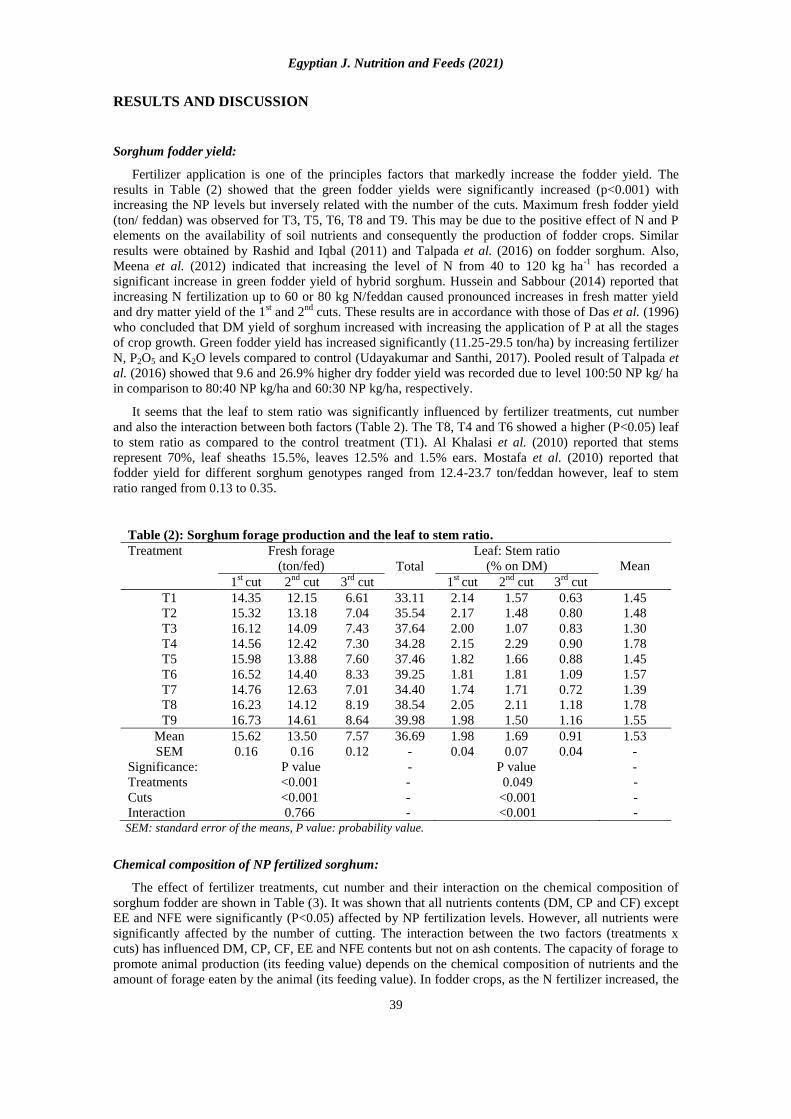
Sorghum fodder yield:
Fertilizer application is one of the principles factors that markedly increase the fodder yield. The
results in Table (2) showed that the green fodder yields were significantly increased (p<0.001) with
increasing the NP levels but inversely related with the number of the cuts. Maximum fresh fodder yield
(ton/ feddan) was observed for T3, T5, T6, T8 and T9. This may be due to the positive effect of N and P
elements on the availability of soil nutrients and consequently the production of fodder crops. Similar
results were obtained by Rashid and Iqbal (2011) and Talpada et al. (2016) on fodder sorghum. Also,
Meena et al. (2012) indicated that increasing the level of N from 40 to 120 kg ha-1
has recorded a
significant increase in green fodder yield of hybrid sorghum. Hussein and Sabbour (2014) reported that
increasing N fertilization up to 60 or 80 kg N/feddan caused pronounced increases in fresh matter yield
and dry matter yield of the 1st and 2
nd cuts. These results are in accordance with those of Das et al. (1996)
who concluded that DM yield of sorghum increased with increasing the application of P at all the stages
of crop growth. Green fodder yield has increased significantly (11.25-29.5 ton/ha) by increasing fertilizer
N, P2O5 and K2O levels compared to control (Udayakumar and Santhi, 2017). Pooled result of Talpada et
al. (2016) showed that 9.6 and 26.9% higher dry fodder yield was recorded due to level 100:50 NP kg/ ha
in comparison to 80:40 NP kg/ha and 60:30 NP kg/ha, respectively.
It seems that the leaf to stem ratio was significantly influenced by fertilizer treatments, cut number
and also the interaction between both factors (Table 2). The T8, T4 and T6 showed a higher (P<0.05) leaf
to stem ratio as compared to the control treatment (T1). Al Khalasi et al. (2010) reported that stems
represent 70%, leaf sheaths 15.5%, leaves 12.5% and 1.5% ears. Mostafa et al. (2010) reported that
fodder yield for different sorghum genotypes ranged from 12.4-23.7 ton/feddan however, leaf to stem
ratio ranged from 0.13 to 0.35.
Table (2): Sorghum forage production and the leaf to stem ratio.
Treatment Fresh forage
(ton/fed) Total
Leaf: Stem ratio
(% on DM) Mean
1st
cut 2nd
cut 3rd
cut 1st
cut 2nd
cut 3rd
cut
T1 14.35 12.15 6.61 33.11 2.14 1.57 0.63 1.45
T2 15.32 13.18 7.04 35.54 2.17 1.48 0.80 1.48
T3 16.12 14.09 7.43 37.64 2.00 1.07 0.83 1.30
T4 14.56 12.42 7.30 34.28 2.15 2.29 0.90 1.78
T5 15.98 13.88 7.60 37.46 1.82 1.66 0.88 1.45
T6 16.52 14.40 8.33 39.25 1.81 1.81 1.09 1.57
T7 14.76 12.63 7.01 34.40 1.74 1.71 0.72 1.39
T8 16.23 14.12 8.19 38.54 2.05 2.11 1.18 1.78
T9 16.73 14.61 8.64 39.98 1.98 1.50 1.16 1.55
Mean 15.62 13.50 7.57 36.69 1.98 1.69 0.91 1.53
SEM 0.16 0.16 0.12 - 0.04 0.07 0.04 -
Significance: P value - P value -
Treatments <0.001 - 0.049 -
Cuts <0.001 - <0.001 -
Interaction 0.766 - <0.001 - SEM: standard error of the means, P value: probability value.
Chemical composition of NP fertilized sorghum:
The effect of fertilizer treatments, cut number and their interaction on the chemical composition of
sorghum fodder are shown in Table (3). It was shown that all nutrients contents (DM, CP and CF) except
EE and NFE were significantly (P<0.05) affected by NP fertilization levels. However, all nutrients were
significantly affected by the number of cutting. The interaction between the two factors (treatments x
cuts) has influenced DM, CP, CF, EE and NFE contents but not on ash contents. The capacity of forage to
promote animal production (its feeding value) depends on the chemical composition of nutrients and the
amount of forage eaten by the animal (its feeding value). In fodder crops, as the N fertilizer increased, the
Kewan et al.
40
content of CP increased while CF decreased which could increase palatability and digestibility. On the
other hand, the amount of soluble carbohydrates also could alter the quality of the forages (Almodares et.
al., 2009). Also, P is another fundamental nutrient required to increase plant yield. Consequently, the lack
of P is important as the lack of N in limiting plant performance. Aganga and Autlwetse (2000) reported
91.20, 6.39, and 11.19% for DM, CP and ash in sorghum, respectively. Chakravarthi et al. (2017) found
that the DM content of sorghum fodder changed from 11.82 to 38.19% with an overall mean estimation of
26.30% on a DM basis. The mean CP content was 12.42% and exhibited an average of 15.95%. The total
ash content varied from 6.15 to 13.08% with a mean value of 9.18%. Talpada et al. (2016) found that
higher CP (10.78%) and CF (33.62%) contents in the sorghum fodder were recorded with NP fertilizers at
the rate of 100:50 kg/ha as compared to 9.93 % and 32.29% for the rate of 80: 40 kg/ha. From this study,
it was inferred that sorghum fodder was nutritionally superior fodder for livestock in scarce rainfall areas.
The current result of CP content was nearly close to that recorded for different sorghum varieties by
Khanum et al. (2010) which ranged from 8.62 to12.26% but higher than that of CF content (18.6-19.7%).
Because of the current fertilization treatments, the ash content was higher than that reported for different
sorghum varieties which ranged from 5.86 to 9.10% (Mahanta and Pachauri, 2005). The current results
were within those reported by Fahmy et al. (2010). The corresponding values were 11.8-13.2, 24.9-24.9,
1.65-2.86, 50.75-44.56 and 10.9 -14.5%, respectively for CP, CF, EE, NFE and ash contents in sorghum
bicolor irrigated with two levels of water salinity; 4000 and 7000 ppm total salts, respectively.
Hydrocyanic acid and nitrate concentration:
Anti-nutritional factors like tannin, nitrates and silica of salt-tolerant fodders could restrict animals
feeding mainly when they are separately used as a sole diet (Helal et al., 2018). At feeding animals, these
compounds in fodders form insoluble complexes with nutrients (proteins, carbohydrates and minerals)
bringing down the feeding values of the fodders. Sorghum contains two major secondary metabolites;
tannin, a polyphenolic compound located in the grain and, dhurrin, a cyanogenic glucoside located mainly
in the aerial shoot and sprouted seeds (Sher et al., 2011). Forage sorghum may have some risk of toxicity
to animals, especially when grazed at an early stage of fodder growth as toxicities can result from
glucoside dhurrin (Conn, 1993). Disruption of the plant tissue allows the glucoside found in the epidermal
tissue to mix with the enzymes occurring in either the mesophyll tissue or in rumen fluid then the HCN is
released (Majak et al., 1990). This may cause lethal harming of animals and more commonly avoiding
sulfur insufficiency (Wheeler et al., 1980). This may be the constraint of usage of sorghum for grazing
while it is still young and digestible.
Figure (1) showed that sorghum hydrocyanic acid content (mg/100g DM) was higher in the third cut
compared to the second and first cuttings, respectively. Additionally, higher total HCN contents in
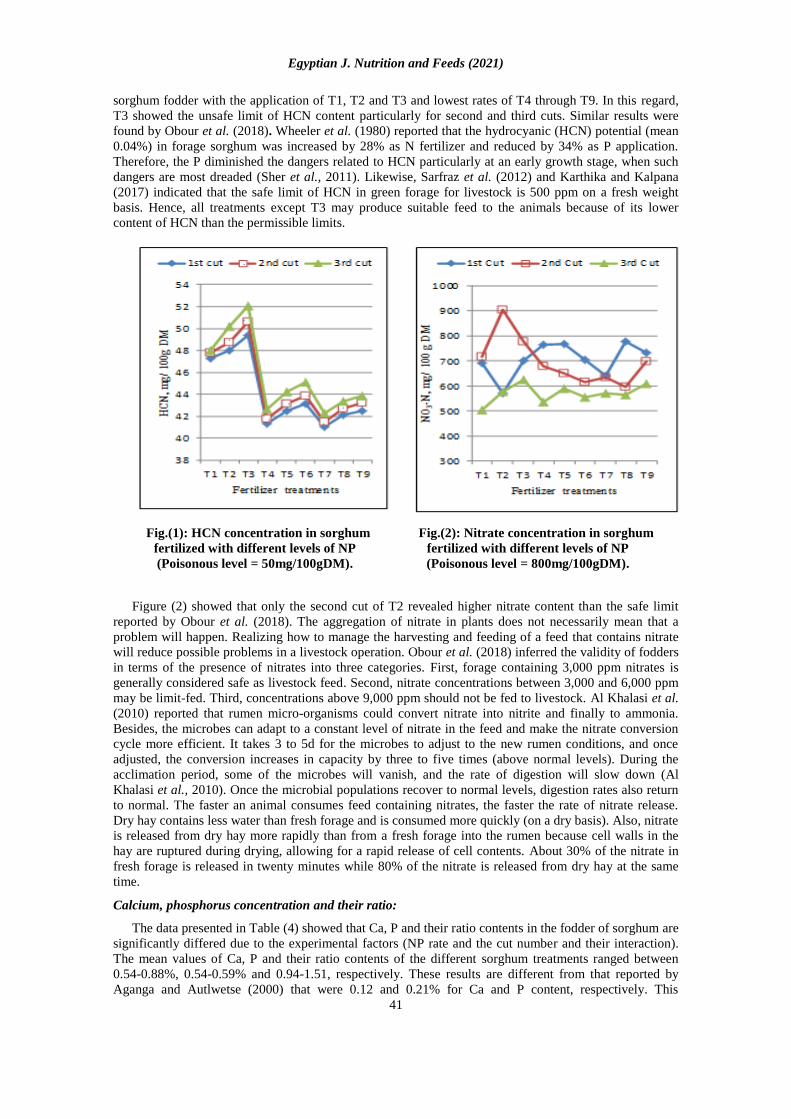
Egyptian J. Nutrition and Feeds (2021)
41
sorghum fodder with the application of T1, T2 and T3 and lowest rates of T4 through T9. In this regard,
T3 showed the unsafe limit of HCN content particularly for second and third cuts. Similar results were
found by Obour et al. (2018). Wheeler et al. (1980) reported that the hydrocyanic (HCN) potential (mean
0.04%) in forage sorghum was increased by 28% as N fertilizer and reduced by 34% as P application.
Therefore, the P diminished the dangers related to HCN particularly at an early growth stage, when such
dangers are most dreaded (Sher et al., 2011). Likewise, Sarfraz et al. (2012) and Karthika and Kalpana
(2017) indicated that the safe limit of HCN in green forage for livestock is 500 ppm on a fresh weight
basis. Hence, all treatments except T3 may produce suitable feed to the animals because of its lower
content of HCN than the permissible limits.
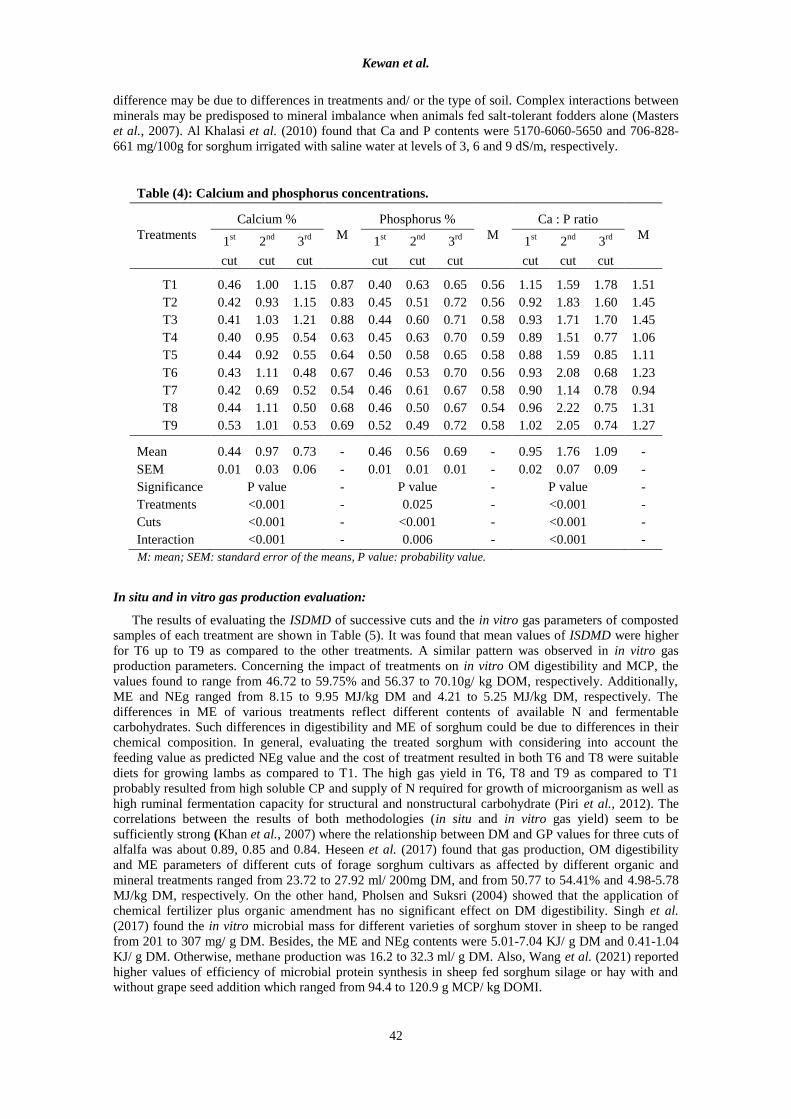
Figure (2) showed that only the second cut of T2 revealed higher nitrate content than the safe limit
reported by Obour et al. (2018). The aggregation of nitrate in plants does not necessarily mean that a
problem will happen. Realizing how to manage the harvesting and feeding of a feed that contains nitrate
will reduce possible problems in a livestock operation. Obour et al. (2018) inferred the validity of fodders
in terms of the presence of nitrates into three categories. First, forage containing 3,000 ppm nitrates is
generally considered safe as livestock feed. Second, nitrate concentrations between 3,000 and 6,000 ppm
may be limit-fed. Third, concentrations above 9,000 ppm should not be fed to livestock. Al Khalasi et al.
(2010) reported that rumen micro-organisms could convert nitrate into nitrite and finally to ammonia.
Besides, the microbes can adapt to a constant level of nitrate in the feed and make the nitrate conversion
cycle more efficient. It takes 3 to 5d for the microbes to adjust to the new rumen conditions, and once
adjusted, the conversion increases in capacity by three to five times (above normal levels). During the
acclimation period, some of the microbes will vanish, and the rate of digestion will slow down (Al
Khalasi et al., 2010). Once the microbial populations recover to normal levels, digestion rates also return
to normal. The faster an animal consumes feed containing nitrates, the faster the rate of nitrate release.
Dry hay contains less water than fresh forage and is consumed more quickly (on a dry basis). Also, nitrate
is released from dry hay more rapidly than from a fresh forage into the rumen because cell walls in the
hay are ruptured during drying, allowing for a rapid release of cell contents. About 30% of the nitrate in
fresh forage is released in twenty minutes while 80% of the nitrate is released from dry hay at the same
time.
Calcium, phosphorus concentration and their ratio:
The data presented in Table (4) showed that Ca, P and their ratio contents in the fodder of sorghum are
significantly differed due to the experimental factors (NP rate and the cut number and their interaction).
The mean values of Ca, P and their ratio contents of the different sorghum treatments ranged between
0.54-0.88%, 0.54-0.59% and 0.94-1.51, respectively. These results are different from that reported by
Aganga and Autlwetse (2000) that were 0.12 and 0.21% for Ca and P content, respectively. This
Fig.(1): HCN concentration in sorghum
fertilized with different levels of NP
(Poisonous level = 50mg/100gDM).
Fig.(2): Nitrate concentration in sorghum
fertilized with different levels of NP
(Poisonous level = 800mg/100gDM).
Kewan et al.
42
difference may be due to differences in treatments and/ or the type of soil. Complex interactions between
minerals may be predisposed to mineral imbalance when animals fed salt-tolerant fodders alone (Masters
et al., 2007). Al Khalasi et al. (2010) found that Ca and P contents were 5170-6060-5650 and 706-828-
661 mg/100g for sorghum irrigated with saline water at levels of 3, 6 and 9 dS/m, respectively.
Table (4): Calcium and phosphorus concentrations.
Treatments
Calcium %
M
Phosphorus %
M
Ca : P ratio
M 1
st
cut
2nd
cut
3rd
cut
1st
cut
2nd
cut
3rd
cut
1st
cut
2nd
cut
3rd
cut
T1 0.46 1.00 1.15 0.87 0.40 0.63 0.65 0.56 1.15 1.59 1.78 1.51
T2 0.42 0.93 1.15 0.83 0.45 0.51 0.72 0.56 0.92 1.83 1.60 1.45
T3 0.41 1.03 1.21 0.88 0.44 0.60 0.71 0.58 0.93 1.71 1.70 1.45
T4 0.40 0.95 0.54 0.63 0.45 0.63 0.70 0.59 0.89 1.51 0.77 1.06
T5 0.44 0.92 0.55 0.64 0.50 0.58 0.65 0.58 0.88 1.59 0.85 1.11
T6 0.43 1.11 0.48 0.67 0.46 0.53 0.70 0.56 0.93 2.08 0.68 1.23
T7 0.42 0.69 0.52 0.54 0.46 0.61 0.67 0.58 0.90 1.14 0.78 0.94
T8 0.44 1.11 0.50 0.68 0.46 0.50 0.67 0.54 0.96 2.22 0.75 1.31
T9 0.53 1.01 0.53 0.69 0.52 0.49 0.72 0.58 1.02 2.05 0.74 1.27
Mean 0.44 0.97 0.73 - 0.46 0.56 0.69 - 0.95 1.76 1.09 -
SEM 0.01 0.03 0.06 - 0.01 0.01 0.01 - 0.02 0.07 0.09 -
Significance P value - P value - P value -
Treatments <0.001 - 0.025 - <0.001 -
Cuts <0.001 - <0.001 - <0.001 -
Interaction <0.001 - 0.006 - <0.001 -
M: mean; SEM: standard error of the means, P value: probability value.
In situ and in vitro gas production evaluation:
The results of evaluating the ISDMD of successive cuts and the in vitro gas parameters of composted
samples of each treatment are shown in Table (5). It was found that mean values of ISDMD were higher
for T6 up to T9 as compared to the other treatments. A similar pattern was observed in in vitro gas
production parameters. Concerning the impact of treatments on in vitro OM digestibility and MCP, the
values found to range from 46.72 to 59.75% and 56.37 to 70.10g/ kg DOM, respectively. Additionally,
ME and NEg ranged from 8.15 to 9.95 MJ/kg DM and 4.21 to 5.25 MJ/kg DM, respectively. The
differences in ME of various treatments reflect different contents of available N and fermentable
carbohydrates. Such differences in digestibility and ME of sorghum could be due to differences in their
chemical composition. In general, evaluating the treated sorghum with considering into account the
feeding value as predicted NEg value and the cost of treatment resulted in both T6 and T8 were suitable
diets for growing lambs as compared to T1. The high gas yield in T6, T8 and T9 as compared to T1
probably resulted from high soluble CP and supply of N required for growth of microorganism as well as
high ruminal fermentation capacity for structural and nonstructural carbohydrate (Piri et al., 2012). The
correlations between the results of both methodologies (in situ and in vitro gas yield) seem to be
sufficiently strong (Khan et al., 2007) where the relationship between DM and GP values for three cuts of
alfalfa was about 0.89, 0.85 and 0.84. Heseen et al. (2017) found that gas production, OM digestibility
and ME parameters of different cuts of forage sorghum cultivars as affected by different organic and
mineral treatments ranged from 23.72 to 27.92 ml/ 200mg DM, and from 50.77 to 54.41% and 4.98-5.78
MJ/kg DM, respectively. On the other hand, Pholsen and Suksri (2004) showed that the application of
chemical fertilizer plus organic amendment has no significant effect on DM digestibility. Singh et al.
(2017) found the in vitro microbial mass for different varieties of sorghum stover in sheep to be ranged
from 201 to 307 mg/ g DM. Besides, the ME and NEg contents were 5.01-7.04 KJ/ g DM and 0.41-1.04
KJ/ g DM. Otherwise, methane production was 16.2 to 32.3 ml/ g DM. Also, Wang et al. (2021) reported
higher values of efficiency of microbial protein synthesis in sheep fed sorghum silage or hay with and
without grape seed addition which ranged from 94.4 to 120.9 g MCP/ kg DOMI.

Egyptian J. Nutrition and Feeds (2021)
43
Table (5): In situ DM degradability at 72h and gas production parameters for sorghum forages.
Treatment ISDMD (%) at 72h
1
Mean Gas production parameters
2
1st cut 2
nd cut 3
rd cut GV CH4 DOM MCP ME NEg
T1 39.93 37.28 35.33 37.51 36.94 5.47 46.72 56.37 8.15 4.21
T2 41.52 40.68 38.88 40.36 38.14 5.54 47.96 57.87 8.31 4.30
T3 45.73 43.86 42.09 43.89 39.18 5.89 49.02 59.14 8.47 4.39
T4 46.09 44.20 40.89 43.71 43.25 5.62 53.08 64.04 8.98 4.69
T5 40.76 38.97 45.00 41.58 46.22 5.66 56.00 67.57 9.41 4.94
T6 48.78 46.19 44.99 46.65 50.01 5.66 59.75 72.08 9.95 5.25
T7 45.95 44.31 42.76 44.34 47.12 5.67 56.85 68.59 9.48 4.98
T8 46.46 51.09 48.77 48.77 48.34 5.68 58.11 70.10 9.64 5.07
T9 45.62 47.55 46.46 46.54 48.21 5.68 58.01 69.99 9.70 5.11
Mean 44.54 43.79 42.80 43.71 44.16 5.65 53.95 65.08 9.12 4.77
SEM 1.01 1.44 1.36 0.73 1.65 0.04 1.64 1.98 0.22 0.13
P value - - - 0.04 0.009 0.005 0.018 0.007 0.01 0.014
1ISDMD: In situ DM degradability. 2GV: gas volume (ml), CH4: methane volume (ml), DOM: digestible organic matter (%), MCP: microbial protein
(g/kg DOM), ME: metabolizable energy (MJ/kg DM), NEg: net energy for growth (MJ/kg DM).
P value: probability value
Chemical composition of the experimental rations:
The chemical composition of green forages and concentrate feed mixture (CFM) are presented in
Table (6). The CP, CF and ash concentration of sorghum T1 (control) were the lowest compared with the
other treatments (T6 and T8) but the opposite trend was observed for NFE%.
Table (6): Chemical composition (%) of feeds and experimental rations fed to Barki lambs.
Item DM CP CF EE NFE Ash Ca P Ca: P
CFM1
91.12 13.67 12.11 4.71 64.29 5.22 1.56 0.87 1.79
T1 23.23 9.10 21.56 3.39 56.56 9.39 0.71 0.49 1.45
T6 24.11 11.35 23.67 2.44 52.19 10.35 0.62 0.58 1.07
T8 25.70 11.05 23.72 2.98 52.13 10.12 0.69 0.62 1.11
Calculated rations2:
R1- Control
46.77 12.19 15.18 4.28 61.78 6.57 1.28 0.75 1.72
R2 47.35 12.90 15.95 3.95 60.27 6.93 0.68 0.77 0.88
R3 47.78 12.74 16.25 4.09 59.96 6.97 0.64 0.78 0.83 1CFM: concentrate feed mixture contains 53% corn; 30% wheat bran; 14% soybean meal; 1.5% lime stone; 1% salt,
0.5% mineral & vitamin mixture. 2R1: control ration includes CFM + sorghum of T1, R2: ration 2 includes CFM+ sorghum of T6, R3: ration 3
includes CFM+ sorghum of T8.
The calculated rations (Table 6) showed similar percentages of contents except the Ca and Ca: P ratio
contents which were higher in T1 than that in T6 and T8. Helal et al. (2018) found that S. bicolor
recorded contents of DM, CP, CF, EE, NFE and ash to be 92.17, 8.08, 22.99, 1.69, 53.53 and 13.71%,
respectively.

Kewan et al.
44
Growth performance of Barki lambs:
Live body weights at the initial experiment of three groups were almost equivalent (Table 7). The
final body weights of all experimental groups were significantly (P<0.05) different. Average daily gain
(ADG) was significantly (P<0.05) affected by the experimental rations being values; 158, 185 and 192
g/h/d for lamb groups fed R1, R2 and R3, respectively. The daily gain in this study was almost
comparable with that obtained in lambs fed ration containing Sesbania-Sorghum mixture (1:1) + CFM
which ranged between 132.5 and 175.5 with an average of 154 g/d (Zaki et al., 2015). What's more, the
sorghum intake by rams was 530 and 640 g DM/head/d from the 1st and the 2
nd cuts, respectively. In
comparison with the current results, the higher feed intake was because of predominantly the lower CFM
offered which was half of the total CP requirement. Furthermore, Al Khalasi et al. (2010) found that
lambs fed diets containing sorghum fodder irrigated with three different concentrations of salt water (3, 6
and 9 dS/m) grew well throughout the trial period and achieved body weight gain between 68.2 and 96.3
g/day. The ADG of lambs fed sweet sorghum silage + grape seed (SSG) was greater (217g) than lambs
fed sweet sorghum hay (SH) (161g) and tended to be greater than sweet sorghum (SS) group (192g),
whereas sweet sorghum hay + grape seed (SHG) group tended to be greater (183g) than SH group (Wang
et al., 2021).
Concerning data of feed intake (Table 7), there were no differences (P< 0.05) in concentrate intake
between animal groups. However, sorghum intake and total feed intake were significantly (P< 0.05)
affected by the experimental rations and both R2 and R3 groups consumed higher amounts compared
with the control one. With calculating the relative daily sorghum intake to body weight or total feed
intake, the corresponding relating esteems were 1.10, 1.15, 1.29% and 32.44, 33.27, 35.63% for T1, T2
and T3, respectively.
Table (7): Growth performance and feed utilization in Barki lambs (Period 85d).
Item Body weight Feed intake as DM Feed conversion
IBW
(Kg)
FBW
(Kg)
ADG
(g/d)
CFM
(g)
Sorghum
(g)
Total
(g)
DM
(g/g)
TDN
(g/g)
DCP
(g/g)
R1- Control 22.23 35.66b
158b
670 322c 992
c 6.28
a 4.44
a 0.512
b
R2 23.00 38.73a
185a
710 354b 1064
b 5.75
b 4.10
b 0.529
a
R3 22.50 38.79a
192a
715 396a 1111
a 5.80
b 4.18
b 0.535
a
SEM 0.29 0.29 2.91 16.14 24.64 38.27 0.26 0.19 0.06
P value 0.685 0.036 0.016 0.615 0.042 0.023 0.033 0.009 0.021
IBW: initial body weight, FBW: final body weight, ADG: average daily gain, CFM: concentrate feed mixture, TDN:
total digestible nutrients, DCP: digestible crude protein, SEM: standard error of the means, P value: probability
value. Means in the same line with different superscripted letters (a, b and c) are significantly different (P < 0.05).
The sorghum intake expressed as g DM/ kg BW were 11.1, 11.5 and 12.9 for R1, R2 and R3 groups,
respectively. These values were lower than that reported by Fahmy et al. (2010) which were 22.9 and
19.6 for sheep fed sole diets based on sorghum irrigated with two salinity levels. In the current study
lambs fed R1 ration (low in P and/or N) consumed less food, produced less rumen microbial protein and
grew at slower rates than those fed a diet rich in these nutrients and these results were in accordance with
that found by Scott et al. (1997). Wang et al. (2021) reported values of DM intake to be 699.0, 661.5,
529.0 and 614.2 g/d for lambs fed SS, SSG, SH and SHG diets, respectively.
There is also a significant impact (P< 0.05) of sorghum treatments on feed conversion ratio (Table 7),
where sheep fed R2 or R3 ration had better feed conversion ratio as g DM/ g gain or g TDN/ g gain than
those fed control sorghum ration. However, control group (R1) revealed better feed conversion as g
DCP/g gain when compared with the other groups. Feed conversion in this study was lower than that
recorded for lambs fed a ration containing sesbania-sorghum mixture (1:1) + CFM which was 7.63 kg
DMI/ kg gain (Zaki et al., 2015). Wang et al. (2021) reported a range from 6.01 to 6.76 g DM/g gain as
feed conversion of diets including sorghum as a silage or hay form.

Egyptian J. Nutrition and Feeds (2021)
45
Digestibility and nutritive values:
Data in Table (8) summarized results of the digestibility of nutrients and also the nutritive values of
the experimental rations. The current results of digestibility for CP and CF were within the range recorded
for different sorghum varieties by Khanum et al. (2010) which were 63.5-74.9% for CP and 64.5-73.5%
for CF but higher than that for DM digestibility (55.1-61.9%). Fahmy et al. (2010) reported the
digestibility of sorghum nutrients to be 58.2, 64.5, 60.7, 75.9 and 59.3% for DM, CP, CF, EE and NFE,
respectively. In addition, they found the TDN and DCP values to be 57.7 and 9.76%, respectively.
Sheridan et al. (2003) showed that sorghum was in a low digestibility by sheep as compared to lucerne
however, the daily growth rate of lambs versus adult sheep grazing sorghum-Sudan grass hybrids was 84
vs. 87 g/d, respectively. Besides, Talpada et al. (2016) inferred that sorghum fodder contains more than
50% TDN with 8% CP, 2.5% EE and 45% NFE and its nutritional value is equivalent to that of corn. The
digestibility of DM ranged from 64.9 to 69.5% for sweet sorghum as silage or hay form with or without
grape seed supplementation (Wang et al., 2021). Singh et al. (2017) found the digestibility of DM and CP
ranged from 51 to 54% and 51 to 56% for different varieties of sorghum stover in sheep but the DCP
value ranged from 45 to 67%.
Zaki et al. (2015) found that lambs fed a ration containing Sesbania-Sorghum mixture (1:1) + CFM,
resulted in digestibility values to be 56.81, 73.60, 51.93, 71.42, and 63.10%, for DM, CP, CF, EE and
NFE, respectively. They added that the TDN was 61.68 and 65.20% for the 1st cut and 2
nd cut of sorghum,
respectively and it was 11.89 and 10.95% for DCP, respectively.
Digestibilities of EE and NFE were in accordance with that found by Ward et al. (2001) who
concluded that digestibility of EE was comparable among different varieties of sorghum silage. They
found also, the digestibilities of various nutrients were similar in various species of animals fed on
sorghum forage exclusively or mixed ration of forage and concentrates. Also, Al Khalasi et al. (2010)
found no differences in the digestibilities of CP, EE and fiber components (NDF and ADF) between
sorghum-based diets.
Table (8): Digestibility of nutrients and feeding values of rations fed to Barki lambs.
Item Digestibility coefficient (%) Nutritive value (%)
DM CP CF EE NFE TDN DCP
R1-Control 66.88b
66.88c
60.00c
76.51 74.58 70.70b
8.15b
R2 67.36a
71.36b
63.09b
78.95 74.64 71.28a
9.20a
R3 68.48a
72.51a
64.95a
77.70 75.21 72.04a
9.24a
SEM 0.15 0.29 0.31 0.66 0.35 0.19 0.11
P value 0.025 0.037 0.046 0.441 0.276 0.034 0.031 SEM: standard error of the means, P value: probability value.
Means in the same line with different superscripted letters (a, b and c) are significantly different (P < 0.05).
Balance of nitrogen, calcium and phosphorus:
Either N intake or urine-N was significantly (P<0.05) affected by the experimental diets as shown in
Table (9). All the experimental lambs revealed a positive N balance. Lower fecal N loss and higher
(P<0.05) N balance were observed in R2 than the control group. Higher N balance in the present study
may be due to comparatively higher DMI as well as higher N content and also increased ruminal N pool
and post-ruminal amino acid flow (Thota et al., 2017). Contrary, Hernandez et al. (2009) observed that N-
intake, fecal-N, urinary N and N-retention were not affected in lambs fed with orchard grass hay as basal
diet. The revealed NB values were nearly close to that found by Wang et al. (2021) which ranged from
6.82 to 8.02 g/d for lambs fed diets based on sorghum fodder. However, Al Khalasi et al. (2010) reported
lower range value (4.5 to 5.1 g/d) for sheep fed diets based on sorghum irrigated with saline water at
levels of 3, 6 and 9 dS/m. Also, Singh et al. (2017) found the NB in sheep fed different varieties of
sorghum stover, ranged from 1.07 to 2.29 g/d. In the current study, the animal groups retained N by about
33.7, 35.6 and 35.5% of N intake for R1, R2 and R3, respectively. These values were within that for
lambs received diets of sorghum silage (9.46 to 36.44%) as recorded by Mahanta and Pachauri (2005).
Also, Fahmy et al. (2010) found NB to be 212 mg/kg BW and represented 33.6% of N intake by lambs
fed sorghum hay. The biological value of N (=NB × 100/ (NI-FN)) was calculated to be 50.31, 49.90 and
48.96% for R1, R2 and R3, respectively.
Kewan et al.
46
Concerning Ca utilization data (Table 9), it pointed out that both Ca intake and fecal Ca were
significantly (P<0.05) affected by the experimental diets. Although, higher significant Ca intake and
excrete via feces in both R1 and R2 groups as compared with control, all the lambs retained relatively
similar amounts of calcium. These finding may because of high availability of Ca where the amount of Ca
retained as a relative to that level recommended by Kearl (1982) represent about 171.4, 148.7 and 174.0
%, for T1, T2 and T3 groups, respectively.
It was interesting to notice higher P content in sorghum of R2 and R3 revealed significantly (P<0.05)
higher P intake and also P retained (Table 9). This may be attributed to improving nutrient digestibility
and ruminal digestion more likely fiber degradation and lower excretion of the minerals (Thota et al.,
2017). It seems that P is excreted mainly in feces, which is composed of unabsorbed dietary P and
endogenous P that are confirmed from saliva, digestive juices and intestinal cells. Otherwise, total P
excretion in feces depends largely on P intake (Louvandini and Vitti, 2007). High intake of electrolytes is
accompanied by their high excretion through the kidneys (Shaker et al., 2008). The amount of P retained
as a relative to that level recommended by Kearl (1982) represents about 89.3, 105.0 and 110.1 %, for T1,
T2 and T3 groups, respectively, which was in harmony with the ADG revealed in the same groups.
Table (9): Balance (g/ head/d) of nitrogen (N), calcium (Ca) and phosphorus (P) in lambs fed the
experimental rations
Items N
Bal. Ca
Bal. P
Bal.
Intake Feces Urine Intake Feces Urine Intake Feces Urine
R1 19.34b
6.40 6.42c
6.51c
12.74c
5.42b
1.51 5.81 7.41b
4.09c
0.31b
3.01c
R2 21.96a
6.29 7.85b
7.82b
13.27a
6.70a
1.53 5.04 8.23a
4.40b
0.29c
3.54b
R3 22.64a
6.22 8.37a
8.04a
13.88b
6.50a
1.48 5.90 8.67a
4.59a
0.37a
3.71a
SEM 0.17 0.12 0.25 0.19 0.10 0.11 0.16 0.13 0.10 0.09 0.02 0.09
P val. 0.019 0.215 0.031 0.049 0.037 0.048 0.445 0.097 0.045 0.029 0.021 0.037
Bal: balance; SEM: standard error of the means, P val.: probability value.
Means in the same line with different superscripted letters (a, b and c) are significantly different (P < 0.05).
Water utilization:
Water utilization by lambs is illustrated in Table (10). Data are mainly related to the metabolic body
mass (W0.82
) and indicated that animals fed T2 and T3 rations consumed water more (P<0.01) than those
fed a control ration (153.1 and 154.4 vs. 119.4 g/kg0.82
, respectively), this may be related to higher intakes
of DM (Kewan et al., 2011), ash (Kewan et al., 2019) as well as CP (Allam et al., 2009). Fecal and total
Table (10). Water utilization (g/kg0.82
) in Barki lambs fed the experimental rations.
Item MBW1 Water Intake (WI) Fecal
Water
Urine
Water
Total
output IWL
3
Feed Free MW2 Total
R1- Control 15.79b 71.46
b 119.4
b 26.64
b 217.5
b 18.4
b 55.4 73.8
b 144
b
(8.47) (24.47)
(33.93) (66.07)
R2 16.65a 71.08
b 153.1
a 27.33
ab 251.5
a 21.1
a 58.3 79.4
a 172
a
(8.39) (23.18) (31.93) (68.42)
R3 16.55a 73.34
a 154.4
a 29.01
a 256.7
a 22.6
a 57.7 80.3
a 176
a
(8.80) (22.48) (31.28) (67.72)
SEM 0.26 2.05 6.15 0.09 3.46 0.81 0.62 0.77 5.47
P value 0.041 0.014 0.021 0.044 0.037 0.019 0.250 0.020 0.038 1MBW: metabolic body weight as kg0.82, 2MW: metabolic water, 3IWL: Insensible water loss.
SEM: standard error of the means, P value: probability value.
Values in brackets represent items as percentages of total water intake.
Means in the same line with different superscripted letters (a and b) are significantly different (P < 0.05).

Egyptian J. Nutrition and Feeds (2021)
47
water execration were higher (P<0.01) for treatment groups vs. the control group. However, urine water
was not affected by the experimental rations. This concurs with earlier reports by Helal et al. (2018) who
recorded higher water intake (220 ml/ kg W0.82
) for Barki sheep fed CFM plus either forage mixture
including 25% sorghum vs. control group fed CFM plus alfalfa hay (79.42ml/kg W0.82
). However, the
revealed insensible water loss (IWL) for two groups was 150.58 vs. 131.80, respectively which were close
to the present values for three groups (144, 172 and 176 g/ kg0.82
for R1, R2 and R3, respectively). The
IWL presents 66.07, 68.42 and 67.72% of the total water intake of the corresponding three groups. These
values were higher than that reported by Fahmy et al. (2010) who concluded that free water intake for
sheep fed sorghum grass was 63.1 ml/ kg BW and the water balance was 41.1 ml/ kg BW which
presented 54.7% of intake. A computing of IWL as a relative to water intake present estimations of 66.07,
68.42 and 67.72 for T1, T2 and T3, groups, respectively, these values are within the range (52.5-78.4%)
reported by Kewan et al. (2016) for sheep fed dry forages.
Rumen fermentation parameters:
Data in Table (11) present the rumen fermentation parameters in Barki rams as a result of feeding the
experimental rations. It is obvious that the maximum (P<0.05) pH values were recorded at zero hour
(before feeding) with all groups then significantly decreased with advanced time (3 and 6h) post-feeding
in all treatments (Table 11). A similar trend was observed in the early study by Zaki et al. (2015). The
rumen pH value of animal group fed control ration (R1) was significantly (P<0.05) higher than other
groups at all the sampling times. The NH3-N was significantly higher post-feeding than before feeding for
all groups. Also, a comparable pattern was seen by Zaki et al. (2015). Animal group received R2 ration
showed the highest (P<0.05) rumen NH3-N values at 3 and 6h post-feeding as compared to the other
groups; however R3 group showed the highest (P<0.05) value at zero hour post-feeding. In the present
study, ruminal ammonia concentrations were in the range of those reported to be required for achieving
the maximum ruminal microbial activity that was from 14.4 to 41.7 mg/dl (Borhami et al., 1998).
Generally, ammonia level depends on CP content in the rations and degradability degree of CP in the
rumen and in addition the amount of absorbed of ammonia through the blood stream in the rumen wall.
Table (11): Rumen fermentation parameters in Barki lambs fed experimental rations.
Item pH NH3-N, mg/dl VFA, meq/dl
0 3h 6h 0 3h 6h 0 3h 6h
R1- Control 6.50a 6.37
a 6.13
a 15.94
c 19.17
c 18.69
c 13.83 18.44 19.68
ab
R2 6.45b 6.31
b 5.95
b 17.00
b 25.34
a 32.30
a 14.93 19.62 22.14
a
R3 6.31c 6.12
c 5.98
b 18.15
a 23.81
b 30.12
b 15.65 19.77 21.45
b
SEM 0.10 0.01 0.01 0.12 0.33 0.25 0.44 0.63 0.51
P value 0.011 0.017 0.023 0.018 0.013 0.022 0.067 0.195 0.047 SEM: standard error of the means, P value: probability value.
Means in the same line with different superscripted letters (a, b and c) are significantly different (P < 0.05).
Volatile fatty acids are the major source of energy as they contribute by about 70% to the caloric
requirements of ruminants as cited by Al Khalasi et al. (2010). In general view, the lowest TVFAs was
recorded at 0h, and then increased up to 6h post-feeding (Table 11). The differences of TVFAs at zero
and 3h among treatments were not significant and the corresponding values ranged from 13.83 to
15.65meq/dl and from 18.44 to 19.77meq/dl, respectively. At 6h post-feeding, group R2 showed the
highest (P<0.05) value of TVFAs (22.14 meq/dl) as compared to the other groups (19.68 and 21.45
meq/dl for R1 and R3, respectively). This indicates that the sorghum under the same condition of R2 and
R3 is a good source for producing energy in sheep.
The present results of rumen pH and NH3-N are within the range recorded by Zaki et al. (2015) for
ration contained Sesbania- Sorghum mixture (1:1) + CFM which were from 5.88 to 7.44 for pH and from
13.67 to 33.18 mg/ dl for NH3-N. Also, Avellaneda et al. (2009) reported a significant increase in NH3-N
concentration in rumen liquor in lambs fed guinea grass supplemented with exotic enzymes. The present
results of TVFAs are higher than that reported by Zaki et al. (2015) that was ranged from 4.17 to 7.00
meq/ dl, and these differences may be due to higher CFM intake in the present study and also higher
soluble carbohydrates available for fermentation as a result of increasing the fiberolytic activity in the
rumen. Also, the current results of rumen pH are similar to that recorded for silage of different sorghum
varieties by Mahanta and Pachauri (2005) but higher in NH3-N and TVFAs. However, Al Khalasi et al.
(2010) found no effect for sorghum irrigated with saline water at levels of 3, 6 and 9 dS/m on the rumen
pH that was 6.2 on average.
Kewan et al.
48
It is interesting to notice that higher P content in sorghum of R2 and R3 revealed significantly lower
pH and at the same time, higher TVFAs as compared to the control group and these finding concurs with
the recent study by Wang et al. (2021). Furthermore, lambs fed the control diet that was low in P and N
consumed less food (Table 7), produced less rumen ammonia and microbial protein (as in Tables (5 and
11) so that grew at slower rates than those fed a diet rich in these nutrients (as in Table 7). This finding
was consistent with earlier reports by Scott et al. (1997).
Blood metabolites and element concentration:
Results in Table (12) present blood biochemical and electrolyte components in lambs as influenced by
the experimental rations. Total protein was significantly (P<0.001) higher (6.35g/dl) for lambs fed R2
than that fed R1 or R3 (4.70 and 5.33g/dl, respectively) which were practically equivalent. However,
albumin concentration was significantly (P<0.05) higher for R3 (4.33g/dl) than that in both R1 and R2
being 2.40 and 3.50g/dl, respectively. These results concur with those reported by Shaker et al. (2008)
and also Shaker (2014) who reported that animals fed salt tolerant plants combination of Atriplex
nummularia, Sorghum bicolor and Pearl millet had insignificantly lower mean values of total protein
(4.80 g%) and albumin (7.32g%) in comparison with control ones. The reduction of TP and albumin
concentration in treated animals might be ascribed to the high content of tannins and oxalates in such salt-
tolerant plants where tannins were reported to decrease the digestibility of crude protein (Mahmoud,
2001). Furthermore, higher salt intake might be another motivation to present such decrement in TP and
Alb, levels (Badawy, 1999). According to another perspective, the slight decline in total proteins fraction
could be ascribed to the lower crude protein recorded in ration R1. Shahen et al. (2004) reported a
positive correlation between dietary protein and plasma protein concentration. On the contrary, Mahanta
and Pachauri (2005) presumed that different varieties of sorghum silage did not have any impact on the
concentration of blood metabolites (plasma protein and urea-N) in sheep. In the present study, blood urea-
N and creatinine values followed the same pattern where comparable values were observed for R2 and R3
groups and at the same time they are significantly higher than those in R1. Plasma urea-N reflects the
dietary CP intake, the ratio of dietary CP to ruminally fermentable OM, and also serves as an indicator of
ruminal protein supply. Blood urea-n and creatinine are the two major nitrogenous compounds eventually
excreted by the kidney and accordingly, any change of their concentration would reflect impaired
glomerular filtration and/ or potentially inadequacy of renal tubules (Kaneko et al., 2008). Moreover, urea
is the significant nitrogenous metabolic product of protein catabolism representing over 75% of the non-
protein-N excreted. Otherwise, production is dependent on several non-real variables like a diet regimen
and hepatic synthesis.
A decrease in urea concentration of R1 group could be attributable to the presence of tannins, which
diminish the degradation of the ruminal proteins (Brooke et al., 1997). In accordance, Cook et al. (2008)
detailed that plasma urea nitrogen was brought down in sheep and goats fed high tannins legumes. Pearce
et al. (2008) reported that treatment significantly affected plasma urea concentrations (P< 0.001) where
sheep fed the control diet had significantly higher plasma urea concentrations than their mates fed the
saltbush diet. However, Badawy et al. (2002) found that animals fed fresh saltbush had high urea values
comparing with the control group. Feeding a mixture of Atriplex nummularia, Sorghum bicolor and Pearl
millet forages increased the serum creatinine concentration comparing to the control group in a reverse
trend with that of urea results. Consistently, Badawy et al. (2002) and Shaker et al. (2008) found that
animals fed fresh Atriplex had higher values of creatinine than their counterparts fed on control ration.
This increment in creatinine levels could be a result of anti-nutritional factors (tannin and oxalates) and/
or high salt in such salt-tolerant plants. On the other hand, the high content of salt in such salt-tolerant
forage mixture might be the clue to understanding the increment observed in creatinine level.
Table (12): Blood biochemical and electrolyte components in lambs fed the experimental diets.
Item TP
g/dL
Alb
g/dL
Urea
mg/dl
Cr.
Mg/dl
NH3
µmol/l
Na
mEq/l
K
mEq/l
Ca
mg/dl
P
mg/dl
R1-Control 4.70b 2.40
c 18.00
b 0.36
b 289.8 142 4.35 9.98 9.01
R2 6.35a 4.33
a 26.25
a 0.61
a 374.5 140 6.05 8.88 9.51
R3 5.33b 3.50
b 27.75
a 0.58
a 318.3 138 6.18 8.35 9.66
SEM 0.18 0.22 0.91 0.054 44.63 2.26 0.87 0.60 1.41
P value 0.001 0.028 0.001 0.017 0.428 0.568 0.299 0.202 0.946 TP: total protein, Alb: albumin, Cr: creatinine, NH3: ammonia, Na: sodium, K: potassium, Ca: calcium, P:
phosphorus. SEM: standard error of the means, P value: probability value.
Means in the same line with different superscripted letters (a, b and c) are significantly different (P < 0.05).
Egyptian J. Nutrition and Feeds (2021)
49
Minerals play a vital role in the regulation of body fluids, acid base balance and metabolic processes.
Data in Table (12) show that there are no significant (P>0.05) differences between the experimental
groups regarding the electrolytes under investigation (Na, K, Ca and P). A different pattern of response
has previously been seen in growing lambs fed low P diets which resulted in a fall in plasma P and a rise
in plasma Ca (Scott et al., 1997). Shaker et al. (2008) reported that serum Na+ level significantly
increased in animals fed atriplex. Concerning of K concentration, animals fed salt tolerant forages
mixture had higher mean plasma K concentration value than the control group. In agreement, Badawy et
al. (2002) reported that animals fed atriplex had higher K+
concentration. This pattern of potassium was in
complete harmony with that of sodium.
CONCLUSION
It could be concluded that, both of the sorghum treatments; N120P30 and N100P40 kg/fed; are in the same
nutritive values and similar growth rate for Barki lambs. However, because of higher P drain away to the
land below in case of N100P40 ration so it is recommended for N120P30 to be a better fertilizer rate for the
fodder consumed by the Barki lambs and for its potential to reduce the environmental pollution with the
high level of P compared to the other treatment.
ACKNOWLEDGEMENT
The authors are thankful to Dr. Ibrahim Abou-Amer, Soil Fertility and Microbiology Department,
Water Resources and Desert Soils Division, Desert Research Center (DRC), for assistance in the
agronomy experiment.
REFERENCES
Abdi, H., and L.J. Williams (2010). Tukey’s honestly significant difference (HSD) test. Encyclopedia of
Research Design, 3(1), 1-5.
Aganga, A.A. and M.N. Autlwetse (2000). Utilization of sorghum forage, millet forage, veldt grass and
Buffel grass by Tswana sheep and goats when fed Lablab purpureus L. as protein supplement. Asian-
Aus, J. Anim. Sci., 13 (8): 1127-1132.
Al Khalasi, S.S., O. Mahgoub, I.T. Kadim, W. Al-Marzouqi and S. Al-Rawahi (2010). Health and
performance of Omani sheep fed salt-tolerant sorghum (Sorghum bicolor) forage or Rhodes grass
(Chloris gayana). Small Ruminant Research, 91: 93–102.
Allam, S.M., H.M. El-Shaer, K.M. Youssef, M.A. Ali and S. Abo Bakr (2009). Impact of feeding
biologically treated wheat straw on the production performance of goats in North Sinai. World J.
Agric. Sci., 5(5): 535-543.
Almodares, A., M. Jafarinia and M.R. Hadi (2009). The effects of nitrogen fertilizer on chemical
compositions in corn and sweet sorghum. American-Eurasian J. Agric. Environ. Sci., 6 (4): 441-446.
AOAC (1997). Association of Official Analytical Chemists, Official Methods of Analysis, 16th
ed.
AOAC, Arlington, VA, USA.
AOAC (2000). Association of Official Analytical Chemists, Official Methods of Analysis, 17th Ed.
Arlington, VA, USA.
Astuti, D., B. Suhartanto, N. Umami and A. Irawan (2019). Productivity, Nutrient Composition, and
Hydrocyanic Acid Concentration of Super-2 Forage Sorghum at Different NPK Levels and Planting
Spaces. Tropical Animal Science Journal, 42(3):189-195.
Avellaneda J.H., J.M. Pinos-Rodriguez, S.S. Gonzalez, R. Barcenac, M. Hernandezc, A. Cobos, O.
Hernandez and D. Montanez (2009). Effects of exogenous fibrolytic enzymes on ruminal fermentation
and digestion of guinea grass hay. Animal Feed Science and Technology, 149: 70-77.
Badawy, M. S. M. (1999). Digestive function and heat regulation in Saidi sheep. M. Sc. Thesis, Assiut
University, Egypt.
Kewan et al.
50
Badawy, M. T., H.A. Gawish and A.A. Younis (2002). Some physiological responses of growing Barki
lambs and Baladi kids fed natural desert shrubs. International Symposium on Optimum Resources
Utilization in Salt - Affect Ecosystems in Arid and Semi- arid Regions. Cairo, 8- 11, April, 496- 503.
Borhami, E.B., A.Z. Salem, W.G. Fahmy and M.H.M. Yacout (1998). Effect of berseem and ammoniated
corn stalks residues supplementation on performance of lactating goats. Proceedings of an
International Conference on Odder, Water Quality Nutrient Management and Socioeconomic Issues.
Lowa State Univ. of Sci & Tech. July 19-22. Vol. 11:531.
Brooke, I. M., C.W. Holmes and G.F. Wilson (1997). Effect of Mimosa bark extracts containing
condensed tannins on rumen metabolism in sheep and milk production by grazing cows. Proceedings-
New Zealand Society of Anim. Prod., 57: 126.
Chakravarthi, M.K., Y. R. Reddy, K. S. Rao, A. Ravi, B. Punyakumari and B. Ekambaram (2017). A
study on nutritive value and chemical composition of Sorghum fodder. International Journal of
Science, Environment and Technology, 6 (1): 104 – 109.
Conn, E.E. (1993). b-Glycosidases in plants. Substrate specificity. In: A. Esen (Ed.) b-Glucosidases:
Biochemistry and Molecular Biology, ACS Symposium Series 533. American Chemical Society,
Washington, DC, pp. 15–26.
Cook, R. W., C.B. Scott and F.S. Hartmann (2008). Short-term Mesquite pod consumption by goats does
not induce toxicity. Rangeland Ecology & Management, 61 (5): 566– 570.
Czerkawski J.W. (1985). An introduction to rumen studies. Pergamon Press, Oxford, UK.
Das, S. K., K. L. Sharma, B. R. Singh, C. P. Rao, K. Srinivas, and M. N. Reddy (1996). Availability of
desorbed phosphorus and internal phosphorus requirement by sorghum in an Alfisol. J. India Soc. Soil
Sci., 44(3) 427-433.
Demeyer, D., M. De Meulemeester, K. De Graeve and B.W. Gupta (1988). Effect of fungal treatment on
nutritive value of straw. Med. Fac. Landbouww. Rijksuniv. Gent, 53: 1811–1819.
Fahmy, A.A, K.M Yousef and H.M. El Shaer (2010). Intake and nutritive value of some salt tolerant
fodder grasses for sheep under saline conditions of South Sinai, Egypt. J. Small Rum. Res., 91:110-
115.
Getachew G., Makkar H.P.S. and K. Becker (2002). Tropical browses: content of phenolic compounds, in
vitro gas production and stoichiometric relationship between short chain fatty acids and in vitro gas
production. J. Agr. Sci., 139: 341–352.
Getachew, G, D. H. Putnam, C. M. De Ben and E. J. De Peters (2016). Potential of Sorghum as an
alternative to corn forage. American Journal of Plant Sciences,7: 1106-1121.
Gorz, H.J., W.L. Haag, J.E. Specht and F.A. Haskins (1977). Assay of p-Hydroxybenzaldehyde as a
measure of Hydrocyanic Acid potential in Sorghums. Crop Science (July-August) 17.
Helal H. G., E.Y. Eid, M.S. Nassar, H.S. Badawy and H.M. El Shaer (2018). Comparative nutritional
studies of ewes and does fed salt tolerant plants under desert condition. Nature and Sci., 16 (6):62-72.
Hernandez, R., S.S. Gonzalez, J.M. Pinos-Rodrigues, M.A. Ortega, A. Hernandez, G. Bueno and M.
Cobos (2009). Effect of yeast culture on nitrogen balance and digestion in lambs fed early and mature
orchard grass. J. Appl. Anim. Res., 32: 53- 56.
Heseen, E. M., S. Mervat Hassan, M. M. Azza Badr, Sh. Fatma Ismail and A. Fatma Abd-Elsalam (2017).
Effect of using different fertilizers sources on forage sorghum yield, digestibility and energy
parameters by in vitro gas test production. Annals Agric. Sci., Moshtohor, 55(4): 805 –816.
Hussein, M.M. and M.M. Sabbour (2014). Effect of irrigation intervals and nitrogen fertilizer on yield
and water use efficiency of sorghum fodder. Int. J. Sci. and Res., 3 (11): 404-410.
Kaneko, J.J., J.W. Harvey and M.L. Bruss (2008). Clinical Biochemistry of domestic Animals. 6th
ed. San
Diego: Academic Press. 904p.
Karsil, M.A. and J.R. Russell (2001). Effect of some dietary factors on ruminal microbial protein
synthesis. J. Veterinary and Animal Science, 25: 681-685.
Karthika, N and R. Kalpana (2017). HCN content and forage yield of multi-cut forage sorghum under
different organic manures and nitrogen levels. Chem. Sci. Rev. Lett., 6(23): 1659-1663.

Egyptian J. Nutrition and Feeds (2021)
51
Kearl, L.C. (1982). Nutrients requirements in developing countries. International Feedstuffs Institute Utah
Agric. Exp. Stat.; Utah State University, Logan; USA.
Kewan, K. Z. A., F.A. Salem, Ahllam R. Abdou, H.M. El-Sayed, S.S.S. Eisa and E.A. Zaki (2016).
Upgrading nutritional value of moringa stalks by using Trichoderma reesei, Cellulomonas cellulasea
and Saccharomyces cerevisiae in solid state fermentation system. J. Environ. Sci., 33(2):213-240.
Kewan, K.Z., A.A. Elkhouly, A.M. Negm and A. Javadi (2019). Feedstock values of some common
fodder halophytes in the Egyptian desert. 22nd
International Water Technology Conference, IWTC22
Ismailia, 12-13 September 2019.
Kewan, K.Z., Abeer M. EL-Essawy, Safinaz, M. Shawket and H.M. El-Shaer (2011). Effect of energy
sources supplement for camels fed berseem hay on: 2. Metabolism of water and some mineral
elements. Egypt. J. Nutr. Feeds, 14(1):63-75.
Khan, S.H., A.G. Khan, M. Sarwar and A. Azim (2007). Effect of maturity on production efficiency,
nutritive value and in situ nutrients digestibility of three cereal fodders. International Journal of
Agricultural Research, 2: 900-909.
Khanum, S.A., H.N. Hussain, M. Hussain and M. Ishaq (2010). Digestibility studies in sheep fed
sorghum, sesbania and various grasses grown on medium saline lands. Small Ruminant Research, 91:
63–68.
Khattari, S. and A. Tell (1988). Response of wheat varieties to P fertilizers under a wide range of rainfall.
In: “Challenges in Dryland Agriculture”, P.W. Unger, T.V. Sneed, W.R. Jordan and R. Jensen (Ed.),
pp. 429–31, Proc. Int. Conf. Dryland Farming, Amarillo, Texas, U.S.A.
Korkmaz, K., H. Ibrikci, E. Karnez, G. Buyuk, J. Ryan, A. Ulger and H. Oguz (2009). Phosphorus use
efficiency of wheat genotypes grown in calcareous soils. Journal of Plant Nutrition, 32(12), 2094-
2106.
Louvandini, H. and D.M.S.S. Vitti (2007). Phosphorus kinetics using mathematical models for adult
sheep. Pesquisa Agropecuaria Brasileira, 42: 1467–1472.
Mahanta, S.K. and V. C. Pachauri (2005). Nutritional Evaluation of Two Promising Varieties of Forage
Sorghum in Sheep Fed as Silage. Asian-Aust. J. Anim. Sci., Vol 18, No. 12 : 1715-1720.
Mahmoud, H. A. (2001). Physiological and nutritional studies on sheep feeding certain halophytic plants
in Sinai. M. Sc. Thesis, Fac. of Sci., Cairo University, Giza, Egypt.
Majak, W., R.E. McDiarmid, J.W., Hall and K.J. Cheng (1990). Factors that determine rates of
Cyanogenesis in Bovine ruminal fluid in vitro. Journal of Animal Science, 68: 1648-1655.
Makkar, H.P.S., P. Siddhuraju and K. Becker (2007). Plant secondary metabolites. Humana Press,
Totowa, New Jersey. pp130.
Masters, D.G., S.E. Benes and H.C. Norman (2007). Biosaline agriculture for forage and livestock
production. Rev. Agric. Ecosyst. Environ, 119: 234–248.
Meena, A.M, P. Singh and P. Kanwar (2012). Effect of nitrogen levels on yield and quality of Sorghum
bicolor (L.) Moench, sorghum genotypes. Forage Res., 37(4): 238-240.
Menke, K. H. and H. Steingass (1988). Estimation of the energetic feed value obtained from chemical
analysis and in vitro gas production using rumen fluid. Anim. Res. Dev., 28:7-12.
Mostafa, M.R.M, S.B. Mehany, Safaa N. Abd El-Azim and Soheur J. Latif (2010). Effect of using three
varieties of Sorghum bicolor stover silages on performance of growing and fattening lambs. Egyptian
J. Nutr. Feeds, 13(2):271-283.
NRC (1985). National Research Council. Nutrient Requirements of Sheep. 6th
ed. National Academy
Press, Washington, DC.
Obour, A., J.D. Holman and D.B. Mengel (2018). Nitrogen application effects on forage sorghum
biomass production and nitrates. Kansas Agricultural Experiment Station Research Reports, 4(5): 4.
Pearce, K. L., D.W. Pethick and D.G. Masters (2008). The effect of ingesting a saltbush and barley ration
on the carcass and eating quality of sheep meat. Animal, 2 (3): 479– 490.
Kewan et al.
52
Pholsen S. and A. Suksri (2004). Effect of organic amendment and chemical fertilizer on growth, yield
and fodder quality of a forage sorghum (Sorghum bicolor (L.) moench). Pakistan Journal of
Biological Sciences, 7 (4): 651-657.
Piri, A., V. Palangi and P. Eivazi (2012). The determination of nutritive value of alhagi by in situ and gas
production techniques. European Journal of Experimental Biology, 2 (3):846-849.
Preston, T.R. (1995). Biological and Chemical Analytical Methods. Tropical animal feeding: a manual for
research workers. Rome: FAO (1995): 191-264.
Rashid, M. and M. Iqbal (2011). Response of sorghum (Sorghum bicolor L.) fodder to phosphorus
fertilizer on torripsamment soil. J. Animal Plant Sci., 21(2): 220-225.
Sanchez, A.C., P.K. Subudhi, D.T. Rosenow and H.T. Jguyen (2002). Mapping QTLs associated with
drought resistance in sorghum (Sorghum bicolor L. Moench). Plant Mol. Biol., 48: 713–726.
Sarfraz, M., A. Nisar, U. Farooq, A. Azhar and H. Khalid (2012). Evaluation of Sorghum varieties/lines
for hydrocynic acid and crude protein contents. J. Agric. Res., 50(1): 39-47.
SAS (2002). Institute. SAS/STAT User’s Guide: Version 8.2. SAS Institute Inc., Cary, NC.
Scott, D., N. Loveridge, L. Nicodemo, W. Buchan, J. Milne, A. Duncan, P. Nicol and S. P. Robins
(1997). Effect of diets varying in nitrogen or phosphorus content on indicators of bone growth in
lambs. Experimental Physiology, 82: 193-202.
Shahen, G. F., A.A. Zaki and H.M. Yousef (2004). Effect of feeding level on growth nutrient digestibility
and feed efficiency for buffalo calves. Egyptian Journal of Nutrition and Feeds, 7: 11.
Shaker, Y.M. (2014). Live Body weight changes and physiological performance of Barki sheep fed salt
tolerant fodder crops under the arid conditions of Southern Sinai, Egypt. J. Am. Sci., 10(2s):78-88.
Shaker, Y. M.; S.S. Abou El-Ezz and A.L. Hashem (2008). Physiological performance of Barki male
lambs fed halophytes under semi-arid conditions. J. Agric. Sci. Mansoura Univ., 33 (9): 6393- 6408.
Sher, A., B. Lorenzo, A. Muhammad, M. Abdul and K. Shuaib (2011) Late harvest associated with P and
S fertilization enhances yield and quality of forage sorghum (Sorghum bicolor L. Moench), grown as a
rainfed crop in Pakistan. African Journal of Agricultural Research, 6(29): 6232-6239.
Sheridan, K.P., J.F. Holland, J.A. Thompson and B.A. Hamilton (2003). Growth rates of lambs and adult
sheep grazing forage sorghums and Lucerne. Aust. J. Exp. Agric. Anim. Husb., 12: 144–145.
Singh, H., S. Pushpendra and H.K. Sumerhya (2008). Effect of fertility leves on fodder yield and HCN
content of fodder sorghum (Sorghum bicolor L. Moench) genotypes. Inter. J. Trop. Agri., 26: 417-420.
Singh, S., B., B.V. Bhat, G.P. Shukla, D. Gaharana and U.Y. Anele (2017). Nutritional evaluation of
different varieties of sorghum stovers in sheep. Animal Feed Science and Technology, 227: 42-51.
Talpada, M.M., G.B. Vekariya, G.S. Sutaria and V.D. Vora (2016). Response of forage sorghum (cv.
CSV 21F) to seed rate and fertilizer level. Indian J. Dryland Agric. Res. & Dev., 2016 31(1): 77-82
Thiex, Nancy J. (2002). Prussic Acid Poisoning. Fact sheets, SDSU Extention, South Dakota State
University Open PRAIRIE: Open Public Research Access Institutional Repository and Information
Exchange. 3-1-2002.
Thota, P., S. A. Chandra, M. Mahender and D.B.V. Ramana (2017). Effect of probiotic supplementation
on nutrient digestibilities, growth performance and enteric methane emissions in Deccani ram lambs.
Journal of Animal Research, Vol.7 (6) :1009-1017.
VDLUFA (2007). Verband deutscher landwirtschaftlicher Untersu-chungs- und Forschungsanstalten.
(2007). Handbuch der Landwirtschaftlichen Versuchs- und Untersuchungs-methodik (VDLUFA-
Methodenbuch), Bd. III: Die chemische Untersuchung von Futtermitteln. VDLUFA-Verlag,
Darmstadt, Germany.
Udayakumar, S. and R. Santhi (2017). Impact of artificial soil fertility gradient strategy on soil fertility,
nutrient uptake and fodder yield of Sorghum. Int. J. Curr. Microbiol. App.Sci., 6(3): 938-944.
Wang, T., J. Jiao, H. Wang, A. A. Degen, N. G. Shanshan Li, Y. Bai and Z. Shang (2021). The effects of
supplementing sweet sorghum with grapeseeds on dry matter intake, average daily gain, feed
digestibility and rumen parameters and microbiota in lambs. Animal Feed Science and Technology,
272: 114750.

Egyptian J. Nutrition and Feeds (2021)
53
Ward, J. D., D. D. Redfearn, M. E. Mc Cormick and G. J. Cuomo (2001). Chemical composition, ensiling
characteristics and apparent digestibility of summer annual forages in a subtropical double cropping
system with annual rye grass. J. Dairy Sci., 84:177-182.
Wheeler, J.L., D.A. Hedges, K.A. Archer and B.A. Hamilton (1980). Effect of nitrogen, sulphur and
phosphorus fertilizer on the production, mineral content and cyanide potential of forage sorghum.
Aust. J. Exp. Agric. Anim. Husbandry, 20: 330-338.
Zaki, M. A., A. A. Osman, Fathia A. Ibrahim and E. S. Soliman (2015). Effect of using Sesbania sesban
and its mixtures with some Summer fresh grasses on lambs productive performance in new reclaimed
soil. Journal of Animal, Poultry and Fish Production Suez Canal University, (3): 7-16.
عضوي عهى جودة عهف انسورجى وو انحلا انبزق انسد غز تأثز انت
خبند س انعببد كوا1
، أبزاهى محمد خطبة2
، عبدل محمد عبد انواحد1
، اسبيه أبو انعش بم3
. يصز -انقبهزة -انطزت -يزكش بحوث انصحزاء -قسى تغذت انحوا واندواج 1 .يصز -يطزوح -جبيعت يطزوح -تانصحزاوت وانبئ كهت انشراعت -وانسك انحواالإتبج قسى 2 .يصز -يوفت -شب انكوو -جبيعت انوفت -انحوا، كهت انشراعت الإتبجقسى 3
ف الأساض ( Pو N)عضى انأصشج انذساعت انحبنت ف حضشبخ نخحذذ يذي اعخضببت صىدة انغىسصى لاعخخذاو انغبد غش
نخضشبت الأون نخقى عىسصى انعهف انغذ بخغع حشكببث . ابعذ انخغزت عه هزا انغىسصى أداء انحىاحقى وببنخبن انغخصهحت حذزب
كضى خشوص/ فذا 120.6و 100.5، 80.4حخكى ي رلارت يغخىبث ي عبد خشاث ايىىو ويزههب ي عبد عىبش فىعفبث )
عهف كحصىل عىسصى ان/ فذا( ف حصى انقطبعبث انعشىائت بزلاد يكشساث ببعخخذاو بثكضى فىعف 40.3و 30.2، 20.2يقببم
هطبقت انصبفت نخبئش انهضى انىضع نهبدة انضبفت وكزنك انقت انحغىبت اخخببس. أظهشث خبئش حضشبت انضساعت يع الأخز ف الاعخببس
ب كعهف نحلا حى حقه حذنخضشبت انزبت خفز ان N100P40و N120P30هب خ أه ك حششح يعبيه انعبيهتحكهفت يع انىصهت نهى
عشىائت. كب ان كبيمحلا / يعبيهت( ف حصى 5) مح 15ببعخخذاو وحى رنك (. N80P20) انقبستانبيت ببنقبست يع يضىعت قانبش
أشهش. حى حغزت صع انحىابث بخهط عهف يشكض نخغطت 5 حىان وعشهب كضى 0.29± 22.83ف بذات انخضشبت وص انحلا يخىعط
هضىعبث انقذيت نانعلائق انخضشبت وكبج. انغىسصى ف كم يعبيهت حخ انشبعحقذى يع( 1982)كشل ٪ ي يخطهببث ىهب70
كبنخبن:ه ىيب 85خلال زلاد ان
)عهقت انقبست(. كضى فىعفىس/ فذا 20.2كضى خشوص يع 80.4 بـ انعهقت الأون: عهف يشكض + عىسصى يغذ
(.1كضى فىعفىس/ فذا )عهقت و 40.3كضى خشوص يع 100.5 انعهقت انزبت: عهف يشكض + عىسصى يغذ بـ
.(2)عهقت و / فذاكضى فىعفىس 30.2كضى خشوص يع 120.6 انعهقت انزبنزت: عهف يشكض + عىسصى يغذ بـ
وك إضبص انخبئش ف اح:
عه انخىان. اعخههكج انحىابث ف 2، و1عه عهقت انقبست ، وصى نهحلا انغزاة 192و 185و 158انىي انىكب يخىعط -
( عه P <0.05) ب ىيع ا حأرش أظهشث انعبيلاث. انقبستيضىعت خهك ف يقبست ب انغىسصىكت أعه ي 2و ، 1و انضىعخ
هضىيت انكهت اننهبدة صبفت أو انشكببث غبت ححىم أفضم 2وأو 1و، حذ كب نلأغبو انخ حى حغزخهب عه غزائخحىم انان كفبءة
هضىونابب كبج يضىعت انقبست ه الأفضم ف كفبءة ححىم انبشوح لإخبس كهىصشاو ى ورنك يقبست بضىعت انقبست،
يقبست ببنضىعبث الأخشي.
، ونك انقبستيضىعت ع 2وو 1ويضىعبث ف أعه انبدة انضبفت وانبشوح انخبو والأنبف انخبو هضى كم ي قى يعبيمكبج -
أعه قت غزائت 2، و1انعبيهت و عهقخأظهشث .يغخخهص الارش وانكشبىهذساث انزائبت هضى يعىب عه ا شحأرك نهعبيلاث نى
يقبست 1و ف خشوص يحخضض (P<0.05) . نىحع أعهع عهقت انقبست ف صىسة يشكببث كهت يهضىيت وبشوح يهضىو
أعه كت بأظهشح 2، و1، إلا أ يضىعخ انعبيهت وانحخضض انكبنغىو تكحشببهب ف صع انحلا ظهشثا ،ضىعت انقبستبـ
و 172و 144بقذاس فقذ انبء غش انحغىط ان تأدث انعلائق انزلار ،انأكىل وانحخضض ع حهك ف يضىعت انقبستىعفىس انف ي
عه انخىان. 2، و1بث انقبست ، ونضىع 176
عبعبث ي 6، 3صفش، عذ انضىعبث الأخشي ع يعىبأعه ف يضىعت انقبستنكشػ غبئم اكبج قت انشقى انهذسوص ن -
أعه 2وبب أظهشث يضىعت ،انخغزت يقبست ببنضىعبث الأخشي يعبعبث 6و 3 حشكض أعه نلأيىب عذ 1أظهشث و. انخغزت
22.14) ي انخغزت بثعبع 6نخشكض الأحبض انذهت انطبسة بعذ أعه قت 1وقت عذ صفش بعذ انخغزت. أظهشث انضىعت
عه انخىان(.يم 100يههكبفئ / 21.45و 19.68( يقبست ببنضىعبث الأخشي )يم100/ كبفئههي
هب يع عذ حقانغزائت و تفظ انقبخش عهب عهف عىسصى كضى / فذا N120P30 ، N100P40انخغذ يعبيهخ ك اعخخبس أ
انعهقت ف حبنت ف انشود وانبىل انفىعفىسفقذ ذل ى يبرم ونك بغبب اسحفبع يعانعهف انشكض كعهقت نهحلا انبيت خش عهب
انخ و N120P30انعبيهت انحخىت عه عىسصى )انعهقت الاخشي نزنك كب أ ىص ببعخخذاو N100P40 انعبيهتانحخىت عه عىسصى
ب نه انبيتهحلا نكغزاء صذ (أقم فقذا نهفىعفىس ه حذ ي حهىد انبئت ببنفىعفىس. وأض