impact of hot and cold aisle - facilitiesnet · impact of hot and cold aisle containment on data...
TRANSCRIPT

Impact of Hot and Cold Aisle Containment on Data Center Temperature and Efficiency
Revision 2
by John Niemann, Kevin Brown, and Victor Avelar
Introduction 2
Efficiency benefits of containment
2
Cold-aisle containment 3
Hot-aisle containment 4
Effect of containment on the work environment
5
Analysis of CACS and HACS 6
Fire suppression considerations
11
Conclusion 12
Resources 13
Appendix 14
Click on a section to jump to it Contents
White Paper 135
Both hot-air and cold-air containment can improve the predictability and efficiency of traditional data center cooling systems. While both approaches minimize the mixing of hot and cold air, there are practical differenc-es in implementation and operation that have signifi-cant consequences on work environment conditions, PUE, and economizer mode hours. The choice of hot-aisle containment over cold-aisle containment can save 43% in annual cooling system energy cost, correspond-ing to a 15% reduction in annualized PUE. This paper examines both methodologies and highlights the reasons why hot-aisle containment emerges as the preferred best practice for new data centers.
Executive summary>
white papers are now part of the Schneider Electric white paper libraryproduced by Schneider Electric’s Data Center Science Center [email protected]

Impact of Hot and Cold Aisle Containment on Data Center Temperature and Efficiency
Schneider Electric – Data Center Science Center White Paper 135 Rev 2 2
High energy costs and accelerated energy consumption rates have forced data center professionals to consider hot-air and cold-air containment strategies. According to Bruce Myatt of EYP Mission Critical, the separation of hot and cold air "is one of the most promising energy-efficiency measures available to new and legacy data centers today” (Mission Critical, Fall 2007). In addition to energy efficiency, containment allows uniform IT inlet temperatures and eliminates hot spots typically found in traditional uncontained data centers. While hot-aisle containment is the preferred solution in all new installations and many retrofit raised floor installations, it may be difficult or expensive to implement due to low headroom or no accessible dropped ceiling plenum. Cold-aisle containment, although not optimal, may be the best feasible option in these cases. Both hot-aisle and cold-aisle containment provide significant energy savings over traditional uncontained configurations. This paper analyzes and quantifies the energy consumption of both containment methods and concludes that hot-aisle containment can provide 43% cooling system energy savings over cold-aisle containment due mainly to increased economizer mode hours. It also concludes that new data centers designs should always use or provision for hot-aisle containment. The containment of hot or cold air in a data center results in the following efficiency benefits. It is important to note that a hot-aisle / cold-aisle row layout1 is a prerequisite for either type of aisle containment. • Cooling systems can be set to a higher supply temperature (thereby saving ener-
gy and increasing cooling capacity) and still supply the load with safe operating temperatures. The temperature of the uncontained perimeter cooling systems is set much lower (i.e. approx 55°F/13°C) than required by IT equipment, in order to prevent hot spots. Hot spots occur when heat is picked up by the cold air as it makes its way from the cooling unit to the front of the racks. Containment allows for increased cold air supply temperatures and the warmest possible return air back to the cooling unit. The benefit of higher return temperature to the cooling unit is better heat exchange across the cooling coil, increased cooling capacity, and overall higher efficiency. This effect holds true for virtually all air conditioning equipment. Some equipment may have limits on the maximum return temperature it can handle, but, in general, all cooling systems yield higher capacities with warmer return air.
• Elimination of hot spots. Contaiment allows cooling unit supply air to reach the front of IT equipment without mixing with hot air. This means that the temperature of the supply air at the cooling unit is the same as the IT inlet air temperature – i.e., uniform IT inlet air temperatures. When no mixing occurs, the supply air temperature can be increased without risk of hot spots while still gaining economizer mode hours.
• Economizer mode hours are increased. When outdoor temperature is lower than indoor temperature, the cooling system compressors don’t need to work to reject heat to the outdoors2. Increasing the set point temperature on cooling systems results in a larger number of hours that the cooling system can turn off its compressors and save energy.3 c
1 A rack layout where a row of racks is positioned with the rack fronts facing the rack fronts of the
adjacent row. This layout forms alternating hot and cold aisles. 2 The difference between outdoor and indoor temperature must be large enough to account for ineffi-
ciencies in heat exchangers, imperfect insulation, and other losses. 3 Set points may be constrained in building-wide cooling systems shared by the data center
Introduction
Efficiency benefits of containment
> What allows more economizer hours? The basic function of a chiller is to remove heat energy from a data center by compressing and expanding a refrigerant to keep chilled water at a set supply temperature, typically 45°F/7°C. When the outdoor temperature is about 19°F/11°C colder than the chilled water temperature, the chiller can be turned off. The cooling tower now bypasses the chiller and removes the heat directly from the data center. Increasing the chilled water supply temperature increases the number of hours that the chiller can be turned off (economizer mode hours). For example, there may be 1000 hours per year when the outdoor temperature is at least 19°F/11°C below the 45°F/7°C chilled water temperature. But if the chilled water is increased to 55°F/13°C, the economizer mode hours increase to 3,700.

Impact of Hot and Cold Aisle Containment on Data Center Temperature and Efficiency
Schneider Electric – Data Center Science Center White Paper 135 Rev 2 3
• Humidification / dehumidification costs are reduced. By eliminating mixing between hot and cold air, the cooling system’s supply air temperatures can be increased, allow-ing the cooling system to operate above the dewpoint temperature. When supplying air above the dewpoint, no humidity is removed from the air. If no humidity is removed, adding humidity is not required, saving energy and water.
• Better overall physical infrastructure utilization, which enables right-sizing – which, in turn, results in equipment running at higher efficiencies. Larger over-sized equipment experiences larger fixed losses4 than right-sized equipment. However, oversizing is necessary for traditional cooling because extra fan power is required both to overcome underfloor obstructions and to pressurize the raised-floor plenum.
A cold-aisle containment system (CACS) encloses the cold aisle, allowing the rest of the data center to become a large hot-air return plenum. By containing the cold aisle, the hot and cold air streams are separated. Note that this containment method requires that the rows of racks be set up in a consistent hot-aisle / cold-aisle arrangement. Figure 1 shows the basic principle of cold-air containment in a data center with perimeter cooling units and a raised floor. Deploying CACS in this type of data center is accomplished by enclosing the tops and ends of the cold aisles, making it a convenient retrofit for many existing data centers. For further guidance on this topic, see White Paper 153, Implementing Hot and Cold Air Containment in Existing Data Centers. Some homegrown solutions are being deployed where data center operators are taking various types of plastic curtain material suspended from the ceiling to enclose the cold aisle (Figure 2). Some vendors offer ceiling panels and end doors that mount to adjoining racks to help separate cold aisles from the warm air circulating in the room.
HOT air freein the room
Cold aisleCooling
unit
Cooling unit
4 Fixed loss – also called no-load, fixed, shunt, or tare loss – is a constant loss that is independent of
load. A constant speed air conditioner fan is an example of fixed loss because it runs at the same speed all the time, regardless of load.
Figure 2 Example of a “homegrown” cold-aisle containment system
Cold-aisle containment
Figure 1 Cold-aisle containment system (CACS) deployed with a room-based cooling approach
Plastic curtains suspended fromceiling at ends of
cold aisle
Plastic curtains suspended fromceiling at ends of
cold aisle
Raised floorwith perforated tiles
for cold air distribution
Raised floorwith perforated tiles
for cold air distribution
Implementing Hot and Cold Air Containment in Existing Data Centers
Link to resource White Paper 153
Impact of Hot and Cold Aisle Containment on Data Center Temperature and Efficiency
Schneider Electric – Data Center Science Center White Paper 135 Rev 2 4
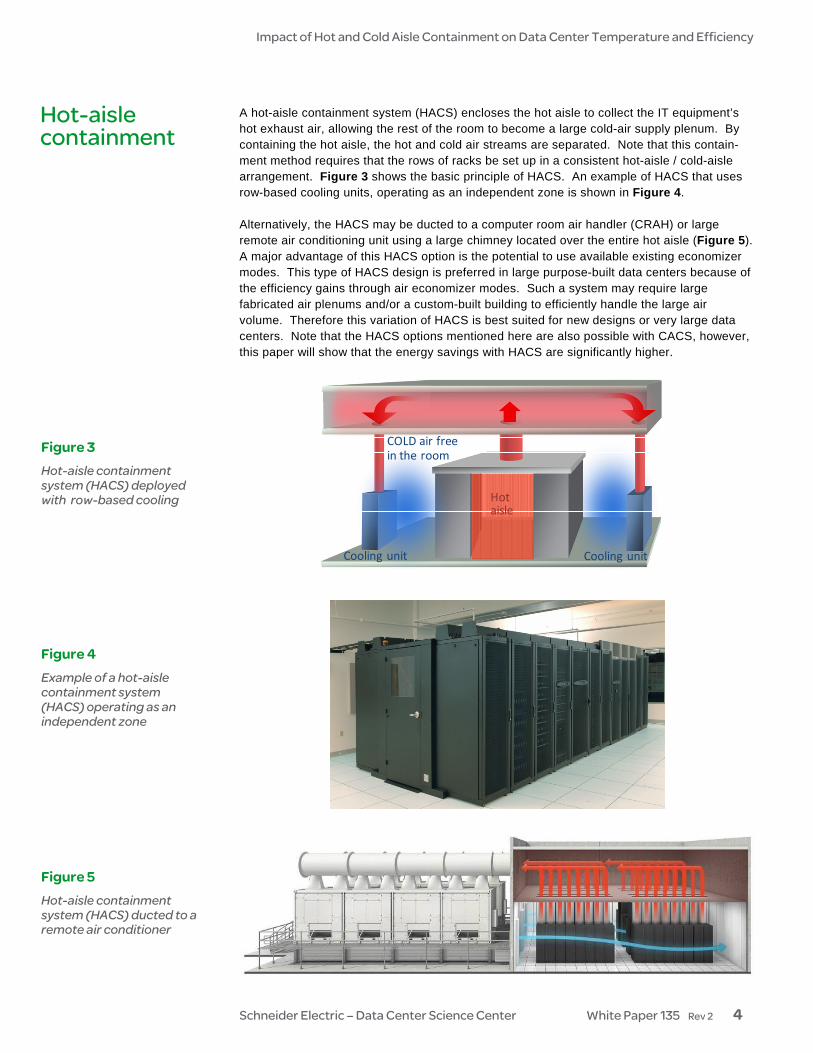
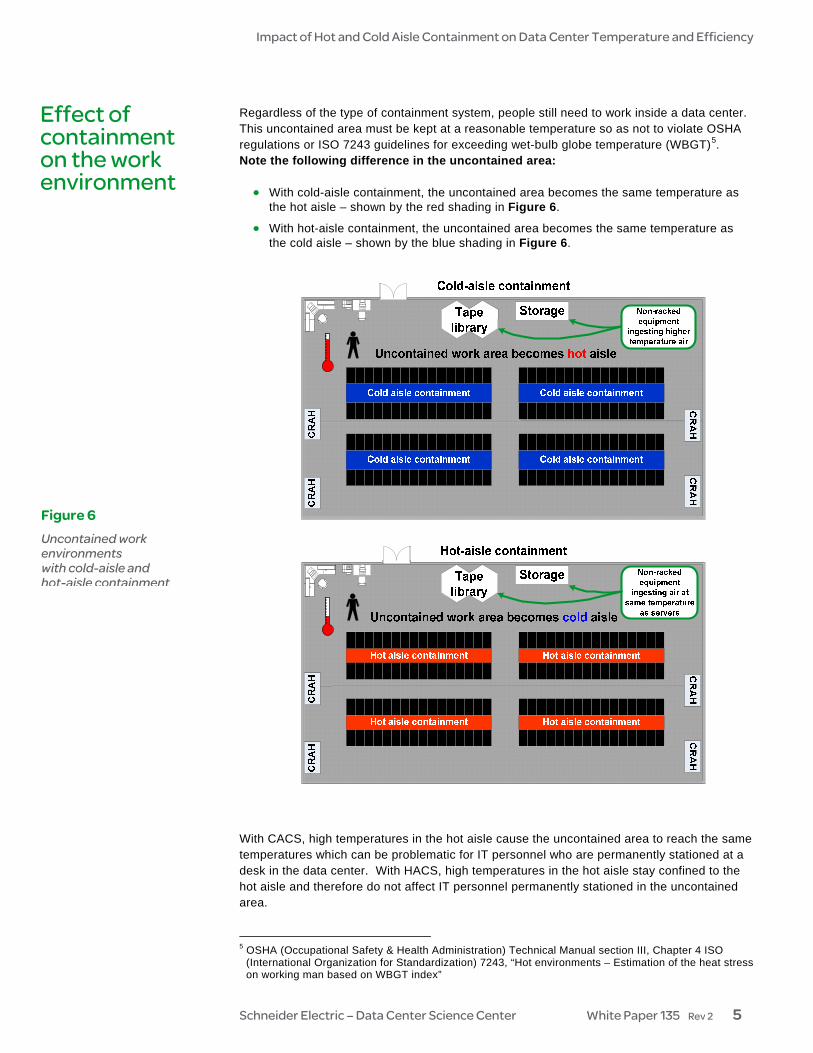
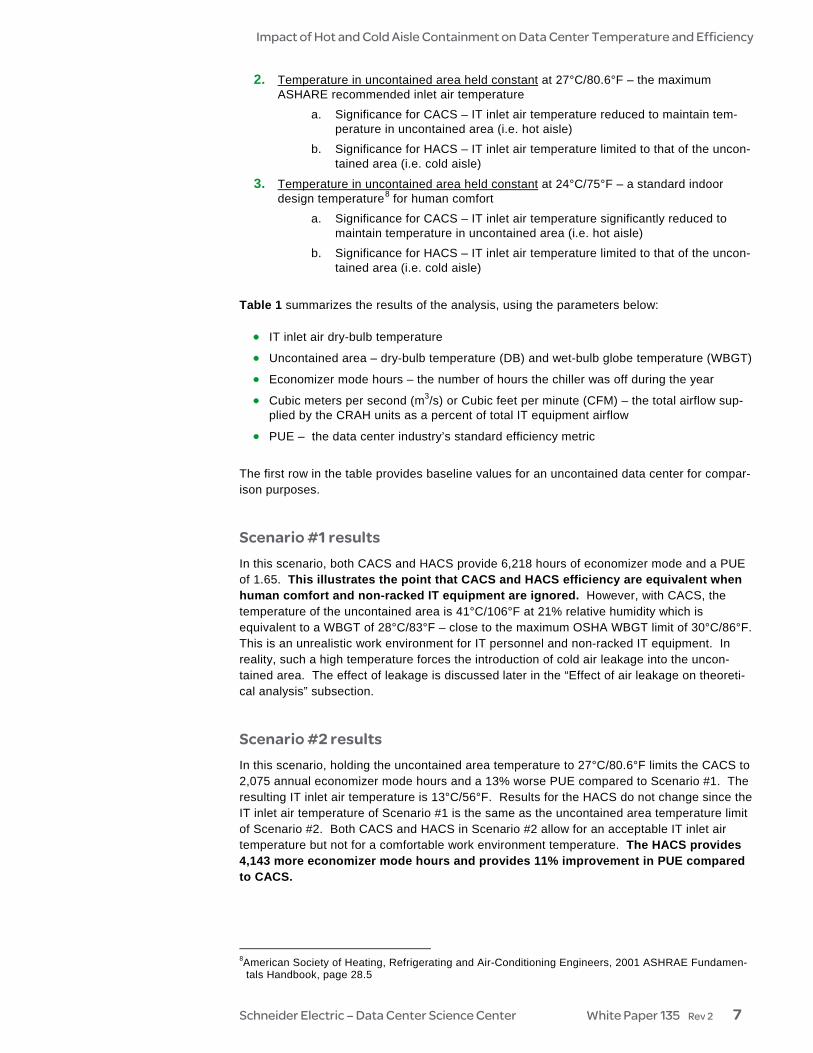
A hot-aisle containment system (HACS) encloses the hot aisle to collect the IT equipment’s hot exhaust air, allowing the rest of the room to become a large cold-air supply plenum. By containing the hot aisle, the hot and cold air streams are separated. Note that this contain-ment method requires that the rows of racks be set up in a consistent hot-aisle / cold-aisle arrangement. Figure 3 shows the basic principle of HACS. An example of HACS that uses row-based cooling units, operating as an independent zone is shown in Figure 4. Alternatively, the HACS may be ducted to a computer room air handler (CRAH) or large remote air conditioning unit using a large chimney located over the entire hot aisle (Figure 5). A major advantage of this HACS option is the potential to use available existing economizer modes. This type of HACS design is preferred in large purpose-built data centers because of the efficiency gains through air economizer modes. Such a system may require large fabricated air plenums and/or a custom-built building to efficiently handle the large air volume. Therefore this variation of HACS is best suited for new designs or very large data centers. Note that the HACS options mentioned here are also possible with CACS, however, this paper will show that the energy savings with HACS are significantly higher.
COLD air free in the room
Cooling unit Cooling unit
Hot aisle
Hot-aisle containment
Figure 5 Hot-aisle containment system (HACS) ducted to a remote air conditioner
Figure 3 Hot-aisle containment system (HACS) deployed with row-based cooling
Figure 4 Example of a hot-aisle containment system (HACS) operating as an independent zone
Impact of Hot and Cold Aisle Containment on Data Center Temperature and Efficiency
Schneider Electric – Data Center Science Center White Paper 135 Rev 2 5
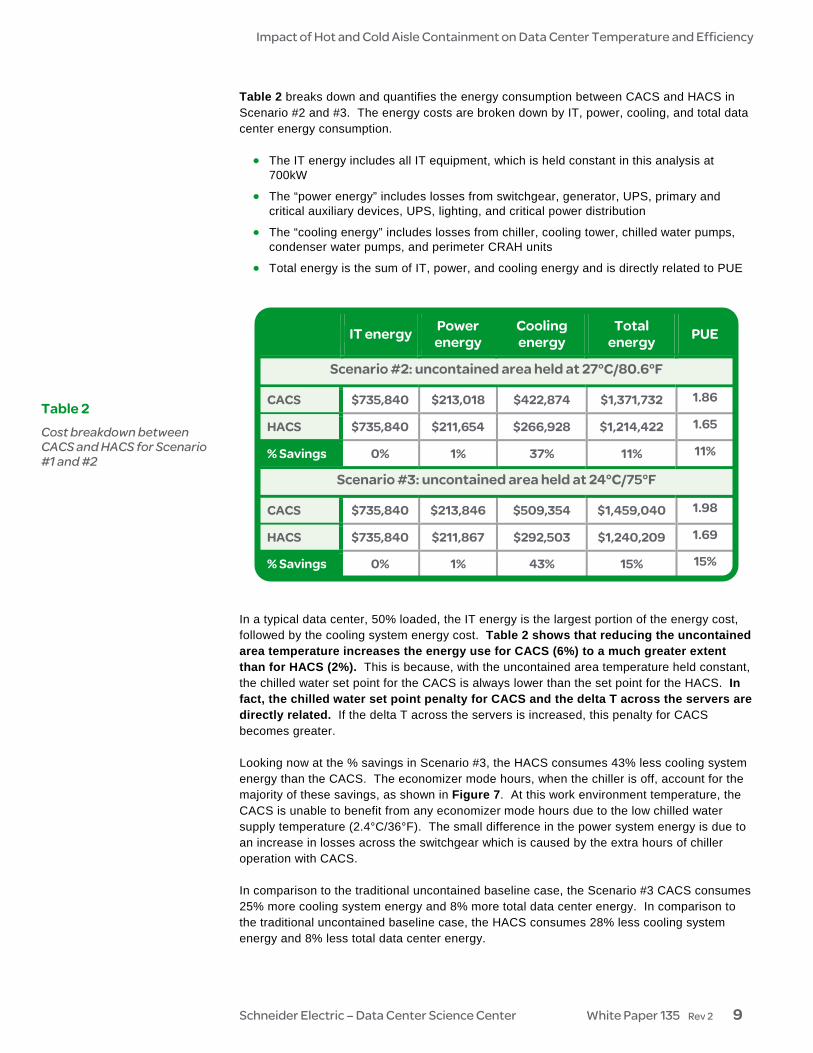
Regardless of the type of containment system, people still need to work inside a data center. This uncontained area must be kept at a reasonable temperature so as not to violate OSHA regulations or ISO 7243 guidelines for exceeding wet-bulb globe temperature (WBGT)5. Note the following difference in the uncontained area: • With cold-aisle containment, the uncontained area becomes the same temperature as
the hot aisle – shown by the red shading in Figure 6.
• With hot-aisle containment, the uncontained area becomes the same temperature as the cold aisle – shown by the blue shading in Figure 6.
With CACS, high temperatures in the hot aisle cause the uncontained area to reach the same temperatures which can be problematic for IT personnel who are permanently stationed at a desk in the data center. With HACS, high temperatures in the hot aisle stay confined to the hot aisle and therefore do not affect IT personnel permanently stationed in the uncontained area. 5 OSHA (Occupational Safety & Health Administration) Technical Manual section III, Chapter 4 ISO
(International Organization for Standardization) 7243, “Hot environments – Estimation of the heat stress on working man based on WBGT index”
Figure 6 Uncontained work environments with cold-aisle and hot-aisle containment
Effect of containment on the work environment

Impact of Hot and Cold Aisle Containment on Data Center Temperature and Efficiency
Schneider Electric – Data Center Science Center White Paper 135 Rev 2 6
Note that if IT personnel must perform work in the hot aisle of a HACS, the high temperatures in the hot aisle are mitigated by temporarily opening the aisle to let in cooler air. Further-more, even if the hot aisle remains closed, work environment regulations are still met for two reasons: 1) workers are not permanently stationed in the hot environment (i.e. hot aisle), as is the case with CACS, and 2) most routine work takes place at the front of IT racks. Therefore given reason #1, OSHA allows for a work / rest regimen of 25% work / 75% rest in the HACS hot aisle which allows for a maximum WBGT6 of 90°F/32.2°C. This means that the HACS hot-aisle temperature can get as high 117°F/47°C. The higher hot-aisle temperature allowed with HACS is the key difference between HACS and CACS since it allows the CRAH units to operate more efficiently. For more information on environmental work conditions see White Paper 123, Impact of High Density Hot Aisles on IT Personnel Work Conditions. In addition to human comfort, the reliable operation of IT equipment is also important. The 2011 version of ASHRAE Standard TC9.9 recommends server inlet temperatures in the range 64.4-80.6°F / 18-27°C. With CACS, the temperature in the uncontained area can get well above 80°F/27°C, and in cases of high-density IT equipment, above 100°F/38°C. Therefore, anyone entering the data center is typically surprised when entering such hot conditions, and tours become impractical. With CACS, people’s expectations need to be adjusted so they understand that the higher temperatures are “normal” and not a sign of impending system breakdown. This cultural change can be challenging for workers not accustomed to entering a data center operating at higher temperatures. Furthermore, when operating a data center at elevated temperatures, special provisions must be made for non-racked IT equipment such as tape libraries and mainframes. With CACS, these devices will need to have custom ducting in order to enable them to pull cold air from the contained cold aisles. Adding perforated tiles in the hot aisle will help cool this equipment but defeats purpose of containment. In addition, electric outlets, lighting, fire suppression, and other systems in the room will need to be evaluated for suitability of operations at elevated temperatures. A theoretical analysis was performed to compare CACS and HACS with no hot or cold air leakage so as to represent the very best performance of each. Raised floor leakage is typically 25-50%, while containment system leakage is typically 3-10%. The assumptions used for this analysis are included in the Appendix. The number of economizer mode hours and resulting PUE were estimated for each scenario using an economizer hour model and a data center PUE model. A traditional uncontained data center with an economizer mode was also analyzed and serves as a baseline to compare the impact of CACS and HACS. The CACS and HACS data center were both analyzed using three temperature scenarios:
1. IT inlet air temperature held constant at 27°C/80.6°F – the maximum ASHARE rec-ommended inlet air temperature7
a. Significance for CACS – no temperature limit on uncontained area (i.e. hot aisle) which affects human comfort and non-racked IT equipment
b. Significance for HACS – temperature in the uncontained area (i.e. cold aisle) limited to the same as IT inlet air
6 The web-bulb globe temperature (WBGT) is a measure of heat stress and it heavily dependent on the
relative humidity of the work environment. The maximum hot-aisle temperature of 117°F/47°C as-sumes a cold-aisle relative humidity of 45%.
7ASHRAE TC 9.9 2011 Thermal Guidelines for Data Processing Environments – Expanded Data Center Classes and Usage Guidance, page 4
Analysis of CACS and HACS
Impact of High Density Hot Aisles on IT Personnel Work Conditions
Link to resource White Paper 123
> WBGT The “wet-bulb globe tempera-ture” (WBGT) is an index that measures heat stress in human work environments.
WBGT = 0.7*NWB + 0.3*GT
NWB is the natural wet-bulb temperature and GT is the globe temperature
NWB is measured by placing a water-soaked wick over the bulb of a mercury ther-mometer. Evaporation reduces the temperature relative to dry-bulb temperature and is a direct representation of the ease with which a worker can dissipate heat by sweating. For a data center, the dry-bulb temperature can be used in place of GT without compro-mising accuracy. “Dry-bulb” refers to temperature measured using a typical analog or digital thermometer.
Maximum OSHA WBGT:
Continuous work: 86°F/30°C 25% work 75% rest: 90°F/32°C
Impact of Hot and Cold Aisle Containment on Data Center Temperature and Efficiency
Schneider Electric – Data Center Science Center White Paper 135 Rev 2 7
2. Temperature in uncontained area held constant at 27°C/80.6°F – the maximum ASHARE recommended inlet air temperature
a. Significance for CACS – IT inlet air temperature reduced to maintain tem-perature in uncontained area (i.e. hot aisle)
b. Significance for HACS – IT inlet air temperature limited to that of the uncon-tained area (i.e. cold aisle)
3. Temperature in uncontained area held constant at 24°C/75°F – a standard indoor design temperature8 for human comfort
a. Significance for CACS – IT inlet air temperature significantly reduced to maintain temperature in uncontained area (i.e. hot aisle)
b. Significance for HACS – IT inlet air temperature limited to that of the uncon-tained area (i.e. cold aisle)
Table 1 summarizes the results of the analysis, using the parameters below: • IT inlet air dry-bulb temperature
• Uncontained area – dry-bulb temperature (DB) and wet-bulb globe temperature (WBGT)
• Economizer mode hours – the number of hours the chiller was off during the year
• Cubic meters per second (m3/s) or Cubic feet per minute (CFM) – the total airflow sup-plied by the CRAH units as a percent of total IT equipment airflow
• PUE – the data center industry’s standard efficiency metric
The first row in the table provides baseline values for an uncontained data center for compar-ison purposes. Scenario #1 results In this scenario, both CACS and HACS provide 6,218 hours of economizer mode and a PUE of 1.65. This illustrates the point that CACS and HACS efficiency are equivalent when human comfort and non-racked IT equipment are ignored. However, with CACS, the temperature of the uncontained area is 41°C/106°F at 21% relative humidity which is equivalent to a WBGT of 28°C/83°F – close to the maximum OSHA WBGT limit of 30°C/86°F. This is an unrealistic work environment for IT personnel and non-racked IT equipment. In reality, such a high temperature forces the introduction of cold air leakage into the uncon-tained area. The effect of leakage is discussed later in the “Effect of air leakage on theoreti-cal analysis” subsection. Scenario #2 results In this scenario, holding the uncontained area temperature to 27°C/80.6°F limits the CACS to 2,075 annual economizer mode hours and a 13% worse PUE compared to Scenario #1. The resulting IT inlet air temperature is 13°C/56°F. Results for the HACS do not change since the IT inlet air temperature of Scenario #1 is the same as the uncontained area temperature limit of Scenario #2. Both CACS and HACS in Scenario #2 allow for an acceptable IT inlet air temperature but not for a comfortable work environment temperature. The HACS provides 4,143 more economizer mode hours and provides 11% improvement in PUE compared to CACS.
8American Society of Heating, Refrigerating and Air-Conditioning Engineers, 2001 ASHRAE Fundamen-
tals Handbook, page 28.5

Impact of Hot and Cold Aisle Containment on Data Center Temperature and Efficiency
Schneider Electric – Data Center Science Center White Paper 135 Rev 2 8
Scenario #3 results In this scenario, the uncontained area temperature limit is lowered to 24°C/75°F for human comfort. This lower temperature results in zero annual economizer mode hours for CACS, 6% worse PUE compared to Scenario #2, and an IT inlet air temperature of 10°C/50°F. The HACS economizer mode hours drops to 5,319 and the PUE decreases to 1.69 (2% worse compared to Scenario #2). Both CACS and HACS in Scenario #3 allow for an comfortable work environment temperature and an acceptable IT inlet air temperature. The HACS provides 5,319 more economizer mode hours and provides 15% improvement in PUE compared to CACS.
Containment type
IT inlet
air
Uncontained area
DB WBGT
Econ hours
m3/s CFM9 PUE Comments
Traditional uncontained
13-27°C 56-81°F
24°C 75°F
17°C 63°F 2,814 149% 1.84 Baseline with 49% cold and 20% hot-air leakage10
Scenario #1: IT inlet air temperature held constant at 27°C/80.6°F
CACS Max ASHRAE IT inlet air temp and no limit on uncontained area temp
27°C 81°F
41°C 106°F
28°C 83°F 6,218 100% 1.65
WBGT only 2°C/3°F below OSHA max regulations. Includes 37% reduction in chiller power consumption. This is due to the increased IT supply temperature which allows for an increased CW supply temperature.
HACS Max ASHRAE IT inlet air temp and no limit on uncontained area temp
27°C 81°F
27°C 81°F
21°C 70°F 6,218 100% 1.65
WBGT 9°C/16°F below OSHA max regulations. Includes 37% reduction in chiller power consumption with increased CW supply temperature. *Note the hot-aisle temperature is 41°C/106°F.
Scenario #2: Temperature in uncontained area held constant at 27°C/80.6°F
CACS 27°C /80.6°F max uncontained area temp
13°C 56°F
27°C 81°F
18°C 64°F 2,075 100% 1.86
Complies with OSHA, and complies with ASHRAE. Includes 5% increase in chiller power consumption. This is due to the decreased IT supply temperature which leads to a decreased CW supply temperature.
HACS 27°C /80.6°F max uncontained area temp
27°C 81°F
27°C 81°F
21°C 70°F 6,218 100% 1.65 Same results as HACS in Scenario #1.
Scenario #3: Temperature in uncontained area held constant at 24°C/75°F
CACS 24°C /75°F max uncontained area temp
10°C 50°F
24°C 75°F
15°C 59°F 0 100% 1.98
Acceptable work environment but worse efficiency than baseline data center in first row. Includes 15% increase in chiller power consumption. This is due to the decreased IT supply temperature which leads to a decreased CW supply temperature.
HACS 24°C /75°F max uncontained area temp
24°C 75°F
24°C 75°F
18°C 65°F 5,319 100% 1.69
Higher efficiency, complies with OSHA, and complies with ASHRAE. Includes 28% reduction in chiller power consumption with increased CW supply temperature. *Note the hot-aisle temperature is 38°C/100°F.
9 Total airflow (stated as % of IT airflow) 10 Hot-air leakage occurs when hot exhaust air from servers mixes with the raised floor supply air, which
increases server inlet temperature. Cold-air leakage occurs when cold air from gaps/voids in the raised floor mixes with return air, lowering return temperature and decreasing the cooling unit’s efficiency.
Table 1 Impact of controlling the uncontained area temperature for a CACS and HACS
Impact of Hot and Cold Aisle Containment on Data Center Temperature and Efficiency
Schneider Electric – Data Center Science Center White Paper 135 Rev 2 9
Table 2 breaks down and quantifies the energy consumption between CACS and HACS in Scenario #2 and #3. The energy costs are broken down by IT, power, cooling, and total data center energy consumption. • The IT energy includes all IT equipment, which is held constant in this analysis at
700kW
• The “power energy” includes losses from switchgear, generator, UPS, primary and critical auxiliary devices, UPS, lighting, and critical power distribution
• The “cooling energy” includes losses from chiller, cooling tower, chilled water pumps, condenser water pumps, and perimeter CRAH units
• Total energy is the sum of IT, power, and cooling energy and is directly related to PUE
IT energy Power energy
Cooling energy
Total energy PUE
Scenario #2: uncontained area held at 27°C/80.6°F
CACS $735,840 $213,018 $422,874 $1,371,732 1.86
HACS $735,840 $211,654 $266,928 $1,214,422 1.65
% Savings 0% 1% 37% 11% 11%
Scenario #3: uncontained area held at 24°C/75°F
CACS $735,840 $213,846 $509,354 $1,459,040 1.98
HACS $735,840 $211,867 $292,503 $1,240,209 1.69
% Savings 0% 1% 43% 15% 15%
In a typical data center, 50% loaded, the IT energy is the largest portion of the energy cost, followed by the cooling system energy cost. Table 2 shows that reducing the uncontained area temperature increases the energy use for CACS (6%) to a much greater extent than for HACS (2%). This is because, with the uncontained area temperature held constant, the chilled water set point for the CACS is always lower than the set point for the HACS. In fact, the chilled water set point penalty for CACS and the delta T across the servers are directly related. If the delta T across the servers is increased, this penalty for CACS becomes greater. Looking now at the % savings in Scenario #3, the HACS consumes 43% less cooling system energy than the CACS. The economizer mode hours, when the chiller is off, account for the majority of these savings, as shown in Figure 7. At this work environment temperature, the CACS is unable to benefit from any economizer mode hours due to the low chilled water supply temperature (2.4°C/36°F). The small difference in the power system energy is due to an increase in losses across the switchgear which is caused by the extra hours of chiller operation with CACS. In comparison to the traditional uncontained baseline case, the Scenario #3 CACS consumes 25% more cooling system energy and 8% more total data center energy. In comparison to the traditional uncontained baseline case, the HACS consumes 28% less cooling system energy and 8% less total data center energy.
Table 2 Cost breakdown between CACS and HACS for Scenario #1 and #2
+
+
=

Impact of Hot and Cold Aisle Containment on Data Center Temperature and Efficiency
Schneider Electric – Data Center Science Center White Paper 135 Rev 2 10
It is clear from this analysis, that under practical work environment temperature constraints and temperate climates, hot-aisle containment provides significantly more economizer mode hours and lower PUE compared to cold-aisle containment. This is true regardless of the type of cooling unit or heat rejection method used (i.e., perimeter vs. row-based, chilled water vs. direct expansion).
0250,000500,000750,000
1,000,0001,250,0001,500,0001,750,0002,000,0002,250,0002,500,0002,750,000
CRAH Chiller Cooling Tower
CW Pumps
Heat Rej Pumps
Ener
gy (k
W h
rs)
HACSCACS
Effect of air leakage on theoretical analysis The analysis above considered the CACS and HACS to be completely sealed so that there is no leakage between the hot and cold air streams. This unlikely assumption allows us to calculate the maximum efficiency of the CRAH units and allows for a fair comparison between CACS and HACS. In reality, there is always cold air leakage with CACS or HACS requiring that the CRAH fan airflow be greater than the IT equipment airflow – this is true even with CRAH units with variable speed fans. The balance of airflow must equal the IT equipment airflow plus the percentage of air leakage from the containment system such as a raised floor. For example, if the CRAH units supply 47 m3/s (100,000 CFM) of air and the IT equipment consumes 38 m3/s (80,000 CFM) of air, the remaining 9 m3/s (20,000 CFM) must make its way back to the CRAH units. Any air not used to cool IT equipment represents wasted energy. This wasted energy comes in two forms: 1) The fan energy used to move the air and 2) the pump energy used to move chilled water through the CRAH coil. Furthermore, hot/cold air mixing decreases the capacity of the CRAH unit. As more mixing occurs, more CRAH units are required to remove the same amount of heat while maintaining the appropriate IT inlet air temperature. In order to comprehend the effect of air leakage, the analysis above was repeated using various air leakage percentages. Because of the increased fan energy needed for the extra CRAH units, the energy increase for CACS was higher than for HACS. This is because more cold air mixes into the hot aisle with CACS than it does with HACS. The hot aisle in HACS is only affected by leakage from the cable cutouts at each rack; whereas the hot aisle in CACS is affected by cable cutouts at the rack, cutouts around the data center perimeter, and cutouts under PDUs. This equates to about 50% more cold-air leakage compared to HACS. The cooling energy for HACS savings over CACS remained about the same. Comparison summary of CACS and HACS Table 3 summarizes CACS and HACS based on the characteristics discussed in this paper. The green shaded cells indicate the best choice for that particular characteristic.
Figure 7 Breakdown of annual cooling system energy consumption for Scenario #3
> Hot and cold air leakage Most hot exhaust air from IT equipment goes back to the CRAH where it is cooled. Hot-air leakage occurs when the IT exhaust air makes its way back to the IT equipment inlets and mixes with the cold inlet air. Cold-air leakage occurs when the cold supply air from the CRAH mixes with the CRAH’s hot return air without ever getting to the IT equipment inlets.

Impact of Hot and Cold Aisle Containment on Data Center Temperature and Efficiency
Schneider Electric – Data Center Science Center White Paper 135 Rev 2 11
Characteristic CACS HACS Comment
Ability to set work environ-ment temperature to 75°F/24°C (standard indoor design temperature)
No Yes
With HACS, cooling set points can be set higher while still maintaining a work environment temperature of 75°F/24°C and benefiting from economizer mode hours. Increasing CACS cooling set points results in uncomfortably high data center temperatures. This promotes a negative perception when someone walks into a hot data center.
Take advantage of potential economizer mode hours No Yes
The number of economizer mode hours with CACS is limited by the maximum work environment temperature in the hot aisle (the work environment) and by tempera-ture limitations of non-racked IT equipment.
Acceptable temperature for non-racked equipment No Yes
With CACS, the uncontained data center area becomes hot because the cold aisles are contained. Perimeter IT equipment (i.e., tape libraries) in the uncontained area should be evaluated for operation at elevated temperatures. Risk of overheating perimeter IT equipment increases with decreased cold-air leakage.
Ease of deployment with room cooling Yes No
CACS is preferred when retrofitting a data center with raised floor, room-level cooling with flooded return (draws its warm return air from the room). A HACS without row-based cooling or dropped ceiling would require special return ductwork. For further guidance on this topic, see White Paper 153, Implementing Hot and Cold Air Containment in Existing Data Centers.
New data center designs No Yes The cost to build a new data center with CACS or HACS is nearly identical. Specifying HACS for a new data center will improve the overall efficiency, work environment, and overall operating cost.
Depending upon the location of the data center, fire detection and/or fire suppression may be required inside the enclosed area of the HACS or CACS. The primary suppression mechan-ism is usually sprinklers, which are heat activated. Gaseous agents are usually a secondary system which can be initiated by smoke detectors. The National Fire Protection Association standard NFPA 75 does not state an opinion as to whether sprinklers or gaseous agents should be provided in a HACS or a CACS. However, NFPA 75 documents the following two requirements that could be applied to both HACS and CACS: • “Automated information storage system (AISS) units containing combustible media with
an aggregate storage capacity of more than 0.76m^3 shall be protected within each unit by an automatic sprinkler system or a gaseous agent extinguishing system with ex-tended discharge.” This is significant because it sets a precedent for fire detection and suppression in an enclosed space in a data center.
• “Automatic sprinkler systems protecting ITE rooms or ITE areas shall be maintained in accordance with NFPA 25, Standard for the Inspection, Testing, and Maintenance of Water-Based Fire Protection Systems.”
In practice, HACS and CACS have been successfully installed and approved with sprinklers and gaseous-agent suppression in various sites. APC Application Note 159 provides more detail on challenges and common practices for deploying fire suppression in hot-aisle contained environments. The AHJ should be contacted for specific requirements in a given location. Note that any plenum (i.e., raised floor or dropped ceiling) must be rated for air distribution.
Table 3 Summary of cold-aisle containment vs. hot-aisle containment
Fire suppression considerations

Impact of Hot and Cold Aisle Containment on Data Center Temperature and Efficiency
Schneider Electric – Data Center Science Center White Paper 135 Rev 2 12
Prevention of hot and cold air mixing is a key to all efficient data center cooling strategies. Both HACS and CACS offer improved power density and efficiency when compared with traditional cooling approaches. A hot-aisle containment system (HACS) is a more efficient approach than a cold-aisle containment system (CACS) because it allows higher hot aisle temperatures and increased chilled water temperatures which results in increased economiz-er mode hours and significant electrical cost savings. Cooling set points can be set higher while still maintaining a comfortable temperature in the uncontained area of the data center. The analysis in this paper shows that HACS can save 43% in the annual cooling system energy cost corresponding to 15% reduction in the annualized PUE compared to CACS while holding the uncontained data center area to 24°C/75°F. This paper concludes that all new data center designs should use HACS as the default containment strategy. In cases where containment is not initially required, the new data center design should incorporate provisions for future HACS deployment. For existing raised floor data centers with a perimeter cooling unit layout, it may be easier and less costly to implement CACS. For guidance on this topic, see White Paper 153, Implementing Hot and Cold Air Containment in Existing Data Centers.
Conclusion
John Niemann is Product Line Manager for Row and Small Systems Cooling Products at Schneider Electric, and is responsible for planning, support, and marketing for these product lines. John has led product management for all of APC’s InRow™ cooling products since 2004. He has 12 years experience in HVAC. His career began in the commercial and industrial HVAC market where he focused on custom air handling and refrigeration systems, with expertise focused on energy recovery and filtration for critical environments. His HVAC experience spans applications engineering, development, product management, and technical sales. John is a member of ASHRAE and The Green Grid, and holds a degree in mechanical engineering from Washington University in St. Louis, Missouri. Kevin Brown is the Vice President of Data Center Global Solution Offer & Strategy at Schneider Electric. Kevin holds a BS in mechanical engineering from Cornell University. Prior to this position at Schneider Electric, Kevin served as Director of Market Development at Airxchange, a manufacturer of energy recovery ventilation products and components in the HVAC industry. Before joining Airxchange, Kevin held numerous senior management roles at Schneider Electric, including Director, Software Development Group. Victor Avelar is a Senior Research Analyst at Schneider Electric’s Data Center Science Center. He is responsible for data center design and operations research, and consults with clients on risk assessment and design practices to optimize the availability and efficiency of their data center environments. Victor holds a bachelor’s degree in mechanical engineering from Rensselaer Polytechnic Institute and an MBA from Babson College. He is a member of AFCOM and the American Society for Quality.
About the author
Implementing Hot and Cold Air Containment in Existing Data Centers
Link to resource White Paper 153

Impact of Hot and Cold Aisle Containment on Data Center Temperature and Efficiency
Schneider Electric – Data Center Science Center White Paper 135 Rev 2 13
Impact of High Density Hot Aisles on IT Personnel Work Conditions White Paper 123
Implementing Hot and Cold Air Containment in Existing Data Centers White Paper 153
Resources Click on icon to link to resource
For feedback and comments about the content of this white paper: Data Center Science Center [email protected] If you are a customer and have questions specific to your data center project: Contact your Schneider Electric representative
Contact us
Browse all white papers whitepapers.apc.com
tools.apc.com
Browse all TradeOff Tools™
Impact of Hot and Cold Aisle Containment on Data Center Temperature and Efficiency
Schneider Electric – Data Center Science Center White Paper 135 Rev 2 14
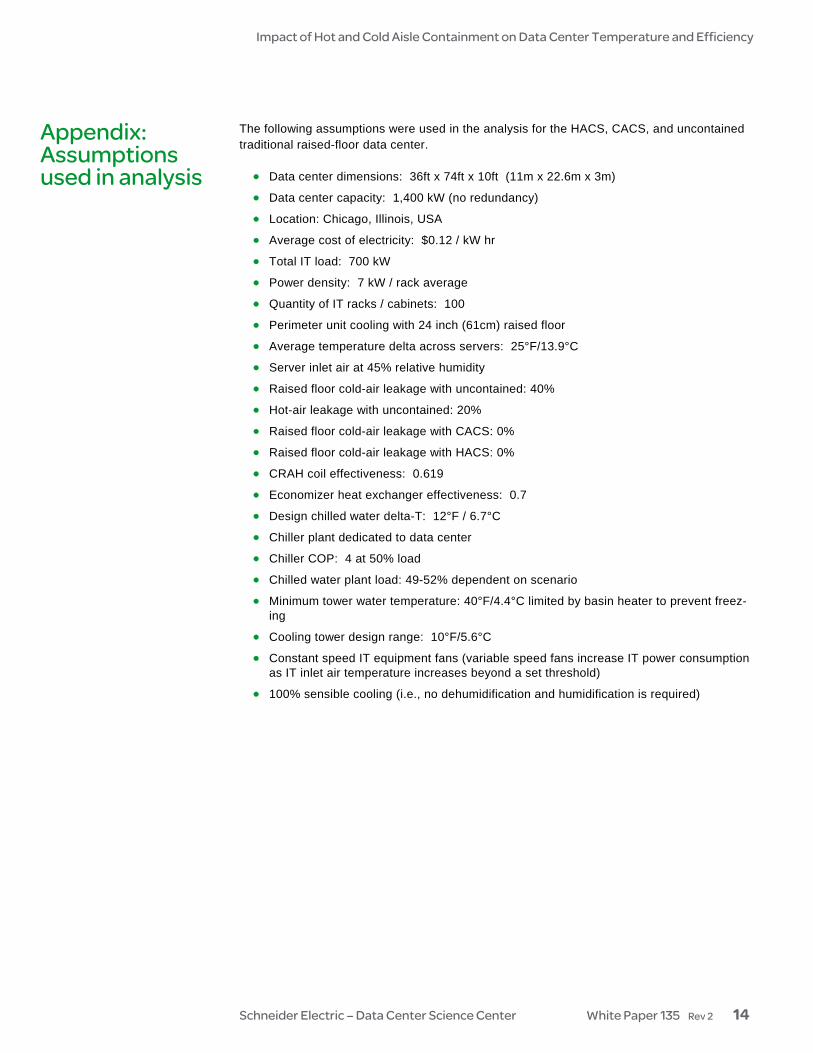
The following assumptions were used in the analysis for the HACS, CACS, and uncontained traditional raised-floor data center. • Data center dimensions: 36ft x 74ft x 10ft (11m x 22.6m x 3m)
• Data center capacity: 1,400 kW (no redundancy)
• Location: Chicago, Illinois, USA
• Average cost of electricity: $0.12 / kW hr
• Total IT load: 700 kW
• Power density: 7 kW / rack average
• Quantity of IT racks / cabinets: 100
• Perimeter unit cooling with 24 inch (61cm) raised floor
• Average temperature delta across servers: 25°F/13.9°C
• Server inlet air at 45% relative humidity
• Raised floor cold-air leakage with uncontained: 40%
• Hot-air leakage with uncontained: 20%
• Raised floor cold-air leakage with CACS: 0%
• Raised floor cold-air leakage with HACS: 0%
• CRAH coil effectiveness: 0.619
• Economizer heat exchanger effectiveness: 0.7
• Design chilled water delta-T: 12°F / 6.7°C
• Chiller plant dedicated to data center
• Chiller COP: 4 at 50% load
• Chilled water plant load: 49-52% dependent on scenario
• Minimum tower water temperature: 40°F/4.4°C limited by basin heater to prevent freez-ing
• Cooling tower design range: 10°F/5.6°C
• Constant speed IT equipment fans (variable speed fans increase IT power consumption as IT inlet air temperature increases beyond a set threshold)
• 100% sensible cooling (i.e., no dehumidification and humidification is required)
Appendix: Assumptions used in analysis