impact of external debt on economic growth: a case study ... 3_4_6.pdf · impact of external debt...
TRANSCRIPT
Advances in Management & Applied Economics, vol. 3, no.4, 2013, 59-82
ISSN: 1792-7544 (print version), 1792-7552(online)
Scienpress Ltd, 2013
Impact of External Debt on Economic Growth: A Case
Study of Tanzania
Faraji Kasidi1 and A. Makame Said
2
Abstract
This study investigated the impact of external debt on economic growth of Tanzania for
the period of 1990-2010. The study used time series data on external debt and economic
performance. It is assumed that external debt helps developing countries to meet
developing needs. While debt servicing seeks development by restoring credibility to
existing and new creditors. The study collected data from Bank of Tanzania (BoT),
Zanzibar branch, President’s Office Finance, Economy and Development Planning in
Zanzibar and Ministry of Finance (MoF), Tanzania. In addition, data were collected from
the World Bank (WB) and International Monetary Fund (IMF) publications. The study
revealed that there is significant impact of the external debt and debt service on GDP
growth. The total external debt stock has a positive effect of about 0.36939 and debt
service payment has a negative effect of about 28.517. Long run relationship the co-
integration test shows that there is no long run relationship of the external debt and GDP.
Conclusively, there is a need for further research to identify the impact of external debt on
foreign direct investments and the impact of external debt on domestic revenues.
JEL classification numbers: C32, C53, E51, F31
Keywords: External debt, debt sustainability, co-integration test.
1 Introduction
The basic reason of external debt in developing countries is to fulfil lack of “saving-
investment” gap (Chenery 1996). The developing countries facing with a current account
deficit were encouraged to borrow from developed countries as well as an international
1Senior Lecturer, Institute of Accountancy Arusha. Correspondence: Faraji Kasidi, Institute of
Accountancy Arusha, P. O. Box 2798, Tanzania, Tel: +255-653-089-043. 2Postgraduate Student, Institute of Accountancy Arusha, Tanzania
Article Info: Received : February 19, 2013. Revised : March 27, 2013.
Published online : July 1, 2013
60 Faraji Kasidi and A. Makame Said
community to boost their economic growth. Gohar et al. (2012) recommended that
countries take debt from the external sources for many reasons that are their income is
low, with budget deficit or they are having low investments. In addition, Soludo (2003)
asserted that countries borrow for two broad categories; macroeconomic reasons or to
finance the transitory balance of payments deficits aimed at boosting economic growth
and reduce poverty.
If borrowing is necessary to economic growth. Our study provides evidence that countries
have persistently borrowed from one another in different forms. The study, therefore
looks at the historical background and rationale of the debt in view of its contribution in
economic growth.
1.1 Background to the Research Problem
External debt problem is one of the main challenges faced by the developing countries
like Tanzania. Gohar et al. (2012) mentioned that the repayment or “debt service” creates
problems for many countries especially for developing countries because a debt has to be
serviced are more than the actual amount it was taken for. Therefore, large debt service
payments impose a number of constraints on a country’s growth scenario. Either, it drains
out limited resources and restricts financial resources for domestic need of development
of these countries.
Benedict et al. (2003) suggested that foreign borrowing has a positive impact on
investment and growth of a country up to a threshold level but external debt service can
potentially affect the growth as most of the funds will go in the repayment of the debt
rather at the investments. Furthermore, Fosu (2009) found out that debt servicing shifts
spending away from the social sector, health and education. This is shown that the aim of
taking debt is behind to seek development than being depressed by debt service payments
because it cuts up most of the resources rather than development. As a result creates a
great hindrance in the economic growth of a country due to high interest payments on the
external debt, heavy public expenditures and foreign exchange to repay that debt.
According to World Development Indicators (WDI-2011) developing countries suffered a
foreign debt burden and debt servicing rather than developed and the Organization for
Economic Co-operation and Development (OECD) countries. For instance over the period
of 1990-2010 the countries like the United State of America (USA), United Kingdom
(UK), and Japan paid nothing for debt service. The table 1.0 shows debt and debt service
of selected countries for 2010.
Table 1: Total debt and debt service for 2010 (US$ million) Country External debt position External debt service
China 548,551 62,611
Brazil 346,978 45,806
Burundi 537 3
Kenya 8,400 399
Japan
Nigeria
0
7,883
0
349
Pakistan 56,773 4,338
Rwanda 795 15
UK
USA
Tanzania
0
0
8,664
0
0
199
Source: World Development Indicators Report (2011)
Impact of External Debt on Economic Growth: A Case Study of Tanzania 61
Tanzania as one among the developing countries has taken significant measures to
liberalise it is economy. Muganda (2004) explained that in order to solve the persistent
severe economic crisis which confronted the country since the late 1970s; Tanzania
signed an agreement with the World Bank (WB) and the International Monetary Fund
(IMF) in 1986 to adopt Structural Adjustment Programmes (SAPs). The reforms of
Tanzania classified into three broad phases; liberalization (1986-1995), derailed reforms
(1992-1995), and successful reforms (1996-2004). The programmes included Economic
Recovery Programme (ERP), Economic and Social Action Plan (ESAP) and the Priority
Social Action Plan (PSAP).
These reforms implied that GDP growth could be sufficient to allow increases in income
per capita, including in rural areas. Overall the long-term poverty trend has been
declining. However the decline in poverty has been more pronounced in urban areas,
while poverty in rural areas remains considerably higher (Muganda 2004). Either, in April
2000, Tanzania has been classified by the IMF and WB as a heavily indebted country and
is eligible for enhanced Highly Indebted Poor Countries (HIPC) debt relief assistance (Mc
Groarty et al. 2009). The HIPC debt reduction, which was followed by additional donor
inflows, allowed the government to increase expenditure allocations to public service
delivery.
On the other hand, External debt of Tanzania reached US$ 8.7 billion in 2010 from US$
6.5 billion in 1990. While in case of the percentage of GDP, it decreased from 130.1% in
1990 to 41.6% in 2010. The annual debt service of Tanzania slightly declined from US$
0.21 billion in 1990 to US$ 0.20 billion in 2010 (WDI 2011). The sustainability of debt
burden indicators shows declining trend, so far the external debt of Tanzania is
sustainable (MOF 2012). Either the macroeconomic performance of Tanzania has been
well performing. The growth rate increased by 7% and the revenue collection also
increased by 16.4 % of GDP (BOT 2012). As a result donor funding and expansion in
public spending increased.
Notwithstanding, Tanzania received assistances of debt relief and foreign aids, and major
SAPs of its economy still remains a slow movement to it is economic growth and
stability, a heavy external debt burden and heavily dependent on donor support. Mc
Groarty et al. (2009) reported that “Tanzania has long been one of Sub-Saharan Africa’s
top recipients of international aid with Official Development Assistance (ODA).
Tanzania’s budget remains heavily dependent on aid”. The report also mentioned that the
reduction in debt by approximately US$ 3.6 billion between 2005 and 2006 was partly
caused by the receipt of financing through the Multilateral Debt Relief Initiative (MDRI)
following implementation of the Paris Club (PC) 7 Agreement.
Many previous studies on the relationship between external debt and economic growth
show that some researchers found positive relation, some negative and some no
significant relationship between external debt and economic growth for different
economic condition. Some of the studies like Were (2001); Wijeweera et al. (2005);
Seetanah et al. (2007); Sharif et al. (2009); and Malik et al. (2010) concluded that there is
negative relationship between external debt and economic growth. Thus, the objective of
this paper was to examine the impact of external debt on the economic growth
performance of Tanzania for the period of 1990-2010.
The foreign debts are important to determinants of economic performance of a country.
Developing countries take the foreign debts for many purposes as mentioned by Chenery
(1996) are to fulfil lack of “saving-investment” gap. Another reason is to fill the gap of
62 Faraji Kasidi and A. Makame Said
budget or balance of payment deficit due to low investment (Gohar et al. 2012 and Soludo
2003).
Since independence, Tanzania has been received several foreign debts in order to spur
economic growth. But the heavy external debt burden as resulted in creating a great
hindrance in the economic growth of a country due to high interest payments on the
external debt and heavy public expenditures. According to WDI (2011), Tanzania in year
2010 had an external debt of US$ 8.6 billion from US$ 6.4 billion in 1990 and servicing
the debt of US$ 0.2 billion was only 2.3% of the external debt. The main interest of this
study is to investigate the impact of external debt on economic growth of Tanzania.
1.2 Objectives of the Study
The aimed at achieving the following specific objectives:
1. To establish the relationship between external debt and economic growth of Tanzania.
2. To find out the impact of debt servicing and external debt on the Tanzanian economic
growth.
3. To investigate long-term correlation between external debt and economic growth in
Tanzania.
1.3 Significance of the Study
The study is premised on the understanding that Tanzania, like other developing countries
suffering on debt burden problem. According to WDI (2011) in year 1990 external debt of
Tanzania was US$ 6,448 million and rose to US$ 8,664 while GDP grew by 6.5%. Many
developing countries claimed about the debt burden problem and the International
Development Agencies (IDA) agreed to cancel the debt through HIPC programme and
Tanzania was among countries that received the debt relief (Mc Groarty et al, 2009). This
study constructs a framework for rationalisation of the impact of external debt on
economic growth and it useful for further researches.
The main objectives of this study are: to investigate the relationship between external debt
and economic growth of Tanzania. Additionally, the study aimed to examine the impact
of external debt on economic growth of Tanzania.
Particularly, the question of interest was whether “there is any impact of external debt and
debt servicing on economic growth of Tanzania”. It was interesting to find out at what
level of external debt has a negative or positive impact on the economic performance and
to what extent of the effect. The study used econometric models to determine the
relationship of debt on growth within the standard growth model. The study adopted a
model developed by Malik et al. This study based on the analysis of Time series data of
Tanzania over the period of 1990 to 2010.
2 Literature Review
This paper reviews both theoretical and the empirical literatutre on impact of the external
debt on economic growth. This section underscores literature on external debt burden,
debt servicing capacity and debt sustainability.
Impact of External Debt on Economic Growth: A Case Study of Tanzania 63
2.1 External Debt Burden and Debt Service Capacity
External debt burden is the reflection of the difficulties and strains arising from the
servicing of external debt. This may result from inability to generate enough resources to
meet commitments in debt servicing. The burden is measured in terms of the proportion
of current resources (income) devoted to financing past consumption (Ogunlana, 2005).
Therefore, when a disproportionately large share of current resources is deployed to serve
external debt the burden increases. The reverse is the case when external debts can be
serviced without compromising the requirements of domestic economic development.
Salop and Spitaller (1980) observed two key issues on debt capacity. The first addresses
what the optimal level of debt should be in order not to run into debt service difficulty.
The second relates to the sustainability of debt situations and policies. The optimizing
framework dominated much of theoretical literature. This concerns analysis of marginal
cost and benefits of borrowing which should be equal at the optimal level of debt. This
approach does not provide a simple formula that would make it possible to ascertain in
more operational detail the debt capacity stance of individual country (Hjertholm, 1999).
The non-optimizing model examines the sustainability of particular debt situations and
policies in the light of the expected growth path of the economy. In this case, the
emphasis has largely been on foreign borrowing for investment purposes in order to fill
the gap between domestic savings and investment (King, 1968, Solomon, 1977). Though
simple and readily understandable, the model suffers from a number of conceptual
problems and the rigidity of its basic assumptions. While it focuses on investment gap,
less consideration was given to whether the investment will generate foreign exchange to
service debt at maturity (Mc Donald, 1982).
The borrowing country’s external solvency condition was addressed in the “debt
dynamic” model. Hence the consideration of the value of exports which gives a more
accurate impression of income in foreign currency that can be used to service debt (World
Bank, 1985, Hernandez, 1988). However, because of the assumption of a time-variant
growth path for exports and the rate of interest, the use of the debt dynamics model also
has limitations in assessing the sustainability of a borrower’s debt. In spite of the obvious
weakness of the growth-cum-debt and the debt dynamic models, they still provide insight
for determining external debt capacity.
2.2 Debt Burden and its Sustainability
The analyses of external debt sustainability are inherently forward looking. A number of
factors come into play to establish if a country will be able to service its debt. These
factors include the existing debt stock and associated debt service, the prospective path of
its deficits, the financing mix of the debt and the evolution of its repayment capacity in
terms of foreign currency value of GDP, exports and government revenues (Abrego et al
2001). Projections of the debt dynamics provide a link between debt sustainability and
macroeconomic policy. The integrity of such projections determines the extent of their
usefulness in establishing debt sustainability.
In measuring debt burden literature expounds good number of indicators as provided here
under: Ogunlana (2005) mentioned several indicators which have been used over the
years to measure debt burden and its sustainability. The indicators are usually reported in
percentages (ratios). These include: Debt Stock/Export, Debt Service/GDP, Debt
Service/Export, Debt Stock/GDP, Reserves/Import and Reserves/Debt Stock. Each of
64 Faraji Kasidi and A. Makame Said
these indicators has its merits and its limitations, suggesting that they should be used in
combination and with caution.
The strength of any economy depends on its output and export potentials. Its debt stock
with regard to its export should be well balanced and sustainable. In the same way,
external debt stock/GDP is a scaled measure of debt stock position. They will measure
foreign presence in an economy in the form of past reliance on contractual foreign capital
inflow with the potential of attracting capital outflow in the future. Whether these will
create debt burden in the future or not depends on the terms of the loan regarding its
maturity structure, interest rate and usage.
The Debt Service/Export and Debt Service/ GDP indicate the proportion of exports and
national output that are committed to service of debt incurred in the past. In particular,
debt service/export is a liquidity measure. The debtor’s ability to meet debt servicing
obligation declines as the ratio increases. This directly shows that the debt is likely to be
unsustainable. This situation can be costly as it can require greater adjustment to
compensate for adverse balance of payments developments. For the debt service/GDP, it
measures the magnitude of current domestic output used in meeting debt service
commitments entered in the previous period.
The Reserves/Debt Stock ratio, though not a common measure of debt sustainability,
assumes that if the total debt stock of the borrower is to be paid off with the reserves, how
far would it go. The greater the ratio the more comfortable the debtor appears to be in
terms of its capacity to meet its external commitments. Similarly, the Reserves/Import
ratio measures the capacity of the country to pay for its imports.
The debt burden indicators suffer the limitations endemic to ordinal measurement. For
instance, a country with a low ratio of debt stock/GDP may record unsustainable external
debt if the value of exportable constitutes a very small proportion of its GDP. Foreign
exchange resources may not be available to meet its debt service payments. Furthermore,
the debt/GDP can also be influenced by exchange rate since local currency depreciation
can raise the ratio while physical output and debt stock in foreign currency remain
unchanged.
In addition, many debt ratios such as debt stock/GDP and debt stock/exports do not
convey the terms and conditions and mix of concessionality and non- concessionality in
the debt. These conditions have different impacts on the magnitude of the subsequent debt
service payments (Omoruyi, 2005). The greater the level of concessionality in a stock of
debt, which allows for long grace and maturity periods and low interest, the better,
compared with debt with short maturity and high interest rate. This is because the debt
service difficulty will be minimised.
Another important dimension to measuring the burden or sustainability of external debt is
the use of the net present value (NPV) of such debt in terms of the discounted value of
future debt service payments. However, the problem with this is that it compares future
debt service obligations with existing repayment capacity without considering the
country’s ability to grow. This is particularly relevant when the debt maturity period is
long. Moreover, while NPV indicators may signal debt servicing difficulties sometime in
the future, they do not provide information on when these problems may become
pressing. Similarly, the discount rate may vary with market conditions. The NPV
approach has to its advantage the capacity to make an effective comparison of debt
burden among the countries on the same level of development.
Impact of External Debt on Economic Growth: A Case Study of Tanzania 65
The choice of relevant denominators in establishing debt ratios is another important issue.
In general, this depends on the constraints that are most binding in an individual country.
The use of GDP captures overall resource constraints, export relates to foreign exchange
constraints while revenue indicates government’s ability to generate fiscal resources. For
external debt, it is useful to monitor and assess debt sustainability in relation to GDP and
export earnings while public debt in general could be related to GDP and fiscal revenues
(IMF, 2000).
It is important to observe a review of a country’s external debt sustainability with total
neglect of the level and constraint associated with domestic debt servicing will be
underestimating the seriousness of indebtedness and the stress of debt servicing. This is
because the impact of debt servicing on the budget is independent of whether payments
are due to external or domestic debt obligations. Indeed they both have the effect of
reducing allocation on other expenditure heads which may be important for sustainable
growth.
Some general thresholds have been considered in the empirical literature for each of these
ratios under the enhanced HIPC Initiative beyond which a country’s debt might be
considered unsustainable. These include NPV Debt-to -Export ≥ 150 per cent, Export-to-
GDP ≥ 30 per cent, and Government Revenue-to-GDP ≥15, NPV Debt – to- Government
Revenue ≥ 250 per cent, Debt Service-to-Export ≥ 15 per cent and Debt Service-to-
Revenue ≥ 25 per cent.
Under the Country Policy and Institutional Assessment (CPIA) in which institutional
strength and quality of policies play important determining factors, classification of
countries to poor, medium and strong, determines what ratio should apply for Debt
Service to export as well as Debt Service to Revenue. Countries classified as strong are to
observe the ratios of 25 and 35 percent for debt service-export and debt service-
government revenue, respectively.
The HIPC initiative was not intended to address the debt problems of all debtor countries.
Hence its thresholds may not be applicable to all. However, the critical issue is that its
eligibility criteria even for the HIPC are neither based on a comprehensive measure of
poverty nor on a comprehensive measure of indebtedness. For example, the classification
of Tanzania, which is poor and highly indebted by all standard, as a “blend” country
rather than “IDA Only” has shown some discrimination which can partly be explained by
political factors.
Some critics have argued that the use of the indicators such as debt and debt service to
exports should be complemented with NPV debt-to-GDP which in itself is a good overall
indicator of a country’s indebtedness. This is not only because it puts all countries at par
in considering the heaviness of debt, but also it is less volatile than NPV debt-to- exports
indicator and more easily available than the NPV debt-to- government revenue indicator
(Sachs, 2000)
Kappagoda and Alexandra (2004) developed five indicators that together allow for
sustainability conclusions to be drawn: The first indicator is the Present value of Debt to
GDP ratio: The GDP figure used is the average of the current year and two preceding
years. Comparisons of GDP demonstrate the size of debt in comparison to the size of the
economy. The second indicator is the present value of debt to Export ratio: The exports
figure used is the average of the current and the two preceding years. Comparisons to
exports demonstrate the ability to pay for the debt, however the availability of funds to
pay for the debt depends on the openness of the economy and arrangements made for
attracting foreign direct investment.
66 Faraji Kasidi and A. Makame Said
The third indicator is Present value of debt to Government revenues ration: The
Government revenues figure used is the average of the current year and two preceding
years. Domestic revenues are the best way out of debt problems; so reducing the ratio
between the debt and government revenues must be a policy target. The fourth indicator is
Debt service to exports ratio: The exports figure used is the average of the current and the
two preceding years. Comparisons to exports demonstrate the ability to pay for the debt,
however the availability of funds to pay for the debt depends on the openness of the
economy and arrangements made for attracting foreign direct investment. And the firth
indicator is Debt service to Government revenue ratio: The Government revenues figure
used is the average of the current year and two preceding years. Domestic revenues are
the best way out of debt problems; so reducing the ratio between the debt and government
revenues must be a policy target.
Due to the fact that the country does default to service their debts, IMF (2000),
Kappagoda and Alexander (2004) established debt threshold. The debt threshold aims at
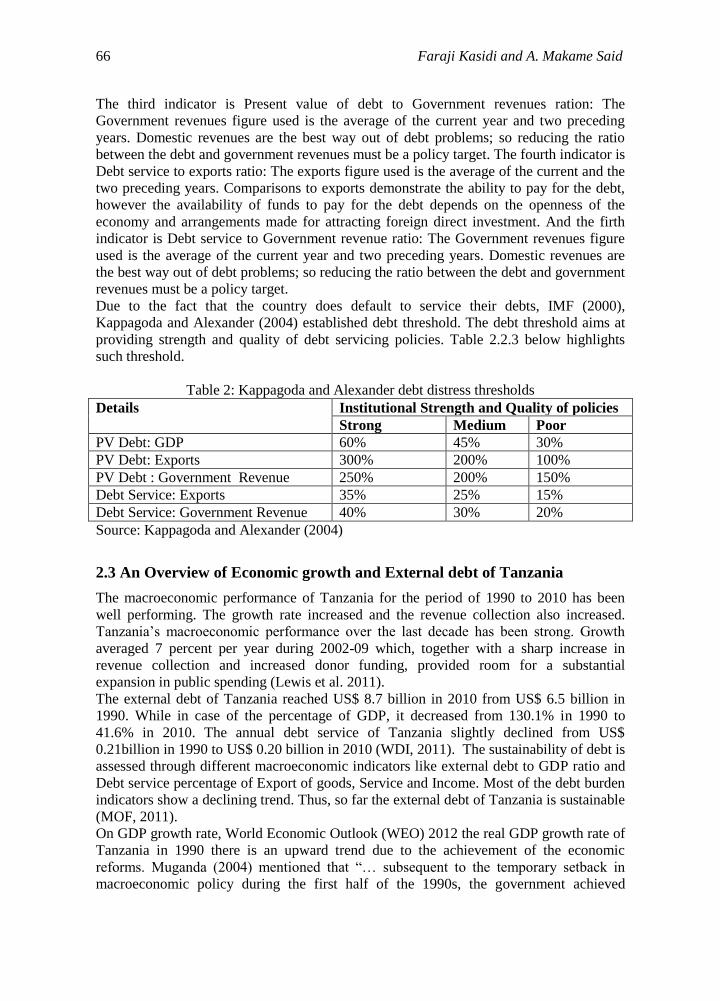
providing strength and quality of debt servicing policies. Table 2.2.3 below highlights
such threshold.
Table 2: Kappagoda and Alexander debt distress thresholds
Details Institutional Strength and Quality of policies
Strong Medium Poor
PV Debt: GDP 60% 45% 30%
PV Debt: Exports 300% 200% 100%
PV Debt : Government Revenue 250% 200% 150%
Debt Service: Exports 35% 25% 15%
Debt Service: Government Revenue 40% 30% 20%
Source: Kappagoda and Alexander (2004)
2.3 An Overview of Economic growth and External debt of Tanzania
The macroeconomic performance of Tanzania for the period of 1990 to 2010 has been
well performing. The growth rate increased and the revenue collection also increased.
Tanzania’s macroeconomic performance over the last decade has been strong. Growth
averaged 7 percent per year during 2002-09 which, together with a sharp increase in
revenue collection and increased donor funding, provided room for a substantial
expansion in public spending (Lewis et al. 2011).
The external debt of Tanzania reached US$ 8.7 billion in 2010 from US$ 6.5 billion in
1990. While in case of the percentage of GDP, it decreased from 130.1% in 1990 to
41.6% in 2010. The annual debt service of Tanzania slightly declined from US$
0.21billion in 1990 to US$ 0.20 billion in 2010 (WDI, 2011). The sustainability of debt is
assessed through different macroeconomic indicators like external debt to GDP ratio and
Debt service percentage of Export of goods, Service and Income. Most of the debt burden
indicators show a declining trend. Thus, so far the external debt of Tanzania is sustainable
(MOF, 2011).
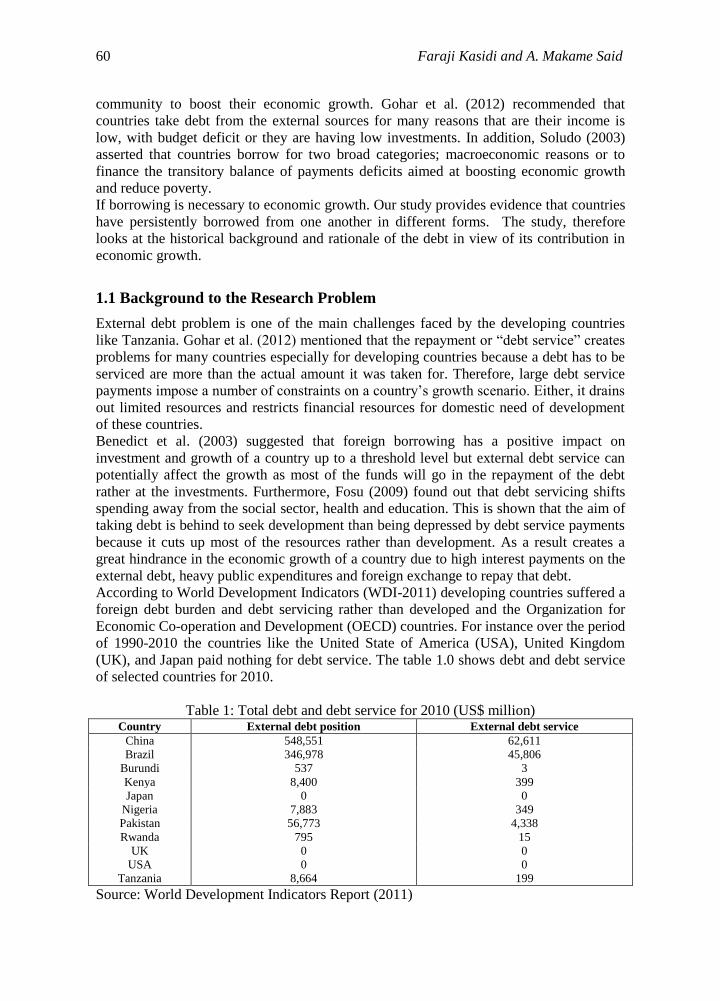
On GDP growth rate, World Economic Outlook (WEO) 2012 the real GDP growth rate of
Tanzania in 1990 there is an upward trend due to the achievement of the economic
reforms. Muganda (2004) mentioned that “… subsequent to the temporary setback in
macroeconomic policy during the first half of the 1990s, the government achieved
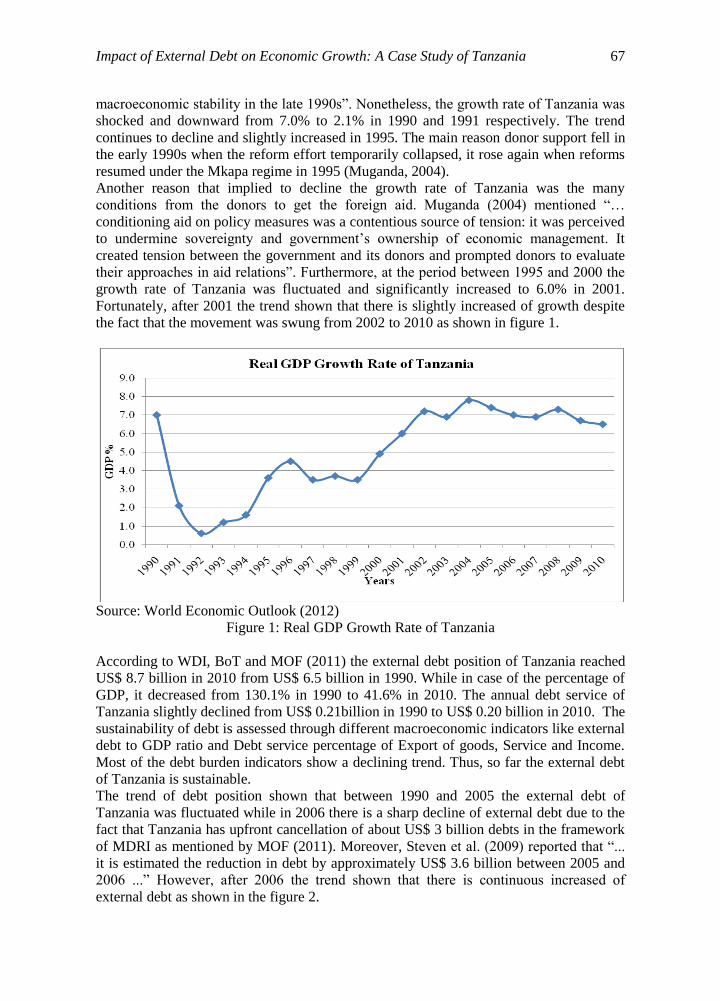
Impact of External Debt on Economic Growth: A Case Study of Tanzania 67
macroeconomic stability in the late 1990s”. Nonetheless, the growth rate of Tanzania was
shocked and downward from 7.0% to 2.1% in 1990 and 1991 respectively. The trend
continues to decline and slightly increased in 1995. The main reason donor support fell in
the early 1990s when the reform effort temporarily collapsed, it rose again when reforms
resumed under the Mkapa regime in 1995 (Muganda, 2004).
Another reason that implied to decline the growth rate of Tanzania was the many
conditions from the donors to get the foreign aid. Muganda (2004) mentioned “…
conditioning aid on policy measures was a contentious source of tension: it was perceived
to undermine sovereignty and government’s ownership of economic management. It
created tension between the government and its donors and prompted donors to evaluate
their approaches in aid relations”. Furthermore, at the period between 1995 and 2000 the
growth rate of Tanzania was fluctuated and significantly increased to 6.0% in 2001.
Fortunately, after 2001 the trend shown that there is slightly increased of growth despite
the fact that the movement was swung from 2002 to 2010 as shown in figure 1.
Source: World Economic Outlook (2012)
Figure 1: Real GDP Growth Rate of Tanzania
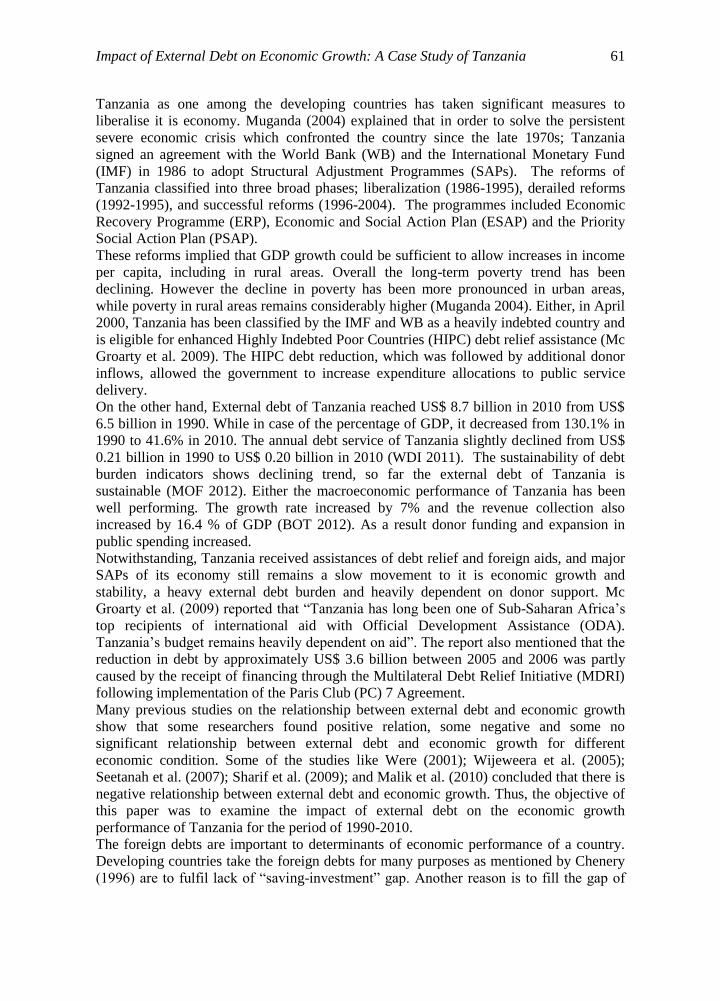
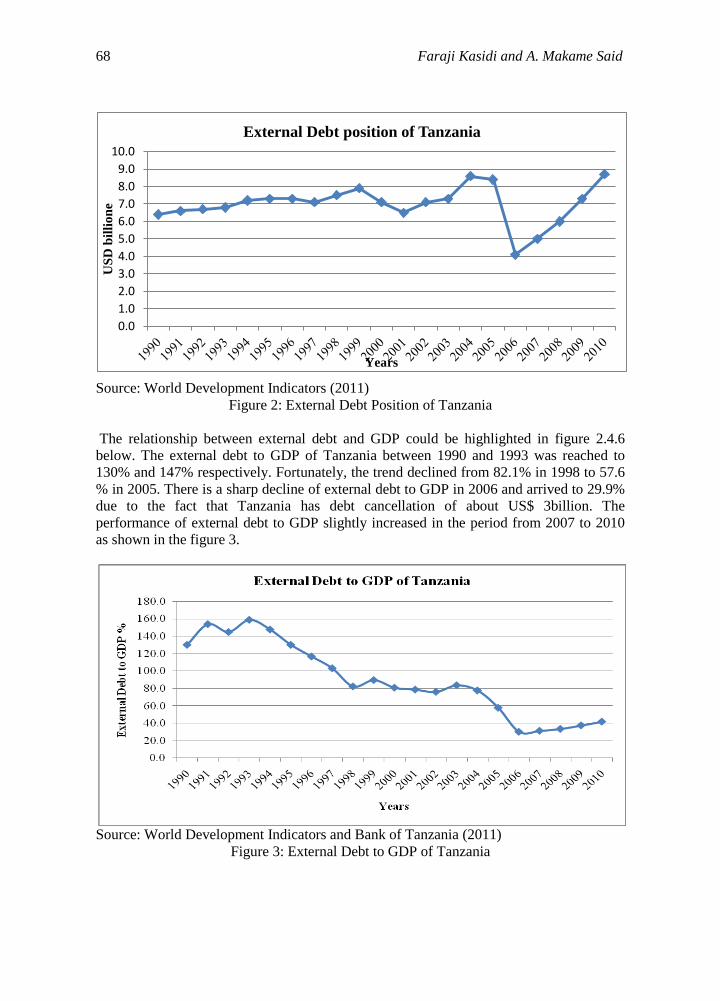
According to WDI, BoT and MOF (2011) the external debt position of Tanzania reached
US$ 8.7 billion in 2010 from US$ 6.5 billion in 1990. While in case of the percentage of
GDP, it decreased from 130.1% in 1990 to 41.6% in 2010. The annual debt service of
Tanzania slightly declined from US$ 0.21billion in 1990 to US$ 0.20 billion in 2010. The
sustainability of debt is assessed through different macroeconomic indicators like external
debt to GDP ratio and Debt service percentage of Export of goods, Service and Income.
Most of the debt burden indicators show a declining trend. Thus, so far the external debt
of Tanzania is sustainable.
The trend of debt position shown that between 1990 and 2005 the external debt of
Tanzania was fluctuated while in 2006 there is a sharp decline of external debt due to the
fact that Tanzania has upfront cancellation of about US$ 3 billion debts in the framework
of MDRI as mentioned by MOF (2011). Moreover, Steven et al. (2009) reported that “...
it is estimated the reduction in debt by approximately US$ 3.6 billion between 2005 and
2006 ...” However, after 2006 the trend shown that there is continuous increased of
external debt as shown in the figure 2.
68 Faraji Kasidi and A. Makame Said
Source: World Development Indicators (2011)
Figure 2: External Debt Position of Tanzania
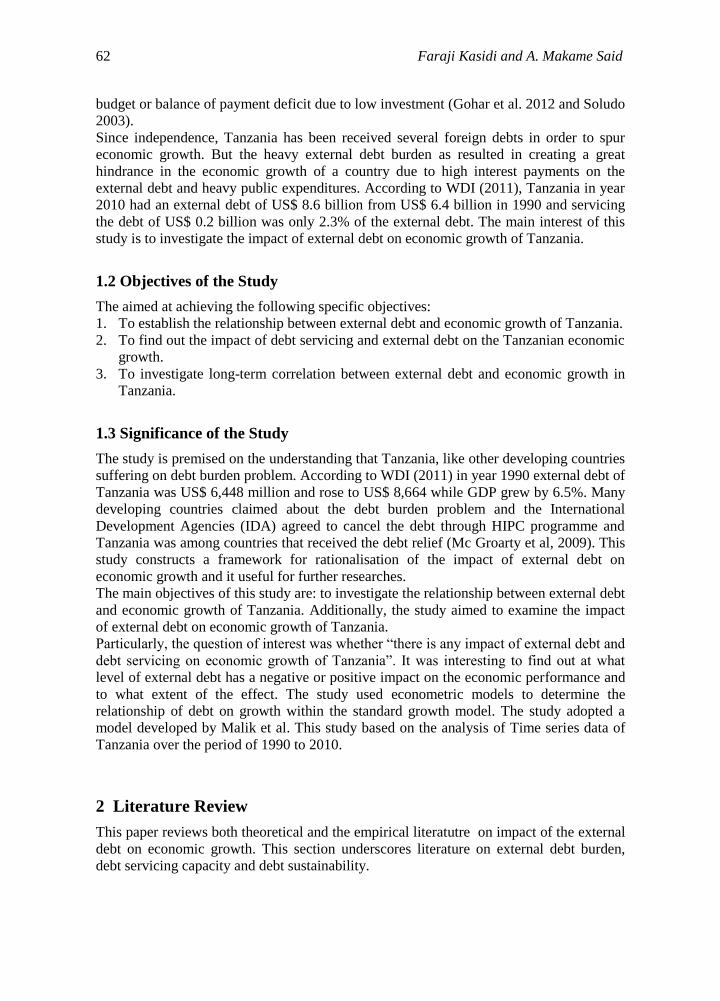
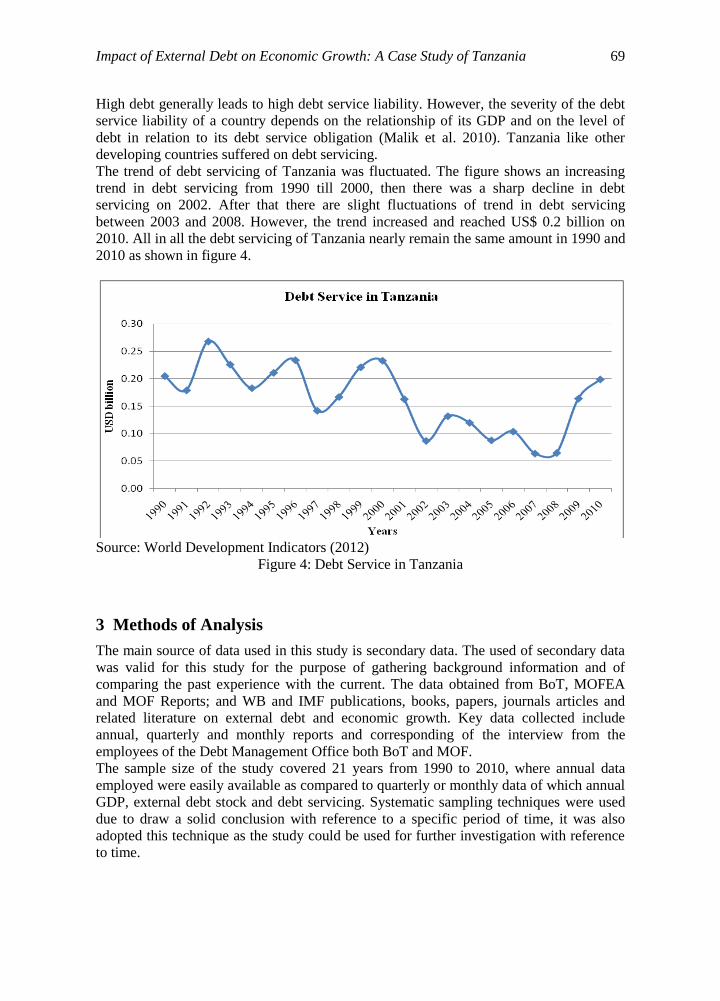
The relationship between external debt and GDP could be highlighted in figure 2.4.6
below. The external debt to GDP of Tanzania between 1990 and 1993 was reached to
130% and 147% respectively. Fortunately, the trend declined from 82.1% in 1998 to 57.6
% in 2005. There is a sharp decline of external debt to GDP in 2006 and arrived to 29.9%
due to the fact that Tanzania has debt cancellation of about US$ 3billion. The
performance of external debt to GDP slightly increased in the period from 2007 to 2010
as shown in the figure 3.
Source: World Development Indicators and Bank of Tanzania (2011)
Figure 3: External Debt to GDP of Tanzania
0.0
1.0
2.0
3.0
4.0
5.0
6.0
7.0
8.0
9.0
10.0
US
D b
illi
on
e
Years
External Debt position of Tanzania
Impact of External Debt on Economic Growth: A Case Study of Tanzania 69
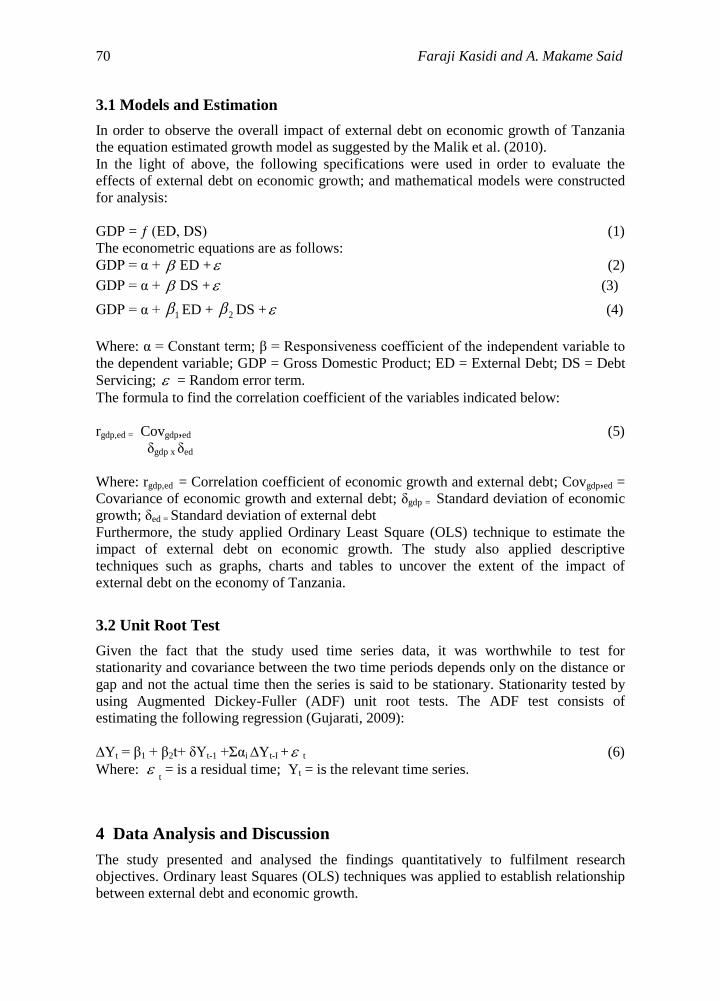
High debt generally leads to high debt service liability. However, the severity of the debt
service liability of a country depends on the relationship of its GDP and on the level of
debt in relation to its debt service obligation (Malik et al. 2010). Tanzania like other
developing countries suffered on debt servicing.
The trend of debt servicing of Tanzania was fluctuated. The figure shows an increasing
trend in debt servicing from 1990 till 2000, then there was a sharp decline in debt
servicing on 2002. After that there are slight fluctuations of trend in debt servicing
between 2003 and 2008. However, the trend increased and reached US$ 0.2 billion on
2010. All in all the debt servicing of Tanzania nearly remain the same amount in 1990 and
2010 as shown in figure 4.
Source: World Development Indicators (2012)
Figure 4: Debt Service in Tanzania
3 Methods of Analysis
The main source of data used in this study is secondary data. The used of secondary data
was valid for this study for the purpose of gathering background information and of
comparing the past experience with the current. The data obtained from BoT, MOFEA
and MOF Reports; and WB and IMF publications, books, papers, journals articles and
related literature on external debt and economic growth. Key data collected include
annual, quarterly and monthly reports and corresponding of the interview from the
employees of the Debt Management Office both BoT and MOF.
The sample size of the study covered 21 years from 1990 to 2010, where annual data
employed were easily available as compared to quarterly or monthly data of which annual
GDP, external debt stock and debt servicing. Systematic sampling techniques were used
due to draw a solid conclusion with reference to a specific period of time, it was also
adopted this technique as the study could be used for further investigation with reference
to time.
70 Faraji Kasidi and A. Makame Said
3.1 Models and Estimation
In order to observe the overall impact of external debt on economic growth of Tanzania
the equation estimated growth model as suggested by the Malik et al. (2010).
In the light of above, the following specifications were used in order to evaluate the
effects of external debt on economic growth; and mathematical models were constructed
for analysis:
GDP = ƒ (ED, DS) (1)
The econometric equations are as follows:
GDP = α + ED + (2)
GDP = α + DS + (3)
GDP = α + 1 ED + 2 DS + (4)
Where: α = Constant term; β = Responsiveness coefficient of the independent variable to
the dependent variable; GDP = Gross Domestic Product; ED = External Debt; DS = Debt
Servicing; = Random error term.
The formula to find the correlation coefficient of the variables indicated below:
rgdp,ed = Covgdp,ed (5)
δgdp x δed
Where: rgdp,ed = Correlation coefficient of economic growth and external debt; Covgdp,ed =
Covariance of economic growth and external debt; δgdp = Standard deviation of economic
growth; δed = Standard deviation of external debt
Furthermore, the study applied Ordinary Least Square (OLS) technique to estimate the
impact of external debt on economic growth. The study also applied descriptive
techniques such as graphs, charts and tables to uncover the extent of the impact of
external debt on the economy of Tanzania.
3.2 Unit Root Test
Given the fact that the study used time series data, it was worthwhile to test for
stationarity and covariance between the two time periods depends only on the distance or
gap and not the actual time then the series is said to be stationary. Stationarity tested by
using Augmented Dickey-Fuller (ADF) unit root tests. The ADF test consists of
estimating the following regression (Gujarati, 2009):
∆Yt = β1 + β2t+ δYt-1 +Σαi ∆Yt-I + t (6)
Where: t = is a residual time; Yt = is the relevant time series.
4 Data Analysis and Discussion
The study presented and analysed the findings quantitatively to fulfilment research
objectives. Ordinary least Squares (OLS) techniques was applied to establish relationship
between external debt and economic growth.
Impact of External Debt on Economic Growth: A Case Study of Tanzania 71
4.1 The Relationship between External Debt and Economic Growth
The first objective of this study was established the relationship between external debt and
economic growth in Tanzania for the period of 1990 to 2010. To overcome with this
objective three methods are used. The methods are graphically presented in figure 5 and
in the following simple equations (7) and (8) below:
GDP = α ± ED + (7)
GDP = α ± DS + (8)
Where: GDP is percentage of economic growth; α is a constant term; β is the
Responsiveness coefficient of the independent variable to dependent variable; ED is
external debt and DS is debt servicing and is a random error term.
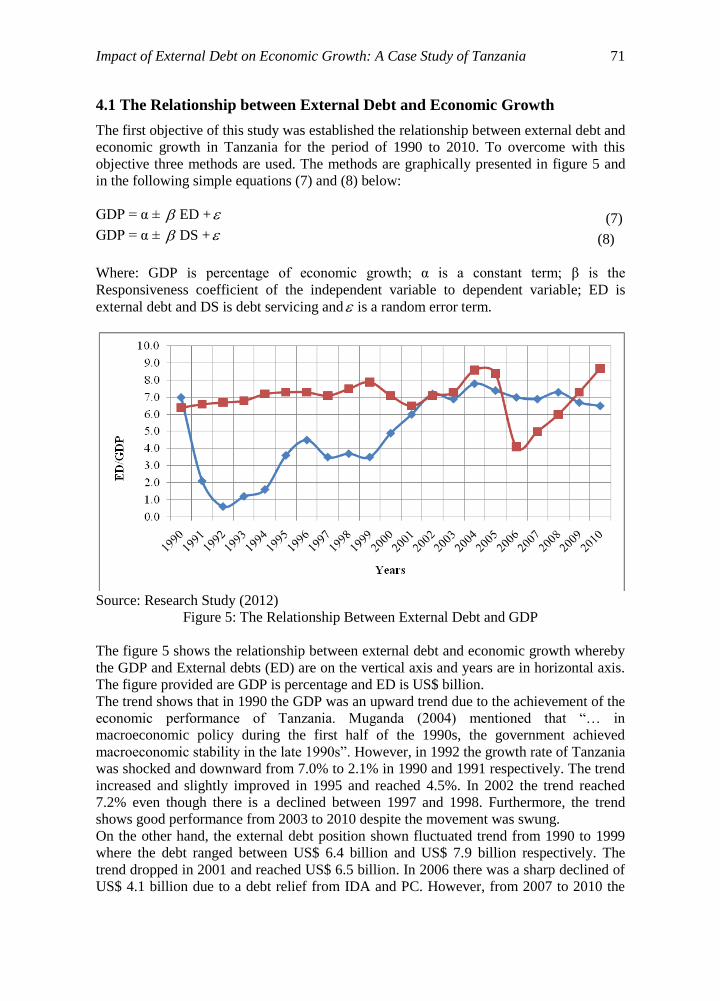
Source: Research Study (2012)
Figure 5: The Relationship Between External Debt and GDP
The figure 5 shows the relationship between external debt and economic growth whereby
the GDP and External debts (ED) are on the vertical axis and years are in horizontal axis.
The figure provided are GDP is percentage and ED is US$ billion.
The trend shows that in 1990 the GDP was an upward trend due to the achievement of the
economic performance of Tanzania. Muganda (2004) mentioned that “… in
macroeconomic policy during the first half of the 1990s, the government achieved
macroeconomic stability in the late 1990s”. However, in 1992 the growth rate of Tanzania
was shocked and downward from 7.0% to 2.1% in 1990 and 1991 respectively. The trend
increased and slightly improved in 1995 and reached 4.5%. In 2002 the trend reached
7.2% even though there is a declined between 1997 and 1998. Furthermore, the trend
shows good performance from 2003 to 2010 despite the movement was swung.
On the other hand, the external debt position shown fluctuated trend from 1990 to 1999
where the debt ranged between US$ 6.4 billion and US$ 7.9 billion respectively. The
trend dropped in 2001 and reached US$ 6.5 billion. In 2006 there was a sharp declined of
US$ 4.1 billion due to a debt relief from IDA and PC. However, from 2007 to 2010 the
72 Faraji Kasidi and A. Makame Said
trend shows the debt position slightly increased hence the position reached US$ 6.5
billion in 2010.
Furthermore, the study analysed the relationship between external debt and economic
growth by using the regression analysis and found that there is negative relationship for
both External Debt (ED) and Debt Servicing (DS) on economic growth of Tanzaniaas
explained below.
4.1.1 External debt and economic growth
External debt (or foreign debt) is that part of the total debt in a country that is owed to
creditors outside the country. Economic growth is the increase in the capacity of an
economy to produce goods and services, compared from one period of time to another as
indicated in Table 2 below.
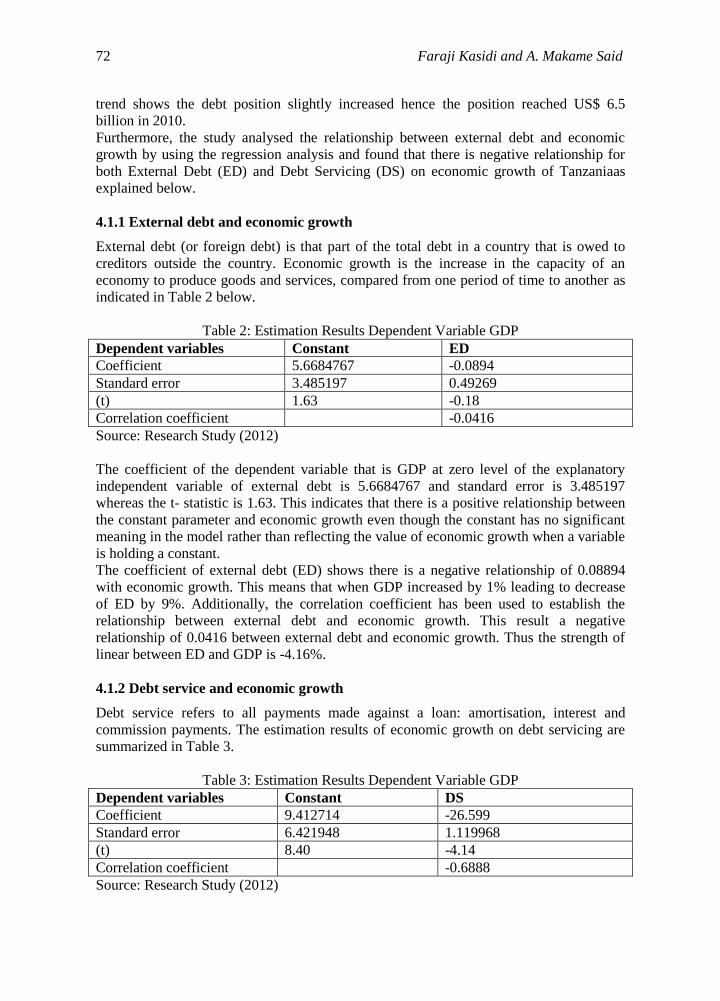
Table 2: Estimation Results Dependent Variable GDP
Dependent variables Constant ED
Coefficient 5.6684767 -0.0894
Standard error 3.485197 0.49269
(t) 1.63 -0.18
Correlation coefficient -0.0416
Source: Research Study (2012)
The coefficient of the dependent variable that is GDP at zero level of the explanatory
independent variable of external debt is 5.6684767 and standard error is 3.485197
whereas the t- statistic is 1.63. This indicates that there is a positive relationship between
the constant parameter and economic growth even though the constant has no significant
meaning in the model rather than reflecting the value of economic growth when a variable
is holding a constant.
The coefficient of external debt (ED) shows there is a negative relationship of 0.08894
with economic growth. This means that when GDP increased by 1% leading to decrease
of ED by 9%. Additionally, the correlation coefficient has been used to establish the
relationship between external debt and economic growth. This result a negative
relationship of 0.0416 between external debt and economic growth. Thus the strength of
linear between ED and GDP is -4.16%.
4.1.2 Debt service and economic growth
Debt service refers to all payments made against a loan: amortisation, interest and
commission payments. The estimation results of economic growth on debt servicing are
summarized in Table 3.
Table 3: Estimation Results Dependent Variable GDP
Dependent variables Constant DS
Coefficient 9.412714 -26.599
Standard error 6.421948 1.119968
(t) 8.40 -4.14
Correlation coefficient -0.6888
Source: Research Study (2012)
Impact of External Debt on Economic Growth: A Case Study of Tanzania 73
The coefficient of the dependent variable GDP at zero level of the explanatory
independent variable of debt service is 9.412714 and standard error is 6.421948 whereas
the t statistic is 8.40. This indicates a positive relationship between the constant parameter
and economic growth even though the constant has no significant meaning in the model
than reflecting the value of economic growth when a variable is holding a constant.
The coefficient of debt servicing (DS) shows there is a negative relationship of 26.599
with economic growth. This means that when GDP increased by 1% the DS imply to
decrease the GDP by 2669.9%. Additionally, the correlation coefficient has been used to
establish the relationship between debt servicing and economic growth. The result of the
study shows there is negative relationship of 0.6888 between debt servicing and economic
growth. Thus the degree of linear between DS and GDP is -68.88%
4.2 Impact of ED and DS on Tanzanian Economic Growth
The second objective of this study was uncovered the impact of ED and DS on Tanzanian
economic growth in the period of 1990 to 2010. In order to overcome with this objective
two methods are used, graphical as presented in Figure 6 and in the equation (9).
GDP = α + 1 ED + 2 DS + (9)
Where: GDP is percentage of economic growth; α is a constant term; β is the
Responsiveness coefficient of the independent variable to dependent variable; ED is
external debt and DS is debt servicing and is a random error term.
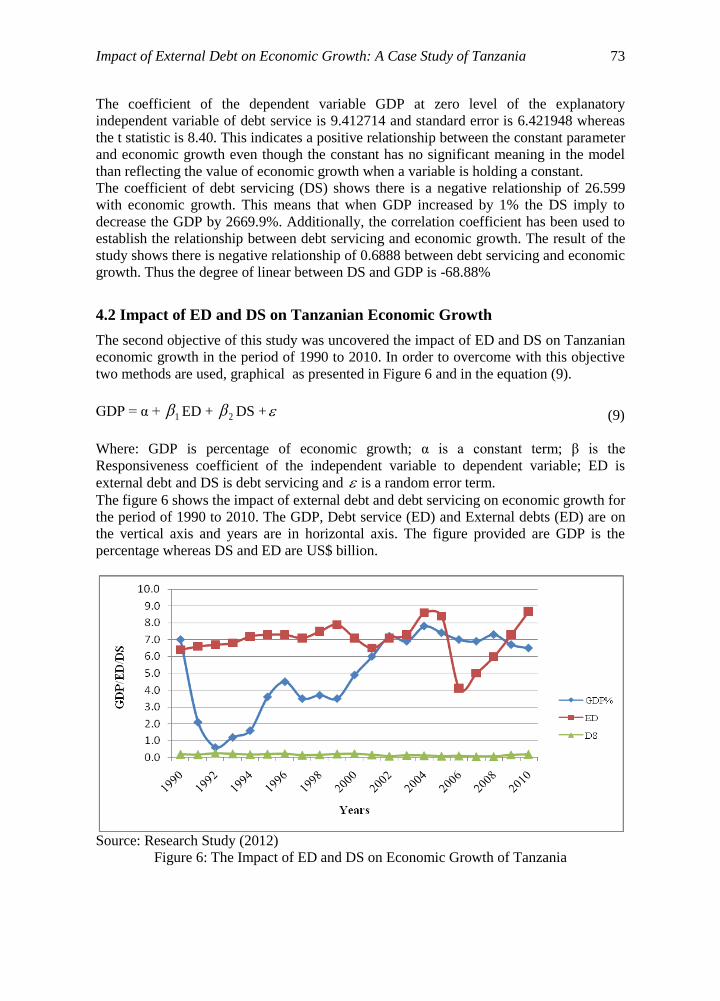
The figure 6 shows the impact of external debt and debt servicing on economic growth for
the period of 1990 to 2010. The GDP, Debt service (ED) and External debts (ED) are on
the vertical axis and years are in horizontal axis. The figure provided are GDP is the
percentage whereas DS and ED are US$ billion.
Source: Research Study (2012)
Figure 6: The Impact of ED and DS on Economic Growth of Tanzania
74 Faraji Kasidi and A. Makame Said
The trend of GDP and ED were explained in section 4.1. In case of debt servicing the
trend shows that there is a fluctuation trend from 1990 to 2010. In general, the debt
servicing was fluctuating between US$ 0.27 billion and US$ 0.18 billion in the period
from 1990 to 2000. Moreover, on the period of 2001 to 2006 the debt service was ranged
between US$ 0.16 billion and US$ 0.10 billion, then there was a sharp decline in debt
servicing on 2007 and 2008 which reached US$ 0.06 billion and US$ 0.07 billion
respectively. After that there was increased of debt servicing and reached US$ 0.16 billion
and US$ 0.20 billion in 2009 and 2010 respectively. Thus, this proves or indicates the
debt servicing of Tanzania nearly remained the same during the 1990 to 2010.
Furthermore, the study analysed the impact of external debt and debt service on economic
growth by using the regression analysis in Ordinary Least Square (OLS) methodology and
the results of estimations are reported in Table 4 below the regression result shows that
there is significant impact of the external debt service and external debt on economic
growth. The debt service payment has a negative effect and external debt has a positive
effect. The evidence suggests that increase in external debt will lead to increase in
economic growth and as the debt servicing increase, there is fewer opportunities for
economic growth.
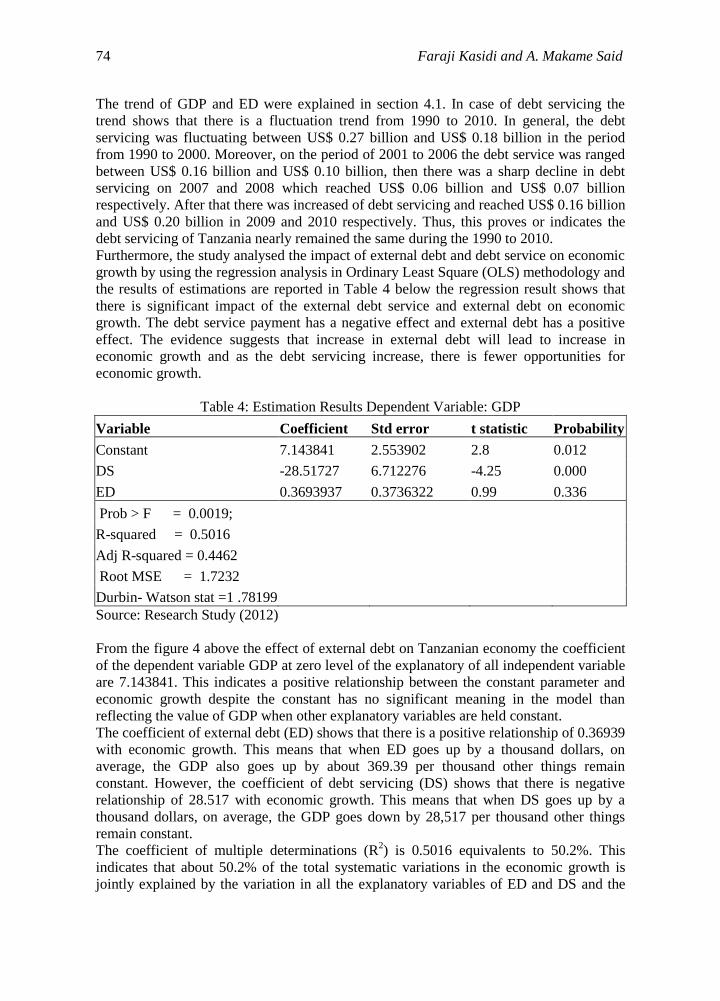
Table 4: Estimation Results Dependent Variable: GDP
Variable Coefficient Std error t statistic Probability
Constant 7.143841 2.553902 2.8 0.012
DS -28.51727 6.712276 -4.25 0.000
ED 0.3693937 0.3736322 0.99 0.336
Prob > F = 0.0019;
R-squared = 0.5016
Adj R-squared = 0.4462
Root MSE = 1.7232
Durbin- Watson stat =1 .78199
Source: Research Study (2012)
From the figure 4 above the effect of external debt on Tanzanian economy the coefficient
of the dependent variable GDP at zero level of the explanatory of all independent variable
are 7.143841. This indicates a positive relationship between the constant parameter and
economic growth despite the constant has no significant meaning in the model than
reflecting the value of GDP when other explanatory variables are held constant.
The coefficient of external debt (ED) shows that there is a positive relationship of 0.36939
with economic growth. This means that when ED goes up by a thousand dollars, on
average, the GDP also goes up by about 369.39 per thousand other things remain
constant. However, the coefficient of debt servicing (DS) shows that there is negative
relationship of 28.517 with economic growth. This means that when DS goes up by a
thousand dollars, on average, the GDP goes down by 28,517 per thousand other things
remain constant.
The coefficient of multiple determinations (R2) is 0.5016 equivalents to 50.2%. This
indicates that about 50.2% of the total systematic variations in the economic growth is
jointly explained by the variation in all the explanatory variables of ED and DS and the
Impact of External Debt on Economic Growth: A Case Study of Tanzania 75
remaining 49.8% could be attributed to the stochastic error term not included in the
model.
4.3 The Long-term Relationship Between ED and Economic Growth
The third objective was to find the long-term relationship between external debt and
economic growth in Tanzania. In order to overcome this objective the analysis used the
different tests such as Augmented Dickey-Fuller unit root test, the Johansen co-
integration test and Durbin Watson.
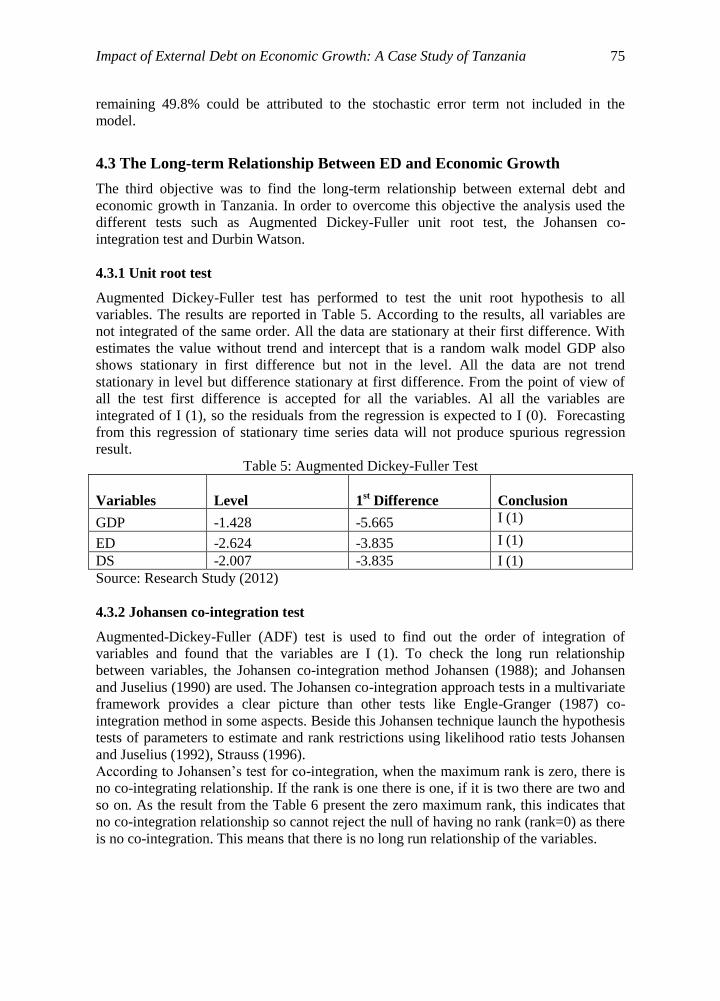
4.3.1 Unit root test
Augmented Dickey-Fuller test has performed to test the unit root hypothesis to all
variables. The results are reported in Table 5. According to the results, all variables are
not integrated of the same order. All the data are stationary at their first difference. With
estimates the value without trend and intercept that is a random walk model GDP also
shows stationary in first difference but not in the level. All the data are not trend
stationary in level but difference stationary at first difference. From the point of view of
all the test first difference is accepted for all the variables. Al all the variables are
integrated of I (1), so the residuals from the regression is expected to I (0). Forecasting
from this regression of stationary time series data will not produce spurious regression
result.
Table 5: Augmented Dickey-Fuller Test
Variables Level 1st Difference
Conclusion
GDP -1.428 -5.665 I (1)
ED -2.624 -3.835 I (1)
DS -2.007 -3.835 I (1)
Source: Research Study (2012)
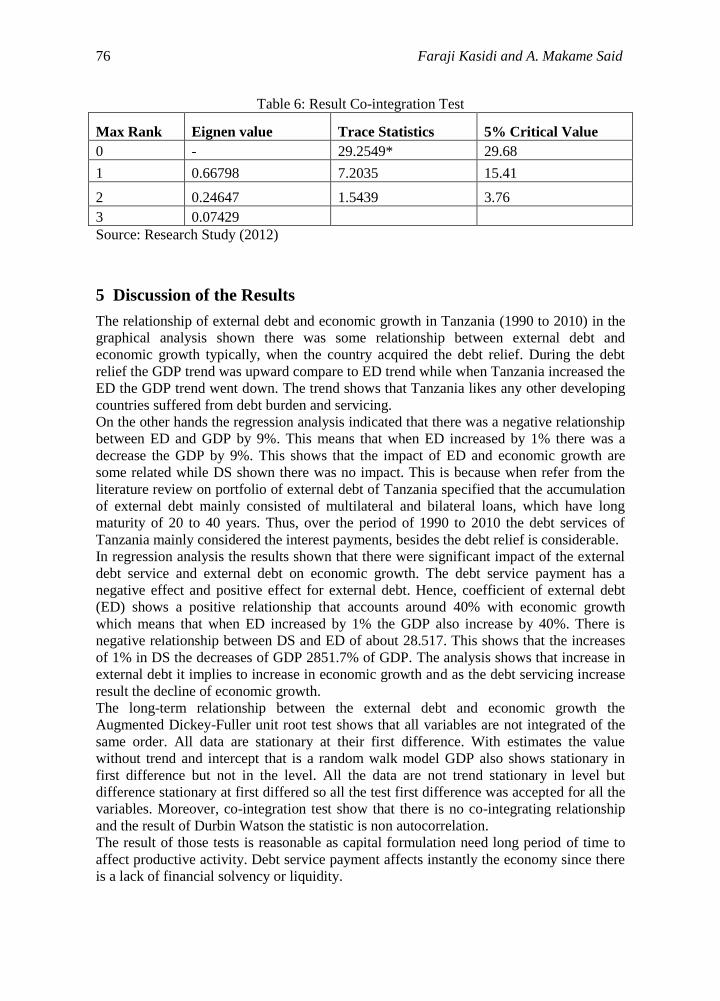
4.3.2 Johansen co-integration test
Augmented-Dickey-Fuller (ADF) test is used to find out the order of integration of
variables and found that the variables are I (1). To check the long run relationship
between variables, the Johansen co-integration method Johansen (1988); and Johansen
and Juselius (1990) are used. The Johansen co-integration approach tests in a multivariate
framework provides a clear picture than other tests like Engle-Granger (1987) co-
integration method in some aspects. Beside this Johansen technique launch the hypothesis
tests of parameters to estimate and rank restrictions using likelihood ratio tests Johansen
and Juselius (1992), Strauss (1996).
According to Johansen’s test for co-integration, when the maximum rank is zero, there is
no co-integrating relationship. If the rank is one there is one, if it is two there are two and
so on. As the result from the Table 6 present the zero maximum rank, this indicates that
no co-integration relationship so cannot reject the null of having no rank (rank=0) as there
is no co-integration. This means that there is no long run relationship of the variables.
76 Faraji Kasidi and A. Makame Said
Table 6: Result Co-integration Test
Source: Research Study (2012)
5 Discussion of the Results
The relationship of external debt and economic growth in Tanzania (1990 to 2010) in the
graphical analysis shown there was some relationship between external debt and
economic growth typically, when the country acquired the debt relief. During the debt
relief the GDP trend was upward compare to ED trend while when Tanzania increased the
ED the GDP trend went down. The trend shows that Tanzania likes any other developing
countries suffered from debt burden and servicing.
On the other hands the regression analysis indicated that there was a negative relationship
between ED and GDP by 9%. This means that when ED increased by 1% there was a
decrease the GDP by 9%. This shows that the impact of ED and economic growth are
some related while DS shown there was no impact. This is because when refer from the
literature review on portfolio of external debt of Tanzania specified that the accumulation
of external debt mainly consisted of multilateral and bilateral loans, which have long
maturity of 20 to 40 years. Thus, over the period of 1990 to 2010 the debt services of
Tanzania mainly considered the interest payments, besides the debt relief is considerable.
In regression analysis the results shown that there were significant impact of the external
debt service and external debt on economic growth. The debt service payment has a
negative effect and positive effect for external debt. Hence, coefficient of external debt
(ED) shows a positive relationship that accounts around 40% with economic growth
which means that when ED increased by 1% the GDP also increase by 40%. There is
negative relationship between DS and ED of about 28.517. This shows that the increases
of 1% in DS the decreases of GDP 2851.7% of GDP. The analysis shows that increase in
external debt it implies to increase in economic growth and as the debt servicing increase
result the decline of economic growth.
The long-term relationship between the external debt and economic growth the
Augmented Dickey-Fuller unit root test shows that all variables are not integrated of the
same order. All data are stationary at their first difference. With estimates the value
without trend and intercept that is a random walk model GDP also shows stationary in
first difference but not in the level. All the data are not trend stationary in level but
difference stationary at first differed so all the test first difference was accepted for all the
variables. Moreover, co-integration test show that there is no co-integrating relationship
and the result of Durbin Watson the statistic is non autocorrelation.
The result of those tests is reasonable as capital formulation need long period of time to
affect productive activity. Debt service payment affects instantly the economy since there
is a lack of financial solvency or liquidity.
Max Rank Eignen value Trace Statistics 5% Critical Value
0 - 29.2549* 29.68
1 0.66798 7.2035 15.41
2 0.24647 1.5439 3.76
3 0.07429
Impact of External Debt on Economic Growth: A Case Study of Tanzania 77
6 Summary of the Research Findings
The analysis results show that there is significant impact of the external debt and debt
service on economic growth of Tanzania. The debt service payment has a negative effect
and external debt has a positive effect. This seems to support the empirical assertion by
Ruby (2012) on a study of the impact of external debt on economic of Bangladesh.
Tanzania has spent about 26% of its external debt for BOP support and the rest spent in
other activities whereby infrastructure only accumulated 36%. This means that remain
sectors spent about 38% only on external debt. This show that the impact of external debt
on economic growth of Tanzania has a positive relationship because the uses of funds
mainly support to development sectors.
Besides, the portfolio of external debt of Tanzania is mainly accumulated multilateral and
bilateral loans which are about 95% of total external debt. This position influenced the
greater level of concessional in a debt stock of Tanzania as a result allows for long grace
and maturity periods and low interest, compared with commercial and export loans which
are short maturity and high interest rate.
Alternatively, the debt servicing affects the economic growth of Tanzania because the
returns from infrastructure sector take a long time to implement hence the payment of
debt service should derive from other sectors. Thus, the debt relief from IDA and PC in
Tanzania most likely implied to boost the economic growth in other way around.
However, on the period of 1990 to 2010 the debt servicing of Tanzania was very low, and
this is because the most loans are mature in long period hence the payment for the whole
period is interest payments and a few of other loans.
The regression analysis result has shown that there is significant impact of the external
debt and external debt service on GDP growth. The total external debt stock has a positive
effect of 0.36939 and debt service payment has a negative effect of 28.517. This means
that when the country increase to take external debt it might lead to increase in economic
growth while when the country decide to service the external debt might lead to disturb
the economic growth of the country. Either, in a long run relationship the unit root test
shows that there is no long run relationship of the external debt and GDP.
6.1 Recommendations of the Study
External debt is a very important area in any country for boosting the economic activities.
It is a contradiction whether external debt stimulates economic growth or hinders growth.
Some researchers found positive relation, some negative and some no significant relation
between external debt and economic growth for different economic condition.
Deficit financing takes place either from internal sources or external source. Any
government borrows either for revenue or development expenditure. Higher indebtedness
can affect growth rate through different channels. High current stock of external debt may
act as future increasing obligations to serve a debt. This represents all things that debt
financed fiscal policy affect economic growth for the lack of availability of investment
resources.
Hence, in this study it is recommended that in future plans should ensure to take an
external debt which productive used and the rate of return of debt is higher than the
service payment rate. It should be a serious concern for what the purpose of external debt
is undertaken and to provide the efficiency of domestic resource uses (that is, it will be
advisable for the government to create other optional strategies to improve their income
78 Faraji Kasidi and A. Makame Said
using their natural and cultural endowment so that they can an increase their economy
rather than depending to the extrenat debt) and to reducing unnecessary cost of
government to spend the budget in the right way in order to avoid the bulky deficit.
6.2 Policy Implications and Limitations of the study
In order to find some policy implications for this study it the government should provide
the following: The government should pay more attention to the debt management profile
and particularly for its items of expenditure. It should try to the best in implementing the
borrowing funds to proper and productive programmes for the betterment of the whole
nation. Importantly, the government should establish, maintain and manage a credible
database. The database should provide timely, accurate and comprehensive data to
requisite stakeholders for the purpose of disclosure and DSA.
Moreover the government should establish a transparency of loan cycle that covers the
activities for project identification, appraisal and approval, loan negotiations and
contracting, loan disbursements, project implementation monitoring and evaluation as
well as loan repayment. Finally, the government should provide a policy framework that
is credibly creating an environment that will encourage investors’ confidence for both
local and foreign to invest in the country.
The study based on a case study at Ministry of Finance (MOF), Tanzania and Bank of
Tanzania (BoT) Zanzibar branch. The research explored the impact of external debt on
economic growth of Tanzania and used the data from 1990 to 2010. During this period
there was a debt cancellation that contributed in the economic performance of Tanzania.
However, due to the difficulty of the availability of data of debt cancellation distributed to
government sectors such as education, health, agriculture and infrastructures it is difficult
to measure the contribution of debt relief on the economic growth of Tanzania.
Another limitation was a lack of time availability and availability of funds to perform the
study at a very significant depth. Also most of the top managements are scared to provide
the data, taking to granted that these data are very confidential and it is for the
government purposes only.
6.3 Suggestions for Further Research
External debt is a very interesting study, it involves many areas thus on further research it
is better to consider some of the following areas: The impact of private external debt on
economic growth, the impact of external debt on foreign direct investments and the
impact of external debt on domestic revenues.
References
[1] Deshpande, The debt overhang and the disincentive to invest, Journal of Economics
Development, 52(1), (1997), 169-87.
[2] F. Presbitero, Total public debt and growth in developing countries, Università
Politecnica delle Marche (Italy), MoFiR Working Paper No. 44, (2010). Avaialable
at : http://docs.dises.univpm.it/web/quaderni/pdfmofir/Mofir044.pdf accessed on
15.02.2013
Impact of External Debt on Economic Growth: A Case Study of Tanzania 79
[3] Freytag and G. Pehnelt, Debt relief and governance quality in developing countries,
World Development, 37 (1), (2009), 62-80.
[4] Hameed, H. Ashraf and M. A. Chaudhary, External Debt and its Impact on
Economic and Business Growth in Pakistan, International Research Journal of
Finance and Economics, Issue 20 (2008), 132-140.
[5] K. Fosu, The External Debt-Servicing Constraint and Public Expenditure
Composition in Sub- Sahara Africa, World Institute for Economic Research,
Working Paper W36, (2009).
[6] K. Fosu, The Impact of External Debt on Economic Growth in Sub-Saharan Africa,
Journal of Economic Development, 21(1), (1996), 93–117.
[7] Muganda, Tanzanian’s Economic Reform and Lesson Learned, The World Bank
Report, Washington, D. C., (2004).
[8] R. Chowdhury, External Debt and Growth in Developing Countries: A Sensitivity
and Causal Analysis, World Institute for Economic Research, Discussion Paper
No.95, (2001).
[9] Wijeweera, B. Dollery and P. Pathberiya, Economic Growth and External Debt
Servicing: A Co-integration Analysis of Sri Lanka, 1952 to 2002, Working Paper
W2005-8, 2005. Avaialble at: http://www.une.edu.au/business-school/working-
papers/economics/1999-2007/econ-2005-8.pdf accessed on 24.09. 2012.
[10] B B. King, Notes on Mechanics of Growth and Debt, World Bank Staff Occasional
Papers 6, Baltimore, (1968).
[11] Seetanah, K. Padachi and R. Durbarry, External debt and economic growth: A
vector error correction approach, International Journal of Business Research, 7(5),
(2007). Avaialble ata http://www.freepatentsonline.com/article/International-
Journal-Business-Research/178945825.html accessed on 15.02.2013.
[12] Bank of Tanzania, Monthly Economic Review (MER) - June 2011. Available on
http:// www.bot-tz.org/Publications/Monthly Economic Review/MER_
JUNE_2011.pdf accessed on 24.09. 2012.
[13] Bank of Tanzania, Monthly Economic Reviews, Quarterly Reports, Annual Report
and various issues (2012). Available on http:// www.bot-
tz.org/Publications/publications And Statistics.asp accessed on 13th September,
2012.
[14] Benedict, R. Bhattacharya and T. Q. Nguyen, External Debt, Public Investment, and
Growth in Low-Income Countries, IMF Working Paper WP/03/249, (2003).
[15] C. Soludo, Debt Poverty and Inequality, in Okojo Iweala, Soludo, and Muntar (Eds).
The debt trap in Nigeria, African World Press NJ. 2003, 23-74.
[16] Pattillo, L. Ricci and H. Poirson, External Debt and Growth, IMF Working Paper
No. W02/69, (2002).
[17] W. J. Granger, Investigating causal relations by econometric models and cross
spectral methods, Econometrica, 37(3), (1969), 424-438.
[18] A. Dickey and W. A. Fuller, Distribution of the estimators for autoregressive time-
series with a unit root, Journal of the American Statistical Association, 74 (366),
(1979), 427-31.
[19] C. Mc Donald, Debt Capacity and Developing Country Borrowing: A Survey of the
literature, IMF Working Paper, W29 (4), (1982).
[20] N. Gujarati, Basic Econometrics, Mc Graw Hill, New Delhi, (2004).
80 Faraji Kasidi and A. Makame Said
[21] C. Hernandez, Issues in design of Growth Exercises, IMF Working Paper,
WP/88/65, (1974).
[22] B. Chenery and A.M. Strout (1966), Foreign Assistance and Economic, American
Review, 56(4), (1966), 679–733.
[23] Sharif, S. Malik and M. Ramazan, Impact of foreign debt and savings on Pakistan,
Journal of Quality and Technology Management, 5(11), (2009), 101-115.
[24] Eaton, Sovereign Debt: A Primer, The World Bank Economic Review, 7(2), (1993),
137-172.
[25] Lewis, M. Giugale, S. Lizondo and D. Desruelle, Debt Sustainability Analysis:
United Republic of Tanzania, Joint WB and IMF, 4(21), (2011), 54-66.
[26] M. Frimpong and E. F. Oteng-Abayie, The impact of external debt on economic
growth in Ghana: A Cointegration Analysis, Journal of Science and Technology, 26
(3), (2003), 121-130.
[27] J. Sachs, The Charade of Debt Sustainability, The Financial Times dated on
Tuesday, 26th September, 2000. Avaialble at:
http://www.earth.columbia.edu/sitefiles/file/Sachs%20Writing/2000/FT_2000_TheC
haradeofDebtSustainability_09_26_00.pdf accessed on 15.02.2013.
[28] A. Chowdhury, Structural Analysis of External Debt and Economic Growth: Some
Evidence From Selected Countries in Asia and the Pacific, Applied Economics, 26
(12), (1994), 1121- 1131.
[29] K. John and M. Sammy, The debt service burden and growth: evidence from low
income countries, Journal of Development Economics, 32(2), (2001), 315-335.
[30] Abrego and D. C. Ross, Debt Relief under HIPC Initiative: Context and Outlook for
Debt Sustainability and Resource Flows, World Institute for Economic Research,
IMF Working Paper WP/01/144, (2001).
[31] L. Boboye and O. M. Ojo, Effect of External Debt on Economic Growth and
Development of Nigeria, International Journal of Business and Social Science,
3(12), (2012), 297- 304.
[32] L. Ndikumana, Additionality of debt relief and debt forgiveness, and implications
for future volumes of official assistance, International Review of Economics and
Finance Vol. 13, (2004), 325-40.
[33] A. Iyoha, External debt and economic growth in sub-Saharan African countries: An
econometric study, African Economic Research Consortium, AERC Research Paper
90, (1990).
[34] M. Barbara, Growth and foreign debt: The Ugandan experience, African Economic
Research Consortium- Kenya, AERC Research Paper 66, (1997).
[35] M. Cholifihani, A Co-integration Analysis of Public Debt Service and GDP in
Indonesia, Journal of Management and Social Sciences, 4(2), (2008), 68-81.
[36] M. Gohar, N. A. Bhutto and F. Butt, The Impact of External Debt Servicing on the
growth of Low-Income Countries, Sukkur Institute of Business Administration,
Proceedings of 2nd
International Conference on Business Management (ISBN: 978-
969-9368-06-6), (2012). Available at: http://www.umt.edu.pk/icobm2012/pdf/2C-
85P.pdf accessed on 15.02.2013.
[37] M. Iftikhar ul Husnain, M. Khan, I. ul Haq Padda, N. Akram and A. Haider, Public
Spending, Foreign Direct Investment and Economic Growth, International Research
Journal of Finance and Economics, Issue 61, (2011), 20-28.
Impact of External Debt on Economic Growth: A Case Study of Tanzania 81
[38] M. N. Metwally and R. Tamaschcke, The interaction among foreign debt, Capital
flows and growth: Case studies, Journal of Policy Modelling, 16 (6), (1994), 597-
608.
[39] M. N. Quresh and K. Ali, Public Debt Burden and Economic Growth: Evidence
from Pakistan, International Research Journal of Finance and Economics, Issue 53,
(2010), 101-108.
[40] M. Nawaz, M. Quresh and N. W. Awan, Does External Debt Causes Economic
Growth: A Case of Pakistan, Romanian Economic Journal, 15(43), 2012, 131-144.
[41] M. S. Kumar and J. Woo, Public Debt and Growth, IMF Working Paper,
WP/10/174, (2010).
[42] M. Sichula, Debt Overhang and Economic Growth in HIPC Countries: The Case of
Southern African Development Community (SADC), International Journal of
Economics and Finance, 4(10), (2012), 82-92.
[43] M. Were, The Impact of External Debt on Economic Growth in Kenya: An
Empirical Assessment, World Institute for Economic Research, Paper No.2001/116,
2001. Avaialble at: http://www.wider.unu.edu/stc/repec/pdfs/dp2001/dp2001-
116.pdf accessed on 24.09. 2012.
[44] Ministry of Finance and Economic Affairs, Zanzibar debt policy, Zanzibar, (2007).
[45] Ministry of Finance, Medium - Term debt management strategy, United Republic
of Tanzania, Dar Es Salaam, Available on:
http://www.docstoc.com/docs/83297612/THE-UNITED-REPUBLIC-OF-
TANZANIA-MINISTRY-OF-FINANCE-MEDIUM-TERM-DEBT-
MANAGEMENT-STRATEGY-JUNE-2011 accessed on 13th August, 2012.
[46] Ministry of Finance, Medium Term debt management strategy, United Republic of
Tanzania, Dar Es Salaam, 2011.
[47] Ministry of Finance, The Economic Survey, United Republic of Tanzania, Dar Es
Salaam, 2009.
[48] Kappagoda and N. C. Alexander, Debt Sustainability Framework for Low Income
Countries: Policy and Resource Implications, Paper Submitted for the G-24
Technicl Group Meeting, Washington, D.C., September 27-28 (2004). Avaialble at:
http://www.nsi-ins.ca/wp-content/uploads/2012/10/2004-Debt-Sustainability-
Framework-for-Low-Income-Countries-Policy-and-Resource-Implications.pdf
accessed on 15.02.2013.
[49] N. Kutivadze, Public debt, domestic and external financing, and economic growth,
Working Paper No. 2011-12, (2011). Available at:
http://wp.demm.unimi.it/tl_files/wp/2011/DEMM-2011_012wp.pdf accessed on
15.02.2013.
[50] A. Ogunlana, Nigeria and the burden of external debt: The need for debt relief,
Central Bank of Nigeria, 2005. Available at http://www.g24.org/TGM/ongu0905.pdf
accessed on 15.02.2013.
[51] Blavy, Public debt and productivity: The difficult quest for growth in Jamaica, IMF
Working paper, WP/06/235, (2006). .
[52] Solomon, A Perspective on the Debt of Developing Countries, Brookings, Paper on
Economic Activity, 2, (1977), 479-510. Avaialble at:
http://www.brookings.edu/~/media/Projects/BPEA/1977%202/1977b_bpea_solomo
n_greenspan_kareken_ohlin.PDF accessed on 15.02.2013.
[53] T. Cunningham, The Effects of Debt Burden on Economic Growth in Heavily
Indebted Nations, Journal of economic development, 18(1), (1993), 115-126.
82 Faraji Kasidi and A. Makame Said
[54] Johansen and K. Juseline, Maximum likelihood estimation and inference on co-
integration with applications to the demand for money, Oxford Bulletin of
Economics and Statistics, 52(2), (1990), 169- 210.
[55] S. Malik, M. K. Hayat and M. U. Hayat, External Debt and Economic Growth:
Empirical Evidence from Pakistan, International Research Journal of Finance and
Economics, Issue 44, (2010), 88-97.
[56] S. Mc Groarty, D. Vorisek and A. Zaidi, Tanzania Country brief, The World Bank
Report, Washington, 2009. Available at:
http://issuu.com/world.bank.publications/docs/97808213786871/1?mode=a_p
accessed on 15.02.2013.
[57] S. Muhanji and K. Ojah, External shocks and persistence of external debt in open
vulnerable economies: The case of Africa, Economic Modelling, 28(4), (2011),
1615-1628.
[58] S. Omoruyi, Debt Burden (Sustainability) Indicators, Presantation Paper at Regional
Course on Debt Recording and Statistical Analysis, Organized by WAIFEM, (2005),
July 18-29, Lagos.
[59] S. Rubby, Economic Growth and External Public Debt: Empirical Evidence from
Bangladesh, 2012, available at:
http://www.publicdebtnet.org/public/results/intenet.org/public/results/index.jps?cmb
country=17 accessed on 15.02.2013.
[60] S. T. Nyoni, Foreign Aid and Economic Performance in Tanzania, African
Economic Research Consortium, Research Paper No.61, (1997). Avaialble at:
http://idl-bnc.idrc.ca/dspace/bitstream/10625/15736/1/106834.pdf accessed on
15.02.2013.
[61] Cordella, L.A. Ricci and M. Ruiz-Arranz, Debt overhang or debt irrelevance?
Revisiting the debt-growth Link, IMF Working Paper No. 05/223, (2005).
[62] T. K. Jayaraman and Lau. E, Does external debt lead to economic growth in Pacific
island countries, Journal of Policy Modelling, 31(2), (2009), 272-288.
[63] UNCTAD, From Adjustment to Poverty Reduction: What is New? Economic
Development in Africa, Geneva, United Nations Conference on Trade and
Development, 2002. Avaialble at: http://unctad.org/en/Docs/pogdsafricad2.en.pdf
accessed on 15.02.2013.