impact of every reath we tae the lifelong impact of air
TRANSCRIPT

The lifelong impact of air pollution
Every breath we take
The lifelong impact of air pollution
Every breath we take
Every breath we take The lifelong im
pact of air pollutionRoyal C
ollege of Physicians
Report of a working partyFebruary 2016
ISBN 978-1-86016-567-2 eISBN 978-1-86016-568-9
Royal College of Physicians 11 St Andrews Place Regent’s Park London NW1 4LE
www.rcplondon.ac.uk
Air_pollution_jacket_artwork_OUTER.indd 1 05/02/2016 14:34

Report of a working partyFebruary 2016
Every breath we take: the lifelong impact of air pollution

The Royal College of Physicians
The Royal College of Physicians (RCP) plays a leading role in the delivery of high-quality patient care bysetting standards of medical practice and promoting clinical excellence. The RCP provides physicians inover 30 medical specialties with education, training and support throughout their careers. As anindependent charity representing 32,000 fellows and members worldwide, the RCP advises and workswith government, patients, allied healthcare professionals and the public to improve health andhealthcare.
Citation for this document: Royal College of Physicians. Every breath we take: the lifelong impact of airpollution. Report of a working party. London: RCP, 2016.
Copyright
All rights reserved. No part of this publication may be reproduced in any form (including photocopyingor storing it in any medium by electronic means and whether or not transiently or incidentally to someother use of this publication) without the written permission of the copyright owner. Applications forthe copyright owner’s written permission to reproduce any part of this publication should be addressedto the publisher.
Copyright © Royal College of Physicians 2016
ISBN 978-1-86016-567-2eISBN 978-1-86016-568-9
Royal College of Physicians11 St Andrews PlaceRegent’s ParkLondon NW1 4LE
www.rcplondon.ac.uk
Registered charity no 210508
Typeset by Cambrian Typesetters, Camberley, SurreyPrinted and bound in Great Britain by The Lavenham Press, Suffolk

Contents
Foreword iv
Foreword – European perspective v
Preface vii
Members of the working party viii
Conflicts of interest x
Executive summary xii
Recommendations for action and research xiv
Definitions xvii
Introduction 1
Chapter 1: Summary 2
Chapter 1: Air pollution in our changing world 4
Chapter 2: Summary 16
Chapter 2: The air we breathe 18
Chapter 3: Summary 34
Chapter 3: In the beginning: protecting our future generations 36
Chapter 4: Summary 50
Chapter 4: Health effects of air pollution over our lifetime 52
Chapter 5: Summary 66
Chapter 5: Our vulnerable groups 68
Chapter 6: Summary 78
Chapter 6: The heavy cost of air pollution 80
Chapter 7: Summary 92
Chapter 7: Changing our future 94
Methodology 103
Acknowledgements 106
© Royal College of Physicians 2016 iii

Foreword
I am very pleased to introduce this report from the Royal College of Physicians (RCP) and the RoyalCollege of Paediatrics and Child Health (RCPCH), which takes a ‘cradle to grave’ approach toconsidering the impact of air pollution on our health.
Air pollution, to which we are all exposed to a lesser or greater extent, has a significant public healthburden. In 2010, the Department of Health’s Committee on the Medical Effects of Air Pollutants(COMEAP) reported that long-term exposure to outdoor air pollution caused the equivalent ofapproximately 29,000 deaths in 2008 in the UK. Current work by the committee suggests that the effectmight be even greater.
Some health effects associated with air pollution are well recognised, such as increases in hospitaladmissions and deaths from cardiovascular diseases, respiratory diseases and lung cancer. We know thatthose with pre-existing cardiovascular and respiratory diseases and older people are particularly at risk.However, researchers are finding that air pollution may be associated with a much wider range of healthconditions. For example, the report considers the evidence for effects of air pollution on diabetes andneurological disease, as well as how exposure during pregnancy may be associated with low birth weightand pre-term births. More research is needed to characterise the impacts, but there is no doubt that thehealth effects of air pollution are significant.
The report also explores how the sources of air pollution have changed and that it is not just an outdoorproblem; we spend much of our time indoors, where we can be exposed to numerous pollutants from avariety of sources. It considers what we can expect in the future with an increasing and ageingpopulation and climate change, and the pressures that these put on our changing society.
While air quality improvements have been made since the early 20th century, it is clear that we mustaddress the ongoing problem of air pollution and we all have a role to play, however big or small.Individuals can take steps to reduce their exposure to air pollution and reduce their impact on air qualityand the environment, for example by considering the transport they use and the routes they travel. Thistype of action alone is not sufficient to help those living in the most deprived areas, where levels of airpollution may be greater and where the death rates from cancer and cardiovascular diseases can behigher. If we are to make significant progress, collective action at population level is needed. Such actionwill not just reduce air pollution, but can also help to address other important public health andenvironmental issues such as health inequalities, physical activity levels and climate change mitigation.
Professor Dame Sally DaviesChief medical officer for England
iv © Royal College of Physicians 2016

Foreword – European perspective
It is now hard to imagine that, when I started my career in environmental health some 35 years ago, airpollution in western Europe was not seen as much of a public health problem. The great sulphurous smogsof the 1950s and 1960s were a thing of the past, and our summer weather was considered too lousy toproduce much in the way of ozone, which was wreaking havoc in the Los Angeles basin at the time.
As the Every breath we take report testifies, this has changed enormously over the past decades. It is a bit ofa paradox – most air pollutants have been strongly reduced over time, and health benefits of thesedownward changes have been convincingly shown in quite a few studies.
So why are we still (or again) concerned? Partly, this stems from the fact that, when concentrations arehigh, the research effort naturally focuses on what’s going on at these high exposures. So, without thesuccess of the air pollution abatement programmes, studies of effects at low or lower levels were simply notpossible. The many studies now available at lower concentrations document serious effects on populationhealth, which, as this report forcefully argues, cannot be ignored. Partly, it is also a matter of improvedresearch methodology: the application of time-series analyses (developed in econometrics) in air pollutionstudies has enabled very detailed ascertainment of shapes of acute concentration–response relationshipsdown to very low levels of pollution, seen on the cleanest days only; advances in air pollution exposuremodelling have made it possible to study effects of long-term air pollution exposure in large cohort studies,often designed for other purposes; and related to this, studies have now demonstrated that air pollution isinvolved in much more than symptom exacerbation and early death in older and frail bronchitis patients.Air pollution affects us at just about every stage of life, starting in the womb, continuing throughchildhood, adolescence and young adulthood into old age. We now see a ‘lifecourse’ epidemiology of airpollution effects on population health emerging, and this Every breath we take report is perhaps the firstone to emphasise this perspective in a concise and easy-to-follow format.
It often quotes results from the European Study of Cohorts for Air Pollution Effects (ESCAPE), a recentpan-European effort to use data from over 30 different cohorts, spanning all ages and a multitude ofdiseases. I had the great privilege of serving as the coordinator of an incredibly dedicated group of talentedcolleagues in this project, and it is rewarding to see the results being put to some good use in this report.
Although air pollution abatement really has been an environmental and public health success story, thisand other reports show that there is still a lot to be gained. Even major additional clean-up efforts costfar less than the monetarised health benefits that they produce. This report, by emphasising that airpollution harms us in all phases of life, provides powerful arguments to support cleaning up the air webreathe every minute, day, year and decade of our lives.
Professor Bert BrunekreefChair of the European Respiratory Society Task Force on Air Pollution
© Royal College of Physicians 2016 v

Preface
For us all, life on Earth depends upon the air we breathe and our ability to extract oxygen from it forenergy creation. During a lifetime, a person breathes about 250 million litres of air, weighing about300,000 kg. However, unknown by many, the air we breathe contains more than natural gases, as amplydemonstrated on 5–9 December 1952, when London was engulfed by a dense fog in which air pollutionfrom the burning of coal causing a massive increase in severe lung disease and death. As pointed out inthe first RCP report on air pollution and health in 1972,1 the recognition of how serious a public healthissue this was led to the Clean Air Acts of 19562 and 1968,3 in which measures were introduced todramatically reduce industrial and domestic fossil fuel emissions with great effect. Following this,everyone thought that the problem of air pollution was over. But how wrong we all were. Over the nexthalf century a different, more insidious form of air pollution appeared, linked to the emissions from theever-increasing number of motor vehicles and other forms of transport on our roads, rail and seas thatare dependent upon combustion of petrol and diesel fuels. Added to this chemical onslaught is the effectof indoor air pollution from workplaces and the fittings, furnishings, heating and cooking in our homes.
Contemporary ambient air pollution in the UK largely comprises small and ultra-fine particles, oxides ofnitrogen and ozone, and is largely invisible apart from episodes when particles and oxides of nitrogencause a brown haze which, in other regions of the world such as China and South-East Asia, is becoming aregular feature. However, although pollution often cannot be seen or smelled, its effects are insidious anddangerous. Population-based studies as well as modern biological science have revealed highly potent toxiceffects of chronic exposure to ‘modern-day pollutants’, not only on the lungs but also on the heart andbroader cardiovascular system. We are further recognising that the systemic effects of pollutants extendbeyond the cardiopulmonary system to affect many other organs, increasing the risk of disease that beginsfrom conception and persists across the lifecourse. Added to this are the multiplying effects ofurbanisation and climate change, both of which are driving air pollution in the wrong direction.4
The Clean Air Acts of the last century, as well as recent tobacco smoking legislation, put the onus on thepolluter to reduce emissions for the greater good of those around them. In the case of modern airpollution, it is currently the public at large that has to take responsibility for avoiding exposure,irrespective of their role in generating pollution, in contrast to the recently introduced tobacco smokingin public places legislation. The evidence base summarised in this report emphasises that the time hasnow arrived to take air pollution, as currently encountered in the UK, much more seriously than hasbeen the case. It should be considered a major public health problem deserving of multiple measures todrive down exposure in as many ways as possible. It is our view that this requires urgent, determined andmultidisciplinary action that is long overdue. Indeed, if we do not act now, our children and generationsto follow will be those who suffer from our failure to act.
Professor Stephen HolgateChair of the RCP/RCPCH working party on air pollution
© Royal College of Physicians 2016 vii
1 www.rcplondon.ac.uk/projects/outputs/air-pollution-and-health-19722 www.legislation.gov.uk/ukpga/1956/52/pdfs/ukpga_19560052_en.pdf3 www.legislation.gov.uk/ukpga/1968/62/pdfs/ukpga_19680062_en.pdf4 www.eea.europa.eu/publications/air-quality-in-europe-2015

Members of the working party
Name Representation
Professor Stephen Holgate CBE (chair)MRC clinical professor of immunopharmacology, Faculty of Medicine,
Southampton General Hospital
Honorary consultant physician, Southampton University Hospital Trust
Professor Jonathan Grigg (vice chair) Royal College of Paediatrics
Professor of paediatric respiratory and environmental medicine, Barts and and Child Health (RCPCH)
The London School of Medicine and Dentistry, Queen Mary University
of London
Professor Raymond Agius Faculty of Occupational
Professor of occupational and environmental medicine, University of Medicine (FOM)
Manchester
Professor John R Ashton CBE RCP council adviser
President of the Faculty of Public Health of the UK Royal Colleges of
Physicians
Professor Paul CullinanProfessor in occupational and environmental respiratory disease,
National Heart and Lung Institute, Imperial College London
Dr Karen Exley Committee on the Medical
Senior environmental public health scientist, Centre for Radiation, Effects of Air Pollutants
Chemical and Environmental Hazards, Public Health England (PHE) COMEAP) (Secretariat)
Professor David Fishwick British Thoracic Society (BTS)
Honorary professor of occupational and environmental respiratory
medicine, University of Sheffield
Dr Gary FullerSenior lecturer in air quality measurement, MRC PHE Centre for
Environment and Health, King’s College London
Mr Nikhil Gokani RCP Patient and Carer
Deputy director, Law and Non-Communicable Diseases Unit, School of Network
Law and Social Justice, University of Liverpool
Professor Chris GriffithsProfessor of primary care, Blizard Institute, Queen Mary University
of London
viii © Royal College of Physicians 2016

Professor Paul HarrisonOwner/director of PTCH Consultancy Ltd, and visiting professor of environment
and health, Cranfield University
Professor John HendersonProfessor of paediatric respiratory medicine, Faculty of Health Sciences,
University of Bristol
Dr Mike HollandConsultant, Ecometrics Research and Consulting, and honorary research fellow,
Imperial College London
Professor John HollowayProfessor of allergy and respiratory genetics, associate dean (research),
University of Southampton Faculty of Medicine
Professor George MorrisHonorary professor, European Centre for Environment and Human Health,
University of Exeter Medical School
Professor Patrick Saunders Faculty of Public Health
Visiting professor of public health, University of Staffordshire
Dr Samantha Walker Asthma UK
Deputy chief executive and director of research and policy, Asthma UK
Professor Dafydd WaltersEmeritus professor of child health, St George’s University of London
Professor Jane Dacre President, Royal College of
Physicians (RCP)
Dr Andrew Goddard Registrar, RCP
Supported by:Kieli Bibbings Illustrator
Claire Cantle Communications project officer,
RCP
Stephen Deed Reader services librarian, RCP
Kate Eisenstein Deputy head of strategy and
policy, RCP
Morgan Evans Senior communications adviser,
RCP
Colleen Shannon Healthcare writer
Christina Smith Committee manager, RCP
Pauline Whitelaw Committee manager, RCP
Natalie Wilder Managing editor, RCP
© Royal College of Physicians 2016 ix
Members of the working party

Conflicts of interest
All working party members have been asked to complete a Declaration of Interests form. The followingpotential conflicts of interest have been declared.
Professor Stephen Holgate is a trustee of the British Lung Foundation (BLF), chair of the BLF’s ScientificCommittee, a trustee of Cancer Research UK, chair of Defra’s Hazardous Substances AdvisoryCommittee and the chair of the European Respiratory Society (ERS) Science Council.
Professor Jonathan Grigg provides scientific advice to the charity Change London(www.changelondon.org/about.php). He is also secretary of the Paediatric Assembly of the ERS.
Professor John Ashton is a member of the Labour Party.
Professor David Fishwick is a member of the BLF.
Dr Gary Fuller is a member of the Air Quality Committee of Environmental Protection UK (EPUK)and his department holds a corporate membership. EPUK is a member-based non-governmentalorganisation (NGO) formerly known as the National Society for Clean Air (www.environmental-protection.org.uk/about-us/). He also declared that he has a freelance contract to write a monthlyarticle on pollution in The Guardian. The remit of this article is to summarise recent air pollution inthe UK. Additionally, he contributes four pieces a year on world air pollution. Each piece appears onthe weather pages of the newspaper and online. He is paid £129 per article.
Professor John Henderson receives university departmental funds from Pfizer Inc to support pre-translational research into epigenetic mechanisms in asthma. F Hoffman-La Roche Ltd supports a phaseIII clinical trial of a pharmaceutical agent in severe asthma through his NHS trust and for which he isthe local principal investigator (PI). He has no personal pecuniary interests in either company.
Dr Mike Holland is a subcontractor to a number of commercial consultancy organisations active in thefield of environmental regulation, including Ricardo-AEA, AMEC and IIASA. Most work for theseorganisations is for the European Commission and associated agencies, and for the UK government. Hehas been consultant to a number of European pressure groups, providing independent assessment of theimpacts of industrial facilities and prospective air pollution legislation. These include HEAL and EEB.The purpose of this work is to apply methods agreed with the World Health Organization and theEuropean Commission to cases of interest to the NGOs. The work concludes with presentation of thecompleted analysis and associated report: he does not participate in any associated lobbying activitiesshould the NGOs wish to use the information in this way. His earnings from these consultancy contractsare variable from year to year, but under €10,000 annually.
Mr Philip Insall is a consultant providing services to clients in the public, private, voluntary andacademic sectors, relating to the development of evidence, policy and guidance on transport andpublic health. At the time he was co-opted onto the RCP/RCPCH working party, he was an employeeof Sustrans, a charity which, among other activities, campaigns on transport and public health issuesincluding air quality. He has no clients or contracts related to his work with the working party, andhas provided his expertise on the project without a fee.
x © Royal College of Physicians 2016

Professor George Morris has received remuneration for work as a consultant in the broad area ofenvironmental public health for the World Health Organization, the Dutch national environment andhealth agency, and the European Environment Agency. This has occasionally related specifically to airquality issues. He was recently lead author on a paper addressing the ‘distal effects of climate change’.This was commissioned by the Natural Environment Research Council as part of the Living withEnvironmental Change initiative.
Dr Samantha Walker works for Asthma UK.
© Royal College of Physicians 2016 xi
Conflicts of interest

Executive summary
Why the RCP and the RCPCH are tackling this issue
Each year in the UK, around 40,000 deaths are attributable to exposure to outdoor air pollution, withmore linked also to exposure to indoor pollutants.
Air pollution plays a role in many of the major health challenges of our day, and has been linked tocancer, asthma, stroke and heart disease, diabetes, obesity, and changes linked to dementia.
Neither the concentration limits set by government, nor the World Health Organization’s air qualityguidelines, define levels of exposure that are entirely safe for the whole population.
When our patients are exposed to such a clear and avoidable cause of death, illness and disability, it isour duty as doctors to speak out.
How we approached the task
This report is a joint effort by the Royal College of Paediatrics and Child Health (RCPCH) and the RoyalCollege of Physicians (RCP).
The two colleges assembled experts in medicine and environmental sciences to discuss the evidenceand draw up recommendations. We searched the literature and heard detailed evidence from expertsand key organisations. A draft of the report was circulated to a wide range of stakeholders for comment.
Full details of the scientific references, evidence heard and stakeholders consulted are available on theRCP website.1
Effects across a lifetime
This damage occurs across a lifetime, from a baby’s first weeks in the womb all the way through to theyears of older age.
Gestation, infancy and early childhood are vulnerable times because the young body is growing anddeveloping rapidly. We know that the heart, brain, hormone systems and immunity can all be harmed byair pollution. Research is beginning to point towards effects on growth, intelligence, and development ofthe brain and coordination.
Harm to babies and children will have an impact that lasts far into the future. For the same reason, anyair quality improvements we make now will have long-lasting benefits.
Older people, and adults with long-term conditions, are also vulnerable to the effects of air pollution.Improving air quality will help them to stay independent and well, benefiting individuals and easing thepressure on our NHS and social services.
xii © Royal College of Physicians 2016

The most vulnerable suffer the most harm
Air pollution is harmful to everyone. However, some people suffer more than others because they:
• live in deprived areas, which often have higher levels of air pollution• live, learn or work near busy roads• are more vulnerable because of their age or existing medical conditions.
Some chemicals in air pollution may be implicated in the development of obesity. It may be a viciouscircle, because we also know that obese people are more sensitive to air pollution.
These vulnerabilities are heightened among those living in the most deprived communities. This is dueto poor housing and indoor air quality, the stress of living on a low income, and limited access to healthyfood and/or green spaces. Moving away from an area of high outdoor air pollution may be unaffordablefor local residents. Some people may not want to leave their homes – and they should not have to.
Costs of air pollution
The annual mortality burden in the UK from exposure to outdoor air pollution is equivalent to around40,000 deaths. To this can be added further impacts from exposure to indoor air pollutants such asradon and second-hand smoke.
The health problems resulting from exposure to air pollution also have a high cost to society andbusiness, our health services, and people who suffer from illness and premature death. In the UK, thesecosts add up to more than £20 billion every year.
Vulnerable people are prisoners of air pollution, having to stay indoors and limit their activity whenpollution levels are high. This is not only unjust; it carries a cost to these individuals and the communityfrom missed work and school, from more health problems due to lack of exercise, and from socialisolation.
Taking action will reduce pain, suffering and demands on the NHS, while getting people back to work,learning, and an active life. The value of these benefits far exceeds the cost of reducing emissions.
Air pollution and climate change
Air pollution plays a key role in the process of climate change, which places our food, air and watersupplies at risk, and poses a major threat to our health.
Several pollutants that cause this environmental damage are also toxic to our bodies. Therefore, many ofthe changes that would decrease air pollution to protect our health – especially using energy moreefficiently and burning less solid fuel and oil – would also help to slow down the overheating of ourplanet.
© Royal College of Physicians 2016 xiii
Executive summary

Recommendations for action and research
What must be done
Everyone has some responsibility for reducing air pollution. Real change will only occur when everyoneaccepts this responsibility, and makes a concerted effort. This includes European, national and localgovernment, business and industry, schools and the NHS, as well as individuals in society at large.
1 Act now, think long term. As a community, we must act now, and with urgency, to protect thehealth, wellbeing and economic sustainability of today’s communities and future generations.Government must empower local authorities and incentivise industry to plan for the long term.
2 Educate professionals and the public. The NHS and patient charities must educate healthprofessionals, policymakers and the public about the serious harm that air pollution causes.Health professionals, in particular, have a duty to inform their patients.
3 Promote alternatives to cars fuelled by petrol and diesel. Government, employers and schoolsshould encourage and facilitate the use of public transport and active travel options like walkingand cycling. Active travel also increases physical activity, which will have major health benefitsfor everyone. Local transport plans, especially in deprived areas, should:
• expand cycle networks• require cycle training at school• promote safe alternatives to the ‘school run’, based on walking, public transport and cycling
instead of cars• encourage employers to support alternatives to commuting by car• promote leisure cycling• develop ‘islands’ of space away from traffic, for safer walking and cycling.
European, national and local policies should also encourage the use of hybrid electrical andhydrogen-powered vehicles.
4 Put the onus on the polluters. Polluters must be required to take responsibility for harming ourhealth. Political leaders at a local, national and EU level must introduce tougher regulations,including reliable emissions testing for cars. They must also enforce regulations vigorously,especially in deprived areas where pollution levels are higher and people are more vulnerable.
5 Monitor air pollution effectively. Air pollution monitoring by central and local governmentmust track exposure to harmful pollutants in major urban areas and near schools. These resultsshould be communicated proactively to the public, in a clear way that everyone can understand.When levels exceed EU limits or World Health Organization guidelines, local authorities mustimmediately publish serious incident alerts.
6 Act to protect the public health when air pollution levels are high. When these limits areexceeded, local authorities must have the power to close or divert roads to reduce the volume oftraffic, especially near schools.
xiv © Royal College of Physicians 2016

7 Tackle inequality. Our most deprived communities are exposed to some of the worst outdoorand indoor air quality, contributing to the gap in life expectancy of nearly 10 years between themost and the least affluent communities. Regulators, local government and NHS organisationsmust prioritise improvements in air quality in our most deprived areas, setting high standards ofemission control across all sectors of industry.
8 Protect those most at risk. Children, older people, and people with chronic health problems areamong the most vulnerable to air pollution. Public services must take account of thisdisproportionate harm through local tools such as planning policies for housing and schools,equalities impact assessments, and joint strategic needs assessments. At an individual level,healthcare professionals should help vulnerable patients protect themselves from the worsteffects of air pollution.
9 Lead by example in the NHS. The NHS is one of the largest employers in Europe, contributing9.1% of the UK’s gross domestic product (GDP). The health service must no longer be a majorpolluter; it must lead by example and set the benchmark for clean air and safe workplaces. Inturn, this action will reduce the burden of air-pollution-related illness on the NHS. As pointedout in two earlier reports,2,3 the Department of Health, NHS England and the devolvedadministrations must give commissioners and providers incentives to reduce their emissions,and protect their employees and patients from dangerous pollutants.4
What can I do?
As citizens and members of the public, everyone can help by:
• trying alternatives to car travel or preferably taking the active option: bus, train, walking and cycling• aiming for energy efficiency in our homes• keeping gas appliances and solid fuel burners in good repair• asking their local council and MP to take action• learning more about air quality and staying informed.
The collective effect of actions by a large number of individuals, together with action by local councilsand governments, can make a significant difference to pollutant exposure.
© Royal College of Physicians 2016 xv
1 www.rcplondon.ac.uk/projects/outputs/every-breath-we-take-lifelong-impact-air-pollution2 www.nihr.ac.uk/policy-and-standards/nihr-carbon-reduction-guidelines.htm3 www.sduhealth.org.uk/documents/Carbon_Footprint_summary_NHS_update_2013.pdf4 Tomson C. Reducing the carbon footprint of hospital-based care. Future Hosp J 2015;2:57–62.
Recommendations for action and research

In many areas, we need more research to improve our understanding of the impact of air pollution onour health, economy and communities.
10 Define the economic impact of air pollution. Air pollution damages not only our physicalhealth, but also our economic wellbeing. We need further research into the economic impact ofair pollution, and the potential economic benefits of well-designed policies to tackle it.
11 Quantify the relationship between indoor air pollution and health. We must strengthen ourunderstanding of the relationship between indoor air pollution and health, including the keyrisk factors and effects of poor air quality in our homes, schools and workplaces. A coordinatedeffort among policymaking bodies will be required to develop and apply any necessary policychanges.
12 Determine how global trends are affecting air quality. From increased energy production andconsumption to global economic development and urbanisation, we need to improve ourunderstanding of how major social and economic trends are affecting air quality and its twinthreat, climate change.
13 Develop new technologies to improve air pollution monitoring. We need better, more accurateand wider-ranging monitoring programmes so that we can track population-level exposure toair pollution. We also need to develop adaptable monitoring techniques to measure emergingnew pollutants, and known pollutants that occur below current concentration limits. We mustdevelop practical technology – such as wearable ‘smart’ monitors – that empower individuals tocheck their exposure and take action to protect their health.
14 Study the effects of air pollution on health. To appreciate fully the risk to health, we needfurther research on air pollution’s effects on the body. In addition to lung and cardiovasculardisease, research into the adverse health effects of pollution should accommodate systemiceffects such as obesity, diabetes, changes linked to dementia, and cancer, as well as effects on thedeveloping fetus and in early childhood.
xvi © Royal College of Physicians 2016
Every breath we take: the lifelong impact of air pollution

Definitions
Air pollutants
Black carbon This is the part of particulate matter that most strongly absorbs light.It is created by the incomplete combustion of fuels and is a major partof soot.
Carbon monoxide (CO) This gas is produced when carbon-containing fuel burns without anadequate supply of oxygen. Outdoor concentrations of carbonmonoxide in the UK are generally low. Malfunctioning indoor gasheating appliances and other fuel-burning devices used indoors maygenerate high, toxic levels of CO.
Diesel exhaust Diesel exhaust is composed of gases and particles. Diesel exhaust gasesinclude compounds such as benzene, 1,3-butadiene, formaldehyde andpolycyclic aromatic hydrocarbons (PAHs). Diesel exhaust particles(DEPs) have a range of sizes and compositions. Small DEPs oftencontain elemental carbon (soot), with many toxic compounds on theirsurface. These include organic compounds, sulphate, nitrate andmetals.
Metals and metalloids These include lead (Pb), mercury (Hg), arsenic (As) and nickel (Ni).Lead air pollution used to be dominated by emissions from roadtransport, but is now dominated mainly by activities in the iron andsteel industry sectors. Mercury emissions are from a number ofindustrial production processes, but the most important is themanufacture of chlorine from Hg cells. Improved controls and newtechnologies have reduced emissions in the UK. Arsenic is a metalloid,ie its properties lie somewhere between those of the metals and thenon-metals. The largest source of arsenic in the UK is the disposal oftreated wood by burning. Nickel is mainly emitted as particles orassociated with particles. UK emissions of nickel have declinedsignificantly owing to reductions in the combustion of oil in powerstations, industry and for domestic heating.
Nitrogen dioxide (NO2) This gas is a member of a family of compounds called oxides ofnitrogen or NOx. Some NO2 is produced directly by combustion.Another source of NO2 is the oxidation of nitric oxide (NO) in theair; this can happen either slowly by reaction with oxygen or morerapidly by reaction with ozone. NO2 levels are higher close to roadtraffic, or indoors where there is gas cooking. Oxides of nitrogen andparticle concentrations are highly linked (correlated) in air samplesfrom city roadside sites and it has been difficult to separate out theireffects.
© Royal College of Physicians 2016 xvii

Every breath we take: the lifelong impact of air pollution
Ozone (O3) This is a gas consisting of three oxygen atoms joined together. It isformed by chemical reactions between other air pollutants, inparticular the reaction of oxides of nitrogen with carbon compoundscalled volatile organic compounds (VOCs) in the presence of sunlight.These reactions take place over periods of several hours or even days.Ozone levels therefore tend to be higher in the countryside than incities, and greater in summer than winter. Some ozone travels overlarge distances. Ozone levels fluctuate markedly over time and arehighest in hot, bright weather.
Particulate matter (PM) Particles in the air are a complex mix of materials. The health effectscovered by this report mostly relate to particles that are generated byhuman activity (‘anthropogenic’ particles), either directly or bychemical reactions in the air. However, some natural dusts (eg soil andsand particles) may also be small enough to be breathed into thelungs. Particle concentrations are usually expressed as mass(micrograms; �g) per cubic metre of air (m3).
Historically, concentrations of particulate matter (PM) were determinedoptically by measuring the ‘blackness’ of a filter after air had been drawnthrough it. This measurement was called black smoke and is practicallythe same as the black carbon measurement, as this is the part of PM thatmost strongly absorbs light. Black carbon is created by the incompletecombustion of fuels and is a major part of soot – for example dieselsoot. Besides elemental carbon it contains polycyclic aromatichydrocarbons (PAHs).
The ‘black smoke’ metric has been largely replaced by metrics of PMbased on the aerodynamic diameter of the particles. Thus PM10 is theamount of particulate matter that is generally less than 10 µm indiameter. PM2.5 is the smaller fraction of PM10 and consists of particles<2.5 µm across (often referred to as ‘fine’ particles). Coarse PM is thedifference between PM10 and PM2.5. Ultra-fine particles are the smallestfractions of PM2.5 and are <0.1 µm (100 nm) in diameter.Differentiation of PM into fractions of different sizes is very relevant forhealth studies because fractions of <10 millionths of a metre (10 µm) indiameter tend not to be filtered out by the nose, and are able topenetrate down into the lungs. In contrast, very small particles(nanoparticles), which range in size from 0.1 to 0.001 µm, are so smallthat they can pass into the circulation. The surface area:volume ratio ofparticles increases exponentially as particles become smaller and smaller.
PM consists of carbon, ammonium nitrate and ammonium sulphate,oxides and salts of many metals, and organic materials including ratherlarge and complex molecules and fragments of soil. The compositionof the PM mixture varies from place to place. Near to roads, emissionsfrom vehicles form the majority of PM, whereas in rural areas there is
xviii © Royal College of Physicians 2016
an increased amount of PM produced by chemical reactions in the airincluding nitrates and sulphates.
Another way of describing PM is by origin. Primary particles are thosethat are emitted directly to the air. These include particles emittedduring fossil fuel combustion, brake and tyre wear, and road dustresuspended by vehicles. Secondary particles are particles formed byatmospheric processes. These include ammonium nitrate and sulphate.The origins (precursors) of secondary particles include nitrogen dioxide,sulphur dioxide, ammonia and volatile organic compounds.
Polychlorinated biphenyls These are synthetic chemicals that do not occur naturally in the (PCBs) environment. The commercial production of PCBs is banned. Sources
of PCBs in the air are landfill sites containing electrical equipmentsuch as transformers and capacitors. Incineration of municipal wastemay lead to PCB pollution.
Polycyclic aromatic These are produced when the burning of fuels is incomplete. PAHs hydrocarbons (PAHs) can exist in over 100 different combinations. Examples of PAHs are
benzo(a)anthracene and benzo(a)pyrene.
Sulphur dioxide (SO2) In the UK, this gas is largely emitted from industrial sources includingpower stations. The contribution from motor vehicle exhausts has beenmuch reduced in recent years, owing to the use of low-sulphur fuels.
Volatile organic compounds These are organic compounds with a low boiling point, and therefore(VOCs) a tendency to evaporate. Benzene and 1,3-butadiene are two important
VOCs that are emitted from petrol car exhausts and directly frompetrol. These emissions from traffic have been reduced through theintroduction of three-way catalysts for petrol cars. Total volatileorganic compounds are also known as TVOCs.
Other terms
Association An association is the statistical relationship between two measuredquantities. Air pollution studies that report associations are examiningthe relationship between concentrations of an air pollutant and ahealth endpoint. Such an association (or correlation) is not necessarilycausal and may be due to chance, bias or some other factor.
COC Committee on Carcinogenicity
COMEAP Committee on the Medical Effects of Air Pollutants
COSHH Control of Substances Hazardous to Health
EC European Commission
© Royal College of Physicians 2016 xix
Definitions

Epidemiological studies These are studies of the causes of diseases in populations.
ESCAPE European Study of Cohorts for Air Pollution Effects
EU European Union
Meta-analysis This is a statistical technique whereby all data from all available studiesare combined. In some cases, meta-analysis reveals statically significanteffects by combining individual studies that are not statisticallysignificant. Meta-analysis often uses data that have been identified by asystematic review. A systematic review aims to identify all relevantpublished and unpublished evidence, select studies for inclusion by anagreed process, assess the quality of each study, interpret the findingsand present a balanced and impartial summary of the findings.
SIDS Sudden infant death syndrome
Spirometry This technique measures how much air and how fast a person canbreathe in and out. Spirometry measurements may be described as thepercentage predicted of normal after ‘adjusting’ for subject height andweight. Thus an individual with an output of spirometry that is 100%of predicted will have the average value expected of a group of healthysubjects of similar height and weight. The forced expiratory volume in 1second (FEV1) is an output of spirometry that measures the totalamount (in litres) of breath expelled in the first second after firsttaking in the largest possible breath. Another spirometry output is theforced vital capacity (FVC), which is the total amount of air (in litres)that can be breathed out by an individual, after taking the largestpossible breath in.
WHO World Health Organization
Every breath we take: the lifelong impact of air pollution
xx © Royal College of Physicians 2016
Introduction
With increasing concerns over the adverse health effects of air pollution on human health, the primaryaim of this enquiry by the Royal College of Physicians (RCP) and the Royal College of Paediatrics andChild Health (RCPCH) was to raise awareness of new issues affecting health, across the lifecourse, fromindoor and outdoor air pollution and in relation to a changing environment. Recognising that there wasalready a strong evidence base for the health effects of acute air pollution episodes, on the basis of newevidence, we decided to focus our enquiry on the health impacts of continuous exposure to chronic airpollution over a lifetime, with specific reference to:
• pregnancy and children as well as adults• indoor as well as outdoor air pollution exposure• the influence of local, regional and national policy relating to pollution control measures• examining the influences of climate change.
In addition, during our enquiry we recognised the importance of socio-economic impacts of airpollution and so we added this dimension to our terms of reference.
More specifically, the scope of this report covers:
• the effects of prenatal and childhood exposure to air pollution on susceptibility to chronic diseaseover the lifecourse; this covers respiratory disease, cardiovascular disease, systemic effects such asdiabetes, obesity, central nervous disease and cancer, as well as effects that maternal exposure to airpollution has on the developing fetus, such as miscarriage, stillbirth, premature delivery and low birthweight
• the impact of outdoor pollutants from vehicle exhaust, as well as indoor pollutants (including carbonmonoxide (CO), volatile organic compounds (VOCs) and emissions from fossil fuel fires and stoves)on health; the recently introduced tobacco smoking legislation in public places is used as an exampleof health gains that can be made through exposure reduction
• a predominantly UK focus, but drawing information from research conducted in other countries and,where appropriate, comparisons with rapidly and slowly developing nations
• special attention being paid to vulnerable groups, including deprivation, poor housing and othersocio-economic factors, and the overall cost of air pollution to society
• the influence of changing age demographics, urbanisation and climate change on air pollution andassociated health risks.
While there is abundant literature on the adverse health effects of air pollution, this report specificallyconcentrates on the newly recognised, insidious effects of chronic and persistent pollution exposure fromconception to old age. It takes account of total pollution exposure sources, both outdoors and indoors, aswell as the influence of combinations of pollutants acting together and, finally, viewing air pollution as astressor that interacts with many other stressors such as diet, socio-economic deprivation and climaticconditions to create reduced health and increased susceptibility to disease. In taking a holistic andmultidisciplinary view of the current air pollution problems and trends over time, we have identified thisas a major public health problem, which we address in a series of recommendations that mandate urgentand definitive interventions to protect the public, especially those people in society who are mostvulnerable.
© Royal College of Physicians 2016 1

Chapter 1: Summary
Air pollution is not a new problem in the UK. The London smog of 1952 killed 12,000 people. Sincethen, changes in the way we live have also changed the air pollution that we breathe. Coal burning hasfallen dramatically, but today increased road transport and the failure to control some exhausts fromdiesel vehicles has led to us being exposed to new air pollutants.
Looking at different generations tells the story. As children, today’s grandparents were exposed to sootand sulphur dioxide from coal burning. Those now in middle age breathed in emissions from leadedpetrol. Today’s children walk and cycle much less, and they inhale nitrogen dioxide and the tinyparticulates from diesel-fuelled vehicles.
Around the world, there are many examples where reducing air pollution has improved public health. Itnow seems likely that childhood exposure to air pollution has a lasting influence on health, so the gainsfrom tackling air pollution today will be felt throughout the decades to come.
2 © Royal College of Physicians 2016

Key facts
• In 2012, road traffic in the UK was ten times higher than in 1949. Total distance walked each yeardecreased by 30% between 1995 and 2013.
• Growth in pollution has not always been as fast as growth in traffic, thanks to tighter exhaustcontrols. Modern cars produce very little carbon monoxide and hydrocarbons, and the sulphur andlead in diesel and petrol must meet tight regulations.
• Nitrogen dioxide and particulates from diesel engines have been poorly controlled and these remain aproblem. In the UK today, about half of cars run on diesel. This is the trend across Europe, but not inthe USA or Japan. Nearly all buses, vans and lorries, forms of water transport, and many trains, usediesel in the UK, along with construction and farm machinery.
• Each year, inhaling particulates causes around 29,000 deaths in the UK, which, on recent evidence,may rise to around 40,000 deaths when also considering nitrogen dioxide exposure.
• Home heating has changed, too. Compared with coal fires, modern gas boilers produce very littleparticle pollution – but they do give off nitrogen dioxide. Cooking, especially with gas, is also animportant source of nitrogen dioxide and particles.
• Air pollution can stay around for days or weeks after it’s created. One type of chemical may interactwith others in the atmosphere, to cause even more pollution. Air pollution also crosses cities, countiesand even countries, so local action is not enough on its own.
© Royal College of Physicians 2016 3
1 Summary

Chapter 1: Air pollution in our changing world
The London smog of 1952, in which up to 12,000 people died,1 was a defining event in air qualitymanagement; it brought about the Clean Air Acts and the start of 3 decades of concerted actions tocontrol public exposure to air pollution. Today, life in the UK is very different from how it was in the1950s. Much more than legislation has changed since this time, with various social, fuel and technologytransitions driving a huge change in outdoor air pollution – changing old pollution sources andintroducing new hazards into our breathed environment. Concerns about black smoke and airacidification (sulphur dioxide, SO2) from coal burning have been replaced by new concerns aboutparticle pollution and nitrogen dioxide (NO2) from transport, and the air pollution that forms throughchemical reactions between other pollutants in the atmosphere. With new knowledge that pollutants canremain in the air for days or even weeks, air pollution has moved from being a local problem to one thatrequires source control at city, regional and even international scales. Each year in the UK the equivalentof around 40,000 deaths can be attributed to outdoor air pollution linked to exposure to fine particulatesand NO2 (see Chapter 6).2,3
Box 1: Six US cities that changed our knowledge of modern air pollution
By the 1990s, the pollution and mortality peaks linked to wintertime smog seemed consigned to history;the Clean Air Acts and the advent of natural gas heating had displaced solid fuel from our cities. In1974, US scientists4 began following the lives of 8,111 people across six US cities. Of these people,1,490 had died by 1991, but these deaths were not spread evenly. Having accounted for factorsincluding smoking rates, education level, diabetes and workplace pollution exposure, the worst-affectedcity had a death rate around 30% greater than that of the least-affected city. Across the six cities, thedifference in death rates was found to be associated with airborne particle pollution; this was not fromair pollution experienced during short smog episodes, but rather from long-term exposure to everydaypollution concentrations. Although the pollution mixture had changed, long-term exposure to modernair pollution was exerting a heavy health burden, leading to the conclusion that modern pollutantsneeded better control, not just during smog episodes but every day.
Returning to the same people 8 years later, researchers5 were able to repeat and confirm the earlierfindings with respect to particle pollution and survival, but with one important difference: those citieswith improved air pollution saw improved survival rates, suggesting that at least part of the air pollutionhealth effects might be reversible and that improvements in air pollution can lead to better city-widehealth outcomes.
1.1 Changes to transport
Changes to transport systems and habits were a defining movement of the last half of the 20th century.In the 1950s, car ownership was beyond the reach of the majority of families; today, many families regardcar ownership as an essential part of life, providing mobility and access to jobs, shops and leisure.
Between 1949 and 2012, a massive investment in roads and road vehicles led to a tenfold increase in thedistance travelled in the UK (Fig 1). This ‘freedom’ has not been universally accepted as a good thing.
4 © Royal College of Physicians 2016

Increased car use has affected pollution emissions; it has also changed our air pollution exposurepatterns, with more transport time spent in cars in polluted road environments. The charity Sustranssuggests that bias in favour of investment in road building and motorised transport has led to a‘windscreen perspective’, ie viewing transport issues from the driver’s perspective only. The RoyalCommission on Environmental Pollution6 pointed to the dominance of road traffic in many urban areasbeing linked to a web of environmental and social causes, with outcomes including air pollution, urbanseverance for those without car access, a decline in walking, and closure of local shops.
The types of traffic on our roads have changed; freight transport has seen massive growth, especiallywith respect to light goods traffic and vans, which have grown in number by over 60% since the turn ofthe century. Road traffic growth has slowed in recent years. The distance driven on UK roads grew by50% during the 1980s, by 14% during the 1990s and then by 6% between 2000 and 2009. Road milespeaked in 2007, followed by three consecutive years of decrease: the first consecutive annual falls sincetraffic records began.7 However, transport planners dismiss the notion that we might have achieved peakcar use; the current hiatus in road traffic growth is expected to be temporary. Traffic is expected to growby a further 19–55% between 2010 and 2040, and is being reinforced by the rapid growth of small packetroad transport.8
Growth in traffic since the 1950s does not necessarily mean a proportionate growth in air pollution. Forover 20 years, ever-tightening standards for exhaust emissions have been applied to new vehicles soldacross Europe, although concerns are being expressed about how suitable such testing is under realisticdriving conditions (http://theicct.org/nox-control-technologies-euro-6-diesel-passenger-cars/). Therealso remains concern about emissions when starting from cold; however, overall the abatement of airpollution from petrol vehicles has been very effective – a new petrol car emits less than one-twentieth of
1 Air pollution in our changing world
Fig 1. Annual distance travelled by road in the UK7
0
100
200
300
400
500
600
Annu
al ve
hicle
dist
ance
(billi
on km
)
1949
1954
1959
1964
1969
1974
1979
1984
1989
1994
1999
2004
2009
2014
Buses and coaches
Motorcycles
Goods vehicles
Light vans
Cars and taxis
© Royal College of Physicians 2016 5

Every breath we take: the lifelong impact of air pollution
the levels of nitrogen oxides emitted by cars made in 1992, before catalytic converters were required.There have also been huge cuts in CO and hydrocarbons (VOCs) in petrol exhausts. In contrast to petrolengines, the technology applied to clean up diesel vehicles has not yielded significant improvements inemissions of nitrogen oxides, and the proportion of NO2 in diesel exhaust has actually increased.9
The types of fuel used to power road transport have changed over the past 20 years. Although heavyvehicles such as lorries and buses have always been powered by diesel, this was not the case for smallervehicles that predominantly ran on petrol. In 2000, just 14% of new cars were diesel powered, but todaythis figure has risen to 50%, and almost all light goods vehicles and vans are now powered by diesel too.10
This increase in diesel vehicles is very much a European phenomenon. Indeed, diesels play almost no rolein car markets in the USA or Japan. Although diesel vehicles are marketed on their low carbon dioxide(CO2) emissions, the Japanese car market has reduced CO2 emission further and faster than Europe byinvestment in petrol engine technology.11 The combination of an increased number of diesel vehicles andthe technological difficulties in abating their real-world emissions has meant that urban concentrations ofairborne particulate matter (PM) and NO2 have not improved, as had been hoped. European limits forNO2 were set in the late 1990s, to be met by 2010, but today busy roads in UK urban areas still fall a longway short of meeting these limits; in places, they are being exceeded by up to threefold.12 In addition toarterial roads, the main problem areas are urban centres that are dominated by diesel vehicles; theseinclude many shopping streets where traffic overwhelmingly comprises buses, delivery vans and taxis.Although tighter approval tests are expected to result in new diesel vehicles producing less pollution, it
6 © Royal College of Physicians 2016
Box 2: Better fuel can mean less pollution
In the latter part of the 20th century, petrol was the main source of lead in urban air. Its use as a fueladditive peaked in the 1970s and 1980s. By this time, lead contamination in the environment hadreached global proportions. Around the world analysis of ice sheets, lake and marine sediments andpeat deposits showed increased concentrations compared with pre-industrial levels.13 The RoyalCommission on Environmental Pollution’s 1983 report on lead in the environment14 was a seminalmoment in the recognition of the harm to the population arising from lead exposure. The commissioncalled for a phased end to leaded petrol within 6 years. Today, lead is no longer used in petrol in the UK,but it is disappointing that the UK was one of the last countries in Europe to completely remove leadadditive from fuel (in 1999). Since the reduction and eventual ban of its use as a petrol additive, therehave been clear changes in lead in children’s blood. This has decreased from concentrations in the1970s that were considered harmful to fetuses and small children.15
Many improvements have been made to oil-based fuels in recent decades. In addition to the phasingout of lead additives in petrol, the other major change has been the regulated decrease of sulphur infuels, prompted by the need to control gaseous SO2 and particulate sulphate pollution, and to enablecatalysts and other exhaust-control technologies. The transition to ultra-low sulphur diesel in the UK in2007 caused a decrease of 30–60% in particle number concentration,16 a measure of airborneparticles that had previously been linked to cardiac hospital admissions and deaths in London.17 Thedecrease in the maximum allowed sulphur content in marine fuel in most European waters in 2006caused a notable improvement in air quality, for example, in the Port of Dover. In Hong Kong,restriction on the sulphur content of heavy fuel oil in 1990 was associated with decreases in all-cause,cardiac and respiratory death rates (by 2–4%).18

will be many years before the vehicle fleet is completely replaced. Recent concerns over software thatallows cars to cheat in emissions tests, making them appear cleaner than they actually are, has not addedto public confidence in air pollution control.
The composition of transport fuel also has undergone marked changes in the UK and across Europe.Lead is no longer used as an additive in petrol, and sulphur impurities are now removed before fuel issold. The introduction of ultra-low sulphur diesel in 2007 caused an almost-immediate decrease of up to60% in the level of sub-micrometre particle pollution in the air that we breathe.16 This was probably themost rapid improvement in UK urban air quality ever seen. Pollution from road use is not limited toexhaust pipe emissions. It is now recognised that particle pollution also comes from the wear of brakes,tyres and the road itself. Evidence suggests that particles from these sources are rich in transition metals,inhalation of which is associated with toxicological effects. In contrast to exhaust emissions, noregulations exist to control these sources of particles and, with the trend towards heavier vehicles, theylook set to increase. Pollution from tyre, brake and road wear also means that even electric andalternatively fuelled vehicles can never be emission free at the point of use.
1 Air pollution in our changing world
Box 3: Do low emission zones work?
Excluding the most polluting traffic is a popular way for European cities to try to clean up their air.Progressively tighter emissions standards mean that newer cars should emit less pollution than olderones. By banning higher-polluting vehicles or charging their owners, cities can reduce their trafficemissions faster than waiting for the natural rate of vehicle replacement.
London has Europe’s largest low emission zone (LEZ), but this only applies to medium and largevehicles and not to cars and small vans. Other LEZs in Oxford and Brighton ban only the most pollutingbuses. Elsewhere in Europe, over 200 schemes operate in 12 countries, with the majority being in Italyand Germany. Many of these include passenger cars.19
Evidence that LEZs work is mixed. Sadly, progressively tighter tests for new vehicles have not deliveredthe hoped-for reductions for some pollutants in real-world driving. This is especially the case fornitrogen oxides (NOx) from diesel vehicles, meaning that the increasing popularity of diesel vehiclescan undo the positive benefits from other policies to decrease air pollution.19 Another difficulty is thediversity in types of LEZ and other local policies, which makes it hard to compare cities.
In London, the UK’s only city-wide LEZ, links have been found between NOx exposure and clinicallysignificant impairment of children’s lung growth. Three years after the introduction of the Londonscheme, there was no evidence of improvement in air quality or in children’s respiratory health, leadingto the conclusion that more aggressive pollution control measures are needed (Mudway et al,unpublished data). In Germany a national framework means that all vehicles, including cars, arerequired to display a red, yellow or green sticker according to their exhaust pollution. The ‘cleaner’stickers (yellow and green) are harder to obtain for diesel vehicles owing to their greater emissionscompared with petrol. Consistent design means that results from over 70 German cities with LEZs canbe viewed together, increasing the power to detect any beneficial effect. Here, air pollution in areaswith LEZs has improved faster than in those cities without zones.20,21 Additionally, ‘dirty vehicles’ didnot simply move into the areas outside the zone; instead, drivers and especially businesses around theLEZs upgraded their vehicles or bought newer ones.20
© Royal College of Physicians 2016 7

Every breath we take: the lifelong impact of air pollution
8 © Royal College of Physicians 2016
Fig 2. The upper panel shows transport share by mode. The lower panel shows distance travelled by pedalcycle, rail and bus/coach.7
90%
80%
70%
60%
50%
40%
30%
20%
10%
0%
1952
1955
1958
1961
1964
1967
1970
1973
1976
1979
1982
1985
1988
1991
1993
1996
1999
2002
2005
2008
2011
Cars, vans and taxis
Air (UK)
Rail
Motor cycles
Buses and coaches
Pedal cycles
Tran
spor
t sha
re
100%
Annu
al v
ehic
le d
ista
nce
(bill
ion
km)
0
1952
1954
1956
1958
1960
1962
1964
1966
1968
1970
1972
1974
1976
1978
1980
1982
1984
1986
1988
1990
1992
1993
1995
1997
1999
2001
2003
2005
2007
2009
2011
2013
10
20
30
40
50
60
70
80
90
100
Buses and coaches
Pedal cycles
Rail

In contrast to the growth in motorised traffic (Fig 2), active transport such as walking and cycling hasdeclined progressively since the 1950s. The total distance walked each year declined by 30% between1995 and 2013,22 and the distance cycled in England and Wales in 2012 was just 20% of that in 1952.6
However, there are some signs of a reversal; trends over the last decade show a slow return to cycling.Many studies have underlined the public health benefits of increased active travel by both cycling andwalking, with the benefits outweighing the increased risks from accidents and air pollution exposure by afactor of at least ten.23 Continued focus on controlling urban air pollution through technical measures toabate vehicle exhaust provides less benefit for public health than focusing on measures that increaseactive travel and public transport (where active travel is often part of the journey).
Looking at other modes of transport, the globalisation of manufacturing and growth in internationaltrade have led to large increases in both air travel and shipping since the 1950s. Air pollution fromshipping spreads beyond ports and makes an important contribution to airborne particle pollutionacross Europe. The greatest air pollution from shipping occurs in coastal countries, including the UK.24
Airports also impact on the communities around them; for example, Heathrow makes a well-recognisedcontribution to NO2 concentrations across suburban west London.25
1.2 Heating our homes
The automated central heating systems that most of us enjoy today are a far cry from the daily labour ofcleaning and making fires that featured through most of our history. Today, the vast majority of homesare heated by gas or electric systems that provide warmth at the touch of a button or the click of a timerswitch. For most UK cities, smoky home fires are a thing of the past. Compared with the sulphur, sootand particle pollution emitted from open coal fires, gas boilers produce very little particle pollution, butthey do contribute to urban NO2.
There are, however, some important differences in the nature of emissions and prevailing pollution levelsacross the UK. Notably, in Northern Ireland, outside Belfast the gas distribution grid is less developed. Asa result, small towns can still experience high levels of airborne particles and polyaromatic hydrocarbons(PAHs) from local coal and oil burning.
We must, however, be cautious before consigning solid fuel burning to history. The increasing popularityof wood burning for heating, in part due to policies to reduce CO2 emissions, risks undoing some of theair quality improvements that have resulted from widespread adoption of gas for domestic heating.Particles from wood burning can now be found each winter in our urban air, mainly at weekends, withwood burning accounting for between 7 and 9% of London’s wintertime particle pollution.27 Studies
1 Air pollution in our changing world
Box 4: How banning coal improved the health of Dubliners
Although the availability of natural gas transformed urban heating in the UK, this was not the case inIreland. In Dublin, increased oil prices brought about an increase in coal heating in the 1980s, withassociated wintertime smogs that could be linked to respiratory deaths. On 1 September 1990, the Irishgovernment banned the sale and distribution of bituminous coals in the city. The change in airpollution was immediate, with black smoke decreasing by 70%. Respiratory deaths in Dublin decreasedby 17% after the ban, and there was a 9% decrease in Cork when the ban was extended in 1995.26
© Royal College of Physicians 2016 9

Every breath we take: the lifelong impact of air pollution
have shown that smoke from wood heating enters neighbouring homes, providing a clear exposurepathway.28,29
The outdoor environment is not the sole source of the pollution that we experience indoors. Beingindoors can offer some protection against outdoor air pollution, but it can also expose us to other airpollution sources. There is now good awareness of the risks from badly maintained gas appliances,radioactive radon gas and second-hand tobacco smoke, but indoors we can also be exposed to NO2 fromgas cooking and solvents that slowly seep from plastics, paints and furnishings. The lemon and pinescents that we use to make our homes smell fresh can react chemically to generate air pollutants, andozone-based air fresheners can also cause indoor air pollution.
1.3 Powering our homes and industry
The iconic smoke stacks of Battersea Power Station and those that now make Tate Modern a Londonlandmark are a reminder of the extent to which coal and heavy oil used to be burned to generateelectricity in the very hearts of our cities. The consequential impacts on urban air pollution can beclearly seen in the 1952 maps of London’s air pollution35 and were very obvious in the black staining ofthe stonework of buildings at the time.
Today, electricity comes from larger power stations that are subject to modern emission controls and arepredominantly located outside our cities. Although a quarter of our electricity still comes from coal-powered generation, this is set to fall still further. Less-polluting sources such as gas, nuclear andrenewables now dominate electricity generation in the UK. Even in the past 20 years, controls onemissions from large power stations have brought an end to the SO2 problems from power stationplumes across Yorkshire, London and other urban areas each summer and winter.
A new focus on decreasing energy consumption should progressively reduce air pollution from powergeneration and industry. Looking to the future, the closure of further parts of the UK’s coal-firedgenerating capacity and growth in other fuelled sources and renewables will lead to more air qualityimprovements. However, a proposed return to small-scale urban energy production through combinedheat and power systems needs to be properly controlled and managed to avoid additional contributionsto local air pollution.36
10 © Royal College of Physicians 2016
Box 5: The effects of indoor smoking bans can be seen in health data
There is a large body of research into the effects of smoke-free legislation. Various bans are now inplace in 92 countries. As a tool to improve indoor air pollution, smoke-free legislation has been veryeffective; for example, PM2.5 (particulate matter that is generally <2.5 µm in diameter) decreased by86% in Scottish bars.30 However, it is the decrease in heart attacks across the whole population that ismost striking. In 2014, a review of 37 studies concluded that indoor smoking bans led to an average12%decrease in acute coronary events.31 Other studies have shown that indoor smoking bans werefollowed by decreases in hospital admissions for childhood asthma (15%)32 and decreases in theincidence of stroke.33 Despite fears, smoking bans have not led to more smoking in cars or homes; inScotland, there is evidence that people with children stopped smoking inside their own homes aswell.34

1.4 Increased urbanisation
Globally, over half of the world’s population now lives in cities. Urban dwelling brings people into closeproximity to transport infrastructure, along with the pollution from buildings. Managing the air qualityconsequences of growing urbanisation is a world problem. Within the UK, the proportion of thepopulation living in urban areas has been relatively stable at 80%, with only 2% growth since 1980.37
However, absolute numbers are increasing: between 2001 and 2011, the urban population of Englandand Wales increased by 8.1%. London stands out, with a decadal growth of 14%38 and a projectedadditional 1.4–1.7 million people by 2031,39 many of these being children and young people. New urbandwellers will require places to live, schools and amenities, along with increased requirements fromtransportation: the delivery of goods, services and personal travel. Therefore, we need to ensure that theair pollution exposure of the new urban population does not lead to an additional public health burden,especially recognising relentless growth in the population. To date, little attention has been paid in urbanor rural planning to the air pollution exposure in housing and schools due to their proximity to roads.
Through the 1990s, the average urban car journey increased by 20% owing to growing long-distancecommuting and non-work travel. Compact mixed-use developments (residential, educational, leisureand business) can reduce the need for travel, whereas the separation of housing, employment, leisure andservices can make lengthy car journeys a necessity rather than a choice, and increase social exclusion forthose without access to a car.5 Even within our current cities, there is considerable scope for active travelfor short journeys: in 2013, 23% of car trips in England were shorter than 2 miles.40
1.5 New knowledge about the spatial scale of air pollution problems
UK measurements of air pollution in the 1950s through to the 1970s focused on the perceived priorities ofblack smoke (soot) and air acidification through SO2, which both came from local coal burning. This focusmeant that many other pollutants were overlooked, including those from traffic and those that formsecondarily in the atmosphere from other pollutants (especially O3, and ammonium nitrate and sulphateparticles). During the mid-1990s, new measurements of PM10 (mass of particles <10 µm in diameter) ledto the recognition that air pollution over the UK could be substantially influenced by emissions fromoutside the country41 from distant industry, traffic and agriculture. Similarly, measurements initiatedduring the 1970s42 found that the UK experienced problems with summertime smog: specifically ground-level O3, the pollutant synonymous with the Los Angeles smogs of the 1950s and 1960s. This smog can takedays to form, as a result of atmospheric chemistry catalysed by sunlight (photochemical pollution), duringwhich time air can slowly move over hundreds of miles. While it is recognised that air pollution from afactory can affect people and the environment downwind, there is less recognition of the impacts of citieson their surrounding regions. Control of modern air pollution must therefore take place at different spatialscales, from the local busy road to the urban scale. There is an urgent need for cities to collaborate toreduce the impact of the pollution that they emit into the air that they share.
1.6 Taking control of our air
Air pollution management has evolved in tandem with our increasing knowledge of the health burdencaused by poor air. The first attempts to control urban air pollution were directed towards single sources:medieval London’s prohibitions on the burning of sea coal and the Victorian Alkali Acts, which focusedon local impacts from the early chemical industry. The death toll from the 1952 smog led to an evolutionin air quality management, with the focus on point sources being supplemented by area-wide actions on
1 Air pollution in our changing world
© Royal College of Physicians 2016 11

Every breath we take: the lifelong impact of air pollution
smoke control mandated by the Clean Air Acts. Today, air pollution management has moved beyondsource control to the setting of internationally agreed limits on the quality of outdoor air. It takes amulti-source and multi-pollutant approach, guided by analysis of cost-effectiveness and cost–benefitratio. Such analyses show that the cost of air pollution is so high that far greater investments in tacklingthe problem would still yield a positive benefit to society. Despite this, few people consider pollutionrisks in their everyday lives. In its 2011 report,43 the parliamentary Environmental Audit Committeecalled for ‘[a] public awareness campaign to drive air quality up the political agenda and inform peopleabout the positive action they could take to reduce emissions and their exposure’. In contrast, currentinformation – such as the advice given during periods of high pollution – focuses on individuals, whoare advised to restrict their lives, rather than requiring emission reductions by polluters.
With research telling us that air pollution is still harmful even below current limits, and a lack ofevidence of a threshold where no effects exist for many pollutants, further control policies should seek todecrease pollution exposure, even where limits are met.
1.7 Conclusions
Since the smogs of the 1950s, numerous transitions in our society, the way in which we lead oureveryday lives, our home heating and our travel, along with legislative changes on air pollutionemissions, have brought about huge changes in the nature and amount of air pollution to which we areexposed. Not all of these changes have been expected or intended through policy. Research has alsochanged our perspective on the health risks of air pollution; an emphasis on controlling short pollutionpeaks from solid fuel burning has been replaced by concerns about long-term exposure to pollutionfrom transport sources.
Looking across the generations alive today, we can see contrasting lifetime pollution exposures. Many oftoday’s children grow up in urban environments with low levels of active travel and a diesel-dominatedtransport environment. In contrast, the childhood exposures of those now in middle age will haveincluded lead and emissions from petrol vehicles, along with peaks in summertime smog, while those inretirement had childhoods when winter air was dominated by ‘pea-souper’ smogs.
Many studies have demonstrated the public health burden of air pollution. Viewed from a differentperspective, better management of air pollution and our exposure to it presents a substantialopportunity for public health improvement, cost savings and increases in quality of life for many.Numerous case studies have shown how successes in reducing air pollution can lead to public healthimprovements in the short to medium term. If, as now seems likely, childhood and lifecourse exposuresto air pollution have lasting influences, then the gains will be even larger, and the benefits from tacklingair pollution today will be felt through the decades to come.
1.8 References
1 Bell ML, Davis DL. Reassessment of the lethal London fog of 1952: novel indicators of acute and chronicconsequences of acute exposure to air pollution. Environ Health Perspect 2001;109 (Suppl 3):389–94.
2 Committee on the Medical Effects of Air Pollutants. The mortality effects of long-term exposure to particulate airpollution in the United Kingdom. London: Health Protection Agency, 2010.www.gov.uk/government/publications/comeap-mortality-effects-of-long-term-exposure-to-particulate-air-pollution-in-the-uk [Accessed 30 November 2015].
12 © Royal College of Physicians 2016

3 Committee on the Medical Effects of Air Pollutants. Nitrogen dioxide: interim view on long-term average concentrationsand mortality. London: Health Protection Agency, 2015. www.gov.uk/government/publications/nitrogen-dioxide-interim-view-on-long-term-average-concentrations-and-mortality [Accessed 17 December 2015].
4 Dockery DW, Pope CA 3rd, Xu X et al. An association between air pollution and mortality in six U.S. cities. N Engl JMed 1993;329:1753–9.
5 Laden F, Schwartz J, Speizer FE, Dockery DW. Reduction in fine particulate air pollution and mortality: extendedfollow-up of the Harvard Six Cities study. Am J Respir Crit Care Med 2006;173:667–72.
6 Royal Commission on Environmental Pollution. Twenty-sixth report. The urban environment. London: HMSO, 2007.www.rcep.org.uk/reports/26-urban/documents/urban-environment.pdf [Accessed 30 November 2015].
7 Department for Transport. Annual road traffic estimates: Great Britain 2012. London: DfT, 2013.www.gov.uk/government/uploads/system/uploads/attachment_data/file/255742/road-traffic-statistics-2012.pdf[Accessed 30 November 2015].
8 Department for Transport. Road traffic forecasts 2015. London: DfT, 2015.www.gov.uk/government/publications/road-traffic-forecasts-2015 [Accessed 30 November 2015].
9 Carslaw DC, Rhys-Tyler G. New insights from comprehensive on-road measurements of NOx, NO2 and NH3 fromvehicle emission remote sensing in London, UK. Atmos Environ 2013;81:339–47.
10 Society of Motor Manufacturers and Traders. New car CO2 report 2014. The 13th report. London: SMMT, 2014.www.smmt.co.uk/2014/03/new-car-co2-report-2014/ [Accessed 30 November 2015].
11 Cames M, Helmers E. Critical evaluation of the European diesel car boom – global comparison, environmental effectsand various national strategies. Environ Sci Eur 2013;25:15.
12 Department for Environment Food and Rural Affairs. Air pollution in the UK 2014. London: Defra, 2014. http://uk-air.defra.gov.uk/library/annualreport/index [Accessed 21 December 2015].
13 Noble SR, Horstwood MSA, Davy P et al. Evolving Pb isotope signatures of London airborne particulate matter (PM10)– constraints from on-filter and solution-mode MC-ICP-MS. J Environ Monit 2008;10:830–6, and references therein.
14 Royal Commission on Environmental Pollution. Ninth report. Lead in the environment. London: HMSO, 1983.www.rcep.org.uk/reports/09-lead/1983-09lead.pdf [Accessed 1 December 2015].
15 European Environment Agency. Late lessons from early warnings: science, precaution, innovation. Copenhagen: EEA,2013. www.eea.europa.eu/publications/late-lessons-2 [Accessed 1 December 2015].
16 Jones AM, Harrison RM, Barratt B, Fuller, G. A large reduction in airborne particle number concentrations at thetime of the introduction of ‘sulphur free’ diesel and the London Low Emission Zone. Atmos Environ 2012;50:129–38.
17 Atkinson RW, Fuller GW, Anderson HR, Harrison RM, Armstrong B. Urban ambient particle metrics and health: atime-series analysis. Epidemiology 2010;21:501–11.
18 Hedley AJ, Wong CM, Thach TQ et al. Cardiorespiratory and all-cause mortality after restrictions on sulphur contentof fuel in Hong Kong: an intervention study. Lancet 2002;360:1646–52.
19 Holman C, Harrison R, Querol X. Review of the efficacy of low emission zones to improve urban air quality inEuropean cities. Atmos Environ 2015;111:161–9.
20 Wolff H. Keep your clunker in the suburb: low emission zones and adoption of green vehicles. Econ J2014;124:F481–F512.
21 Malina C, Scheffler F. The impact of low emission zones on particulate matter concentration and public health.Transp Res Part A Policy Pract 2015;77:372–85.
22 Department for Transport. National travel survey: England 2013. London: DfT, 2014.www.gov.uk/government/statistics/national-travel-survey-2013 [Accessed 30 November 2015].
23 Rabl A, De Nazelle A. Benefits of shift from car to active transport. Transp Policy 2012;19:121–31.
24 Viana M, Hammingh P, Colette A et al. Impact of maritime transport emissions on coastal air quality in Europe.Atmos Environ 2014;90:96–105.
25 Carslaw DC, Beevers SD, Ropkins K, Bell MC. Detecting and quantifying aircraft and other on-airport contributionsto ambient nitrogen oxides in the vicinity of a large international airport. Atmos Environ 2006;40:5424–34.
26 Dockery DW, Rich DQ, Goodman PG et al. Effect of air pollution control on mortality and hospital admissions inIreland. Res Rep Health Eff Inst 2013;176:3–109.
27 Fuller GW, Tremper AH, Baker TD, Yttri KE, Butterfield D. Contribution of wood burning to PM10 in London. AtmosEnviron 2014;87:87–94.
1 Air pollution in our changing world
© Royal College of Physicians 2016 13

Every breath we take: the lifelong impact of air pollution
28 Ries FJ, Marshall JD, Brauer M. Intake fraction of urban wood smoke. Environ Sci Technol 2009;43:4701–6.
29 Fuller GW, Sciare J, Lutz M, Moukhtar S, Wagener S. New Directions: Time to tackle urban wood burning? AtmosEnviron 2013;68:295–6.
30 Semple S, Creely KS, Naji A, Miller BG, Ayres JG. Secondhand smoke levels in Scottish pubs: the effect of smoke-freelegislation. Tob Control 2007;16:127–32.
31 Callinan JE, Clarke A, Doherty K, Kelleher C. Legislative smoking bans for reducing secondhand smoke exposure,smoking prevalence and tobacco consumption. Cochrane Database Syst Rev 2010;4:CD005992.
32 Mackay D, Haw S, Ayres JG, Fischbacher C, Pell JP. Smoke-free legislation and hospitalizations for childhood asthma.N Engl J Med 2010;363:1139–45.
33 Tan CE, Glantz SA. Association between smoke-free legislation and hospitalizations for cardiac, cerebrovascular, andrespiratory diseases: a meta-analysis. Circulation 2012;126:2177–83.
34 Akhtar PC, Haw SJ, Currie DB, Zachary R, Currie CE. Smoking restrictions in the home and secondhand smokeexposure among primary schoolchildren before and after introduction of the Scottish smoke-free legislation. TobControl 2009;18:409–15.
35 Wilkins ET. Air pollution aspects of the London fog of December 1952. Q J R Meteorol Soc 1954;80:267–71.
36 Clegg A, Wiatr A, Haigh C, McHugh C. Biomass and CHP emission standards. Report for Greater London Authority,Air Quality Support. London: Amec, 2013.
37 World Bank, 2014. http://data.worldbank.org/indicator/SP.URB.TOTL.IN.ZS/countries?display=default [Accessed 28April 2015].
38 Office for National Statistics. 2011 census analysis – comparing rural and urban areas of England and Wales. ONS,2013. www.ons.gov.uk/ons/rel/census/2011-census-analysis/rural-urban-analysis/comparing-rural-and-urban-areas-of-england-and-wales.html [Accessed 1 December 2015].
39 GLA Intelligence. GLA 2012 round population projections: intelligence update 05-2013. London: Greater LondonAuthority, 2013. http://data.london.gov.uk/dataset/2012-round-population-projections/resource/50a548be-8da7-4310-8a2a-34518281f271 [Accessed 1 December 2015].
40 Department for Transport. National travel survey: 2013. London: DfT, 2014.www.gov.uk/government/statistics/national-travel-survey-2013 [Accessed 17 June 2015].
41 Air Particle Expert Group (APEG). Source apportionment of airborne particulate matter in the United Kingdom.London: Department for the Environment, Transport and the Regions, 1999. http://uk-air.defra.gov.uk/library/reports?report_id=32 [Accessed 1 December 2015].
42 Cox RA, Eggleton AEJ, Derwent RG, Lovelock JE, Pack DH. Long-range transport of photochemical ozone in north-western Europe. Nature 1975;255:118–21.
43 Environmental Audit Committee. Air quality: a follow up report. London: TSO, 2011.www.publications.parliament.uk/pa/cm201012/cmselect/cmenvaud/1024/1024.pdf [Accessed 7 December 2015].
14 © Royal College of Physicians 2016

Chapter 2: Summary
We tend to think of the environment as the wide outdoor world. But it includes indoor spaces too. Eachday we move through a series of micro-environments as we make journeys, go to work or school, or stayin our homes. The air we breathe is different in each place.
Outdoors, we are exposed to a range of pollutants, many of which come from vehicles. These includeparticulates (mostly soot particles from diesel engines) and nitrogen oxides (exhaust gases). We alsobreathe in ozone, which is produced by chemical reactions in the atmosphere.
The quality of air indoors is important too, because we spend so much time inside. So we need toconsider things we use every day, from our gas cookers and cleaning and personal care products, tomaterials for DIY. Pets and insects can also affect some people, as can damp and mould. A fewsubstances, such as cigarette smoke and carbon monoxide, are very serious hazards.
Key facts
• The most important chemical pollutants in our outdoor air are:
° particulates – small specks of matter such as soot, which can be natural but are primarily fromtraffic (especially diesel engines)
° nitrogen oxides – gases generated by vehicles, or by chemical reactions in the atmosphere
° ozone – this gas is formed when other pollutants react in the atmosphere.
16 © Royal College of Physicians 2016
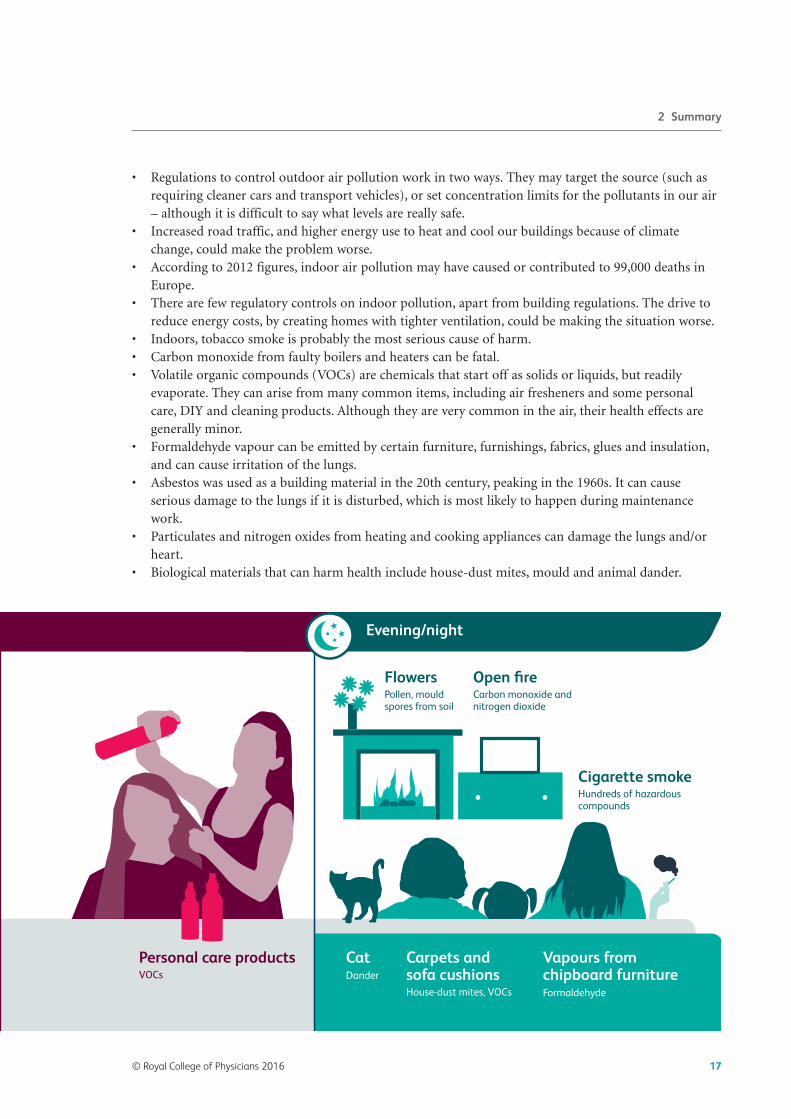
• Regulations to control outdoor air pollution work in two ways. They may target the source (such asrequiring cleaner cars and transport vehicles), or set concentration limits for the pollutants in our air– although it is difficult to say what levels are really safe.
• Increased road traffic, and higher energy use to heat and cool our buildings because of climatechange, could make the problem worse.
• According to 2012 figures, indoor air pollution may have caused or contributed to 99,000 deaths inEurope.
• There are few regulatory controls on indoor pollution, apart from building regulations. The drive toreduce energy costs, by creating homes with tighter ventilation, could be making the situation worse.
• Indoors, tobacco smoke is probably the most serious cause of harm. • Carbon monoxide from faulty boilers and heaters can be fatal. • Volatile organic compounds (VOCs) are chemicals that start off as solids or liquids, but readily
evaporate. They can arise from many common items, including air fresheners and some personalcare, DIY and cleaning products. Although they are very common in the air, their health effects aregenerally minor.
• Formaldehyde vapour can be emitted by certain furniture, furnishings, fabrics, glues and insulation,and can cause irritation of the lungs.
• Asbestos was used as a building material in the 20th century, peaking in the 1960s. It can causeserious damage to the lungs if it is disturbed, which is most likely to happen during maintenancework.
• Particulates and nitrogen oxides from heating and cooking appliances can damage the lungs and/orheart.
• Biological materials that can harm health include house-dust mites, mould and animal dander.
© Royal College of Physicians 2016 17
2 Summary

Chapter 2: The air we breathe
Our day-to-day world comprises a range of micro-environments through which we, as individuals, uniquelymove, live and breathe through the course of a day – and indeed throughout our lifetime. It includes, ofcourse, the outdoor environment, which is affected by a wide range of factors. Outdoor air, in turn,influences the quality of the air in indoor environments. But indoor environments also have their ownsources of contaminants, so that consideration of particular exposures in the home, public places,schools/colleges, hospitals, workplaces and transport is very important in assessing impacts of the breathedenvironment on our health and wellbeing.
As will be demonstrated in this chapter, there are often ‘unintended consequences’ of actions and policiesthat impact the breathed environment, including problems relating to the design and/or formulation ofproducts and materials, and the health consequences of exposure to their ingredients or components.
2.1 The air outside
2.1.1 What are the main pollutants, where do they come from and what effects do they have?
Outdoor air contains a range of pollutants from a variety of sources, both natural and man-made. Asoutlined in Chapter 1 of this report, the principal anthropogenic pollution sources are transport vehicles(petrol and diesel engine emissions, along with products from tyre and brake wear), power stations andfactories. The atmosphere also contains dust from geological sources and compounds that are the product ofchemical reactions between individual substances in the air, as well as a wide variety of gases and particlesthat originate from natural and biological sources, ranging from volcanic activity to natural ecosystems,agriculture and forestry.
The key pollutants in outdoor air are generally regarded to be particles (measured as PM10 and PM2.5), oxidesof nitrogen (principally NO2) and ozone (O3), with sulphur dioxide (SO2), carbon monoxide (CO),hydrocarbons (including benzene, 1,3-butadiene and PAHs) and metals also being significant from ahealth perspective.
The health effects of all these substances have been intensively studied, and comprehensive assessments of theirindividual impacts on health are available elsewhere.1–3 Chapter 6 shows that their effects are considerable, andthat these pollutants are all subject to national and/or international ambient concentration limits. Pollutantswith the greatest current impact on public health are considered to be PM2.5, O3 and NO2. However, in mostcases legislated concentration limits do not represent a ‘safe’ level for the population as a whole, but are oftentalked about as levels considered to not pose a ‘significant risk’ to health. This begs the question of the meaningof ‘significant’ – given, for example, that impacts of exposure to fine particles have been observed at very lowconcentrations and that there is no evidence for a threshold for exposure at the population level. TheCommittee on the Medical Effects of Air Pollutants (COMEAP) estimates 29,000 ‘equivalent’ deaths annuallyfrom exposure to PM2.5 in the UK,4 with only a small fraction of that figure relating to exposures toconcentrations in excess of legal limits. This figure increases to around 40,000 if the recently described effectsof NO2 are taken into account.5,6 The reality is that agreed standards often incorporate considerations ofpracticality, ie by how much is it economically reasonable to reduce emissions? For this reason, World HealthOrganization (WHO) guidelines – based solely on health concerns – are considerably lower in someimportant cases than national or EU limit values, and even these are not totally protective.7
18 © Royal College of Physicians 2016

It is known that road traffic emissions – especially of NO2 and PM – are very significant in terms of totalpollutant loading of the outdoor air, and that diesel vehicles emit significantly higher levels of thesesubstances than their petrol-driven equivalents. Thus, diesel vehicles are a valid target for furtherpollution-reduction measures.
2.1.2 The control and regulation of outdoor air pollutants*
There are many regulations and initiatives aimed at reducing the concentration of pollutants in theoutdoor air. Some of these directly limit point-source emissions (such as those from factories, powerstations, vehicles, ships etc), while others aim at managing the total input of pollutants into the localenvironment. Some options for emission controls will lead to a reduction in several air pollutantssimultaneously. For example, improved vehicle efficiency (and more reliable emission monitoring andtesting), and the promotion of active transport, should reduce all tailpipe exhaust emissions. Someoptions, such as requirements for particle traps on diesel vehicles, are more specific.
2.1.3 Possible future impacts of climate change and related factors†
Despite technological advances, for example in reducing emissions from individual motor vehicles, thegrowth in the number of cars, buses and commercial transport vehicles using the roads creates realproblems for any authority charged with the task of controlling the levels of key pollutants in outdoor air –especially around busy roads in built-up areas. Such problems are likely to remain with us for many years.In addition, there may be new issues associated with climate change and society’s adaptations to thesechanges (see Chapter 7). For example, in the UK the greatest energy use is by buildings, and if winters wereto become colder and/or summers become hotter, as has been forecast with climate change, there may bemarked increases in energy demand for heating and air conditioning, which will require increased energyoutput from power plants. In turn, this may lead to increased combustion of fossil fuels and concomitantrises in pollution emissions from these sources. The growing popularity of wood burning in fires and stovesis a further concern, as this liberates significant amounts of particulate pollution into the outdoor air – asdo forest fires. Similarly, the current proliferation of small commercial plants designed to burn biofuels (forheating industrial estates, for example) is of potential concern and may need to be regulated.
Given that fossil fuel combustion is a major source of both greenhouse gases and local air pollutants, ifaction is taken to address climate change there could be major improvements in outdoor air quality as aresult of decarbonisation of power and transport systems, and improved efficiency of energy use. Indeed,the economic benefits of improved health resulting from reduced exposure to fine particles and otherlocal and regional air pollutants as a consequence of climate policies have been estimated to be sufficient,on their own (ie without reference to climate benefits), to justify a range of climate actions beingadopted (see Chapter 7).
2.1.4 A brief overview
Numerous pollution sources impact the outdoor air, causing a build-up of substances that can adverselyaffect our health and wellbeing. Some of these pollutants are natural and unavoidable, while others arethe clear and direct result of industrialisation and urbanisation. While the impacts of these on any
2 The air we breathe
*See also section 2.4. †See also Chapter 7 of this report.
© Royal College of Physicians 2016 19

Every breath we take: the lifelong impact of air pollution
individual may be indiscernible, effects on whole populations can be significant, as is the case for PM,which affects the heart and lungs, and causes measurable increases in population morbidity andmortality (see Chapter 4).
Principal pressures on outdoor air quality come from vehicles and the burning of fossil fuels for energy.Further expansion of road traffic and possible increased energy consumption in buildings because ofclimate change further add to the burden of pollutants in outdoor air.
2.2 Indoor air
2.2.1 Indoor sources of pollution
The quality of the air indoors is important, because it is here that we spend the majority of our time –whether that is at home, at work,* at school, in shops or in vehicles. One important source of indoor airpollution is outdoor air, gaining ingress through windows, doors and general building ‘leakiness’. So,‘clean’ outdoor air will help to ensure high-quality air indoors. But there are many important andsometimes potent sources of pollution that are located inside buildings and other internal spaces. Theseinclude both natural and anthropogenic sources.
2.2.2 Natural pollution sources
Natural pollution sources include a number of biological ones. We ourselves release pollutants includinga personal particle cloud through normal metabolic processes, and also through use of personal careproducts. In addition, we often share our indoor environment – both deliberately and unwittingly – withvarious other living organisms. There are pets of course, dogs, cats and sometimes birds, rabbits androdents, but also various insects and arachnids that enjoy home comforts, especially including house-dust mites, bacteria and moulds that thrive in warm, moist environments. In addition, cut flowers andpotted plants may release pollen into the indoor air.
Another important potential source of indoor air pollutants is the soil and bedrock upon which a houseor other dwelling is built – a major determinant of exposure to radon, for example.
2.2.3 Anthropogenic sources – the influence of what we do, what we use, and how and where we live
There are a large number of potential ‘man-made’ pollution sources in indoor environments, especiallythe home (see Fig 3). Probably top of the list in terms of health consequences is the smoking ofcigarettes, cigars, pipes etc, giving rise to so-called ‘second-hand smoke’ containing many noxioussubstances. In addition, hookahs/shisha smoking, candles, joss sticks and other materials that we burnfor recreational purposes emit pollutants into the indoor air. Combustion appliances – cookers, boilers,open fires and portable gas/paraffin heaters (with no flue) – are particularly significant in terms of totalemissions.† The building itself, the materials from which it is built and those with which it is decoratedare also important potential sources of chemical pollutants – these include the construction materials, aswell as paints, glues, furniture, wallpaper and drapery. Cleaning and DIY products, air fresheners andother consumer products such as insecticide sprays that we use in the home are also important. Some
20 © Royal College of Physicians 2016
*Workplaces are considered special situations and are dealt with separately in section 2.3. †It is noteworthy that, in the UK, the use of gas for cooking and heating is particularly prevalent.8

waterproofing/filling DIY products can contain highly asthmagenic di-isocyanates, for example. It is nowknown that pieces of electrical equipment, including scanners and photocopiers, also emit pollutants –and for houses with built-in garages, the ingress of vehicle exhaust and vapours from petrol, storedpaints and solvents, etc can affect the quality of indoor air in the home. Educational establishments (seeBox 7), shops and offices may have additional sources of pollution – relating to activities and/or storeditems – including materials that emit VOCs.
The principal pollutants emitted from indoor sources are shown in Box 6. Additional compounds maybe generated through chemical reactions between certain pollutants in indoor air – for example, betweenozone and VOCs – forming complex new organic substances. Also, water vapour production in homes(and condensation due to poor building design/construction etc) is important because it encourages thegrowth of moulds and house-dust mites, and because damp homes are known to be unhealthy homes.
The possible health consequences of exposure to the substances listed in Box 6 have been well evaluatedelsewhere;9,10 potential health impacts include asthma, chronic obstructive pulmonary disease (COPD),respiratory irritation, effects on the heart, and cancer,* as well as non-specific symptoms such asheadache, tiredness and loss of concentration (sometimes referred to as ‘sick building syndrome’).According to the European INDEX project,11 the most significant of these pollutants (excluding tobaccosmoke – see below) in terms of health impact are formaldehyde, NO2, CO, benzene and naphthalene. COis of special concern because it is known that acute exposure can cause collapse and death. It is all themore deadly because there are no warning signs and the early symptoms can resemble those of foodpoisoning.8 Moreover, certain persistent health effects may occur following high-level acute exposure or
© Royal College of Physicians 2016 21
BedroomsDust and dust mites, bacteria and viruses, pet dander, VOCs from personal care products
AtticMan-made mineral fibres, asbestos, formaldehyde, dust
BathroomMould and mildew, bacteria, VOCs and other chemicals from cleaning products
Living areasRadon from soil/bedrock, CO and NO2 from fires and wood-burning stoves, VOCs and formaldehyde from carpets, paints, glues, furniture and air fresheners, tobacco smoke, pet dander
KitchenCO, NO2 and particulates from gas cookers/stoves, VOCs from household cleaning products
GarageCO from car exhaust, mould and mildew, VOCs from stored paints and solvents, pesticides and herbicides
Fig 3. Sources and types of indoor pollution encountered in homes. VOCs = volatile organic compounds.Please note that these lists are not exhaustive and that the actual pollutants present, and their amounts,will vary from household to household.
*Second-hand tobacco smoke, benzo(a)pyrene, radon, benzene and asbestos are established human carcinogens.
2 The air we breathe

Every breath we take: the lifelong impact of air pollution
prolonged low-level exposure to CO. Formaldehyde is important because it is a respiratory irritant and asensitiser, and is essentially ubiquitous. CO2 is rarely regarded as a threat to health in indoorenvironments, but in buildings such as schools it can rise to levels high enough to cause drowsiness,
22 © Royal College of Physicians 2016
Box 6: Key indoor pollutants
Pollutants emitted from indoor sources include:
• second-hand smoke – from tobacco smoking • CO (and CO2) – from combustion appliances, open fires and burned materials/products; faulty orpoorly maintained gas heaters and boilers are a particularly important source
• bacteria and viruses – from inhabitants and decaying materials • biological allergens – from house-dust mites, insects, moulds, and animal dander from pets • formaldehyde – from composite wood furniture and fittings, fabric, glues, urea–formaldehyde foaminsulation
• PAHs, including benzo(a)pyrene – from cooking • VOCs, including benzene, naphthalene and ‘essential oils’ such as terpenoids – from a wide variety ofhousehold, consumer and personal care products
• oxides of nitrogen – from combustion appliances • ultra-fine particles – from combustion appliances and cooking • pollen – from plants/flowers • ozone – from electrical appliances • phthalates – from plastic materials • polychlorinated biphenyls (PCBs) and other persistent organic compounds – from old paints, masticsand sealants, plastics and flame retardants
• insecticides – from timber, timber treatment, pesticide sprays • radon (a radioactive gas) – from soil/bedrock and building stone • methane – from contaminated ground soil • lead – in dust from old paintwork • mineral dusts and fibres (including asbestos) – from building and insulation material.
Box 7: Indoor air quality in schools
The recently completed EU SINPHONIE project12 has revealed significant problems within schoolbuildings, including:
• concentrations of PM2.5 and radon above recommended limits in some schools • levels of CO2 above 1,000 ppm in some schools • exposure of some schoolchildren to levels of benzene above 5 µg/m3
• exposure of some schoolchildren to levels of formaldehyde above 10 µg/m3
• exposure of some children and teachers to high levels of moulds and bacterial endotoxins.
Health outcomes linked with environmental exposure include asthma, allergies and various othernasal/respiratory symptoms.

hence affecting concentration and productivity. Exposure of children generally – and indeed of thedeveloping fetus via maternal exposure – to indoor air pollutants is of particular concern (see Chapter 3).
The presence of asbestos in the fabric of schools13 is discussed in section 2.3. The question of whetherchildren are at particular risk from asbestos exposure, as might occur while they are at school, wasrecently addressed by the Committee on Carcinogenicity.14 The committee concluded that, from thelimited data, it is not possible to say whether children are intrinsically more susceptible than adults toasbestos-related injury (lung fibrosis, cancer and mesothelioma).* However, owing to the increased lifeexpectancy of children compared with adults, there is an increased lifetime risk of mesothelioma as aresult of the long latency period of the disease. For a given dose of asbestos, the lifetime risk ofdeveloping mesothelioma is predicted to be about three times greater if first exposure occurs as a child(aged 5) rather than as an adult (aged 25).
The health effects of second-hand smoke are now well understood and are considerable (Box 8), andlegislation has been put in place to control exposure in public places (see Chapter 1). However,controlling or reducing exposure to second-hand smoke in the domestic environment is more difficultand requires substantial educational campaigning – especially with regard to the exposure of children,and pregnant women and hence the unborn child. The legislation on smoking in vehicles containingchildren is a further step forward. There are also current concerns about possible adverse consequencesof exposure to e-cigarettes, but the body of evidence is not sufficient to allow any firm conclusions orrecommendations to be made at this time.
Box 8: Health effects of second-hand smoke15
Second-hand smoke contains at least 7,000 chemicals. Consequences of exposure include:
• cardiovascular disease – including coronary heart disease and stroke • lung cancer – non-smokers exposed to second-hand smoke have an estimated 20–30% increased riskof developing lung cancer
• sudden infant death syndrome (SIDS) – risk is increased in infants exposed before and/or after birth • health problems in children – including wheezing, bronchitis, ear infections and asthma attacks
Because polluted outdoor air can enter buildings and degrade the quality of the indoor air that we breathe,there is much to be gained by building schools, hospitals etc away from heavily polluted roads. A location'spostcode can be used as a reasonable surrogate for exposure to certain outdoor pollutants. But for othersubstances the concentration indoors is as much as ten times higher than that outdoors because of thepresence of internal sources. This emphasises the importance of indoor air quality – not only do wespend considerably more time indoors than out, but the range and concentration of pollutants insidebuildings are often much greater than those found outdoors.
Useful indicators of indoor air quality are measured levels of CO2 or of total VOCs (TVOCs). These arenot indicators of potential health effects but rather of problems with ventilation that could lead to healtheffects, and hence are useful for remediation purposes.
*Mesothelioma is a malignant cancer of the tissue that lines the space between the chest and the lung.
2 The air we breathe
© Royal College of Physicians 2016 23

Every breath we take: the lifelong impact of air pollution
2.2.4 The question of mixtures
We are constantly exposed to numerous substances from multiple sources, and this is especially true of airpollutants. Most risk assessment approaches and procedures evaluate risks on a substance-by-substance basisand do not consider combined adverse health effects due to exposure to multiple chemicals.16 It has beenasserted that the determination of risk on a single-chemical basis could well underestimate the combinedrisks of mixtures.17 The indoor environment is one situation where the issue of simultaneous exposure tomultiple substances is of high relevance. The recent publication by De Brouwere et al16 proposes a practicalscreening method for the evaluation of mixtures in residential indoor air.
Sometimes synergistic (more than additive) interactions between pollutants can occur. While these aremostly unknown, or at least uncharacterised, there is some evidence that such interactions may occurbetween radon and tobacco smoking in the causation of lung cancer. This is one reason why radon, which isimportant in itself, is increasingly recognised as a very significant indoor air pollutant. Also, pollutant gasesfound indoors, such as NO2 and formaldehyde, can markedly increase the effects of exposure to allergenssuch as house-dust mites by acting as adjuvants in enhancing allergic sensitisation.
2.2.5 Out and about – pollutants in transport and public places
Exposure to air pollutants inside road vehicles is dominated by traffic pollutants drawn into the vehicle.Indeed, air pollution levels inside vehicles are frequently higher than those outside as a result of fans andair conditioning units venting exhaust fumes from tailpipes directly into the vehicle. Other potentialpollutants include petrol vapour (including benzene) released during refuelling, tobacco smoke, andVOCs from the construction/furnishing materials (plastics and fabrics) used in the vehicle – as well asfrom air fresheners deliberately placed inside the vehicle. The impact of in-vehicle pollution on children’shealth has recently been recognised by legislation banning smoking in cars if children are present.Aircraft have an additional, if minor, problem of fumes from aviation fuel and products of lubricating oilcombustion that may infiltrate the cabin at certain stages of flight.
Until recently, pollution in public places was dominated by second-hand smoke, but this problem has beenall but eradicated by the introduction of smoking legislation (see Chapter 1). Other causes of pollution inpublic places are largely dependent upon the type of space, and will include some or all of the domesticindoor air pollutants listed above. Many public places are also workplaces, as recognised in section 2.3 below.
2.2.6 How can indoor air pollution be controlled – and what happens if it isn’t?
The practicalities of setting guidelines and establishing control policies for indoor air pollutants havepreviously been explored.18 There are a number of difficult issues, including the complexity of pollutionsources and the multitude of parties potentially responsible for causing, monitoring and/or regulatingindoor air pollution. As already noted, the quality of indoor air in any particular building or location isdependent on a number of factors that are themselves governed by a range of different influences, includingthe quality of the outdoor air, the design and condition of the building, ventilation exchange rates, thefurnishings present, and the occupiers’ lifestyle, habits and behaviours, including their management of thebuilding and use of products.
Although acknowledgement of the importance of indoor air quality has often led to calls for legislation,specific legislation for this purpose is often not available, has gaps, or is perceived as too ‘intrusive’ on
24 © Royal College of Physicians 2016

individuals’ lifestyles; moreover, very often no single authority or profession has overall responsibility forindoor air quality (see Fig 4). Positive examples of legislative instruments that apply to indoor air qualityinclude the provisions of the building regulations, which do exert some control over ventilationrequirements, radon ingress etc, and the highly successful policy to ban smoking in public places, whichundoubtedly has led to reduced smoking indoors – although, apart from smoking in vehicles carryingchildren, legislation does not cover smoking inside private spaces.
Despite this complexity, in 2010 the WHO published quantitative guidelines19 for the protection of publichealth from risks due to indoor benzene, CO, formaldehyde, naphthalene, NO2, PAHs (especiallybenzo(a)pyrene), radon, trichloroethylene and tetrachloroethylene. These guidelines are targeted at publichealth professionals involved in preventing health risks of environmental exposures, as well as at specialistsand authorities involved in the design and use of buildings, indoor materials and products. In 2014, theWHO report was followed by indoor air quality guidelines for household fuel combustion,20 targetingpredominantly low- and middle-income countries where poorly vented and inefficient stoves using highlypolluting biomass fuels are common, and responsible for a significant health burden. A recent commissionreport on household air pollution21 established that nearly 3 billion people worldwide are exposed to thethreat of household air pollution every day from the use of solid fuel for cooking, heating and lighting. Theauthors concluded that household air pollution is a major contributor to global figures for morbidity andmortality, with major effects on respiratory symptoms and disease, including non-smoking COPD.
A WHO global burden of disease analysis22 identified household air pollution as an extremely importantrisk factor accounting for an estimated 4.3 million deaths worldwide in 2012, mostly in low- and
2 The air we breathe
© Royal College of Physicians 2016 25
Layer
Local
Local authorities
Instrument
Scope
Regulatory toolboxProhibitions, enforcement, remedies, assessment, information disclosures
Statutory instruments
Case law
Bye-laws
Standards
Soft law
Self-regulation
Statutes
Treaties
Conventions
Directives
Regulations
National
ParliamentDevolved governments
Regional
European Union
Environment
Building standardsTown planningFiscal policyHousing and tenancy
Industry
Occupational healthCorporate governanceAgricultureBusiness permitsManufacturing
Products
Product standardsVehicle emissions limits
People
Human rightsWaste disposalTransportationSmoking bansSmoke control zones
Relationships
Health and safetyNuisanceTrespassNegligence
International
United NationsWorld Trade Organization
Fig 4. The regulatory framework for the control of air pollution. Courtesy Nikhil Gokani, School of Lawand Social Justice, University of Liverpool.

Every breath we take: the lifelong impact of air pollution
middle-income countries and including some 99,000 in Europe. Around 60% of these deaths are due tostroke (34%) and ischaemic heart disease (26%), with the remainder accounted for by COPD (22%), acutelower respiratory disease (12%) and lung cancer (6%). According to WHO, the guidelines that it hasproduced provide a scientific basis for legally enforceable standards. They may also be useful as the basis foremissions standards/limits to achieve appropriate source control indoors, which is the specific aim of variousexisting emission limit-setting and product-labelling initiatives in Europe.23 Other building- and housing-related policy options to improve indoor air quality and associated quantified impacts on occupant healthare presented in the EnVIE report.24
2.2.7 Possible future impacts of climate change and associated factors*
There are many direct and indirect consequences of climate change, and society’s adaptations to it, that maysignificantly affect the indoor environment and, in turn, its influence on occupant health and wellbeing. Atpresent, initiatives to conserve energy in homes (in an effort to reduce carbon emissions) have generally ledto reductions in ventilation (air change rates) and hence the potential build-up of pollutants from indoorsources. Unless properly addressed in a coordinated fashion through planning, design and constructionpolicies, the pressure to save energy will continue to degrade the quality of the indoor environment. Thepossibility of colder winters will add to this pressure while, if summers become hotter, the use of airconditioning in domestic buildings may supplant window opening, which will similarly lead to a morepolluted, and less healthy, indoor environment.
2.2.8 Quick summary
There are many different sources of indoor air pollution, with numerous substances emitted. Pressures toconserve energy have often led to reduced ventilation and hence an increased propensity for the build-upof hazardous substances inside buildings. Drivers associated with climate change may add increasingburdens to maintaining clean, healthy indoor air. Maintenance of good ventilation is key, together withappropriate source control, which might include emission standards/limits linked to quantitative indoorair guideline values. Although the ban on smoking in public places has been highly effective, thereremains a need to reduce exposure to second-hand smoke inside the home.
2.3 Workplace air
2.3.1 Some special concerns
Some of the general indoor issues discussed above also apply to workplaces, but there are in addition anumber of special concerns.
Workplaces constitute a unique form of environment where exposures to harmful inhaled agents mayoccur; they may be predominantly indoor (typical factory settings, offices, salons and commercialenvironments), outdoor (including agricultural- and environmental-based jobs), underground(including mining and hyperbaric tunnelling) or in hostile environments (including offshore, altitudeand deep-sea work). Health risks arising from air pollutants in the workplace can be appreciably higherthan those of the same pollutants occurring in the domestic situation, as exposure concentrations can besubstantially higher. While the focus of this section is on air quality in interior spaces, it is clear that
26 © Royal College of Physicians 2016
*See also Chapter 7 of this report.

outdoor air quality issues still apply to many workers, particularly those who work near sources ofoutdoor air pollution including, for example, urban-based traffic police and street cleaners. Also, someworkplaces can be local ‘hotspots’ of air pollution, giving rise to increased exposure and possible elevatedrisk of respiratory conditions among neighbourhood inhabitants.
Workers in these diverse types of workplace may find it difficult to reduce or materially influence theirexposure to harmful inhaled agents. Because of the reliance on the employer to control the nature ofthe air breathed by workers, workplace air quality is normally regulated, although the nature and typeof the regulation will vary from country to country. In the UK, the Health and Safety at Work Act andsubsequent Control of Substances Hazardous to Health (COSHH) regulations contain much of thelegislation used to control harmful inhaled exposures at work. These underpin a risk-based approach,where those responsible for the quality of air in workplaces assess likely exposure, estimate the likelyrisk, and develop a set of interventions in the so-called ‘hierarchy of control’ to reduce the risks tohealth.
The lung is vulnerable to exposure to a broad range of harmful substances in the workplace, includingallergens, asthmagens, organic dusts, mineral dusts and fibres, solvents and VOCs, gases and chemicalcarcinogens. Newer types of exposure include engineered hypoxic environments to control ignition risks.This serves to illustrate how complex workplace air quality considerations can be, and shows that theseconsiderations need to evolve with changes in workplace design.
Four examples – asthmagens, organic dusts, mineral dusts and fibres, and hypoxic environments – aredetailed in Box 9 to illustrate some current and future risks among the UK workforce.
In addition to the more traditional work-related respiratory diseases, perhaps more difficult to quantifyare illnesses that arise from a particular workplace environment where a single, particular responsibleexposure has not yet been identified. These include building-related illness (otherwise known as ‘sickbuilding syndrome’) – a constellation of non-specific upper airway, eye and nasal symptoms oftenassociated with newer building occupancy and also with perceived lack of control by the occupants overtheir environment. The roles of various exposures, including VOCs, O3 and PM, have been assessed, andwork continues to identify the best preventative strategies. Other issues relevant to workplaces/officesinclude the use of large numbers of printers and photocopiers that may emit O3. More generally, poorair quality is known to have measurable impacts on worker productivity.
It is also important to recognise that certain workplaces are public areas, and here air quality willinfluence, and be influenced by, both public and worker occupancy. While exposure to environmentaltobacco smoke may be less of a risk nowadays given recent UK-based legislation, the use of cleaning andpersonal care products, sprays and vaporisers, and also emissions from large quantities of stored itemsand products (eg inside shops and warehouses), may pose particular air quality issues.
The structure/fabric of workplaces can also give rise to low-level inhalation exposures known to causerespiratory ill health, including exposure to asbestos fibres in older buildings, and to formaldehyde andVOCs in newer builds. Builders, carpenters and electricians, for example, have been at particular riskfrom exposure in their day-to-day work to asbestos in old domestic and commercial buildings (see Box9). Exposure of teachers to asbestos, used in the construction of many schools during the 1940s to1980s,13 is also a matter of ongoing concern. Work continues in an effort to understand the risks posedby these vicarious exposures in both public and privately owned buildings.
2 The air we breathe
© Royal College of Physicians 2016 27

Every breath we take: the lifelong impact of air pollution
Looking to the future, newer ‘green’ workplaces will be constructed, and newer technologies will bedeveloped for use within them. The latter include significant developments in, for example, the use ofadvanced materials and three-dimensional printing. The construction, occupancy and exposure profilesof newer workplaces will lead to the potential for novel inhaled hazards and risks, and vigilance will berequired in order to identify the occupational lung problems attributed to the workplaces of tomorrow.
2.3.2 Main points
The workplace can be the location of significant exposures to airborne substances that can pose real andmeasurable risks to health. That is why stringent workplace regulations are in place – to protect workers
28 © Royal College of Physicians 2016
Box 9: Examples of workplace risks
AsthmagensBakers, flour confectioners, metal machiners, welders, assemblers, vehicle paint sprayers, chemicalprocess workers, cleaners and nurses are particularly at risk of asthma. The responsible agents includedi-isocyanates (typically in ‘twin-pack’ paints), flours, cutting oils, animal proteins, wood dusts, metals,welding fumes and cleaning agents. A particular ongoing concern relates to ‘novel’ chemicals designedas high-performance adhesives, resin or polymer precursors, sealants or coatings.
Organic dusts Exposures are highly varied and include exposure to bioaerosols, including endotoxins, bacteria, virusesand fungi. These have a variety of potential health consequences, including infections andinflammatory lung diseases such as hypersensitivity pneumonitis. Healthcare workers in particular areexposed to bioaerosols, and the consequences of such exposures can be serious for certain infectiousagents. Also, exposure to wood dust is an acknowledged risk for potentially serious respiratory diseases,including nasal cancer.
Mineral dusts and fibres Large numbers of workers are exposed, in a variety of workplace sectors, to respirable crystalline silica.While the dangers of these exposures have long been recognised, silica exposure still causes new casesof lung disease both in the UK and further afield. Exposure to asbestos fibres (notably the amphiboleforms crocidolite and amosite) constitutes a serious and long-recognised health issue. The legacy ofpast extensive use of asbestos in buildings as heat and sound insulation and as fire protection is stillcausing exposure issues for tradesmen such as demolition workers, plumbers, electricians andcarpenters, who may encounter asbestos-containing materials on a day-to-day basis.25 Elevatedexposure can cause asbestosis (pulmonary fibrosis), lung cancer and mesothelioma. Because of theserisks, there is a duty on building owners to identify and record the presence of asbestos materials andto take appropriate action to isolate or, if necessary, remove them.
Engineered hypoxic environments These constitute a relatively new workplace risk. Workers may be required to work in spaces where thepartial pressure of oxygen has been reduced, or engineered, in order to reduce ignition risk. This isimportant for certain electrical considerations, or where spaces contain materials that may beirretrievably lost by fire damage. These workplaces represent interesting health and workplacechallenges, particularly for those workers with established lung diseases.

who might otherwise suffer as a consequence of their occupation. However, a number of concernsremain, particularly for some workers who are engaged in occupations or in environments that are lessadequately or thoroughly controlled. It is also important to consider that some workplaces are publicplaces, and vice versa.
2.4 A word on the regulatory control of air pollution
Fig 4 illustrates that regulatory strategies in the control of air pollution can be made at local, national,regional and international levels. Although there is not necessarily a hierarchy between these levels, withthe notable exception of EU law having supremacy over UK law, the constraints imposed by law onpolicymakers must be considered in order to create rules that are both effective and binding.
Control policies can be implemented using a variety of instruments across different areas relevant tothe control of air pollution in particular situations and environments. These instruments range frombinding legislation to voluntary self-regulatory schemes. In developing air pollution control laws, it isnecessary for policymakers to make evidence-based decisions in order to determine who or what issought to be regulated, together with the desired outcomes, and thus choose the most effectiveregulatory tools.
2.5 Conclusions
Our exposure to air pollutants depends on age and occupation, and varies throughout the day accordingto the different micro-environments that we encounter. Fig 5 clearly shows how a person’s exposure to‘black carbon’ (representing airborne carbon particles) varies according to the individual and theiractivities; who they are, what they do, and where they are during the day. Some case studies about oureveryday exposure to air pollutants are presented in Box 10, illustrating the diverse range of pollutants towhich we are all exposed. In addition, in Box 11 we offer some tips on how to improve the air that webreathe indoors, based upon two UK government leaflets.26,27
It is clear that pollutants with potentially significant impacts on health are encountered outdoors, in thehome, in transport and public places, at work and at school – and even in utero. Pressures to conserveenergy to reduce the carbon footprint of buildings and hence reduce climate change (see Chapter 7) canhave potentially detrimental effects on ventilation provision within buildings, leading to potentialincreases in exposure to pollutants with indoor sources. This complexity mandates a holistic approach tothe control of exposure to substances in the breathed environment and the need to consider the fullrange of available regulatory tools.
2 The air we breathe
© Royal College of Physicians 2016 29

Every breath we take: the lifelong impact of air pollution
30 © Royal College of Physicians 2016
Box 10: Exposure to air pollution – a ‘day in the life’ of a schoolchild and an office worker
Schoolchild • Breakfast in kitchen with gas cooker – exposed to NO2, CO2 and other gas combustion products. • Travels to school in parent’s car – exposed to vehicle exhaust and VOCs from car air freshener. • Studies in crowded classroom – elevated exposure to CO2, plus some exposure to dusts and fibres. • Outdoor playtime – exposed to range of outdoor air pollutants. • Art lesson – exposed to VOCs from paints, resins and adhesives. • Returns home, watches television in the lounge – exposed to parent’s second-hand tobacco smoke. • Supper in dining room – exposed to lead in dust from old paintwork through recent redecoration. • Asleep overnight in downstairs bedroom – exposed to radon ingress from bedrock.
Office worker • Bathroom ablutions – exposed to VOCs from personal care products. • Breakfast in kitchen – exposed to PAHs from burned bacon and PM from burned toast! • Travels to work on the London underground – exposure to PM (metallic particles) in the tunnels. • Office duties – exposed to O3 from printers and photocopiers. • Returns home and rests in lounge with signs of damp – exposed to mould spores. • Supper in dining room – exposed to formaldehyde from ‘flat-pack’ furniture and PM from candles. • Decorates spare room – exposed to VOCs from gloss paint and asbestos through drilling the ceiling. • Bedtime – exposed overnight to CO from faulty gas boiler and to house-dust mite allergens in pillow.
Schoolpupil
Officeworker
Pensioner
Nurserytoddler
Homeworker
Cyclecourier
Ambulancedriver
0 500 1,000Cumulative black carbon exposure (µg/m3)
1,500 2,000 2,500 3,000 3,500 4,000 4,500
Morning travel (1 hour)Daytime activities (8 hours)Afternoon travel (1 hour)Evening activities (4 hours)Bedtime (11 hours)
Fig 5. How a person’s daily exposure to ‘black carbon’ (representing airborne carbon particles) variesaccording to the individual – what they do and where they are over 24 hours. Numerous factors willinfluence actual measured levels for any one individual, including, for example, where they live and work(eg near a busy road), how and for how long they travel, and whether they are exposed to indoor sources(eg open fires). Courtesy Benjamin Barratt, MRC PHE Centre for Environment and Health.

2.6 References
1 Committee on the Medical Effects of Air Pollutants. Long term exposure to air pollution: effect on mortality. London:Health Protection Agency, 2009. www.gov.uk/government/uploads/system/ uploads/attachment_data/file/304667/COMEAP_long_term_exposure_to_air_pollution.pdf [Accessed 2 December 2015].
2 World Health Organization. Review of evidence on health aspects of air pollution – REVIHAAP Project. Bonn: WorldHealth Organization, 2013. www.euro.who.int/__data/assets/pdf_file/0004/193108/REVIHAAP-Final-technical-report-final-version.pdf/ [Accessed 2 December 2015].
3 Newby DE, Mannucci PM, Tell GS et al. Expert position paper on air pollution and cardiovascular disease. Eur Heart J2015;36:83–93.
4 Committee on the Medical Effects of Air Pollutants. The mortality effects of long-term exposure to particulate air pollutionin the United Kingdom. London: Health Protection Agency, 2010. www.gov.uk/government/publications/ comeap-mortality-effects-of-long-term-exposure-to-particulate-air-pollution-in-the-uk [Accessed 30 November 2015].
5 Department for Environment Food and Rural Affairs. Valuing impacts on air quality: Updates in valuing changes inemissions of oxides of nitrogen (NOx) and concentrations of nitrogen dioxide (NO2). London: Defra, 2015.www.gov.uk/government/uploads/system/uploads/attachment_data/file/460401/air-quality-econanalysis-nitrogen-interim-guidance.pdf [Accessed 15 December 2015].
6 Committee on the Medical Effects of Air Pollutants. Nitrogen dioxide: interim view on long-term average concentrationsand mortality. London: Health Protection Agency, 2015. www.gov.uk/government/publications/nitrogen-dioxide-interim-view-on-long-term-average-concentrations-and-mortality [Accessed 17 December 2015].
7 Brunekreef B, Annesi-Maesano I, Ayres JG et al. Ten principles for clean air. Eur Respir J 2012;39:525–8.
8 Tam CW, Bevan RJ, Harrison PTC, Youngs LC, Crump D. Public health impacts of exposure to carbon monoxidefrom gas appliances in UK homes – are we missing something? Indoor Built Environ 2012;21:229–40.
9 Institute for Environment and Health. Indoor air quality in the home. Leicester: IEH, 1995.
10 Harrison PTC. Health effects of indoor air pollutants. In: Harrison RM, Hester RE (eds), Air pollution and health (Issues in environmental science and technology, vol 10). Cambridge: Royal Society of Chemistry, 1998:101–25.
2 The air we breathe
© Royal College of Physicians 2016 31
Box 11: How to reduce exposure to air pollutants in the home
Although some indoor pollutants are unavoidable, there are things that you can do to reduce exposuresand lessen possible adverse health effects:
• do not smoke at home • avoid using appliances without flues (eg freestanding gas and paraffin heaters) • properly maintain all boilers, stoves, fires and other appliances that burn fuel of any kind • ensure adequate fresh air ventilation at all times • use cooker extractor hoods and kitchen/bathroom extractor fans where supplied • treat condensation, and kill and remove mould. Avoid condensation by keeping boiling pans coveredand not drying your wet washing inside the home. Properly insulate your home and do not blockexisting permanent ventilation provision (air blocks, trickle vents etc)
• heat the home sufficiently to prevent damp, while maintaining adequate ventilation – try to achievethe necessary balance between energy efficiency and pollution control
• consider reducing the use of products and materials that release high levels of VOCs.
In addition, depending on the pollutant in question, you may need to seek professional help – forexample, to prevent entry of radon from the ground or to remove, or seal, asbestos-containingmaterials.

Every breath we take: the lifelong impact of air pollution
11 European Commission. INDEX: Critical appraisal of the setting and implementation of indoor exposure limits in the EU.Ispra, Italy: EC, 2004. http://ec.europa.eu/health/ph_projects/2002/pollution/fp_pollution_2002_exs_02.pdf [Accessed4 December 2015].
12 European Commission. SINPHONIE: schools indoor pollution and health observatory network in Europe, final report. EC,2014. http://ec.europa.eu/health/healthy_environments/docs/2015_sinphonie_frep_en.pdf [Accessed 4 December 2015].
13 Institute for Environment and Health. Fibrous materials in the environment. Leicester: IEH, 1997.
14 Committee on Carcinogenicity of Chemicals in Food, Consumer Products and the Environment. Statement on therelative vulnerability of children to asbestos compared to adults. London: Public Health England, 2013.www.gov.uk/government/publications/relative-vulnerability-of-children-to-asbestos-compared-to-adults/ [Accessed 4December 2015].
15 Centers for Disease Control and Prevention. Health effects of secondhand smoke. Atlanta, GA: CDC, 2014.www.cdc.gov/tobacco/data_statistics/fact_sheets/secondhand_smoke/health_effects/ [Accessed 4 December 2015].
16 De Brouwere KD, Cornelis C, Arvanitis A et al. Application of the maximum cumulative ratio (MCR) as a screeningtool for the evaluation of mixtures in residential indoor air. Sci Total Environ 2014;479–80:267–76.
17 European Commission. State of the art report on mixture toxicity. London: EC, 2009. http://ec.europa.eu/environment/chemicals/effects/pdf/report_mixture_toxicity.pdf [Accessed 4 December 2015].
18 Harrison PTC. Editorial: Indoor air quality guidelines. Occup Environ Med 2002;59:73–4.
19 World Health Organization. WHO guidelines for indoor air quality: selected pollutants. Copenhagen: WHO, 2010.www.euro.who.int/__data/assets/pdf_file/0009/128169/e94535.pdf [Accessed 4 December 2015].
20 World Health Organization. WHO guidelines for indoor air quality: household fuel combustion. Geneva: WHO, 2014.http://apps.who.int/iris/bitstream/10665/141496/1/9789241548885_eng.pdf [Accessed 4 December 2015].
21 Gordon SB, Bruce NG, Grigg J et al. Respiratory risks from household air pollution in low and middle incomecountries. Lancet Respir Med 2014;2:823–60.
22 World Health Organization. Burden of disease from household air pollution for 2012. Geneva: WHO, 2014.www.who.int/phe/health_topics/outdoorair/databases/FINAL_HAP_AAP_BoD_24March2014.pdf [Accessed 4December 2015].
23 Brown VM, Crump DR, Harrison PTC. Assessing and controlling risks from the emission of organic chemicals fromconstruction products into indoor environments. Environ Sci Process Impacts 2013;15:2164–77.
24 EnVIE. Co-ordination action on indoor air quality and health effects. Porto, Portugal: EnVIE, 2009.http://paginas.fe.up.pt/envie/documents/finalreports/Final%20Reports%20Publishable/Publishable%20final%20activity%20report.pdf [Accessed 4 December 2015].
25 Harrison PTC, Llewellyn JW. Exposure to asbestos and man-made mineral fibres in buildings and the consequencesfor health. In: Moschandreas DJ (ed), Design, construction, and operation of healthy buildings: solutions to global andregional concerns. Atlanta, GA: ASHRAE, 1998:83–93.
26 UK Government. Keep your home free from damp and mould. London: Crown copyright, 1992.
27 UK Government. Good air quality in your home. London: Crown copyright, 1993.
32 © Royal College of Physicians 2016

Chapter 3: Summary
Pregnancy, infancy and early childhood are critical times when all the body’s systems are formed, andstart maturing. This process happens at a lightning pace. It is controlled by genes, which must switch onand off at just the right time, in just the right order.
Therefore, it is clearly a vulnerable phase of life. The developing heart, lung, brain, hormone systems andimmunity can all be harmed by pollution. Environmental effects on the embryo, fetus, baby and toddlermay last a lifetime, but may take years or even decades to become apparent.
Smoking in pregnancy is probably the most serious source of harm, causing slow fetal growth,prematurity and stillbirth.
There is also clear evidence that early exposure to air pollution can damage the lungs, and increase therisk of lung infections that may be fatal. It is known to have an effect on heart health in adult life.Research is beginning to point towards effects on growth, intelligence, asthma, and development of thebrain and coordination.
34 © Royal College of Physicians 2016

Key facts
• Before birth, the health of the baby is tied closely to the health of the mother.
° Smoking in pregnancy is linked to slow fetal growth, premature birth and stillbirth. It can alsocause the placenta to break away (abruption), which is very dangerous to both mother and baby.The mother’s risk of high blood pressure is increased.
° Some pollutants, when breathed by the mother, can cross through the placenta to the developingbaby. Particulates and heavy metals are two examples.
° Air pollution can affect growth of the unborn baby and may be linked to premature birth. • Development in the womb is rapid.
° By 3–4 weeks of pregnancy, the heart is beating.
° The major organs are formed by 12 weeks, and the endocrine (hormone) system is functioning.
° At 16 weeks, the main tube system of the lungs (the bronchial tree) is formed.
° By 6 months, most of the brain, spinal cord and nerves are in place.
° Around 7 months, the lungs’ air sacs (alveoli) begin to form. Half of them are completed by theend of a full-term pregnancy.
° These are all critical points where air pollution or exposure to smoking could cause harm.
© Royal College of Physicians 2016 35
3 Summary

Chapter 3: In the beginning: protecting our futuregenerations
3.1 Early human development
To understand why fetuses, babies and children are more susceptible to external insults, including theeffects of air pollution, it is useful to understand, at least in outline, aspects of early human developmentand growth.
3.1.1 Development and growth: a short background to early development
Development implies more than just growth; it includes changes in the nature and structure of tissues. Inbiological terms, it requires differentiation of cells into specialised types with varying functions, eg heartcells, which contract rhythmically, or cells in the gut, which secrete liquid and absorb nutrients.
Growth is increase in size; in the body, this means an increase in the number of cells in a particulartissue, rather than the cells themselves enlarging.
The amazing transformation of the fertilised human egg – a single cell – into a complex organism in avery short time requires the integrated and precisely controlled coordination of differentiation andgrowth of cells. These processes are controlled by the switching on and off of genes in a specific sequencein a timely manner. It is believed that over half the genes in the human genome are used only for earlydevelopment.
The majority of organs are formed by about 10 weeks after fertilisation (12 weeks of pregnancy).
The heart
The heart is one of the first tissues in the body to develop into a functional organ; it starts to beat and topump blood from around 3–4 weeks’ gestation.
The lungs
The lungs will be the first point of contact for air pollution throughout life and, therefore, areparticularly vulnerable to its adverse effects. The bronchial tree (air passages in the lungs) iscompletely formed by 16 weeks of pregnancy (Fig 6). The air sacs (alveoli) start developing at 28weeks and about half the final adult number of alveoli are present at birth (40 weeks). Most of theremainder develop by about 2 years of age, but it is likely that they continue to develop throughadolescence until body growth ceases. The peak of lung function is not achieved until the early tomid-twenties, making the lung vulnerable for many years, but perhaps maintaining an ability torecover some lost function.
The brain and central nervous system
The primitive brain and spinal cord are present from very early pregnancy, but development of thenervous system is an ongoing process that continues throughout fetal life and after birth to adolescence.Most of the nerve cells have developed by the middle of pregnancy and afterwards they go on to develop
36 © Royal College of Physicians 2016

their specialised functions in the nervous system. Therefore, they remain vulnerable to injury throughoutchildhood.
Glands and hormones
The fetus is able to produce hormones from early gestation. These are important for maintenance ofpregnancy, and the fetus responds to stress by producing stress hormones. This can result in long-termresetting of hormone systems so that they do not function normally after birth. Because hormonesproduced by the endocrine system are vital for many functions of the body, including growth anddevelopment, such resetting can have adverse consequences for future health.
Immunity, infections and allergies
Babies’ immune systems are not fully developed at birth and they are vulnerable to infections. Although thefetus is capable of producing antibodies and can develop allergic responses, most of the antibodies presentat birth come from the mother, so the baby benefits from the mother’s own immunity to infections. Afterbirth, the immune system matures through exposure to infections and micro-organisms in the gut.
In view of the very intricate and rapid changes in this early period of development, the fetus is veryvulnerable to external insults, be they chemical, physical or types of radiation. Small changes ordisturbances in the process can have permanent, lifelong consequences (Fig 7). A good example of thiscan be demonstrated by German measles (rubella) infection of a pregnant mother. The effect on the
Fig 6. Principal stages of lung development in humans. Adapted with permission from: Kajekar R.Environmental factors and developmental outcomes in the lung. Pharmacol Ther 2007;114:129–45.
Lung bud differentiationTrachea and bronchiPulmonary vein and artery
4–7 weeks
In uteroBirth
Postnatal7–17 weeks 17–26 weeks 27–36 weeks 36 weeks – 2 years ~18 years
Conducting airwaysTerminal bronchioles
Immature neural networks
Pre-acinar blood vessels
Primitive alveoliType II, type II
cells Surfactant
synthesis
Alveoli sacculesExtracellular matrix
Neural network maturation Expansion of gas exchange
area, nerves and capillaries
Continued cellular proliferationLung growth and expansion
Terminal bronchiole
Acinus
Respiratorybronchiole
Embryonic
Pseudoglandular
Canalicular
Saccular
Alveolar
3 In the beginning: protecting our future generations
© Royal College of Physicians 2016 37

Every breath we take: the lifelong impact of air pollution
developing fetus is crucially dependent on the timing in pregnancy of the infection and on which organsare developing most rapidly at that time. Infection in very early pregnancy affects the heart, but only afew days later produces permanent damage in the brain, eyes and ears. In contrast, infection near the endof pregnancy has few damaging effects. When children and adults contract German measles, it isconsidered to be a trivial disease, demonstrating that the sensitivity to and consequences of rubellainfection are highly dependent on the stage of development.
3.2 Why are infants and young children vulnerable to the effects of air pollution?
Pregnancy and early childhood are critical times for the formation and maturation of all the importantbody systems; there is no other time in life during which such rapid changes take place. This means thatfactors that exert an adverse influence on human development, including air pollution, can have a fargreater influence during this period than at other times; the rapidity of change magnifies their effects,and important organ systems, once their physical development is harmed, may not have the capacity torecover. This means that organ damage that occurs as a result of harm in early life, including beforebirth, will be present for the rest of that individual’s life. This does not always mean that such changes
38 © Royal College of Physicians 2016
1
Age of embryo (in weeks)
Loss of conceptus
Timing of air pollution risks:
Interrupted placental development
Fetal growth restriction
Note: Grey bars indicate time periods when major morphological abnormalities can occur, while light-blue bars correspond to periods at risk from minor abnormalities and functional defects.
Reduced weight gain
Preterm birthEarly susceptibility to later preterm birth
Heart defects
Major morphological abnormalities Functional defects and minor morphological abnormalities
Dividing zygote, implantation and gastrulation
CNS
Heart
Heart
Limbs Teeth
Eye Eye Ear Ear BrainHeart
Heart
Upper limbs
Lower limbs
Teeth
CNS
Eyes
Ear
Palate
Palate
External genitalia
External genitalia
Fetal period (in weeks)
Fullterm
2 3 4 5 6 7 8 9 16 20–36 38
Fig 7. Critical periods of risk from air pollution during fetal development. CNS = central nervous system. Figurereprinted with permission. Ritz B, Willhelm M. Air pollution impacts on infants and children. UCLA Institute ofthe Environment: Southern California Environmental Report Card – Fall 2008, Los Angeles, CA: 2008.

will show themselves during the early years of life. There is often a threshold of organ function belowwhich symptoms occur and it may not be until the influences of natural physical decline in adulthoodand older age are added to early injury that disease will become obvious.
There are three major periods of vulnerability to the adverse effects of air pollution during this criticalperiod of early childhood development.
Pregnant women are susceptible to the effects of air pollution. The health of the developing fetus isintricately dependent on the health and wellbeing of its mother and on the function of the placenta.Illnesses or exposure of the mother to harmful substances, such as tobacco smoke, can result in slowingof fetal growth. This can affect the growth of different organs and, if growth is hampered at a criticaltime of development, can lead to permanent damage. This is an example of indirect harm due to airpollution. However, direct harm to the fetus may also occur owing to transfer of toxic substances fromthe mother’s blood across the placenta. Although the placenta has a barrier function to filter outsubstances harmful to the fetus, several pollutants, such as heavy metals and fine particles (PM2.5 andsmaller), are able to cross the placental barrier1 and have the potential to cause injury to the fetus and itsdeveloping organs.
The developing fetus is susceptible to the effects of air pollution. From the earliest stages ofdevelopment, the building block of life, DNA, is susceptible to changes arising from exposure to airpollution. This can be in the form of physical changes to the DNA structure or influences on howgenes function. Even modifications of mothers’ DNA before conception could influence fetaldevelopment. The fetus is also undergoing a remarkable and coordinated process of organdevelopment, which follows a time-dependent course. As discussed above, even seemingly trivialinterference during critical periods can irrevocably harm organs and tissues (the fetal brain andnervous system are exquisitely sensitive to these effects) or change their developmental trajectory sothat their function is permanently impaired.
Infants are susceptible to the effects of air pollution. Even after birth, there is considerable developmentand maturation of organs that makes them vulnerable to harmful effects of pollution. Infants arerelatively immobile and dependent on their parents to protect them or move them from sources ofpollution, yet their main mode of outdoor transport seems designed to put them at precisely the levelof motor vehicle exhaust emissions (Fig 8). Infants have a relatively high metabolic rate, so theybreathe a greater volume of air per minute than an adult relative to their size. This is a doublejeopardy: they get exposed to relatively higher doses of toxic pollutants, as well as being morevulnerable to their harmful effects.
3.3 How does air pollution affect human development?
3.3.1 What does air pollution do to pregnancy outcomes?
The placenta contains a myriad of blood vessels from both the fetal and the maternal circulations,which grow very rapidly in early pregnancy. There are several possible mechanisms through which airpollution can harm placental and hence fetal development, although it is unclear which of these isthe most important. It is known that air pollution harms blood vessels in later life, giving rise toheart attacks and strokes. It would not be unreasonable, then, to expect some effect of air pollutionon the placental blood vessels, but whether the time course of 9 months is sufficient for any effects to
3 In the beginning: protecting our future generations
© Royal College of Physicians 2016 39
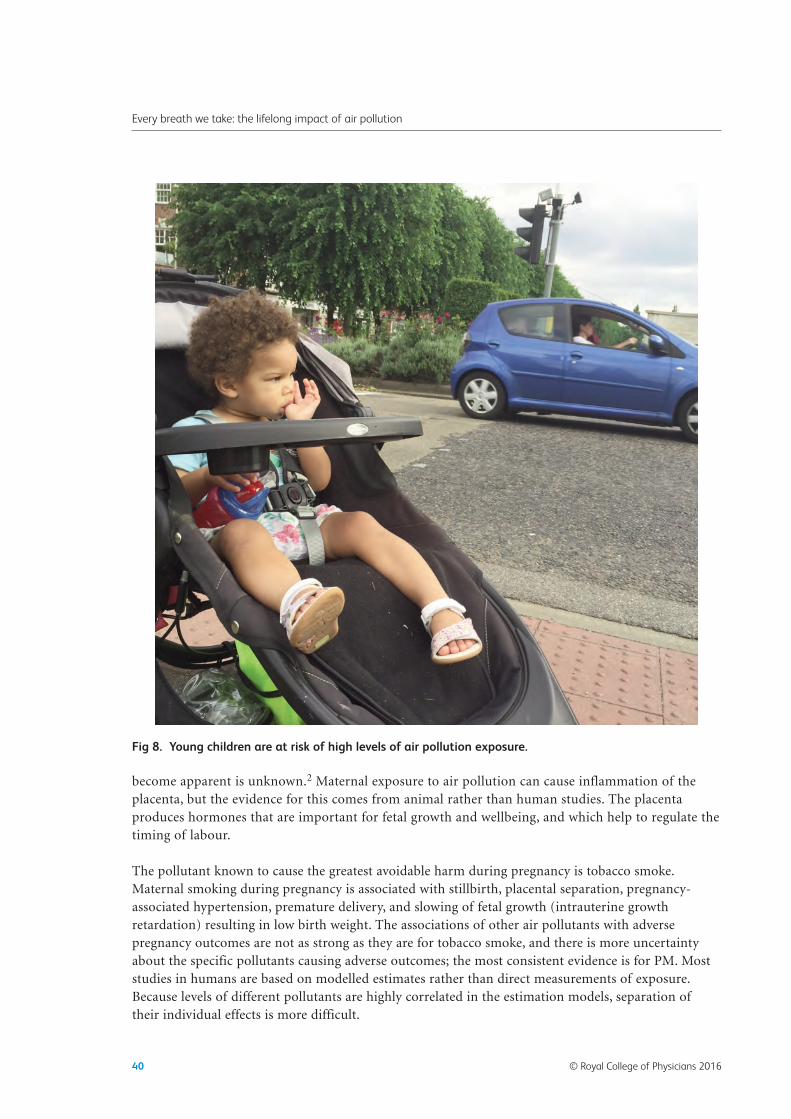
Every breath we take: the lifelong impact of air pollution
become apparent is unknown.2 Maternal exposure to air pollution can cause inflammation of theplacenta, but the evidence for this comes from animal rather than human studies. The placentaproduces hormones that are important for fetal growth and wellbeing, and which help to regulate thetiming of labour.
The pollutant known to cause the greatest avoidable harm during pregnancy is tobacco smoke.Maternal smoking during pregnancy is associated with stillbirth, placental separation, pregnancy-associated hypertension, premature delivery, and slowing of fetal growth (intrauterine growthretardation) resulting in low birth weight. The associations of other air pollutants with adversepregnancy outcomes are not as strong as they are for tobacco smoke, and there is more uncertaintyabout the specific pollutants causing adverse outcomes; the most consistent evidence is for PM. Moststudies in humans are based on modelled estimates rather than direct measurements of exposure.Because levels of different pollutants are highly correlated in the estimation models, separation oftheir individual effects is more difficult.
40 © Royal College of Physicians 2016
Fig 8. Young children are at risk of high levels of air pollution exposure.

Air pollution exposure is associated with premature birth.3 Depending on the maturity of the fetus atbirth, effects can range from minor inconvenience to severe disability and early death. Modernneonatology has improved the outcomes for premature babies enormously over the past 50 years, andbabies born after 28 weeks’ gestation have generally favourable outcomes. More premature infants,between 24 and 28 weeks’ gestation, are at higher risk and their outcomes are closely dependent on theirgestational age; owing to their rapid development, even a few days makes a difference to their maturity. Asmall shift in gestation at birth can have a huge effect on their survival and subsequent complications,particularly of the brain and respiratory system. Epidemiological studies suggest a link between airpollution exposure and premature birth, with the strongest evidence for gaseous pollutants (O3 and SO2)and weaker evidence for particulates (PM2.5 and PM10).
The strongest evidence from epidemiological studies of pregnancy outcomes is that air pollutionaffects fetal growth and birth weight.4 It is estimated that traffic-related air pollution exposure ofpregnant women accounts for more than one-fifth of all cases of low birth weight at term. There isconsistent evidence that exposure to particulates during pregnancy increases the risk of low birthweight.5 The timing of exposure is critical, with the greatest harm during early pregnancy, and thereis some evidence that girls and boys have different susceptibility to these adverse effects. There is alsoevidence that naturally occurring variations in some genes that reduce the activity of enzymesinvolved in detoxifying air pollutants increase the risk of harm associated with air pollutionexposure during pregnancy, thus providing supporting evidence that this is a true biological effect.The evidence is less consistent for gaseous pollutants, but O3, NO2 and possibly CO have been linked with low birth weight (REVIHAAP Project: Technical Report; question B1),6 as has thecombustion of indoor solid fuels.7 It is important to note that high exposure to specific airpollutants is socially patterned and linked with other lifestyle factors, including smoking and diet.The effects described appear to be independent of these confounding influences, but there is somesuggestion that socio-economic deprivation increases the adverse effects of air pollution on low birthweight.
Although the average size of the effects on birth weight is modest (such effects are generally of the orderof 100–200 g), the shift of the exposed population to the lighter end of the spectrum of birth weightsmeans that babies in the lower tail of the population distribution are at increased risk of seriousproblems at birth and thereafter. Similarly, a shift in the average gestational age at delivery by only asmall amount can have a substantial influence on the numbers of babies born very preterm (<28 weeks’gestation), with consequent implications for their health outcomes and also the need for sufficientneonatal intensive care facilities.
3.3.2 What does air pollution do to young children?
Air pollution exposure during pregnancy The effects of air pollution on fetal outcomes, principally premature birth and fetal growthretardation/low birth weight,8 are themselves associated with impact on the developing organ systems.Interference with normal placenta development, evidenced by variations of the size and structure of theplacenta at birth, has been associated with several chronic diseases, including heart disease, obesity andtype 2 diabetes. Low birth weight for gestation is associated with low lung function, COPD,cardiovascular disease and early death in adulthood.9 Poor fetal growth is linked to abnormaldevelopment of the kidneys, and to hypertension and kidney disease in later life.10 Low birth weight forgestation is associated with rapid postnatal growth, which is linked in turn to the development of
3 In the beginning: protecting our future generations
© Royal College of Physicians 2016 41

Every breath we take: the lifelong impact of air pollution
obesity, asthma and low lung function. Additional to these consequences of poor fetal growth, there maybe direct toxic effects of air pollution on specific organ development.
The best evidence for prenatal pollution exposure affecting subsequent development is for the brain andnervous system. Heavy metals, particularly lead (Pb) and mercury (Hg), which can cross the placentaand accumulate in the fetus, have been associated with neurodevelopmental harm, leading to reducedcognitive function, lower IQ, attention deficit hyperactivity disorder (ADHD), and possibly autismspectrum disorder during childhood.11 It is suggested that similar effects could be associated withexposure to ultra-fine particles, which freely enter the bloodstream. Exposure to airborne PAHs inpregnancy has also been linked to adverse developmental abnormalities in children, including low IQ.12
These compounds bind to DNA and have been associated with epigenetic remodelling (see section 3.4.1on epigenetic effects) and DNA mutations, indicating the potential for increased cancer risk, althoughthe evidence for this is currently limited.13
Intrauterine lung development is almost certainly hampered by tobacco smoke, either active smoking onthe part of the mother or second-hand exposure of the mother to others’ smoking. Low birth weight forgestation is associated with low lung function in childhood and later life, and babies of normal weightwho were exposed to maternal smoking in pregnancy have low airway function shortly after birth.14 Theevidence that exposure to airborne substances other than tobacco smoke alters lung development in thesame way is not so well developed, but there is evidence that PM10 exposure alters lung function in thepostnatal period,15 and that prenatal PM2.5 exposure is associated with low forced expiratory volume in1 second (FEV1) and forced vital capacity (FVC) in preschool children.
16
There is compelling evidence in children and adults that air pollution exposure is associated with new-onset asthma, but it is more difficult to be certain about the effects of exposure during pregnancy. This ispartly due to the problem of trying to separate highly correlated exposures in the prenatal and earlypostnatal periods in observational studies of long-term outcomes. There is certainly evidence thattobacco smoke exposure, as well as affecting lung function, can influence the development of asthma andpossibly other allergic diseases in children. This could be mediated through effects on the developingimmune system. Maternal exposure to PM10 and NO2 has been linked to altered proportions of immunecells in cord blood, and PAH and PM2.5 exposure is associated with high cord blood immunoglobulin E(IgE) levels, but only in children of mothers without any reported allergies. Although IgE is raised inallergic diseases, high IgE by itself is not proof of allergic sensitisation in infants. However, currentevidence is insufficient to determine whether similar effects can be attributed to air pollution exposureduring pregnancy and developmental changes predisposing to asthma in children, although prenataltobacco smoke exposure may increase vulnerability to postnatal exposure to air pollution.17
For other organ systems with long latencies of disease manifestation, such as the cardiovascular andmetabolic systems, epidemiological studies are not well suited to separating organ-specific effects ofprenatal exposures from cumulative exposure to pollutants through the remainder of the lifecourse. Thestrongest evidence comes from links between low birth weight and disease outcomes in adulthood.
Air pollution exposure after birthInfants living in areas with high levels of particulate air pollution are at increased risk of death duringthe first year of life, particularly from respiratory illnesses. There is also evidence that air pollution, liketobacco smoke, may exacerbate the effects of respiratory infections in young children.18 There is lesscertain evidence of a link between pollution exposure in the postneonatal period and SIDS.19
42 © Royal College of Physicians 2016
There is little doubt that acute exposure to high levels of air pollution results in increased respiratorysymptoms in children, including parent- and self-reported cough and wheeze, and increased visits toemergency departments with respiratory illnesses. Whether air pollution causes asthma in previouslyhealthy children is a more contentious issue.20,21
Epidemiological studies have suggested associations of air pollution with asthma onset, but results havebeen inconsistent and no specific pollutant has been identified. There are also difficulties in separatingthe effects of pollution on respiratory symptoms (wheeze) from true asthma, particularly in youngchildren. Additionally, these studies are prone to confounding from a large number of social and lifestylefactors, including housing, diet, obesity, exercise and exposure to indoor and outdoor allergens, which allchanged rapidly in society as asthma prevalence increased towards the end of the 20th century. There isbiological evidence that diesel exhaust particles (DEPs) can enhance responses to inhaled allergens; thisis supported by an epidemiological link between estimated traffic-related air pollution exposure andallergic diseases, although the evidence is still relatively weak.22 Exposure to VOCs, particularlyformaldehyde in indoor air, has been suggested as a possible cause of asthma onset, but the currentevidence remains inconsistent. Exposure of young children to second-hand tobacco smoke remains oneof the most important sources of indoor air pollution and is associated with asthma prevalence,although the effects of exposure to maternal smoking in pregnancy are probably stronger than forchildhood exposure. There seems little doubt that air pollution adversely affects the normal growth oflung function during childhood,23,24 right up to the late teens (see next chapter). Interestingly, thisreduction in lung function is reversible to some extent, but it is not yet known how long the potential forrecovery persists into later life.
Because the central nervous system is still developing rapidly after birth, children remain susceptible toharmful effects of air pollution on their neurodevelopment and long-term cognitive health.25 Severaltypes of air pollution have been associated with harmful effects on neurocognitive development. As withprenatal effects, exposure of young children to heavy metals, even at very low levels, impairs cognitivedevelopment and lowers IQ. There is evidence that high levels of NO2 impair all domains ofneurodevelopment, including sensory, motor and psychomotor function. Children exposed to highindoor NO2 levels from cooking and heating sources have been shown to have poorer cognitive functionand seem to be at increased risk of ADHD.
There is compelling evidence that air pollution is a major risk factor for cardiovascular diseases (seenext chapter) and a link has been suggested between air pollution and the development of obesity inchildren. In addition, there are concerns that air pollution can cause changes in human DNA that arebiological markers of increased cancer risk. However, there is currently limited evidence of anincreased risk of childhood cancers or of longer-term effects on adult cancers associated with highlevels of exposure to air pollutants in childhood, with the possible exception of second-hand tobaccosmoke.
3.4 How do early developmental changes manifest themselves throughout life?
Although tobacco smoke and air pollution are not equivalent exposures, the mechanism by whichtobacco smoke exposure in early life influences future health is used in Box 12 as an illustration to showhow exposure at different periods through life can affect lung growth and development. Althoughtobacco smoke is used here as an example because there is a great deal of research evidence about itsharmful effects, air pollution exposure can have similar consequences for the lungs.
3 In the beginning: protecting our future generations
© Royal College of Physicians 2016 43

Every breath we take: the lifelong impact of air pollution
Box 12: The lifecourse influences of air pollution (eg tobacco smoke) exposure on lungfunction and disease
A pregnant woman can be exposed to many types of potentially harmful environmental poisonsincluding alcohol, heavy metals, drugs and air pollution (including tobacco smoke). Some of these canbe avoided by lifestyle choices, but for others, such as air pollution, this may not be possible. We usetobacco smoke exposure as an example because it is a common exposure and one for which the bestevidence exists. However, the same pathways may operate for unavoidable risks, such as outdoor airpollution. A baby born of a mother who smokes during her pregnancy is likely to be born early and tohave low birth weight, both of which are associated with low lung function at birth. Frequent respiratoryillnesses in the newborn period may further hamper lung development. Continued tobacco smokeexposure during early childhood leads to increased respiratory illnesses and slows lung growth,exacerbating the prenatal effects.
Smoking is socially patterned. Therefore, children of smoking mothers are more likely to live in deprivedurban areas and to be exposed to other harmful influences, including air pollution, which also slows lungfunction growth. Lung function established in early life ‘tracks’ to low peak lung function in adulthood.Even without further harm, the natural decline in lung function that occurs during adult life leads toearlier onset of diseases associated with low lung function, eg COPD. However, children of smokingparents are themselves more likely to smoke, and lack of social mobility leads to a greater risk ofcontinued exposure to harmful air pollutants. These accelerate lung function decline, resulting in earlieronset of respiratory diseases and early death.
Even relatively small disturbances to normal development of organs can have marked changes on thenumber of individuals in a population that develop diseases as a consequence. In the example of lungfunction given above, a small change in lung function in an individual may not cause that person to havesymptoms of lung disease. However, as shown in Fig 9, lung function values follow a normal distributionaround the average. If a toxic exposure such as air pollution shifts the population average downwards,then a greater number of individuals in the lower tail of the population will have low enough lungfunction to cause disease.
44 © Royal College of Physicians 2016
Maternal smokingMother exposed to second-hand smoke
Intrauterine growth restrictionLow birth weight
Neonatal lungdisease
+ Tracking of lung function
Possibility of some ‘recovery’?
Low lung function
Pre-eclampsiaPremature delivery
Impaired airwaydevelopment
Further insult
Environmental tobacco smoke
Pregnancy Early childhood Adolescence Adulthood
Active smoking
Early deathCOPDCardiovascular disease
+
–

3.4.1 Epigenetic effects
Another possible mechanism for the long-term effects of early-life exposure to air pollution on health is bychanges in DNA, called epigenetic modification.26 There are several ways in which DNA can be changedwithout altering its underlying genetic code; the most studied of these is DNA methylation, in which methyl(-CH3) chemical groups are bound to cytosine residues that comprise one of the four building blocks ofDNA, usually resulting in gene silencing (see Fig 10). Both acute and chronic exposures to indoor andoutdoor air pollutants, such as indoor solid fuel use, particulates, Pb, arsenic (As), nickel (Ni) and PAHs,have been shown to be associated with changes in DNA methylation.27,28 This can alter how genes work andis thought to be a way for humans to adapt to their environment without having to wait for evolutionarychanges over many generations.29 Fig 10 shows an example of how epigenetic modification of DNA byintrauterine exposures could affect lung function at birth.
Fetal life is a particularly sensitive period when maternal environmental exposures can result in epigeneticchanges that can persist into adult life. For example, DNA methylation patterns associated with intrauterinetobacco smoke exposure have been shown to persist into adulthood and to occur in genes that couldinfluence the biological response to personal smoking in later life. Studies currently underway will establishwhether comparable intrauterine air pollution exposure has similar long-term epigenetic effects.
One fascinating aspect of epigenetic changes is their potential to be inherited from parent to child and tosubsequent generations. This has been observed in animals and, although the evidence in humans is lessclear, several studies have now reported that grandmaternal smoking while pregnant, irrespective ofwhether the mother herself smokes, is associated with increased risk of asthma in grandchildren. Thesefindings indicate how early-life air pollution exposure could have consequences for future generations,even if current exposure is reduced.
Num
ber o
f cas
es
Dis
ease
thre
shol
d
Air pollution reduces average value
Additional cases
Lower Lung function Higher
Fig 9. A small change in the average value of lung function leads to a far greater number of peoplefalling below the disease threshold (shaded).
3 In the beginning: protecting our future generations
© Royal College of Physicians 2016 45
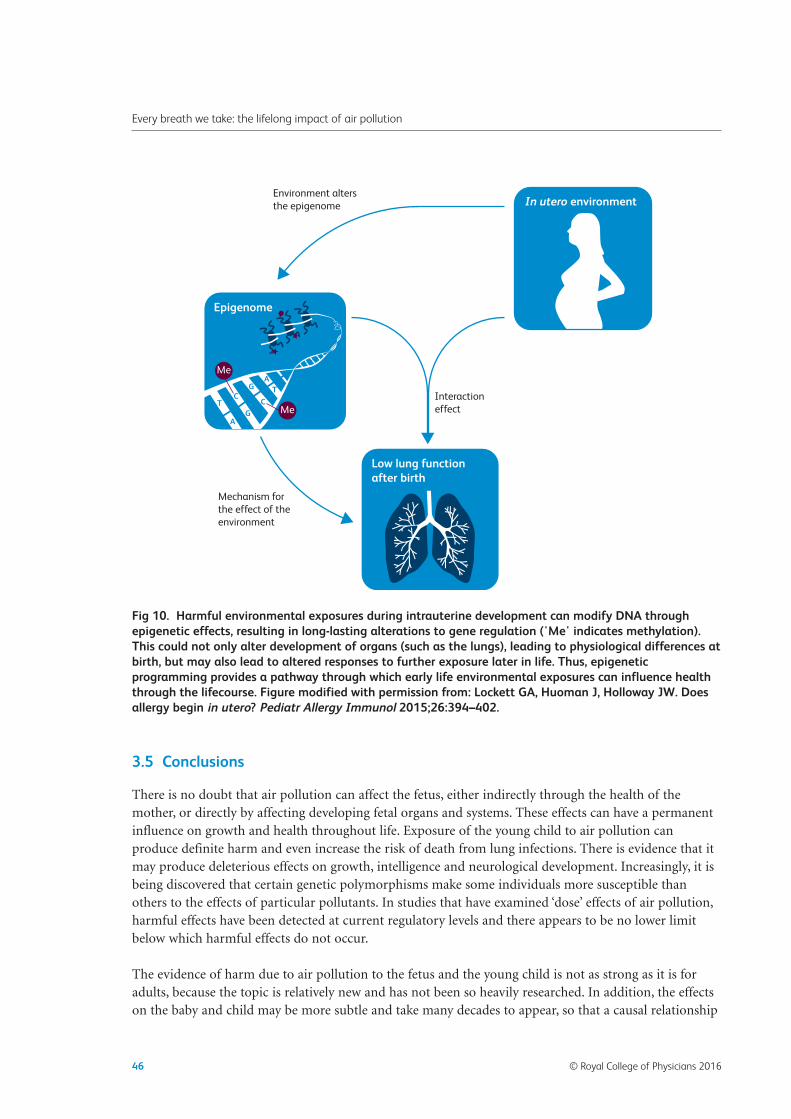
Every breath we take: the lifelong impact of air pollution
3.5 Conclusions
There is no doubt that air pollution can affect the fetus, either indirectly through the health of themother, or directly by affecting developing fetal organs and systems. These effects can have a permanentinfluence on growth and health throughout life. Exposure of the young child to air pollution canproduce definite harm and even increase the risk of death from lung infections. There is evidence that itmay produce deleterious effects on growth, intelligence and neurological development. Increasingly, it isbeing discovered that certain genetic polymorphisms make some individuals more susceptible thanothers to the effects of particular pollutants. In studies that have examined ‘dose’ effects of air pollution,harmful effects have been detected at current regulatory levels and there appears to be no lower limitbelow which harmful effects do not occur.
The evidence of harm due to air pollution to the fetus and the young child is not as strong as it is foradults, because the topic is relatively new and has not been so heavily researched. In addition, the effectson the baby and child may be more subtle and take many decades to appear, so that a causal relationship
46 © Royal College of Physicians 2016
Environment altersthe epigenome
Interaction effect
Mechanism for the effect of the environment
Epigenome
In utero environment
Low lung function after birth
T
TC
C
A
A
G
G
Me
Me
Fig 10. Harmful environmental exposures during intrauterine development can modify DNA throughepigenetic effects, resulting in long-lasting alterations to gene regulation ('Me' indicates methylation).This could not only alter development of organs (such as the lungs), leading to physiological differences atbirth, but may also lead to altered responses to further exposure later in life. Thus, epigeneticprogramming provides a pathway through which early life environmental exposures can influence healththrough the lifecourse. Figure modified with permission from: Lockett GA, Huoman J, Holloway JW. Doesallergy begin in utero? Pediatr Allergy Immunol 2015;26:394–402.

is not observed unless it is specifically looked for over a long period of time. It is likely that maternal airpollution exposure interacts with other stressors in pregnancy such as poor diet, tobacco smoking andexposure to certain drugs. Moreover, the evidence for the effects of air pollution on cardiovasculardisease and death in later life is very strong, so it is logical to conclude that reducing exposure to airpollution from as early an age as possible will be beneficial in order to reduce morbidity and early death.
3.6 References
1 Wick P, Malek A, Manser P et al. Barrier capacity of human placenta for nanosized materials. Environ Health Perspect2010;118:432–6.
2 van den Hooven EH, Pierik FH, de Kluizenaar Y et al. Air pollution exposure and markers of placental growth andfunction: the generation R study. Environ Health Perspect 2012;120:1753–9.
3 Ha S, Hu H, Roussos-Ross D et al. The effects of air pollution on adverse birth outcomes. Environ Res 2014;134:198–204.
4 Shah PS, Balkhair T, Knowledge Synthesis Group on Determinants of Preterm/LBW births. Air pollution and birthoutcomes: a systematic review. Environ Int 2011;37:498–516.
5 Glinianaia SV, Rankin J, Bell R et al. Particulate air pollution and fetal health: a systematic review of the epidemiologicevidence. Epidemiology 2004;15:36–45.
6 World Health Organization. Review of evidence on health aspects of air pollution – REVIHAAP Project. Bonn: WHO,2013. www.euro.who.int/__data/assets/pdf_file/0004/193108/REVIHAAP-Final-technical-report-final-version.pdf/[Accessed 2 December 2015].
7 Amegah AK, Quansah R, Jaakkola JJK. Household air pollution from solid fuel use and risk of adverse pregnancyoutcomes: a systematic review and meta-analysis of the empirical evidence. PLoS One 2014;9:e113920.
8 Pedersen M, Giorgis-Allemand L, Bernard C et al. Ambient air pollution and low birthweight: a European cohortstudy (ESCAPE). Lancet Respir Med 2013;1:695–704.
9 Risnes KR, Vatten LJ, Baker JL et al. Birthweight and mortality in adulthood: a systematic review and meta-analysis.Int J Epidemiol 2011;40:647–61.
10 Luyckx VA, Bertram JF, Brenner BM et al. Effect of fetal and child health on kidney development and long-term riskof hypertension and kidney disease. Lancet 2013;382:273–83.
11 Canfield RL, Henderson CR Jr, Cory-Slechta DA et al. Intellectual impairment in children with blood leadconcentrations below 10 microg per deciliter. New Engl J Med 2003;348:1517–26.
12 Perera F, Weiland K, Neidell M, Wang S. Prenatal exposure to airborne polycyclic aromatic hydrocarbons and IQ:estimated benefit of pollution reduction. J Public Health Policy 2014;35:327–36.
13 Perera F, Hemminki K, Jedrychowski W et al. In utero DNA damage from environmental pollution is associated withsomatic gene mutation in newborns. Cancer Epidemiol Biomarkers Prev 2002;11:1134–7.
14 Stick SM, Burton PR, Gurrin L, Sly PD, LeSouëf PN. Effects of maternal smoking during pregnancy and a familyhistory of asthma on respiratory function in newborn infants. Lancet 1996;348:1060–4.
15 Latzin P, Röösli M, Huss A, Kuehni CE, Frey U. Air pollution during pregnancy and lung function in newborns: abirth cohort study. Eur Respir J 2009;33:594–603.
16 Jedrychowski WA, Perera FP, Maugeri U et al. Effect of prenatal exposure to fine particulate matter on ventilatorylung function of preschool children of non-smoking mothers. Paediatr Perinat Epidemiol 2010;24:492–501.
17 Sonnenschein-van der Voort AM, de Kluizenaar Y, Jaddoe VW et al. Air pollution, fetal and infant tobacco smokeexposure, and wheezing in preschool children: a population-based prospective birth cohort. Environ Health2012;11:91.
18 MacIntyre EA, Gehring U, Mölter A et al. Air pollution and respiratory infections during early childhood: an analysisof 10 European birth cohorts within the ESCAPE Project. Environ Health Perspect 2014;122:107–13.
19 Woodruff TJ, Darrow LA, Parker JD. Air pollution and postneonatal infant mortality in the United States, 1999–2002.Environ Health Perspect 2008;116:110–15.
20 Dick S, Friend A, Dynes K et al. A systematic review of associations between environmental exposures anddevelopment of asthma in children aged up to 9 years. BMJ Open 2014;4:e006554.
3 In the beginning: protecting our future generations
© Royal College of Physicians 2016 47

Every breath we take: the lifelong impact of air pollution
21 Mölter A, Simpson A, Berdel D et al. A multicentre study of air pollution exposure and childhood asthma prevalence:the ESCAPE project. Eur Respir J 2015; 45:610–24.
22 Gruzieva O, Bellander T, Eneroth K et al. Traffic-related air pollution and development of allergic sensitization inchildren during the first 8 years of life. J Allergy Clin Immunol 2012;129:240–6.
23 Chen Z, Salam MT, Eckel SP, Breton CV, Gilliland FD. Chronic effects of air pollution on respiratory health inSouthern California children: findings from the Southern California Children’s Health Study. J Thor Dis 2015;7:46–58.
24 Gehring U, Gruzieva O, Agius RM et al. Air pollution exposure and lung function in children: the ESCAPE project.Environ Health Perspect 2013;121:1357–64.
25 Liu J, Lewis G. Environmental toxicity and poor cognitive outcomes in children and adults. J Environ Health2014;76:130–8.
26 Fernandez-Twinn DS, Constância M, Ozanne SE. Intergenerational epigenetic inheritance in models ofdevelopmental programming of adult disease. Semin Cell Dev Biol 2015;43:85–95.
27 Jiang R, Jones MJ, Sava F, Kobor MS, Carlsten C. Short-term diesel exhaust inhalation in a controlled humancrossover study is associated with changes in DNA methylation of circulating mononuclear cells in asthmatics. PartFibre Toxicol 2014;11:71.
28 Janssen BG, Godderis L, Pieters N et al. Placental DNA hypomethylation in association with particulate air pollutionin early life. Part Fibre Toxicol 2013;10:22.
29 Hou L, Zhang X, Wang D, Baccarelli A. Environmental chemical exposures and human epigenetics. Int J Epidemiol2012;41:79–105.
48 © Royal College of Physicians 2016

Chapter 4: Summary
Exposure to air pollution has health effects at every stage of life, from before birth into old age. Thedamage is sometimes gradual, and may not be apparent for many years.
Lung function naturally develops throughout childhood, and there is clear evidence that long-termexposure to outdoor air pollution suppresses this process. In addition, it may speed up the decline oflung function through adulthood and into older age.
There is also good evidence that outdoor air pollution causes lung cancer.
It is likely that long-term exposure to air pollution is linked to the development of asthma. For peoplewho already have asthma, there’s strong evidence that air pollution can make it worse.
We still need more research, but it’s possible that exposure to air pollution could be associated with theappearance of diabetes, and may also damage the brain’s thinking abilities (cognition) in subtle ways thatbuild up over time.
Large studies have shown a strong link between air pollution and cardiovascular disease (heart diseaseand strokes).
50 © Royal College of Physicians 2016
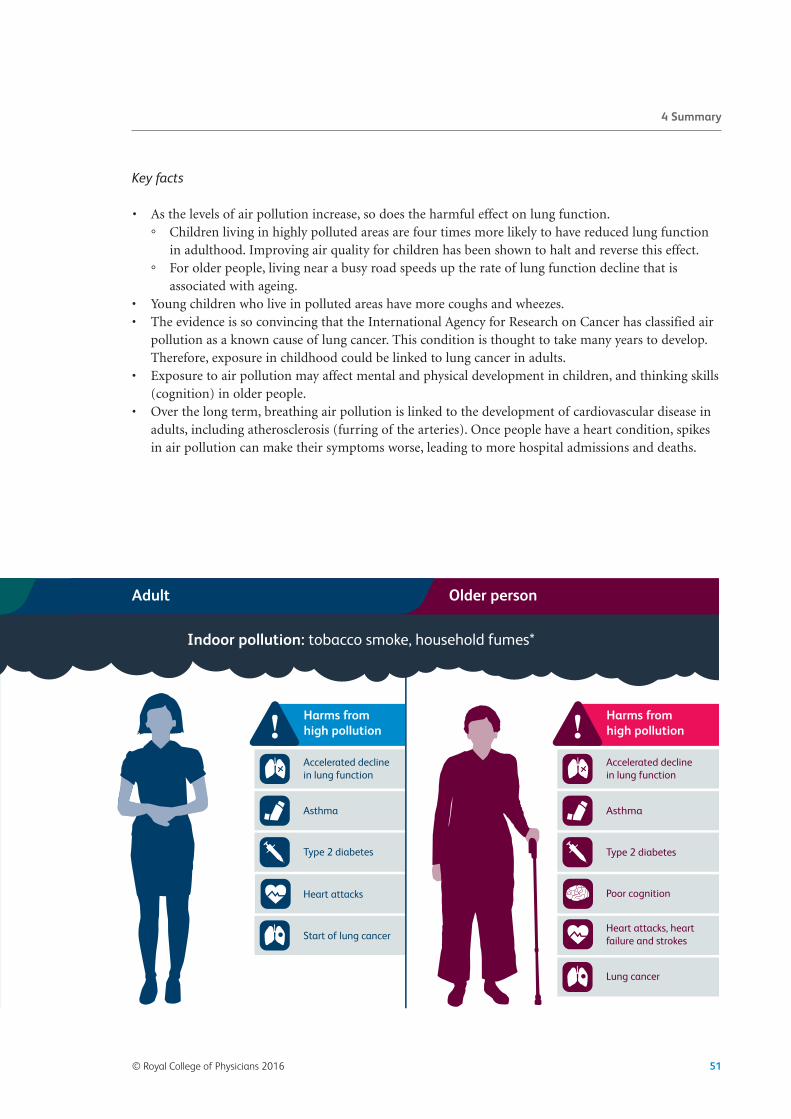
Key facts
• As the levels of air pollution increase, so does the harmful effect on lung function.
° Children living in highly polluted areas are four times more likely to have reduced lung functionin adulthood. Improving air quality for children has been shown to halt and reverse this effect.
° For older people, living near a busy road speeds up the rate of lung function decline that isassociated with ageing.
• Young children who live in polluted areas have more coughs and wheezes. • The evidence is so convincing that the International Agency for Research on Cancer has classified airpollution as a known cause of lung cancer. This condition is thought to take many years to develop.Therefore, exposure in childhood could be linked to lung cancer in adults.
• Exposure to air pollution may affect mental and physical development in children, and thinking skills(cognition) in older people.
• Over the long term, breathing air pollution is linked to the development of cardiovascular disease inadults, including atherosclerosis (furring of the arteries). Once people have a heart condition, spikesin air pollution can make their symptoms worse, leading to more hospital admissions and deaths.
© Royal College of Physicians 2016 51
4 Summary

Chapter 4: Health effects of air pollution over ourlifetime
In the previous chapter, we reviewed the reasons why the fetus and the child are especially vulnerable toair pollution, and why this vulnerability has implications for health across the lifecourse. This chapterreviews the evidence that long-term exposure to air pollution has adverse effects on health in infants,children, young people and adults. In reviewing the evidence, we focus mainly on new-onset (incident)disease and, therefore, greater weight is placed on evidence from studies where large groups ofindividuals have been followed over long periods of time.
4.1 The growing and the ageing lung
Maximising lung growth during childhood and minimising lung function decline during ageing areimportant because the development of low lung function (measured by spirometry as FEV1 andFVC) means that there is less reserve if lung disease develops. For example, in asthmatic children,low lung function detected by spirometry predisposes to more severe asthma symptoms anddecreased quality of life. In healthy young adults in the Coronary Artery Risk Development in YoungAdults (CARDIA) study, accelerated decline in lung function over a 10-year period was associatedwith lower output of blood from the heart,1 and recent analyses of data from the FraminghamOffspring Cohort, the Copenhagen City Heart Study and the Lovelace Smokers Cohort found thatlow FEV1 in early adulthood predisposes to the development of COPD in later life.
2 A lung functionof <80% of that expected is normally used as a cut-off to indicate an increased risk of respiratorysymptoms.
4.1.1 Infants
As discussed earlier, adverse effects of air pollution on the developing fetus may have long-termeffects on lung development during extrauterine life. Separating the effects of exposure duringgestation from the effects of exposure during infancy is difficult, because new mothers with infantsusually live at the same address as when they were pregnant. However, a recent study reported aneffect of fetal exposure per se on lung function in later life. In this study, increased exposure to NO2during the second trimester of gestation was independently associated with reduced FEV1 measuredat 4.5 years of age.3
4.1.2 Schoolchildren
In schoolchildren, the effects of air pollution over time on the increase of FEV1 and FVC (as indices oflung function growth) have been examined in the Children’s Health Study. This study recruited morethan 11,000 schoolchildren selected from classrooms in 16 communities in California, USA.4 Childrenwere chosen from different areas to reflect the widest range of background regional pollution, which isthe component of air pollution that all children are exposed to within a community. Lung function wasmeasured every year and long-term background levels of air pollution were measured using monitoringstations in each community. After adjusting for a wide range of confounding variables, suppression oflung function growth was found in children living in communities with the highest concentrations ofPM10, PM2.5, elemental carbon and NO2 (Fig 11).
52 © Royal College of Physicians 2016

In the California study, suppression of lung function growth by air pollution was clinically significant.For example, the proportion of young adults with an FEV1 <80% of that expected was four times higherin the community exposed to the highest background level of air pollution than in the least pollution-exposed community.
The Children’s Health Study also addressed the independent effect of exposure to locally generated airpollution from traffic.4 Researchers found that children living within 500 m of a heavily used road had
1,450
1,420
1,390
1,360
1,330
1,300
1,270
1,240
1,210
2,485
2,455
2,425
2,395
2,365
2,335
2,305
2,275
2,245
00 5 10 15 20 25 30 35 40
Gro
wth
in F
EV1 a
mon
g gi
rls (m
L)
NO2 (ppb)
Gro
wth
in F
EV1 a
mon
g bo
ys (m
L)
Girls
Boys
Fig 11. Average growth in FEV1 in school-age girls (open circles) and boys (closed circles) during an 8-yearperiod, plotted against average NO2. Each dot represents a separate community. As background NO2increases in communities, the rate of growth in FEV1 decreases. A similar effect was observed forbackground PM. Adapted with permission from Gauderman et al,5 © 2004 Massachusetts Medical Society.
4 Health effects of air pollution over our lifetime
© Royal College of Physicians 2016 53

Every breath we take: the lifelong impact of air pollution
suppression of growth of lung function (measured as FEV1) over an 8-year period, compared withchildren living >1,500 m from a heavily used road.
The association between air pollution and impaired lung function growth has also been observed inother populations. For example, in a study of Taiwanese children followed over a 2-year period, reducedlung function growth (as FEV1) was strongly associated with increased exposure to PM2.5.
6
More direct evidence that air pollution causes suppression of lung function growth is provided by across-sectional study of healthy schoolchildren in Leicester, UK.7 This study used the capacity ofmacrophages resident on the mucosal surface of the lower airways to take up inhaled material, includingpollution particles (PM) (Fig 12).
In this study, each 1 µm2 increase in the area of macrophage black carbon was associated with a 17%reduction in the expected FEV1 (Fig 13).
The question of whether reducing the levels of air pollution improves lung function growth was recentlyaddressed. In its most recent analysis, the Children’s Health Study found that declining levels of NO2 andPM were associated with improvements in lung function growth.8 Improved lung function growth, as aconsequence of improved air quality, reduced the proportion of young people with an FEV1 <80% ofnormal from 7.9% to 3.6%. In the UK, 7.9% of the population of 18-year-olds translates toapproximately 58,500 individuals.
Whether exposure to O3 (a predominantly summer pollutant produced in the atmosphere byphotochemical oxidation of primary pollutants on sunny days) reduces lung function growth is unclear.However, an effect of O3 on 2-year lung growth was found in the Taiwanese study referred to above,
6 anda study of students who were lifelong residents of the Los Angeles and San Francisco Bay areas foundthat those with the highest exposure to O3 had reduced measures of small airways lung function.
9
4.1.3 Adults
As pointed out earlier, lung function in adulthood slowly declines with age. A recent analysis linked thelong-term lung function of the US adults recruited into the Framingham Offspring or Third Generationstudies with exposure in the home to air pollution, expressed as either distance of home from a majorroad or as modelled exposure to PM2.5.
10 This study found that adults living <100 m from a major roadhad a greater decline in FEV1 than those living >400 m from a major road. In a study of older US men
54 © Royal College of Physicians 2016
Fig 12. Examples of macrophages recovered from the lower airways of healthy children living in Leicester.The black spots in some of the cells are inhaled fossil fuel-derived particles.

(average age 70 years) whose lung function was measured up to six times from 1995 to 2011, exposure totraffic-derived air pollution, determined for the home address, revealed that increased long-termexposure to black carbon correlated with an accelerated decline in both FEV1 and FVC.
11 The EuropeanStudy of Cohorts for Air Pollution Effects (ESCAPE) also studied the effect of outdoor air pollution onadult lung function decline.12 Subjects in this study had to be at least 20 years old, with lung functiondata from two different time points approximately 10 years apart. While no association was foundbetween either background or locally generated air pollution and lung function decline, cross-sectionalanalysis found that reduced FEV1 was associated with increased long-term exposure to NO2 and PM10.The researchers concluded that their findings were consistent with accelerated decline in lung functioncaused by air pollution.
4.1.4 Summary
Long-term exposure to either background or locally generated air pollution impairs lung functiongrowth in children. Reducing exposure to air pollution reverses this effect, thereby allowing more youngpeople to achieve their maximum lung function growth potential. In adults, there is emerging evidencethat air pollution accelerates the decline in lung function during ageing.
© Royal College of Physicians 2016 55
4 Health effects of air pollution over our lifetime
Fig 13. Association between FEV1 (expressed as a percentage of the predicted value based on height andsex) and area of fossil fuel-derived particles in healthy children living in Leicester, UK. As the number ofparticles in macrophages increases, lung function decreases. Adapted with permission from Kulkarni et al,7
© 2006 Massachusetts Medical Society.
0.00 0.25 0.50 0.75 1.00 1.250
75
85
95
105
115
125
FEV
1 (% o
f pre
dict
ed)
Median carbon area (µm2)
r2=0.13p=0.004

Every breath we take: the lifelong impact of air pollution
4.2 Wheeze and asthma
Asthma is a long-term inflammatory condition of the conducting airways of the lungs. It causes the airwaysto contract too much and too easily (airways hyper-responsiveness), leading to cough, wheeze, chesttightness and shortness of breath. It is a disease whose onset often begins in early childhood and isassociated with acquisition of atopy – the inherited predisposition to become allergic to commonenvironmental allergens such as dust mites, animal dander, fungi and pollens. Superimposed upon day-to-day asthma symptoms are exacerbations lasting from days to weeks, which are caused by a variety ofstressors such as air pollution episodes, respiratory viral infection and allergen exposure. Asthma ispotentially a life-threatening condition, with a high burden on health services and quality of life. There areover 5 million people in the UK who are currently receiving treatment for asthma, 1 million of these beingchildren.13 The UK still has some of the highest rates of asthma in Europe and, on average, three people aday still die from asthma.13
4.2.1 Preschool children
In preschool children, wheeze occurs in episodes triggered by viral colds. Unlike asthma in school-agechildren and adults, in preschool children wheeze is not associated with allergy and is not usuallyassociated with wheeze between colds. Clinicians therefore label wheeze in this age group as ‘preschoolwheeze’ – although the label ‘preschool asthma’ is also used. Preschool wheeze is common, with up to25% of all preschool children experiencing at least one episode of wheeze.14 Analysis of children aged1–5 years in the Leicester Birth Cohort found that exposure to locally generated PM10 at the homeaddress was associated with new-onset preschool wheeze.15 A study in British Columbia, Canada, whichidentified all new cases of preschool asthma diagnosed up to 3–4 years of age, found an increased risk ofpreschool asthma with increased modelled exposure to either NO2 or PM10 both during gestation andduring the first year of life.16 A 3-year longitudinal study that recruited both preschool and early school-age children in different communities in southern California, USA, found that increased risk ofdeveloping early school-age asthma was associated both with markers of traffic-associated outdoor airpollution near the home and with exposure to background NO2.
17
4.2.2 Schoolchildren
In the Californian Children’s Health Study, exposure to higher local concentrations of NO2 wasassociated with new-onset asthma.4 Furthermore, in this study the risk of lifetime asthma was higher inchildren living closer to a freeway. Children living within 75 m of a major road had a 29% increased riskof lifetime asthma, and traffic-related air pollutants near the home and school were associated with a1.5-fold-increased risk of new-onset asthma. A meta-analysis by Gasana et al18 of the effect of traffic-generated air pollution and asthma in children, which included 19 studies, concluded that:
1 increased exposure to NO2 is associated with new-onset asthma 2 increased exposure to PM is associated with new-onset wheeze.
NO2 is also generated indoors during gas cooking. In a meta-analysis of 19 cross-sectional studies on theeffect of either indoor NO2 or gas cooking and asthma, Lin et al
19 found that gas cooking was alsoassociated with increased risk of both current and lifetime asthma. The risk estimates were similar forpreschool wheeze, asthma in 6–10-year-olds, and asthma in children >10 years of age.
56 © Royal College of Physicians 2016

4.2.3 Adults
The Swiss study on Air Pollution and Lung Disease in adults (SAPALDIA) cohort found that new-onsetasthma was associated with exposure to traffic-related PM10 at the home address.
20 A study of women inthe USA reported an association between exposure to PM2.5 and new-onset asthma.
21 A recent meta-analysis of the effect of long-term exposure to air pollution and new-onset asthma in bothschoolchildren and adults by Anderson et al,22 using data from 17 cohorts, found that a 7% and a 16%increase in new-onset asthma was associated with a 10 µg/m3 increase in either NO2 or PM2.5,respectively.
4.2.4 Summary
There is now consistent evidence that outdoor air pollution is associated with new-onset asthma acrossthe lifecourse. There is also accumulating evidence that indoor NO2 may also be associated with new-onset asthma.
4.3 Diabetes
Type 2 diabetes is due to a combination of the body not producing sufficient insulin to function properly,and/or the body’s cells losing their response to insulin (insulin resistance). Type 2 diabetes is more commonthan type 1 diabetes (when the body doesn’t produce any insulin at all), and is associated with obesity andmetabolic syndrome with increased risk of cardiovascular disease. Most adults with diabetes have type 2that is linked to diet and obesity. In the UK, 6% of adults (approximately 2.7 million individuals) have adiagnosis of diabetes.23
4.3.1 Children
A study of healthy 10-year-old children reported an association between increased insulin resistance andexposure of the home address to outdoor air NO2 and PM10.
24 However, it remains unclear whether anabnormal insulin resistance index during childhood is associated with an increased risk of developingtype 2 diabetes.
4.3.2 Adults
A prospective cohort study of women followed up for 10 years assessed the association between new-onset type 2 diabetes and modelled outdoor air pollution (both locally generated and background) at thehome address.25 New-onset type 2 diabetes was associated with exposure to both PM2.5 and oxides ofnitrogen (including NO2). An analysis of 23-year follow-up data from the Nurses’ Health Study and theHealth Professionals Follow-Up Study found that living within 50 m of a major road, compared withthose living >200 m away, was associated with new-onset type 2 diabetes.26 A meta-analysis of the effectof long-term exposure to air pollution on type 2 diabetes by Wang et al,27 which included data fromthese studies along with data from eight other cohorts, concluded that increased risk of developing type2 diabetes is associated with long-term exposure to PM2.5, PM10 and NO2. In addition, a recent meta-analysis by Eze et al,28 which included three studies on PM2.5 and four studies on NO2, showed an8–10% increased risk of type 2 diabetes per 10 μg/m3 increase in exposure to both pollutants, withstronger associations being observed in women.
© Royal College of Physicians 2016 57
4 Health effects of air pollution over our lifetime

Every breath we take: the lifelong impact of air pollution
4.3.3 Summary
There is emerging evidence that exposure to air pollution is associated with new-onset type 2 diabetes inadults.
4.4 The brain
4.4.1 Fetus
As discussed in the previous chapter, there is clear evidence that exposure of pregnant women to airpollution affects fetal growth. An analysis of pooled data from 14 population-based mother–child cohortstudies from 12 European countries found an inverse association between head circumference at termand outdoor air pollution, assessed using the ESCAPE methodology.29 As head circumference isassociated with brain volume, these results suggest that exposure to air pollution affects fetal braingrowth. Evidence that effects of air pollution on the developing brain may have long-term consequencesis provided by data from children recruited into six European population-based birth cohorts, whichfound that exposure of the fetus to increased NO2 at the home address was associated with reducedpsychomotor development at 1–6 years of age.30 However, no association was found between airpollution and measures of cognitive development.
Using prospective cohort data from the Nurses’ Health Study II Cohort, researchers compared theexposure to air pollution during pregnancy of participants’ children with autism spectrum disorder(cases) with that of controls without autism spectrum disorder, and found that fetal exposure to PM2.5 atthe home address was associated with increased risk of autism spectrum disorder.31
4.4.2 Preschool children
In a study of mother–child pairs in the US Project Viva, children living <50 m from a heavily used roadhad lower non-verbal IQ,32 but disentangling this association from socio-economic factors is difficultowing to the small number of children living near a heavily used road. A single case–control study foundthat children with autism spectrum disorder were more likely to live at residences with the highestexposure to traffic-related air pollution prenatally and during the first year of life.33
4.4.3 Adults
A cross-sectional analysis of data from the US Health and Retirement Study found reduced cognitivefunction in older adults living in areas with higher PM2.5 concentrations.
34 Analysis of older men in theUS Department of Veterans Affairs Normative Aging Study found that increased exposure to fossil fuel-derived black carbon was associated with increased risk of having a Mini-Mental State Examinationscore ≤25, and that living in more polluted areas was associated with a decrease in cognitive functionthat is similar to a 1.7–2.8-year difference in age.35 Evidence that exposure to air pollution affects brainstructure was found by magnetic resonance imaging (MRI) of participants in the FraminghamOffspring Study, indicating that higher exposure to PM2.5 is associated with a reduction in total brainvolume.36
58 © Royal College of Physicians 2016

4.4.4 Summary
There is emerging evidence that air pollution adversely affects both the developing and the ageing brain.The associations need to be validated in more studies, and studies need to be sufficiently robust tocontrol for socio-economic factors.
4.5 The heart and blood vessels
There are 7 million people in the UK living with disease of the heart and blood vessels (cardiovasculardisease) and 2.3 million with coronary heart disease, which is the leading cause of death in the UK.37
4.5.1 Children
Cardiovascular disease in children is generally caused by genetic factors; children may be born with anabnormality of the heart or the blood vessels of the heart. In some cases, childhood disease can beacquired owing to infections, such as from rheumatic fever. In children, biomarkers of cardiovascularfunction show changes after exposure to air pollution. For example, studies have shown effects on bloodpressure after exposure to different pollutants. A study in Mexican children found that long-termexposure to increased PM2.5 is associated with increased mean pulmonary arterial pressure.
38 Similarly,in a study of 12-year-old European children, long-term exposure to outdoor NO2 and PM10 at the homeaddress was found to be associated with increased diastolic blood pressure.39 The relevance of suchchanges in children to the risk of developing adult cardiovascular disease is unclear.
4.5.2 Adults
Epidemiological studies have shown significant associations between air pollution and a range ofcardiovascular effects in adults. Both short- and long-term exposure to air pollution can increase therisk of myocardial infarction (heart attacks), heart failure, arrhythmias (abnormal rhythms of theheart) and stroke in susceptible individuals, such as older people or those with pre-existing medicalconditions including cardiovascular disease, high blood pressure and diabetes.40–42 For example,analysis of data in the UK Myocardial Infarction Audit demonstrated an increase in myocardialinfarction in the hours following exposure to traffic-related air pollution.43 A recent large review andmeta-analysis of short-term exposures to gaseous and particulate pollutants and admissions tohospital for stroke or mortality from stroke found strong associations with the day of exposure, withmore persistent effects observed for fine PM.44 Long-term exposure to fine PM is associated withcardiovascular morbidity and a reduction in life expectancy, which is due to increased deaths fromcardiovascular disease (as well as respiratory disease and lung cancer).40–42 For example, the ESCAPEstudy, which collected data from across Europe, found associations between long-term exposures tofine PM and an increased risk of stroke in older people,45 as well as an increased risk of first coronaryevents such as myocardial infarctions.46
Coronary heart disease and other circulatory diseases are caused by atherosclerosis; this is when arteriesbecome clogged with collections of fatty substances referred to as plaques or atheroma. Plaques cancause arteries to narrow and harden, restricting blood flow. Rupture of a plaque can cause a blood clotand could lead to a heart attack or stroke. It has been proposed that exposure to PM increases thelikelihood of these plaques to rupture, by generating an inflammatory response in the lung and release ofinflammatory mediators into the circulation, adversely affecting the cardiovascular system – for example,
© Royal College of Physicians 2016 59
4 Health effects of air pollution over our lifetime

Every breath we take: the lifelong impact of air pollution
by increasing circulating platelet stickiness. Short-term exposures to air pollution have demonstrated anincrease in the acute-phase inflammatory markers C-reactive protein and fibrinogen.47 Other proposedmechanisms, which could occur simultaneously, include the stimulation of receptors in the lung by PM,which then affect the autonomic nervous system and alter the control of the heart. Small particles mayalso affect the blood vessels directly.42
Atherosclerosis develops over a number of years and begins in childhood, but effects of the disease donot become clinically significant until adulthood. Long-term exposure to air pollution has beenassociated with markers of atherosclerosis, such as intima–media thickness (IMT; a measure of thethickness of the walls of the artery). For example, the Multi-Ethnic Study of Atherosclerosis (MESA) inthe USA was designed to investigate associations between long-term PM2.5 exposures and theprogression of atherosclerosis over a 10-year follow-up period, using information from a large cohort ofpeople who were without pre-existing cardiovascular disease at recruitment. Early analysis of resultsshows that higher long-term PM2.5 concentrations are associated with increased IMT of carotid arteries,and greater reductions in PM2.5 are related to a slower increase in IMT.
48
4.5.3 Summary
The evidence for the effects of both short- and long-term exposures to air pollution on cardiovasculardisease in adults is strong. Exposure to air pollution can exacerbate existing heart conditions andcontribute to the development of cardiovascular disease, resulting in increased hospital admissions anddeaths from cardiovascular disease. Strongest associations have been observed for PM. It is unclearwhether exposure to air pollution during childhood affects the development of cardiovascular disease inlater life.
Box 13: Reductions in air pollution levels during the Beijing Olympics
In Beijing and other cities in China, high levels of air pollution are frequently experienced by thepopulation; these are due to increases in coal-fired power stations, traffic and factories, as a result ofChina’s increasing economy and demand for energy. During the Beijing Olympics, measures were takento reduce levels of air pollution. This gave researchers an opportunity to look at the effect of short-termchanges in exposure on markers of inflammation and of cardiovascular physiology in healthy youngadults. The studies revealed changes in these markers that, although not clinically significant on theirown, provide support to the proposed mechanisms for how air pollution can cause cardiovasculareffects.49
4.6 Cancer
4.6.1 Children
Cancer is rare in children, and the WHO reported in 2005 that there was ‘insufficient evidence forambient air pollution and childhood cancer’.50 Since 2005, studies on traffic-related air pollution andchildhood cancers have produced equivocal results. One Californian study in 2013 found a greater risk ofacute lymphoblastic leukaemia and retinoblastoma in children after mothers were exposed to high levels
60 © Royal College of Physicians 2016

of traffic pollution during pregnancy.51 However, a meta-analysis in 2014 looked at nine studies ofresidential traffic exposure and childhood cancer from January 1980 to July 2011. This analysis reportedan association of childhood leukaemia with residential traffic exposure in the postnatal, but not theprenatal, period.52 Another meta-analysis in 2014 of 11 studies that investigated traffic density and riskof childhood leukaemia from January 1979 to December 2013 found no significant associations.53
Air pollution exposures have been linked to lung cancer, but this is not a type of cancer generally seen inchildren. It is believed that the development of lung cancer after exposure has a long latency period; thiscould be 15, 20, even 30 years later. Therefore, exposure of children to high levels of air pollution couldcontribute to the development of cancers in later life.
4.6.2 Adults
Two American studies (the American Cancer Society Study54 and the Six Cities study55) in the early1990s were the first large studies to show associations between long-term exposure to air pollution(specifically PM) and deaths from lung cancer. Since then, other air pollution studies have reportedassociations with, deaths from, and incidence of lung cancer. The ESCAPE study used data from 17cohort studies in nine European countries and found that PM contributes to the incidence of lungcancer in Europe.56 Based on such studies, the International Agency for Research on Cancer (IARC)classifies outdoor air pollution and PM from outdoor air pollution as carcinogenic to humans (group1).57 They concluded that there is strong evidence that exposures to outdoor air pollution are associatedwith changes in gene expression and genetic damage, which are linked to increased cancer risk inhumans. They further state that there is ‘sufficient evidence that exposure to outdoor air pollution causeslung cancer’. The IARC has also classified diesel engine exhaust as carcinogenic,58 although a recentreport by the Health Effects Institute suggests that new-technology diesel exhaust may not becarcinogenic.59
4.6.3 Summary
There is insufficient evidence of cancers due to air pollution in childhood. There is strong evidence thatoutdoor air pollution exposure is linked to lung cancer.
4.7 Conclusions
4.7.1 Lung function
There is strong evidence that long-term exposure to outdoor air pollution suppresses normal lungfunction growth in children, and there is emerging evidence that air pollution accelerates lung functiondecline in adults.
4.7.2 Asthma
There is highly suggestive evidence that long-term exposure to outdoor air pollution causes new-onsetasthma in both children and adults. There may be an additional effect of indoor-generated NO2. Thisevidence base is increasingly being strengthened. For example, in a population-based birth cohort studypublished online in November 2015, Gehring et al reported that increased exposure to NO2 at the birthaddress is associated with increased risk of new-onset (incident) asthma up to age 14–16 years.60 It is
© Royal College of Physicians 2016 61
4 Health effects of air pollution over our lifetime

Every breath we take: the lifelong impact of air pollution
therefore likely that, for individuals living in areas of high pollution throughout their lifecourse, reducedlung growth – and accelerated lung function decline – significantly increase their risk of developingrespiratory symptoms.
4.7.3 Diabetes
The emerging association between air pollution and new-onset type 2 diabetes in adults is concerning.
4.7.4 Neurodevelopment and cognition
Small cognitive deficits during childhood, when combined with accelerated cognitive decline duringadulthood, may result in clinically significant cognitive effects if high exposure continues over thelifecourse. The link between air pollution and autism is unclear. No such link was found in a recentanalysis of data from the ESCAPE project published online in June 2015.61
4.7.5 Cardiovascular
Exposure to air pollution exacerbates existing cardiovascular disease, causes deaths from cardiovasculardisease and is associated with a range of cardiovascular effects including myocardial infarction, heartfailure and stroke.
4.7.6 Cancer
There is strong evidence that outdoor air pollution causes cancer.
4.8 References
1 Cuttica MJ, Colangelo LA, Shah SJ et al. Loss of lung health from young adulthood and cardiac phenotypes inmiddle age. Am J Respir Crit Care Med 2015;192:76–85.
2 Lange P, Celli B, Agusti A et al. Lung-function trajectories leading to chronic obstructive pulmonary disease. NEngl J Med 2015;373:111–22.
3 Morales E, Garcia-Esteban R, de la Cruz OA et al. Intrauterine and early postnatal exposure to outdoor airpollution and lung function at preschool age. Thorax 2015;70:64–73.
4 Chen Z, Salam MT, Eckel SP, Breton CV, Gilliland FD. Chronic effects of air pollution on respiratory health inSouthern California children: findings from the Southern California Children’s Health Study. J Thorac Dis2015;7:46–58.
5 Gauderman WJ, Avol E, Gilliland F et al. The effect of air pollution on lung development from 10 to 18 years ofage. N Engl J Med 2004;351:1057–67.
6 Hwang BF, Chen YH, Lin YT, Wu XT, Leo Lee Y. Relationship between exposure to fine particulates and ozone andreduced lung function in children. Environ Res 2015;137:382–90.
7 Kulkarni N, Pierse N, Rushton L, Grigg J. Carbon in airway macrophages and lung function in children. N Engl JMed 2006;355:21–30.
8 Gauderman WJ, Urman R, Avol E et al. Association of improved air quality with lung development in children. NEngl J Med 2015;372:905–13.
9 Tager IB, Balmes J, Lurmann F et al. Chronic exposure to ambient ozone and lung function in young adults.Epidemiology 2005;16:751–9.
10 Rice MB, Ljungman PL, Wilker EH et al. Long-term exposure to traffic emissions and fine particulate matter andlung function decline in the Framingham heart study. Am J Respir Crit Care Med 2015;191:656–64.
62 © Royal College of Physicians 2016

11 Lepeule J, Litonjua AA, Coull B et al. Long-term effects of traffic particles on lung function decline in the elderly.Am J Respir Crit Care Med 2014;190:542–8.
12 Adam M, Schikowski T, Carsin AE et al. Adult lung function and long-term air pollution exposure. ESCAPE: amulticentre cohort study and meta-analysis. Eur Respir J 2015;45:38–50.
13 Asthma UK. Asthma facts and FAQs. www.asthma.org.uk/asthma-facts-and-statistics [Accessed 31 March 2015].
14 Kuehni CE, Davis A, Brooke AM, Silverman M. Are all wheezing disorders in very young (preschool) childrenincreasing in prevalence? Lancet 2001;357:1821–5.
15 Pierse N, Rushton L, Harris RS et al. Locally generated particulate pollution and respiratory symptoms in youngchildren. Thorax 2006;61:216–20.
16 Clark NA, Demers PA, Karr CJ et al. Effect of early life exposure to air pollution on development of childhoodasthma. Environ Health Perspect 2010;118:284–90.
17 McConnell R, Islam T, Shankardass K et al. Childhood incident asthma and traffic-related air pollution at home andschool. Environ Health Perspect 2010;118:1021–6.
18 Gasana J, Dillikar D, Mendy A et al. Motor vehicle air pollution and asthma in children: a meta-analysis. Environ Res2012;117:36–45.
19 Lin W, Brunekreef B, Gehring U. Meta-analysis of the effects of indoor nitrogen dioxide and gas cooking on asthmaand wheeze in children. Int J Epidemiol 2013;42:1724–37.
20 Künzli N, Bridevaux PO, Liu LJ et al. Traffic-related air pollution correlates with adult-onset asthma among never-smokers. Thorax 2009;64:664–70.
21 Young MT, Sandler DP, DeRoo LA et al. Ambient air pollution exposure and incident adult asthma in a nationwidecohort of U.S. women. Am J Respir Crit Care Med 2014;190:914–21.
22 Anderson HR, Favarato G, Atkinson RW. Long-term exposure to air pollution and the incidence of asthma: meta-analysis of cohort studies. Air Qual Atmos Health 2013;6:47–56.
23 NHS Choices. Type 2 diabetes. www.nhs.uk/Conditions/Diabetes-type2/Pages/Introduction.aspx [Accessed 31 March2015].
24 Thiering E, Cyrys J, Kratzsch J et al. Long-term exposure to traffic-related air pollution and insulin resistance inchildren: results from the GINIplus and LISAplus birth cohorts. Diabetologia 2013;56:1696–704.
25 Coogan PF, White LF, Jerrett M et al. Air pollution and incidence of hypertension and diabetes mellitus in blackwomen living in Los Angeles. Circulation 2012;125:767–72.
26 Puett RC, Hart JE, Schwartz J et al. Are particulate matter exposures associated with risk of type 2 diabetes? EnvironHealth Perspect 2011;119:384–9.
27 Wang B, Xu D, Jing Z et al. Effect of long-term exposure to air pollution on type 2 diabetes mellitus risk: a systematicreview and meta-analysis of cohort studies. Eur J Endocrinol 2014;171:R173–82.
28 Eze IC, Hemkens LG, Bucher HC et al. Association between ambient air pollution and diabetes mellitus in Europeand North America: systematic review and meta-analysis. Environ Health Perspect 2015;123:381–9.
29 Pedersen M, Giorgis-Allemand L, Bernard C et al. Ambient air pollution and low birthweight: a European cohortstudy (ESCAPE). Lancet Respir Med 2013;1:695–704.
30 Guxens M, Garcia-Esteban R, Giorgis-Allemand L et al. Air pollution during pregnancy and childhood cognitive andpsychomotor development: six European birth cohorts. Epidemiology 2014;25:636–47.
31 Raz R, Roberts AL, Lyall K et al. Autism spectrum disorder and particulate matter air pollution before, during, andafter pregnancy: a nested case–control analysis within the Nurses’ Health Study II Cohort. Environ Health Perspect2015;123:264–70.
32 Harris MH, Gold DR, Rifas-Shiman SL et al. Prenatal and childhood traffic-related pollution exposure and childhoodcognition in the Project Viva cohort (Massachusetts, USA). Environ Health Perspect 2015;123:1072–8.
33 Volk HE, Lurmann F, Penfold B, Hertz-Picciotto I, McConnell R. Traffic-related air pollution, particulate matter, andautism. JAMA Psychiatry 2013;70:71–7.
34 Ailshire JA, Crimmins EM. Fine particulate matter air pollution and cognitive function among older US adults. Am JEpidemiol 2014;180:359–66.
35 Power MC, Weisskopf MG, Alexeeff SE et al. Traffic-related air pollution and cognitive function in a cohort of oldermen. Environ Health Perspect 2011;119:682–7.
© Royal College of Physicians 2016 63
4 Health effects of air pollution over our lifetime

Every breath we take: the lifelong impact of air pollution
36 Wilker EH, Preis SR, Beiser AS et al. Long-term exposure to fine particulate matter, residential proximity to majorroads and measures of brain structure. Stroke 2015;46:1161–6.
37 British Heart Foundation. BHF cardiovascular disease statistics UK factsheet. London: BHF, 2015.www.bhf.org.uk/research/heart-statistics [Accessed 19 June 2015].
38 Calderón-Garcidueñas L, Vincent R, Mora-Tiscareño A et al. Elevated plasma endothelin-1 and pulmonary arterialpressure in children exposed to air pollution. Environ Health Perspect 2007;115:1248–53.
39 Bilenko N, van Rossem L, Brunekreef B et al. Traffic-related air pollution and noise and children’s blood pressure:results from the PIAMA birth cohort study. Eur J Prev Cardiol 2015;22:4–12.
40 Brook RD, Rajagopalan S, Pope CA 3rd et al. Particulate matter air pollution and cardiovascular disease: an update tothe scientific statement from the American Heart Association. Circulation 2010;121:2331–78.
41 World Health Organization. Review of evidence on health aspects of air pollution – REVIHAAP Project. Bonn: WHO,2013. www.euro.who.int/__data/assets/pdf_file/0004/193108/REVIHAAP-Final-technical-report-final-version.pdf/[Accessed 2 December 2015].
42 Newby DE, Mannucci PM, Tell GS et al. Expert position paper on air pollution and cardiovascular disease. Eur Heart J2015;36:83–93b.
43 Bhaskaran K, Hajat S, Armstrong B et al. The effects of hourly differences in air pollution on the risk of myocardialinfarction: case crossover analysis of the MINAP database. BMJ 2011;343:d5531.
44 Shah AS, Lee KK, McAllister DA et al. Short term exposure to air pollution and stroke: systematic review and meta-analysis. BMJ 2015;350:h1295.
45 Stafoggia M, Cesaroni G, Peters A et al. Long-term exposure to ambient air pollution and incidence of cerebrovascularevents: results from 11 European cohorts within the ESCAPE project. Environ Health Perspect 2014;122:919–25.
46 Cesaroni G, Forastiere F, Stafoggia M et al. Long term exposure to ambient air pollution and incidence of acutecoronary events: prospective cohort study and meta-analysis in 11 European cohorts from the ESCAPE Project. BMJ2014;348:f7412.
47 Langrish JP, Bosson J, Unosson J et al. Cardiovascular effects of particulate air pollution exposure: time course andunderlying mechanisms. J Intern Med 2012;272:224–39.
48 Adar SD, Sheppard L, Vedal S et al. Fine particulate air pollution and the progression of carotid intima-medialthickness: a prospective cohort study from the multi-ethnic study of atherosclerosis and air pollution. PLoS Med2013;10:e1001430.
49 Zhang J, Zhu T, Kipen H et al. Cardiorespiratory biomarker responses in healthy young adults to drastic air qualitychanges surrounding the 2008 Beijing Olympics. Res Rep Health Eff Inst 2013:5–174.
50 World Health Organization. Effects of air pollution on children’s health and development: a review of the evidence. Bonn:WHO, 2005. www.euro.who.int/__data/assets/pdf_file/0010/74728/E86575.pdf [Accessed 10 December 2015].
51 Heck JE, Wu J, Lombardi C et al. Childhood cancer and traffic-related air pollution exposure in pregnancy and earlylife. Environ Health Perspect 2013;121:1385–91.
52 Ghosh JK, Heck JE, Cockburn M et al. Prenatal exposure to traffic-related air pollution and risk of early childhoodcancers. Am J Epidemiol 2013;178:1233–9.
53 Sun XX, Zhang SS, Ma XL. No association between traffic density and risk of childhood leukemia: a meta-analysis.Asian Pac J Cancer Prev 2014;15:5229–32.
54 Pope CA 3rd, Thun MJ, Namboodiri MM et al. Particulate air pollution as a predictor of mortality in a prospectivestudy of U.S. adults. Am J Respir Crit Care Med 1995;151:669–74.
55 Dockery DW, Pope CA 3rd, Xu X et al. An association between air pollution and mortality in six U.S. cities. N Engl JMed 1993;329:1753–9.
56 Raaschou-Nielsen O, Andersen ZJ, Beelen R et al. Air pollution and lung cancer incidence in 17 European cohorts:prospective analyses from the European Study of Cohorts for Air Pollution Effects (ESCAPE). Lancet Oncol2013;14:813–22.
57 International Agency for Research on Cancer. Outdoor air pollution a leading environmental cause of cancer deaths. Pressrelease no 221. Lyon: IARC, 2013. www.iarc.fr/en/media-centre/iarcnews/pdf/pr221_E.pdf [Accessed 19 June 2015].
58 International Agency for Research on Cancer. Diesel and gasoline engine exhausts and some nitroarenes (Monographs onthe evaluation of carcinogenic risks to humans 2013, volume 105). http://monographs.iarc.fr/ENG/Monographs/vol105/mono105.pdf [Accessed 19 June 2015].
64 © Royal College of Physicians 2016

59 Health Effects Institute. Advanced Collaborative Emissions Study (ACES): lifetime cancer and non-cancer assessment inrats exposed to new-technology diesel exhaust (Health Effects Institute research report no 184). Boston, MA: HealthEffects Institute, 2015. http://pubs.healtheffects.org/getfile.php?u=1039 [Accessed 10 December 2015].
60 Gehring U, Wijga AH, Hoek G et al. Exposure to air pollution and development of asthma and rhinoconjunctivitisthroughout childhood and adolescence: a population-based birth cohort study. Lancet Respir Med2015;doi:10.1016/S2213-2600(15)00426-9.
61 Guxens M, Ghassabian A, Gong T et al. Air pollution exposure during pregnancy and childhood autistic traits in fourEuropean population-based cohort studies: the ESCAPE project. Environ Health Perspect 2015;doi:10.1289/ehp.1408483.
4 Health effects of air pollution over our lifetime
© Royal College of Physicians 2016 65

Chapter 5: Summary
Air pollution is harmful to everyone. However, some people suffer more because they are:
• more likely to live in polluted areas• exposed to higher levels of air pollution• more vulnerable to health problems caused by air pollution.
Some people face all of these disadvantages.
Low income is one factor that can have such multiple effects. Poorer people are more likely to haveexisting medical conditions, and tend to live in areas where the outdoor and indoor environments –including the quality of the air – are not as healthy. Less access to decent housing, green spaces, jobs andhealthy food all contribute to poor health. These stressful conditions may also affect the body’s responseto air pollution.
In some ways, it is a vicious circle. For example, research suggests that some chemicals in air pollutionmay be implicated in the development of obesity – and we also know that obese people are moresensitive to air pollution.
66 © Royal College of Physicians 2016

To make the injustice worse, poorer people often can’t afford to move away and leave the problem tosomeone else – and they may not want to. People in low-income areas need more resources andopportunities to create a healthy local environment.
Key facts
• The body’s defences against hazards like air pollution are partly controlled by our genes.• Older people are more vulnerable to the harmful effects of air pollution.• There is evidence that air pollution can also harm the health of children, starting from the time they
are in the womb.• Some health problems, such as heart and lung conditions, can make a person more vulnerable to
harm from air pollution.• Being overweight can also make people more vulnerable to the harmful effects of air pollution, while
a diet that is rich in antioxidant nutrients (such as many vitamins), or which includes vitamin andmineral supplements, may give some protection.
• Poorer people can often find it easier to buy cheap, unhealthy foods than a healthy diet, which putsthem at a significant disadvantage.
• Poorer people also tend to live in environments where they are more exposed to air pollution, forexample from busy roads or in unhealthy housing.
• All of these disadvantages add up, so poorer people are at a greater risk from air pollution and itsdamaging health consequences.
© Royal College of Physicians 2016 67
5 Summary

Chapter 5: Our vulnerable groups
5.1 Concepts
As with all toxic substances, the adverse effects of air pollution vary between individuals. This imbalancereflects a complex set of intrinsic and external factors and is variously described as ‘vulnerability’,‘susceptibility’ or ‘sensitivity’, terms which are used differently and often interchangeably.1
Here, we use the term ‘vulnerability’ to express the broad range of determinants whereby the healthimpacts of pollution are unequal. These determinants include those innate to an individual, such as theirage and their genetically regulated capacity to metabolise inhaled pollutants, and those that are acquired,such as the presence of respiratory or heart disease. Together, these influences are reflections of anindividual’s biological ‘susceptibility’. In addition, vulnerability includes environmental, social and/orbehavioural factors that determine an individual’s level of exposure and their capacity to manage it; thesefactors include, for example, the proximity of one’s home to an external source of pollution, co-exposures in the workplace, and access to preventive measures or healthcare. These concepts are depictedin Fig 14.
The distinction between biological and environmental vulnerability, or innate and acquiredsusceptibility, is conceptually useful, but in truth it is somewhat artificial. For example, older individualsbecome more vulnerable because they have an age-related loss of antioxidant defence mechanisms in the
68 © Royal College of Physicians 2016
Fig 14. Concepts of vulnerability to the effects of air pollution.
Modification or risk
Biological susceptibility
Vulnerability
Environmental susceptibility
Innate
• Age
• Sex
• (Epi)genome
• Etc
Structural
• Place of residence
• Housing
• Access to preventive
strategies
• Access to healthcare
• Etc
Behavioural
• Occupation
• Mode of travel
• Commuting
• Etc
Acquired
• Disease
• Diet
• Etc

lung and elsewhere, because they are more likely to have developed chronic cardiorespiratory diseases, orbecause their place of residence and modes of travel expose them to higher levels of urban pollution.
5.2 Impacts of vulnerability
The concept of vulnerability indicates that increases in exposure to pollution may have substantial effectson a vulnerable portion of the population, even if the change in risk for the whole population is small;and, conversely, that reductions in pollution levels may lead to pronounced health benefits in populationgroups with the highest vulnerability.
Individuals, or groups of similar individuals, who are especially vulnerable to the effects of air pollutionmay:
• for any given exposure to pollution, have a higher risk of an adverse health outcome (Fig 15a)• for any given exposure to pollution, experience a more severe adverse health outcome (Fig 15b)• experience an adverse health outcome at a lower level (‘threshold’) of exposure to pollution (Fig 15c)• be more likely to experience an above-threshold exposure to pollution (Fig 15d).
The adverse effects of air pollution measured in epidemiological studies are depicted as an average ofeffects across a whole population of individuals, within which there will exist varying individual states of
Fig 15. Different impacts of air pollution vulnerability.
Vulnerablepopulation
Risk
of a
dver
se e
ffec
t
a b
d
Pollution dose
Risk
of a
dver
se e
ffec
t
Pollution dose
Seve
rity
of a
dver
se e
ffec
t
Pollution dose
Norm
Like
lihoo
d of
exp
osur
e
Pollution dose
Vulnerablepopulation
c
Norm
Vulnerablepopulation
Norm
Vulnerablepopulation
Norm
© Royal College of Physicians 2016 69
5 Our vulnerable groups

Every breath we take: the lifelong impact of air pollution
vulnerability. Generally, the effect sizes (risk estimates) are small, but important because they have animpact on a large number of people. To a statistician, factors that determine vulnerability modify the riskestimate; in other words, the size of the estimate varies according to the presence or absence of avulnerability factor. Studies that set out to examine vulnerability need to be especially large and, ingeneral, have used only crude measures of vulnerability such as age or sex.
To complicate matters further, different factors that increase vulnerability often interact. For example,relatively socio-economically deprived communities will include a high proportion of individuals withdiseases or poor diets that render them vulnerable to the effects of air pollution, and may be exposed tohigher levels of pollution: a double injustice. These issues are discussed more fully below, but they begseveral questions:
• Are these differences inequalities or injustices?• Is it fair that those populations most exposed to air pollution are also more likely to have other
stressors, such as poverty, poor housing, low educational attainment, obesity, long-term illnesses andhigher levels of smoking?
• How much do these factors affect individual and population health?• Which are the most important?• Are they inevitable?• Should we be reducing them and, if so, how do we do it?• What options, if any, are available to deprived communities to avoid or reduce exposure and its
effects?• How much will intervention cost and who is responsible?
5.3 Biological (innate/acquired) susceptibility
5.3.1 Genetic and epigenetic influences
Human defences against external hazards are determined in part by factors that are under geneticcontrol. For example, the capacity to neutralise inhaled toxins is regulated by enzymes in the airway,whose nature and production are governed by inherited genes. Variation in these genes explains part ofthe difference in how individuals respond to air pollution.
Several such genetically controlled factors have been identified (eg in asthma, polymorphism in the TNF(tumour necrosis factor) gene promoter and GSTM1 (glutathione S-transferase µ1) gene affectsresponsiveness to O3 exposure), but even collectively they explain only a small part of individualvariation in susceptibility. More recently, attention has moved to the ‘epigenome’, a term used to describeinheritable material other than the sequence of DNA (see Chapter 3). Epigenetic mechanisms include theswitching on or off of genes, a process that may be fixed through life, but may also be prompted byenvironmental exposures including air pollutants such as PM.2 These effects may vary by age. There isthus the intriguing possibility that past exposures to air pollution determine future responses, favourableor unfavourable, to the same pollutants (see Chapter 3).
5.3.2 Age
There is consistent evidence that older people are particularly vulnerable to the adverse effects of airpollution. A systematic review of studies that examined deaths in association with exposure to PM,3
70 © Royal College of Physicians 2016

for example, indicated a risk in older people of about twice that observed in younger persons (seeFig 16); similar findings are reported for hospitalisations. These comparisons are relatively crude(‘older’, variously categorised, versus ‘not older’) and probably obscure a stronger effect. Theexplanation(s) are likely to be several and have not been examined fully, but they will include thehigher frequency of pollution-sensitive pulmonary, cardiovascular and metabolic diseases in olderpopulations.
Few studies have explicitly compared risks in children with those in adults, but there is evidence ofan adverse effect of air pollution on the health of children who spend a higher proportion of theirtime outdoors and are therefore at greater risk of exposure to ambient pollutants.4 Moreover, in 2015nearly 25% of all schoolchildren in London were exposed to levels of air pollution that exceeded legallimits.5
First author, yearFaustini, 2011Cakmak, 2011Goldberg, 2000Katsouyanni, 2009Wichmann, 2000Biggeri, 2005Samoli, 2008Franklin, 2007Forastiere, 2008Samoli, 2011O’Neill, 2008Aga, 2003Zeka, 2006Wong, 2010Yang, 2012Revich, 2010Chen, 2010O’Neill, 2008Samoli, 2008Samoli, 2008O’Neill, 2008Qian, 2010Katsouyanni, 2009Garrett, 2011Katsouyanni, 2009Ma, 2011Balakrishnan, 2011Kan, 2008Son, 2012Balakrishnan, 2011Overall
–1 0 1 2 3 4 5 6
Increase (%) in risk of death per 10 µg/m3 PM10
Fig 16. Meta-analysis of the association with age of increased risk of death from exposure to PM10. Solidsquares represent results from younger populations; open squares represent those for older populations.Each square represents a central risk estimate, and each horizontal line its 95% confidence interval.Diamonds represent overall results from the meta-analysis. Adapted from Bell et al,3 by permission ofOxford University Press.
© Royal College of Physicians 2016 71
5 Our vulnerable groups

Every breath we take: the lifelong impact of air pollution
5.3.3 Sex
The issue of sex differences in vulnerability to air pollution is complex.6 The evidence is inconsistent instudies of adults, although research in older adults and studies that have used estimates of exposurebased on place of residence suggest that the effects of air pollution are more pronounced in women. Anydifferences are likely to have several explanations that include biological differences between men andwomen (such as in the absorption of gases through the lung or hormonal differences in chemicalregulation), the higher proportion of older and vulnerable women than men, sex-related behaviouraldifferences in factors such as smoking and occupational exposures (that may mask, in men, the effects ofair pollution), or simply that estimates of exposure may be more accurate in adult women.
In infants and young children, the effects of pollution appear stronger in boys than girls, whereas inolder children (>5 years old) the opposite is the case. The reasons for these differences are probablycomplex, reflecting sex- and age-related differences in lung function and growth, and behaviour.
5.3.4 Disease
Studies of air pollution frequently include comparisons between individuals who do or do not have pre-existing disease. The conditions that have been most often examined in this way are respiratory andcardiovascular diseases and, more recently, diabetes. These are very common in the general population,and understanding whether their presence confers a particular vulnerability is an important issue. Thepicture is complicated by the facts that older people often have more than one such condition (multiplecomorbidities), and that air pollution itself may give rise to new disease (such as asthma) that thenrenders an individual more vulnerable to future pollution exposures. While it might reasonably beassumed that individuals with, say, heart disease would experience more serious effects from air pollutionor effects at lower doses, the evidence that this is so is not entirely consistent.7 This may reflect the factthat the concomitant use of medication may offset some or all of any vulnerability conferred by disease.
Nonetheless, some conclusions can be drawn:
• Asthma is a condition of chronic airway inflammation and, consequently, of airways that arehypersensitive to inhaled irritants such as many constituents of ambient air pollution. Therefore, it isunsurprising that individuals with asthma report more symptoms from pollution than those withoutasthma, and may require more controller anti-inflammatory and preventer bronchodilator treatmentsor are more likely to have an ‘attack’ of asthma (exacerbation) when ambient outdoor air pollutionlevels are high than when they are not. As might be expected, those individuals with more severeasthma and those whose asthma is undertreated are especially vulnerable.
• COPD is common in older populations, causally linked to many years of tobacco smoking and/or biomassfuel burning in homes in developing countries. Patients with COPD have a diminished capacity to clearinhaled material from their lungs and may, as a result, incur a higher-than-normal ‘dose’ at any level of airpollution. In response to elevated levels of pollution, individuals with COPD experience a greater fall inlung function and a higher risk of admission to hospital than healthy persons of the same age.
Inhaled gaseous and particulate pollutants (PM) are able to enter the circulation from the lungs, thusbecoming systemically bioavailable to cause adverse effects on the heart, brain and other organs. Patientswho already have cardiovascular or other disease of the internal organs may be especially vulnerable tothe adverse effects of pollution.
72 © Royal College of Physicians 2016

The presence of coronary artery disease increases the risk of adverse events from traffic-relatedpollutants and, in particular, those emitted from diesel engines. These events include myocardialinfarctions (heart attacks), but also more subtle effects such as autonomic nervous system abnormalitiesin heart rhythm or rate, hypertension, accelerated heart failure and type 2 diabetes.
5.3.5 Obesity
English children from deprived areas are almost twice as likely to be obese than those in affluent areas.8
UK adult obesity is also associated with deprivation, particularly in women.9 There is evidence that obesepeople are more vulnerable than others to the effects of exposure to air pollutants, which, given thenumber of people involved, is of particular concern. For example, the attenuation of age-related declinein lung function associated with improved air quality is not observed in overweight or obese people, andthere are reports that obesity may also exacerbate the impact of particulate exposure, including severalstudies suggesting that obese individuals (and/or those with metabolic syndrome) may be at greater riskof cardiovascular events due to PM exposure.10 Obesity can modify the associations between airpollution and markers of systemic inflammation, and between childhood asthma and respiratorysymptoms. Recent research has suggested that obese young children may be more likely than non-obesechildren to develop asthma in association with exposure to PAHs.11 Maternal obesity can exacerbate therisk associated with exposure to airborne PAHs on reproductive outcomes. Research has also suggestedthat some components of air pollution may be implicated in the development of obesity; prenatalexposure to endocrine-disrupting chemicals, for example, has been reported to increase children’s risk ofobesity.12
There is as yet little research on obesity and indoor air quality, although long-term occupationalexposure to airborne pollutants has been reported as increasing the risk of obesity, and being overweightor obese has been reported to increase vulnerability to indoor PM2.5 and NO2 in children with asthmaliving in urban areas.13
5.4 Environmental vulnerability
5.4.1 Deprivation
There are well-documented inequalities in the distribution of pollutants in the UK, although therelationship with deprivation is not straightforward. Deprived communities live in poorer-qualityenvironments that experience higher levels of air pollution14 (Fig 17), a relationship reported in otherdeveloped nations and in the former communist states of Eastern Europe. UK populations living in airquality management areas (AQMAs) by definition will encounter high air pollution – although largeAQMAs may include some areas that meet national air quality objectives – and are disproportionatelydeprived. There are exceptions where affluent populations tend to live in more trafficked areas, althoughthe impact of congestion charging in central London on reducing levels of NO2 and PM has beengreatest in the most deprived areas.10 Levels of O3 are generally lower in urban areas, given the chemistryof its formation as a photochemical-oxidant secondary pollutant and its removal by reacting with NO2,which is higher in such areas.
Poor indoor air quality, including high levels of VOCs, PM and NO2, is associated with unfit orinadequate housing standards, conditions that overwhelmingly affect those who are deprived.
© Royal College of Physicians 2016 73
5 Our vulnerable groups

Every breath we take: the lifelong impact of air pollution
Stress, at both the individual and the community levels, can weaken the body’s defences against externalinsult and influence the internal dose of toxicants.15 While the health experience of the relatively affluentis effectively independent of geographical region of residence, the Marmot Review14 clearly shows thatgeography has a major impact on the health effects of deprivation in England (Fig 18). It is entirelyplausible that environmental stressors such as air quality contribute to this inequity.
Deprivation has been identified as increasing susceptibility to PM in a number of separate studies. AEuropean review reported that poorer communities were more vulnerable to the effects of PM10exposure, including morbidity and mortality.16 Other factors closely associated with deprivation, suchas obesity and pre-existing cardiovascular and respiratory diseases, also increase vulnerability.Deprivation modifies the impacts of both PM on preterm birth and black smoke exposure onrespiratory mortality. Effects on cardiorespiratory disease and gestational hypertension continue to bereported.
5.4.2 Diet
One of the main mechanisms through which air pollutants affect lung and heart health is by theactivation of ‘oxidative stress’ in the airways and circulation. Diets that are rich in antioxidant nutrients(such as many vitamins), or which include micronutrient supplements, may help to protect against theharmful effects of air pollution, although the evidence here is based only on short-term studies.17 Poorerpeople have more limited access to a healthy diet,18 which may reduce the body’s defences against air
74 © Royal College of Physicians 2016
0
10
20
30
40
50
60
70
80
90
100
Perc
enta
ge o
f the
pop
ulat
ion
Least deprived areas
No conditions
Environmental conditions: river water quality, air quality, green space, habitat favourable to biodiversity, flood risk, litter, detritus, housing conditions, road accidents, regulated sites (eg landfill)
One condition Two conditions Three or more conditions
Most deprived areasLevel of deprivation
Fig 17. Proportion of the UK population living with adverse environmental conditions associated withdeprivation, 2001–2006.14 Data originally from Department for Environment Food and Rural Affairs(2007): www.ltnetwork.org/SITE/UPLOAD/DOCUMENT/defra_sustain.pdf.

pollutants, as nutrition can have a buffering or synergistic effect on PM-induced cardiovascularresponses and effects on the fetus.
5.5 Conclusions
There is clear evidence that, with a few exceptions, poorer people tend to live in lower-qualityenvironments and are more exposed to air pollution. This inequality is not necessarily an injustice,provided that the levels of exposure are not hazardous and that deprivation does not increasevulnerability; however, neither of these conditions seems to apply.
While many aspects of air quality have improved over the past few decades, there are still breaches of airquality standards, particularly in urban areas, and some important air pollutants are ‘non-thresholdtoxins’, meaning that any level of exposure will have an impact at a population level. Deprivation seemsparticularly linked with increasing susceptibility to PM exposure and cardiorespiratory effects, althoughthe precise mechanisms remain unclear. There is a general pattern that deprived populations, althoughnot always more exposed, experience greater harmful effects of air pollution because of vulnerabilityfactors. There is also some research suggesting that obesity may negatively modify risk and that exposureto some chemicals may be implicated in the development of metabolic syndrome. It is also clear thatpoorer people have other health, social and environmental stressors, such as poor-quality housing, higher
0
100
England and Wales
Routine
Semi-routine
Lower supervisory and technical
Small employers, own account workers
Intermediate
Lower managerial, professional
Higher managerial, professional
E SW SE EM
Region
Mor
talit
y ra
te p
er 1
00,0
00
WM YH L NW NE
200
300
400
500
600
700
800
Fig 18. Age-standardised mortality rates by socio-economic classification and region, for men aged 25–64years, 2001–2003.14 Data originally from Office for National Statistics (2008): ww.ons.gov.uk/ons/rel/hsq/health-statistics-quarterly/no—40—winter-2008/regional-differences-in-male-mortality-inequalities-using-the-national-statistics-socio-economic-classification—england-and-wales—2001-03.pdf.
© Royal College of Physicians 2016 75
5 Our vulnerable groups

Every breath we take: the lifelong impact of air pollution
unemployment, less access to environmental resources such as green spaces, poor diet and higher levelsof pre-existing disease. These stresses may modify the effect of exposure to pollutants.
These inequities affect people across the lifecourse from the prenatal stage through to old age. They arecompounded by the limited opportunities available for deprived communities to improve or escape theirenvironments.
5.6 References
1 Parkin RT, Balbus JM. Variations in concepts of ‘susceptibility’ in risk assessment. Risk Anal 2000;20:603–11.
2 Janssen BG, Byun HM, Gyselaers W et al. Placental mitochondrial methylation and exposure to airborne particulatematter in the early life environment: An ENVIRONAGE birth cohort study. Epigenetics 2015;10:536–44.
3 Bell ML, Zanobetti A, Dominici F. Evidence on vulnerability and susceptibility to health risks associated with short-term exposure to particulate matter: a systematic review and meta-analysis. Am J Epidemiol 2013;178:865–76.
4 Bateson TF, Schwartz JJ. Children’s response to air pollutants. Toxicol Environ Health A 2008;71:238–43.
5 Howard R. Up in the air: how to solve London’s air quality crisis: part 1. London: Policy Exchange, 2015.www.policyexchange.org.uk/publications/category/item/up-in-the-air-how-to-solve-london-s-air-quality-crisis-part-1[Accessed 11 December 2015].
6 Clougherty JE. A growing role for gender analysis in air pollution epidemiology. Cien Saude Colet 2011;16:2221–38.
7 Sacks JD, Stanek LW, Luben TJ et al. Particulate matter-induced health effects: who is susceptible? Environ HealthPerspect 2011;119:446–54.
8 National Obesity Observatory. National Child Measurement Programme: Changes in children’s body mass index between2006/07 and 2011/12. Oxford: National Obesity Observatory, 2013. www.noo.org.uk/uploads/doc/vid_17929_NCMP_Changes_children.pdf [Accessed 15 December 2015].
9 Public Health England. Health inequalities. National Obesity Observatory. www.noo.org.uk/NOO_about_obesity/inequalities [Accessed 28 October 2014].
10 World Health Organization. Review of evidence on health aspects of air pollution – REVIHAAP Project. Bonn: WHO,2013. www.euro.who.int/__data/assets/pdf_file/0004/193108/REVIHAAP-Final-technical-report-final-version.pdf/[Accessed 2 December 2015].
11 Jung KH, Perzanowski M, Rundle A et al. Polycyclic aromatic hydrocarbon exposure, obesity and childhood asthma inan urban cohort. Environ Res 2014;128:35–41.
12 Rundle A, Hoepner L, Hassoun A et al. Association of childhood obesity with maternal exposure to ambient airpolycyclic aromatic hydrocarbons during pregnancy. Am J Epidemiol 2012;175:1163–72.
13 Lu KD, Breysse PN, Diette GB et al. Being overweight increases susceptibility to indoor pollutants among urbanchildren with asthma. J Allergy Clin Immunol 2013;131:1017–23.
14 The Marmot Review. Fair society, healthy lives: strategic review of health inequalities in England post-2010. London:Marmot Review, 2010. www.instituteofhealthequity.org/projects/fair-society-healthy-lives-the-marmot-review[Accessed 11 December 2015].
15 Gee GC, Payne-Sturges DC. Environmental health disparities: a framework integrating psychosocial andenvironmental concepts. Environ Health Perspect 2004;112:1645–53.
16 Deguen S, Zmirou-Navier D. Social inequalities resulting from health risks related to ambient air quality – a Europeanreview. Eur J Public Health 2010;20:27–35.
17 Romieu I, Castro-Giner F, Kunzli N, Sunyer J. Air pollution, oxidative stress and dietary supplementation: a review.Eur Respir J 2008;31:179–97.
18 Saunders P, Saunders A, Middleton J. Living in a ‘fat swamp’: exposure to multiple sources of accessible, cheap,energy-dense fast foods in a deprived community. Br J Nutr 2015;113:1828–34.
76 © Royal College of Physicians 2016

Chapter 6: Summary
Putting numbers on the harmful effects of air pollution allows policymakers to compare the costs ofaction with the benefits that will follow. This helps them to develop cost-effective plans, ensuring that weget the greatest benefit from investments in cleaning up air pollution.
Calculating the impact of air pollution also highlights areas where the evidence base is weak, and wherefurther research would be most useful. For example, we have a lot of information about the impact ofoutdoor air pollution, but much less knowledge about indoor air pollution. We also know very littleabout the long-term health and economic effects of childhood illness caused by air pollution.
However, we already have clear evidence that air pollution is costing society dearly. It is forcing people tomiss work and school, and to change their lifestyles to avoid exposure on high-pollution days. Exposure tofine particles, nitrogen dioxide and other pollutants in the air we breathe is causing pain and suffering –and additional healthcare costs – through increased illness. It has been estimated to cause 44,750–52,500early deaths every year. Emerging evidence suggests a slightly lower figure, and therefore we have opted fora best estimate of around 40,000 attributable deaths per year with a range of ±25%.
The European Commission, the US Environmental Protection Agency and various other bodies haveconcluded that further measures to control air pollution are economically justified. The costs of cuttingemissions are outweighed by the benefits of action, because it would reduce pain and suffering, lowerhealthcare costs and get people back to work.
78 © Royal College of Physicians 2016

Countries across Europe, including the UK, have already paid a high price for failing to act more stronglyearlier. The longer action is delayed, the more this damage will mount up.
Key facts
• Exposure to particulates and nitrogen dioxide is linked to around 40,000 early deaths in the UK eachyear.
• Air pollution is also linked to illness. For an individual, this can range from a minor illness thatrequires some medication, to a very serious situation – such as admission to hospital caused by astroke, heart attack, lung condition or a range of other diseases.
• The health problems caused by air pollution impose many costs on society, through reducedproductivity and an added burden on the health service.
• Overall, the estimated cost to individuals and society is more than £20 billion annually for the UK.• According to 2010 estimates, the economic impact of exposure to air pollution across the European
Union is more than €240 billion each year.• We have less evidence about the costs of indoor air pollution. However, second-hand tobacco smoke
and radon gas also cause deaths, and impose a significant burden on the NHS.
© Royal College of Physicians 2016 79
6 Summary

Chapter 6: The heavy cost of air pollution
6.1 Introduction
The development of policy for reducing the risks of air pollution is informed through the quantificationand monetisation of effects. Quantification highlights both the magnitude and the variety of impacts.The monetisation process typically accounts for healthcare costs, lost productivity, and ‘welfare’ or‘utility’, placing a value on good health per se. Monetisation permits the costs of action to reducepollutant exposure to be compared with the benefits, to ensure that there is a sound economic basis foraction.
In this chapter, particular attention is given to the effects of outdoor (ambient) air pollution, as this hasbeen the focus of a large number of health impact and economic assessments. Reference is also made tosome work on indoor air quality, but this focuses on specific examples (second-hand smoke and radon)and is significantly less complete.
Quantification is limited to effects for which there is considered to be sufficient evidence available, notonly for acceptance of effect, but also for quantification. Important elements of the emerging literatureon childhood illness, in particular, have yet to be taken through to quantification.
6.2 Outdoor air pollution
6.2.1 Methods
All of the major air pollution health impact assessments follow the same broad method, referred to asthe impact pathway approach, which was first elaborated in detail in the EC–US Fuel Cycles Study of theearly 1990s, a collaborative exercise between the European Commission and the US Department ofEnergy.1 This approach tracks air pollution from its source in a logical, sequential manner, to describethe exposure of the population and then the impacts on the population either as a whole or for specificgroups (eg those over the age of 65 years, or children with asthma).
The development of methods by various bodies, including the UK’s Committee on the Medical Effects ofAir Pollutants (COMEAP),2,3 the US Environmental Protection Agency (USEPA)4,5 and the WHO,6 hasrequired a number of decisions to be made, of which the following are particularly important:
• Analysis is based on the use of data from epidemiological studies in preference to toxicology, in orderto capture effects on the whole population, and a full range of effects from those that range frommild to severe for individuals.
• Various reviews of evidence from the western hemisphere have concluded that analysis should focuson exposure to fine particles (PM2.5) and O3. There is growing evidence for inclusion of additionalimpacts of exposure to NO2 and these effects are now being integrated with damage assessments.
• PM2.5 is a complex mix of primary and secondary particles, varying in their physical and chemicalcharacteristics. However, available evidence does not support a systematic distinction betweendifferent particle types within the PM2.5 size range.
• Epidemiological research of fine particles has found no evidence for a threshold at the level of thewhole population.7 For O3, expert opinion8 has concluded that, while there is no firm evidence
80 © Royal College of Physicians 2016

for a threshold for health effects, there is more convincing evidence for effects above a certainlevel (35 ppb) than below, and this should be adopted as a cut-off point for analysis. The question of a threshold for NO2 assessment is currently still under review, although a preliminary opinion of COMEAP in the UK is that there is unlikely to be a threshold at the level of the whole population (bearing in mind that this includes people in a variety of healthstates).9
• The most-studied effects, on mortality and hospital admissions linked to short-term exposure tofine particles, capture only a small part of the range of the total health effects reported for airpollution. For policy evaluation, this makes it desirable to include other endpoints, but the questionarises of how far one should proceed, given increasing uncertainty as one pursues endpoints forwhich the evidence base is limited. Variable conclusions on this point have been reached by differentbodies, noting here that analysis for the European Commission and USEPA has tended to quantify alarge number of endpoints, while analysis for the UK government has so far considered fewer.
It is notable that the major quantification studies in the UK, European Union and USA have all come tothe same conclusions on several of the most important of these questions, specifically that:
1 PM has significant effects on health2 the mortality effects of long-term exposure to PM should be quantified without threshold and
without distinguishing between different types of particle3 these mortality impacts should be quantified using a response function in the order of a 6% change
in impact per 10 μg/m3 PM2.5.
6.2.2 Analysis of impacts in the UK
COMEAP2 provides a detailed account of the quantification of the mortality burden of exposure toPM2.5 in the UK. Results are shown in Table 1, expressed in terms of deaths and the impact onlongevity.
The COMEAP report considers the meaning of the estimate of the number of deaths shown in Table 1,noting that effects are principally from cardiovascular disease, which has multiple established and likelycauses at the population level, and almost certainly has a complex mixture of factors affecting initiationand progression at the individual level. On this basis, the reported number of deaths should beconsidered as more of a statistical construct, with air pollution playing some role in bringing forward thedeaths of a larger number of people than the 28,861 shown in Table 1.
Table 1. COMEAP results for effects of outdoor PM2.5 exposure on mortality for the UK2
Measure of mortality Impact
Number of attributable deaths 28,861
Attributable deaths per 100,000 aged over 30 years 75
Burden on total survival (life-years lost) 340,000
Difference in life expectancy for the 2008 cohort (days)Females 194Males 182
© Royal College of Physicians 2016 81
6 The heavy cost of air pollution

Every breath we take: the lifelong impact of air pollution
For some time, COMEAP has also made recommendations on quantification of the effects of O3 onmortality, and of NO2 and SO2 in addition to PM and O3 on hospital admission rates.2 Theserecommendations have been applied by the Interdepartmental Group on Costs and Benefits inevaluating policies that influence emissions of air pollution in the UK. However, the ensuing results aredominated by the mortality burden of fine particles. COMEAP is currently undertaking a number ofactivities to investigate extension of the range of effects for which quantification may be recommendedfor UK policy analysis. In related work, the function for PM-related mortality has been applied togenerate a list of attributable deaths and life-years lost for each local authority in the UK.10
Preliminary estimates of NO2 impacts on mortality were published by the UK’s Department forEnvironment Food and Rural Affairs (Defra) in September 2015.11 These indicate that NO2 is linked to23,500 deaths annually in the UK (with a range of 9,500–38,000), based on pollutant levels in 2013. It isnoted that this figure will include some overlap with the impact quantified against exposure to PM2.5.
When quantifying the total impact associated with exposure to both NO2 and PM2.5, it is thereforenecessary to account for this overlap in the response functions. Defra estimates that the annualequivalent number of attributable deaths associated with the two pollutants combined is 44,750–52,500,with an associated annual social cost of £25.3 billion – £29.7 billion. However, a subsequent paper issuedby COMEAP in December 2015 indicates that the level of overlap in estimates between pollutants maybe greater than originally thought.12 On this basis, while recognising that COMEAP’s research on thisissue is continuing, this report adopts a combined estimate of effect of around 40,000 deaths annuallywith an associated annual social cost of £22.6 billion (both with a range for a central estimate of ±25%).
6.2.3 Global burden of disease
With respect to air pollution, the Global Burden of Disease (GBD) 2010 study13 focused onquantification of mortality impacts from exposure to PM2.5 and O3. Overall, results indicate that a totalof 7 million deaths in 2010 across the world were attributable to indoor and outdoor air pollution,making air pollution one of the most important risk factors globally. Results for air pollutant impacts forthe UK, expressed as both disability-adjusted life-years (DALYs) and deaths (GBD did not includemorbidity), are shown in Table 2.
82 © Royal College of Physicians 2016
Table 2. GBD results for outdoor air pollution for the UK13
DALYs Deaths %
Ambient PM pollution
Cerebrovascular disease 73,061 5,448 20%
COPD 27,558 1,681 8%
Ischaemic heart disease 220,643 13,907 61%
Lower respiratory infections 815 9 0%
Trachea, bronchus and lung cancers 38,623 2,328 11%
Total (all causes) 360,700 23,373 100%
Ozone
Total (all COPD) 8,865 772 100%

It will be noted that the estimate for PM2.5 by COMEAP, presented above, is higher than the GBDestimate by about 20%. The COMEAP estimate is preferred here, because it is based on much finer-scalemodelling. The two sets of results are, however, sufficiently close to provide a good level ofcorroboration.
The GBD analysis addresses household air pollution in relation to emissions generated from solidfuel use, and particularly from crude, poorly ventilated stoves used in the developing world. Resultsfor the UK for this source are negligible. There are further indoor air quality issues considered in theGBD work, some of which are highlighted towards the end of this chapter.
6.2.4 USEPA analyses
USEPA has quantified health benefits of the US Clean Air Act of 1970 and subsequent legislation,including quantification of the costs and benefits of the 1990 Clean Air Act Amendments.4 Estimatedhealth impacts and associated economic benefits for the USA are shown in Table 3.
Like most other analysis, the US work is focused on impacts related to PM and O3 exposure, of which thePM effects are predominant. While the economic assessment is driven largely by mortality, the resultsshowing change in incidence demonstrate a substantial burden on a wide range of morbidity endpoints.
The costs of the US Clean Air Act Amendments are large, with an estimated net present value of $380billion from 1990 to 2020. However, the overall benefits to society are considerably greater, estimated
Table 3. USEPA results showing the estimated benefits of the US Clean Air Act Amendments for the USAin 2020.4 Values are expressed in $million, price year 2006
Health effect Pollutant Incidence Value ($million)
Mortality, attributed deaths* PM, O3 230,000 1,800,000
Chronic bronchitis PM 75,000 36,000
Non-fatal myocardial infarction PM 200,000 21,000
Respiratory hospital admissions PM, O3 66,000 1,100
Cardiovascular hospital admissions PM 69,000 2,000
Respiratory emergency room visits PM, O3 120,000 44
Acute bronchitis PM 180,000 94
Lower respiratory symptom days PM 2,300,000 42
Upper respiratory symptom days PM 3,300,000 60
Asthma exacerbation days PM 6,700,000 130
Minor restricted activity days PM, O3 140,000,000 6,700
Work loss days PM 19,000,000 2,700
School loss days O3 8,600,000 480
Outdoor worker productivity O3 Not applicable 170
*The mortality estimate shown includes effects on infants as well as adults.Source: USEPA,4 Tables 5–7.
© Royal College of Physicians 2016 83
6 The heavy cost of air pollution

Every breath we take: the lifelong impact of air pollution
between a factor of 4 and 92 higher (the range accounting for variability in the response functions andvaluations).
6.2.5 European Commission analyses
The European Commission has used cost–benefit analysis in the development of policy on air pollutionsince the mid-1990s. Results from the latest analysis14,15 are shown in Table 4 as health impactassessment and Table 5 as economic assessment, including results for the European Union as a whole,and separately for the UK. Again, the estimate of mortality linked to PM2.5 exposure is broadly similar tothat generated by COMEAP. Like the approach used by USEPA, the EC analyses consider a broad rangeof effects on morbidity, the demonstration of which provides support for there being a significantburden of air pollution on mortality. The economic assessment considers several dimensions of value:healthcare costs, lost productivity, pain and suffering, and aversion to risk. It is notable that theeconomic analysis indicates that the most-studied morbidity endpoint from the epidemiology literature,hospital admissions, represents only a small part of the overall morbidity impact.
84 © Royal College of Physicians 2016
Table 4. Estimated impacts in 2010 in the European Union and the UK15
O3 effects Units EU UK
Mortality Premature deaths 23,507 1,371
Respiratory hospital admissions Cases 19,117 1,368
Cardiovascular hospital admissions Cases 86,279 2,678
Minor restricted activity days Days 108,845,140 6,662,683
PM2.5 effects
Mortality Life-years lost 4,030,653* 327,769*
Mortality Premature deaths 379,420* 30,018*
Infant mortality Premature deaths 777 70
Chronic bronchitis Cases 316,685 25,582
Bronchitis in children aged 6–12 Cases 1,068,990 102,386
Respiratory hospital admissions Cases 142,243 11,652
Cardiac hospital admissions Cases 108,989 4,523
Restricted activity days Days 436,351,761 40,809,466
Asthma symptom days in children Days 11,290,673 1,171,559
Lost working days Days 121,378,612 6,097,215
NO2 effects
Chronic mortality Life-years lost NQ† NQ†
Bronchitis in children Cases NQ† NQ†
Respiratory hospital admissions Cases NQ† NQ†
*Alternative estimates of the same impact (effect of long-term exposure to particles on mortality).†NQ: recommended for quantification by the WHO, but not quantified in the European analysis.

The results of this analysis have been used by the European Commission to identify the socially optimaltarget for its Clean Air Policy Package (CAPP) released in December 2013. Technical measures forreducing emissions were identified and brought together in an abatement cost curve, showing how thecosts of abatement per unit of emission increase as emissions are reduced further. Health benefits wereoverlaid onto this graph and indicated that a target of around 75% of the abatement potential iseconomically justifiable. Results reveal a substantial surplus of benefit to society over cost for the CAPP,although the policy package is only the latest in a long series of actions to improve air quality going back60 years or more. This shows that the failure to act earlier has generated substantial costs of inaction forpublic health, much of which could have been avoided.
A report for the European Environment Agency16 applies the approaches developed for the EuropeanCommission at the level of all the industrial facilities that are required to report emissions to theEuropean Pollutant Release and Transfer Register (E-PRTR). A total in excess of 14,000 industrialplants have been considered, generating estimates of total burden and economic equivalent, andhighlighting those plants considered to cause the highest levels of damage. It is notable that 50% ofthe damage costs were linked to emissions from only 147 facilities, 1% of the total number ofindustrial plants assessed (Fig 19). With its focus on the impacts of industry, this analysis excludesassessment of other sources such as traffic, but does highlight the type of plant most likely to generateharm and variation in applied emission standards, enabling emission controls to be targeted on themost damaging facilities.
Table 5. Monetised estimates of impacts in 2010 in the European Union and UK, €million/year15
Damage, €million/year EU UKOzone effects
Mortality (valued as loss of life expectancy) 1,043–2,785 61–146
Hospital admissions 180 7
Minor restricted activity days 3,516 215
PM2.5 effects
Mortality (valued against life expectancy) 179,000–430,000* 14,600–34,600*
Mortality (valued against deaths) 318,000–648,000* 25,400–51,500*
Infant mortality 977–1,990 88–227
Chronic bronchitis 13,057 1,055
Bronchitis in children aged 6–12 484 46
Hospital admissions 429 28
Restricted activity days 30,880 2,888
Asthma symptom days in children 365 38
Lost working days 12,138 610
Totals 243,000–712,000 20,000–56,200
*Alternative estimates of the same impact (effect of long-term exposure to particles on mortality).
© Royal College of Physicians 2016 85
6 The heavy cost of air pollution

Every breath we take: the lifelong impact of air pollution
6.2.6 Overview of estimates of impacts of outdoor air pollutants
A number of bodies and groups around the world have reviewed the evidence for health impacts ofoutdoor air pollutants. While there are differences in the extent to which effects are quantified byeach group, and in the precise response functions selected, there is also much common ground.Overall:
• each group has recognised that the effects of air pollutants on health are real• no group considers there to be evidence to support adoption of a threshold for impacts of PM• all groups indicate a substantial mortality burden associated with PM in particular, for the UK
equivalent to around 29,000 attributable deaths.
The figure for attributable early deaths in the UK increases to up to 50,000 and probably around 40,000when the impacts of NO2 exposure are brought into the analysis.
Analyses of morbidity impacts for USEPA and the European Commission indicate a variety of effects,from hospital admissions to heart failure and chronic bronchitis, down to effects that are minor at thelevel of the individual (eg days of restricted activity). When taken together, this information onmorbidity provides support for the large mortality burden. Analysis for the UK government has taken amore conservative approach to morbidity quantification, reflecting the limited evidence base from whichsome morbidity endpoints can be quantified and indicating the need for further research on the less-studied effects.
Results of these analyses have been used to inform the development of policies to reduce pollutantemissions. That cited above for the European Commission and USEPA demonstrates major societalbenefits for continued action on air pollution, well in excess of cost.
86 © Royal College of Physicians 2016
50% of totaldamage147 facilities
75% of totaldamage568 facilities
90% of totaldamage1,529 facilities
100
90
80
70
60
50
40
30
20
10
0
Perc
enta
ge o
f tot
al d
amag
e co
sts
0 200 400 600 800 1,000 1,200 1,400 1,600 1,800
Number of facilities
Fig 19. Cumulative distribution of the estimated damage costs associated with emissions of selectedpollutants from facilities reporting emissions to the E-PRTR.16

6.3 Quantitative estimates of impacts of indoor air pollution for the UK
The quantification of impacts of indoor air pollution has received far less attention than that for outdoorair. The following examples, for radon and second-hand smoke, provide national estimatesdemonstrating that the effects of indoor air pollution are far from trivial. However, they do not paint acomplete picture of the problem and further quantification work is urgently needed to highlight themost important indoor sources and associated risk factors.
6.3.1 Radon
The Health Protection Agency (now part of Public Health England) has provided a review on radon inrelation to public health.17 The burden of disease from radon in the UK is quantified at about 1,100deaths from lung cancer annually, equivalent to just over 1 in 500 from all causes. There is a close linkbetween the risks of radon exposure and smoking, although over 40% of deaths caused jointly by radonand smoking occur in people who have already given up smoking.
Analysis under the GBD Project suggests a higher figure of 2,320 deaths per year from radon exposure inthe UK,18 along with an estimated 38,500 DALYs (Fig 20). The results generated by the Health ProtectionAgency are likely to be more reliable, as this analysis should take better account of conditions within theUK. However, the GBD results suggest that the estimate of 1,100 deaths provided by the HealthProtection Agency may be an underestimate, and provides a useful insight into the development ofdisease with age, with effects starting in some people as young as their mid-30s.
6.3.2 Second-hand smoke
It has been estimated that second-hand smoke, or ‘passive smoking’, accounted for 600 deaths in the UK
Fig 20. Estimate of deaths and DALYs associated with exposure to radon in the UK in 2010, from the GBDProject.18
Dea
ths
by a
ge g
roup
DAL
Ys b
y ag
e gr
oup
800
700
600
Deaths (total = 2,320) DALYs (total = 38,549)
500
400
300
200
100
0
8,000
7,000
6,000
5,000
4,000
3,000
2,000
1,000
0
25–2
9 ye
ars
30–3
4 y
ears
35–3
9 y
ears
40–4
4 y
ears
45–4
9 y
ears
50–5
4 y
ears
55–5
9 y
ears
60–6
4 y
ears
65–6
9 y
ears
70–7
4 y
ears
75–7
9 y
ears
80+
yea
rs
© Royal College of Physicians 2016 87
6 The heavy cost of air pollution

Every breath we take: the lifelong impact of air pollution
in 2003 for those exposed in the workplace, and for 10,700 for those exposed at home (2,700 of whomwere aged under 65 years, and 8,000 over 65 years).19
Analysis by the RCP20 focuses on the effects of second-hand smoke on children, highlighting links toSIDS, lower respiratory infection, wheeze and asthma, middle ear infection and meningitis. Results aresummarised in Table 6, with estimated health costs in Table 7, totalling £22 million.
The healthcare costs presented in Table 7 are only a partial estimate of economic cost, as they omitwelfare costs (pain and suffering), impacts on productivity through parents needing to take time offwork, etc. By focusing on the impacts on children they also, of course, omit effects of passive smoking onthe adult population.
As for radon, the GBD Project18 provides an estimate of deaths and DALYs associated with exposure tosecond-hand smoke (Fig 21), demonstrating the progress of disease with age. Effects are noted in thevery young and for adults from their mid-20s. Total results are broadly similar to the GBD estimates for
88 © Royal College of Physicians 2016
Table 7. Healthcare costs for children in the UK associated with exposure to second-hand smoke (2007prices, £million)20
Effect Age group in years Consultations Hospital admissions
Lower respiratory infections ≤2 0.78 5.08
Middle ear infections 0–16* 4.81 5.06*
Wheeze ≤2 0.31 1.12
Asthma 3–4 0.23 0.28
Asthma 5–16* 2.97 1.46*
Meningitis 0–16* 0.02 0.60*
Total 9.12 13.60
*Results for hospital admissions go up to age 14, not 16.
Table 6. Disease in UK children associated with exposure to second-hand smoke20
Effect Age group Cases Consultations Hospital in years admissions
Lower respiratory infections ≤2 20,500 26,000 3,361
Middle ear infections 0–16* 121,400 160,200 2,517*
Wheeze ≤2 7,200 10,300 938
Asthma 3–4 1,700 7,600 236
Asthma 5–16* 13,700 99,000 1,211*
Meningitis 0–16* 600 800 231*
Total 165,100 303,900 8,494
*Results for hospital admissions go up to age 14, not 16.

radon, although there are differences in the progression of effects with age. GBD also providesinformation on the illnesses linked to exposure to second-hand smoke (Table 8).
The 2,800 deaths estimated by the GBD study for the UK in 201018 are clearly much lower than theestimate of around 11,000 deaths made previously for 2003.19 Reduced prevalence of smoking andlegislation against smoking indoors will have had some effect over this period, although the difference islikely to be linked more to the methods used than to trends over the period. Further detailed analysis forthe UK specifically would clearly be beneficial in targeting future policies.
Dea
ths
by a
ge g
roup
DAL
Ys b
y ag
e gr
oup
1,400
1,200
1,000
Deaths by age group (total = 2,791) DALYs by age group (total = 42,600)
800
600
400
200
0
7,000
1,600 8,000
6,000
5,000
4,000
3,000
2,000
1,000
0
0–6
day
s
7–2
7 d
ays
1–4
yea
rs
28–3
64 d
ays
25–2
9 ye
ars
30–3
4 ye
ars
35–3
9 ye
ars
40–4
4 ye
ars
45–4
9 ye
ars
50–5
4 ye
ars
55–5
9 ye
ars
60–6
4 ye
ars
65–6
9 ye
ars
70–7
4 y
ears
75–7
9 y
ears
80+
yea
rs
Fig 21. Estimate of deaths and DALYs associated with exposure to second-hand smoke in the UK in 2010,from the GBD Project.18
© Royal College of Physicians 2016 89
6 The heavy cost of air pollution
Table 8. Breakdown of DALYs and deaths from second-hand smoke exposure in the UK in 2010 by type ofdisease18
DALYs Deaths
Haemorrhagic and other non-ischaemic stroke 4,493 264
Ischaemic heart disease 27,938 1,844
Ischaemic stroke 5,402 513
Lower respiratory infections 1,687 18
Middle ear infection 510 0
Trachea, bronchus and lung cancers 2,569 152
Total (all causes) 42,599 2,791

Every breath we take: the lifelong impact of air pollution
6.4 Conclusions
Despite actions undertaken over many decades, outdoor air pollution remains a major risk to health in theUK and other countries. These risks generate a burden to both mortality and morbidity, with a generalconsensus around the COMEAP estimate of 29,000 attributable deaths brought forward because of exposureto ambient PM2.5 air pollution each year in the UK. Reported morbidity effects vary greatly in severity, fromimpacts that are seriously debilitating, such as COPD or cardiac events, to those that are less seriousindividually (eg ‘restricted activity days’ or ‘symptom days’), but which affect a large number of people. Thecosts of these impacts, for welfare, healthcare and productivity, are truly substantial. Quantification of effectsassociated with exposure to NO2 remains under discussion, although current indications are that PM2.5 andNO2 combined will bring forward around 40,000 attributable deaths annually.
Over time, it is to be expected that the costs of controlling air pollution will rise, as the cheapestmeasures, including efficiency improvements that save money by reducing energy costs, are fullyimplemented. At some point, then, it is to be expected that the costs of reducing emissions will exceedthe benefits gained. However, analyses for the European Commission, USEPA and others suggest thatsufficient inexpensive measures remain available to justify continued action. In part, this reflects newunderstanding of the sources of pollution, with sources that have in the past attracted little attentionnow being considered important enough to be taken into account. A good example concerns emissionsof ammonia from agriculture, which are linked to the formation of secondary sulphate and nitrateparticles, an important part of the mixture of pollutants that together form PM.
Most measures for reducing emissions of greenhouse gases (eg CO2) also have benefits for reducingemissions of local and regional air pollutants. The ‘co-benefits’ so generated are substantial and, in somecases, sufficient on their own to justify the abatement measures, irrespective of resulting climate benefits.This results from the two types of pollutant sharing a major common source, the combustion of fossilfuels. In contrast, some measures for control of greenhouse gases may have a negative impact on airquality. Combustion of biomass fuel, for example, which is commonplace in middle- and lower-incomecountries, has the potential to increase emissions of fine particles, especially where the biomass is burnedindoors for domestic heating and cooking.
From this limited review of the health effects of indoor pollutants, it has been shown that they cause, at aminimum, several thousands of deaths per year in the UK, and are associated with healthcare costs in theorder of tens of millions of pounds. A more systematic approach to the quantification of the effects ofindoor air pollution would be beneficial, not least as this is where people in the UK spend most of theirtime.
6.5 References
1 ExternE (1995) Volume 2: methodology. Method for estimation of physical impacts and monetary valuation for priorityimpact pathways. ExternE: Externalities of Energy. www.externe.info/externe_d7/?q=node/37 [Accessed 15 December2015].
2 Committee on the Medical Effects of Air Pollutants. The mortality effects of long-term exposure to particulate airpollution in the United Kingdom. London: Health Protection Agency, 2010. www.gov.uk/government/publications/comeap-mortality-effects-of-long-term-exposure-to-particulate-air-pollution-in-the-uk [Accessed 30November 2015].
3 Committee on the Medical Effects of Air Pollutants. Statement on the evidence for differential health effects ofparticulate matter according to source or components. London: Health Protection Agency, 2015. www.gov.uk/government/publications/particulate-air-pollution-health-effects-of-exposure/ [Accessed 2 April 2015].
90 © Royal College of Physicians 2016

4 USEPA. Prospective study: the benefits and costs of the Clean Air Act, 1990 to 2020. United States EnvironmentalProtection Agency, 2011. www.epa.gov/clean-air-act-overview/benefits-and-costs-clean-air-act-1990-2020-second-prospective-study [Accessed 3 April 2015].
5 USEPA. Manual and appendices for BenMAP 4.0. United States Environmental Protection Agency, 2012.
6 World Health Organization. HRAPIE: Health risks of air pollution in Europe – HRAPIE project. Recommendations forconcentration–response functions for cost–benefit analysis of particulate matter, ozone and nitrogen dioxide. Bonn: WHO,2013. www.euro.who.int/en/health-topics/environment-and-health/air-quality/publications/2013/health-risks-of-air-pollution-in-europe-hrapie-project-recommendations-for-concentrationresponse-functions-for-costbenefit-analysis-of-particulate-matter,-ozone-and-nitrogen-dioxide/ [Accessed 15 December 2015].
7 Crouse DL, Peters PA, van Donkelaar A et al. Risk of nonaccidental and cardiovascular mortality in relation to long-term exposure to low concentrations of fine particulate matter: a Canadian national-level cohort study. EnvironHealth Perspect 2012;120:708–14.
8 World Health Organization. Review of evidence on health aspects of air pollution – REVIHAAP Project. Bonn: WHO,2013. www.euro.who.int/__data/assets/pdf_file/0004/193108/REVIHAAP-Final-technical-report-final-version.pdf/[Accessed 2 December 2015].
9 Committee on the Medical Effects of Air Pollutants. Working group on the quantification of mortality associated withlong-term average concentrations of nitrogen dioxide (NO2): Note of the meeting held on Monday 6 July 2015. London:Committee on the Medical Effects of Air Pollutants, 2015. www.gov.uk/government/publications/nitrogen-dioxide-interim-view-on-long-term-average-concentrations-and-mortality [Accessed 15 December 2015].
10 Gowers AM, Miller BG, Stedman JR. Estimating local mortality burdens associated with particulate air pollution (reportno PHE-CRCE-010). London: Public Health England, 2014. www.gov.uk/government/uploads/system/uploads/attachment_data/file/332854/PHE_CRCE_010.pdf/ [Accessed 15 December 2015].
11 Department for Environment Food and Rural Affairs. Valuing impacts on air quality: Updates in valuing changes inemissions of oxides of nitrogen (NOx) and concentrations of nitrogen dioxide (NO2). London: Defra, 2015.www.gov.uk/government/uploads/system/uploads/attachment_data/file/460401/air-quality-econanalysis-nitrogen-interim-guidance.pdf [Accessed 15 December 2015].
12 Committee on the Medical Effects of Air Pollutants. Nitrogen dioxide: interim view on long-term average concentrationsand mortality. London: Health Protection Agency, 2015. www.gov.uk/government/publications/nitrogen-dioxide-interim-view-on-long-term-average-concentrations-and-mortality [Accessed 17 December 2015].
13 Lim SS, Vos T, Flaxman AD et al. A comparative risk assessment of burden of disease and injury attributable to 67risk factors and risk factor clusters in 21 regions, 1990–2010: a systematic analysis for the Global Burden of DiseaseStudy 2010. Lancet 2012;380:2224–60.
14 Holland M. Implementation of the HRAPIE Recommendations for European Air Pollution CBA work. Report toEuropean Commission DG Environment, 2014. http://ec.europa.eu/environment/air/pdf/CBA%20HRAPIE%20implement.pdf [Accessed 18 December 2015].
15 Holland M. Cost–benefit analysis of final policy scenarios for the EU Clean Air Package (corresponding to IIASA TSAPreport no 11). Report to European Commission DG Environment, 2014. http://ec.europa.eu/environment/air/pdf/TSAP%20CBA.pdf [Accessed 21 December 2015].
16 European Environment Agency. Cost of air pollution from European industrial facilities 2008–12. Luxembourg:European Environment Agency, 2014. www.eea.europa.eu/publications/costs-of-air-pollution-2008-2012/ [Accessed 2April 2015].
17 Health Protection Agency. Radon and public health: Report of the independent Advisory Group on Ionising Radiation.Chilton: Health Protection Agency, 2009. http://webarchive.nationalarchives.gov.uk/20110109132023/http://hpa.org.uk/web/hpawebfile/hpaweb_c/1243838496865/ [Accessed 2 April 2015].
18 Global Burden of Disease Study 2010 (GBD 2010) data downloads. http://ghdx.healthdata.org/global-burden-disease-study-2010-gbd-2010-data-downloads [Accessed 27 May 2015].
19 Jamrozik K. Estimate of deaths attributable to passive smoking among UK adults: database analysis. BMJ2005;330:812.
20 Royal College of Physicians. Passive smoking and children. A report by the Tobacco Advisory Group of the RoyalCollege of Physicians. London: RCP, 2010. www.rcplondon.ac.uk/sites/default/files/documents/passive-smoking-and-children.pdf/ [Accessed 2 April 2015].
© Royal College of Physicians 2016 91
6 The heavy cost of air pollution

Chapter 7: Summary
In the first chapter of this report, we explained how our economy, industries and way of life havechanged over recent generations, and how these trends have affected air pollution over that time.
We close the report by looking at the effect that these developments will have on our environment andthe air we breathe in the years ahead.
We are using up natural resources at an unprecedented rate. Our pollution of the environment harmsthe delicate global ecosystems on which we rely. The air pollution we generate plays a key role in thisdamage, not least in the process of climate change, which places our food, air and water supplies at riskand threatens our health and wellbeing.
Many of the pollutants that cause this environmental damage are the same ones that are toxic to ourbodies. These health problems will get worse if we continue on our current course.
There is hope, though, if we act quickly. Many of the changes that would decrease air pollution to protectour health – especially using energy more efficiently and burning less solid fuels and oil – would alsohelp to slow down the overheating of our planet. If we take steps now to save lives by cleaning up our air,we may also protect the future of our home on Earth.
Key facts
• By 2013, the concentration of carbon dioxide in the atmosphere had increased by about 42% over thelevels before the Industrial Revolution, and the concentration continues to rise. Carbon dioxide is oneof the main gases causing the Earth to overheat.
92 © Royal College of Physicians 2016

• Air pollution and climate change are intertwined. For example, the shifts in weather patterns due toclimate change may cause more ozone to be produced at ground level, which harms our health.Increased ozone levels then contribute to more warming.
• Sometimes what is good for one of these problems is bad for the other. Diesel-fuelled vehicles cutdown on carbon dioxide but they increase pollution from particulates, which damage health.
• On the other hand, many strategies to decrease air pollution are also ways to slow down climatechange. We can make this happen by:
° using less energy
° using energy more efficiently
° burning less oil, gas, coal and wood, while making more use of renewable energy sources
° using hybrid and low emission vehicles
° developing and using technology that captures carbon from power plants and factories, before it isreleased into the air.
If we act now to reduce greenhouse gas emissions to target levels by 2050, we can have a real impact. Ananalysis for the European Commission suggests that, each year in the UK, this would prevent thefollowing impacts related to local and regional air pollutant exposure:
• 5,700 deaths• 1,600 hospital admissions for lung and heart problems• 2,400 new cases of bronchitis.
Reducing air pollution would also allow vulnerable people to be more active, take less medication, andlive longer.
The economic value of these benefits would add up to €3.9 billion per year.
© Royal College of Physicians 2016 93
7 Summary

Chapter 7: Changing our future
7.1 Introduction
Population growth, urbanisation, developments in the way that we travel, our pursuit and use of energy,new approaches to producing and sourcing food, and many other transitions have all delivered benefitsfor individuals and society. Yet, in combination, such changes have often created unintended new andcomplicated threats to health and wellbeing. Human beings are now using natural resources at anunprecedented rate and are damaging global systems and processes, on which we all rely for health andwellbeing.1 Many of the global environmental changes – from depletion of the ozone layer, to oceanacidification, to climate change – can be linked to pollution of the atmosphere by human activity. Thisemphasises both the fragility and the interconnectivity of global systems and processes.2,3
The pollutants primarily responsible for climate change often share common sources with the toxicpollutants that damage health in our towns and cities. When we burn fossil fuels in vehicles, in our homes orin industry, health-damaging chemicals (notably SO2, oxides of nitrogen including NO2, and PM) arereleased. At the same time, fossil fuel combustion produces gases such as CO2 and NO2, which contribute towarming of the planet. One consequence is that measures to reduce emissions of greenhouse gases throughenergy efficiency, and most of the options for switching from fossil to other fuels, also reduce local airpollution. Thus, policies and interventions that tackle local air pollution can address climate change, and viceversa. They are said to offer ‘co-benefits’. However, there are some policy options that generate ‘trade-offs’. Forexample, as discussed earlier, reducing reliance on fossil fuels by increased burning of biomass (typicallybiological material derived from recently living plants) may increase particle emissions. Similarly, ‘end-of-pipe’ options for cleaning flue gases reduce overall energy efficiency and increase the pollutants that they donot specifically target, potentially contributing to both climate change and local air quality problems.
Some policy options introduce unexpected complications and can have unanticipated negativeconsequences. For example, the shift away from petrol and towards diesel for the small engines thatpower our cars has reduced tailpipe CO2 emissions. However, critically, the shift to diesel has alsocontributed to levels of health-damaging airborne particulates in the air of our towns and cities. Notably,too, the Air Quality Expert Group in its 2007 report Air quality and climate change: a UK perspective4
observed that, while the situation is complicated, the perceived climate benefits of reduced CO2 intailpipe emissions are, to an extent, offset by increased refinery emissions of CO2 due to increaseddemand for diesel, and the climate-warming effects of black carbon particles that diesel engines emit. Fig22 provides a simple illustration of how climate change and air pollution policies can interact.
7.2 Different pollutants – different behaviours and effects
The public health implications of many different emissions to the atmosphere are considered throughoutthis report. However, pollutants often differ markedly in their behaviour when introduced to theatmosphere. This is important for whether and how they impact on health and wellbeing and for thetypes of policy that are required to address the threats. When we think about air pollution in our townsand cities, we naturally focus on local pollutant concentrations and sources, such as busy roads orfactories. These are important for people who live and work in the vicinity. However, the challenge fromair pollutants assumes different characteristics when they are transported and transformed intosecondary pollutants (such as O3 and secondary particles) during dispersal in the atmosphere, perhaps
94 © Royal College of Physicians 2016

over several days. In these circumstances, the environment and the health of people living at somedistance from the initial pollution source(s) is placed at risk. This has been recognised through thedevelopment of international action on air quality, as well as climate change, for example through anumber of EU directives and the United Nations Economic Commission for Europe (UNECE)Convention on Long-range Transboundary Air Pollution.5
The global health threat from climate change has its origins in yet another type of pollutant behaviour.Because climate pollutants are less chemically reactive, they mix globally and respond much more slowlyto emission reduction measures. They persist and penetrate throughout the atmosphere over timescalesmeasured in decades and even centuries. This means that, although the need to address this dimensionof air pollution and health is urgent and serious, the threat can appear very remote in space and time toresidents in the locality or region where the emissions occur. People living in different locations willoften experience the direct and indirect health impacts of climate change in different ways and overdifferent timescales. Some communities will be affected much more severely than others, but invariablythose most vulnerable to the impacts of climate change are, like those most vulnerable to the adversehealth effects of air pollution, among the poorest in society. Thus, the release of pollutants into theatmosphere from human activity can be seen to initiate a number of quite different processes, whichimpact in different ways on human health and wellbeing. However, the public health response to airpollution should always be about protecting humans and the environment in ways that are sociallyinclusive and equitable, globally and across multiple generations.6
Beneficialfor AQ
Negative for AQ
Beneficialfor CC
Negative for CC
Beneficialfor both AQ and CC
Negativefor both AQ and CC
Flue gas desulphurisationThree-way catalysts (petrol)Particulate �lters (diesel)
Uncontrolled coal and oil fossil fuels in stationary and mobile sources
Increase in ‘uncontrolled’ dieselSome conventional biofuelsBiomassCombined heat and powerBuying credits overseas
Energy e!ciencyDemand managementNuclearWind, solar, tidal...Hybrids, low emission vehicles, carbon capture and storage
Fig 22. Policy map displaying air quality (AQ) / climate change (CC) interactions. Source: Defra (2010). Airpollution: Action in a changing climate. www.gov.uk/government/publications/air-pollution-action-in-a-changing-climate.
7 Changing our future
© Royal College of Physicians 2016 95

Every breath we take: the lifelong impact of air pollution
7.3 How local air pollution affects our climate
Average global temperatures are dictated by the balance between the incoming energy from the sun that isretained by, and warms, the Earth’s surface, and the energy that is reflected back into space. When humanactivity pollutes the air, it upsets the Earth’s energy balance, producing a warming effect. Both gases andparticles are involved in this process. Greenhouse gases, such as CO2 and CH4, act directly, trapping radiationin the atmosphere. Others, such as oxides of nitrogen (NOx), impact indirectly on the concentrations ofCH4 and O3 (another powerful greenhouse gas). The role of aerosols in global warming is complex and canbe positive and negative. By 2013, the concentration of CO2 in the atmosphere had increased by around 42%over the levels present before the Industrial Revolution. In 2013, the Intergovernmental Panel on ClimateChange (IPCC) concluded that, unless very stringent emission standards are achieved, by the end of the 21stcentury global surface temperatures will be more than 1.5°C above their 19th-century levels.7 Disturbingly,the IPCC expressed medium confidence that a ‘business as usual’ scenario, in which emissions remain high,carries a 50:50 chance that warming will exceed 4°C by 2100. Such a rise will have huge implications forhealth, wellbeing and the global community itself.8–11 A tragic but timely indication of the consequences ofthe extreme weather events likely to become more common in the world was provided by the devastationwrought by Cyclone Pam on Vanuatu in March 2015.
7.4 How climate change affects the air we breathe
Atmospheric chemistry is complex and, just as climate change is primarily caused by the release ofgreenhouse gases, the warming climate itself alters atmospheric chemistry in ways that can damagehealth and wellbeing. This can be illustrated by reference to O3. Global warming increases levels of O3 inthe lower atmosphere, giving rise to airway damage, reduced lung function and increases in respiratorysymptoms in exposed persons, as we have discussed throughout this report. Yet, the highest levels ofatmospheric O3 exist in the stratosphere (the second major layer of the Earth’s atmosphere), where the‘O3 layer’ reduces the amount of ultraviolet radiation reaching the Earth’s surface and, with it, damage toour DNA. In the 1970s, thinning of the O3 layer prompted measures to tackle release of thechlorofluorocarbons (CFCs) present in aerosols that were primarily responsible. However, more recentlyit has been proposed that the 50–60-year timescale predicted for O3 layer recovery may not in fact beachieved owing to climate change.12,13
The Air Quality Expert Group report Air quality and climate change: a UK perspective provides an in-depth assessment of the interactions between the climate and aspects of the air we breathe.4
7.5 Health and wellbeing implications
Even in outline, the interconnections between air quality and climate change present a complex andsometimes confusing picture. However, the headline message for society, supported by an overwhelmingscientific consensus, is that climate change is a product of human activity and, especially, emissions fromthe combustion of fossil fuels. By extension, any consideration of the health effects of human-induced airpollution is incomplete without including the many and diverse health and wellbeing impacts that arealready taking place owing to the changing climate.
In a recent report, a working group of the IPCC observed that, through shifts in weather patterns andother consequences, climate change is both a direct and an indirect risk to health.14 Through its impactson air quality, water and food, it is already affecting lives and livelihoods across the globe. In 2014 the
96 © Royal College of Physicians 2016

WHO estimated that, between 2030 and 2050, climate change will cause an additional 250,000 deathsworldwide per year from malaria, diarrhoea, heat exposure and undernutrition.15
For the UK, climate change will certainly impact negatively on air quality, but the most obviouschanges will be in the seasonal, maximum, mean and minimum temperatures, in precipitation and insea levels. Although the actual contribution of climate change to recent storms and floods in the UKcannot be accurately assessed, such events show the social and economic disruption that can beanticipated, should such events become more commonplace. They also illustrate the potentialconsequences of a changing climate for physical and mental health. The UK’s Health ProtectionAgency (now part of Public Health England) recently considered impacts of climate-relatedenvironmental change specifically for the UK.16 Its report highlights the inherent difficulty inpredicting the impacts of a process that is influenced by such a wide range of factors, not least thefuture level of man-made emissions and the effectiveness of mitigation and adaptation measures.However, the agency concluded that the medium-term prospect for the UK is more likely to be anexacerbation of existing health challenges, rather than the introduction of entirely new ones.16 Thepredictions make a valuable contribution, informing adaptation measures and emphasising theimportance of climate change to a sometimes disengaged public. However, while it is essential for anycountry or community to consider the direct threats to health arising from changes close to home, it isalso important to take account of a wider set of climate-related threats to health and wellbeing,including effects mediated through impacts on ecosystems.
The global nature of climate change means that, irrespective of the source of pollution, ecosystem-related changes can disrupt economies and societies anywhere in the world. Where these disruptions (egfloods and droughts) occur, they may damage material resources such as crops or the marine harvest, oraffect non-material resources such as tourism and culture, which also underpin society. In turn, theseimpacts can rapidly undermine key determinants of health and wellbeing for the community, such assecurity, social relations, freedom of choice, and material resources. While such changes can appearremote to a country like the UK, the global connectivity of economic, social and ecological systemsmeans that any sense of separation is often illusory.17 The migration of people, the availability of goods,and issues of food security can all impact societies that may not, themselves, be directly experiencingsignificant climate-related disruptions.
In summary, for any locality to appreciate fully the potential health-related impacts of climate change, itis necessary to consider the anticipated environmental changes close to home, but also those that, for avariety of reasons, may appear more remote and abstract.6 Fortunately, the co-benefits for climatechange and local air quality that can flow from the right policies mean that actions to improve healththrough tackling local air pollution can be entirely consistent with securing the health of people in far-off lands at some point in the future.
7.6 Air pollution co-benefits from climate mitigation
Research for the European Commission under the ClimateCost Project18 indicates the magnitude of airquality benefits attributable to climate policies. Across the EU, a climate mitigation scenario designed torestrict warming to 2°C is estimated to reduce annual emissions of sulphur and nitrogen by 60% and46% respectively in 2050 in Europe, with a 19% reduction for PM. As indicated in Table 9, thesereductions have significant benefits for health, the monetary equivalent of total co-benefits being in theorder of €40 billion per year.
7 Changing our future
© Royal College of Physicians 2016 97

Every breath we take: the lifelong impact of air pollution
The analytical methods used for health impact assessment of air pollution in Europe have since beenupdated through the WHO-led health risks of air pollution in Europe (HRAPIE) study.19,20 While thedetail of the recommended methods for European appraisal has changed, overall results, using theupdated approach, will be broadly similar to those given above. These co-benefits equate to around €24per tonne of CO2 and are sufficient on their own to justify many actions to reduce greenhouse gasemissions. Similar findings have been reported elsewhere, for example by Balbus et al,21 who reported airquality co-benefits from climate policies of between $40 and $93 per tonne of CO2.
The conclusion from these studies is clear: that climate and air pollution policies are closely linked, andthat there are substantial benefits from ensuring that the linkages present are fully exploited. The reversealso holds true, ie that a failure to exploit these links will incur unnecessary costs to health andecosystems. The same applies to industry, for which inefficient policy will create additional demand forexpensive emission controls.
7.7 Policy implications
The need to adapt to the now-unavoidable reality of climate change in the UK and elsewhere, and tomitigate the pace and extent of climate change through reducing emissions of greenhouse gases, isevident. It is clear that, while greenhouse gases are most active in the upper atmosphere and toxicpollutants are most active at ground level, they invariably share a source in the combustion of fossil fuels.This is important for policy, as improved energy conservation, measures to increase fuel efficiency andsubstitution of fossil fuels with alternative energy sources can have beneficial impacts on both airpollution and climate change. A number of policies targeting the way in which society lives, consumesand moves around have potential to produce co-benefits. For example, measures that discourage the useof private cars in urban areas deliver co-benefits to health and wellbeing through tackling climate changeand air pollution. However, where such measures drive an increase in active travel (walking and cycling),
98 © Royal College of Physicians 2016
Table 9. Health impacts and co-benefits for the EU of moving from the baseline to the mitigationscenario for 2050
Results for 2050 Pollutant(s) Baseline Mitigation Co-benefit
Acute mortality (all ages), deaths O3 24,000 21,000 3,400
Respiratory hospital admissions (≥65 years) O3 28,000 24,000 3,800
Minor restricted activity days (15–64 years) O3 36,200,000 31,200,000 4,940,000
Respiratory medication use (adults ≥20 years) O3 16,700,000 14,400,000 2,280,000
Chronic mortality, life-years lost PM 1,390,000 905,000 482,000
Infant mortality (1 month – 1 year), deaths PM 200 130 70
Chronic bronchitis (≥27 years), new incidence PM 77,000 50,000 27,000
Respiratory hospital admissions (all ages) PM 29,000 19,000 10,000
Cardiac hospital admissions (all ages) PM 18,000 12,000 6,100
Restricted activity days (15–64 years) PM 124,000,000 81,400,000 42,700,000
Respiratory medication use, days PM 14,990,000 9,847,000 5,184,000
Total annual monetary equivalent O3 + PM €125 billion €82.5 billion €42.8 billion

a much wider set of benefits to physical and mental health and wellbeing can result from increasedphysical activity levels.
The UK health sector is an important focus for climate change mitigation activities. It has beenestimated that European health services have, in total, a carbon footprint equivalent to that of thewhole of the Netherlands. With UK health services costing around 9.1% of gross domestic product(GDP),22 it follows that the sector uses a substantial amount of energy and is responsible for asubstantial amount of greenhouse gas and local/regional air pollutant emissions.23–25 It follows, then,that improved energy efficiency within the health sector will have direct benefits to the health of thesociety that it serves through reduced burdens on climate and local air quality. For example, areduction in hospital admissions and rates of other illnesses will save resources that can be reinvestedto improve healthcare in other ways. An example of what NHS trusts can do to tackle air pollution isshown in Box 14.
Box 14: What can NHS trusts do?
• In collaboration with the charity Global Action Plan, Barts Health NHS Trust has worked with localboroughs to reduce staff and patients’ exposure to air pollution and to reduce carbon and airpollution emissions.
• The Barts Health Cleaner Air Programme has focused on five core areas: clinical engagement(doctors and pharmacists), active travel, reducing community-based emissions through domestichousing, reducing hospitals’ impact through fleet emissions, and protecting patients in high-riskgroups (such as those with COPD).
• An example of the programme’s outputs is a leaflet entitled 3 easy ways to reduce your contactwith air pollution… (co-designed with patients; Fig 23), which is freely available in clinics and localpharmacies.
• The seven partners in this programme are Barts Health NHS Trust, City of London Corporation,Waltham Forest Council, Newham Council, Tower Hamlets Council, the Greater London Authority,and delivery partner Global Action Plan. The programme is financed by the partners as well as bythe Mayor’s Air Quality Fund and Defra.
A big difference could be made if more trusts instigated activities like this, because the scale andactivities of the NHS mean that it has a huge environmental impact.
In addition to local initiatives such as that described above, the NHS is very actively promotingsustainability in its operations through, for example, the outputs of its Sustainable Development Unit(www.sduhealth.org.uk/).
7 Changing our future
© Royal College of Physicians 2016 99

Every breath we take: the lifelong impact of air pollution
100 © Royal College of Physicians 2016
Fig 23. Information packs developed as part of the Barts Health Cleaner Air Programme. Maps providedby King’s College London; photographs reproduced with permission from Global Action Plan, for theWaltham Forest Pharmacy Intervention.
7.8 References
1 Rayner G, Lang T. Ecological public health: reshaping the conditions for good health. Abingdon: Routledge, 2012.
2 Steffen W, Crutzen PJ, McNeill JR. The Anthropocene: are humans now overwhelming the great forces of nature?Ambio 2007;36:614–21.
3 Rockström J, Steffen W, Noone K et al. Planetary boundaries: exploring the safe operating space for humanity. EcolSoc 2009;14:32.
4 Air Quality Expert Group. Air quality and climate change: a UK perspective. London: Defra, 2007. http://uk-air.defra.gov.uk/assets/documents/reports/aqeg/fullreport.pdf [Accessed 21 December 2015].
5 Reis S, Grennfelt P, Klimont Z et al. Policy Forum: From acid rain to climate change. Science 2012;338:1153–4.
6 Morris GP, Reis S, Beck S et al. Climate change and health in the UK. Scoping and communicating the longer-term‘distal’ dimensions. Living with Environmental Change: Climate Change and Health Report Card, technical paper no10. Swindon: Natural Environment Research Council, 2015. www.nerc.ac.uk/research/partnerships/lwec/products/report-cards/health/papers/source10/ [Accessed 22 December 2015].
7 Intergovernmental Panel on Climate Change. Climate change 2013: the physical science basis. Working Group Icontribution to the fifth assessment report of the Intergovernmental Panel on Climate Change. Cambridge:Cambridge University Press, 2013. www.climatechange2013.org/report/ [Accessed 21 December 2015].
8 Anderson K, Bows A. Beyond ‘dangerous’ climate change: emission scenarios for a new world. Phil Trans R Soc A2011;369:20–44.
9 New M. Four degrees and beyond: the potential for a global temperature increase of four degrees and its implications.Phil Trans R Soc A 2011;369:6–19.
10 Thornton PK, Jones PG, Ericksen PJ, Challinor AJ. Agriculture and food systems in sub-Saharan Africa in a 4°C+world. Phil Trans R Soc A 2011;369:117–36.
11 Fung F, Lopez A, New M. Water availability in +2°C and +4°C worlds. Phil Trans R Soc A 2011;369:99–116.
12 Kelfkens G, Bregman A, de Gruijl FR et al. Ozone layer–climate change interactions. Influence on UV levels and UVrelated effects. Global Change NOP–NRP report 2002. Netherlands: RIVM, 2002. www.rivm.nl/bibliotheek/digitaaldepot/410200112_main_report.pdf [Accessed 21 May 2014].
13 Gao W, Schmoldt DL, Slusser JR (eds). UV radiation in global climate change: measurements, modeling and effects onecosystems. Berlin: Springer-Verlag, 2010.
14 Intergovernmental Panel on Climate Change. Climate change 2014: impacts, adaptation, and vulnerability. Summaryfor policymakers. Working Group II contribution to the fifth assessment report climate change of the 2014Intergovernmental Panel on Climate Change. Cambridge: Cambridge University Press, 2014. www.ipcc-wg2.gov/AR5/[Accessed 2 February 2015].
15 Neira M. Climate change: an opportunity for public health. WHO Department of Public Health, Environmental andSocial Determinants of Health, 2014. www.who.int/mediacentre/commentaries/climate-change/en/ [Accessed 14 May2015].
16 Vardoulakis S, Heaviside C (eds). Health effects of climate change in the UK 2012: current evidence, recommendationsand research gaps. London: Health Protection Agency, 2012. www.gov.uk/government/uploads/system/uploads/attachment_data/file/371103/Health_Effects_of_Climate_Change_in_the_UK_2012_V13_with_cover_accessible.pdf[Accessed 21 December 2015].
17 Adger WN, Eakin H, Winkels A. Nested and teleconnected vulnerabilities to environmental change. Front Ecol Environ2009;7:150–7.
18 Holland M, Amann M, Heyes C et al. Technical policy briefing 6: The reduction in air quality impacts and associatedeconomic benefits of mitigation policy. Summary of results from the EC RTD ClimateCost Project. In Watkiss P (ed),2011. The ClimateCost Project. Final Report. Volume 1: Europe. Stockholm: Stockholm Environment Institute, 2011.www.climatecost.cc/images/Policy_Brief_master_REV_WEB_medium_.pdf [Accessed 21 December 2015].
19 World Health Organization. HRAPIE: Health risks of air pollution in Europe – HRAPIE project. Recommendations forconcentration–response functions for cost–benefit analysis of particulate matter, ozone and nitrogen dioxide. Bonn: WHO,2013. www.euro.who.int/en/health-topics/environment-and-health/air-quality/publications/2013/health-risks-of-air-pollution-in-europe-hrapie-project-recommendations-for-concentrationresponse-functions-for-costbenefit-analysis-of-particulate-matter,-ozone-and-nitrogen-dioxide/ [Accessed 15 December 2015].
20 Holland M. Cost–benefit analysis of final policy scenarios for the EU Clean Air Package (corresponding to IIASA TSAP
7 Changing our future
© Royal College of Physicians 2016 101

Every breath we take: the lifelong impact of air pollution
report no 11). Report to European Commission DG Environment, 2014. http://ec.europa.eu/environment/air/pdf/TSAP%20CBA.pdf [Accessed 21 December 2015].
21 Balbus JM, Greenblatt JB, Chari R, Millstein D, Ebi KL. A wedge-based approach to estimating health co-benefits ofclimate change mitigation activities in the United States. Clim Change 2014;127:199–210.
22 The World Bank. Health expenditure, total (% of GDP). Washington, DC: The World Bank, 2013.http://data.worldbank.org/indicator/SH.XPD.TOTL.ZS [Accessed 14 January 2016].
23 National Institute for Health Research. NIHR carbon reduction guidelines. London: NIHR, 2014.www.nihr.ac.uk/policy-and-standards/nihr-carbon-reduction-guidelines.htm [Accessed 21 December 2015].
24 Sustainable Development Unit. Carbon footprint update for NHS in England 2012. Cambridge: SustainableDevelopment Unit, 2013. www.sduhealth.org.uk/documents/Carbon_Footprint_summary_NHS_update_2013.pdf[Accessed 21 December 2015].
25 Tomson C. Reducing the carbon footprint of hospital-based care. Future Hosp J 2015;2:57–62.
102 © Royal College of Physicians 2016

© Royal College of Physicians 2016 103
Methodology
Background
Sir Richard Thompson, immediate past president of the Royal College of Physicians (RCP), initiallycontacted Professor Stephen Holgate to discuss the health effects of climate change; this later developedinto air pollution, with climate change as a sub-area of this, recognising new research that could informthe field. A working party, chaired by Professor Holgate, was set up to look at the topic of air pollutionand its effect on health across the lifecourse, including looking at the effects in utero.
Administration
The working party was led by the RCP. It was agreed that the report should be jointly owned by the RCPand the Royal College of Paediatrics and Child Health (RCPCH), owing to the aspects of child healththat are covered, as well as issues relating to later life.
• The working party was administered through the RCP Membership Support and Global EngagementDepartment.
• Production of the report was managed by the RCP Strategy, Communications and PolicyDepartment.
Meetings
The working party met as follows.
• One planning meeting to set out the aims and objectives of the report. This allowed planning prior tothe invitation of potential members of the working party, and was felt to be a good approach toensure that the report’s scope was available to share with potential members.
• Six meetings of the working party, which were each 3 hours long (plus an evidence-giving session ofan additional 2 hours). These meetings were formally led by the chair of the working party, with anagenda that covered the minutes of the previous meeting, the breakdown of the report, anddiscussions around chapter development and recommendations. The project initiation documentwas assessed at each meeting and updated accordingly. This was considered to be a robust approachto ensure that all relevant areas were covered adequately and discussed. Members of RCP staff wereinvited to provide input on policy, recommendation setting and good publication practice.
• Sub-meetings were set up on an ad hoc basis, with attendance of the chair and vice chair fordiscussions around policy aspects, key recommendations and additional evidence. Additionalmeetings were held to ensure that policy aspects of the report could be discussed in detail with theRCP, and recommendations could be finalised.
The six meetings were well attended by working party members, with most members attending eachmeeting either in person or via teleconferencing. There was representation from both the RCP and theRCPCH at all meetings. Working party members / chapter authors were reminded at each meeting todisclose any potential new conflicts of interest. If members sent their apologies, written emails andupdates were circulated.

Every breath we take: the lifelong impact of air pollution
Drafting the report
Subgroups of the working party with the appropriate expertise were charged with the responsibility toproduce draft chapters, with additional working party members being co-opted as required to ensurethat individual subject areas were covered in detail, and that the report had full ownership from thosecontributing to each section. However, while recognising that specific expertise was important indeveloping and analysing the evidence, the working party functioned as an expert committee rather thana committee of experts. Each chapter was discussed in depth at the meetings of the working party. Thechapters were subsequently edited by the chair, Professor Stephen Holgate, to ensure coherence andconnectivity between the different chapters. Where chapters overlapped in content, authors workedtogether to avoid duplication.
It was felt that chapter authors would be best placed to develop recommendations; therefore, eachsubgroup was responsible for developing key recommendations from each chapter to take forward. Thesewere then assessed and edited by Ms Colleen Shannon, Professor Stephen Holgate, Mr Philip Insall andmembers of the RCP Strategy, Communications and Policy Department to ensure that the overarchingkey recommendations encapsulated the messages and views of the report.
RCP library staff conducted literature searches on the following topics: air pollution and development,air pollution and obesity, and long-term effects of air pollution. In each case, the Medline database wassearched using MeSH and the title and abstract fields. The search strategies used in each case areavailable on request.
The addition of a professional healthcare writer was felt to be beneficial, to allow chapters to besummarised succinctly for a non-specialist audience. Ms Colleen Shannon was commissioned to developaccessible summaries of each chapter and the executive summary, and to work with authors in draftingrecommendations. The summaries of each chapter feature in the main report and in a shorter, publiclyaccessible version of the report. It was felt this would help non-specialist readers to understand the keymessages from each chapter.
Evidence
Evidence was gathered by selecting individuals/organisations that are key in the area of air pollution andrelated health issues. The RCP wrote to organisations and relevant individuals, requesting evidence. Mostrequests were for written evidence, as it was felt that this would give organisations the opportunity tosubmit evidence and position statements for incorporation into the report.
The relevance of the evidence to the report was assessed by the working party at its meetings. Allevidence has been incorporated into the report in some format.
Most evidence was received as written submissions.1 We had one oral evidence-giving session from MrPhilip Insall (formerly at Sustrans). Mr Insall was subsequently co-opted onto the working party.
Many of the submissions received contained both evidence-based and consensus views fromorganisations. The evidence referenced large studies in the field of air quality and health, and individualcase studies.1 Some submissions received were organisational statements in this area based on currentevidence.
104 © Royal College of Physicians 2016
Evidence submitted to the report can be viewed on the RCP website.1 This was seen to be a beneficialsource to readers. Permissions were gained from evidence givers; if permission was not granted, theevidence is not provided online, but instead referenced in the report.
Consultation
Around 80 stakeholder organisations were identified. Many had already been involved with the report inthe evidence-giving stage. The organisations were considered to be key in the area of air pollution andrelated health issues, and were from both the private and the public sectors.
The draft report, without recommendations, was sent to these stakeholders, giving them 4 weeks tocomment and, in particular, to identify any omissions or inaccuracies. Stakeholders were also asked whatthey believed the main recommendations of the report should be.
Members of the working party considered the stakeholder feedback and made decisions about how thereport should be amended, editing the report accordingly. Each amended section was approved by theworking party chair.
The final text of the report was approved by the RCP Council and the RCPCH Executive Committee.
1 Royal College of Physicians. Every breath we take: the lifelong impact of air pollution. Report of a working party.London: RCP, 2016. www.rcplondon.ac.uk/projects/outputs/every-breath-we-take-lifelong-impact-air-pollution[Accessed 21 December 2015].
© Royal College of Physicians 2016 105
Methodology

106 © Royal College of Physicians 2016
Acknowledgements
The RCP and RCPCH would like to acknowledge with thanks the following people and organisations fortheir contribution to the evidence that informs this report:
• Dr Abigail Whitehouse, clinical research fellow, Blizard Institute, Barts and The London School ofMedicine and Dentistry
• Amy Smullen, policy officer, British Heart Foundation• Fiona Osgun, health information officer, Cancer Research UK• Gavin Thomson, healthy air campaigner, ClientEarth• Emma Ryland, geriatric registrar and medical leadership fellow in patient safety, Leeds Teaching
Hospitals NHS Trust• Caroline Watson, partner, Global Action Plan• Annette Figueiredo, senior civil servant, Greater London Authority• Anne Stauffer, deputy director, Health and Environment Alliance (HEAL)• Abid Shah, clinical effectiveness manager, Royal College of Obstetrics and Gynaecology• Professor Derek Bell, president, Royal College of Physicians of Edinburgh• Robert Walker, senior technical manager – Environment, Public Policy and Vehicle Legislation
Department, Society of Motor Manufacturers and Traders (SMMT)• Philip Insall on behalf of Sustrans, now director of Insall and Coe active travel consulting• Hannah Graff, senior policy researcher, UK Health Forum• Dr Penny Woods, CEO, British Lung Foundation.

The lifelong impact of air pollution
Every breathwe take
The lifelong impact of air pollution
Every breath we take
Every breath we take
The lifelong impact of air pollution
Royal College of Physicians
Report of a working partyFebruary 2016
ISBN 978-1-86016-567-2 eISBN 978-1-86016-568-9
Royal College of Physicians 11 St Andrews Place Regent’s Park London NW1 4LE
www.rcplondon.ac.uk
Air_pollution_jacket_artwork_OUTER.indd 1 05/02/2016 14:34