impact of evapotranspiration on dry season climate...
TRANSCRIPT
Impact of Evapotranspiration on Dry Season Climate in the Amazon Forest*
ANNA HARPER
College of Engineering, Mathematics, and Physical Sciences, University of Exeter, Exeter, Devon, United Kingdom,
and Department of Atmospheric Science, Colorado State University, Fort Collins, Colorado
IAN T. BAKER, A. SCOTT DENNING, DAVID A. RANDALL, DONALD DAZLICH, AND MARK BRANSON
Department of Atmospheric Science, Colorado State University, Fort Collins, Colorado
(Manuscript received 30 January 2013, in final form 30 August 2013)
ABSTRACT
Moisture recycling can be an important source of rainfall over the Amazon forest, but this process relies
heavily upon the ability of plants to access soil moisture. Evapotranspiration (ET) in the Amazon is often
maintained or even enhanced during the dry season, when net radiation is high. However, ecosystem
models often over predict the dry season water stress. The authors removed unrealistic water stress in an
ecosystem model [the Simple Biosphere Model, version 3 (SiB3)] and examined the impacts of enhanced
ET on the dry season climate when coupled to a GCM. The ‘‘stressed’’ model experiences dry season water
stress and limitations on ET, while the ‘‘unstressed’’ model has enhanced root water access and exhibits
strong drought tolerance.
During the dry season in the southeastern Amazon, SiB3 unstressed has significantly higher latent heat flux
(LH) and lower sensible heat flux (SH) than SiB3 stressed. There are two competing impacts on the climate in
SiB3 unstressed: cooling resulting from lower SH andmoistening resulting from higher LH. During the average
dry season, the cooling plays a larger role and the atmosphere is more statically stable, resulting in less pre-
cipitation than in SiB3 stressed. During dry season droughts, significantly higher LH in SiB3 unstressed is
a necessary but not sufficient condition for stronger precipitation. Themoistening effect of LH dominates when
the Bowen ratio (BR 5 SH/LH) is .1.0 in SiB3 stressed and precipitation is up to 26% higher in SiB3 un-
stressed. An implication of this analysis is that forest conservation could enable theAmazon to copewith drying
conditions in the future.
1. Introduction
The Amazon forest stores huge amounts of carbon in
its biomass (Saatchi et al. 2007, 2011), but its future is
uncertain because of the combined threats of climate
change and deforestation (Nepstad et al. 2008;Malhi et al.
2008). Recent Amazonian droughts have led to decreases
in biomass (Phillips et al. 2009; Lewis et al. 2011; Toomey
et al. 2011) and increases in tree mortality (Phillips et al.
2010), and several GCMs predict reduced dry season
precipitation throughout the twenty-first century (Malhi
et al. 2008). Amazon droughts are linked to variability in
the tropical Atlantic and Pacific sea surface temperatures
(Liebmann andMarengo 2001; Marengo 2004; Chen et al.
2011). An anomalously warm tropical North Atlantic
displaces the intertropical convergence zone (ITCZ)
northward (Marengo et al. 2011), which weakens the
trade winds, reduces water vapor transport, and increases
subsidence above the central and southern Amazon
(Espinoza et al. 2011). In effect, these meteorological
changes lengthen the dry season, and data from theGlobal
Precipitation Climatology Centre suggest that dry seasons
have become longer since the 1990s (Marengo et al. 2011).
El Ni~no events are associated with drought in the north-
eastern Amazon (Ropelewski and Halpert 1987; Chen
et al. 2011) and large-scale subsidence due to a shift in the
Walker circulation (Malhi and Wright 2004). Two recent
* Supplemental information related to this paper is available at
the Journals Online website: http://dx.doi.org/10.1175/JCLI-D-13-
00074.s1.
Corresponding author address:AnnaHarper, Laver Building, North
Park Road, University of Exeter, Exeter, Devon EX4 4QE, United
Kingdom.
E-mail: [email protected]
574 JOURNAL OF CL IMATE VOLUME 27
DOI: 10.1175/JCLI-D-13-00074.1
� 2014 American Meteorological Society
severe droughts (in 2005 and 2010) attracted attention
because of their severity and ecological impacts. Both
droughts were linked to an anomalously warm tropical
North Atlantic (Marengo et al. 2008b; Espinoza et al.
2011), a pattern that is predicted to continue or perhaps
increase (Cox et al. 2008). In 2005, drought coincided
with the dry season and resulted in significant biomass
reductions (Aragao et al. 2008; Zeng et al. 2008; Phillips
et al. 2009) related to both heat and moisture stress
(Toomey et al. 2011). The severe drought in 2010 affected
a larger area, negatively impacted biomass (Lewis et al.
2011), and resulted in widespread declines in vegetation
greenness (Xu et al. 2011). This drought was preceded by
an El Ni~no, which limited wet season precipitation and
contributed to the severity of the drought (Marengo et al.
2011).
During a drought, plants may close their stomata to
limit water loss (Fisher et al. 2006), which can lead to
mortality as the plants cease to assimilate carbon.
Whether plant stomata remain open or closed during
a drought also impacts the latent heat flux (LH) between
the land and atmosphere. On average, moisture recycling
due to evaporation from the land surface contributes
between one-quarter and one-third of the precipitation
over the Amazon, although this number varies in space
and time (Eltahir and Bras 1994; Trenberth 1999).
Evapotranspiration (ET) serves as a significant source of
precipitation (Spracklen et al. 2012), and loss of forest
cover has been linked to drying in the southern Amazon
over the past 30 years (Lee et al. 2011). Moisture re-
cycling can impact dry season climate by affecting the
timing of the wet season onset (Fu and Li 2004; Li and
Fu 2004). Prior to the transition from dry to wet season,
surface LH increases the atmosphere’s convective avail-
able potential energy (CAPE) and decreases convective
inhibition energy (CINE). These processes increase
rainfall and initiate the transition period (Fu andLi 2004).
When the land surface is anomalously dry, LH is lower
and sensible heat (SH) is higher than average. CINE re-
mains high and the wet season onset is delayed (Fu and Li
2004).
If stomatal conductance is severely limited during
a drought, reduced ET could reduce moisture recycling
and reinforce drought conditions. This is a positive
feedback on drought, analogous to the delayed wet
season onset described by Fu and Li (2004). Conversely,
plants can maintain or even increase transpiration dur-
ing the dry season (Nepstad et al. 1994; Oliveira et al.
2005; Lee et al. 2005; Hasler and Avissar 2007; da Rocha
et al. 2009; Costa et al. 2010). Because of the presence of
deep roots and ample soil moisture, ET in the equatorial
Amazon is tightly coupled to net radiation, which is
higher during the dry season (Hasler and Avissar 2007).
Moving south, the seasonality of precipitation increases,
as does the potential for water stress during the dry
season. As a result, ET can be higher in the dry season
(Costa et al. 2010; Vourlitis et al. 2011) or the wet season
(Costa et al. 2010; daRocha et al. 2009; Lathuilliere et al.
2012), depending on several factors such as vegetation
type, dry season intensity, and depth to the water table.
For example, in the southern Amazon, surface resistance
can be twice as high during the dry season compared to
the wet season (Costa et al. 2010), contributing to lower
dry season ET.
It is unknown how long into a drought the trees are
able to maintain predrought photosynthesis and tran-
spiration rates, but the immediate impacts of the 2005
drought possibly included enhanced vegetation green-
ness (which implies increased transpiration) (Saleska
et al. 2007), although a subsequent study asserted that
forest ‘‘green up’’ did not occur (Samanta et al. 2010).
Satellite-based microwave retrievals based on improved
algorithms during the 2005 drought suggest a 3-month
lag in the forest response to water deficits in the western
Amazon, although the response was concurrent with the
greatest water deficits in the northeastern Amazon
(Saatchi et al. 2013). If plants continue to transpire
during a drought, this could reduce the severity of the
drought through moisture recycling. Evidence of this
phenomenon has been observed during the wet season
onset, such that when the land surface is wet, the en-
hanced LH can enable an earlier transition (although
large-scale circulation can counteract this) (Fu and Li
2004).
Modeling studies of Amazon climate are essential for
preparing for possible future climate and land cover
scenarios, and it is equally important to accurately cap-
ture the impacts of ET on dry season rainfall. Models that
do not allow plants to access adequate soil moisture
during the dry season will overestimate the dry season
Bowen ratio (BR 5 SH/LH) and are more likely to in-
duce the positive feedback cycle above. Recent devel-
opments in the Simple Biosphere Model, version 3
(SiB3), focused on accurately representing soil water
stress in the Amazon. Previously, SiB predicted water
limitations on photosynthesis and transpiration during
the dry season. When coupled to a GCM [affectionately
known as the Beautiful General Circulation Modeling
System (BUGS) at Colorado State University], reduced
ET severely limited precipitation above the Amazon
(Randall et al. 1996). Changes to SiB3’s soil and roots
enabled the trees to transpire through the dry season,
increased LH, reduced SH, and impacted the local cli-
mate (Baker et al. 2008; Harper et al. 2010). SiB3 can
realistically simulate seasonal cycles of LH, SH, and net
ecosystem exchange at a handful of sites in the Amazon
15 JANUARY 2014 HARPER ET AL . 575
[Tapajos K83 in Baker et al. (2008); Manaus, Tapajos
K67, K83, Reserva Jaru, and Pe de Gigante in Baker
et al. (2013); and Tapajos K67, K83, and Caxiuana in
Harper et al. (2013, manuscript submitted to J. Geophys.
Res. Biogeosci.)].
The aim of the present study is to examine the impacts
of increased ET on the dry season climate in the Ama-
zon, using SiB3 coupled to the GCM BUGS, version 5
(BUGS5). The standard version of SiB3 represents
a strongly drought resistant forest, as it includes pro-
cesses documented as important for soil moisture access
in the tropical forests of South America (Baker et al.
2008, 2013; Harper et al. 2013, manuscript submitted to
J. Geophys. Res. Biogeosci.). We use a second version of
SiB3 that does not include these adaptations and pro-
duces unrealistic dry season water stress. The standard
version is called SiB3 unstressed (SiB3U), and the latter
model is SiB3 stressed (SiB3S). We hypothesize that
SiB3 stressed will produce the positive feedback ad-
dressed above (reduced dry season ET reinforcing dry
conditions and further reducing precipitation). The
methods of the study are outlined in section 2, and the
overall performance of the BUGS5model is discussed in
section 3, with special attention on South American
climate. In section 4, we assess the impacts on the dry
season climate of two extreme representations of forest
drought resistance.
2. Methods
a. SiB3
SiB3 simulates biophysical processes and ecosystem
metabolism (Sellers et al. 1986; Denning et al. 1996;
Sellers et al. 1996a,b; Baker et al. 2008). Carbon assimi-
lation accounts for enzyme kinetics (Farquhar et al. 1980)
and is linked to stomatal conductance (Collatz et al. 1991,
1992). The model simulates the turbulent exchange of
CO2, moisture, heat, and momentum between the free
atmosphere and a prognostic canopy air space (Vidale
and Stockli 2005). The surface hydrology scheme consists
of water intercepted by the canopy, the ground, and a 10-
layer soil model. Vertical movement of soil moisture is
governed byDarcy’s law, and themodel has 10 soil layers
that become thicker with depth. Runoff can occur as
a result of subsurface drainage out of the lowest layer or
resulting from excess overland flow when incoming
rainfall cannot infiltrate the top layer. SiB3’s ET is the
sum of canopy transpiration and evaporation from pud-
dles, the top soil layer, and the canopy. Themodifications
to SiB3 stressed alter the stomatal conductance; there-
fore, differences in the canopy transpiration dominate the
model differences in ET. In the coupling with the GCM,
ET is converted to latent heat flux from the canopy air
space to themixed layer (which is the lowestGCM level).
The leaf area index (LAI) and fraction of photosyn-
thetically active radiation (fPAR) are calculated from
the normalized difference vegetation index (NDVI)
from the Advanced Very High-Resolution Radiometer
4-km global area coverage data (Tucker et al. 2005).
Each grid cell is assigned one biome type for the entire
simulation period (Sellers et al. 1996b); therefore, there
is no land use change in the experiments. Grid cells in
the Amazon forest are designated as tropical broadleaf
evergreen forest, and NDVI is held constant at the
maximum value during the measurement period. The
use of a constant NDVI avoids known errors in the re-
motely sensed vegetation index because of cloud and
aerosol contamination (Los et al. 2000; Hilker et al.
2012; Samanta et al. 2012). The parameter fPAR is
a strong determinant of model potential photosynthesis
and transpiration rates, and it saturates above an LAI of
4m2m22. Therefore, the constant NDVI introduces
only minor errors in regions with high LAI, as is the case
in much of the Amazon basin (Myneni et al. 2007;
Malhado et al. 2009; Miller et al. 2004). However, sem-
ideciduous forests are common in the transition zone
between the evergreen tropical forests and savannas,
and in these regions LAI can display strong seasonality.
For example, LAI varies from 2–2.5m2m22 during
the dry season to 5–6m2m22 during the wet season at
a site northeast of Sinop, Mato Grosso (11824.750S,55819.500W) (Vourlitis et al. 2011). In these regions, SiB3
will likely overestimate dry season ET as a result of the
constant LAI and fPAR.
SiB3 constrains the net ecosystem exchange (NEE) of
CO2 to be roughly zero each year, since the model does
not include dynamic vegetation or biomass storage and
cannot accumulate or lose carbon. NEE is not exactly
zero because the respiration is based on the previous
year’s assimilation. Soil texture is based on maps from
the International Geosphere–Biosphere Programme
(IGBP; Global Soil Data Task Group 2000).
Potential photosynthesis in SiB3 is linearly weighted
by three stress factors to give the actual photosynthetic
rate. The three factors range from 0.1 (maximum stress)
to 1 (no stress) and parameterize the impacts of less than
optimal temperature, humidity, and soil moisture on the
gross carbon assimilation (Sellers et al. 1992, 1996a).
The modifications in SiB3 stressed relate to the soil
moisture stress, which at strong water deficits can induce
stomatal closure and reduce transpiration and photo-
synthesis. There are three differences between SiB3
stressed and unstressed (Table 1). First, the soil is 3.5-m
deep in SiB3S and 10-m deep in SiB3U. Root depths
vary by biome and density decreases exponentially with
576 JOURNAL OF CL IMATE VOLUME 27
depth (Jackson et al. 1996). Roots extend through the
entire soil column in both versions in the tropical
broadleaf evergreen biome. Second, roots in SiB3U
are able to access soil moisture wherever it is in the
soil column, regardless of root biomass (Baker et al.
2008). This emphasizes the role of deep roots in effi-
ciently accessing soil moisture. In SiB3S, root water
extraction is weighted by biomass, which emphasizes
the shallow soil layers over the deep layers. Third,
the dependence of soil moisture stress on the volu-
metric water content is revised, such that SiB3U ex-
periences less stress atmoderate soil moisture reductions.
For further details of these changes see Baker et al.
(2008).
b. BUGS5
BUGS5 has evolved from the University of Cal-
ifornia, Los Angeles (UCLA), GCM to include a geo-
desic grid and modified sigma coordinate (Suarez et al.
1983; Randall et al. 1985; Ringler et al. 2000) (http://
kiwi.atmos.colostate.edu/BUGS/BUGSoverview.html).
The planetary boundary layer (PBL) depth changes are
due to horizontal mass flux divergence, entrainment,
and convective mass flux. The entrainment rate is pre-
dicted by integrating the turbulent kinetic energy (TKE)
conservation equation over the depth of the PBL
(Denning et al. 2008). BUGS5 uses a modifiedArakawa–
Schubert cumulus parameterization with a prognostic
cumulus kinetic energy (Ding and Randall 1998; Pan
and Randall 1998), which relaxes the quasi-equilibrium
closure of the model’s original Arakawa–Schubert pa-
rameterization. The stratiform parameterization in-
cludes prognostic variables for cloud water, cloud ice,
rain, snow, and water vapor (Fowler et al. 1996) and is
directly coupled to the cumulus parameterization. The
microphysical parameterization follows Fowler and
Randall (2002). The radiation scheme is adopted from
theNational Center for Atmospheric Research (NCAR)’s
Community Atmosphere Model (CAM), which uses
a 2-streammethod for calculating broadband and heating
rates in the shortwave and longwave and accounts for
infrared scattering (Gabriel et al. 2001; Stephens et al.
2001).
The dynamical core is based on a spherical geodesic
grid (Ringler et al. 2000), which solves the vorticity and
divergence equations with second-order accuracy. The
model resolution is 10 242 grid cells, which yield an av-
erage cell area of 4.98 3 1024 km2 (for comparison a
2.58 3 2.58 grid has 10 368 grid cells). BUGS and an
earlier version of SiB3 (SiB2) were initially coupled
in the early 1990s (Randall et al. 1996; Denning et al.
1996), and SiB3 was tested in a single column version of
BUGS5 (Harper et al. 2010). In the present study, we
ran SiB3U and SiB3S coupled to BUGS5 with observed
SSTs from 1997 to 2006. The SSTs are from the Program
for Climate Model Diagnosis and Intercomparison
(PCMDI) as part of the Atmospheric Model Inter-
comparison Project (AMIP) Phase II (Taylor et al. 2000;
Hurrell et al. 2008). We ran five 10-yr ensembles of each
version of the model, each initialized with a restart file
from a previous, spunup AMIP-style run created in the
first 5 days of 1997 (ensemble 1 begins with the 1 January
restart, ensemble 2 begins with the 2 January restart,
etc.). The biome maps for SiB3 are identical for the two
runs; therefore, the only differences are the changes in
Table 1.
c. Datasets and analysis
A number of datasets are used for comparison with
model results. First, the National Centers for Environ-
mental Prediction–U.S. Department of Energy (NCEP–
DOE) Reanalysis, version 2 (NCEP2; Kalnay et al.
1996), was provided by the National Oceanic and At-
mospheric Administration (NOAA) Earth System Re-
search Laboratory’s Physical Sciences Division (from
their website at http://www.esrl.noaa.gov/psd/).We limit
our use of NCEP2 to the observation-based variables air
temperature, relative humidity, vertical velocity v, and
geopotential height. Precipitation is from the Global
Precipitation Climatology Project (GPCP) version 2.1
(Adler et al. 2003), and the outgoing longwave radiation
(OLR) is from the Earth’s Radiation Budget Experi-
ment (ERBE), which based OLR on observations from
the Earth’s Radiation Budget Satellite and theNOAA-9
and NOAA-10 satellites from February 1985 to April
1989. (ERBE data were accessed at http://www2.cgd.
ucar.edu.) The NCAR command language (NCL 2013)
was used for much of the analysis (e.g., significance
testing) and plotting. Statistical significance of differ-
ences between the models is determined with two-
tailed Student’s t test. If the returned probability is less
than 0.05, we reject the null hypothesis that the means
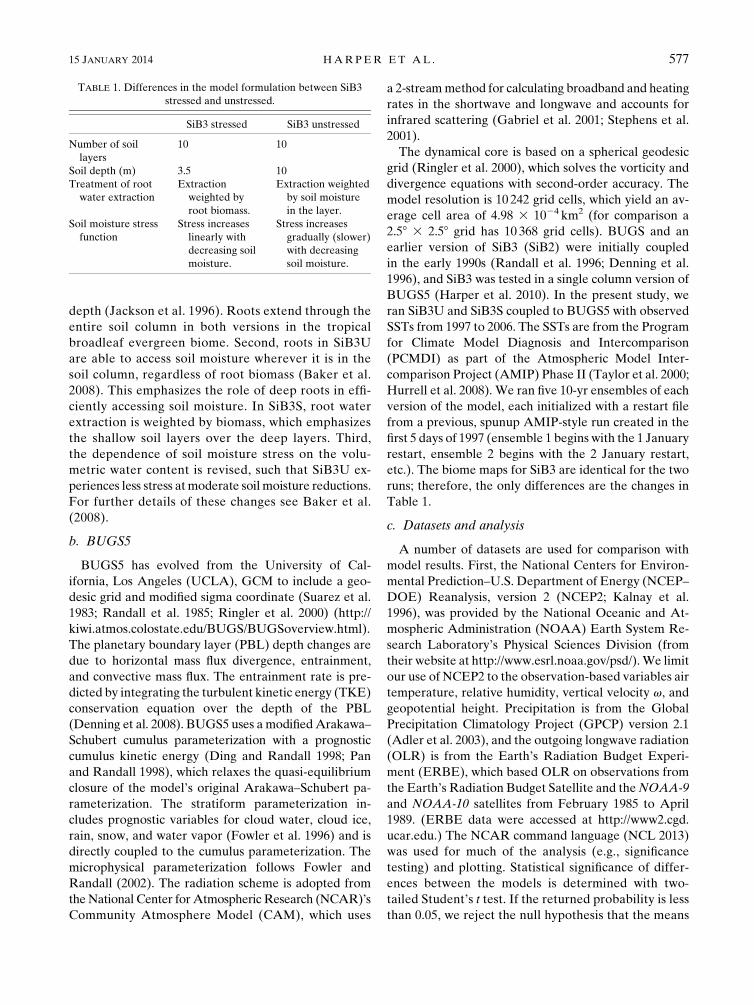
TABLE 1. Differences in the model formulation between SiB3
stressed and unstressed.
SiB3 stressed SiB3 unstressed
Number of soil
layers
10 10
Soil depth (m) 3.5 10
Treatment of root
water extraction
Extraction
weighted by
root biomass.
Extraction weighted
by soil moisture
in the layer.
Soil moisture stress
function
Stress increases
linearly with
decreasing soil
moisture.
Stress increases
gradually (slower)
with decreasing
soil moisture.
15 JANUARY 2014 HARPER ET AL . 577
are from the same population; hence, the differences
are significant.
To diagnose behavior during dry season droughts, we
first computed an area-averaged time series of pre-
cipitation from 98–148S, 508–608W, considering tropical
forest points only (see Fig. S1 in the supplementary
material; box in Fig. 3). This region contains the largest
differences in surface fluxes between SiB3 stressed and
unstressed, and it encompasses the transition between
the humid tropical forests and the more arid savannas.
Within this region, the dry season lasts from May
through September. The average seasonal cycle was
removed to avoid a seasonal bias when determining
drought months, and we applied a 5-month running
mean to remove short-lived precipitation anomalies.
The resultant anomaly time series is shown in Fig. S2 of
the supplemental material, and we defined dry season
droughts for each ensemble as austral winter months
[June–August (JJA)] with precipitation anomalies
,21. Composites of drought conditions in each en-
semble were then averaged together for analysis of
land–atmosphere interactions.
We also determined drought months using two well-
known drought indices: the standardized precipitation
index (SPI) (McKee et al. 1993; Taylor et al. 2012) and
the soil moisture anomaly (SMA) (e.g., Burke and
Brown 2008). The SPI was calculated by fitting a gamma
distribution to the precipitation time series in Fig. S1 and
standardizing the resultant time series. By definition, the
SPI3 is based on anomalies from the preceding 3 months
and highlights short-term droughts, while the SPI6 is
based on the previous 6 months and identifies longer-
term (but subannual) droughts. We calculated the SPI
for each ensemble and determined drought months
(during JJA only) as summarized in Table 2. The SMA is
directly related to the soil moisture stress felt by the
model:
SMA5 SM2SMc , (1)
where SM is the soil moisture content for the entire
rooting profile averaged over the preceding 12 months,
and SMc is the soil moisture climatology for the in-
dividual ensemble. The SMA was standardized, and
we defined droughts as months (during JJA) when the
SMA , 21.
3. Evaluation of BUGS5 climatology
a. Global climatology
The overall patterns of modeled climate agree well
with observations, and the global climate is roughly
similar in BUGS5 with SiB3U and SiB3S (Fig. S3 in the
supplementary material). In general, the model tends to
produce overvigorous precipitation at the expense of
growing high clouds, as indicated by globally high biases
in precipitation andOLR.During July, BUGS5 captures
observed patterns of global precipitation, but the global
mean is too high because of the overestimations in
tropical convergence zones (Fig. S3). Modeled OLR is
higher than the global observed average, indicating an
underestimation of cloud cover, especially for high
clouds. Previous work with BUGS showed the sensitiv-
ity of tropical rainfall to the parameter a in the cumulus
parameterization (Lin et al. 2000). The cloudmass flux is
inversely proportional to theffiffiffi
ap
(Pan and Randall
1998). This study uses the default value of a 5 108 but
a larger value might yield more realistic precipitation
throughout the tropics (Lin et al. 2000). Precipitable
water is also too high in most of the tropics (not shown).
Global-mean temperature is slightly higher in BUGS5
than in the NCEP2 reanalysis, mostly due to over-
estimation in subtropical dry zones (such as the Sahara
and Arabian Peninsula) and in the midlatitudes (recall
that SSTs are set by observed values). Many of the same
biases are seen in the January climatology (Fig. S4), and
the model performance during January is discussed in
the supplementary material.
b. Tropical South American climate
Observed annual precipitation has a maximum in the
northwestern Amazon (Fig. 1), and high annual rainfall
extends to the southeast through the South Atlantic
convergence zone. The models capture the mean pat-
tern of high annual rainfall in the northwest and lower
rainfall in the southeast. There is toomuch rainfall in the
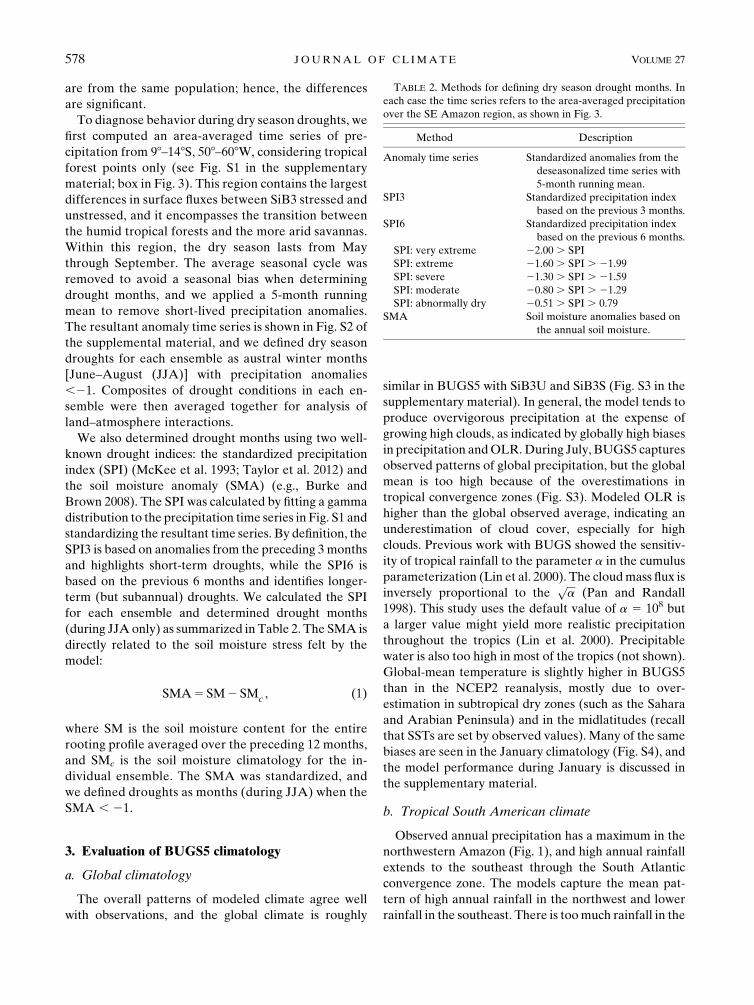
TABLE 2. Methods for defining dry season drought months. In
each case the time series refers to the area-averaged precipitation
over the SE Amazon region, as shown in Fig. 3.
Method Description
Anomaly time series Standardized anomalies from the
deseasonalized time series with
5-month running mean.
SPI3 Standardized precipitation index
based on the previous 3 months.
SPI6 Standardized precipitation index
based on the previous 6 months.
SPI: very extreme 22.00 . SPI
SPI: extreme 21.60 . SPI . 21.99
SPI: severe 21.30 . SPI . 21.59
SPI: moderate 20.80 . SPI . 21.29
SPI: abnormally dry 20.51 . SPI . 0.79
SMA Soil moisture anomalies based on
the annual soil moisture.
578 JOURNAL OF CL IMATE VOLUME 27
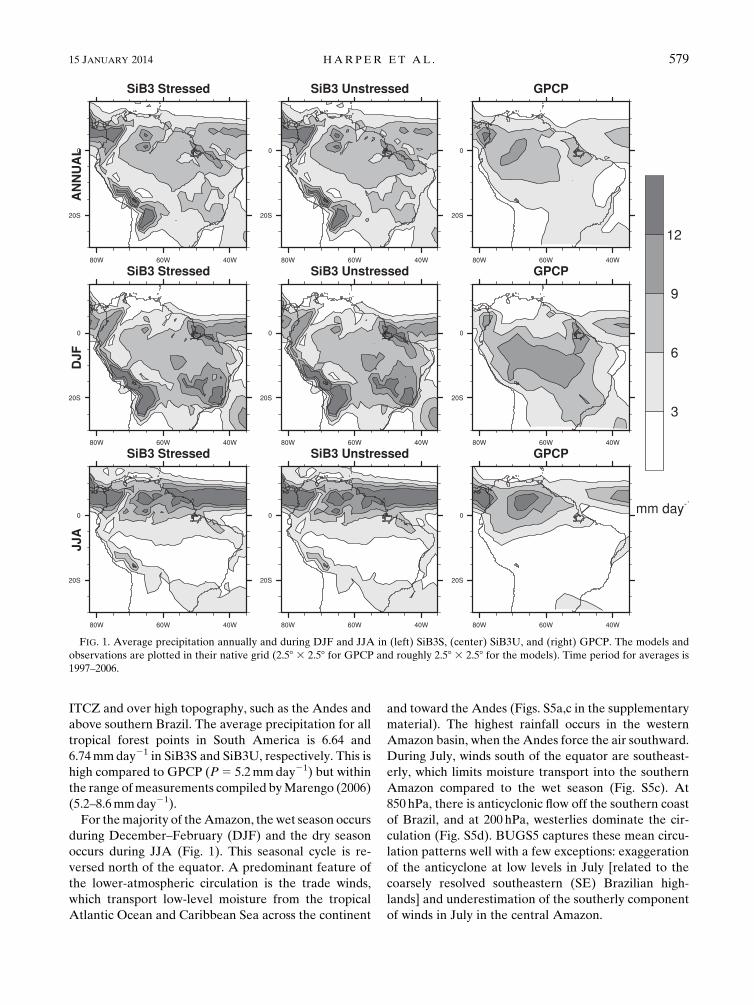
ITCZ and over high topography, such as the Andes and
above southern Brazil. The average precipitation for all
tropical forest points in South America is 6.64 and
6.74mmday21 in SiB3S and SiB3U, respectively. This is
high compared to GPCP (P5 5.2mmday21) but within
the range ofmeasurements compiled byMarengo (2006)
(5.2–8.6mmday21).
For themajority of theAmazon, the wet season occurs
during December–February (DJF) and the dry season
occurs during JJA (Fig. 1). This seasonal cycle is re-
versed north of the equator. A predominant feature of
the lower-atmospheric circulation is the trade winds,
which transport low-level moisture from the tropical
Atlantic Ocean and Caribbean Sea across the continent
and toward the Andes (Figs. S5a,c in the supplementary
material). The highest rainfall occurs in the western
Amazon basin, when the Andes force the air southward.
During July, winds south of the equator are southeast-
erly, which limits moisture transport into the southern
Amazon compared to the wet season (Fig. S5c). At
850 hPa, there is anticyclonic flow off the southern coast
of Brazil, and at 200 hPa, westerlies dominate the cir-
culation (Fig. S5d). BUGS5 captures these mean circu-
lation patterns well with a few exceptions: exaggeration
of the anticyclone at low levels in July [related to the
coarsely resolved southeastern (SE) Brazilian high-
lands] and underestimation of the southerly component
of winds in July in the central Amazon.
FIG. 1. Average precipitation annually and during DJF and JJA in (left) SiB3S, (center) SiB3U, and (right) GPCP. The models and
observations are plotted in their native grid (2.58 3 2.58 for GPCP and roughly 2.58 3 2.58 for the models). Time period for averages is
1997–2006.
15 JANUARY 2014 HARPER ET AL . 579
Average precipitation for South American tropical
forests has a similar seasonal cycle in both versions of
the model. These are controlled by the large-scale cir-
culation patterns described above. To better understand
precipitation biases in the model, we averaged seasonal
rainfall over two regions used in an analysis of models
from phase 5 of the Coupled Model Intercomparison
Project (CMIP5) (Yin et al. 2013): the southernAmazon
(SAma: 58–158S, 508–708W) and northern Amazon
(NAma: 58N–58S, 558–708W) (Fig. S6 in the supple-
mentary material). In the SAma, the models produce
dry biases of 2.6 and 2.4mmday21 (in SiB3 stressed and
unstressed, respectively) during the wet season (DJF)
and wet biases of 1.6 and 1.5mmday21 during the dry
season (JJA) (Fig. S6b). The JJA wet bias is in contrast
to the majority of the CMIP5 models, which mostly
produce a dry bias (Yin et al. 2013). Compared to the
European Centre for Medium-Range Weather Fore-
casts (ECMWF) Interim Re-Analysis (ERA-Interim),
the majority of CMIP5 models overestimate dry season
moisture divergence in the SAma, possibly related to an
overactive ITCZ and strong subsidence over the Ama-
zon. The two models without a dry season dry bias
[Hadley CentreGlobal EnvironmentalModel 2, Carbon
Cycle (HadGEM2-CC) and Hadley Centre Global En-
vironmental Model 2, Earth System (HadGEM2-ES)]
compensate for high moisture divergence by also having
high ET. Following themethodology in Yin et al. (2013),
we calculated moisture convergence as
MC5P2ET 1 DTWV, (2)
where DTWV is the monthly change in atmospheric
total water vapor. In the SAma, the BUGS5 model
demonstrates a similar trade-off between ET andMC as
the two Hadley Centre models (Fig. S7). In SiB3
stressed, ET is low andMC is near 0, meaning very small
moisture divergence. In SiB3 unstressed, ET is higher by
0.69mmday21, but P is slightly lower (by 0.04mmday21).
The excess water vapor originating from ET is trans-
ported away from the Amazon, and MC is more nega-
tive by 0.73mmday21. A similar result was found using
SiB3 stressed and unstressed coupled to a single column
version of BUGS5 (Harper et al. 2010).
In the NAma, observed rainfall is relatively high year-
round, but the driest (wettest) months are September–
November (SON) [March–May (MAM)] (Fig. S6). The
BUGS5 modeled seasonal cycle does not match obser-
vations: the driest (wettest) months occur during DJF
(SON) in BUGS5. Because of these high biases in the
northern Amazon, the focus of the remaining analysis is
on the southernAmazon.However, since themean state
of the dry season in the southern Amazon is too wet,
drought intensities and responses might be dampened in
these experiments.
4. Results
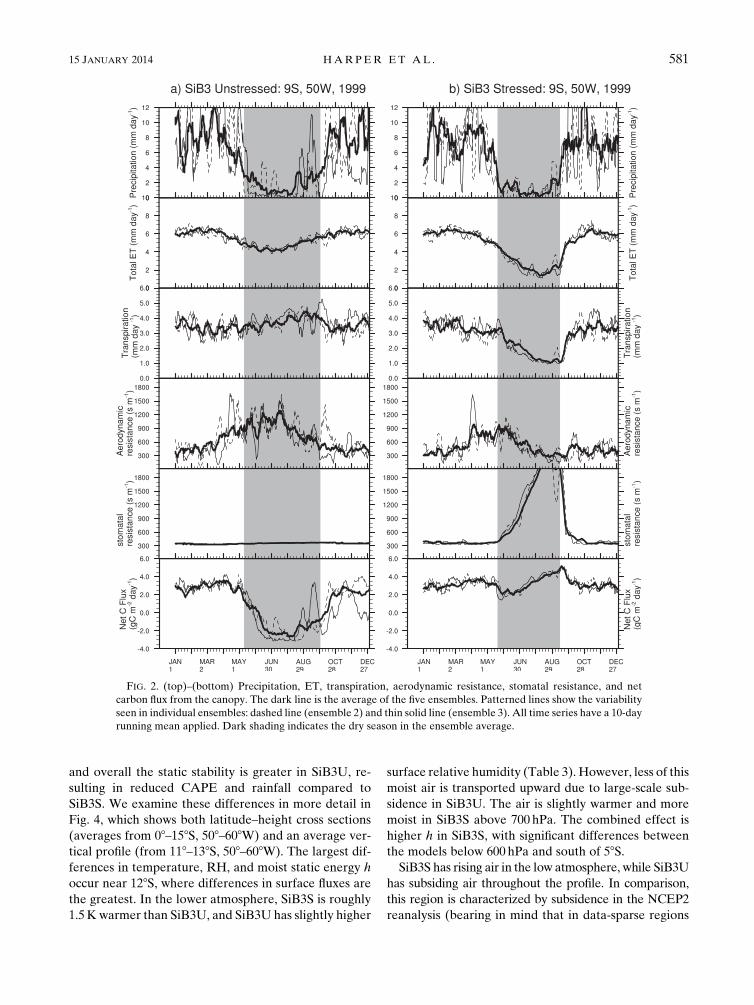
a. Impact of water stress on dry season fluxesand precipitation
Because of the changes in root zone biophysics (see
section 2a; Table 1), SiB3 unstressed avoids moisture-
related stress during the dry season. For illustrative
purposes, Fig. 2 shows daily averages from the two
versions of the model during 1999 at a point in the
southern Amazon. During the dry season, the stomatal
resistance is lower in SiB3 unstressed, leading to higher
rates of photosynthesis and transpiration and therefore
higher LH. Because the net surface energy must be
balanced, the higher LH results in lower SH. During
JJA, there are significant model differences in surface
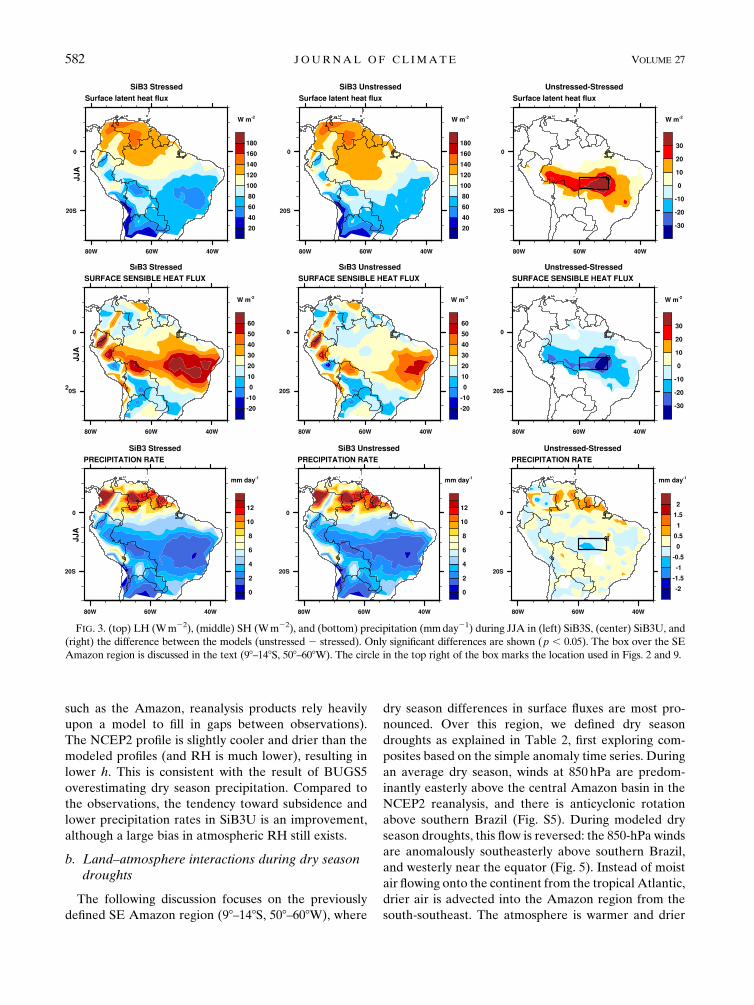
fluxes along the southern edge of the forest (Fig. 3).
We define the region with the largest model differ-
ences as the SE Amazon for the purpose of further
analysis (98–148S, 508–608W, tropical forest points only;
see box in Fig. 3). (Note that this region is different from
the SAma region in section 3.) The dry season is rela-
tively long and dry, lasting fromMay to September with
an average precipitation of 1.3–1.6mmday21 in the
models; therefore, the impact of enhanced soil water
access is greater than in regions with a less pronounced
dry season. Sensible heat flux in SiB3 stressed is more
than twice that from SiB3 unstressed (56 compared
to 27Wm22) (Table 3), and LH is on average 40%
higher in SiB3 unstressed, with the largest difference of
48Wm22. As mentioned in section 2a, LAI and fPAR
are prescribed at a constant value in SiB3 and are likely
overestimated during the dry season in this region. High
LAI could lead to overestimated ET, but this bias is
present in both versions of the model.
Enhanced LH could increase rainfall through moist-
ening and destabilizing the lower atmosphere (Fu and Li
2004). The model differences in precipitation are small
but significant (p , 0.05) (Fig. 3). On average, precip-
itation in the South American tropical forests is mar-
ginally greater in SiB3U (by 0.1mmday21). Within the
SE region, however, precipitation is greater in SiB3S
(JJAaverage 1.95 compared to 1.61mmday21 in SiB3U),
with the largest difference of 0.8mmday21.
Convective activity in the model depends on the at-
mospheric static stability. In SiB3U, enhanced surface
humidity decreases the static stability (because of more
latent heat in the low atmosphere), while cooler surface
temperatures from reduced SH increase stability. Dur-
ing the average dry season, the latter effect is greater,
580 JOURNAL OF CL IMATE VOLUME 27
and overall the static stability is greater in SiB3U, re-
sulting in reduced CAPE and rainfall compared to
SiB3S. We examine these differences in more detail in
Fig. 4, which shows both latitude–height cross sections
(averages from 08–158S, 508–608W) and an average ver-
tical profile (from 118–138S, 508–608W). The largest dif-
ferences in temperature, RH, and moist static energy h
occur near 128S, where differences in surface fluxes are
the greatest. In the lower atmosphere, SiB3S is roughly
1.5K warmer than SiB3U, and SiB3U has slightly higher
surface relative humidity (Table 3). However, less of this
moist air is transported upward due to large-scale sub-
sidence in SiB3U. The air is slightly warmer and more
moist in SiB3S above 700 hPa. The combined effect is
higher h in SiB3S, with significant differences between
the models below 600 hPa and south of 58S.SiB3S has rising air in the low atmosphere, while SiB3U
has subsiding air throughout the profile. In comparison,
this region is characterized by subsidence in the NCEP2
reanalysis (bearing in mind that in data-sparse regions
FIG. 2. (top)–(bottom) Precipitation, ET, transpiration, aerodynamic resistance, stomatal resistance, and net
carbon flux from the canopy. The dark line is the average of the five ensembles. Patterned lines show the variability
seen in individual ensembles: dashed line (ensemble 2) and thin solid line (ensemble 3). All time series have a 10-day
running mean applied. Dark shading indicates the dry season in the ensemble average.
15 JANUARY 2014 HARPER ET AL . 581
such as the Amazon, reanalysis products rely heavily
upon a model to fill in gaps between observations).
The NCEP2 profile is slightly cooler and drier than the
modeled profiles (and RH is much lower), resulting in
lower h. This is consistent with the result of BUGS5
overestimating dry season precipitation. Compared to
the observations, the tendency toward subsidence and
lower precipitation rates in SiB3U is an improvement,
although a large bias in atmospheric RH still exists.
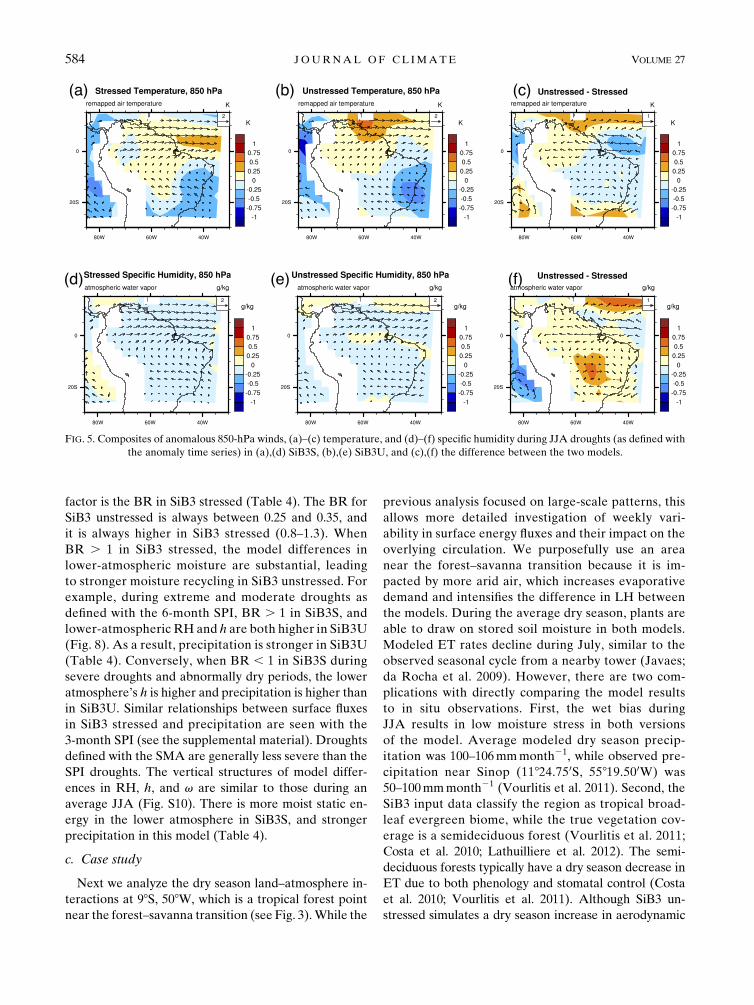
b. Land–atmosphere interactions during dry seasondroughts
The following discussion focuses on the previously
defined SE Amazon region (98–148S, 508–608W), where
dry season differences in surface fluxes are most pro-
nounced. Over this region, we defined dry season
droughts as explained in Table 2, first exploring com-
posites based on the simple anomaly time series. During
an average dry season, winds at 850 hPa are predom-
inantly easterly above the central Amazon basin in the
NCEP2 reanalysis, and there is anticyclonic rotation
above southern Brazil (Fig. S5). During modeled dry
season droughts, this flow is reversed: the 850-hPa winds
are anomalously southeasterly above southern Brazil,
and westerly near the equator (Fig. 5). Instead of moist
air flowing onto the continent from the tropical Atlantic,
drier air is advected into the Amazon region from the
south-southeast. The atmosphere is warmer and drier
FIG. 3. (top) LH (Wm22), (middle) SH (Wm22), and (bottom) precipitation (mmday21) during JJA in (left) SiB3S, (center) SiB3U, and
(right) the difference between the models (unstressed 2 stressed). Only significant differences are shown (p , 0.05). The box over the SE
Amazon region is discussed in the text (98–148S, 508–608W). The circle in the top right of the box marks the location used in Figs. 2 and 9.
582 JOURNAL OF CL IMATE VOLUME 27
than during an average dry season, and the differences in
surface fluxes between the models are enhanced (Fig. 6;
Table 3).
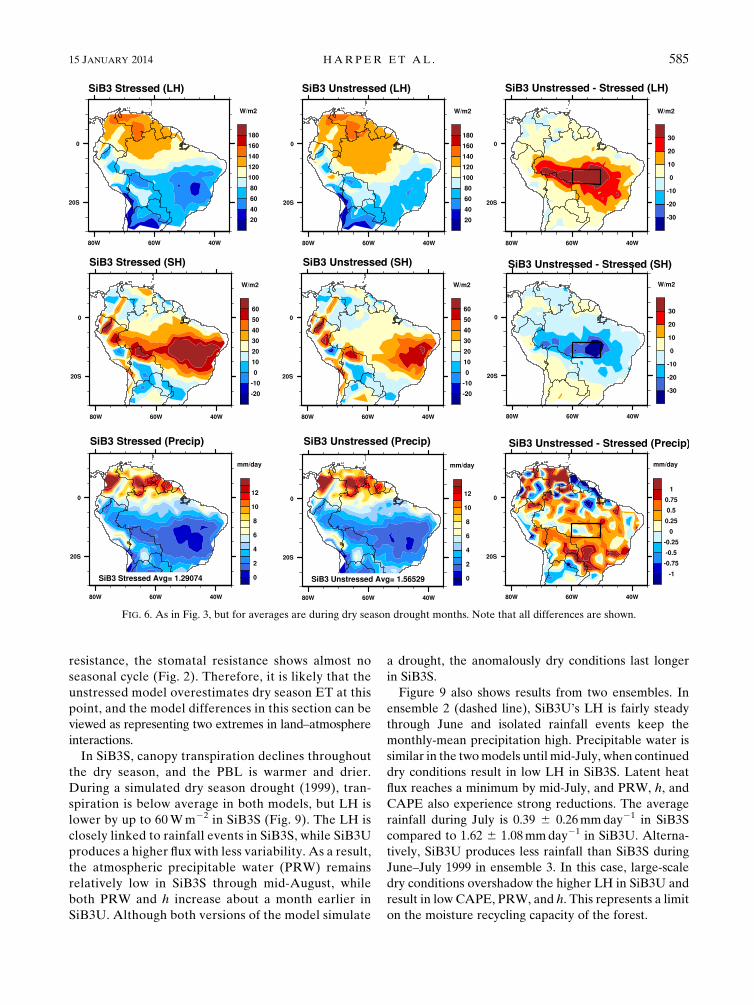
Contrary to the results for an average dry season,
the enhanced ET in SiB3U can play an important role
in moisture recycling during dry season droughts.
Precipitation in the SE Amazon region is approxi-
mately 20% higher in SiB3U (Fig. 6; Table 3). The
unstressed atmosphere is cooler (by up to 1.8 K at
850 hPa) and more moist (by on average 1 g kg21). The
result is slightly higher h between the surface and
850 hPa, although the differences are not significant
(Fig. 7). The moist static energy is higher near the
surface and lower near 700 hPa, and there is slightly
more CAPE in SiB3U. Above 700 hPa, subsidence is
stronger in SiB3S.
Although rainfall during droughts is higher in SiB3U,
the number of drought months is also higher. This is
likely a result of the selection criteria. During the dry
season, the modeled rainfall is infrequent but heavy
rains are possible, leading to a bimodal probability
distribution for dry season rain rates in both versions of
the model. In SiB3U this distribution is spread out: the
very dry and very wet months are more frequent at the
expense of average months (Fig. S8 in the supplemen-
tary material). Therefore, it is more likely for this
model to encounter dry season months with low rain
rates. To test the dependence of results on the defini-
tion of drought months, we composite dry season
droughts based on the SPI and SMA (Table 2). There
are more drought months during JJA using these two
indices than with the original index. The timing of
droughts in the original index is most similar to the
3-month SPI. The annual SMA best captures the long-
term nature of the 2005 drought in the SE Amazon
region, which was particularly severe because it fol-
lowed an anomalously dry wet season (Marengo et al.
2008a). The model simulates drought conditions during
the austral winter of 2005 in three of the five ensembles
for SiB3 stressed and in four of the five ensembles in
SiB3 unstressed.
During droughts based on the SPI, the average pre-
cipitation over the SE Amazon region is higher in the
model with higher RH throughout the profile and higher
vertically integrated h (Figs. 8 and S9). An additional
FIG. 4. (top) Latitude–height cross sections of model differences (SiB3U2 SiB3S) of potential temperature (K), RH (%), h (kJ kg21),
andv (hPa hr21) from 08 to 158S (averaged from 508 to 608W) during JJA. Stippling indicates regions of significant differences between the
models (p , 0.05). (bottom) Vertical profiles averaged over 118–138S and 508–608W from the two models and NCEP2 reanalysis.
TABLE 3. Average latent heat, sensible heat, Bowen ratio (SH/
LH), precipitation, temperature at 850 hPa (T850), and specific
humidity at 850 hPa (q850) during an average JJA and during dry
season droughts.
SiB3S
(JJA)
SiB3U
(JJA)
SiB3S
(drought)
SiB3U
(drought)
LH (Wm22) 77 114 63 112
SH (Wm22) 56 27 65 32
BR 0.72 0.24 1.03 0.29
P (mmday21) 1.95 1.61 1.29 1.57
T850 (K) 292.1 290.8 292.0 290.8
q850 (kg kg21) 0.0122 0.0125 0.0108 0.0122
15 JANUARY 2014 HARPER ET AL . 583
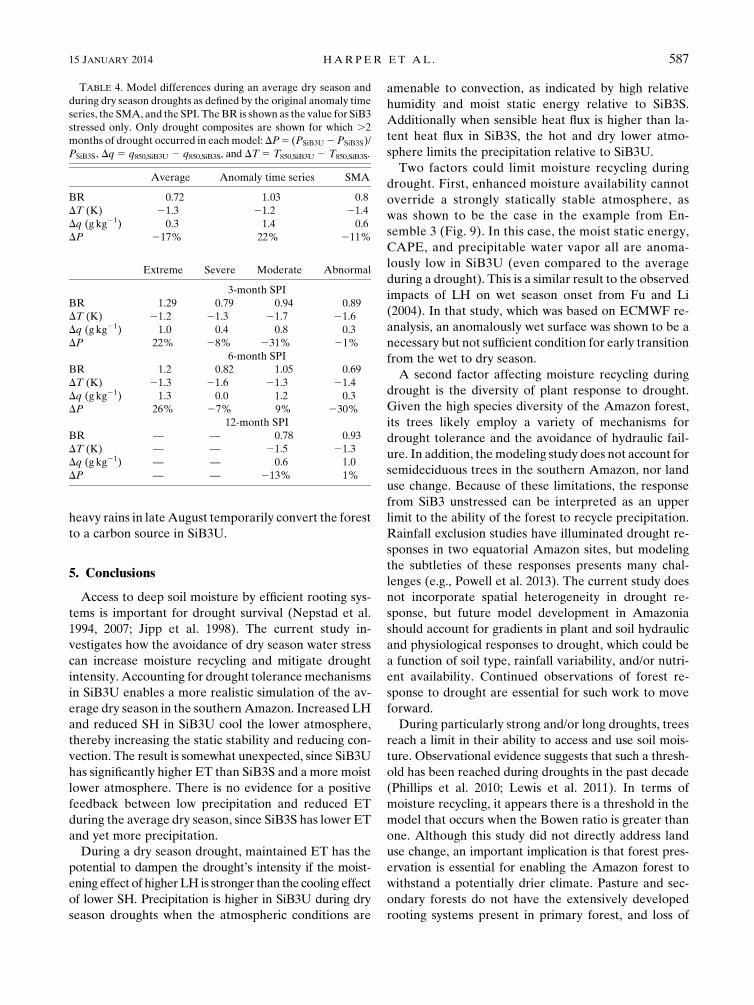
factor is the BR in SiB3 stressed (Table 4). The BR for
SiB3 unstressed is always between 0.25 and 0.35, and
it is always higher in SiB3 stressed (0.8–1.3). When
BR . 1 in SiB3 stressed, the model differences in
lower-atmospheric moisture are substantial, leading
to stronger moisture recycling in SiB3 unstressed. For
example, during extreme and moderate droughts as
defined with the 6-month SPI, BR . 1 in SiB3S, and
lower-atmospheric RH and h are both higher in SiB3U
(Fig. 8). As a result, precipitation is stronger in SiB3U
(Table 4). Conversely, when BR , 1 in SiB3S during
severe droughts and abnormally dry periods, the lower
atmosphere’s h is higher and precipitation is higher than
in SiB3U. Similar relationships between surface fluxes
in SiB3 stressed and precipitation are seen with the
3-month SPI (see the supplemental material). Droughts
defined with the SMA are generally less severe than the
SPI droughts. The vertical structures of model differ-
ences in RH, h, and v are similar to those during an
average JJA (Fig. S10). There is more moist static en-
ergy in the lower atmosphere in SiB3S, and stronger
precipitation in this model (Table 4).
c. Case study
Next we analyze the dry season land–atmosphere in-
teractions at 98S, 508W, which is a tropical forest point
near the forest–savanna transition (see Fig. 3).While the
previous analysis focused on large-scale patterns, this
allows more detailed investigation of weekly vari-
ability in surface energy fluxes and their impact on the
overlying circulation. We purposefully use an area
near the forest–savanna transition because it is im-
pacted by more arid air, which increases evaporative
demand and intensifies the difference in LH between
the models. During the average dry season, plants are
able to draw on stored soil moisture in both models.
Modeled ET rates decline during July, similar to the
observed seasonal cycle from a nearby tower (Javaes;
da Rocha et al. 2009). However, there are two com-
plications with directly comparing the model results
to in situ observations. First, the wet bias during
JJA results in low moisture stress in both versions
of the model. Average modeled dry season precip-
itation was 100–106mmmonth21, while observed pre-
cipitation near Sinop (11824.750S, 55819.500W) was
50–100mmmonth21 (Vourlitis et al. 2011). Second, the
SiB3 input data classify the region as tropical broad-
leaf evergreen biome, while the true vegetation cov-
erage is a semideciduous forest (Vourlitis et al. 2011;
Costa et al. 2010; Lathuilliere et al. 2012). The semi-
deciduous forests typically have a dry season decrease in
ET due to both phenology and stomatal control (Costa
et al. 2010; Vourlitis et al. 2011). Although SiB3 un-
stressed simulates a dry season increase in aerodynamic
FIG. 5. Composites of anomalous 850-hPa winds, (a)–(c) temperature, and (d)–(f) specific humidity during JJA droughts (as defined with
the anomaly time series) in (a),(d) SiB3S, (b),(e) SiB3U, and (c),(f) the difference between the two models.
584 JOURNAL OF CL IMATE VOLUME 27
resistance, the stomatal resistance shows almost no
seasonal cycle (Fig. 2). Therefore, it is likely that the
unstressed model overestimates dry season ET at this
point, and the model differences in this section can be
viewed as representing two extremes in land–atmosphere
interactions.
In SiB3S, canopy transpiration declines throughout
the dry season, and the PBL is warmer and drier.
During a simulated dry season drought (1999), tran-
spiration is below average in both models, but LH is
lower by up to 60Wm22 in SiB3S (Fig. 9). The LH is
closely linked to rainfall events in SiB3S, while SiB3U
produces a higher flux with less variability. As a result,
the atmospheric precipitable water (PRW) remains
relatively low in SiB3S through mid-August, while
both PRW and h increase about a month earlier in
SiB3U. Although both versions of the model simulate
a drought, the anomalously dry conditions last longer
in SiB3S.
Figure 9 also shows results from two ensembles. In
ensemble 2 (dashed line), SiB3U’s LH is fairly steady
through June and isolated rainfall events keep the
monthly-mean precipitation high. Precipitable water is
similar in the twomodels until mid-July, when continued
dry conditions result in low LH in SiB3S. Latent heat
flux reaches a minimum by mid-July, and PRW, h, and
CAPE also experience strong reductions. The average
rainfall during July is 0.39 6 0.26mmday21 in SiB3S
compared to 1.62 6 1.08mmday21 in SiB3U. Alterna-
tively, SiB3U produces less rainfall than SiB3S during
June–July 1999 in ensemble 3. In this case, large-scale
dry conditions overshadow the higher LH in SiB3U and
result in low CAPE, PRW, and h. This represents a limit
on the moisture recycling capacity of the forest.
FIG. 6. As in Fig. 3, but for averages are during dry season drought months. Note that all differences are shown.
15 JANUARY 2014 HARPER ET AL . 585
The differences in soil moisture access between the
models also have implications for the carbon cycle.
The net CO2 flux from the canopy to the atmosphere is
the difference between uptake by the forest through
photosynthesis and efflux resulting from respiration (the
convention in Fig. 9 is such that a negative flux is uptake).
SiB3U generally simulates the land as a carbon sink
during the dry season of 1999 because of higher rates of
photosynthesis than respiration, while the opposite is
true for SiB3S. Localized precipitation events can tem-
porarily switch the carbon sink to a source. For example,
in ensemble 3, large pulses of soil respiration following
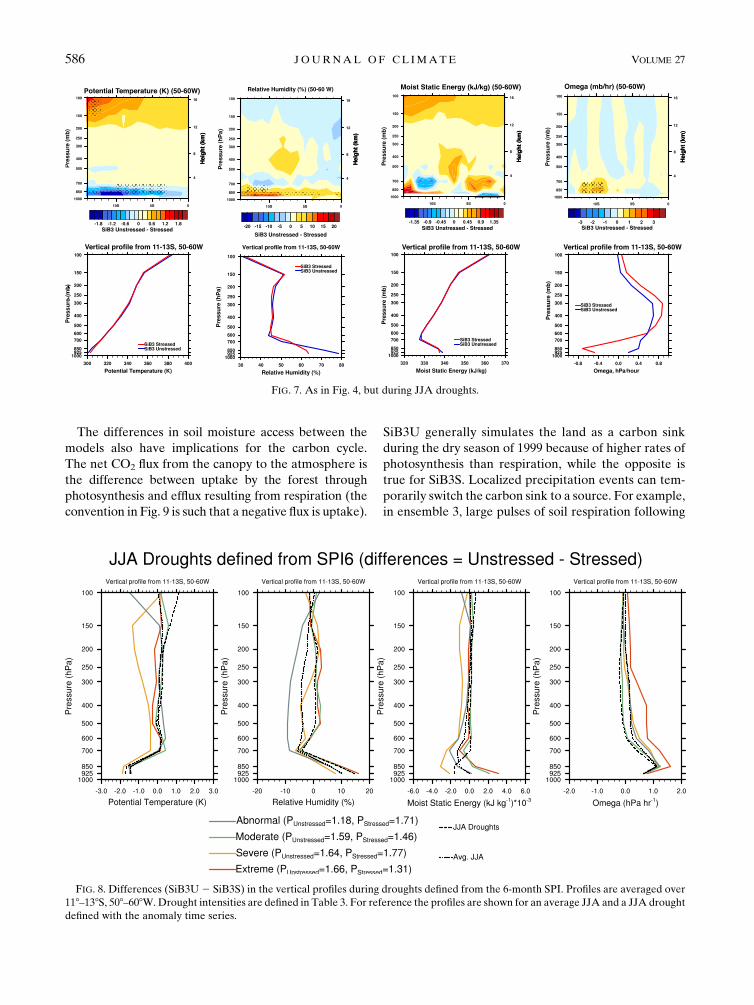
FIG. 7. As in Fig. 4, but during JJA droughts.
FIG. 8. Differences (SiB3U2 SiB3S) in the vertical profiles during droughts defined from the 6-month SPI. Profiles are averaged over
118–138S, 508–608W.Drought intensities are defined in Table 3. For reference the profiles are shown for an average JJA and a JJA drought
defined with the anomaly time series.
586 JOURNAL OF CL IMATE VOLUME 27
heavy rains in lateAugust temporarily convert the forest
to a carbon source in SiB3U.
5. Conclusions
Access to deep soil moisture by efficient rooting sys-
tems is important for drought survival (Nepstad et al.
1994, 2007; Jipp et al. 1998). The current study in-
vestigates how the avoidance of dry season water stress
can increase moisture recycling and mitigate drought
intensity. Accounting for drought tolerancemechanisms
in SiB3U enables a more realistic simulation of the av-
erage dry season in the southern Amazon. Increased LH
and reduced SH in SiB3U cool the lower atmosphere,
thereby increasing the static stability and reducing con-
vection. The result is somewhat unexpected, since SiB3U
has significantly higher ET than SiB3S and a more moist
lower atmosphere. There is no evidence for a positive
feedback between low precipitation and reduced ET
during the average dry season, since SiB3S has lower ET
and yet more precipitation.
During a dry season drought, maintained ET has the
potential to dampen the drought’s intensity if the moist-
ening effect of higherLH is stronger than the cooling effect
of lower SH. Precipitation is higher in SiB3U during dry
season droughts when the atmospheric conditions are
amenable to convection, as indicated by high relative
humidity and moist static energy relative to SiB3S.
Additionally when sensible heat flux is higher than la-
tent heat flux in SiB3S, the hot and dry lower atmo-
sphere limits the precipitation relative to SiB3U.
Two factors could limit moisture recycling during
drought. First, enhanced moisture availability cannot
override a strongly statically stable atmosphere, as
was shown to be the case in the example from En-
semble 3 (Fig. 9). In this case, the moist static energy,
CAPE, and precipitable water vapor all are anoma-
lously low in SiB3U (even compared to the average
during a drought). This is a similar result to the observed
impacts of LH on wet season onset from Fu and Li
(2004). In that study, which was based on ECMWF re-
analysis, an anomalously wet surface was shown to be a
necessary but not sufficient condition for early transition
from the wet to dry season.
A second factor affecting moisture recycling during
drought is the diversity of plant response to drought.
Given the high species diversity of the Amazon forest,
its trees likely employ a variety of mechanisms for
drought tolerance and the avoidance of hydraulic fail-
ure. In addition, themodeling study does not account for
semideciduous trees in the southern Amazon, nor land
use change. Because of these limitations, the response
from SiB3 unstressed can be interpreted as an upper
limit to the ability of the forest to recycle precipitation.
Rainfall exclusion studies have illuminated drought re-
sponses in two equatorial Amazon sites, but modeling
the subtleties of these responses presents many chal-
lenges (e.g., Powell et al. 2013). The current study does
not incorporate spatial heterogeneity in drought re-
sponse, but future model development in Amazonia
should account for gradients in plant and soil hydraulic
and physiological responses to drought, which could be
a function of soil type, rainfall variability, and/or nutri-
ent availability. Continued observations of forest re-
sponse to drought are essential for such work to move
forward.
During particularly strong and/or long droughts, trees
reach a limit in their ability to access and use soil mois-
ture. Observational evidence suggests that such a thresh-
old has been reached during droughts in the past decade
(Phillips et al. 2010; Lewis et al. 2011). In terms of
moisture recycling, it appears there is a threshold in the
model that occurs when the Bowen ratio is greater than
one. Although this study did not directly address land
use change, an important implication is that forest pres-
ervation is essential for enabling the Amazon forest to
withstand a potentially drier climate. Pasture and sec-
ondary forests do not have the extensively developed
rooting systems present in primary forest, and loss of
TABLE 4. Model differences during an average dry season and
during dry season droughts as defined by the original anomaly time
series, the SMA, and the SPI. TheBR is shown as the value for SiB3
stressed only. Only drought composites are shown for which .2
months of drought occurred in eachmodel:DP5 (PSiB3U 2PSiB3S)/
PSiB3S, Dq 5 q850,SiB3U 2 q850,SiB3S, and DT 5 T850,SiB3U 2 T850,SiB3S.
Average Anomaly time series SMA
BR 0.72 1.03 0.8
DT (K) 21.3 21.2 21.4
Dq (g kg21) 0.3 1.4 0.6
DP 217% 22% 211%
Extreme Severe Moderate Abnormal
3-month SPI
BR 1.29 0.79 0.94 0.89
DT (K) 21.2 21.3 21.7 21.6
Dq (g kg21) 1.0 0.4 0.8 0.3
DP 22% 28% 231% 21%
6-month SPI
BR 1.2 0.82 1.05 0.69
DT (K) 21.3 21.6 21.3 21.4
Dq (g kg21) 1.3 0.0 1.2 0.3
DP 26% 27% 9% 230%
12-month SPI
BR — — 0.78 0.93
DT (K) — — 21.5 21.3
Dq (g kg21) — — 0.6 1.0
DP — — 213% 1%
15 JANUARY 2014 HARPER ET AL . 587

vegetation coverage increases runoff during heavy rain.
Pasture is more likely to experience dry season water
stress and seasonal reductions in ET, particularly in the
southern Amazon (von Randow et al. 2012), and de-
forestation can reduce moisture recycling and down-
wind precipitation (Spracklen et al. 2012). In addition,
forests that border pasture or savanna are more prone to
desiccation and fire impacts (Malhi et al. 2008). Large
areas of undisturbed forest are more likely to maintain
ET during dry periods and recycle rainfall.
Acknowledgments. This work was funded through the
National Science Foundation’s Science and Technology
Center for Multiscale Modeling of Atmospheric Pro-
cesses, managed by Colorado State University under
Cooperative Agreement ATM-0425247, and through
the U.K. National Environment Research Council Joint
Weather andClimateResearch Programme. Computing
resources were supplied by the National Energy Re-
search Scientific Computing Center, supported by the
Office of Science of the U.S. Department of Energy
FIG. 9. (top)–(bottom) Precipitation, LH, CAPE, total column PRW, vertically integrated moist static energy
(MSE; from 1000 to 100 hPa), and net carbon flux from the canopy during the dry season of 1999. The dark line is the
average of five ensembles. Patterned lines show the variability seen in individual ensembles: dashed line (ensemble 2)
and thin solid line (ensemble 3). All time series have a 10-day runningmean applied. The climatological dry season is
May–September. The months that qualified as droughts were July–August (SiB3U, ensemble 2), August (SiB3U,
ensemble 3), July (SiB3S, ensemble 2), and June–August (SiB3S, ensemble 3). The beginning and end of the droughts
are denoted with the horizontal lines above the x axis.
588 JOURNAL OF CL IMATE VOLUME 27
under Contract DE-AC02-05CH11231. The authors
thank the editor, Dr. Michael Coe, and three anonymous
reviewers for their helpful reviews of the manuscript.
REFERENCES
Adler, R. F., and Coauthors, 2003: The Version-2 Global Pre-
cipitation Climatology Project (GPCP) monthly precipitation
analysis (1979–present). J. Hydrometeor., 4, 1147–1167.
Aragao, L., Y. Malhi, N. Barbier, A. Lima, Y. Shimabukuro,
L. Anderson, and S. Saatchi, 2008: Interactions between rain-
fall, deforestation and fires during recent years in the Brazilian
Amazonia. Philos. Trans. Roy. Soc. London, B363, 1779–1785.
Baker, I. T., L. Prihodko, A. S. Denning, M. Goulden, S. Miller,
and H. R. da Rocha, 2008: Seasonal drought stress in the
Amazon: Reconciling models and observations. J. Geophys.
Res., 113, G00B01, doi:10.1029/2007JG000644.
——, and Coauthors, 2013: Surface ecophysiological behavior
across vegetation and moisture gradients in tropical South
America. Agric. For. Meteor., 182–183, 177–188.
Burke, E. J., and S. J. Brown, 2008: Evaluating uncertainties in the
projection of future drought. J. Hydrometeor., 9, 292–299.
Chen, Y., and Coauthors, 2011: Forecasting fire season severity in
South America using sea surface temperature anomalies.
Science, 334, 787–791, doi:10.1126/science.1209472.Collatz, G., J. Ball, C. Grivet, and J. Berry, 1991: Physiological and
environmental regulation of stomatal conductance, photo-
synthesis and transpiration: A model that includes a laminar
boundary layer. Agric. For. Meteor., 54, 107–136.
——,M. Ribas-Carbo, and J. Berry, 1992: Coupled photosynthesis-
stomatal conductance model for leaves of C4 plants. Aust.
J. Plant Physiol., 19, 519–538.Costa, M. H., M. C. Biajoli, L. Sanches, A. C. M. Malhado, L. R.
Hutyra, H. R. da Rocha, R. G. Aguiar, and A. C. de Araujo,
2010: Atmospheric versus vegetation controls of Amazonian
tropical rain forest evapotranspiration: Are the wet and sea-
sonally dry rain forests any different? J. Geophys. Res., 115,
G04021, doi:10.1029/2009JG001179.
Cox, P. M., and Coauthors, 2008: Increasing risk of Amazonian
drought due to decreasing aerosol pollution.Nature, 453, 212–
215.
da Rocha, H. R., and Coauthors, 2009: Patterns of water and
heat flux across a biome gradient from tropical forest to
savanna in Brazil. J. Geophys. Res., 114,G00B12, doi:10.1029/
2007JG000640.
Denning, A. S., G. J. Collatz, C. G. Zhang, D. A. Randall, J. A.
Berry, P. J. Sellers, G. D. Colello, and D. A. Dazlich, 1996:
Simulations of terrestrial carbon metabolism and atmospheric
CO2 in a general circulation model. 1. Surface carbon fluxes.
Tellus, 48B, 521–542.——, N. Zhang, C. Yi, M. Branson, K. Davis, J. Kleist, and
P. Bakwin, 2008: Evaluation of modeled atmospheric bound-
ary layer depth at the WLEF tower. Agric. For. Meteor., 148,
206–215.
Ding, P., and D. A. Randall, 1998: A cumulus parameterization
with multiple cloud base levels. J. Geophys. Res., 103 (D10),
11 341–11 353.
Eltahir, E. A. B., andR. L. Bras, 1994: Precipitation recycling in the
Amazon basin. Quart. J. Roy. Meteor. Soc., 120, 861–880.
Espinoza, J. C., J. Ronchail, J. L. Guyot, C. Junquas, P. Vauchel,
W. Lavado, G. Drapeau, and R. Pombosa, 2011: Climate
variability and extreme drought in the upper Solim~oes River
(western Amazon basin): Understanding the exceptional 2010
drought. Geophys. Res. Lett., 38, L13406, doi:10.1029/
2011GL047862.
Farquhar, G. D., S. von Caemmerer, and J. Berry, 1980: A bio-
chemical model of photosynthetic CO2 assimilation in leaves
of C3 species. Planta, 149, 78–90.
Fisher, R. A., M. Williams, R. L. Do Vale, A. L. Da Costa, and
P. Meir, 2006: Evidence from Amazonian forests is consistent
with isohydric control of leaf water potential. Plant Cell
Environ., 29, 151–165.
Fowler, L. D., andD. A. Randall, 2002: Interactions between cloud
microphysics and cumulus convection in a general circulation
model. J. Atmos. Sci., 59, 3074–3098.
——, ——, and S. A. Rutledge, 1996: Liquid and ice cloud micro-
physics in the CSU general circulation model. Part I: Model
description and simulated microphysical processes. J. Climate,
9, 489–529.Fu, R., and W. Li, 2004: The influence of the land surface on the
transition from dry to wet season in Amazonia. Theor. Appl.
Climatol., 78, 97–110.
Gabriel, P. M., P. T. Partain, and G. L. Stephens, 2001: Parame-
terization of atmospheric radiative transfer. Part II: Selection
rules. J. Atmos. Sci., 58, 3411–3423.
Global Soil Data Task, 2000: Global soil data products (IGBP-
DIS). International Geosphere-Biosphere Programme, Data
and Information System, CD-ROM. [Available online at
http://www.daac.ornl.gov.]
Harper, A. B., A. S. Denning, I. T. Baker, M. D. Branson,
L. Prihodko, and D. A. Randall, 2010: Role of deep soil
moisture in modulating climate in the Amazon rainforest.
Geophys. Res. Lett., 37, L05802, doi:10.1029/2009GL042302.
Hasler, N., and R. Avissar, 2007:What controls evapotranspiration
in the Amazon basin? J. Hydrometeor., 8, 380–395.
Hilker, T., A. I. Lyapustin, C. J. Tucker, P. J. Sellers, F. G.Hall, and
Y. Wang, 2012: Remote sensing of tropical ecosystems: At-
mospheric correction and cloudmasking matter.Remote Sens.
Environ., 127, 370–384, doi:10.1016/j.rse.2012.08.035.Hurrell, J., J. Hack, D. Shea, J. Caron, and J. Rosinski, 2008: A
new sea surface temperature and sea ice boundary dataset
for the community atmosphere model. J. Climate, 21, 5145–
5153.
Jackson, R. B., J. Canadell, J. R. Ehleringer, H. A. Mooney,
O. E. Sala, and E. D. Schulze, 1996: A global analysis of
root distributions for terrestrial biomes. Oecologia, 108,
389–411.
Jipp, P. H., D. C. Nepstad, D. K. Cassel, and C. R. De Carvalho,
1998: Deep soil moisture storage and transpiration in forests
and pastures of seasonally-dry Amazonia. Climatic Change,
39, 395–412.
Kalnay, E., and Coauthors, 1996: The NCEP/NCAR 40-Year Re-
analysis Project. Bull. Amer. Meteor. Soc., 77, 437–471.Lathuilliere, M. J., M. S. Johnson, and S. D. Donner, 2012: Water
use by terrestrial ecosystems: Temporal variability in rain-
forest and agricultural contributions to evapotranspiration in
MatoGrosso, Brazil.Environ. Res. Lett., 7, 024024, doi:10.1088/
1748-9326/7/2/024024.
Lee, J. E., R. S. Oliveira, T. E. Dawson, and I. Fung, 2005: Root
functioning modifies seasonal climate. Proc. Natl. Acad. Sci.
USA, 102, 17 576–17 581.
——, B. R. Lintner, C. K. Boyce, and P. J. Lawrence, 2011: Land
use change exacerbates tropical South American drought by
sea surface temperature variability. Geophys. Res. Lett., 38,
L19706, doi:10.1029/2011GL049066.
15 JANUARY 2014 HARPER ET AL . 589

Lewis, S. L., P. M. Brando, O. L. Phillips, G. M. F. van der Heijden,
and D. Nepstad, 2011: The 2010 Amazon drought. Science,
331, 554.
Li, W. H., and R. Fu, 2004: Transition of the large-scale atmo-
spheric and land surface conditions from the dry to the wet
season over Amazonia as diagnosed by the ECMWF re-
analysis. J. Climate, 17, 2637–2651.
Liebmann, B., and J. A. Marengo, 2001: Interannual variability of
the rainy season and rainfall in the Brazilian Amazon basin.
J. Climate, 14, 4308–4318.
Lin, X., D. A. Randall, and L. D. Fowler, 2000: Diurnal vari-
ability of the hydrologic cycle and radiative fluxes: Com-
parisons between observations and a GCM. J. Climate, 13,
4159–4179.
Los, S. O., and Coauthors, 2000: A global 9-yr biophysical land
surface dataset from NOAA AVHRR data. J. Hydrometeor.,
1, 183–199.Malhado, A., M. H. Costa, F. Z. de Lima, K. C. Portilho, and D. N.
Figueiredo, 2009: Seasonal leaf dynamics in an Amazonian
tropical forest. For. Ecol. Manage., 258, 1161–1165.
Malhi, Y., and J. Wright, 2004: Spatial patterns and recent trends in
the climate of tropical rainforest regions. Philos. Trans. Roy.
Soc. London, B359, 311–329.
——, J. T. Roberts, R. A. Betts, T. J. Killeen, W. H. Li, and C. A.
Nobre, 2008: Climate change, deforestation, and the fate of
the Amazon. Science, 319, 169–172.Marengo, J. A., 2004: Interdecadal variability and trends of rainfall
across the Amazon basin. Theor. Appl. Climatol., 78, 79–96.
——, 2006: On the hydrological cycle of the Amazon basin: A
historical review and current state-of-the-art. Rev. Bras. Me-
teor., 21, 1–19.
——, C. A. Nobre, J. Tomasella, M. F. Cardoso, andM. D. Oyama,
2008a: Hydro-climatic and ecological behaviour of the drought
of Amazonia in 2005. Philos. Trans. Roy. Soc. London, B363,
1773–1778.
——, and Coauthors, 2008b: The drought of Amazonia in 2005.
J. Climate, 21, 495–516.
——, J. Tomasella, L. Alves, W. Soares, and D. Rodriguez, 2011:
The drought of 2010 in the context of historical droughts in the
Amazon region. Geophys. Res. Lett., 38, L12703, doi:10.1029/
2011GL047436.
McKee, T., N. Doesken, and J. Kleist, 1993: The relationship of
drought frequency and duration to time scales. Proc. Eighth
Conf. on Applied Climatology,Anaheim, CA, Amer. Meteor.
Soc., 179–184.
Miller, S., M. Goulden, M. Menton, H. da Rocha, H. de Freitas,
A. Figueira, and C. de Sousa, 2004: Biometric and microme-
teorological measurements of tropical forest carbon balance.
Ecol. Appl., 14 (Suppl.), S114–S126.
Myneni, R. B., and Coauthors, 2007: Large seasonal swings in leaf
area of Amazon rainforests. Proc. Natl. Acad. Sci. USA, 104,
4820–4823, doi:10.1073/pnas.0611338104.
NCL, 2013: The NCAR command language (version 6.1.1).
UCAR/NCAR/CISL/VETS. [Available online at http://www.
ncl.ucar.edu/.]
Nepstad, D. C., and Coauthors, 1994: The role of deep roots in the
hydrological and carbon cycles of Amazonian forests and
pastures. Nature, 372, 666–669.
——, I. M. Tohver, D. Ray, P. Moutinho, and G. Cardinot, 2007:
Mortality of large trees and lianas following experimental
drought in an amazon forest. Ecology, 88, 2259–2269.
——, C. Stickler, B. Soares, and F. Merry, 2008: Interactions
among Amazon land use, forests and climate: Prospects for a
near-term forest tipping point. Philos. Trans. Roy. Soc. Lon-
don, B363, 1737–1746, doi:10.1098/rstb.2007.0036.
Oliveira, R. S., T. E. Dawson, S. S. O. Burgess, and D. C. Nepstad,
2005: Hydraulic redistribution in three Amazonian trees.
Oecologia, 145, 354–363.Pan, D. M., and D. A. Randall, 1998: A cumulus parametrization
with a prognostic closure.Quart. J. Roy.Meteor. Soc., 124, 949–981.
Phillips, O. L., and Coauthors, 2009: Drought sensitivity of the
Amazon rainforest. Science, 323, 1344–1347.——, and Coauthors, 2010: Drought-mortality relationships for
tropical forests. New Phytol., 187, 631–646.
Powell, T. L., and Coauthors, 2013: Evaluating model predictions
of carbon fluxes forAmazonian rainforests subjected to severe
drought. New Phytol., 200, 350–365, doi:10.1111/nph.12390.
Randall, D. A., J. A. Abeles, and T. G. Corsetti, 1985: Seasonal
simulations of the planetary boundary layer and boundary
layer stratocumulus clouds with a general circulation model.
J. Atmos. Sci., 42, 641–676.
——, and Coauthors, 1996: A revised land surface parameteriza-
tion (SiB2) for GCMS. Part III: The greening of the Colorado
State University general circulation model. J. Climate, 9, 738–
763.
Ringler, T. D., R. P. Heikes, andD.A. Randall, 2000:Modeling the
atmospheric general circulation using a spherical geodesic
grid: A new class of dynamical cores. Mon. Wea. Rev., 128,
2471–2490.
Ropelewski, C. F., and M. S. Halpert, 1987: Global and regional
scale precipitation patterns associated with the El Ni~no/
Southern Oscillation. Mon. Wea. Rev., 115, 1606–1626.
Saatchi, S. S., R. A. Houghton, R. Alvala, J. V. Soares, and Y. Yu,
2007: Distribution of aboveground live biomass in the Ama-
zon basin. Global Change Biol., 13, 816–837, doi:10.1111/
j.1365-2486.2007.01323.x.
——, andCoauthors, 2011: Benchmarkmap of forest carbon stocks
in tropical regions across three continents. Proc. Natl. Acad.
Sci. USA, 108, 9899–9904.
——, S. Asefi-Najafabady, Y. Malhi, L. Aragao, L. Anderson,
R. Myneni, and R. Nemani, 2013: Persistent effects of a severe
drought on Amazonian forest canopy. Proc. Natl. Acad. Sci.
USA, 110, 565–570.
Saleska, S. R., K. Didan, A. R. Huete, and H. R. da Rocha, 2007:
Amazon forests green-up during 2005 drought. Science, 318,
612.
Samanta, A., S. Ganguly, H. Hashimoto, S. Devadiga, E. Vermote,
Y. Knyazikhin, R. R. Nemani, and R. B. Myneni, 2010: Am-
azon forests did not green-up during the 2005 drought. Geo-
phys. Res. Lett., 37, L05401, doi:10.1029/2009GL042154.
——, ——, E. Vermote, R. R. Nemani, and R. B. Myneni, 2012:
Why is remote sensing of Amazon forest greenness so chal-
lenging? Earth Interact., 16, doi:10.1175/2012EI440.1.
Sellers, P. J., Y. Mintz, Y. C. Sud, and A. Dalcher, 1986: A Simple
Biosphere Model (SiB) for use within general circulation
models. J. Atmos. Sci., 43, 505–531.
——, J. A. Berry, G. J. Collatz, C. B. Field, and F. G. Hall, 1992:
Canopy reflectance, photosynthesis, and transpiration. III.
A reanalysis using improved leaf models and a new can-
opy integration scheme. Remote Sens. Environ., 42, 187–
216.
——, and Coauthors, 1996a: A revised land surface parameteri-
zation (SiB2) for atmospheric GCMS. Part I: Model formu-
lation. J. Climate, 9, 676–705.
——, S. O. Los, C. J. Tucker, C. O. Justice, D. A. Dazlich, G. J.
Collatz, and D. A. Randall, 1996b: A revised land surface
590 JOURNAL OF CL IMATE VOLUME 27

parameterization (SiB2) for atmospheric GCMS. Part II: The
generation of global fields of terrestrial biophysical parame-
ters from satellite data. J. Climate, 9, 706–737.
Spracklen, D. V., S. R. Arnold, and C. M. Taylor, 2012: Observa-
tions of increased tropical rainfall preceded by air passage
over forests. Nature, 489, 282–285.
Stephens, G. L., P. M. Gabriel, and P. T. Partain, 2001: Parame-
terization of atmospheric radiative transfer. Part I: Validity of
simple models. J. Atmos. Sci., 58, 3391–3409.
Suarez, M. J., A. Arakawa, and D. A. Randall, 1983: The param-
eterization of the planetary boundary layer in the UCLA
general circulation model: Formulation and results. Mon.
Wea. Rev., 111, 2224–2243.
Taylor, I. H., E. Burke, L. McColl, P. Falloon, G. R. Harris, and
D. McNeall, 2012: Contributions to uncertainty in projections of
future drought under climate change scenarios.Hydrol.Earth Syst.
Sci. Discuss., 9, 12613–12653, doi:10.5194/hessd-9-12613-2012.
Taylor, K., D. Williamson, and F. Zwiers, 2000: AMIP II sea sur-
face temperature and sea ice concentration boundary condi-
tions. PCMDIRep. 60. [Available online at http://www-pcmdi.
llnl.gov/projects/amip/AMIP2EXPDSN/BCS/amip2bcs.php.]
Toomey, M., D. A. Roberts, C. Still, M. L. Goulden, and J. P.
McFadden, 2011: Remotely sensed heat anomalies linked with
Amazonian forest biomass declines. Geophys. Res. Lett., 38,
L19704, doi:10.1029/2011gl049041.
Trenberth, K. E., 1999: Atmospheric moisture recycling: Role
of advection and local evaporation. J. Climate, 12, 1368–
1381.
Tucker, C. J., J. E. Pinzon,M. E. Brown,D.A. Slayback, E.W. Pak,
R. Mahoney, E. F. Vermote, and N. El Saleous, 2005: An
extended AVHRR 8-km NDVI dataset compatible with
MODIS and spot vegetation NDVI data. Int. J. Remote Sens.,
26, 4485–4498.
Vidale, P. L., and R. Stockli, 2005: Prognostic canopy air space
solutions for land surface exchanges. Theor. Appl. Climatol.,
80, 245–257.vonRandow, R. C. S., C. vonRandow,R.W.A.Hutjes, J. Tomasella,
and B. Kruijt, 2012: Evapotranspiration of deforested areas in
central and southwestern Amazonia. Theor. Appl. Climatol.,
109, 205–220.Vourlitis, G., F. Lobo, P. Zeilhofer, and J. Nogueira, 2011: Tem-
poral patterns of net CO2 exchange for a tropical semi-
deciduous forest of the southern Amazon basin. J. Geophys.
Res., 116, G03029, doi:10.1029/2010JG001524.
Xu, L. A., A. Samanta,M.H. Costa, S. Ganguly, R. R. Nemani, and
R. B. Myneni, 2011: Widespread decline in greenness of
Amazonian vegetation due to the 2010 drought.Geophys. Res.
Lett., 38, L07402, doi:10.1029/2011GL046824.
Yin, L., R. Fu, E. Shevliakova, andR. E.Dickinson, 2013:Howwell
canCMIP5 simulate precipitation and its controlling processes
over tropical South America? Climate Dyn., doi:10.1007/
s00382-012-1582-y, in press.
Zeng, N., J.-H. Yoon, J. Marengo, A. Subramaniam, C. A. Nobre,
A. Mariotti, and J. D. Neelin, 2008: Causes and impacts of
the 2005 Amazon drought. Environ. Res. Lett., 3, 014002,
doi:10.1088/1748-9326/3/1/014002.
15 JANUARY 2014 HARPER ET AL . 591