impact of ethiopia’s community based health...
TRANSCRIPT

1
Impact of Ethiopia’s Community Based Health Insurance on
Household Economic Welfare
Zelalem Yilmaa, Anagaw Mebratieb, Robert Sparrowc, Marleen Dekkerd , Getnet Alemue,
Arjun S. Bedif
(Preliminary Draft: May 9, 2014)
Abstract
In mid-2011, the Government of Ethiopia launched a pilot Community-Based Health Insurance
(CBHI) scheme in thirteen rural districts. Among others, the aims of the scheme are to increase
access to health care and to reduce household vulnerability to unexpected out-of-pocket health
expenditure. Against this background the current paper uses three rounds of household survey data
collected before and after the introduction of CBHI in pilot and control districts and assesses the
impact of the scheme on household consumption, income, indebtedness and livestock holdings. We
find that enrolment leads to a 5 percentage point or 16 percent decline in the probability of
borrowing and is associated with an increase in household income. There is no evidence that
enrolling in the scheme affects consumption or livestock holdings. Our results show that the scheme
reduces reliance on harmful and less preferred coping responses, such as borrowing. This paper adds
to the relatively small body of work which rigorously evaluates the impact of CBHI schemes on
economic welfare.
The authors acknowledge the financial support of the Netherlands Organisation for Scientific Research (NWO-WOTRO), grant number W07.45.103.00.
a Corresponding author, International Institute of Social
Studies, Erasmus University Rotterdam, [email protected] ; b International Institute of Social Studies, Erasmus
University Rotterdam, [email protected] ; c Crawford School of Public Policy, Australian National University,
African Studies Centre, Leiden University, [email protected] e Addis Ababa
University, [email protected]; f
International Institute of Social Studies, Erasmus University Rotterdam & School of Foreign Service-Qatar, Georgetown University, [email protected] .
2
1. Introduction
Various forms of health insurance have been advocated as market based risk-transfer mechanisms
with the potential to guard against the impoverishing effects of ill-health (see Leive and Xu 2008,
Asfaw and Von Braun 2004, Xu et al. 2003, Gertler and Gruber 2002). The recent proliferation of
Community Based Health Insurance (CBHI) schemes in many developing countries emanates partly
from a need to provide financial protection against unexpected health care costs and to enhance
access to modern health care. As a prelude to national coverage, in June 2011, the Ethiopian
Government introduced a pilot CBHI scheme in thirteen Woredas (districts) across the four main
regional states that constitute 86 percent of the population (Population Census Commission, 2008).1
The aim of this paper is to examine the impact of this scheme on measures of household economic
welfare (consumption, income, indebtedness and livestock).
The economic burden associated with the incidence of ill-health has been documented in a recent
but rapidly growing literature on poverty dynamics. Most of these studies examine the consumption
implications of health shocks while some delve into the portfolio of coping responses adopted by
households.2 A number of studies show that households in the informal rural sector rely on
traditional coping responses such as selling assets and informal borrowing to deal with the adverse
consequences of ill-health (Sparrow et al. 2014, Yilma et al. 2014, Dekker and Wilms 2010, Heltberg
and Lund 2009). These coping responses are not cost free but entail a compromise – protecting
current consumption at the cost of future vulnerability (Flores et al. 2008).
Health insurance provides the possibility of dealing with one of the two sources of household
financial stress, namely unexpected out-of-pocket health expenditure. The second channel is
forgone income due to a decline in the capacity to work of the sick individual. Most health insurance
schemes are, however, not designed to curb this source of vulnerability. Nonetheless, by freeing up
resources meant for productive purposes, for instance, to buy fertilizers and high value seeds, and
by facilitating early recovery, health insurance might also protect a household’s agricultural income
from falling. As such, by avoiding the necessity to rely on potentially harmful coping responses, such
as borrowing at usurious rates, health insurance schemes might protect a household’s economic
welfare both in the short and the long-run.
Although analyses of the impact of health insurance has been the subject of a large body of
empirical literature, much of this work has focused on health care utilization and out-of-pocket
(OOP) health expenditure or on induced behavioural responses such as moral hazard (Leon 2012).
Based on subsequent systematic reviews of the literature, both Ekman (2004) and Mebratie et al.
(2013a) conclude that the evidence base with respect to the conclusion that CBHI schemes provide
financial protection is questionable. The bulk of the CBHI evaluation literature, with few exceptions3,
1 This came following a successful low-cost health service extension program designed to increase the supply
of preventive and basic curative health services. See its impact evaluation in Admassie et al. (2009).
2 See, amongst others, Gertler and Gruber 2002, Wagstaff 2007, Wagstaff and Lindelow 2010, Islam and Maitra 2010, Genoni 2012, Sparrow et al. 2013, Mohanan 2013. 3 Jowett et al. (2003) for Vietnam, Levine et al. (2012) for Cambodia and Lu et al. (2012) for Rwanda, find
statistically significant negative effects of CBHI on OOP health spending. Wagstaff et al. (2009) find no statistically significant effects for China.

3
relies on cross-section based association and does not identify causal effects. Ignoring self-selection
in voluntary insurance uptake is likely to lead to biased estimates of the impact of CBHI.
Moreover, while there are studies that examine whether health insurance helps protect income or
wealth from declining due to ill-health (Smith 1999, Levy 2002, Lindelow and Wagstaff 2005) or have
studied the effect of such schemes on consumption (Wagstaff and Pradhan 2005), there are
relatively few studies that have evaluated the impact of such schemes on indebtedness and
livestock.
This paper makes use of three rounds of rich panel household survey data – a baseline and two
follow-up surveys. The presence of a baseline survey enables us to examine self-selection and to
control for both observable and unobservable time invariant factors which may affect self-selection.
To identify the effect of the scheme on income, consumption, livestock and indebtedness we rely on
both fixed effects and matching methods and compare results for different control groups (within
and across pilot and non-pilot districts).
We find that enrolment in the CBHI scheme decreases the probability of indebtedness by about 5
percentage points. This result is robust across methods and different control groups. We also find a
negative, yet imprecise, effect on the amount of outstanding loans, although the coefficient is
relatively stable across methods and control groups. There is no statistically significant impact on
livestock holding. However, enrolment in CBHI, is associated with an annual increase of Ethiopian
Birr 785 in annual crop output and ETB 1087 in total income. This effect is robust across methods for
the pilot district households although estimates are not precisely estimated for the non-pilot district
households. There is no statistically significant impact on consumption.
The remainder of the paper is organized as follows. Section two provides the context and design of
the CBHI scheme. Section three describes the data. This is followed by a brief discussion on the how
the scheme may be expected to influence outcomes. Section five describes the empirical approach
and section six presents the results. Finally, section seven concludes.
2. CBHI scheme design
As part of the new health sector financing reform (HSFR) initiatives, in June 2011 the Ethiopian
Government launched a pilot CBHI scheme in 13 districts across the four main regions (Tigray,
Amhara, Oromiya, and SNNPR) of the country.4,5 Regional administrative bodies selected these
districts based on directives provided by the Federal Ministry of Health (FMoH). The selection
criteria require that the districts fulfil five conditions while in practice selection was based on two
4 Although initially the plan was to launch the pilot scheme in 3 districts in each of the four regions, an
additional district in Oromiya region volunteered to join the pilot scheme and was included. 5 The main components of the health sector financing reform include revenue retention and utilization by
health facilities, fee waiver and exemption of certain services, and establishment of private wings in public hospitals.

4
conditions: undertaking HSFRs and geographical accessibility of health centers (located close to the
main road).6
The community component of the CBHI scheme partly emanates from the fact that it is the
community at the village (Kebele) level that determines, based on a simple majority vote, whether
or not to join the scheme. Possibly due to prior sensitization activities, all villages in pilot districts
voted in favour of the scheme. Once a Kebele accepts CBHI, it is up to the household to decide to
enrol in the scheme. Enrolment is at the level of the household rather than the individual (FMoH
2008). This reduces chances of adverse selection within households. By design the community is also
involved in cheme management and supervision. Within each village, three CBHI members are
selected to be delegates in the local CBHI administrative bodies. However, while these members are
supposed to take part in the general assembly organized at district level, in practice their
participation may be limited.7
The design of the scheme is based on a feasibility study conducted by an international consultancy
company, Abt Associates, which is also responsible for implementation and monitoring of the
scheme in collaboration with relevant government bodies at the federal and local level. The benefit
packages, registration fees and premiums are the same within regions but vary slightly across
regions (Table 1). The premium payment methods also slightly differ across regions. While in
Amhara region the unit of contribution is the individual (ETB 3 per individual per month) in other
regions it is the household. For core household members (parents and minor children), household
level monthly premiums range between ETB 10.50 in SNNPR to ETB 15 in Oromiya (see Table 1). For
each additional non-core household member the monthly premium lies between ETB 2.10 and ETB
3.00. To put these figures in context, the premium for all core household members in Oromiya
amount to about 1.4 per cent of household monthly non-medical consumption expenditure.8 Village
level CBHI officials and community representatives may adjust the interval of premium collection
based on local conditions. The scheme is subsidized by both the central and regional/district
governments. The central government provides a general subsidy amounting to a quarter of the
premium collected at district level while the regional and district level governments cover the costs
of providing a fee waiver for the poorest 10 percent of the population.9
6 The complete set of selection criteria include (1) Willingness of district authorities to implement the scheme
(2) Commitment of districts to support the scheme, (3) Geographical accessibility of health centers (4) Quality of health centers, (5) The implementation of cost recovery, local revenue retention, and public pharmacy policies in health centers. 7 Identification of households eligible for the fee waiver arrangement, however, included the participation of
the community and local government officials. 8
In 2011, monthly household non-medical consumption expenditure was ETB 1103 in 2011 (with USD 1 equal ETB 18). 9 These households are categorized as indigent groups (households without land, house, or any valuable
assets). In December 2012 about 9 percent of total eligible households had received a fee waiver. There are differences across districts ranging from 0.9 percent in Deder (Oromiya) to 21 percent in South Achefer (Amhara). According to information obtained from Abt Associates, the coverage of the indigent groups depends on the budget allocated by district and regional governments.

5
The benefit package includes both outpatient and inpatient service utilization at public facilities.
Enrolled households may not seek care in private facilities unless a particular service or drug is
unavailable at a public facility. The scheme excludes treatment abroad and treatments with large
cosmetic value such as artificial teeth and plastic surgery. The scheme has a referral procedure:
members are expected to first visit health centers and may only seek care at hospitals (district or
regional) if they have referral letters from these facilities. Those who do not follow this referral
procedure need to cover half the costs of their medical treatment.10
In our sample, CBHI uptake has reached 44.4 percent in April 2013 (see Table 1). This is comparable
to the official overall figure reported by Abt Associates (45.5 percent in December 2012). Although
there is not much of a difference between uptake in April 2012 (41 percent) and uptake in April 2013
(44 percent), the speed of uptake is remarkable compared to experiences in other African countries.
Uptake in Senegal after two years was 4.8 percent (Smith and Sulzbach, 2008), in Tanzania 2.8
percent after six years (Chee et al., 2002), in Mali 11.4 percent after six years (Diop et al., 2006), and
in Rwanda 35 percent after seven years and 85 percent after nine years (Shimeles, 2010).
3. Data
We use three-rounds of a household level panel data set, collected in March/April of 2011, 2012 and
2013. The first round was collected a few months before the launch of the CBHI scheme and serves
as a baseline. Sixteen districts located across four main regions of the country (Amhara, Oromiya,
Tigray and SNNPR) are included in the survey. For each region we include all three districts that
implemented the CBHI pilot and one selected non-pilot district. The non-pilot districts were chosen
based on the same criteria that were used to select the pilot districts. Within the districts we applied
a two stage sampling design. Six villages were randomly selected from each of the 16 districts and
within each village 17 households were randomly drawn from the household roster of the village
administrative office. The total sample size in the first round is 1632 households comprising 9,455
individuals. The two follow up surveys were conducted in the same months of the two consecutive
years. Of the original sample households, 98 and 97 percent were re-surveyed in 2012 and 2013,
respectively.
The survey instrument contains information on a variety of individual and household socio-economic
attributes such as consumption expenditure, crop output, off-farm income, assets, outstanding
loans, household demographics, employment and health conditions. The total value of all
outstanding loans at the time of the survey is used to measure indebtedness. We record the number
of various livestock types owned rather than their monetary values. It is important to acknowledge
that although this is less prone to reporting error, we are not able to capture livestock quality and
size differences. Our measures of income are value of crop output and total income in the past 12
months. The latter is the sum of the former and off-farm income. The survey asks if the household
produced any of 33 crop items listed and how much is produced. We calculate the value of crop
production using the per unit sales price of each item. If the household did not sell that item we rely
10
Access to tertiary level care differs across regions. While in Oromiya coverage includes hospitals located
outside the region, in SNNPR they may visit only the nearest public hospital. In Amhara and Tigray, CBHI
enrollees may visit any public hospital within the region but not outside the region.

6
on the median district price of that item in the dataset.11 Off-farm income is calculated by
multiplying the reported average number of days worked in the past month with the average cash
equivalent remuneration per day.12 Our measure of consumption is monthly non-medical per adult
equivalent consumption.13 The survey collected the quantity and monetary value of 41 food items
consumed in the last week and consumption expenditure on 34 non-food items in the past month or
year, depending on the item. Both food and non-food consumption expenditures are then converted
to their monthly equivalents.
In addition to the surveys, we also conducted event history interviews with 42 purposively selected
households across the four regions. We make occasional references to this qualitative information.
4. CBHI and expected effects
As CBHI enables households to get free care once they pay the periodic contributions, it might
decrease the necessity to rely on less preferred coping responses for the sake of meeting health care
costs. For example, Yilma et al. (2014) argue that borrowing is a last resort in the coping response
preference of households which is adopted primarily to meet urgent health care needs.14 Hence, we
expect CBHI to reduce the probability of borrowing/indebtedness. The possible impact on livestock
holding is less clear as households might sell livestock to pay premiums (given this is a preferred
coping response). This is particularly so for small animals that are frequently used as buffer stocks
rather than as productive assets. Dekker and Wilms (2010) also state such possibilities for liquidity-
constrained insured households in Uganda. The possibility that insurance protects households
against the income effects of health shocks has been noted in China (Lindelow and Wagstaff 2005).
There are two ways by which CBHI might affect household income. First, it might reduce the
negative impact on labor supply by facilitating early treatment and fast recovery. Second, as the
following quotes suggest, credit constrained rural households tend to finance health care using cash
that is saved for buying fertilizers or seeds. Subsequent delays in production or loss of productivity
might compromise household income.
“My wife is sick of modern illness, TB. She is recurrently sick and goes to health facilities
quite often. I spent around 5000 birr. Her illness has affected our harvest. Because of health
expenditure, I couldn’t buy inputs of production (high yield seeds and fertilizer) on time and
hence, reduced my output. [Male respondent, Oumbulo Tenkaka Kebele of SNNPR, Interview
conducted on 11th February 2013]”
“My daughter had a stomach complaint for more than a week. I took her to a traditional
healer but she couldn’t get better. Then, I took her to a health center... I spent 300 birr for
that. Due to her illness, I didn’t work on my vegetable garden. As I used the money I put aside
11
If no one sold that item in that district, we take the median price in the zone/region/country from the dataset. 12
Self-employment business is excluded from this figure. Hence, our measure of income is under estimated for some households who engage in these activities. 13
We adopt the age-sex based adult equivalent household size suggested by Dercon and Krishnan (1998). 14
Yilma et al. (2014) also show that selling assets and relying on savings are prominent responses to health shocks in these villages.

7
for seeds, I ran out of cash to buy the seeds to plant my vegetables. Although, after
sometime, I worked off-farm (dig-out sand and sell) and planted vegetables, I do not expect
as much output as I planted it late. [Male respondent, Jara Damuwa Kebele of SNNPR,
Interview conducted on 15th of February 2013]”
5. Methods
The non-random nature of insurance uptake is an important empirical concern in identifying the
causal effect of CBHI. Demand for health insurance may be driven by affordability or latent health
status, in which case simple differences in outcomes between CBHI enrolled and non-enrolled
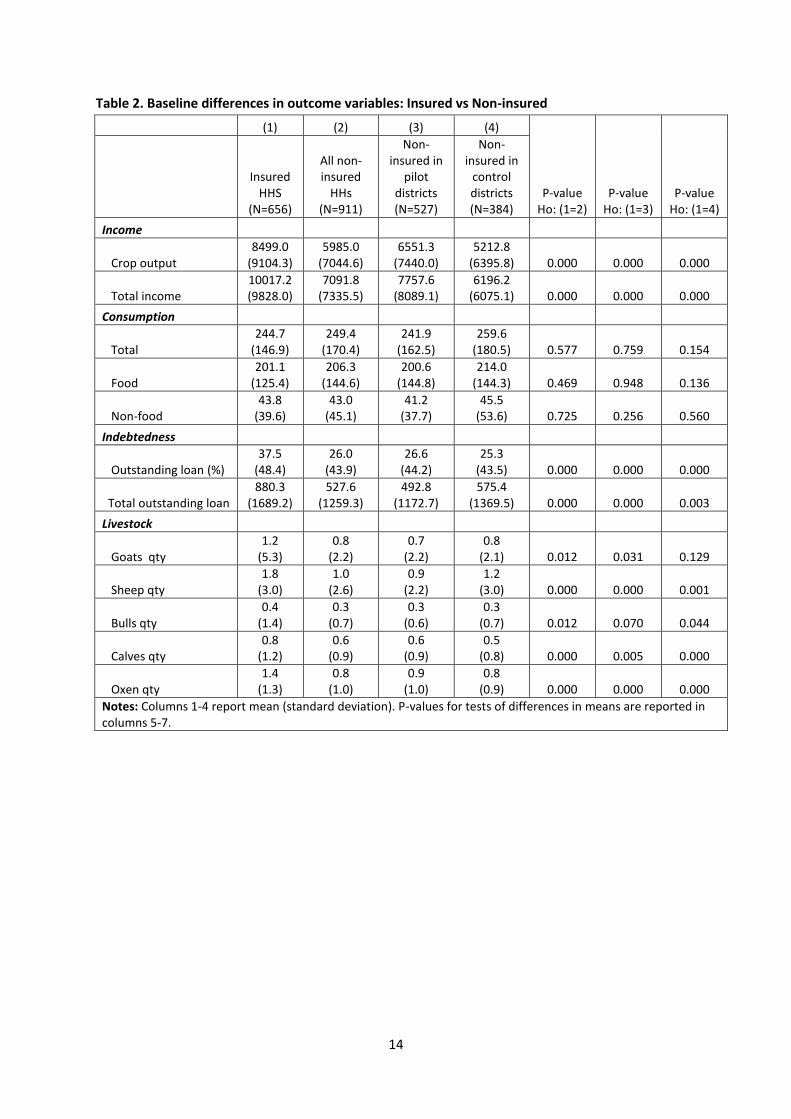
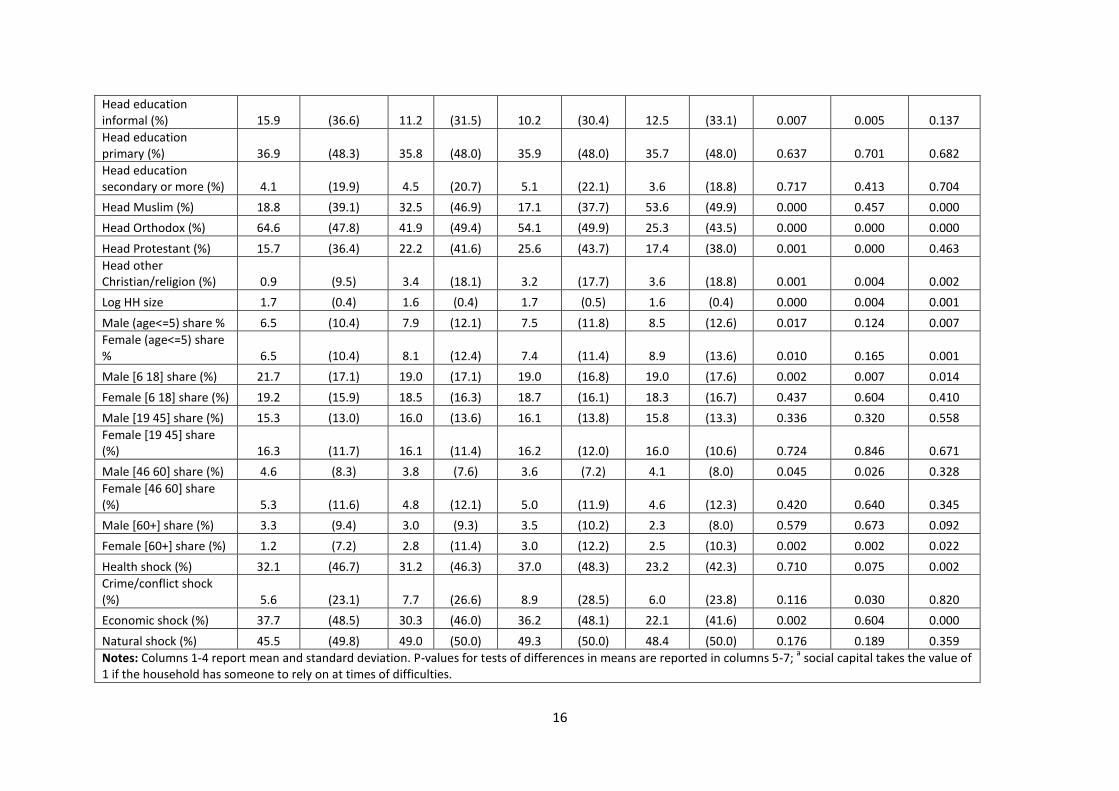
households may not be viewed as causal effects of the scheme. Tables 2 and 3 suggest non-random
uptake. At baseline, households that later take up insurance and those that never insure (both in
pilot and non-pilot districts) are different in a variety of socio-economic characteristics. Those that
take up CBHI have more livestock and income in 2011 although there is no difference in the level of
consumption. Outstanding loans are also higher among those who eventually insure. A naive
comparison of averages in the post CBHI period would tend to lead to overestimates of scheme
impact on income and livestock and underestimates of scheme impact in decreasing indebtedness.
The availability of panel data and a baseline enables us to control for a substantial source of
unobserved heterogeneity. We estimate a household fixed effects model that controls for both
observed and unobserved time-invariant confounding factors (risk aversion and time preferences,
for instance).15 We first estimate
itiittitit XTCBHIY (1)
where itY is the outcome of interest for household i at time t , the dummy variable itCBHI
indicates whether household i is insured in year t , and T reflects year dummy variables for each of
the three years. Household fixed effects are captured by i and it is a random error term. Our
coefficient of interest is , the average treatment effect on the treated of CBHI coverage. In order
to examine the potential role of time varying unobservables we control for a vector of characteristics
itX , which include demographics, various measures of socio-economic status, shocks and
household head characteristics. We estimate the above equation with and without itX . If the
confounding role of time-variant unobserved characteristics is minimal, then we would expect
similar treatment effects across these two specifications. In addition we also estimate (1) after using
propensity score matching (PSM). CBHI uptake is estimated as a function of baseline (2011)
characteristics. We use PSM to drop households which are outside the common support and
subsequently estimate a household fixed effects regression.
As mentioned earlier we have two groups of control households: uninsured households in pilot
districts and those who are from the non-pilot districts. Both of these introduce their own bias. First,
for the pilot districts, selection may induce a bias as insured and uninsured households may be
different due to the voluntary nature of the scheme. Our fixed effects model would avoid this bias
15 Studies have showed that risk attitude is an important factor in households’ insurance enrolment decisions. Monheit and Vistnes (2008), for example, find that the stronger a household’s aversion to risk the higher the probability of taking up insurance.

8
only if selection is based on observed or time-invariant unobserved characteristics. A second
concern for pilot district control households is the possibility of spill-over effects. However, given
that the benefit of CBHI works through the CBHI membership card, for the outcome variables we are
concerned with, spill-over effects are less of a concern.16 The direction of bias due to each of these
could be known separately, however, a priori we cannot determine the direction of the combined
spill-over and selection bias.
To have an indication of the reliability of our estimates, we also use control households in non-pilot
districts. Although these districts are drawn from the same regions and fulfil the criteria stipulated
by the government in selecting CBHI districts, geographical differences raise an additional
identification concern. Household fixed effects model would take care of this if differences are fixed
over time. However, if there are aggregate shocks (negative shocks) particular to non-pilot districts,
then treatment effects based on using this sample would be over estimated. As pointed out earlier,
our dataset is rich. It contains information on 22 different sub-shock types (natural shock,
crime/conflict related shock, health shock and economic shock). We estimate the model with and
without these shocks to check for sensitivity of results.
Finally, there remains a possible confounding effect from other social programs that share targeting
and selection criteria with the CBHI pilot. We are aware of only one such social safety net program in
rural Ethiopia, the PSNP (Productive Safety Net Program). For both sets of control households, we
estimate models with and without an indicator variable for PSNP.
6. Estimates
Table 4 presents average treatment effects on income and consumption using three methods
(household fixed effects without covariates, with covariates before matching and with covariates
after matching) and for different control groups (all control households, non-pilot district control
households and pilot district control households). Across methods we find statistically significant
positive impact on income (crop output and total income) for the pilot district comparison only.
While the magnitudes of the estimates decline as we include time varying covariates and excluding
households that are off-support, we find that crop output and total income increase by ETB 785 and
ETB 1027, respectively. While the coefficients are also positive when we use households in non-pilot
districts as controls, the estimates are not precise. The results provide no evidence that CBHI affects
household consumption, as the coefficients lack statistical significance and the magnitudes are
small.
In table 5 we present estimates for the impact on the amount of outstanding loans, the probability
of having an outstanding loan and livestock holdings. We find a relatively robust negative impact,
across methods and control groups, on the probability of having outstanding loans. The treatment
effect ranges between 4 to 5 percent, depending on the control group.17 There is also an indication
16
This could be possible if CBHI makes members healthier and that has a positive externality to non-member households, say in the case of communicable diseases. If this is true and there is no selection on time-variant unobservables, our treatment effect in the pilot districts will be a lower bound. 17
For pilot district control households this coefficient declines to 3 percent when other covariates are controlled for.

9
of a negative impact on the amount of outstanding loans although it is imprecise. Estimates for all
types of livestock are not statistically significant. The signs of the coefficients are negative for
number of sheep, goats and calves but positive for bigger animals, oxen and bulls. Despite the lack of
statistical significance, negative coefficients for the number of sheep and goats might be due to two
reasons. First, according to our event history analysis, these livestock types are typically used as
buffer stock and households might use them to pay for CBHI premium. Secondly, if these were
previously held as buffer stock to be used at times of unexpected cash needs for health care, CBHI
might induce households to substitute these with productive animals, like oxen.
7. Conclusion
This paper explored the impact of Ethiopia’s pilot voluntary CBHI scheme on household
consumption, income, indebtedness and asset holdings. We makd use of a three round panel
household survey, which included one baseline and two follow-up surveys.. We deployed different
specifications of a household fixed effects model and compared results across different control
groups (within and across pilot and non-pilot districts).
We found that enrolment in CBHI decreases the probability of indebtedness by about 5 percentage
point.. Compared to the proportion of households who were indebted at baseline (30.5 percent),
this is a large decline.. We found no statistically significant impacts on consumption and livestock
holdings. We did find some evidence that CBHI increased annual crop output and total income, but
the results are not robust.
Thus, the main benefit of the scheme is its effect on reducing the need to borrow. This may have
longer-term benefits in reducing vulnerability to other forms of shocks. A related study has found a
sharp impact on increasing health care utilization (Mebratie et al. 2013b). Taken together, while
these successes support the government’s recent move to extend the CBHI pilot to a total of 161
districts, a nationwide scale up requires an examination of the scheme’s financial sustainability.

10
References
Admassie, A., Abebaw, D. and Woldemichael, A.D. (2009). “Impact Evaluation of the Ethiopian
Health Service Extension Program” Journal of Development Effectiveness 1(4): 430-449
Asfaw, A. and von Braun, J. (2004). “Is Consumption Insured against Illness? Evidence on
Vulnerability on Households to Health Shocks in Rural Ethiopia.” Economic Development and
Cultural Change 53(1): 115-129
Chee, G., Smith, K. and Kapinga, A. (2002). “Assessment of Community Health Fund in Hanang
District, Tanzania”. The Partners for Health Reformplus Project, Abt Associates Inc.,
Bethesda, MD.
Dekker, M. and Wilms, A. (2010). “Health Insurance and Other Risk-Coping Strategies in Uganda: The
Case of Microcare Insurance Ltd.” World Development 38(3): 369-378
Dercon, S. and Krishnan, P. (1998). “Changes in Poverty in Rural Ethiopia 1989-1995: Measurement,
Robustness Tests and Decomposition” CSAE WPS/98-7, University of Oxford
Diop, F., Sulzbach, S. and Chankova, S. (2006). “The impact of mutual health organizations on social
inclusion, access to health care, and household income protection: Evidence from Ghana,
Senegal, and Mali” PHRplus, Abt Associates Inc, Bethesda.
Ekman, B. (2004). “Community-Based Health Insurance in Low-Income Countries: A Systematic
Review of the Evidence”. Health Policy and Planning 19(5): 249-270.
Flores, G., Krishnakumar, J., O’Donnell, O., and van Doorslaer E. (2008). “Coping with Health-Care
Costs: Implications for the Measurement of Catastrophic Expenditures and Poverty” Health
Economics 17(12): 1393-1412
FMoH (2008). “Health Insurance Strategy”. Federal Ministry of Health Planning and Program
Department. Addis Ababa.
Genoni, M.E. (2012). “Health Shocks and Consumption Smoothing: Evidence from Indonesia”
Economic Development and Cultural Change 60 (3): 475-506
Gertler, P. and Gruber, J. (2002). “ Insuring Consumption Against Illness” The American Economic
Review 92(1): 51-70
Heltberg, R. and Lund, N. (2009). “Shocks, Coping and Outcomes for Pakistan’s Poor: Health Risks
Predominate” Journal of Development Studies 45(6): 889-910
Islam, A. and Maitra, P. (2012). “Health Shocks and Consumption Smoothing in Rural Households:
Does Microcredit Have a Role to Play? Journal of Development Economics 97(2): 232-243
Jowett, M., Contoyannis,P. and Vinh, N.D. (2003). “The Impact of Public Voluntary Health Insurance
on Private Health Expenditure in Vietnam” Social Science and Medicine 56: 333-342
Leive, A. and Xu, K. (2008). “Coping with Out-of-Pocket Health Payments: Empirical Evidence from 15
African Countries” Bulletin of the World Health Organization 86(11): 849-856

11
Leon, A.S. (2012). “The Cost of Incomplete Consumption Insurance against Health Shocks: Evidence
from Mexico”.
Levine, D., Polimeni, R. And Ramage, I. (2012). “Insuring Health or Insuring Wealth? An experimental
Evaluation of Health Insurance in Rural Cambodia” American Economic Journal XX(XX)
Levy, H. (2002). “The Economic Consequences of Being Uninsured”. Working Paper 12. ERIU
Lindelow, M. and Wagstaff, A. (2005). “Health Shocks in China: Are The Poor and Uninsured Less
Protected? World Bank Policy Research Working Paper 3740. World Bank.
Lu, C., Chin, B., Lewandowski, J.L., Basinga, P., Hirschhorn, L.R., Hill, K., Murray, M. and Binagwaho,
A. (2012). “Towards Universal Health Coverage: An Evaluation of Rwanda Mutuelles in Its
First Eight Years” PLoS ONE 7(6): e39282. doi:10.1371/journal.pone.0039282
Mebraite, A. D., Sparrow, R.A., Alemu, G. and Bedi, A.S. (2013). “Community-Based Health Insurance
Schemes: A Systematic Review” ISS Working Paper Series/General Series. Vol. 568: 1-47
Mebratie, A., Sparrow, R., Yilma, Z., Abebaw, D., Alemu, G. and Bedi, A.S. (2013). Impact of
Ethiopian Pilot Community Based Health Insurance Scheme on Health Care Utilization: A
Household Panel Data Analysis. The Lancet. 381: S92
Mohanan, M. (2013). “Causal Effects of Health Shocks on Consumption and Debt: Quasi-
experimental Evidence from Bus Accident Injuries” The Review of Economics and Statistics
95(2): 673-681
Monheit, A. C., & Vistnes, J. P. (2008). “Health insurance enrolment decisions: preferences for
coverage, worker sorting, and insurance take-up”. Inquiry. 45(2): 153-167.
Population Census Commission, Federal Democratic Republic of Ethiopia (2008) “Summary and
Statistical Report of the 2007 Population and Housing Census” Addis Ababa, Ethiopia.
Preker, A.S., Carrin, G., Dror, D.M., Jakab, M., Hsiao, W. and Arhin-Tenkorang, D. (2002).
“Effectiveness of Community Health Financing in Meeting the Cost of Illness”, Bulletin of the
World Health Organization 80(2): 143-50.
Shimeles, A. (2010). “Community Based Health Insurance Schemes in Africa: The Case of Rwanda”
GU Working Papers in Economics 463. Göteborg: Göteborg University.
Smith, K.V. and Sulzbach, S. (2008). “Community-Based Health Insurance and Access to Maternal
Health Services: Evidence from Three West African Countries”. Social Science & Medicine
66(12): 2460-2473.
Sparrow, R., van de Poel, E., Hadiwidjaja, G., Yumna, A., Warda, N. and Suryahadi, A. (2014). “Coping
with the Economic Consequences of Ill Health in Indonesia.” Health Economics 23(6): 719-
728
Wagstaff, A. (2007). “The Economic Consequences of Health Shocks: Evidence From Vietnam.”
Journal of Health Economics 26(1): 82-100

12
Wagstaff, A. and Lindelow, M. (2010). “Are Health Shocks Different? Evidence From a Multi-Shock
Survey in Laos” World Bank Policy Research Working Paper 5335. World Bank
Wagstaff, A. and Pradhan, M. (2005). “Health Insurance Impacts on Health and Nonmedical
Consumption in a Developing Country” Policy Working Paper Series 3563, The World Bank
Xu, K., Evans, D., Kawabata, K., Zeramdini, R., Klavus, J., and Murray, C.. (2003). “Household
Catastrophic Health Expenditure: a Multicountry Analysis”. The Lancet 326: 111-117
Yilma, Z., Mebratie, A.D., Sparrow, R.A., Abebaw, D., Dekker, M, Alemu, G and Bedi, A.S. (2014)
“Coping with shocks in rural Ethiopia”. Forthcoming in Journal of Development Studies.

13
Table 1. Premium and CBHI uptake per region
Region
Premium per month (ETB) CBHI uptake (%)
For all core HH members
Per each non-core HH member April 2012 April 2013
Tigray 11 2.5 33.9 41.9
Oromiya 15 3 44.2 44.3
SNNPR 10.5 2.1 35.3 35.4
Amhara 3 per any member 49.5 56.1
Total
40.7 44.4
Notes: A one-time registration fee of ETB 5.00 apply for all households; Payment interval :Tigray (annual), Amhara (biannual), Oromiya (annual or biannual), SNNPR (three times a year or quarterly); Core household members include parents and their children below the age of 18.
14
Table 2. Baseline differences in outcome variables: Insured vs Non-insured
(1) (2) (3) (4)
P-value Ho: (1=2)
P-value Ho: (1=3)
P-value Ho: (1=4)
Insured HHS
(N=656)
All non-insured
HHs (N=911)
Non-insured in
pilot districts (N=527)
Non-insured in
control districts (N=384)
Income
Crop output 8499.0
(9104.3) 5985.0
(7044.6) 6551.3
(7440.0) 5212.8
(6395.8) 0.000 0.000 0.000
Total income 10017.2 (9828.0)
7091.8 (7335.5)
7757.6 (8089.1)
6196.2 (6075.1) 0.000 0.000 0.000
Consumption
Total 244.7
(146.9) 249.4
(170.4) 241.9
(162.5) 259.6
(180.5) 0.577 0.759 0.154
Food 201.1
(125.4) 206.3
(144.6) 200.6
(144.8) 214.0
(144.3) 0.469 0.948 0.136
Non-food 43.8
(39.6) 43.0
(45.1) 41.2
(37.7) 45.5
(53.6) 0.725 0.256 0.560
Indebtedness
Outstanding loan (%) 37.5
(48.4) 26.0
(43.9) 26.6
(44.2) 25.3
(43.5) 0.000 0.000 0.000
Total outstanding loan 880.3
(1689.2) 527.6
(1259.3) 492.8
(1172.7) 575.4
(1369.5) 0.000 0.000 0.003
Livestock
Goats qty 1.2
(5.3) 0.8
(2.2) 0.7
(2.2) 0.8
(2.1) 0.012 0.031 0.129
Sheep qty 1.8
(3.0) 1.0
(2.6) 0.9
(2.2) 1.2
(3.0) 0.000 0.000 0.001
Bulls qty 0.4
(1.4) 0.3
(0.7) 0.3
(0.6) 0.3
(0.7) 0.012 0.070 0.044
Calves qty 0.8
(1.2) 0.6
(0.9) 0.6
(0.9) 0.5
(0.8) 0.000 0.005 0.000
Oxen qty 1.4
(1.3) 0.8
(1.0) 0.9
(1.0) 0.8
(0.9) 0.000 0.000 0.000
Notes: Columns 1-4 report mean (standard deviation). P-values for tests of differences in means are reported in columns 5-7.

15
Table 3. Baseline differences in covariates: Insured vs Non-insured
(1) (2) (3) (4) (5) (6) (7)
Insured households
(N=656)
All non-insured households
(N=911)
Non-insured in pilot districts (N=527)
Non-insured in control districts
(N=384)
P-value Ho: (1=2)
P-value Ho: (1=3)
P-value Ho: (1=4)
Mean Std. dev Mean Std. dev Mean Std. dev Mean Std. dev
Health measures
Head ADL Index 0.044 (0.136) 0.054 (0.151) 0.063 (0.167) 0.042 (0.124) 0.181 0.033 0.792
Any illness 46.8 (49.9) 46.9 (49.9) 51.2 (50.0) 40.9 (49.2) 0.977 0.130 0.064
Any chronic illness 16.3 (37.0) 17.1 (37.7) 20.3 (40.3) 12.8 (33.4) 0.671 0.076 0.122
Any paralysis 4.9 (21.6) 3.4 (18.1) 4.4 (20.4) 2.1 (14.3) 0.143 0.677 0.024
Any poor/very poor SAH 15.9 (36.6) 11.9 (32.3) 15.4 (36.1) 7.0 (25.6) 0.022 0.820 0.000
Covariates
Head does not work 1.2 (11.0) 1.9 (13.5) 1.7 (13.0) 2.1 (14.3) 0.314 0.484 0.275
Head farmer (%) 93.6 (24.5) 87.5 (33.1) 91.3 (28.3) 82.3 (38.2) 0.000 0.130 0.000
Head domestic worker (%)) 2.6 (15.9) 5.7 (23.2) 3.6 (18.7) 8.6 (28.1) 0.003 0.313 0.000
Head other employment (%) 2.6 (15.9) 4.9 (21.7) 3.4 (18.2) 7.0 (25.6) 0.019 0.406 0.001
PSNP member (%) 25.8 (43.8) 20.9 (40.7) 10.3 (30.5) 35.2 (47.8) 0.022 0.000 0.001
Asset quintile 1 (%) 10.5 (30.7) 24.9 (43.3) 23.3 (42.3) 27.1 (44.5) 0.000 0.000 0.000
Asset quintile 2 (%) 15.5 (36.3) 23.3 (42.3) 22.2 (41.6) 24.7 (43.2) 0.000 0.003 0.000
Asset quintile 3 (%) 19.4 (39.5) 21.2 (40.9) 21.1 (40.8) 21.4 (41.0) 0.377 0.468 0.439
Asset quintile 4 (%) 23.9 (42.7) 17.8 (38.3) 18.2 (38.6) 17.2 (37.8) 0.003 0.017 0.011
Asset quintile 5 (%) 30.6 (46.1) 12.8 (33.5) 15.2 (35.9) 9.6 (29.5) 0.000 0.000 0.000
Social capital (%)a 40.5 (49.1) 35.6 (47.9) 34.4 (47.6) 37.2 (48.4) 0.051 0.033 0.306
Head is male (%) 88.1 (32.4) 85.6 (35.1) 86.1 (34.6) 84.9 (35.9) 0.153 0.315 0.138
Head age 47.3 (13.1) 45.6 (14.5) 46.4 (14.7) 44.5 (14.2) 0.022 0.319 0.001
Head has no education (%) 43.1 (49.6) 48.5 (50.0) 48.8 (50.0) 48.2 (50.0) 0.032 0.050 0.109
16
Head education informal (%) 15.9 (36.6) 11.2 (31.5) 10.2 (30.4) 12.5 (33.1) 0.007 0.005 0.137
Head education primary (%) 36.9 (48.3) 35.8 (48.0) 35.9 (48.0) 35.7 (48.0) 0.637 0.701 0.682
Head education secondary or more (%) 4.1 (19.9) 4.5 (20.7) 5.1 (22.1) 3.6 (18.8) 0.717 0.413 0.704
Head Muslim (%) 18.8 (39.1) 32.5 (46.9) 17.1 (37.7) 53.6 (49.9) 0.000 0.457 0.000
Head Orthodox (%) 64.6 (47.8) 41.9 (49.4) 54.1 (49.9) 25.3 (43.5) 0.000 0.000 0.000
Head Protestant (%) 15.7 (36.4) 22.2 (41.6) 25.6 (43.7) 17.4 (38.0) 0.001 0.000 0.463
Head other Christian/religion (%) 0.9 (9.5) 3.4 (18.1) 3.2 (17.7) 3.6 (18.8) 0.001 0.004 0.002
Log HH size 1.7 (0.4) 1.6 (0.4) 1.7 (0.5) 1.6 (0.4) 0.000 0.004 0.001
Male (age<=5) share % 6.5 (10.4) 7.9 (12.1) 7.5 (11.8) 8.5 (12.6) 0.017 0.124 0.007
Female (age<=5) share % 6.5 (10.4) 8.1 (12.4) 7.4 (11.4) 8.9 (13.6) 0.010 0.165 0.001
Male [6 18] share (%) 21.7 (17.1) 19.0 (17.1) 19.0 (16.8) 19.0 (17.6) 0.002 0.007 0.014
Female [6 18] share (%) 19.2 (15.9) 18.5 (16.3) 18.7 (16.1) 18.3 (16.7) 0.437 0.604 0.410
Male [19 45] share (%) 15.3 (13.0) 16.0 (13.6) 16.1 (13.8) 15.8 (13.3) 0.336 0.320 0.558
Female [19 45] share (%) 16.3 (11.7) 16.1 (11.4) 16.2 (12.0) 16.0 (10.6) 0.724 0.846 0.671
Male [46 60] share (%) 4.6 (8.3) 3.8 (7.6) 3.6 (7.2) 4.1 (8.0) 0.045 0.026 0.328
Female [46 60] share (%) 5.3 (11.6) 4.8 (12.1) 5.0 (11.9) 4.6 (12.3) 0.420 0.640 0.345
Male [60+] share (%) 3.3 (9.4) 3.0 (9.3) 3.5 (10.2) 2.3 (8.0) 0.579 0.673 0.092
Female [60+] share (%) 1.2 (7.2) 2.8 (11.4) 3.0 (12.2) 2.5 (10.3) 0.002 0.002 0.022
Health shock (%) 32.1 (46.7) 31.2 (46.3) 37.0 (48.3) 23.2 (42.3) 0.710 0.075 0.002
Crime/conflict shock (%) 5.6 (23.1) 7.7 (26.6) 8.9 (28.5) 6.0 (23.8) 0.116 0.030 0.820
Economic shock (%) 37.7 (48.5) 30.3 (46.0) 36.2 (48.1) 22.1 (41.6) 0.002 0.604 0.000
Natural shock (%) 45.5 (49.8) 49.0 (50.0) 49.3 (50.0) 48.4 (50.0) 0.176 0.189 0.359
Notes: Columns 1-4 report mean and standard deviation. P-values for tests of differences in means are reported in columns 5-7; a social capital takes the value of
1 if the household has someone to rely on at times of difficulties.

17
Table 4. Welfare effects of CBHI
FE without covariates FE with covariates FE with covariates after matching
a
All districts
control districts
Pilot districts
All districts
control districts
Pilot districts
All districts
control districts
Pilot districts
Income
Crop output 673.6 497.8 1,105** 459.9 286.6 816.4* 418.6 243.8 785.4*
(476.8) (577.5) (466.0) (477.4) (572.4) (460.7) (481.8) (573.8) (470.1)
Total income 971.6* 755.7 1,484** 675.7 427.8 1,092* 593.9 338.2 1,027*
(564.7) (631.3) (587.8) (571.3) (632.7) (593.6) (577.3) (633.7) (604.2)
Consumption
Total 25.59 24.98 20.34 18.01 25.03 12.38 -6.556 -1.874 -14.96
(28.75) (33.50) (32.68) (27.45) (30.75) (33.02) (21.34) (24.82) (26.35)
Food 26.35 27.59 19.39 18.59 26.94 10.87 -5.655 0.405 -16.18
(27.86) (32.57) (31.65) (26.70) (29.95) (32.25) (20.67) (23.92) (25.68)
Non-food 0.210 -1.143 2.167 0.113 -1.044 2.436 0.0201 -1.285 2.467
(2.907) (3.451) (3.075) (2.969) (3.581) (3.166) (3.047) (3.748) (3.228)
Notes: The column headings refer to which set of non-insured households are used in the analysis. i.e all districts (all non-insured households
included), control districts (only non-insured households in control districts included), pilot districts (only non-insured households in pilot districts
included). Standard errors (in parentheses) are clustered at the village level; *** p<0.01, ** p<0.05, * p<0.1; a
results are broadly similar when
excluding the time-varying covariates; A list of covariates is given in Table 3.

18
Table 5. Welfare effects of CBHI
FE without covariates FE with covariates FE with covariates after matching
a
All districts
control districts
Pilot districts
All districts
control districts
Pilot districts
All districts
control districts
Pilot districts
Indebtedness
Loan (0/1) -0.0539** -0.0572** -0.0412* -0.0506** -0.0540** -0.0340 -0.0483** -0.0484** -0.0341
(0.0221) (0.0237) (0.0237) (0.0222) (0.0237) (0.0238) (0.0225) (0.0235) (0.0243)
Loan amount -43.50 -39.48 -29.20 -44.87 -51.24 -16.72 -36.24 -38.18 -10.62
(70.60) (78.52) (72.77) (69.76) (77.20) (70.32) (70.81) (77.93) (71.84)
Livestock
Goats # -0.0801 -0.00357 -0.111 -0.0835 -0.0357 -0.129 -0.0836 -0.0247 -0.136
(0.145) (0.126) (0.157) (0.141) (0.124) (0.151) (0.145) (0.127) (0.156)
Sheep # -0.0434 0.0190 -0.0817 -0.0321 0.0237 -0.0808 -0.0336 0.0205 -0.0808
(0.114) (0.132) (0.113) (0.113) (0.129) (0.114) (0.114) (0.130) (0.115)
Bull # 0.0445 0.0368 0.0285 0.0453 0.0421 0.0247 0.0458 0.0447 0.0209
(0.0352) (0.0398) (0.0343) (0.0362) (0.0415) (0.0349) (0.0368) (0.0425) (0.0356)
Calves # 0.00694 -0.00756 0.0164 -0.0177 -0.0360 -0.00440 -0.0210 -0.0380 -0.00400
(0.0634) (0.0583) (0.0631) (0.0631) (0.0547) (0.0647) (0.0644) (0.0562) (0.0664)
Oxen # 0.0558 0.0723 0.0439 0.0451 0.0590 0.0286 0.0439 0.0574 0.0277
(0.0474) (0.0514) (0.0476) (0.0452) (0.0480) (0.0467) (0.0464) (0.0495) (0.0483)
Notes: The column headings refer to which set of non-insured households are used in the analysis. i.e all districts (all non-insured households
included), control districts (only non-insured households in control districts included), pilot districts (only non-insured households in pilot districts
included). Standard errors (in parentheses) are clustered at the village level; *** p<0.01, ** p<0.05, * p<0.1; a
results are broadly similar when
excluding the time-varying covariates; A list of covariates is given in Table 3 (in the case of livestock we exclude the asset index quintiles as the index
includes number of livestock).