impact of economic recession induced problems on...
TRANSCRIPT

Journal of Emerging Issues in Economics, Finance and Banking (JEIEFB)
An Online International Research Journal (ISSN: 2306-367X)
2017 Vol: 6 Issue: 2
2334 www.globalbizresearch.org
Impact of Economic Recession –
Induced Problems on Nigerian Economic Growth
Georgina Obinne Ugwuanyi,
College of Management Sciences,
Michael Okpara University of Agriculture, Nigeria.
E-mail: [email protected]
Chinelo Jenevive Obiekwe,
College of Management Sciences,
Michael Okpara University of Agriculture, Nigeria.
E-mail: [email protected]
___________________________________________________________________________
Abstract
This study examines the Impact of Economic Recession –induced problems on the Nigerian
economic growth for the period 1985 to 2015. The major objective of this research is to
ascertain the impact of these problems on Nigerian economic growth. The study adopted ex-
post-facto research design. Data were obtained from secondary sources mainly from: Central
Bank of Nigeria published statistical Bulletin of 2015, Nigeria’s Bureau for Statistics quarterly
reports, and World Bank Development Indicator. As the unit root test on the time series data
revealed a combination of I(0) and I (1) variables, the Auto-regressive Distributed Lag (ARDL)
Model technique was employed for data estimation. The findings reveal that focusing on the
short run relationship, most of the explanatory variables and their lags are significant functions
of Nigerian economic growth at 5% level of significance. Conclusively, all the economic
recession induced outcomes under study responded significantly and negatively or positively
to economic growth contemporaneously or with a lapse of time (lag). For the independent
variables under study and their lags, only exchange rate with time lapses of three years
produced a negative impact of 8% reduction on the Nigerian economic growth while other
variables (public debt with four years lapses of time, unemployment rate with a year lapse of
time, and the lagged dependent variable (lagged GDP as a regressor) impacted positively on
the economic growth producing 4%, 6% and 84% increase on the GDP (at every1% change),
respectively. This broadly means that economic growth is the function of the recession induced
variables.
___________________________________________________________________________
Key Words: Economic recession, Recession –induced problems, Economic Growth,
Nigeria
JEL Classification: H 3

Journal of Emerging Issues in Economics, Finance and Banking (JEIEFB)
An Online International Research Journal (ISSN: 2306-367X)
2017 Vol: 6 Issue: 2
2335 www.globalbizresearch.org
1. Introduction
In a layman’s understanding, a recession is a period of general economic slowdown. But in
economics, a recession is a negative growth in GDP for two consecutive quarters.
According to Dictionary of Contemporary English, New edition for advanced learners, a
recession is a difficult time when there is less trade, business activity, etc in a country than
usual. A recession also means a slowdown in Gross Domestic Product or National outputs. The
business dictionary also defines recession as a period of general economic decline usually as a
contraction in the GDP for six months (two consecutive quarters). A recession will typically be
characterized by high unemployment, falling average incomes, increased inequality and higher
government borrowing, etc (Tejvan, 2012). Uzie (2016) also added that the greatest recession
of 2008 to 2012 has shown many of the negative impact of recession to workers and also has
resulted to: high inflation rate, increase in crime rate, and strained family relationship.
Equity (2017) noted that during any recession, every news in the headings of newspapers
are about unemployment figures in which the families encountering the recession keep
suffering, and silently too. The citizens make extra efforts to let ends meet hoping that economy
will soon turn around yet all to no avail. Although many families strive to keep afloat as if
nothing wrong happens, gradually the recession can impose profound effect on the day-to-day
activities of these citizens and on their ways of living their lives.
When a recession lasts for a long time it becomes depression, hence, a depression is a deep and
long lasting recession (Investopedia, 2017, L.L.C). An economic recession is not a permanent
situation but rather a temporal one; hence hopefully Nigerian economy will soon bounce back
in a short while.
If economic recession lingers on in a country, it induces some problems that are bound to
impact on the growth of the economy or sometimes directly on the basic physiological needs
of such country’s citizens hence the need for this research study which investigates into the
impact of economic recession-induced problems on Nigerian economic growth.
1.1 Objectives of the Research
The main objective of this research is to examine the impact of Economic Recession Induced
problems on the Nigerian economic growth.
The specific objective is to:
i) Ascertain the extent of impact of economic recession induced problems on Nigerian
economic growth.
1.2 Hypothesis
The researcher formulated the following hypothesis for the study:
Ho1: Economic recession-induced problems have no significant impact on Nigerian
economic growth.
Journal of Emerging Issues in Economics, Finance and Banking (JEIEFB)
An Online International Research Journal (ISSN: 2306-367X)
2017 Vol: 6 Issue: 2
2336 www.globalbizresearch.org
2. Literature Review
2.1 Conceptual Framework
A global recession is the recession that affects many countries around the world, that is, a
period of global economic-slow down or declining economic output (Wikipedia, 2017).
However, an economic recession is typically defined as a significant decline in economic
activity, real GDP, real income, employment industrial production and sales following a decline
in the aggregate demand for at least two consecutive quarters (myaccountrycourse.com, 2017).
On the other hand, the National Bureau of economic research (NBER) defined recession as a
“significant decline in economic activity. The National Bureau of Economic Research (NBER)
defined a recession as a “significant decline in economic activity spread across the economy,
lasting more than a few months, normally visible in a real gross domestic product (GDP), real
income, employment, industrial production and wholesale-retail sales” (Noko,
2016;NBER,2008).
The setup of economic recession gradually induced its effect in ripples: when the
government imposes higher interest rates, the cost of money rises, thus lowering consumer and
government borrowing. The consumer confidence also declines hence lowering the demand for
goods and services; if business operations are difficult to be financed by means of borrowing,
the firms start retrenching their staff thereby increasing unemployment. Eventually when
recession follows the downward phase of an economy (with stagnation or decline in the
investment, reduction of income, and increase of unemployment), the economy either enters a
recession or it resumes to the expansion phase (myaccountingcourse.com).
According to Tejvan (2011) therefore, there are several problems induced by economic
recession such as:
Falling Output: This means that less will be produced resulting to lower real GDP and
lower average incomes. Wages tend to rise much more slowly or not at all.
Unemployment: a rise in cyclical unemployment is the biggest problem of recession.
Higher Government Borrowing: As levels of government borrowing increases, it
leads to higher interest rates costs.
Devaluation in Exchange rate and others such as falling asset prices, falling share
prices, social problems associated with rising unemployment; increased inequality, etc.
2.2 History of Economic Recession
In the history of economic recession there was a recession called Wall Street Crash that took
place in 1929. The international Monetary Fund defines a global recession as “a decline in
annual per-capita real world GDP (purchasing power parity weighted), backed up by a decline
or worsening for one or more of the seven other global macro-economic indicators. Industrial
production, trade, capital flows, oil consumption, unemployment rate, per-capita investment,
Journal of Emerging Issues in Economics, Finance and Banking (JEIEFB)
An Online International Research Journal (ISSN: 2306-367X)
2017 Vol: 6 Issue: 2
2337 www.globalbizresearch.org
and per-capita consumption (Wall Street Journal, 2009; Economic Outlook, 2009). By this
definition since World War II only four global recessions existed (in 1975, 1982, 1991 and
2009). Each of them lasted for a year (but the 1991 recession would have lasted until 1993 if
the IMF had used normal exchange rate weighted per capita real world GDP rather than the
purchasing power parity weighted per capita real world GDP). (Wall Street Journal 2009;
World Economic Outlook 2009). The 2009 global recession called the Great Recession, was by
far the worst of the four war recessions, both in terms of the number of countries affected and
the decline in real world GDP per capita (Wall street Journal; 2009; World Economic Outlook,
2009).
Prior to April 2009, the IMF argued that a global annual real GDP growth rate of 3.0 percent
or less was “equivalent to a global recession (Economist.com; 2008; Lall, Subir, 2008) Based
on this measure, there have been six global recessions since 1970:
1974-75 (http://www.imf.org/external/pubs,2009
1980 – 83 (http://www.imf.org/external/pubs, 2004
1990 – 93 (Bloombere.com,2008)
1998 (Bloomberg.com,2008)
2001-02 (Bloomberg.com,2008)
2008-2009 (World Economic Outlook, 2013)
By distinction therefore a national recession is identified by two quarters of decline.
Furthermore, a developing country is expected to have a higher GDP growth than a Developed
country (IMF World Economic Outlook, 2008).
According to IMF, the real GDP growth of the emerging and developing countries is on an
uptrend and that of the advanced economies is on a downtrend since 1980s (Wikipedia, the free
encyclopedia)
Nigeria’s first full year recession began in the year 1987 with output contracted to 0.4
percent in the first quarter from a year earlier, and 0.7 percent point in the fourth quarter
(Bohlund, 2016). In 2006, there occurred a recession called the bursting of the real estate bubble
on the summer which originally led to the bankruptcy of a large number of floating rate
mortgages and then moved to the market of corporate subordinated bonds issued to finance
securitized mortgages. The outcome was a wave of collapse, mergers, and nationalizations after
September 2008.
The 2008 recession is said to be one of the major economic recessions called subprime
mortgage crisis. The consequence of the subprime crisis gave birth to instant movement to the
financial markets of other countries causing a surprise decline of 40 to 70% (my accounting
course, 2017).
Journal of Emerging Issues in Economics, Finance and Banking (JEIEFB)
An Online International Research Journal (ISSN: 2306-367X)
2017 Vol: 6 Issue: 2
2338 www.globalbizresearch.org
2.3 Recession Indicators
The technical indicator of a recession is two consecutive quarters of negative quarters of
economic growth as measured by a country’s Gross Domestic Product (GDP), although the
National Bureau of Economic Research (NBER) does not necessarily need to see this occur to
call it a recession (Investoperdia, 2017, LLC).
Besides the two consecutive quarters of GDP decline, economists have two categories of
recession indicators:
(i) Leading indicators that materialize prior to official declaration of recession. This
is the most common leading indicator being the contraction in the stock market.
Declines in bread stock indices such as Dow Jones Industrial Average (DJIA) and
standard of poor’s (S & P) 500 index, often appear several months prior to a
recession taking place. This exemplifies 2007 case where the market began
declining in August, four months ahead of the official recession in December 2007
(Investopedia, 2017, LLC).
(ii) Lagging Indicators: These of a recession include unemployment rate. Though the
Great Recession began in December 2007, the unemployment rate still indicated
full employment - a rate of 5% or lower – four months later. The unemployment
rate began declining in May 2008, and did not recover until several months after
the recession ended in June, 2009. (Investopedia, 2017 LLC).
Recession: Way Forward
A professor of History and former transitional chairman of the movement for the survival
of Ogoni People (MOSOP), Ben Naanen suggested that the Federal Government of Nigeria
should return to history in order to find out why various economic reforms have failed in the
past and that our leaders should head towards an economic rebirth. He further argued that the
government must have to spend its way out of the recession by creating jobs, revitalizing
businesses; to pull the country out of the recession, and also boost education and utilize the
abundant human capital the nation has (Naanen, 2016).
2.4 Theoretical Review
There exist some theories proposed by earlier researchers on the areas of economic recession
and the impact of the induced problems on economic growth and basic physiological needs.
These are:
2.5 Keynesian Economic Theory in recession
Keynes (1936), first presented his theories forming the basis of the Keynesian economics
during the Great Depression. These are the different theories of how in the short run, and
especially during recession economic output is strongly influenced by aggregate demand (total
spending in the economy). Keynes opined that in recession, that the way to break the cycle is
Journal of Emerging Issues in Economics, Finance and Banking (JEIEFB)
An Online International Research Journal (ISSN: 2306-367X)
2017 Vol: 6 Issue: 2
2339 www.globalbizresearch.org
for the government to push in spending heavily into the economy by building roads and bridges
and other public works. He argued that level of economic activity is dependent on aggregate
demand and that if demand comes low it results to recession and high unemployment.
2.6 Hangover Theory
Krugmen (1998) in this theory gives an idea that slumps are the price we pay for booms,
meaning that the suffering an economy experiences during a recession is a necessary
punishment for the excesses of the previous expansion. After a long argument on this theory by
comparing it with Keynesiansism and Austrian theorists for and against the above theory, this
theory was said to have turned out to be intellectually incoherent since nobody has managed to
explain why bad investments in the past require the unemployment of good workers in the
present. It was then concluded that often if not always that “it is ideas, not vested interests that
are dangerous for good or evil (www.pkarchive.org)
2.7 Empirical Review
Impact of Economic Recession on Economic Growth and Citizens
Massavrat and Sha (2015) carried out a research to assess the impact of recession on
Consumer’s behavior as an empirical study in Dubai. Their aim was to understand the impact
of global recession on consumer shopping behavior and how consumer consumption and saving
pattern changed across different product categories during and after recession. A total of 235
respondents were issued structured questionnaire. Paired sample t-test and ANOVA were
employed to analyse the data. The research finding revealed empirical evidence that the
priorities of the consumers significantly changed after recession.
Gautan, et al (2014) carried out a research on global recession and its impact on
telecommunications industry as an empirical dissection. The study’s objective included
analyzing the flows of foreign Direct Investments in telecom sector in India and also examining
the reasons behind consistency in FDIs during global financial crisis period. Findings revealed
that even with recession, India has witnessed a steady growth in the economy with the FDI’s
inflows and the telecom sector and its various project were not hindered by global crisis.
Economic recession-induced problems do not only affect the economic growth but also
impose mental health disorders on some Nigerian citizens. For instance, recently, in Nigeria,
there have been increases in cases of documented suicides, violent crimes, depression, and
alcohol dependency among other vices that go with economic recession (Muanya, 2016). Even
the WHO statistics (2012) ranks Nigeria 102 among the list of nations in the incidence of
suicide among the population, with an annual figure of 6.5 for every 100,000 in the population
and a strong male preponderance. (Muanya, 2016)

Journal of Emerging Issues in Economics, Finance and Banking (JEIEFB)
An Online International Research Journal (ISSN: 2306-367X)
2017 Vol: 6 Issue: 2
2340 www.globalbizresearch.org
Opejobi (2017) also reported of a medical doctor by name Allwel Orji who jumped into
Lagos lagoon on March 21, reason being that government left doctors on half pay, irregular pay
or no pay at all because of recession –induced cash contraction in Nigerian economy.
Also, Olugbile (2017) who is a consultant psychiatrist and former chief Director of Lagos
State University Teaching Hospital (LASUTH) Ikeja, of past Nigeria also confirmed that there
is a positive relationship between economic recession and mental health disorders.
Rahman,Galvan and Martinez (2017) explored into the root causes, consequences and
recoveries of the economic recession for the sustainable economic growth in spain. They
employed a systematic examination of past researches on economic recession topics. The
findings reveal that one of the main reasons for the Spanish deep economic recession was the
burst of the housing bubble while one of the most prominent consequences is the increasing
unemployment and one of the most important recovery measures taken by the government was
the faster adjustment in the housing sector. The research concluded that Spain is facing its worst
crisis in the last fifty years and that the Spanish economic recovery depends specially on two
facts: that at the National level ,the reforms implemented over the past two years should be
pursued further while still initiating structural reforms in other areas; also that the process of
bank restructuring should be completed and the model of state organization should be
redesigned..ii) that at the European level , solutions should be promoted to eliminate the
fundamental problems of the Eurozone, the restrictions on the European Central Bank’s
intervention and the lack of fiscal integration (Paul,2010)
3. Methodology
3.1 Research Design
The study adopted ex-post-facto research design as the incidence bringing about the data
has occurred in the time past and hence, the researcher cannot manipulate them. Economic
growth is proxied by Real GDP as the dependent variable while the independent variables are
the indicators of the economic recession induced problems: public debt, unemployment rate
and the real exchange rate.
3.2 Research Questions
i) To what extent has economic recession induced problems impacted on the Nigerian
economic growth?
3.3 Data
Datasets were obtained from secondary sources mainly from Central Bank of Nigeria’s
published statistical Bulletin of 2015 and from Nigeria’s Bureau for statistics quarterly reports
of various issues, while the data for real effective exchange rate were sourced from World Bank
Development Indicators.

Journal of Emerging Issues in Economics, Finance and Banking (JEIEFB)
An Online International Research Journal (ISSN: 2306-367X)
2017 Vol: 6 Issue: 2
2341 www.globalbizresearch.org
The data so collected is annualized time series and covers the years 1985-2015. The choice
of the year 1985 is to have at least two years before the 1985 first full year recession in Nigeria.
Table 3.1: Datasets of Real Gross Domestic Product and the Variables Resulting
from Economic Recession Inducement:
YEAR RGDP PDEBT UNER REER
1985 14,953.91 40.48 6.10 489.6102
1986 15,237.99 45.25 5.30 267.468
1987 15,263.93 69.89 7.00 85.21023
1988 16,215.37 137.57 5.30 85.62721
1989 17,294.68 180.98 4.50 76.24926
1990 19,305.63 287.44 3.50 70.74783
1991 19,199.06 382.71 3.10 59.96909
1992 19,620.19 444.65 3.40 49.74446
1993 19,927.99 722.22 2.70 54.50262
1994 19,979.12 906.98 2.00 100.7952
1995 20,353.20 1056.39 1.80 160.1283
1996 21,177.92 1194.59 3.40 207.6351
1997 21,789.10 1037.29 3.20 235.9241
1998 22,332.87 1097.68 3.20 272.3435
1999 22,449.41 1193.84 3.00 70.14648
2000 23,688.28 3372.18 18.10 69.86898
2001 25,267.54 3995.63 13.70 77.83398
2002 28,957.71 4193.27 12.20 78.0773
2003 31,709.45 5098.89 14.80 73.19962
2004 35,020.55 6260.59 11.80 74.90703
2005 37,474.95 4220.97 11.90 85.54584
2006 39,995.50 2204.72 12.30 91.50221
2007 42,922.41 2608.52 12.70 89.64672
2008 46,012.52 2843.56 14.90 99.12479
2009 49,856.10 3818.46 19.70 92.13576
2010 54,612.26 5241.65 21.10 100
2011 57,511.04 6519.69 23.90 100.3086
2012 59,929.89 7564.44 25.40 111.3909
2013 63,218.72 8492.55 23.50 118.8171
2014 67,152.79 9535.54 24.30 127.1006
2015 69,023.93 10948.53 126.0723
Source: Central Bank of Nigeria Statistical Bulletin 2015; World Bank Development Indicators
The above table 3.1 represents the used datasets at level series. The datasets however, were
treated in order to standardize them before use.
3.4 Model Framework
This study follows the Autoregressive Distributed Lag Model as developed and popularized
by Pesaran, Shin and Smith (2001). The technique has several advantages over other methods
for which cause it is chosen for this work. Firstly, it is efficient in small samples and not

Journal of Emerging Issues in Economics, Finance and Banking (JEIEFB)
An Online International Research Journal (ISSN: 2306-367X)
2017 Vol: 6 Issue: 2
2342 www.globalbizresearch.org
restricted in terms of stationary properties of the variables under study. The approach can allow
for a combination of I(0) and I(1) variables.
Following this method, the model below chosen as the optimal model following the Akaike
Information criterion is estimated. The optimal lag is (1,4,4,3) and the model is shown below:
LRGDP = BO + B1 LRGDPt-1 + B2 LREERt + B3LREERt-1 + B4LREERt-2 + B5LREERt-3 +
B6LREERt-4 + B7LPDEBT+ B8 LPDEBTt-1 + B9LPDEBTt-2+ B10LPDEBTt-3+ B11LPDEBTt-4+
B12LUNER+ B13LUNERt-1 + B14LUNERt-2+ B15LUNERt-3+ ᶓt -------------------------------------------… Eq. 1
RGDP= Real gross Domestic Product
REER= Real Effective Exchange Rate
PDEBT=Public Debt
REER t-1 t-4 = Lag of Real Effective Exchange Rate
PDEBT t-1 t-4 =lag of public Debt
UNER t-1 t-3=lag of Unemployment rate
0 = intercept
1 ----- 15 = Coefficients of variables
ᶓt ------------------ error term
4. Results and Discussion
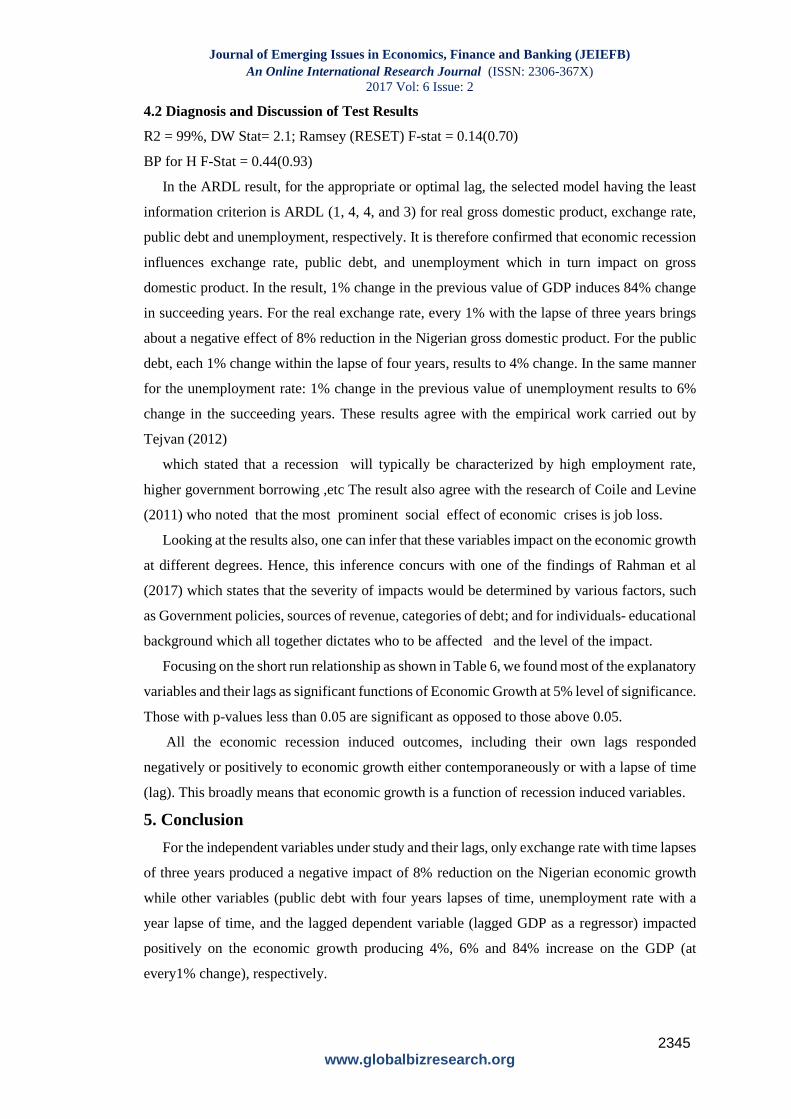
Standard and Basic descriptive statistics were applied on the datasets to confirm their basic
characteristics as follows:
Table 2: Summary of Descriptive Statistics
Variables Mean Median Maximum Minimum Std
Deviation
Skewness Kurtosis Number of
observations
LPDEBT 7.23 7.69 9.30 3.70 1.61 -0.75 2.57 31
LREER 4.65 4.52 6.19 3.91 0.52 1.24 4.17 31
LRGDP 10.27 10.07 11.14 9.61 0.50 0.40 1.75 31
LUNER 2.04 2.21 3.23 0.59 0.85 -0.11 1.57 30
Table 2 above shows aggregative averages like the mean, median as well as measures of
spread and variation like standard deviation. It also shows skewness which is a measure of the
degree of symmetry and kurtosis which is a show of the degree of peakedness of the
observation. The results on skewness and kurtosis suggest a departure from normality. This is
not a point that is strong enough to discredit the goodness of the dataset for the analyses in
view.
Table 3: Summary of Unit Root Test Results
S/No Variables ADF Stat Critical Values Probability
Value
Inference
1% 5% 10%
1. LRGDP -3.10 -3.67 -2.97** -2.628* 0.038 I(1)
2. LREER -3.70 -3.67*** -2.96** -2.62* 0.009 I(0)
3. LUNER -6.00 -4.32*** -3.58** -3.23* 0.000 I(1)
4. LPDEBT -4.24 -4.30 -3.57** -3.22* 0.011 I(1)
The Unit root test results in Table 3 above show that the variables are integrated of different
orders which justifies the use of the Autoregressive distributed Lag Model (ARDL). While
Journal of Emerging Issues in Economics, Finance and Banking (JEIEFB)
An Online International Research Journal (ISSN: 2306-367X)
2017 Vol: 6 Issue: 2
2343 www.globalbizresearch.org
LRGDP, LUNER and LPDEBT are of order one variables following the ADF test, LREER is
order zero. This combination essentially validates the choice of ARDL.
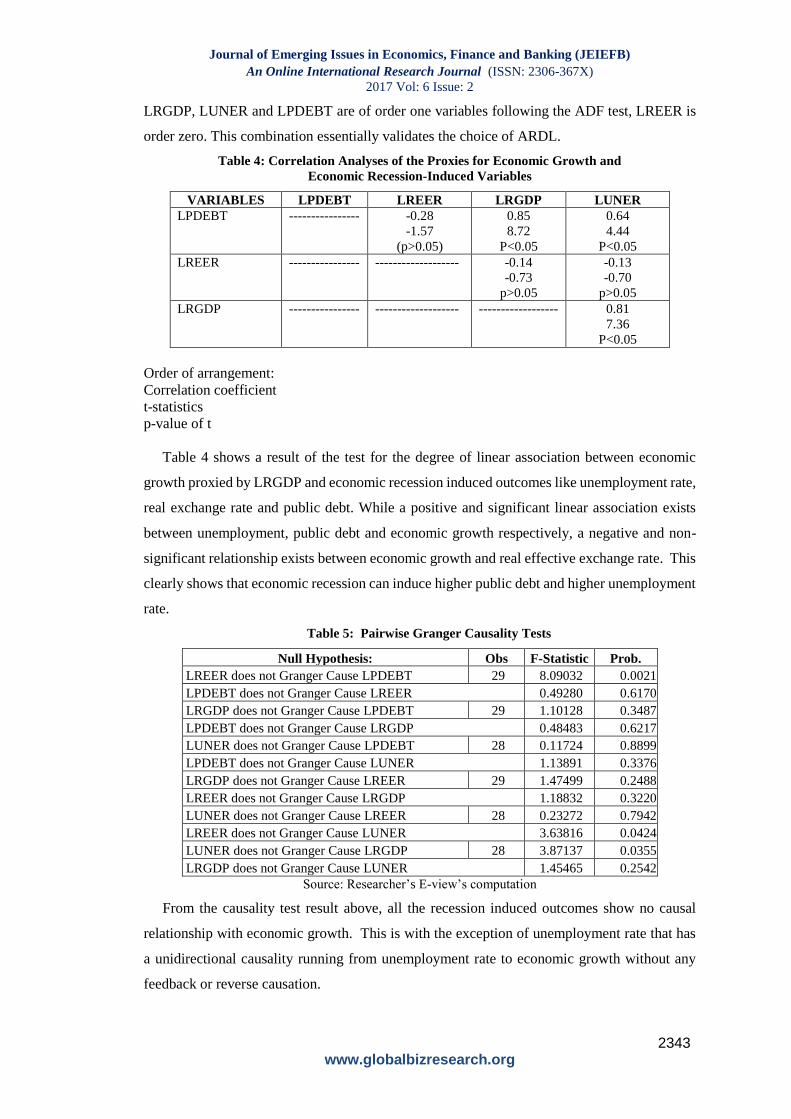
Table 4: Correlation Analyses of the Proxies for Economic Growth and
Economic Recession-Induced Variables
VARIABLES LPDEBT LREER LRGDP LUNER
LPDEBT ---------------- -0.28
-1.57
(p>0.05)
0.85
8.72
P<0.05
0.64
4.44
P<0.05
LREER ---------------- ------------------- -0.14
-0.73
p>0.05
-0.13
-0.70
p>0.05
LRGDP ---------------- ------------------- ------------------ 0.81
7.36
P<0.05
Order of arrangement:
Correlation coefficient
t-statistics
p-value of t
Table 4 shows a result of the test for the degree of linear association between economic
growth proxied by LRGDP and economic recession induced outcomes like unemployment rate,
real exchange rate and public debt. While a positive and significant linear association exists
between unemployment, public debt and economic growth respectively, a negative and non-
significant relationship exists between economic growth and real effective exchange rate. This
clearly shows that economic recession can induce higher public debt and higher unemployment
rate.
Table 5: Pairwise Granger Causality Tests
Null Hypothesis: Obs F-Statistic Prob.
LREER does not Granger Cause LPDEBT 29 8.09032 0.0021
LPDEBT does not Granger Cause LREER 0.49280 0.6170
LRGDP does not Granger Cause LPDEBT 29 1.10128 0.3487
LPDEBT does not Granger Cause LRGDP 0.48483 0.6217
LUNER does not Granger Cause LPDEBT 28 0.11724 0.8899
LPDEBT does not Granger Cause LUNER 1.13891 0.3376
LRGDP does not Granger Cause LREER 29 1.47499 0.2488
LREER does not Granger Cause LRGDP 1.18832 0.3220
LUNER does not Granger Cause LREER 28 0.23272 0.7942
LREER does not Granger Cause LUNER 3.63816 0.0424
LUNER does not Granger Cause LRGDP 28 3.87137 0.0355
LRGDP does not Granger Cause LUNER 1.45465 0.2542
Source: Researcher’s E-view’s computation
From the causality test result above, all the recession induced outcomes show no causal
relationship with economic growth. This is with the exception of unemployment rate that has
a unidirectional causality running from unemployment rate to economic growth without any
feedback or reverse causation.
Journal of Emerging Issues in Economics, Finance and Banking (JEIEFB)
An Online International Research Journal (ISSN: 2306-367X)
2017 Vol: 6 Issue: 2
2344 www.globalbizresearch.org
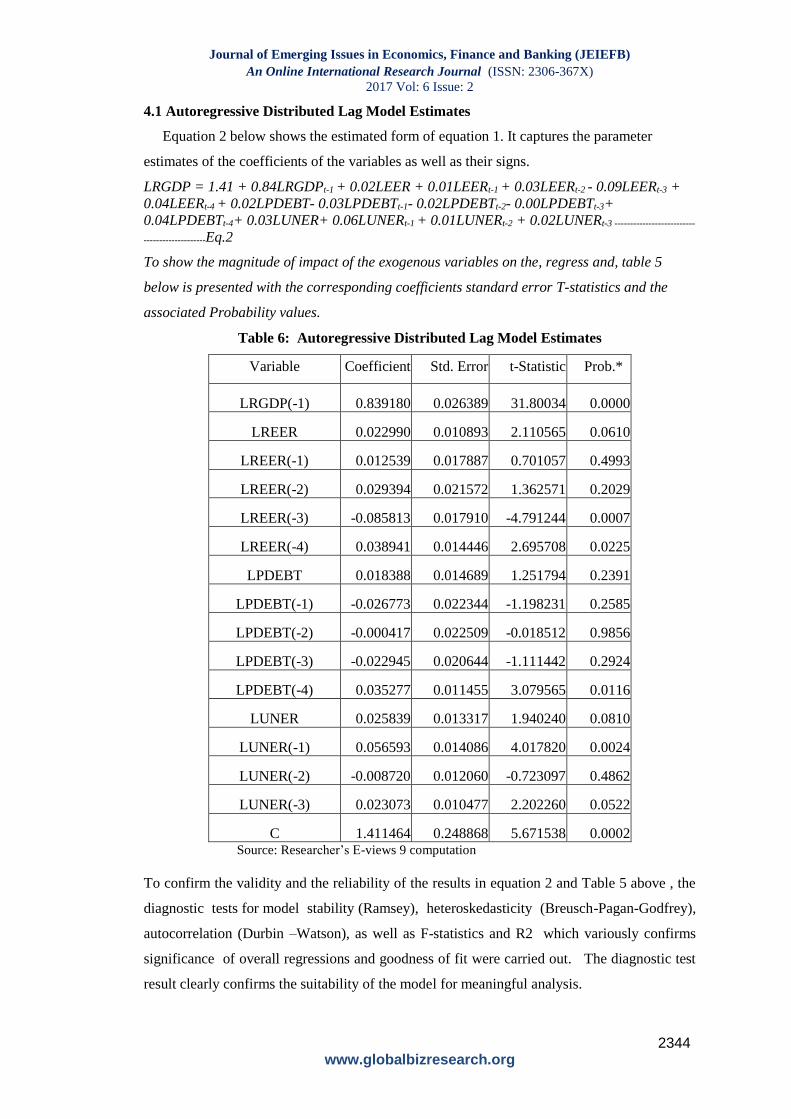
4.1 Autoregressive Distributed Lag Model Estimates
Equation 2 below shows the estimated form of equation 1. It captures the parameter
estimates of the coefficients of the variables as well as their signs.
LRGDP = 1.41 + 0.84LRGDPt-1 + 0.02LEER + 0.01LEERt-1 + 0.03LEERt-2 - 0.09LEERt-3 +
0.04LEERt-4 + 0.02LPDEBT- 0.03LPDEBTt-1- 0.02LPDEBTt-2- 0.00LPDEBTt-3+
0.04LPDEBTt-4+ 0.03LUNER+ 0.06LUNERt-1 + 0.01LUNERt-2 + 0.02LUNERt-3 --------------------------
--------------------Eq.2
To show the magnitude of impact of the exogenous variables on the, regress and, table 5
below is presented with the corresponding coefficients standard error T-statistics and the
associated Probability values.
Table 6: Autoregressive Distributed Lag Model Estimates
Variable Coefficient Std. Error t-Statistic Prob.*
LRGDP(-1) 0.839180 0.026389 31.80034 0.0000
LREER 0.022990 0.010893 2.110565 0.0610
LREER(-1) 0.012539 0.017887 0.701057 0.4993
LREER(-2) 0.029394 0.021572 1.362571 0.2029
LREER(-3) -0.085813 0.017910 -4.791244 0.0007
LREER(-4) 0.038941 0.014446 2.695708 0.0225
LPDEBT 0.018388 0.014689 1.251794 0.2391
LPDEBT(-1) -0.026773 0.022344 -1.198231 0.2585
LPDEBT(-2) -0.000417 0.022509 -0.018512 0.9856
LPDEBT(-3) -0.022945 0.020644 -1.111442 0.2924
LPDEBT(-4) 0.035277 0.011455 3.079565 0.0116
LUNER 0.025839 0.013317 1.940240 0.0810
LUNER(-1) 0.056593 0.014086 4.017820 0.0024
LUNER(-2) -0.008720 0.012060 -0.723097 0.4862
LUNER(-3) 0.023073 0.010477 2.202260 0.0522
C 1.411464 0.248868 5.671538 0.0002 Source: Researcher’s E-views 9 computation
To confirm the validity and the reliability of the results in equation 2 and Table 5 above , the
diagnostic tests for model stability (Ramsey), heteroskedasticity (Breusch-Pagan-Godfrey),
autocorrelation (Durbin –Watson), as well as F-statistics and R2 which variously confirms
significance of overall regressions and goodness of fit were carried out. The diagnostic test
result clearly confirms the suitability of the model for meaningful analysis.
Journal of Emerging Issues in Economics, Finance and Banking (JEIEFB)
An Online International Research Journal (ISSN: 2306-367X)
2017 Vol: 6 Issue: 2
2345 www.globalbizresearch.org
4.2 Diagnosis and Discussion of Test Results
R2 = 99%, DW Stat= 2.1; Ramsey (RESET) F-stat = 0.14(0.70)
BP for H F-Stat = 0.44(0.93)
In the ARDL result, for the appropriate or optimal lag, the selected model having the least
information criterion is ARDL (1, 4, 4, and 3) for real gross domestic product, exchange rate,
public debt and unemployment, respectively. It is therefore confirmed that economic recession
influences exchange rate, public debt, and unemployment which in turn impact on gross
domestic product. In the result, 1% change in the previous value of GDP induces 84% change
in succeeding years. For the real exchange rate, every 1% with the lapse of three years brings
about a negative effect of 8% reduction in the Nigerian gross domestic product. For the public
debt, each 1% change within the lapse of four years, results to 4% change. In the same manner
for the unemployment rate: 1% change in the previous value of unemployment results to 6%
change in the succeeding years. These results agree with the empirical work carried out by
Tejvan (2012)
which stated that a recession will typically be characterized by high employment rate,
higher government borrowing ,etc The result also agree with the research of Coile and Levine
(2011) who noted that the most prominent social effect of economic crises is job loss.
Looking at the results also, one can infer that these variables impact on the economic growth
at different degrees. Hence, this inference concurs with one of the findings of Rahman et al
(2017) which states that the severity of impacts would be determined by various factors, such
as Government policies, sources of revenue, categories of debt; and for individuals- educational
background which all together dictates who to be affected and the level of the impact.
Focusing on the short run relationship as shown in Table 6, we found most of the explanatory
variables and their lags as significant functions of Economic Growth at 5% level of significance.
Those with p-values less than 0.05 are significant as opposed to those above 0.05.
All the economic recession induced outcomes, including their own lags responded
negatively or positively to economic growth either contemporaneously or with a lapse of time
(lag). This broadly means that economic growth is a function of recession induced variables.
5. Conclusion
For the independent variables under study and their lags, only exchange rate with time lapses
of three years produced a negative impact of 8% reduction on the Nigerian economic growth
while other variables (public debt with four years lapses of time, unemployment rate with a
year lapse of time, and the lagged dependent variable (lagged GDP as a regressor) impacted
positively on the economic growth producing 4%, 6% and 84% increase on the GDP (at
every1% change), respectively.

Journal of Emerging Issues in Economics, Finance and Banking (JEIEFB)
An Online International Research Journal (ISSN: 2306-367X)
2017 Vol: 6 Issue: 2
2346 www.globalbizresearch.org
References
Bloomberg.com (2008): Global Recession Risk Grows as U.S Damage Spreads Jan. 28 Bohlund, Mark
(2016). Analysis: Why Nigerian Economy Is Facing its First-full year Recession since 1987. Bloomberg
Intelligence Economist, June 9 Nairametrics.com
Coile, C. and Levine, P. (2011) The Market Crash and Mass Layoffs: How the Current Economic Crisis
may Affect Retirement. The B.E.Journal of Economic Analysis and Policy 11(1)
Economist.Com (2008). The World Economy Bad or Worse 9th
Guatam, Omviri; Singh V.K. and Sharma, R (2015). Global recession and its Impact on
Telecommunication Industry: An Empirical Dissection. International Journal of Management and
Business 5(2) 107-116.
IMF World Economic Outlook Update (2008) Rapidly Weakening Prospects call for New Policy
Stimulus imf.org, 6th November.
Krugman, Paul (1998). Are Recessions the Inevitable Payback for good Times? Mises Review. 5 No
(spring, 1999) Dec. 3.
Lall, Subir (2008). “IMF predicts slower World Growth amid Serious Market Crisis”. International
Monetary Fund, 9th April.
Masarrat, Ghazal and Jha Suchita (2015) Assessing the Impact of Recession on Consumer’s Behaviour:
An Empirical Study in Dubai Researchers World, July www.questa.com.
Muanya, Chukwu (2017). Tackling Economic Recession-induced mental Health Disorder Guardian
Newspaper of 16 August.
My accounting course.com (2017) what is an economic Recession .Paul, D. (2010). Crisis in the
Eurozone and How to Deal with It. The Centre for Economic Policy Studies Policy Brief, 204, 1-6.
Naanen, Ben (2016). Recession: Nigeria Neglected History-Historic Society Business Day, 31st Oct.
National Bureau of Economic Recession (2008). Recession Dating Procedure;
http://www.nber.org/cycles/jan08bcdc_memo.html
OLugbile, Femi (2016) cited in Muanya (2017) Tackling Economic Recession-induced Mental Health
Disorders. Guardian Newspapers, 16 August.
Opejobi, Seun (2017). Why Dr Orji jumped into Lagos Lagoon- Colleague Reveals. Daily Post Daily
post.ng/2017/03/21 Reported by Essien Attah at 3rd Mainland Bridge in Lagos.
Pesaran, M.H: Shin, Y and Smith, R.J (2001) an Autoregressive Distributed Lag Modelling Approach to
Co-integration Analysis.
Rahman ,Md,Habibur;Galvan, Ramar Sanguino and Martinez, Ascension Barroso (2017), Economic
Recession in Spain :Exploring the Root causes , consequences and Recoveries For the Sustainable
Economic Growth. International Journal Of Economics and Financial Management 5(2),60-68 DOI
10.1269/ijefin-5-2-5 www.myaccountingcourse.com/accountingdictionary economic recession
Tejvan, Pettinger (2011). Problems of Recessions Economics Help.org. Oct 11 economics. The Wall
street Journal (2009). What is a Global Recession? 22nd April.
Wikipedia, the free Encyclopedia (2017) Global Recession Retrieved on 24/05/17.
World Economic Outlook (2009). Crisis and Recovery (PDF) Box 1.1 pp11-14 IMF April 24.
World Economic Outlook (2013). Statistical Appendix-Table – A summary of World Output (PDF) IMF.
Appendices
Descriptive Statistics
LPDEBT LREER LRGDP LUNER
Mean 7.225717 4.650033 10.27390 2.043902
Median 7.698356 4.516363 10.07274 2.207005
Maximum 9.300960 6.193609 11.14221 3.234749
Journal of Emerging Issues in Economics, Finance and Banking (JEIEFB)
An Online International Research Journal (ISSN: 2306-367X)
2017 Vol: 6 Issue: 2
2347 www.globalbizresearch.org
Minimum 3.700808 3.906899 9.612728 0.587787
Std. Dev. 1.609475 0.517938 0.499034 0.851477
Skewness -0.752594 1.241292 0.401757 -0.105586
Kurtosis 2.568753 4.166167 1.748744 1.566294
Jarque-Bera 3.166603 9.717431 2.856231 2.625132
Probability 0.205296 0.007760 0.239760 0.269129
Sum 223.9972 144.1510 318.4908 61.31707
Sum Sq. Dev. 77.71227 8.047783 7.471041 21.02538
Observations 31 31 31 30
Covariance Analysis: Ordinary
Date: 05/27/17 Time: 16:17
Sample (adjusted): 1985 2014
Included observations: 30 after adjustments
Balanced sample (listwise missing value deletion)
Correlation
t-Statistic
Probability LPDEBT LREER LRGDP LUNER
LPDEBT 1.000000
-----
-----
LREER -0.284341 1.000000
-1.569367 -----
0.1278 -----
LRGDP 0.854946 -0.136469 1.000000
8.721432 -0.728948 -----
0.0000 0.4721 -----
LUNER 0.643063 -0.131512 0.811833 1.000000
4.443335 -0.701992 7.357236 -----
0.0001 0.4885 0.0000 -----
Dependent Variable: LRGDP
Method: ARDL
Date: 05/27/17 Time: 16:53
Sample (adjusted): 1989 2014
Included observations: 26 after adjustments
Maximum dependent lags: 4 (Automatic selection)
Model selection method: Akaike info criterion (AIC)
Dynamic regressors (4 lags, automatic): LREER LPDEBT LUNER
Fixed regressors: C
Number of models evalulated: 500
Selected Model: ARDL(1, 4, 4, 3)
Variable Coefficient Std. Error t-Statistic Prob.*
LRGDP(-1) 0.839180 0.026389 31.80034 0.0000
LREER 0.022990 0.010893 2.110565 0.0610
LREER(-1) 0.012539 0.017887 0.701057 0.4993
LREER(-2) 0.029394 0.021572 1.362571 0.2029

Journal of Emerging Issues in Economics, Finance and Banking (JEIEFB)
An Online International Research Journal (ISSN: 2306-367X)
2017 Vol: 6 Issue: 2
2348 www.globalbizresearch.org
LREER(-3) -0.085813 0.017910 -4.791244 0.0007
LREER(-4) 0.038941 0.014446 2.695708 0.0225
LPDEBT 0.018388 0.014689 1.251794 0.2391
LPDEBT(-1) -0.026773 0.022344 -1.198231 0.2585
LPDEBT(-2) -0.000417 0.022509 -0.018512 0.9856
LPDEBT(-3) -0.022945 0.020644 -1.111442 0.2924
LPDEBT(-4) 0.035277 0.011455 3.079565 0.0116
LUNER 0.025839 0.013317 1.940240 0.0810
LUNER(-1) 0.056593 0.014086 4.017820 0.0024
LUNER(-2) -0.008720 0.012060 -0.723097 0.4862
LUNER(-3) 0.023073 0.010477 2.202260 0.0522
C 1.411464 0.248868 5.671538 0.0002
R-squared 0.999686 Mean dependent var 10.33759
Adjusted R-squared 0.999216 S.D. dependent var 0.447875
S.E. of regression 0.012543 Akaike info criterion -5.644022
Sum squared resid 0.001573 Schwarz criterion -4.869809
Log likelihood 89.37229 Hannan-Quinn criter. -5.421077
F-statistic 2124.275 Durbin-Watson stat 2.123246
Prob(F-statistic) 0.000000
*Note: p-values and any subsequent tests do not account for model
selection.
Heteroskedasticity Test: Breusch-Pagan-Godfrey
F-statistic 0.442235 Prob. F(15,10) 0.9255
Obs*R-squared 10.36891 Prob. Chi-Square(15) 0.7959
Scaled explained SS 4.478827 Prob. Chi-Square(15) 0.9957
Test Equation:
Dependent Variable: RESID^2
Method: Least Squares
Date: 05/27/17 Time: 17:00
Sample: 1989 2014
Included observations: 26
Variable Coefficient Std. Error t-Statistic Prob.
C -0.003710 0.003627 -1.022781 0.3305
LRGDP(-1) 0.000472 0.000385 1.228309 0.2475
LREER -2.32E-05 0.000159 -0.146339 0.8866
LREER(-1) -8.98E-05 0.000261 -0.344301 0.7378
LREER(-2) 0.000242 0.000314 0.768902 0.4597
LREER(-3) -0.000219 0.000261 -0.837655 0.4218
LREER(-4) 3.79E-05 0.000211 0.180189 0.8606
LPDEBT -0.000100 0.000214 -0.467729 0.6500
LPDEBT(-1) 0.000230 0.000326 0.707604 0.4954
LPDEBT(-2) -0.000277 0.000328 -0.844066 0.4184
LPDEBT(-3) 0.000212 0.000301 0.704360 0.4973
LPDEBT(-4) -0.000175 0.000167 -1.046152 0.3201
LUNER 2.75E-05 0.000194 0.141631 0.8902
LUNER(-1) 7.11E-05 0.000205 0.346146 0.7364
LUNER(-2) -3.27E-05 0.000176 -0.186056 0.8561
LUNER(-3) -0.000116 0.000153 -0.759908 0.4648
R-squared 0.398804 Mean dependent var 6.05E-05
Adjusted R-squared -0.502989 S.D. dependent var 0.000149
S.E. of regression 0.000183 Akaike info criterion -14.10081
Sum squared resid 3.34E-07 Schwarz criterion -13.32659
Log likelihood 199.3105 Hannan-Quinn criter. -13.87786

Journal of Emerging Issues in Economics, Finance and Banking (JEIEFB)
An Online International Research Journal (ISSN: 2306-367X)
2017 Vol: 6 Issue: 2
2349 www.globalbizresearch.org
F-statistic 0.442235 Durbin-Watson stat 2.799480
Prob(F-statistic) 0.925452
Ramsey RESET Test
Equation: UNTITLED
Specification: LRGDP LRGDP(-1) LREER LREER(-1) LREER(-2) LREER(
-3) LREER(-4) LPDEBT LPDEBT(-1) LPDEBT(-2) LPDEBT(-3)
LPDEBT(-4) LUNER LUNER(-1) LUNER(-2) LUNER(-3) C
Omitted Variables: Squares of fitted values
Value Df Probability
t-statistic 0.392511 9 0.7038
F-statistic 0.154065 (1, 9) 0.7038
F-test summary:
Sum of Sq. Df Mean Squares
Test SSR 2.65E-05 1 2.65E-05
Restricted SSR 0.001573 10 0.000157
Unrestricted SSR 0.001547 9 0.000172
Unrestricted Test Equation:
Dependent Variable: LRGDP
Method: ARDL
Date: 05/27/17 Time: 17:04
Sample: 1989 2014
Included observations: 26
Maximum dependent lags: 4 (Automatic selection)
Model selection method: Akaike info criterion (AIC)
Dynamic regressors (4 lags, automatic):
Fixed regressors: C
Variable Coefficient Std. Error t-Statistic Prob.*
LRGDP(-1) 1.299411 1.172857 1.107903 0.2966
LREER 0.037076 0.037648 0.984805 0.3505
LREER(-1) 0.017774 0.022964 0.773996 0.4588
LREER(-2) 0.043952 0.043405 1.012592 0.3377
LREER(-3) -0.127796 0.108586 -1.176914 0.2694
LREER(-4) 0.061138 0.058532 1.044530 0.3235
LPDEBT 0.029164 0.031456 0.927135 0.3780
LPDEBT(-1) -0.041007 0.043132 -0.950719 0.3666
LPDEBT(-2) -1.96E-05 0.023548 -0.000832 0.9994
LPDEBT(-3) -0.035509 0.038602 -0.919858 0.3816
LPDEBT(-4) 0.050415 0.040385 1.248372 0.2434
LUNER 0.036644 0.030847 1.187929 0.2653
LUNER(-1) 0.083388 0.069834 1.194091 0.2630
LUNER(-2) -0.013857 0.018169 -0.762647 0.4652
LUNER(-3) 0.035834 0.034304 1.044580 0.3235
C -0.771049 5.566470 -0.138517 0.8929
FITTED^2 -0.025223 0.064262 -0.392511 0.7038
R-squared 0.999692 Mean dependent var 10.33759
Adjusted R-squared 0.999143 S.D. dependent var 0.447875
S.E. of regression 0.013110 Akaike info criterion -5.584072
Sum squared resid 0.001547 Schwarz criterion -4.761471
Log likelihood 89.59294 Hannan-Quinn criter. -5.347193
F-statistic 1823.048 Durbin-Watson stat 2.133603
Prob(F-statistic) 0.000000
*Note: p-values and any subsequent tests do not account for model
selection.