impact of dividend announcement on … impact of dividend announcement on stock prices:a study in...
TRANSCRIPT

IMPACT OF DIVIDEND ANNOUNCEMENT ON STOCK PRICES:
A STUDY IN MALAYSIAN STOCK EXCHANGE CONTEXT
IBRAHIM SAMEER
A Master’s Project submitted in partial fulfillment of the requirements for the degree of
Master of Business Administration
Faculty of Business Management
Villa College
Open University Malaysia
2012

ii
DECLARATION
Ibrahim Sameer
S101061984
I hereby declare that this Master’s Project is the result of my own work, except for quotations
and summaries which have been duly acknowledged.
Signature: Date:

iii
IMPACT OF DIVIDEND ANNOUNCEMENT ON STOCK
PRICES:A STUDY IN MALAYSIAN STOCK
EXCHANGE CONTEXT
IBRAHIM SAMEER
June 2012
ABSTRACT
This study examined the stock market reaction on the announcement of dividend increase or
decrease in comparison with last year dividend. This study also assesses market efficiency
which exists in Malaysia Stock Exchange (Bursa Malaysia). The classical event study
methodology, ANOVA: Single Factor and Run Test are adopted to examine the price
reactions of 77 sampled listed companies sampled 2010 to 2012, from the Main Board of
Bursa Malaysia surrounding twenty one (+10, -10) days of the announcement dates. Results
of this study supports dividend signaling theory, especially for dividend increased firm,
because investors are able to earn abnormal return on the announcement of dividend
increased. But the firms which select to announce a relative decrease in their dividend firms,
investors expect that to happen therefore a clear picture was not able to draw. This result
shows that Bursa Malaysia Stock Exchange has not reached in its full efficiency in its semi –
strong form.
Keywords:
Abnormal return, ANOVA, Run Test, Event Study, dividend signaling theory

iv
ACKNOWLEDGEMENTS
Alhamdulillah!
In the name of Allah, most benevolent, ever merciful. All praise to be Allah, Lord of all the
worlds, giving me the forte, new ideas and forbearance from the commencement until the
completion of this project paper.
First and foremost, I owe my debt of gratitude especially to my supervisor, Mr. Muhammed
Tariq for his supportive censure, his erudite philosophies, reassurance and guidance to mould
and contour this project paper. Without his support and help, this paper cannot be completed
on time. Second, I owe my debt of gratitude especially to Villa College Rector Dr. Ahmed
Anwar for his support and encouragement throughout this project paper.
My indebtedness and thankfulness goes to my beloved wife and my offspring, Mausooma Ali
and Mariyam Azka Ibrahim respectively; who always heartens and show their endurance
through the accomplishment of this MBA project paper. Moreover, my distinct appreciations
also go to all my friends, directly and indirectly for the reason that of their association in
assisting, to gather all the imperative information related to this project Paper.
Thank you very much.

v
TABLE OF CONTENT
DECLARATION ....................................................................................................................... ii
ABSTRACT ............................................................................................................................. iii
ACKNOWLEDGEMENTS ...................................................................................................... iv
TABLE OF CONTENT ............................................................................................................. v
LIST OF TABLES ................................................................................................................. viii
LIST OF FIGURES .................................................................................................................. ix
DEFINITION OF TERMS ........................................................................................................ x
CHAPTER 1INTRODUCTION ................................................................................................ 1
1.1 Background of the Study ............................................................................................. 1
1.2 Problem Statement ...................................................................................................... 3
1.3 Objectives of the Study ............................................................................................... 4
1.4 Research Questions and Hypothesis ........................................................................... 4
1.4.1 Research Questions .............................................................................................. 4
1.4.2 Hypothesis............................................................................................................ 4
1.5 Significance of the Study ............................................................................................ 6
1.6 Scope of the Study....................................................................................................... 7
CHAPTER 2 REVIEW OF LITERATURE .............................................................................. 8
1.7 Theoretical Framework ............................................................................................... 8
1.8 Information Content Hypothesis ................................................................................. 9

vi
1.8.1 Middle East Market............................................................................................ 13
1.8.2 Asian Market ...................................................................................................... 14
1.8.3 European Market ................................................................................................ 16
1.8.4 America and African Market ............................................................................. 18
1.8.5 Malaysian Stock Exchange Market Specific ..................................................... 20
1.9 Agency Cost .............................................................................................................. 23
1.10 Efficient Market Hypothesis ..................................................................................... 24
1.11 Conclusion ................................................................................................................. 26
CHAPTER 3 METHODOLOGY ............................................................................................ 27
1.12 Research Design ........................................................................................................ 27
1.13 Population and Sample .............................................................................................. 28
1.14 Data Collection Procedures ....................................................................................... 28
1.14.1 Daily Return Measure ( ) ............................................................................ 30
1.14.2 Adjusted Mean Measures ..................................................................... 31
1.14.3 Abnormal Return .................................................................................. 31
1.14.4 Average Abnormal Return (AAR) ..................................................................... 32
1.14.5 Average Abnormal Return (CAAR) .................................................................. 32
1.14.6 Standard Deviation (σ) ....................................................................................... 32
1.14.7 Standard Error ................................................................................ 33
1.14.8 T-Test ( ) ............................................................................................ 33
1.14.9 Run Test ............................................................................................................. 33

vii
1.15 Framework for Data Analysis ................................................................................... 34
1.16 Methodological Issues ............................................................................................... 36
CHAPTER 4 DATA ANALYSIS AND RESULTS ............................................................... 37
1.17 Dividend Increase 45 Firms ...................................................................................... 37
1.18 For dividend Decrease 32 Firms ............................................................................... 40
1.19 Combination of Dividend Increase / Decreased ........................................................ 43
1.20 ANOVA: Single Factor ............................................................................................. 45
1.21 Run Test .................................................................................................................... 45
CHAPTER 5 DISCUSSION AND CONCLUSION ............................................................... 47
1.22 Summary of Main Finding ........................................................................................ 47
1.23 Discussion ................................................................................................................. 49
1.23.1 Dividend Increase 45 Firms ............................................................................... 49
1.23.2 Dividend Decreased 32 Firms ............................................................................ 50
1.23.3 Combined CAAR ............................................................................................... 51
1.24 Implication ................................................................................................................ 53
1.25 Limitations of the Study ............................................................................................ 53
1.26 Directions for Future Research ................................................................................. 54
REFERENCES ........................................................................................................................ 56
APPENDICES ......................................................................................................................... 64

viii
LIST OF TABLES
Table 4.1: Stock Market Reaction to Average Abnormal Return (AAR), Cumulative Average
Abnormal Return (CAAR), T – Values for Dividend Increased Announcement of 45
Firms…………….………………………………………...………………………………….38
Table 4.2: Stock Market Reaction to Average Abnormal Return (AAR), Cumulative Average
Abnormal Return (CAAR), T – Values for Dividend Decreased Announcement of 45
Firms………………….……………………………………...……………………………… 41
Table 4.3: Test of Significance at different Event Window on Cumulative Average
Abnormal Return (CAAR) for dividend Increased (45) and Decreased (32)
Firms…………………………………………………………………………………….……44
Table 4.4: ANOVA: Single Factor Test Results ………………………..…………………..45
Table 4.5: Run Test Results for Dividend Increased / Decreased (77 Firms) (Observation
Period (+15, -15) …………..……………………………………………..……………….…46

ix
LIST OF FIGURES
Figure 2.1: Researchers who are in favor and against of Dividend Signaling
Hypothesis………………………………………………………………………………..……8
Figure2.2: The Capital Markets’ Reaction to (Unanticipated) Equity Cash Flow
Decisions…………………………………………………………………………………..... 12
Figure 2.3: Different Forms of Efficient Market Hypothesis Proposed by Fama, Fisher,
Jensen and Roll (1969)………………..…………………………………………………...... 26
Figure3.1: Research Framework………………....………….……..………………….…… 27
Figure3.2: Time Line of Event Study proposed by MacKinlay (1997) .………….…….…. 28
Figure3.3: Time Line for Event Window for this research………...……………………..... 30
Figure4.1: AAR Surrounding the Announcements of Dividend Increase / Initiation for 45
Observations in each Event Window (-10, +10)……….………………………....………….39
Figure4.2: CAAR Surrounding the Announcements of Dividend Increase / Initiation for 45
Observations in each Event Window (-10, +10)……….……………………...…….……….40
Figure4.3: AAR Surrounding the Announcements of Dividend Decrease / Initiation for 32
Observations in each Event Window (-10, +10)….………………………...……….……….42
Figure4.4: CAAR Surrounding the Announcements of Dividend Decrease / Initiation for 42
Observations in each Event Window (-10, +10)………………………………………….….43
Figure4.5: CAAR Surrounding the Announcements of Dividend Increased and Decreased for
77 Observations in each Event Window (-10, +10)………………………………...….…….44

x
DEFINITION OF TERMS
APT – Arbitrage Pricing Model
ANOVA – Analysis of Variance
AR – Abnormal Return
AAR – Average Abnormal Return
BM – Bursa Malaysia
CAAR – Cumulative Average Abnormal Return
CAPM – Capital Asset Pricing Model
CFPS – Cash Flow Per Share
EPS – Earning Per Share
EMH – Efficient Market Hypothesis
EW – Event Window
GDP – Gross Domestic Product
ROE – Return on Equity
NASDAQ– National Association of Securities Dealer Automated Quotations
NYSE– New York Stock Exchange

1
CHAPTER 1
INTRODUCTION
1.1 Background of the Study
Stockholders can earn return for the stock by means of two ways i.e. in the form of dividend
and capital gain. In the world of corporate finance, it is not a compulsion for the company to
pay dividend for the shareholders but was relatively noted that numerous organizations that
disburse dividend on customary basis. Now the question is why organizations pays dividend,
there has been lot of research done on this topic during the past five decades. In straight
forward terms dividend is an amount which pays to the stockholders in cash / stock by the
company from its earning every year or quarterly basis. As a result, when the firm pays
dividend it means that cash is going out from the firm, hence the capital structure of the firm
will get effected or changed depends upon the proportion of the payout ratio.
The pronouncement of dividend effect on the stock price will be based upon the dividend
policy of the firm. When the firms make proclamation of dividend in cash increase or
decrease the firm is making a dividend policy decision. When the firm makes the dividend
policy decision they need to make definite that they should be able to uphold the policy for a
quite elongated period. If they are not able to prolong the homogeny in their dividend payout
ratio, it might effect the stock market price of the company.
According to Ross, Westerfield, & Jaffe (2008) when the firm declared dividend increase
generally stock price increases and when the firm dividend decrease then the stock price
decrease according to the information content hypothesis.

2
The issue, whether the manager in the firm dupe the stockholder by declearing dividend
increase, the riposte to this question is yes, but it can be done for a diminutive epoch of time
and the stock market price may decrease much beneath than the intrinsic value of the stock
price. Another imperative fact that manager requisite to retain in mind when deciding the
payout policy, is there any project which can engender optimistic Net Present Value (NPV),
if so the managers need to contemplate about in investing those project rather than affirming
high dividend payout. If the firm desired to upturn their payout, then they perchance have to
forgo some of the positive NPV project, which may in the long run firm perhap shurt.
Agency cost is also one of the significant matter in the corporate finance world. Agency cost
ascend amongst the managers (management) and the shareholers due to the conflict of
interest. According to Ross, Westerfield, & Jaffe (2008) agency cost can be divided into two
namely direct and indirect. Indirect agency cost can be a lost opportunity. Direct agency cost
come in two forms. The first type is corporate expenditure of managers which benefits for
him/her (for instance costly car) but an expenditure for shareholders. The second type is
expenditure arise for monitoring managers action (for instance Auditors salary) but an
expenditure for shareholders.
Efficient Market Hypothesis (EMH) was propounded by Fama (1970) in his seminal paper
titled Efficient Capital Markets: A Review of Theory and Empirical Work. In an efficent
market all the security prices are fully reflected to all the available information and no one
will be able to earn excess profit using this information. According to him there are three type
of efficiency namley weak form, semi – strong, and strong form of market efficiency.
The main intention of this research is to examined the impact of dividend announcement on
stock price in the Malaysian stock exchange (Bursa Malaysia). The next aim of this research
is to find out which form of market efficiency exist in the Malaysian stock exchange namely

3
strong form, semi strong form or weak form of market efficiency. In this research I have used
event study methodology in order to measure the abnormal return of the company’s stock
prices that occurred during a fixed period, before and after the day of dividend increase or
decrease announcement.
1.2 Problem Statement
Malaysia is following a constitutional monarchy. The current king is Yang Di-Pertuan
Agong. He is the head of the states in a ceremonial role. The head of government is prime
minister. The incumbent prime minister is Najib Tun Razak. Malaysia is a developing
country. Prior to the 1997 crash, Malaysia is one of Asia’s “Tiger Economy” but it has
recovered. Currently, Malaysian economy ranks 30th
in the world in term of per capita GDP
[Szczepanski (2012)].
The stock exchange of Malaysia was established in 1964 but later it was renamed as Bursa
Malaysia Berhad on 14 April 2004. Bursa Malaysia is one of the prevalent stock exchanges in
Asia with more than 1000 companies trading through Bursa Malaysia Stock Exchanged
[BursaMalaysia (2012)].
Since the publication of the seminal work of Miller & Modigliani (1961) dividend irrelavance
theory, there has been number of row that have been proposed in the finance litarature for
instance Pettit (1972), Bhattacharya (1979), John & Williams (1985), Miller & Rock (1985),
Asquith & Mullins (1986), Ling, Mutalip, Shahrin, & Othman (2008), Jais, Karim, Funaoka
& Abidin (2009), Mohamed, et al., (2010), Hussin, Ahmed &Ying (2010), Isa & Lee (2011),
and Ismail & Rahman (2012), in order to rationalize why firm confer dividends to its
shareholders. By and large, the reasons why firm recompense dividend to their shareholders
that was documented in the above mention literature, first reason was firms pay dividend in
order to signal the information to the market, second reason was in order to return excess
4
cash if there is no positive NPV project for fairly to the shareholders and third reason may be
to attract clienteles. Upto today in the world of corporate finance there was no singal theory
which dominate, why firm pay dividends?
On the other hand researchers who are in favour of Miller & Modigliani (1961) theory
include such Abdullah, Rashid, & Ibrahim (2002), Ali & Chowdhury (2010), Akbar & Baig
(2010), Robbani & Bhuyan (2010) and Padmavathy & Ashok (2012).
1.3 Objectives of the Study
There are two motives behind in doing this research, at the outsetis to find out whether there
is an opportunity in the Bursa Malaysia for arbitrages and secondly examining which form of
market efficiency exist in the Bursa Malaysia Stock Exchange, because according to
Dr.Momani & Dr.Alsharari (2012) stock exchange is known as a mirror to the economic
situation of the Countries.
1.4 Research Questions and Hypothesis
1.4.1 Research Questions
1. What is the impact of dividend announcement on stock price, is there any opportunity
for arbitrage in Malaysian stock exchange (Bursa Malaysia)?
2. What kind of market efficiency exist in Malaysian stock exchange (Bursa Malaysia)
namely weak form, semi – strong form or strong form?
1.4.2 Hypothesis
In order to answer the above questions following hypothesis was developed:

5
1.4.2.1 Abnormal Return for dividend increase / initiationfirms
H₀: there is statistically zero significant abnormal return (positive or negative) due to
dividend increase / initiation. Therefore the Bursa Malaysia Stock Market is semi – strong
efficient with respect to the dividend increase / initiation.
H₁: there is statistically significant abnormal return (positive or negative) due to dividend
increase / initiation.
₁
1.4.2.2 Cumulative Average Abnormal Return for dividend increase / initiation firms
H₀: there is statistically zero significant cumulative average abnormal return (positive or
negative) due to dividend increase / initiation. Therefore the Bursa Malaysia Stock Market is
semi – strong efficient with respect to the dividend increase / initiation.
H₁: there is statistically significant cumulative average abnormal return (positive or negative)
due to dividend increase / initiation.
₁
1.4.2.3 Abnormal Return for dividend decrease / omission firms
H₀: there is statistically zero significant abnormal return (positive or negative) due to
dividend decrease / omission. Therefore the Bursa Malaysia Stock Market is semi – strong
efficient with respect to the dividend decrease / omission.
₁
H₁: there is statistically significant abnormal return (positive or negative) due to dividend
decrease / omission.
₁

6
1.4.2.4 Cumulative Average Abnormal Return for dividend decrease / omission firms
H₀: there is statistically zero significant cumulative average abnormal return (positive or
negative) due to dividend decrease / omission. Therefore the Bursa Malaysia Stock Market is
semi – strong efficient with respect to the dividend decrease / omission.
H₁: there is statistically significant cumulative average abnormal return (positive or negative)
due to dividend decrease / omission.
₁
1.4.2.5 ANOVA – Single Factor
H₀: Malaysian Stock Exchange all individual batch means are equal.
₁
H₁: Malaysian Stock Exchange all individual batch means are not equal.
₁ ₁
1.4.2.6 Run Test Hypothesis
H₀: Malaysian Stock Exchange stock data was produce in random manner.
H₁ Malaysian Stock xchange stock data was not produce in random manner.
₁
1.5 Significance of the Study
As highlighted in the problem statement, dividend is considered as a mechanism to signal
about the future prospect of the firm. Despite the fact that, there are countless studies done in
this on dividend in Malaysia, but a small number of studies have done on checking the form
of market efficiency and dividend announcement in collectively. As a result, I look forward

7
to that this research will shed supplementary illumination in the existing literature on this
topic in Malaysia.
I am optimism that this study perhaps be obliging for the government, impending investors,
researchers, managers and the current shareholders of the company in perceptive the dividend
policies of the firms in Malaysian economy.
1.6 Scope of the Study
In the world of corporate finance there are abundant causes which may affect the stock price
of firms, explicitly corporate dividend announcement, micro and macro environment of the
country investor’s buoyancy on the market etc.
Nevertheless, in this case study base paper I am going to test dividend signaling hypothesis in
Malaysia Stock Exchange, in other words I am going to study on the announcement of
dividend is there is any significant change in the Bursa Malaysia stock prices, and through
this I am going to test the form of market efficiency that exist in Bursa Malaysia., namely
weak form or semi – strong form or strong form. In this research paper data was collected
from 2010 to 2012 and total sample size is 77 firms, of which 45 have shown dividend
increased and 32 are dividend decreased firm. I also have incorporated firms who have
increased and decreased cash dividend and weigh against to their previous year
announcement. In this study I have not integrated any stock split, stock repurchase, stock
dividend, or merger and acquisitions.

8
CHAPTER 2
REVIEW OF LITERATURE
1.7 Theoretical Framework
The intention of this chapter is to review preceding work done by dissimilar academics on
this subject. In the world of corporate finance dividend payout policy is solitary dubious
topics among the researchers after publishing the seminal work of Miller & Modigliani
(1961) dividend irrelevance theory. The entire literature was alienated into two parts, some
are in support that dividend payout do convey information to the market participant and the
other group are support that dividend does not convey any information to the market
participants. Below figure 2.1 represent a snapshot of researchers who are in favor and not in
favor of dividend signaling hypothesis.

9
1.8 Information Content Hypothesis
Lintner (1956) was one of the pioneering scholar in the field of corporate finance. One of his
classic study was done on the topic of “Distribution of Incomes of Corporations Among
Dividends, Retained Earnings, and Taxes”. In this study he have used 600 observations from
28 listed companies. He states that “the belief on the part of many managements that most
stockholders prefer a reasonably stable rate and that the market puts a premium on stability
or gradual growth rate – were strong enough that most managements sought to avaoid
making changes in their dividend rates that might have to be reversed within a year or so.”
Therefore, Lintner argued that management of any organization desire to retain the firmness
of the dividend payout ratio rather than altering the payout ratio habitually. He affirm that
management of the organization consider about the future prospect of the company sooner
than deciding the dividend payout. If they sense organization going to carry outsound then
they conceivably declear high dividend and if they believe prospect is ambiguous then
management decleare low dividend. But on the other hand Lintner revealed that companies
are indisposed to lessen the dividend because it perhaps drive a negative signal.
Miller & Modigliani (1961) study was the most vital literature in the corparate finance world,
because Miller & Modigliani (1961) study documented that dividend payout does not add any
value to the firm, this phenomena was called ‘Dividend Irrelevence Theory’. It has to be
noted that the influential paper of Miller & Modigliani (1961) the Dividend Irrelevence
Theory exist in a market which is perfect, rational investors, no brokarage fee, tax free world,
no transetion cost. But now we are living bona fide world, postulation made by Miller &
Modigliani are now on reverse, namely there are diffierent types of taxes, market is not
perfect.

10
Nonetheless, there are numerous contemporary study which documented that dividend payout
do add value to the firm and information content hypothesis was true, which may include the
study of Pettit (1972), Bhattacharya (1979), John & Williams (1985), Miller & Rock (1985),
Asquith & Mullins (1986), DeAngelo, DeAngelo, & Skinner (2004), Ryan, Besley, & Lee
(2000)
Pettit (1972) have investigated the the validity of efficient market hypothesis and how the
dividend annoucment effect the market participant in the New York Stock Exchanged. He
have employ sample size of 625 observation for the period of January 1964 to June 1968. He
documented that there is no information leakage in the market. He also avow that dividend
annoucement do communicate valuable information to the market participant, dividend
increase annoucements good news and dividend decrease annoucemnt leads to bad news. He
states that “the market reacts very dramatically to these annoucements when dividends are
reduced or when a substantial increase takes place.”
Bhattacharya (1979) was the first person who developed dividend signalling model for the
corporate finance world, though dividend are tax higher rate than the capital gain. He
acknowledged that increase in dividend signal the future prospect of the firm. He states that
“dividends function as a signal”. Another momentous conclusion he drew was manager
know more private information about the company than outside shareholders, therefore the
only way to commune with investors is through the payout policy of the firm. As an investors
we may suspect that financial statement presented by the management perhaps be backed by
the ghostwrting of well paid public relation firm or speicialist.
John & Williams (1985) advocate that there is positive correlation between dividend and
stock price. In their study, they put forward that when the organization amend its payout
policy to signal the future prospect of the firm, because managers in the organization know

11
more about the firm than the outsider (shareholders). John & Williams states that “corporate
insiders with more valuable private information optimally distribute larger dividends and
receive higher prices for their stock.” This has been proven by many researchers during the
past four decades in the corporate finance world.
Miller & Rock (1985) have probe the dividend policy of the firm when there is asymmetry of
information between the stockholders and the mangers. They established that dividend
annoucement merely provide the missing pieace of information to the investors. They also
documented that only large firm whose earning is more can make larger dividend
annoucements, another imperative thing they found was they are in favour of dividend
signaling hypothesis. They states that “dividends make sense as signals for the good news,
not the bad news firm.”
Asquith & Mullins (1986) have examined the NYSE market reaction to dividend
annocement, employe a sample size of 168 firm during a period of 1964 to 1980. In this study
they have incorporated the firm who pay dividend in their corporate history or recommence
paying dividend after a hiatus of atleast ten years. They documented that if the firm deaclared
a dividend yield of 0.67% then the stock price was not effected, but if dividend declared is
more than 0.67% investors pleasatly surprised, resulting postive return in the bourse. They
states that “on the annoucement day, the firm must fulfill investors’ expectations or suffer a
reduction in stock price.” The below figure 2.2 demonstrate that when there is an
unanticipated equity cash outflow (increased in dividend and stock repurchase) the stock
price move positivley and that is taken as good news by the market participants. On the other
hand if the organization requires cash inflow through captial market by issuing equity
(decrease in dividend and equity issue), the result is negative, the stock price move
downwards and the investors take it as a bad news. This result is consistent with their
previous research research Asquith & Mullins (1983) and more recently Ryan, Besley, & Lee
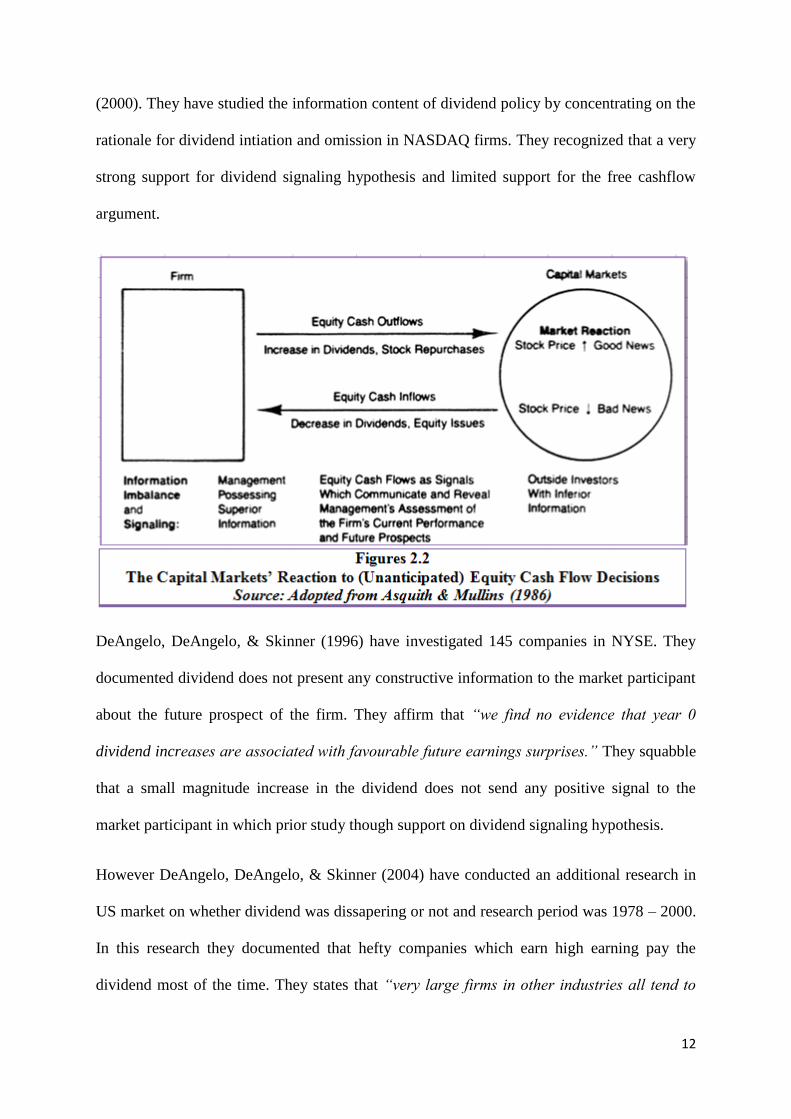
12
(2000). They have studied the information content of dividend policy by concentrating on the
rationale for dividend intiation and omission in NASDAQ firms. They recognized that a very
strong support for dividend signaling hypothesis and limited support for the free cashflow
argument.
DeAngelo, DeAngelo, & Skinner (1996) have investigated 145 companies in NYSE. They
documented dividend does not present any constructive information to the market participant
about the future prospect of the firm. They affirm that “we find no evidence that year 0
dividend increases are associated with favourable future earnings surprises.” They squabble
that a small magnitude increase in the dividend does not send any positive signal to the
market participant in which prior study though support on dividend signaling hypothesis.
However DeAngelo, DeAngelo, & Skinner (2004) have conducted an additional research in
US market on whether dividend was dissapering or not and research period was 1978 – 2000.
In this research they documented that hefty companies which earn high earning pay the
dividend most of the time. They states that “very large firms in other industries all tend to
13
pay dividend”. A research conducted by Fama & French (2001) found that firm paying cash
dividend fall from 66.5% in 1978 and in 1999 upto 29.8%, they have used aggregate dividend
from 1978 to 1999. This result is inconsistent with DeAngelo, DeAngelo, & Skinner (2004)
they have found that increase dividend over the past two decades. The result is inconsistent
due to fact that Fama & French (2001) have used cumulative dividend, which may be
misleading when declearing dividend because large firm probably dominate the collective
result of such dividends. Another vital issue documented by DeAngelo, DeAngelo, & Skinner
(2004) was that high tax bracket earner like to invest in a firm which don’t give dividend
because dividend are tax more than the capital gain. They states that “high tax bracket
investors desire to invest substantial amount of wealth.”
From here ownwards I am going to look into previous studies done on thistopic on the basis
of continental wise, so that it will be easy to relate theories and findings of this study based
on the region or the continents.
1.8.1 Middle East Market
By looking into Middle East Market Alzahrani & Skerratt (2009) have examined Saudi Stock
Market on the subject of dividend signaling hypothesis. They found that investors underreact
to positive news and overreact to negative news. An extra vital things they documented was
prior to the announcement dividend, their was an information leakage, which is also
establishedby Chander, Sharma, & Mehta (2007), Liargovas & Repousis (2011), Taneem &
Yüce (2011), Yilmaz & Selcuk (2010).
On the other hand, Alisinaei & Habibi (2012) have looked into the causes that are relevent to
payout ratio in Tehran stock exchange. In their delve, they have tested six hypothesis. In the
first hypothesis, they tested that CEO compansation was negatively related to payout ratio.
They originate that a siginificant relationship between them. In the second hypothesis they
14
studied the rapport between the market to book value ratio and dividend payout ratio. They
established that there is a significant rapport between them. In the third hypothesis they have
tested the relationship between cost of capital and dividend payout ratio, the reuslts found
that there is a significant relatioship between them. In the fourh hypothesis they have tested
the relationship between systematic risk and dividend payout ratio, the results found that no
relationship (no significant) found. The fifth hypothesis they have tested is the relatioship
between income and payout ratio, the results they found is there is no significant relatioship.
The last hypothesis they tested is the relationship between debt to equity and dividend payout
ratio, the results found that there was a siginificant relationship between.
1.8.2 Asian Market
While reviewing Asian market, I found varied result. A research conducted by Mandal & Rao
(2010) found that Indian stock market is efficient in its semi strong form with reverence to
both events: dividend initiation and dividend omission. They have conducted their research
from 1990 to 2009 employing 40 securities in dividend initiation and 44 securities dividend
omission. In their research they have found enough evidence for the support of both
announcements dividend initiation and dividend omission carry new value relevant
information to the market participants. For the sample of dividend initiation they have used
cross sectional t-test at 5% significance and reveal that AAR values (1.197 & 1.434)
significantly are different from zero only for two days that is (t=-1 and t = 0), but in case of
dividend omission only the announcement day (t = 0) AAR values (-1.985) is significance at
1% and the rest of the event period AAR is not significance. Therefore they found that
investors react more on dividend omission compare to dividend initiation, in case of dividend
initiation though the market is little sluggish but for dividend omission it is more reactive.
However Ali & Chowdhury (2010) have investigated Dhaka Stock Exchange (DSE) in
Bangladesh the effect of dividend announcement on the stock price. They found that dividend

15
announcement does not carry information to the market participants, due to the fact that
insider information.Sharma (2011) also support the view of Ali & Chowdhury (2010).
Sharma (2011) documented that dividend annoucement does not result any random behaviour
in the stock burse, and he states that information content of dividend annoucement was fully
reflected in shares therefore in Bombay Stock Exchange in India, no stockholders are able to
earn abnormal return during the event period.
Another research conducted by Akbar & Baig (2010) in Karachi stock exchange, in Pakistan
found a mix result. They have cash dividend annoucement effects on stock price, they
concluded that annocement of cash dividend is statistically insignificants meaning their
results are inconsistent with dividend signaling theory hypothesis.
Taneem & Yüce (2011) have conducted research in Indian stock exchange. They have used
82 companies’ data in Bombay stock exchange which announce dividend during the year
2004 to 2007. Their research has shown that when the firm dividend increased then the
investors react to that information favorably and when the dividends decrease it’s vice versa.
They concluded their research, dividend announcement do have information content in the
Indian stock exchanged and it do influence the share price. Another research conducted by
Thanatawee (2011) found the same results, they support the free cash flow and life cycle
hypothesis.
Looking into a recent study, Mollah (2011) have conducted research in order to investigate
the behaviour of pay out policy in the Dhaka stock exchange in Bangladesh. He concluded
stating “dividends do convey information to the market; therefore, more uncertainty is
supposed to lead to fewer dividend payments and vice versa. These results indicate that
managers do convey right information to the market. The DSE listed firms follow stable
dividend pay out policy; so, they have a little scope of dividend adjustment; therefore,

16
dividend contains information but less significant and consequently dividend becomes less
informative to signal the profitablity. These results narrowly support information content
hypothesis of Miller and Modigliani (1961)”. But on the other hand, his result has produced a
clear cut evidence that agency cost transection do have influcene on the dividend pay out
policy.
Khan, Aamir, Qayyum, Nasir & Khan (2011) have conducted research in Pakisthan stock
exchange employ a sample size of 55 from a period of 2001 - 2010. They have found that
stockholders do expect or wants dividend because it provides signal about the future prospect
of the organization. In the concluding remarks they stated that “dividend policy is important
as it provides signal about the success of the company.” Therefore their result is consistent
with Arnott & Asness (2003) states that “anecdotal tales about managers signaling their
earnings expectation through dividend.”
Looking into most recent literature Padmavathy & Ashok (2012) documented that on the
annoucement of merger does not hold any significant share price movement (meaning no
investors were able to gain abnormal return during the event period) in the Indian stock
exchange. Hence in the concluding remarks they stated on the annoceuemnt of merger does
not hold any signficant information for the investors in the indian stock exchnaged.
1.8.3 European Market
When I look into European market regarding on this topic I found mixed result. A research
conducted by Capstaff, Kteboe, & Marshall (2004) documented that in Oslo stock exchnage
they found strong evidence of dividend signaling hypothesis. Skinner & Soltes (2009)
concluded that the idea of dividend provide information about the quality of reported
earnings, and also found that the relation between present earning and future earnings was
stronger for firms that pay dividends than for those that do not. Another research conducted

17
by Bouwman (2010) documented that dividend changes do generate abnormal price
reactions, and yet too little information do provide about the future earnings of the firm.
Yilmaz & Selcuk (2010) have examined the market reaction to dividend changed
annoucement in the Istabul Stock Exchange. They have used a sample of 184 annoucement
made be 46 companies during a period of 2005 to 2008. They found that market react
positively for dividend increase and market react nagetively for dividend decreased and no
abnormal return earned by no change in dividend. Therefore their results are consistent with
dividend signaling hypothesis theory. It has also been revealed that before the annocement of
dividend decrease, there was information leakage.
Liargovas & Repousis (2011) have examined the Althene stock exchanged in Greek on the
annoucement of merger and acquisition. They documented that investor was able to gain
significant cumulative average abnormal return (CAAR) ten day prior to the announcement
of merger and acquisition, it indicate the leakage of information and they reject that Althene
stock exchanged follow semi strong form of market efficiency.
Looking into some recent studies Scheufele, Haas, & Brosius (2011) try to investigate how
the media influence on stock price in Germany. They found that media report is one of the
important source which influence the stock price especially for small investors. While
concluding their research report they states that “we found strong correlations between media
coverage about listed German companies and the development of stock prices and trading
volumes”. Charitou, Lambertides, & Theodoulou (2011) found that the dividend initiation or
raise are linked with lessen in the default risk afar other systematic risk. Another research
conducted by Schanz & Haesner (2011) concluded that Germany stock market response to
positive dividend surprises was more pronounced under the full imputation system, where

18
dividends are normally more favourable to the shareholders from a tax outlook, than under
the half income system.
Apolinario, Santana, Sales, & Caro (2011) have conducted a research on day of the week
effect on european stock markets from july 1997 to march 2004. In their observation they
have taken data from major european stock market namely germany, Austria, Belgium,
Denmark, Spain, France, Netherland, Italy, Portuagal, United Kingdom, Czech Republic,
Sweden and Switzerland. The have concluded their research stating that most of the european
markets do not follow a day of the week effect because the result of each single day does not
differ significantly fro the other days of the week. Another research conducted by Oduncu
(2012) found that day of the week effect was not present in the Turkish Derivatives
Exchange.
1.8.4 America and African Market
While reviewing American and African market, I found varied result. Nikkinen, Sahlström,
Takko, & Äijö, (2009) documented in the US market anomalies do occur due to the
annocuement or release of news during around turn of the month. Another research by
Okpara (2010) studied the relationship between asymmetric information and dividend policy
in Nigeria. He doucmented that there is significant correlation between dividend policy and
asymmetric information, and his finding was consistent with dividend signaling hypothesis.
Robbani & Bhuyan (2010) have studied the Canadian Stock Exchange. In the conclusion they
stated that “financial market reacts negatively to any restatement of earnings. This is evident
from the fact that irrespective of the reasons for restatement, all restatements show a
negative effect on the stock price. The impact of the restatement announcements is significant
for all the prediction intervals.”

19
Aduda & Kimathi (2011) in their research paper have examined the applicability of constant
dividend model which are in Nairobi Stock Exchange. The sample size of the research is 18,
and they have conducted their research in 2002 to 2008. Their empirical researched revealed
that constant growth model was not applicable to Nairobi Stock Exchanged. In the
concluding remarks they states that “firms that increase dividends had a significant decrease
in systematic risk while firms which reduced dividends incurred a significant increase in
risk”.
Agyei & Yiadom (2011) have investigated the correlation between bank performance and
dividend payout policy in Ghana. They docuemented three things, first they found wasaround
24.65% bank do pay dividend, second banks who pay dividend perform better compare to
bank who don’t pay dividend and finally bank pay dividend in order to reduce the agency
cost problem.
Abdalla (2012) found that day of the week effect was not present in the Khartoum Stock
Exchange (KSE) in Sudan.
Looking into the most recent study, Farooq, Saoud and Agnaou (2012) have conducted
research in Casablanka Stock Exchange, in Morocco regarding the dividend policy as a
signaling mechanism under different market condition. They have concluded that stating “we
find a significantly negative relatioship between dividend payout ratio and stock price
volatility during the stable growth period. We also show a significantly positive relationship
between dividend payout ratio and stock returns during the same period. However, this
relationship turns insignificant during the high growth period. One of the reasons for our
results may be that investors pay lesser attention to the signaling value of dividends during
the periods when they are earning higher returns on their investments.” This result is
consistent with Salminen (2008) where he concluded his thesis stating that “the abnormal

20
returns of dividend increases were clearly positively larger during the recession than the
boom. This is in line with the view that investors respect dividend increase more during
recession than a boom.” Therefore it means that stockholder do expect a dividend during bad
economic condition (recession) and they don’t expect dividend when the economy in good
condition (boom), during boom investors wantmore captial gain.
Another research by Ramadan (2012) studied that the validity of Arbitrage Pricing Theory
(APT) in in Amman Stock Exchange (ASE),they found that enough evidence to support the
validity of APT in ASE.
1.8.5 Malaysian Stock Exchange Market Specific
While reviewing Malaysian context, I found mixed result, some are in support of dividend
signaling hypothesis and some oppose. The academics who are in support include such as
Ling, Mutalip, Shahrin, & Othman (2008), Jais, Karim, Funaoka & Abidin (2009), Mohamed,
et al., (2010), Hussin, Ahmed & Ying (2010), Isa & Lee (2011), and Ismail & Rahman
(2012).
Ling, Mutalip, Shahrin, & Othman (2008) have examined the dividend policy of 100
Malaysian public listed companies in the bourse. They found that there are more dividend
paying firm than non dividend paying firm over the period of 2002 to 2005, unswerving with
Fama & French (2001). They conclude their research stating that “we find that dividend
payment has a positive correlation with the past earnings, little or no correlation with
current earnings, and is negatively correlated with future eanings. The finding suggest that
dividend policy for Malaysian public listed companies is influenced by their past
performance more than their current and future performances. The dividend policy for
Malaysian public listed companies is rigid and sticky as managers are reluctant to cut or
avoid omit dividend even when the performance of the companies are deteriorating.”
21
Jais, Karim, Funaoka & Abidin (2009) have examined the Malaysian stock exchange
dividend announcements reaction. They have used a sample size of 853 dividend increase
announcements and 376 dividend decrease announcements from 2001 to 2005. They have
found that dividend increase announcements signal as good news and dividend decrease
announcements greeted as bad news. They also found that stockholder do not react more
when there is small change or increase in the dividend compare to the previous year.
However the post announcement return shows that stockholders treat increase dividend
announcement as good news and they positively react to those announcements. Looking into
the other side, dividend decrease announcement they found that across all the investors in the
immediate event window surrounding the announcement was negative. But the result is not
statistically significant. Therefore no investors are able to gain abnormal return in the 3 day
event period. One possible reason for that is due to investors expect that happen because in
Malaysia all the company need to publish their accounts in quarterly hence investors analyze
those data on regular basis.
Mohamed, et al., (2010) have conducted an empirical study in Malaysian Stock Exchange,
regarding the determinants of dividend payment: profitability and liqudity. In their study they
have employ 200 companies in the Bursa Malaysia with highest market capitalization. They
found that Malaysian organization paid out on average 40 percent of their earnings as
dividends. It means that on average, about a quarter of their operating cash flow was used to
payout dividend for their shareholdres. They also revealed that Earnig Per Share (EPS),
Return on Equity (ROE) and Cash Flow Per Share (CFPS) are significants of dividend
determinant of Malaysian companies. In their concluding remarks they states that “this study
confirms the fact that profitability and liquidity are two important determinants of
dividends.”

22
Hussin, Ahmed & Ying (2010), in their study they have used sample size of 120 companies
listed the Bursa Malaysia for a period from 1 January to 30 November 2006. They found that
the capital market reaction to dividend announcement strongly support the information
content dividend hypothesis. In their result it is revealed that the higher dividend
announcements, on an average, earned positive abnormal return; lower dividend
announcement resulted in negative abnormal return. They concluded that “Malaysian stock
exchange has not yet reached its full efficiency level in semi strong form, as the time required
for the market to absorb the information conveyed by the dividend and earnings
announcements is extensively long. The cumulative abnormal returns still exhibit clear
upward or downward trends within two weeks (10 trading days) after the announcements
day, indicating a long delayed response to newly released public information.”
Muhammed & Rahman (2010) have conducted a research on day of the week effect in
Malaysian stock exchange from January 1999 to December 2006. They found that in
Malaysian stock exchange the day of the week effect was present. Another research by Isa &
Lee (2011) have observed the impact of acquisition annoucement to the acquirer’s form in the
Bursa Malaysia. They establish that acquiring firm do acquire significant abnormal return
during the annoucement period (-1 to +1).
A very recent study done by Ismail & Rahman (2012), have used 76 listed companies in the
Malaysian stock exchange. In their study they examine by publishing the quarterly financial
report does it have any effect on the share price? They employed event study methodology in
their research and they have developed three hypothesis. In the first hypothesis they found
that the announcements of quarterly report have no significant positive relationship with the
share price in the Malaysian stock exchange. In the second hypothesis they examine the
relationship between the level disclosure of quarterly financial report and firm share price and
found that no significant relationship. In the third hypothesis they examine the relationship

23
between the changes in quarterly earnings and firm share price and reveal that the changes in
quarterly earnings have significant positive relationship with share price. Therefore it is clear
that always the investors look into the earning capacity of the firm.
However the results of Abdullah, Rashid, & Ibrahim (2002) conducted emprical research on
the effect of dividend annoucements on the stock returns for the companies in the malaysian
stock exchange. They have included 120 observation from the year 1996 to 1999. They found
that decreasing dividend annoucment leads to positive abnormal return trend. The
annoucement period day t-60 to t+60, t-30 to t+30, t-0 to t+1 and t+1 to t+60 the CAAR
values are 15.79%, 8.49%, 1.42% and 9.59% respectively. These result indicate that by
decreasing dividend annoucements are associated with positive abnormal return and all the t-
values are statistically significant. Hence, dividend annoucement does not send bad news to
the bourse. Therefore these results are inconsistent with dividend signalling theory
(information content hypothesis) proposed by Bhattacharya (1979/1980), John and Williams
(1985), and Miller and Rock (1985).
1.9 Agency Cost
In the world of corporate finance agency cost is one of the important area which the
researchers have highlighted, how can agency cost can be reduced. According to Peavler
(2012) agency cost mean shareholders and corporate excutive (managers) are not necessarily
in agreement on the measure best suited to the business operation and that there is a cost
involved in such agreement. This is know as the agency problem.
Easterbrook (1984) is one of the pioneering scholar who first talk about the agency problem.
According to him when the firm decelare dividend help to reduce the agency cost problem
because declaring dividend leads to reduction in the free cash flow with the managers.
Therefore if the managers want to raise more fund then they have to go the capital market. He

24
argue that if there are more free cash flows with the manager he may invest a project which
may not be in the interest of the shareholders or he may not invest in the most profitable
project. Easterbrook states that sometime the risk – averse manager may opt a project that are
safe but perhaps the lesser expected return than a riskier venture, but the shareholders
(owners) may have contrarypenchant.
Al-Jafari & Altaee (2011) have conducted a research on whether the prices in Egypt
emerging equity market follow a random walk hypothesis. They have used a sample size of
3189 observation from January 1998 to December 2010. In their empirical researched they
have employs unit root test, run test and variance root test. In their conclusion they stated that
“the Egyptian stock market did not follow a random walk and informational inefficient at the
weak form level. Therefore, prudent investors will realize abnormal returns by using
historical sequences of stock prices, data related to trading volumes and other market
generated information.”
1.10 Efficient Market Hypothesis
In an efficient market it is impractical to beat the market and gain abnormal return, for the
reason that in efficient market it is always assumed that stocks are traded at its fair value. The
pioneering study done on Efficient Market Hypothesis (EMH) was Fama, Fisher, Jensen, &
Roll 1969, have examined (NYSE, January 1927 – December 1959) the stock price
adjustment towards the annoucement of stock split. They have documented that stock price
adjust very rapidly to the annoucement of stock split, and it indicate that NYSE is efficient in
its semi strong form. In their concluding remarks they state that “the stock market is
‘efficient’ in the sense that stock prices adjust very rapidly to the new information.” Another
significant fact found in their seminal study was split cannot be used to increase expected
abnormal profit perhaps seems to be bit anomalous.

25
Efficient Market Hypothesis (EMH) was propounded by Fama (1970) in his seminal paper
titled Efficient Capital Markets: A Review of Theory and Empirical Work. In an efficent
market all the security prices are fully reflected to all the available information and no one
will be able to earn excess profit using this information. Fama (1970) states that “a market in
which prices at any time ‘fully reflect’ available information is called ‘efficient’.” In his
paper he categorize EMH into three form efficiency namely Weak form, Semi – Strong form
and Strong form. Figure 2.3 depict those three form of efficiencies. In the weak form of
market efficiency if the current price is fully reflected by past or historical data, therefore no
investors should be able to earn abnormal return using company historical data. In his paper
he states that “weak form tests, in which the information set is just historical prices, are
discussed.” In semi – strong form the stock price should be reflected by all publically
available information, consequently no investors should be able to gain abnormal return using
public inforamtion (annoucement of dividend, merger, stock split or bonus). In his paper he
states that “semi – strong form tests, in which the concern is whether prices efficently adjust
to other information that is obviously publicaly available are considered.” Finally last form
of market efficiency was strong form, which is tremendously sporadic case. In strong form it
is asssumed that all stock price are fully reflected to all the information public as well as
insider information.
Sewell (2011) in his critic article on EMH, he have reviewed more than 163 article and found
that 50% reviewed are in support of EMH. In the conclusion he documenented that EMH is
false, but in spirit it is overwhelmingly true. He advocate that no real market in the factual
world will ever be efficient, signifying that EMH is virtually unquestionably made-up.

26
1.11 Conclusion
I would like to conclude this literature chapter a quote from Black (1976) “the harder we
look at the dividend picture, the more it seems like a puzzle, with pieces that don’t fit
together.” Hence, I believe there is always room or gap in this filed i.e, dividend signaling
hypothesis to be researched on.

27
CHAPTER 3
METHODOLOGY
1.12 Research Design
In figure 3.1 show the research framwork of this project paper. In the first phase through
literature review I have highlighted the main theories that was developed by previous
researchers on this topic. The famous theories that was developed include dividend signaling
hypothesis (relevent or irrelevent), information content hypothesis, agency cost, information
assymmetry, Efficient Market Hypothsis (EMH) and finally days of the week effect. In the
second phase hypothesis was developed based on theories in order to test market efficiency
and dividend signalling, after that data was collected and it was analysed and finally the
results was checked whether it support the exisiting theories or not.
28
1.13 Population and Sample
In this research the target population is the listed companies which are operating in Bursa
Malaysia Stock Exchange. There are more than 1000 companies listed in that burse. In this
paper, I have intergrated random sample technique, in total 77 companies dividend
annoucement data was collected, of which 45 companies are with dividend increase and the
the remaining 32 companies are with dividend decrease compare to the previous year. The
annoucement date (of dividend) is define as the very first day of the official statement made
by the board of directors of the sample companies. The data was collected from 2010 to 2012
in the calander year. The raw data was collected from http://biz.thestar.com.my/, and this data
was cross checked from their annual finacial statement for their validity.
1.14 Data Collection Procedures
In this project paper, I have employed the classic event study methodolgy and Run test for
checking the type of market efficiency exist in Malaysian Stock Exchange. Event study
observe the behaviour of the firm stock price during the communal dividend annoucement.
Any news that may effect the market value of the firm can be considered as an event. An
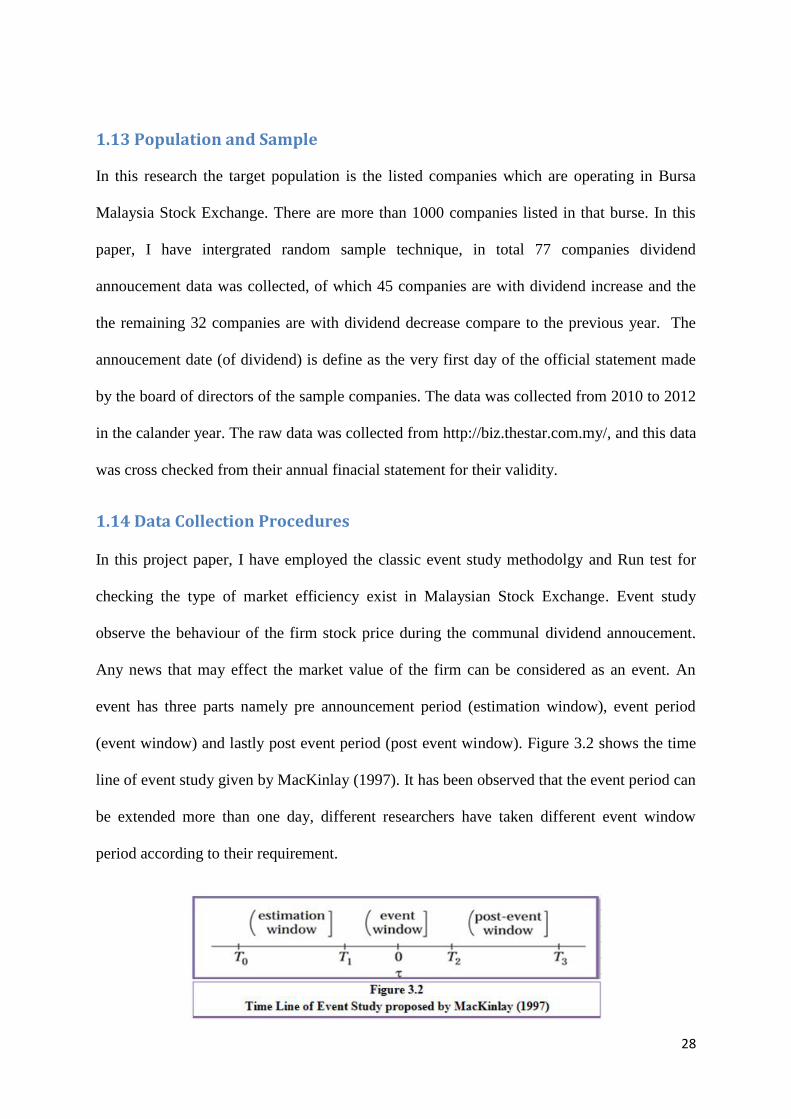
event has three parts namely pre announcement period (estimation window), event period
(event window) and lastly post event period (post event window). Figure 3.2 shows the time
line of event study given by MacKinlay (1997). It has been observed that the event period can
be extended more than one day, different researchers have taken different event window
period according to their requirement.

29
The corerationale of an event study methodolgy review the extent to which stock price
performance around the time of an event is abnormal or not, therefore the extent in which
stock returns are dissimilar from those known by the model determining equilibrium return.
Event studies has been used in various field of researches namley for earning annoucement,
debt or equity issues, merger and acquisitions, lawsuits, investment decision, impact of the
value of the firm when there is change in the regulatory environment (MacKinlay, 1997).
In this research I am going to use 21 day event windowincluding the annoucement day that is
(-10 to +10), in order to capture whether there is abnormal return or not. Previous researcher
who have used 21 day event window namley include Capstaff, Kteboe, & Marshall (2004),
Mandal & Rao (2010), and Hussin, Ahmed, & Ying (2010). On the other hand for the
calculation of adjusted mean, I have taken 100 days as the estimation period (-130 to -30). In
general in the finance literature 100 days to 250 days has been taken as estimation period. But
Michaely, Thaler, & Womack (1995) have used -254, +1 and -1, +758 days, conversely I
don’t distinguish any use of taking such an elongated event period for this study, and I
presume that within 21 days period if there is any abnormal return then it can be captured. By
means of event window, I can test the hypothesis draw conclusion in the anon in this chapter.
Event study methodogy is a statistical method, in order to review the effect of the security
market on annoucement of an event. Therefore in order to review the event study I have to
measure the abnormal return for each day.
In this research I have used mean adjusted model to estimated abnormal returns of the
securities, the main reason behind the use of this model in my project, due to its simplicities
and easiness of calculation. Brown & Warner (1985) found that mean adjusted model is more
sophisticated model than the other model. Chander, Sharma, & Mehta (2007) acknowledged
that Average Abnormal Return (AAR) under the mean adjusted model seemed to be cogently
more unswerving around the dividend announcement.

30
For each company, calendar time of the announcement is converted to event time by defining
the date of announcement as t=0. For announcement on stock exchange holiday in Malaysia
includes Friday and Saturday, I have used the next available trading as the event day, t=0. In
the mean adjusted model, where it assumes the expected returns are equal across all stocks at
a point of time t, but not necessarily constant for a stock at different times. In this study I
have used 130 days prior to the announcement, of which -130 to -30 (total 100 days) was
used to calculate the adjusted mean for the event window. Timeline I have used is shown in
figure 3.3. The speculative period -29 to 0 days data was not used in calculating the adjusted
mean in order to minimize the error. The actual return on each security on a particular day is
calculated using mean adjusted model.
1.14.1 Daily Return Measure ( )
There are abundant ways in calculating the the return for the security including the log return.
But here in this project report for the purpose of ease I have used an extremely trouble-free
arithametic ratio. The raw return at day t for firm i can be methametically symbolized as
follows:

31
(
)
Where indicate the return for firm i security on a t day, denotes the daily closing
security i on day t and symbolize the return for firm i security on a t day, denotes the
daily closing security i on previous day.
1.14.2 Adjusted Mean Measures
Adjusted mean is calculatd by averaging the raw return of stock i in given period of time
here in this study it was -130 to -30 days. The adusted mean of a firm can be methametically
symbolized as follows:
∑
Where denote adjusted mean for the data and = +1 equals the number of time
periods used to calculate the average return. For the use of this project paper = 100 days
where ( +1 is used.
1.14.3 Abnormal Return
After the calculation of daily return ( ) and Adjusted mean [ ] then I have to
calcualte abnormal return under the event study methodology. Abnormal return is the
excess return over the expected return on a security. The Abnormal return at day t for
firm i can be methametically symbolized as follows:
Where is the abnormal return on security i on day t, ( ) is the daily return on on
security i on day t and is the expected return on security i on the day t.

32
1.14.4 Average Abnormal Return (AAR)
After calculating, daily abnormal return then averaged across the firms in the choosen
samples using the following formula. for the definite cluster of companies are
examined in order to determine if the event produeces any return that perhaps cannot be
expained by the Capital Asset Pricing Model (CAPM).
∑
Where N is the total number of observation, here in this research N is 45 & 32 for dividend
increase& decrease firm respectively.
1.14.5 Average Abnormal Return (CAAR)
The usual way to study performance over longer interval is by means of Cumulative Average
Abnormal Return (CAAR), where the Average Abnormal Returns (AAR) are aggregated
from the start of the event period, t₁, up to time t . The CAAR at day t for firm i stock can be
methametically symbolized as follows:
∑
₁
1.14.6 Standard Deviation (σ)
Standard deviation give an idea about the dispersion that subsist from the average mean of
the data, a low standard deviation specify that the data points are close to the mean where as
high standard deviation signify data are spread over a hefty range of values. The σ at day t for
firm i security can be methametically symbolized as follows:
√
∑

33
1.14.7 Standard Error
The standard error compute the precision whether the sample represents the population. The
standard error at day t for firm i security can be methametically symbolized as follows:
σ
√
Where N is the total number of observation, here in this research N is 45 & 32 for dividend
increase & decrease firm respectively.
1.14.8 T-Test ( )
In order to find out the statistical significance of the AAR I have employ a parametric test
which is t-test. The t-test make use of the cross sectional standard deviation of abnormal
returns. T-Values are calculated by means of the following formula.
σ
Where t - statistics values for checking the significant level. is the Average
Abnormal Return on security i on the day t. σ on security i on the day t.
1.14.9 Run Test
Another name for the run test is Geary test, it is a non parametric test in which we try to
calculate the number of positive and negative hits and compare against its sampling
distribution under the random walk hypothesis. A run is defined as repeated occurance of the
same value. In this research the first run is marked as ‘0’ and the second run is marketd as
‘1’. A stock price runs can be positive, negative or no changes. The expected return and
standard deviation in the run test is calcuated using the following formula:

34
1.14.9.1 Expected Return
1.14.9.2 Standard Deviation
√
Where is the number of observation is number of first run cycle and is number of
second run cycle.
1.14.9.3 Z – test
Where R is the number of run in the market. & are expected return and standard
deviation respectively.
1.15 Framework for Data Analysis
Objectives 1. Find out whether there is an opportunity
in the Bursa Malaysia for arbitrages
2. Which form of market efficiency exist in
the Bursa Malaysia Stock Exchange
Research Question 1. What kind of market efficiency exist in
Malaysian stock exchange (Bursa
Malaysia) namely weak form, semi –
strong form or strong form?
2. What is the impact of dividend

35
announcement on stock price, is there any
opportunity for arbitrage in Malaysian
stock exchange (Bursa Malaysia)?
Hypothesis For dividend increase / initiation Firms
Abnormal Return
₁
Cumulative Average Abnormal Return
₁
For dividend decrease / omission
Abnormal Return
₁
Cumulative Average Abnormal Return
₁
ANOVA Single Factor
₁
₁ ₁
Run Test
₁

36
Source of Data
http://thestar.com.my/ and Annual Financial
Statement of Listed Companies.
Type of Data Secondary Data
Technique of Analysis 1. Event study methodology
2. Quantitative Analysis.
3. Descriptive statistics
1.16 Methodological Issues
Though there are advantages of using event study methodology and its wide spread usage in
the world stock market trade it do have some shortcoming. Since I have used mean adjusted
model in this research it has been very difficult in ascertaining the estimation period. Another
vital point to be documented is during the estimation period of means there perhaps interim
dividend announcements or other event which may impact on stock price, which may impact
on the results of this research by McWilliams & Siegel (1997) highlighted some of the issues
in event study in particulary the field of management research included that unaticipated
event, confounding effects, samples size, non parametric test to identify outliers, length of
event window and explanation of abnormal return are issues to be address in order to get
competent event studies.

37
CHAPTER 4
DATA ANALYSIS AND RESULTS
Stock market reactions on the announcement of event dividend (increase / decrease) are
captured by its Average Abnormal Return (AAR) values and Cumulative Average Abnormal
Return (CAAR) surrounding the event announcement day. The main intention of doing this
research is to find the answer the research questions which were developed in chapter 1, in
order to do that I have developed some hypothesis in chapter 1.
1.17 Dividend Increase 45 Firms
H₀: there is statistically zero significant abnormal return (positive or negative) due to
dividend increase / initiation. Therefore the Bursa Malaysia Stock Market is semi – strong
efficient with respect to the dividend increase / initiation.
H₁: there is statistically significant abnormal return (positive or negative) due to dividend
increase / initiation.
₁
Table 4.1 depict 45 dividend increased firm AAR, CAAR and T – Values (AAR), on each
event window (-10, +10) correspondingly. From table 4.1 it is found that 62% of the firms
have positive AAR and 38% have negative AAR during post event and pre-event period. The
firm who have increased their dividend compare to previous year found that on the day of
announcement of dividend, day 0 AAR is negative i.e., -0.19%, but in the following day, but
on the immediate event day+1 AAR is positive i.e., +1.25 (t – value +3.6048) and it is
significant at 1%. Figure 4.1 shows pre – announcement period negative curve, but after the

38
announcement of dividend day +1 it instantly increased and market has been adjusted after
day +3. This market rejoinder implied that increase in dividends release positive information
about the organization or the firm. In overall this results indicate significant market reaction
on the announcement data to positive dividend change. This result is consistent with dividend
signaling hypothesis theory. Therefore I do accept the null hypothesis .
Table 4.1
Stock Market Reaction to Average Abnormal Return (AAR), Cumulative Average
Abnormal Return (CAAR), T – Values for Dividend Increase Announcement of 45
Firms.
Event Window AAR CAAR T – Values (AAR)
-10 +0.07% +0.07% +0.1951
-9 +0.04% +0.11% +0.1003
-8 +0.23% +0.34% +0.9133
-7 +0.02% +0.36% +0.0463
-6 -0.57% -0.21% -1.5421*
-5 -0.16% -0.37% -0.4914
-4 +0.06% -0.31% +0.2006
-3 +0.07% -0.24% +0.1569
-2 -0.15% -0.39% -0.6655
-1 -0.04% -0.43% -0.1899
0 -0.19% -0.62% -0.6793
+1 +1.25% +0.63% +3.6048***
+2 +0.08% +0.71% +0.3008
+3 +0.86% +1.57% +2.2106**
+4 +0.04% +1.61% +0.1455
+5 +0.23% +1.84% +0.7299
+6 -0.39% +1.45% -1.4334*
+7 +0.35% +1.80% +1.1799
+8 -0.01% +1.79% -0.0471
+9 -0.15% +1.64% -0.5272
+10 +0.08% +1.72% +0.1874
* Significant at 10%, ** Significant at 5% and *** Significant at 1%

39
As we know that the exact occurrence of information content involves uncertainties, therefore
it is very much indispensable to test the cumulative effects of AAR. Hence under here am
going to test the significance of CAAR.
Cumulative Average Abnormal Return
H₀: there is statistically zero significant cumulative average abnormal return (positive or
negative) due to dividend increase / initiation. Therefore the Bursa Malaysia Stock Market is
semi – strong efficient with respect to the dividend increase / initiation.
H₁: there is statistically significant cumulative average abnormal return (positive or negative)
due to dividend increase / initiation.
₁
Figure 4.2 represents Cumulative Average Abnormal Return (CAAR), it reveals that 67% of
the firms have positive CAAR and 33% have negative CAAR during post event and pre-
event period. Figure 4.2 demonstrate CAAR for the firm who have increased their dividend
compare to previous year, found that in the day of announcement of dividend, day 0 CAAR is
negative i.e., -0.62%, but in the following day, day +1 CAAR is positive i.e., +0.63. The

40
announcement effect was spread to, day 2 as well as day 3, CAAR values are +0.71% and
+1.57% respectively, but after that market has been adjusted. In overall this results indicate
significant market reaction on the announcement data to positive dividend change. Therefore
I do accept the null hypothesis .
1.18 For dividend Decrease 32 Firms
Abnormal Return
H₁: there is statistically zero significant abnormal return (positive or negative) due to
dividend decrease / omission. Therefore the Bursa Malaysia Stock Market is semi – strong
efficient with respect to the dividend decrease / omission.
₁
H₁: there is statistically significant abnormal return (positive or negative) due to dividend
decrease / omission.
₁
Table 4.3 shows 32 dividend decreased firm AAR, CAAR and T – Values (AAR), on each
event window (-10 , +10) correspondingly. From the table 4.3 it is found that 57% of the
firms have positive AAR and 43% have negative AAR during post event and pre-event

41
period. The firm who have decreased their dividend compare to previous year found positive
AAR in day -3, -2, and -1, AAR values are +0.46, +0.07 and +0.23 respectively, but on the
day of announcement of dividend, day 0 AAR is negative i.e., -0.17%, indicating for the
dividend decrease announcement market participant react negatively on that, but that is not
significant. But looking into individual pre – announcement event, day -9, AAR is -0.60%
(corresponding t – value is -1.9733) significant at 5% and day -5, AAR is -0.67%
(corresponding t – value is -1.6193) significant at 10%. These results indicate that,
shareholders do expect a dividend decrease because in Malaysia, listed companies need to
publish their books of accounts on quarterly basis, therefore based on the firms performance
stockholder, anticipate a dividend decreased.
Table 4.2
Stock Market Reaction to Average Abnormal Return (AAR), Cumulative Average
Abnormal Return (CAAR), T – Values for Dividend Decrease Announcement of 32
Firms.
Event Window AAR CAAR T – Values (AAR)
-10 +0.79% +0.79% +1.7102
-9 -0.60% +0.19% -1.9733**
-8 -0.65% -0.45% -1.3073
-7 +0.28% -0.17% +0.5834
-6 -0.30% -0.47% -0.9409
-5 -0.67% -1.14% -1.6193*
-4 -0.25% -1.39% -0.8470
-3 +0.46% -0.93% +0.9669
-2 +0.07% -0.86% +0.2261
-1 +0.23% -0.62% +0.6706
0 -0.17% -0.80% -0.4366
+1 +0.13% -0.67% +0.6319
+2 -0.27% -0.93% -1.3838*
+3 +0.02% -0.91% +0.1043
+4 +0.61% -0.31% +1.2859
+5 -0.67% -0.97% -1.5331*
+6 +0.83% -0.15% +1.4614*
+7 +0.01% -0.14% +0.0282
+8 +0.05% -0.08% +0.0889
+9 -0.39% -0.48% -1.4547*
+10 +0.25% -0.23% +0.7403
* Significant at 10%, ** Significant at 5% and *** Significant at 1%

42
Figure 4.3 show the CAAR curves for the event period (-10, +10), it depict that very much
fluctuation hence, was not able to draw a proper conclusion on that. As expected on the day
announcement day 0, dividend has been fallen.
Cumulative Average Abnormal Return
H₀: there is statistically zero significant cumulative average abnormal return (positive or
negative) due to dividend decrease / omission. Therefore the Bursa Malaysia Stock Market is
semi – strong efficient with respect to the dividend decrease / omission.
H₁: there is statistically significant cumulative average abnormal return (positive or negative)
due to dividend decrease / omission.
₁
The result presented in figure 4.4, a clear negative CAAR trend can be observed for the firms
announcing the dividend decrease or omission in dividend compare to the previous annual
year. It is found that 95% of the firms have negative CAAR and only 5% have positive
CAAR values. The CAAR is positive for only two days i.e., day -10 &-9, CAAR values are
+0.79% and +0.19 respectively. All the rest in the event days the CAAR are negative. From
day -7 onwards the CAAR started falling gradually and it reach the deepest in day -4 (CAAR

43
value is -1.39%). Before the announcement of one day which is at day -1 the CAAR value is -
0.62% and on the day of dividend announcement at day 0 CAAR value is -0.80%, indicating
decrease in dividend announcement market participant reaction on that and at day +1 the
CAAR value is -0.67%. It is also clear that market has not been adjusted after the
announcement therefore I do reject the H1.
1.19 Combination of Dividend Increase / Decreased
Figure 4.5 represent a combined CAAR for both dividends increased and dividend decreased
firm. It shows that dividend increased firm pre – announcement period day -10, -9, -8, -7,
their corresponding CAAR values are +0.07%, +0.11%, +0.34% & +0.36% respectively, and
for dividend decreased firm day -10, -9, -8, -7, their corresponding CAAR values are
+0.76%, +0.19%, -0.45% & -0.17% respectively. Hence, for those four day dividend
increased firm has higher CAAR values compare to dividend decreased firm. But from day -
6, -5, -4, -3, -1 for these five days dividend decreased firm have higher CAAR values
compare to dividend increased firms. However, after the announcement of dividend, dividend
increase firm have much more higher CAAR values compare to dividend decrease firm.

44
The table 4.3 shows the dividend increase and decrease announcement of different event
window, in order to check whether there is significant CAAR in that event window.
Table 4.3
Test of Significance at different Event Window on Cumulative Average Abnormal
Return (CAAR) for dividend Increase (45) and Decrease (32) firms
Event Window Dividend Increased 45 Firms Dividend Decreased 32 Firms
CAAR T – Values CAAR T – Values
(-10 , -2) -0.39% -0.5933 -0.86% -0.8729
(-1 , +1) 1.02% 1.9723** 0.19% 0.6700
(+4 , +9) 0.07% 0.1297 0.43% 0.5221
* Significant at 10%, ** Significant at 5% and *** Significant at 1%
The referred table shows CAAR values and the corresponding t – values at different event
windows. For the pre – event window I took 8 days period that is (-10, -2), the CAAR values
for this window is -0.39% and the corresponding t – values is -0.5933 which is not
statistically significant. But for the immediate announcement event window which is (-1, +1)
the CAAR values is 1.02% and the corresponding t – values is 1.9723 which is statistically
significant at 5% confidence level. On the other hand for the post – event window I took 5
days period that is (+4, +9), the CAAR values for this window are 0.07% and the
corresponding t – values is 0.1297 which is not statistically significant.

45
1.20 ANOVA: Single Factor
In order to establish the stock price reaction towards dividend increased / decreased
announcement, I have conducted one way ANOVA for CAAR values 21 days (-10, +10)
event period for the entire sample both dividend increase as well as dividend decrease group.
ANOVA outcomes have been generated using Microsoft Excel 2010. The depiction of
outcomes is below presented in the table 4.4
The above table 4.4 shows that the F value is 24.82 and the corresponding F critical value is
4.0847, therefore when F value is greater than F critical value, I have to reject null hypothesis
and accept the alternative hypothesis. Another important thing is the p – values is very lower
almost zero i.e., 0.00001252.
1.21 Run Test
Run test has been done in order to check, which kind of market efficiency exists in Malaysia
Stock Exchange.

46
Table: 4.5
Run Test Results for Dividend Increased / Decreased (77 Firms)
(Observation period +15, -15)
22
9
31
20
13.7742
5.0135
2.2390
2.7805
±1.96
Hypothesis Accept: H1
From the above table 4.5 it show results of the run test for all 77 companies for a period on
one month i.e., (-15, +15). The total number of runs within one month period is 20 and the
expected run 13.7742, which is higher than expected before i.e., 6.2258. In the first and
second run cycle there were 22 &9 runs respectively. The standard deviation of this run test is
2.2390 and the ‘Z’ value is 2.7805, which is significant at 5%. Therefore I reject null
hypothesis and accept the alternative hypothesis.

47
CHAPTER 5
DISCUSSION AND CONCLUSION
1.22 Summary of Main Finding
The main findings of this research which I wanted to document are as follows:
Dividend increased firms AAR are positive day +1, and significant at 1% confidence
level, therefore this results indicate significant market reaction on the announcement
of dividend to positive dividend change and this result is consistent with dividend
signaling hypothesis theory.
Dividend increased firms CAAR values shows gradual increased starting from event
day (day 0) but the values arenegative -0.62%, on the other hand at day +1 CAAR is
+0.63, the CAAR has been adjusted after day +3, indicating longer time for adjusting
the market. Since CAAR is positive after the announcement it indicates that investors
or stockholders feels dividend increase of cash dividend as good news.
Dividend decreased firms AAR reveals a very volatile and there pre - announcement
and post announcement period there are statistically significant value. On the overall
AAR values indicate shareholders do expect a dividend decrease because in Malaysia,
listed company need to publish their books of accounts on quarterly basis, therefore
based on the firm performance stockholder, anticipate a dividend decreased.
Dividend decreased firms almost all the CAAR values are negative, it indicate that
investors or stockholders feels dividend decreased of cash dividend as bad news and
also market has not been adjusted after the announcement.

48
Looking into different event window CAAR for dividend increased and decreased, I
found that during the event window of post announcement (-10, -2) CAAR value is
not statistically significant for dividend increased or decreased firms, it indicates that
there is no informational leakage in the Bursa Malaysia. For the immediate event
window (-1, +1) I found dividend increased firm t-values is statistically significant at
5%. This indicate that there is a strong positive relationship between abnormal return
and dividend announcements in the Malaysian Stock Exchange (Bursa Malaysia), but
the Bursa Malaysia market seize this vicissitudes so hasty that it does not permit
stockholders to feat any superfluous abnormal gain steadily. On the other hand for the
dividend decreased firm t-value is not significant. It indicates that market participant
no longer is able to gain abnormal return due to fact that all the investors have that
information Malaysian Stock Exchange (Bursa Malaysia). For event window (+4, +9)
I found the CAAR value is not statistically significant for dividend increase or
decrease firms, indicating market adjusted to the information.
ANOVA reveals that there is a difference in the mean values of dividend increased
and decreased group. Therefore it suggests that stockholders react differently to the
dividend increased and decreased announcement.
Run test reveals that Bursa Malaysia does not follow Random Walk theory, because
Bursa Malaysia does not follow any randomness. It indicated that Bursa Malaysia
Stock Exchange does not satisfy the weak form of market efficiency.
From all the above result, I conclude that Bursa Malaysia Stock Exchange has not
reached its full efficiency in semi strong form, because it requires more time to adjust
the release information to the market.

49
1.23 Discussion
1.23.1 Dividend Increase 45 Firms
Referring the result presented in Table 4.1, the AAR earned on the day of announcement (day
0) is negative which is -0.19% with t – values -0.6793 and the corresponding CAAR value is
-0.62%. Dividend increased announcement contradict the findings of Abdullah, Rashid, &
Ibrahim (2002) & Mandal & Rao (2010) who found that positive AAR & CAAR on the day
of announcement (day 0), and they found on day 0, significant abnormal return. However the
result presented in Figure 4.1, on day 0 there is no abnormal gain and t – value is not
significant, but AAR is positive day +1 i.e., +1.25 (t – value +3.6048) and the corresponding
CAAR value is +0.63% and it is statistically significant at 1%. Hence, this result is
consistent with (Hussin, Ahmed, & Ying, 2010). This market rejoinder implied that increase
in dividends release positive information about the organization or the firm. In overall this
results indicate significant market reaction on the announcement data to positive dividend
change. This result is consistent with other dividend signaling hypothesis theory proposed by
Bhattacharya (1979) & Miller & Rock (1985).
Referring the result presented in Figure 4.2 demonstrate CAAR for the firm who have
increased their dividend, found that in the day of announcement of dividend, day 0 CAAR is
negative i.e., -0.62%, but in the following day, day +1 CAAR is positive i.e., +0.63. The
announcement effect was spread for consecutively two days, day +2 as well as day +3,
CAAR values are +0.71% and +1.57% respectively, but after that market has been adjusted.
In overall this results indicate significant market reaction on the announcement data to
positive dividend change. This 45 firms which I have taken, was firms which have increase
their current dividend compare to preceding year dividend and result signpost that it followed
by positive price reaction and vice versa. Therefore it can be said that there is positive
relation between the announcement of increase in dividend (which investors take as good

50
news) and the stock price. An increasing dividend announcement indicates an increase of
analogous company stock price and stockholders respond positively to the announcement.
This result is consistent with (Hussin, Ahmed, & Ying, 2010), (Taneem & Yüce, 2011) &
(Yilmaz & Selcuk, 2010), on the other hand this result is inconsistent with (Abdullah, Rashid,
& Ibrahim, 2002) & (Mandal & Rao, 2010).
1.23.2 Dividend Decreased 32 Firms
From the table 4.3 it is found that most of the firms have positive AAR values. Referring the
figure 4.3 I cannot capture any pattern in the AAR curve and also after the announcement of
dividend decrease market has not been adjusted it has been very volatile. Both pre and post
announcement period I found negative and positive return. It is found that before three day
prior to the announcement day -3 to -1 there was positive AAR but on the day of event i.e.,
announcement day 0 AAR is negative i.e., -0.17%, indicating for the dividend decrease
announcement market participant react negatively on that, but that is not statistically
significant. But proceeding to day +2 there I was able to capture significant at 10%, negative
abnormal return on that day. This result is inconsistent with (Mandal & Rao, 2010), what
they found was on declaring dividend omission they found negative AAR at day 0 significant
at 1% level and market has been adjust after day +3. The main reason why market participant
doesn’t react to this dividend decrease announcement due to reason that, shareholders do
expect a dividend decrease because in Malaysia, listed company need to publish their books
of accounts on quarterly basis, therefore based on the firm performance stockholder,
anticipate a dividend decreased.
Referring the result presented in figure 4.4 a clear negative CAAR trend can be observed for
the firms announcing the dividend decrease or omission in dividend compare to the previous
annual year. These results are consistent with Miller & Rock (1985) information content
dividend signaling theory. Which suggest that in a typical world of asymmetry of information

51
between the stockholders and the mangers do exist, dividend annoucement merely provide
the missing pieace of information to the investors. They confirm that on the annoucement of
deacrease in dividend may sometimes shows comperatively negative return / performance in
the burse. They states that “dividends make sense as signals for the good news, not the bad
news firm.” However Miller & Modigliani (1961) argue that dividend policies are irrlevent
because stockholders can earn homemade shares by selling their shares, dividend policies of
the firm have no effect on gaining abnormal return.
1.23.3 Combined CAAR
Referring figure 4.5 in chapter 4, I found that after the announcement of dividend the firm
which increase dividend compare to previous year have higher CAAR values to dividend
omission firm. Another fact I want to document is AAR values and CAAR values are
statistically significant at day +1. It indicate that investors greet dividend increase as good
news and they react that positively on the other hand dividend decrease investors greet
investors as bad news and this results is consistent with (Pettit, 1972), (Miller & Rock, 1985),
(Asquith & Mullins, 1986) and (Jais, Karim, Funaoka, & Abidin, 2009).
Referring table 4.3 in chapter 4, the post announcement event window (-10, -2) the CAAR
values are -0.39% and -0.86% corresponding t-values are -0.5933 & -0.8729 for dividend
increased and decreased firms respectively. None of the values are statistically significant
indicating that there does not exists information leakage before the announcement of dividend
in the Malaysian Stock Exchange (Bursa Malaysia). For the announcement event window
period (-1, +1) the CAAR values are 1.02% and +0.19% corresponding t-values are +1.9723
and +0.6700 for dividend increase and decrease firms respectively. The dividend increased
firms t-values arestatistically significant at 5%. This indicate that there is a strong positive
relationship between abnormal return and dividend announcements in the Malaysian Stock
Exchange (Bursa Malaysia), but the Bursa Malaysia market seize this vicissitudes so hasty
52
that it does not permit stockholders to feat any superfluous abnormal gain steadily. On the
other hand for the dividend decreased firm t-value is not statistically significant. It indicates
that market participant no longer is able to gain abnormal return due to fact that all the
investors have that information Malaysian Stock Exchange (Bursa Malaysia). The main
reason why investors are not able to get abnormal gain due to fact that in Malaysia all listed
companies need to publish their set of accounts on quarterly, therefore investors will study
performance of firm, therefore they expect that if the firm are not doing well, then there
might be decrease in dividend.
Table 4.4 in chapter 4, one way ANOVA reveals that there is a difference in the mean values
of dividend increased and decreased group. Therefore it indicates that stockholders react
differently to the dividend increase and decrease announcement. This result is consistent with
(Akbar & Baig, 2010). From the event study also I found that dividend increased address as
good news and dividend decrease greet as bad news.
Referring table 4.5 in chapter 4, Run test reveals that Bursa Malaysia does not follow
Random Walk theory, because Bursa Malaysia does not follow any randomness. It indicated
that Bursa Malaysia Stock Exchange does not satisfy the weak form of market efficiency.
This result is consistent with (Al-Jafari & Altaee, 2011) who found that Egyptian equity
market does not follow weak form efficiency.
On the whole I can conclude this research result by documenting two important points.
Firstly, Bursa Malaysia Stock Exchange is not an exception to the dividend signaling theory.
I found that increase dividend; investors welcome that and react positively to the
announcement, on the other hand dividend decrease announcement investors doesn’t react
much, the main reason for that is due to the fact that the investors expect that to happen.
Secondly, since the run test support that Bursa Malaysia market is weak form inefficient, then

53
it should follow semi strong form of efficiency. From my research result I found that Bursa
Malaysia Stock Exchange has not reached its full efficiency in semi strong form, because it
requires more time to adjust the release information to the market (around three +3 or +4
days). The CAAR values show that clear upward and downward trends after the dividend
increased or decreased announcement, indicating a delay in response to the newly public
information. Consequently, this result is again another added literature to support that Bursa
Malaysia is not fully efficient in its semi strong form for the announcement of dividend
increase / decrease, hence consistent with (Hussin, Ahmed, & Ying, 2010)
1.24 Implication
This research make number of contribution in the finance literature especially to the
Malaysian market. This research result support the dividend signaling hypothesis, but I found
on the announcement day (day 0) no significant abnormal return was gain by any investors.
Another implication of this research found was Malaysian Stock Exchange does not follow
Random Walk theory or Bursa Malaysian does not follow weak form of market efficiency.
Bursa MalaysianStock Exchange has not reached its full efficiency in semi – strong form.
Another implication found was decrease in dividend does not convey any information to the
investors, therefore corporate heads need to consider this fact, it is because investors expect
dividend to go down, they learn this by the quarterly publication of the firm’s financial
statements, this result is consistent with Ismail & Rahman (2012).
1.25 Limitations of the Study
The foremost intend of this research is to uncoverwhether there is an opportunity in the Bursa
Malaysia for arbitrages and checking which form of market efficiency exist in the Bursa
Malaysia Stock Exchange. In order to achieve the main objective of this research I have faced
lot of challenges, therefore in this research there are few limitation. One of the main thing I
54
wanted to highlight is the time constrained, I got a very few weeks in order conduct this
research. Secondly, in this research I have used mean adjusted model to estimated abnormal
returns and I have used event study methodology in order to test the significance of the
hypothesis. Conclusion drawn from these statistical studies may have their own limitations in
the theories. Third the stock price can be not only effect by dividend increase or decrease
announcement, in the market there are variable which may also impact on the stock price,
however in this research I was only concentrating on the dividend announcement variable
only. Fourth in this research I have not analyzed Malaysian tax system and its effect on
dividend announcement which perhaps impact on the behavior of the stockholders. Fifth this
research has been done by using the secondary data, therefore the results of this research
paper will be depend on the accuracy and reliability of material published in
http://biz.thestar.com.my/, and financial statement. Lastly in this study I have used only 77
firms’ data, which include 45 dividend increase firm and 32 dividend decreased firm, the
sample size is not ample in lieu of whole Bursa Malaysia stock exchange. The sample data
perhaps can include more in order to get better picture of Bursa Malaysia stock price
behavior.
1.26 Directions for Future Research
In this research I have used a study period from 2010 to 2012, and the sample size was 77,
which is very short less number of period observations. Therefore I suggest using a longer
period with more number of observation which can cover a whole business or economic cycle
(which is booms and recession), because based on the economic condition the payout policy
of the firms vary differently. Hence, if someone takes a whole economic life cycle and do a
research will give a clearer picture of dividend signaling effects.

55
Another suggestion for an improvement could use different kind of model in estimating the
abnormal return, in this research I have used only mean adjusted model. Therefore one can
use market model, Capital Asset Pricing Model (CAPM) and most recent type such as Fama–
French three factor models might give a clear picture in using different kind of model what
are the difference in abnormal return.
Another suggestion for improvement is, in this research I have used only cash dividend
increased and decreased firms, rather one can use different kind of dividend payment because
in Malaysia there are many companies who pay stock dividend on regular basis.
56
REFERENCES
Abdalla, S. Z. (2012). Day-of-the-Week Effect on Returns and Conditional Volatility:
Empirical Evidence from Sudanese Stock Market. Middle Eastern Finance and Economics
(16), 167 - 180.
Abdullah, N.-A. H., Rashid, R. A., & Ibrahim, Y. (2002). The Effect of Dividend
Annoucements on Stock Returns for Companies Listed on the Main Board of the Kuala
Lumpur Stock Exchange. Malaysian Management Journal, 6 (1&2), 81 - 98.
Aduda, J. O., & Kimathi, H. (2011). The Applicability of the Constant Dividend Model for
Companies Listed at the Nairobi Stock Exchange. Journal of Financial Studies & Research,
2011, 1-39.
Agyei, S. K., & Yiadom, E. M. (2011). Dividend Policy and Bank Performance in Ghana.
International Journal of Economics and Finance, 3 (4), 202 - 207.
Akbar, M., & Baig, H. H. (2010). Reaction of Stock Prices to Dividend Annoucements and
Market Efficiency in Pakistan. The Lahore Journal of Economics, 15 (1), 103 - 125.
Ali, M. B., & Chowdhury, T. A. (2010). Effect of Dividend on Stock Price in Emerging
Stock Market: A Study on the Listed Private Commercial Banks in DSE. International
Journal of Economics and Finance, 2 (4), 52 - 64.
Alisinaei, H., & Habibi, L. (2012). An Investigation of Factors Relevant to Payout Ratio in
Listed Firms on the Tehran Stock Exchange. International Journal of Multidisciplinary
Management Studies, 2 (2), 22 - 37.
Al-Jafari, M. K., & Altaee, H. H. (2011). Testing the Random Walk Behavior and Efficiency
of the Egyptian Equity Market. Journal of Money, Investment and Banking (22), 132 - 146.

57
Alzahrani, A., & Skerratt, L. (2009). How Markets React to Earnings Announcements in the
Absence of Analysts and Institutions Evidence from the Saudi Market. Economics and
Finance Working Paper Series, 9 (40), 1 - 23.
Apolinario, R. M., Santana, O. M., Sales, L. J., & Caro, A. R. (2011). Day of the Week Effect
on European Stock Markets. Journal of European Union Economics and Finance, 2011 (1),
34-47.
Arnott, R. D., & Asness, C. S. (2003). Surprise! Higher Dividends = Higher Earnings
Growth. Financial Analysts Journal, 59 (1), 70 - 87.
Asquith, P., & Mullins, D. W. (1986). Signalling with Dividends, Stock Repurchases, and
Equity Issues. Financial Management Association International, 15 (3), 27 - 44.
Asquith, P., & Mullins, D. W. (1983). The Impact of Initiating Dividend Payments on
Shareholders' Wealth. The Journal of Business, 56 (1), 77 - 96.
Bhattacharya, S. (1979). Imperfect Information, Dividend policy, and "the bird in the hand"
fallacy. The Bell Journal of Economics, 10 (1), 259 - 270.
Black, F. (1976). The Dividend Puzzle. The Journal of Portfolio Management, 2 (2), 5 - 8.
Bouwman, C. H. (2010). Managerial Optimism and the Market's Reaction to Dividend
Changes. Western Reserve University, Wharton Financial Institutions Center. MIT Sloan
School of Management.
Brown, S. J., & Warner, J. B. (1985). Using Daily Stock Returns: The Case of Event Studies.
Journal of Financial Economics, 14, 3 - 31.

58
BursaMalaysia. (2012). Bursa Malaysia overview. Retrieved April 26, 2012, from
bursamalaysia:
http://www.bursamalaysia.com/website/bm/about_us/the_organisation/overview.html
Capstaff, J., Kteboe, A., & Marshall, A. P. (2004). Share Price Reaction to Dividend
Announcements: Empirical Evidence on the Signaling Model from the Oslo Stock Exchange.
Multinational Finance Journal, 8 (1), 115 - 139.
Chander, R., Sharma, R., & Mehta, K. (2007). Dividend Announcement and Informational
Efficiency: An Empirical Study of Indian Stock Market. The Icfai Journal of Applied
Finance, 13 (10), 29 - 42.
Charitou, A., Lambertides, N., & Theodoulou, G. (2011). Dividend Increases and Initiations
and Default Risk in Equity Returns. Journal of Financial and Quantitative Analysis , 46 (5),
1521-1543.
DeAngelo, H., DeAngelo, L., & Skinner, D. J. (2004). Are dividends disappearing? Dividend
concentration and the consolidation of earnings. Journal of Financial Economics, 72, 425–
456.
DeAngelo, H., DeAngelo, L., & Skinner, D. J. (1996). Reversal of fortune Dividend
Signaling and the disappearance of sustained earnings growth. Journal of Financial
Economics , 40, 341 - 371.
Dr.Momani, G. F., & Dr.Alsharari, M. A. (2012). Impact of Economic Factors on the Stock
Prices at Amman Stock Market (1992-2010). International Journal of Economics and
Finance, 4 (1), 151 - 159.
Easterbrook, F. H. (1984). Two Agency - Cost Explanations of Dividends. The American
Economic Review, 74 (4), 650 - 659.

59
Fama, E. F. (1970). Efficient Capital Markets: A Review of Theory and Empirical Work. The
Journal of Fianance, 25 (2), 383 - 417.
Fama, E. F., & French, K. R. (2001). Disappearing dividends: changing firm characteristics
or lower propensity to pay? Journal of Financial Economics, 60, 3 - 43.
Fama, E. F., Fisher, L., Jensen, M. C., & Roll, R. (1969, February). The Adjustment of Stock
Prices to New Information. International Economic Review , 1 - 21.
Farooq, O., Saoud, S., & Agnaou, S. (2012). Dividend Policy as a Signaling Mechanism
under Different Market Conditions: Evidence from the Casablanca Stock Exchange.
International Research Journal of Finance and Economics (83), 187 - 198.
Hussin, B. M., Ahmed, A. D., & Ying, T. C. (2010). Semi - Strong Form Efficiency: Market
Reaction to Dividend and Earnings Announcements in Malaysian Stock Exchange. Journal of
Applied Finance, 16 (f), 36-60.
Isa, M., & Lee, S.-P. (2011). Method of Payment and Target Status: Announcement Returns
to Acquiring Firms in the Malaysian Market. International Journal of Economics and
Finance, 3 (3), 177 - 189.
Ismail, K., & Rahman, R. A. (2012). The Wealth of Information from quarterly financial
report in Malaysia. African Journal of Business Management, 6 (3), 1054-1067.
Jais, M., Karim, B. A., Funaoka, K., & Abidin, A. Z. (2009). Dividend Announcements and
Stock Market Reaction. Munich Personal RePEc Archive, 19779, 1-19.
John, K., & Williams, J. (1985). Dividends, Dilution, and Taxes: Signalling Equilibrium. The
Journal of Finance, 40 (4), 1053 - 1070.

60
Khan, K. I., Aamir, M., Qayyum, A., Nasir, A., & Khan, M. I. (2011). Can Dividend
Decisions Affect the Stock Prices: A Case of Dividend Paying Companies of KSE.
International Research Journal of Finance and Economics (76), 67-74.
Liargovas, P., & Repousis, S. (2011). The Impact of Mergers and Acquisitions on the
Performance of the Greek Banking Sector: An Event Study Approach. International Journal
of Economics and Finance, 3 (2), 89 - 100.
Ling, F. S., Mutalip, M. L., Shahrin, A. R., & Othman, M. S. (2008). Dividend Policy:
Evidence From Public Listed Companies In Malaysia. International Review of Business
Research Paper, 4 (4), 208 - 222.
Lintner, J. (1956). Distribution of Incomes of Corporation Among Dividens, Retained
Earnings, and Taxes. The American Economic Review, 46 (2), 97 - 113.
MacKinlay, A. C. (1997). Event Studies in Economics and Finance. Journal of Economic
Literature, 35, 13 - 39.
Mandal, N., & Rao, N. K. (2010). Semi - Strong Form of Indian Stock Market Efficiency: An
Empirical Study. Journal of Management, 11, 1-16.
McWilliams, A., & Siegel, D. (1997). Event studies in management research: Theoretical and
empirical issues. Academy of Management Journal, 40 (3), 626 - 657.
Michaely, R., Thaler, R. H., & Womack, K. L. (1995). Price Reaction to Dividend Intitiations
and Omissions: Overreaction or Drift? The Journal of Finance, 2, 573 - 608.
Miller, M. H., & Modigliani, F. (1961). Dividend Policy, Growth, and the Valuation of
Shares. The Journal of Business, 34 (4), 411 - 433.

61
Miller, M. H., & Rock, K. (1985). Dividend Policy under Asymmetric Information. The
Journal of Finance, 40 (4), 1031 - 1051.
Mohamed, N., Hui, W. S., Omar, N. H., Rahman, R. A., Mastuki, N., Azis, M. A., et al.
(2010, December 5). EMPIRICAL ANALYSIS OF DETERMINANTS OF DIVIDEND
PAYMENT: PROFITABILITY AND LIQUIDITY. Selangor: Accounting Research Institute
&Faculty of Accountancy.
Mollah, S. (2011). Do emerging market firms follow different dividend policies? Empirical
investigation on the pre - and post - reform dividend policy and behaviour of Dhaka Stock
Exchange listed firms. Emerald Studies in Economics and Finance, 28 (2), 118 135.
Muhammad, N. M., & Rahman, N. M. (2010). Efficient Market Hypothesis and Market
Anomaly: Evidence from Day - of - the Week Effect of Malaysian Exchange. International
Journal of Economics and Finance, 2 (2), 35 - 42.
Nikkinen, J., Sahlström, P., Takko, K., & Äijö, J. (2009). Turn-of-the-month and Intramonth
Anomalies and U.S. Macroeconomic News Announcements on the Thinly Traded Finnish
Stock Market. International Journal of Economics and Finance, 1 (2), 3 - 11.
Oduncu, A. (2012). The Day of the Week Effect on the Turkish Derivatives Exchange.
European Journal of Economics, Finance and Administrative Sciences (45), 81 - 85.
Okpara, G. C. (2010). Asymmetric Information and Dividend Policy in Emerging Markets:
Empirical Evidence from Nigeria. International Journal of Economics and Finance, 2 (4),
212 - 220.
Padmavathy, S., & Ashok, J. (2012). Merger Announcements and Stock Price Behavior:
Empirical Evidence from Indian Stock Market. International Research Journal of Finance
and Economics (83), 153 - 160.

62
Peavler, R. (2012). What is the Agency Cost for Business? Retrieved May 4, 2012, from
http://bizfinance.about.com: http://bizfinance.about.com/od/Basic-Financial-
Management/a/what-is-the-agency-cost-for-business.htm
Pettit, R. R. (1972). Dividend Announcements, Security Performance, and Capital Market
Efficiency. The Journal of Finance, 27 (5), 993 - 1007.
Ramadan, I. Z. (2012). The Validity of the Arbitrage Pricing Theory in the Jordanian Stock
Market. International Journal of Economics and Finance, 4 (5), 177 - 185.
Robbani, M. G., & Bhuyan, R. (2010). Re - stating financial statements and its reaction in
financial market: Evidence from Canadian stock market. International Journal of Accounting
and Information Management, 18 (3), 188 - 197.
Ross, S. A., Westerfield, R. W., & Jaffe, J. (2008). Corporate Finance (8th Edition ed.). New
York, United States of America: McGraw-Hill Companies, Inc.
Ryan, P. A., Besley, S., & Lee, H. W. (2000). An Empirical Analysis of Reactions to
Dividend Policy Changes for NASDAQ Firms. Journal of Financial and Strategic Decisions,
13 (1), 35 - 44.
Salminen, J. (2008). Abnormal Returns of Dividend Announcements during a Boom and a
Recession. Empirical Evidence from U.S. from the years of 2000 - 2002 and 2005 - 2007,
including Finnish Extra Dividends. LAPPEENRANTA UNIVERSITY OF TECHNOLOGY.
Schanz, D., & Haesner, C. (2011, April). Taxes and the Valuation of Dividends: A Study of
Dividend Announcements in Germany. Otto Beisheim School of Management , pp. 1-27.

63
Scheufele, B., Haas, A., & Brosius, H. B. (2011). Mirror or Molder? A Study of Media
Coverage, Stock Prices, and Trading Volumes in Germany. Journal of Communication (61),
48 - 70.
Sewell, M. (2011, January 20). History of the Efficient Market Hypothesis. Retrieved April 25
, 2012, from http://www-typo3.cs.ucl.ac.uk: http://www-typo3.cs.ucl.ac.uk/fileadmin/UCL-
CS/research/Research_Notes/RN_11_04.pdf
Sharma, R. (2011). Stock Price Behaviour around Dividend Announcements: An Event Study
Methodology. Journal of Management, XI, 23 - 32.
Skinner, J. D., & Soltes, E. (2009). What Do Dividends Tell Us About Earnings Quality?
Havard Business Review, 16, 1-28.
Szczepanski, K. (2012). Malaysia - Facts and History. Retrieved April 26, 2012, from
asianhistory.about.com: http://asianhistory.about.com/od/malaysia/p/malaysiaprof.htm
Taneem, S., & Yüce, A. (2011). Information Content of Dividend Announcements: An
Investigation of the Indian Stock Market. International Business and Economics Research
Journal, 10 (5), 49-58.
Thanatawee, Y. (2011). Life-Cycle Theory and Free Cash Flow Hypothesis: Evidence from
Dividend Policy in Thailand. International Journal of Financial Research, 2 (2), 52 - 60.
Yilmaz, A. A., & Selcuk, E. A. (2010). Information Content of Dividends: Evidence from
Istanbul. International Business Research, 3 (3), 126 - 132.

64
APPENDICES
Dividend Increased 45 Firms AR, AAR, CAAR, Standard Deviation, Standard Error,
and T-Values

65
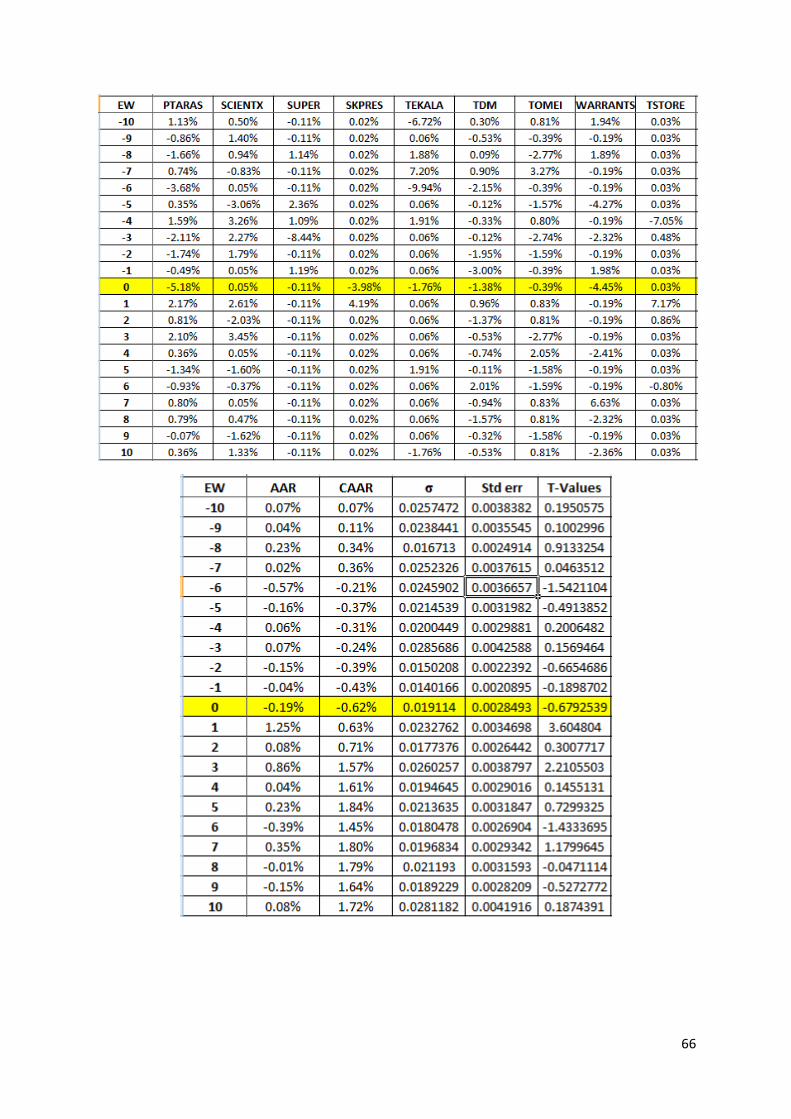
66

67
Dividend Decreased 32 Firms AR, AAR, CAAR, Standard Deviation, Standard Error,
and T-Values
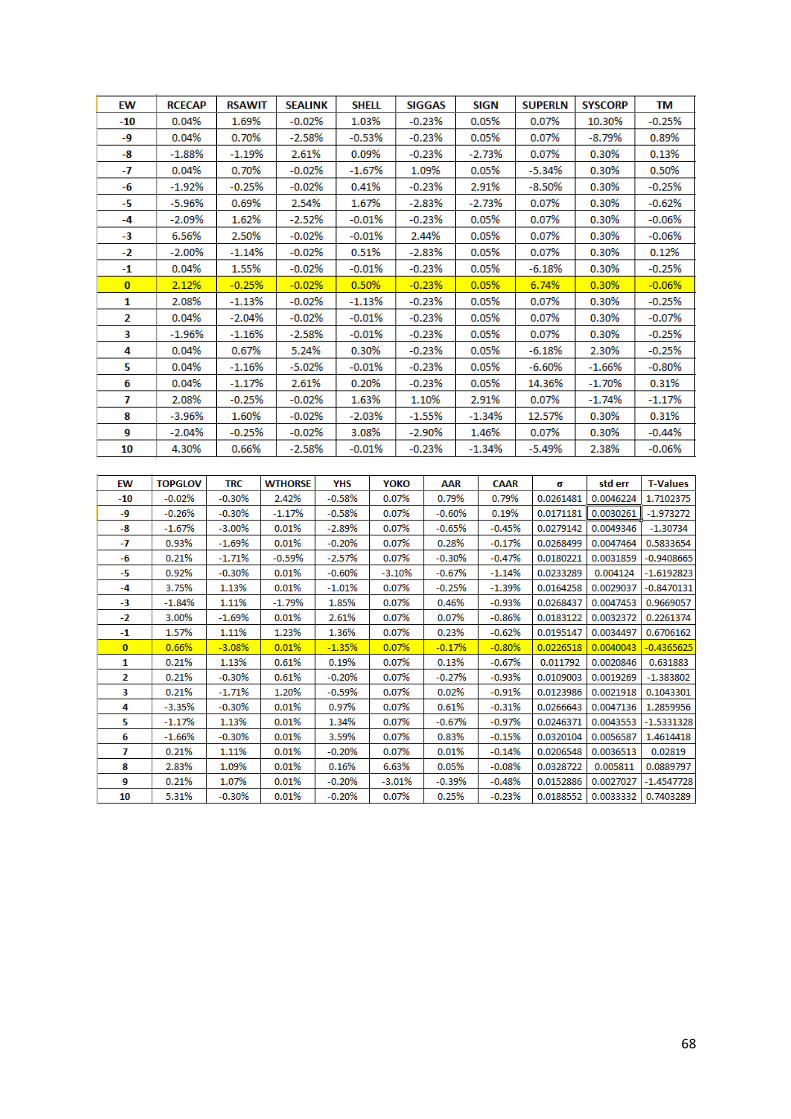
68