impact of delta and calendar time on vaccine effectiveness
TRANSCRIPT
COVID-19 Infection Survey – preliminary analysis - p1
This information is provided from the ONS/Oxford University COVID-19 Infection Survey and is shared as
Management Information for operational decision making purposes. It is not to be used publicly unless
published first by ONS/Oxford University.
Impact of Delta and calendar time on vaccine effectiveness (VE) against new SARS-CoV-2
infection and Ct/viral burden in infections post-vaccination: preliminary analysis on data to 12
July 2021
Koen B. Pouwels, Emma Pritchard, Philippa C. Matthews, Nicole Stoesser, David W. Eyre, Owen
Gethings, Karina-Doris Vihta, Joel Jones, Thomas House, Jodie Hay, Iain Bell, John I Bell, John N
Newton, Jeremy Farrar, Derrick Crook, Tim Peto, Duncan Cooke, Emma Rourke, Ruth Studley, Ian
Diamond, A. Sarah Walker and the COVID-19 Infection Survey team
Summary
• We updated our previous vaccine effectiveness analysis (https://www.nature.com/articles/s41591-
021-01410-w) using the same models (details at end), but splitting time from second vaccine dose
by 0-13 days vs 14 days, and estimating separate effects for the calendar period 1dec2020-
16may2021 (when Alpha was dominant) and 17may2021 onwards (when Delta became dominant).
• [p3, table on p13] Estimated vaccine effectiveness against all infections during 1dec2020-
16may2021 (when Alpha was dominant) was similar to that previously reported on data to 8 May
2021 in https://www.nature.com/articles/s41591-021-01410-w.
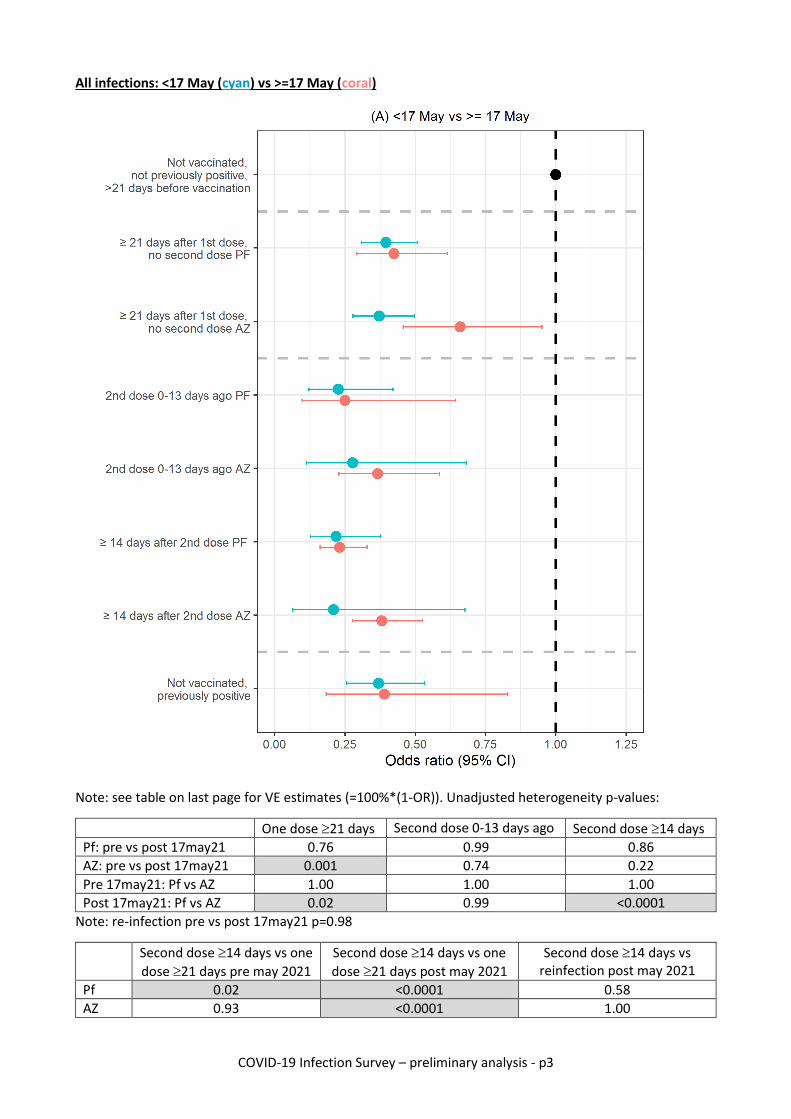
• [p3] Post 17 May 2021, we found no evidence of significant attenuation of vaccine effectiveness
(VE) against all new infections after first and second Pfizer doses versus pre 17 May 2021. However,
we did find some evidence of attenuation for AZ, leading to significantly lower VE (higher odds
ratios (OR)) for AZ vs Pfizer post 17 May2021.
o For both vaccines, post 17 May 2021 two doses still provides significantly more protection
than one dose.
o Post 17 May 2021, there was no evidence that the effectiveness of AZ >=14 days post
second vaccination differed from protection from prior infection without vaccination
(heterogeneity p=1.00).
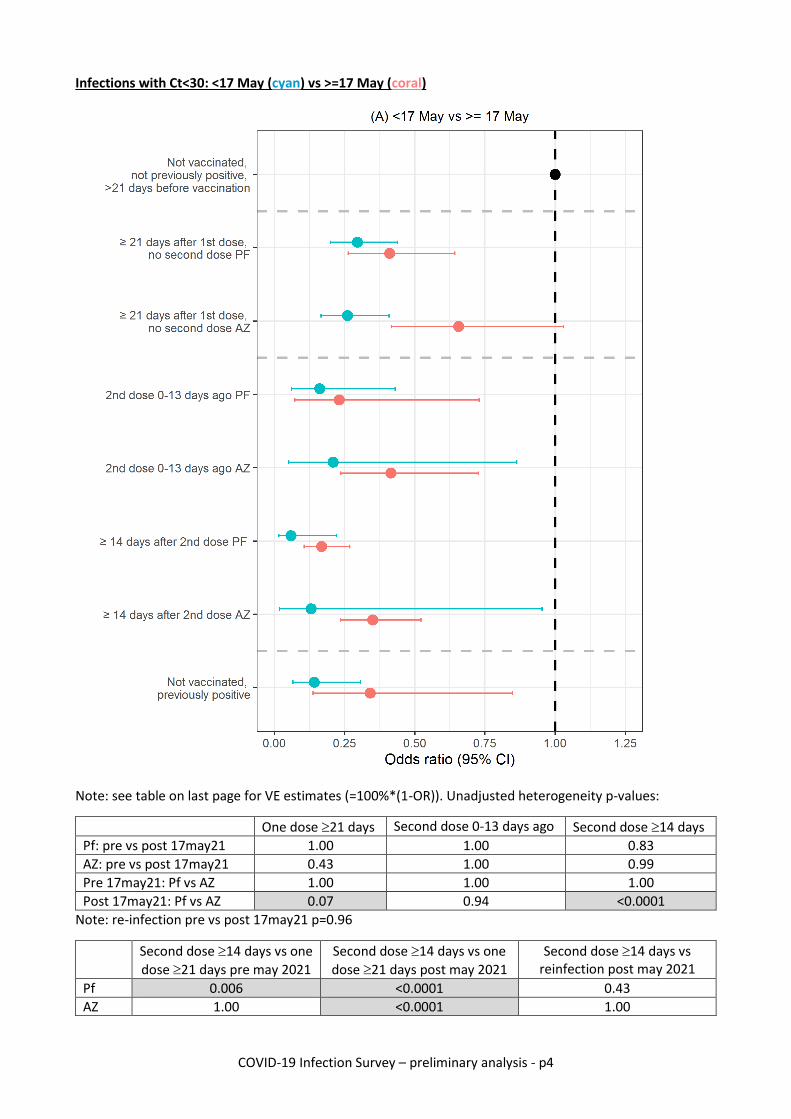
• [p4, p5] Considering new infections with Ct<30 or with symptoms as the outcome, power was
much lower. Point estimates suggested numerically similar attenuation post 17 May 2021 vs pre 17
May 2021 with AZ to that observed for all new infections. Point estimates suggested some
attenuation post 17 May 2021 vs pre 17 May 2021 with Pfizer, but to a smaller degree than with
AZ, meaning that VE remained significantly or was still numerically greater with Pfizer than AZ after
17 May 2021 for infections with Ct<30 or with symptoms.
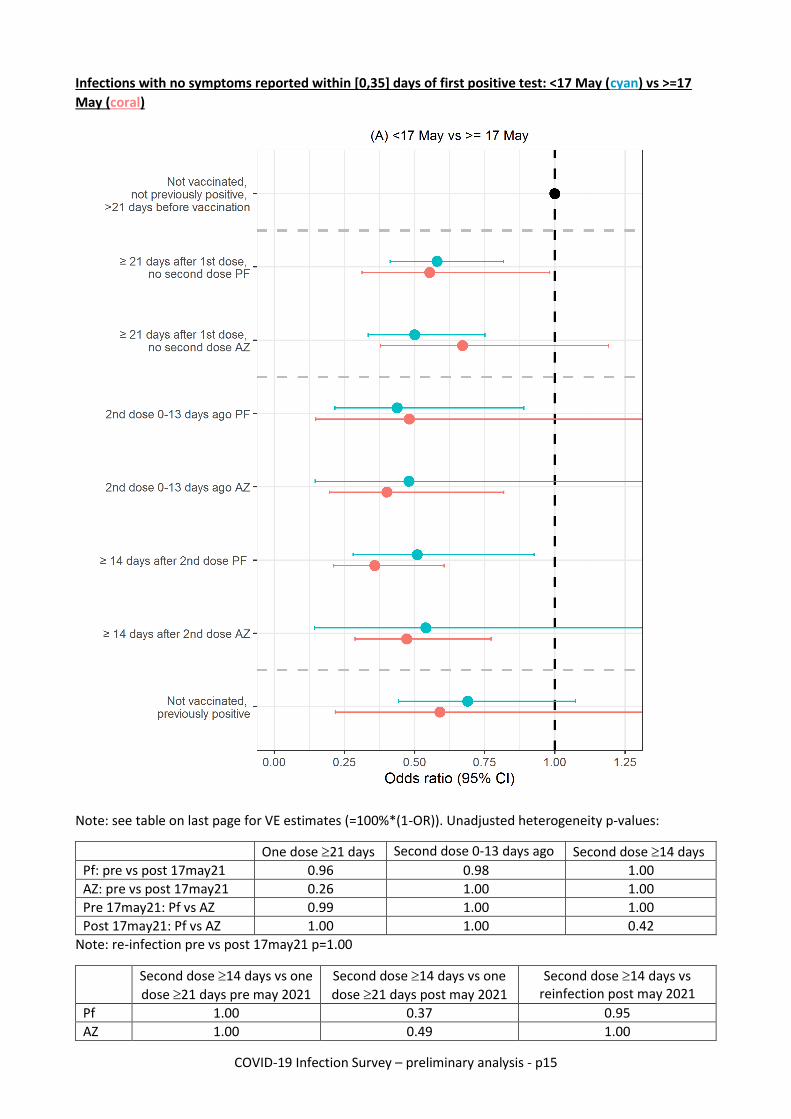
• [p11, p12] In contrast, there was no statistical evidence of differences pre vs post 17 May 2021 in
vaccine effectiveness against infections with Ct30 or without any symptoms reported at any visit
within [0,35] days of the first positive test; and point estimates of effect were similar, and
substantially lower than against infections with Ct<30 or symptoms, in both periods.
• [p6, p8] With increasing time from first and second vaccination, Ct values increased significantly
faster in positive cases pre vs post 17 May 2021 (heterogeneity in trend p=0.01), meaning that the
difference in Ct values between positive cases that were unvaccinated vs >=14d post second dose
narrower substantially, to only median +1.5 (-0.2,+3.2) in positive cases from 14 June 2021 onwards
(median Ct 24.1 in unvaccinated [N=539] vs 25.6 in cases >=14d post second dose [N=490]).
o [p7, p9] Ct values were significantly lower in positive cases occurring >=14d after two AZ
doses [N=352] than 2 Pfizer doses [N=133]; the difference was median +2.9 (+0.1,+5.7)
from 14 June 2021 onwards (p=0.02).
o [p7, p9] Ct values in positive cases occurring >=14d post second dose were consistently
estimated to come from a mixture of two sub-populations, a low Ct subpopulation (~21.5)
COVID-19 Infection Survey – preliminary analysis - p2
and a high Ct subpopulation (~33) (consistent with either mild or late identified infection).
The relative percentage of cases falling into these two subpopulations varied over time.
o [p10] Similar differences were seen for self-reported symptoms
• [p11, p12] In positive cases occurring >=14d post second dose, associations between Ct values and
other factors appeared to varied by type of vaccine, being somewhat stronger with age and prior
antibody levels [-70,-28] days previously for AZ, but with time since second vaccination for Pfizer.
Associations were modest at best, and in particular, a substantial number of low Ct infections
occurred in individuals with levels >100 ng/ml.
COVID-19 Infection Survey – preliminary analysis - p3
All infections: <17 May (cyan) vs >=17 May (coral)
Note: see table on last page for VE estimates (=100%*(1-OR)). Unadjusted heterogeneity p-values:
One dose 21 days Second dose 0-13 days ago Second dose 14 days
Pf: pre vs post 17may21 0.76 0.99 0.86
AZ: pre vs post 17may21 0.001 0.74 0.22
Pre 17may21: Pf vs AZ 1.00 1.00 1.00
Post 17may21: Pf vs AZ 0.02 0.99 <0.0001
Note: re-infection pre vs post 17may21 p=0.98
Second dose 14 days vs one
dose 21 days pre may 2021
Second dose 14 days vs one
dose 21 days post may 2021
Second dose 14 days vs reinfection post may 2021
Pf 0.02 <0.0001 0.58
AZ 0.93 <0.0001 1.00
COVID-19 Infection Survey – preliminary analysis - p4
Infections with Ct<30: <17 May (cyan) vs >=17 May (coral)
Note: see table on last page for VE estimates (=100%*(1-OR)). Unadjusted heterogeneity p-values:
One dose 21 days Second dose 0-13 days ago Second dose 14 days
Pf: pre vs post 17may21 1.00 1.00 0.83
AZ: pre vs post 17may21 0.43 1.00 0.99
Pre 17may21: Pf vs AZ 1.00 1.00 1.00
Post 17may21: Pf vs AZ 0.07 0.94 <0.0001
Note: re-infection pre vs post 17may21 p=0.96
Second dose 14 days vs one
dose 21 days pre may 2021
Second dose 14 days vs one
dose 21 days post may 2021
Second dose 14 days vs reinfection post may 2021
Pf 0.006 <0.0001 0.43
AZ 1.00 <0.0001 1.00
COVID-19 Infection Survey – preliminary analysis - p5
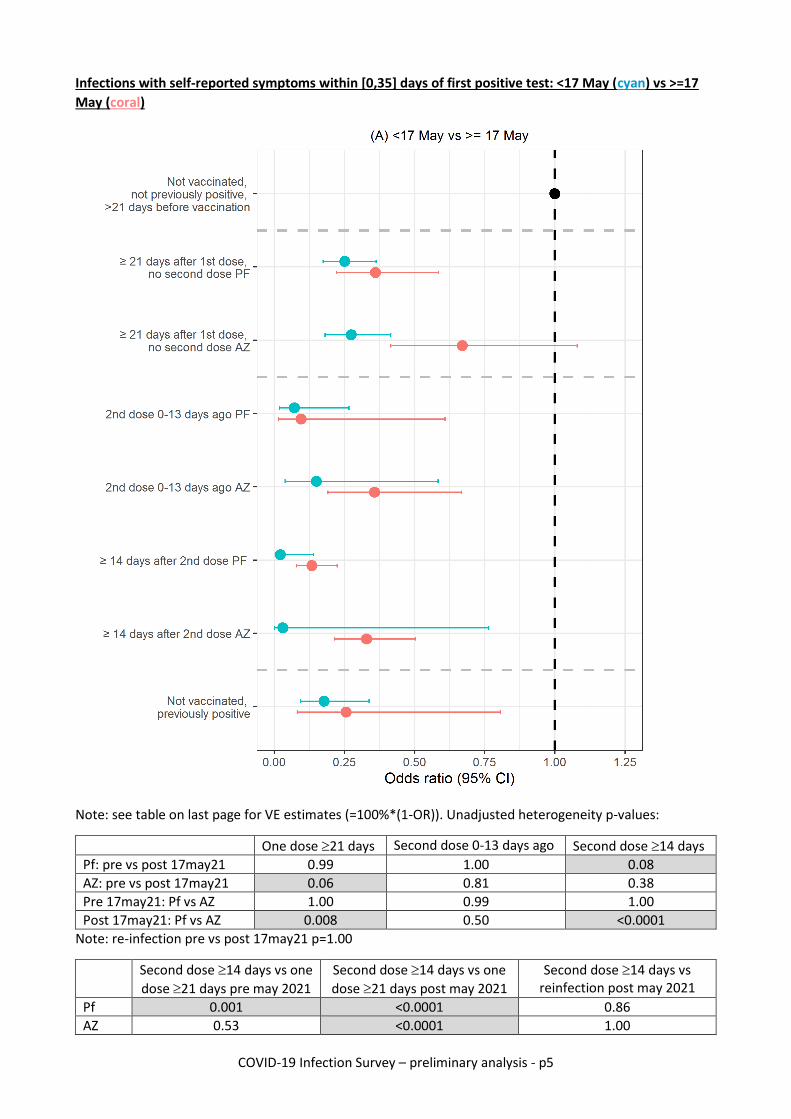
Infections with self-reported symptoms within [0,35] days of first positive test: <17 May (cyan) vs >=17
May (coral)
Note: see table on last page for VE estimates (=100%*(1-OR)). Unadjusted heterogeneity p-values:
One dose 21 days Second dose 0-13 days ago Second dose 14 days
Pf: pre vs post 17may21 0.99 1.00 0.08
AZ: pre vs post 17may21 0.06 0.81 0.38
Pre 17may21: Pf vs AZ 1.00 0.99 1.00
Post 17may21: Pf vs AZ 0.008 0.50 <0.0001
Note: re-infection pre vs post 17may21 p=1.00
Second dose 14 days vs one
dose 21 days pre may 2021
Second dose 14 days vs one
dose 21 days post may 2021
Second dose 14 days vs reinfection post may 2021
Pf 0.001 <0.0001 0.86
AZ 0.53 <0.0001 1.00
COVID-19 Infection Survey – preliminary analysis - p6
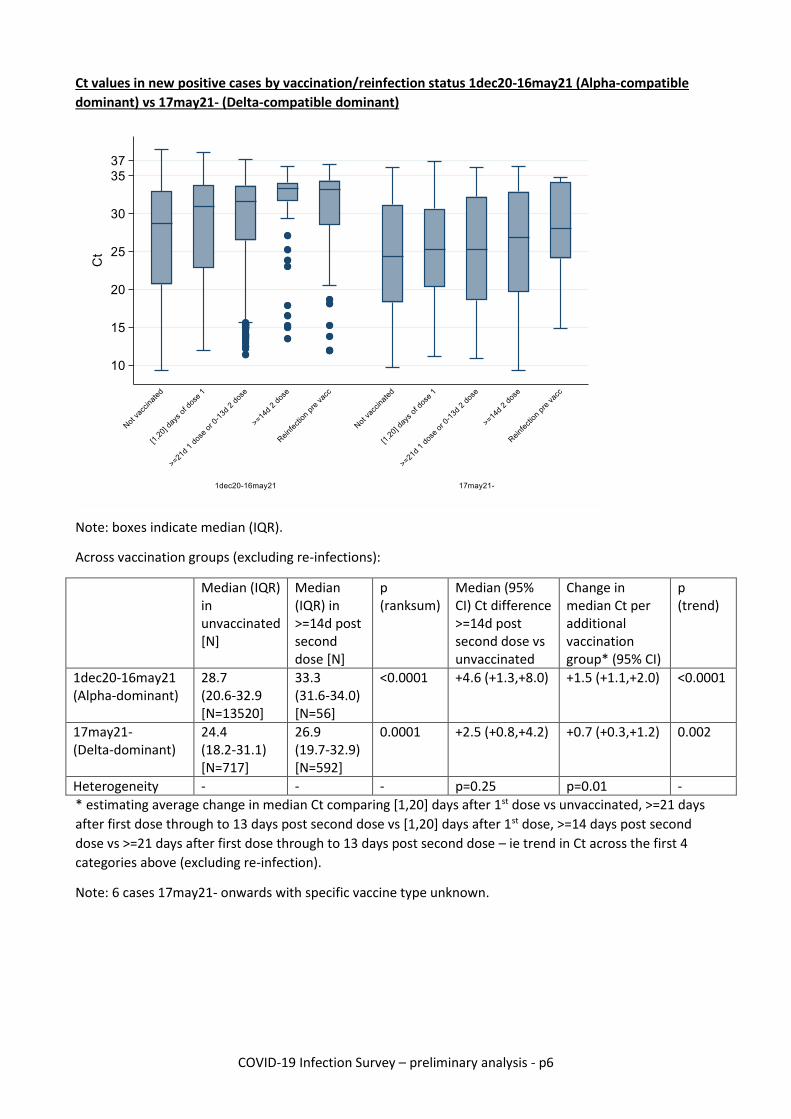
Ct values in new positive cases by vaccination/reinfection status 1dec20-16may21 (Alpha-compatible
dominant) vs 17may21- (Delta-compatible dominant)
Note: boxes indicate median (IQR).
Across vaccination groups (excluding re-infections):
Median (IQR) in unvaccinated [N]
Median (IQR) in >=14d post second dose [N]
p (ranksum)
Median (95% CI) Ct difference >=14d post second dose vs unvaccinated
Change in median Ct per additional vaccination group* (95% CI)
p (trend)
1dec20-16may21 (Alpha-dominant)
28.7 (20.6-32.9 [N=13520]
33.3 (31.6-34.0) [N=56]
<0.0001 +4.6 (+1.3,+8.0) +1.5 (+1.1,+2.0) <0.0001
17may21- (Delta-dominant)
24.4 (18.2-31.1) [N=717]
26.9 (19.7-32.9) [N=592]
0.0001 +2.5 (+0.8,+4.2) +0.7 (+0.3,+1.2) 0.002
Heterogeneity - - - p=0.25 p=0.01 -
* estimating average change in median Ct comparing [1,20] days after 1st dose vs unvaccinated, >=21 days
after first dose through to 13 days post second dose vs [1,20] days after 1st dose, >=14 days post second
dose vs >=21 days after first dose through to 13 days post second dose – ie trend in Ct across the first 4
categories above (excluding re-infection).
Note: 6 cases 17may21- onwards with specific vaccine type unknown.
COVID-19 Infection Survey – preliminary analysis - p7
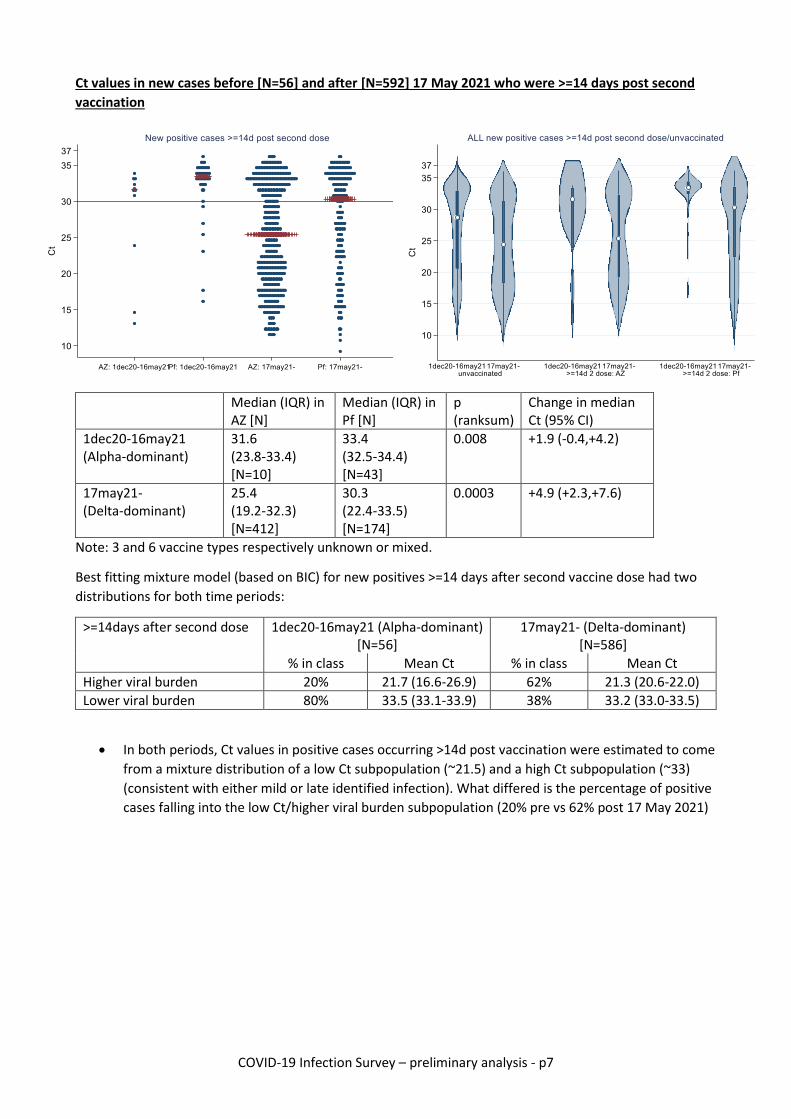
Ct values in new cases before [N=56] and after [N=592] 17 May 2021 who were >=14 days post second
vaccination
Median (IQR) in
AZ [N] Median (IQR) in Pf [N]
p (ranksum)
Change in median Ct (95% CI)
1dec20-16may21 (Alpha-dominant)
31.6 (23.8-33.4) [N=10]
33.4 (32.5-34.4) [N=43]
0.008 +1.9 (-0.4,+4.2)
17may21- (Delta-dominant)
25.4 (19.2-32.3) [N=412]
30.3 (22.4-33.5) [N=174]
0.0003 +4.9 (+2.3,+7.6)
Note: 3 and 6 vaccine types respectively unknown or mixed.
Best fitting mixture model (based on BIC) for new positives >=14 days after second vaccine dose had two
distributions for both time periods:
>=14days after second dose 1dec20-16may21 (Alpha-dominant) [N=56]
17may21- (Delta-dominant) [N=586]
% in class Mean Ct % in class Mean Ct
Higher viral burden 20% 21.7 (16.6-26.9) 62% 21.3 (20.6-22.0)
Lower viral burden 80% 33.5 (33.1-33.9) 38% 33.2 (33.0-33.5)
• In both periods, Ct values in positive cases occurring >14d post vaccination were estimated to come
from a mixture distribution of a low Ct subpopulation (~21.5) and a high Ct subpopulation (~33)
(consistent with either mild or late identified infection). What differed is the percentage of positive
cases falling into the low Ct/higher viral burden subpopulation (20% pre vs 62% post 17 May 2021)
COVID-19 Infection Survey – preliminary analysis - p8
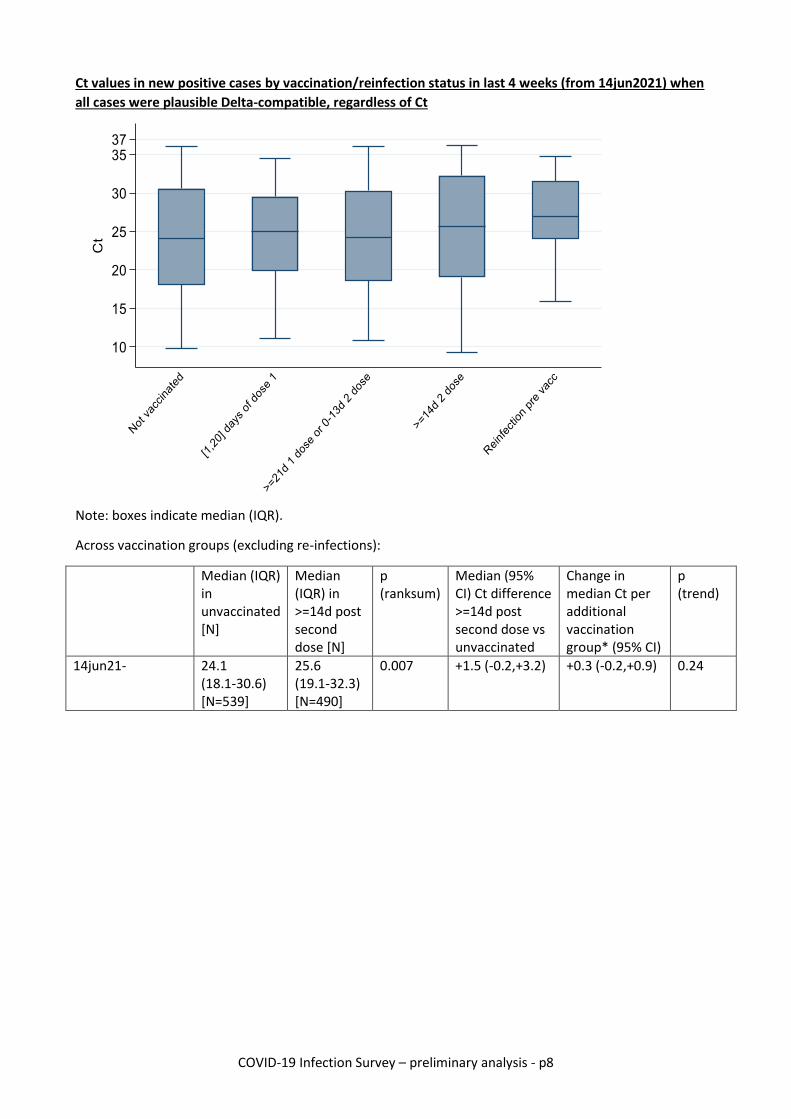
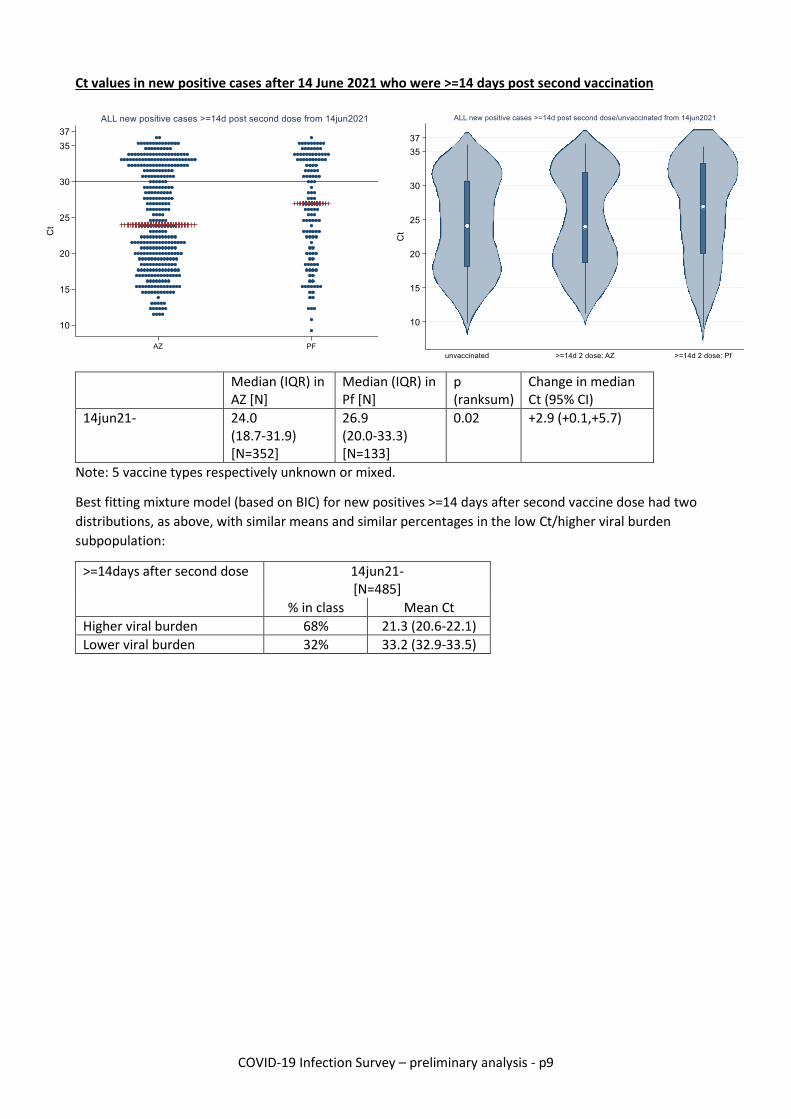
Ct values in new positive cases by vaccination/reinfection status in last 4 weeks (from 14jun2021) when
all cases were plausible Delta-compatible, regardless of Ct
Note: boxes indicate median (IQR).
Across vaccination groups (excluding re-infections):
Median (IQR) in unvaccinated [N]
Median (IQR) in >=14d post second dose [N]
p (ranksum)
Median (95% CI) Ct difference >=14d post second dose vs unvaccinated
Change in median Ct per additional vaccination group* (95% CI)
p (trend)
14jun21- 24.1 (18.1-30.6) [N=539]
25.6 (19.1-32.3) [N=490]
0.007 +1.5 (-0.2,+3.2) +0.3 (-0.2,+0.9) 0.24
COVID-19 Infection Survey – preliminary analysis - p9
Ct values in new positive cases after 14 June 2021 who were >=14 days post second vaccination
Median (IQR) in
AZ [N] Median (IQR) in Pf [N]
p (ranksum)
Change in median Ct (95% CI)
14jun21- 24.0 (18.7-31.9) [N=352]
26.9 (20.0-33.3) [N=133]
0.02 +2.9 (+0.1,+5.7)
Note: 5 vaccine types respectively unknown or mixed.
Best fitting mixture model (based on BIC) for new positives >=14 days after second vaccine dose had two
distributions, as above, with similar means and similar percentages in the low Ct/higher viral burden
subpopulation:
>=14days after second dose 14jun21- [N=485]
% in class Mean Ct
Higher viral burden 68% 21.3 (20.6-22.1)
Lower viral burden 32% 33.2 (32.9-33.5)

COVID-19 Infection Survey – preliminary analysis - p10
Symptoms reported in new positive cases by vaccination/reinfection status 1dec20-16may21 (Alpha-
dominant) and 17may21- (Delta-dominant)
Any symptoms Cough, fever, anosmia, ageusia p (trend)* p unvaccinated vs in
>=14d post second dose (exact)
p (trend)* p unvaccinated vs in >=14d post second dose (exact)
1dec20-16may21 (Alpha-dominant)
<0.0001 <0.0001 <0.0001 <0.0001
17may21- (Delta-dominant)
0.02 <0.0001 0.01 <0.0001
* estimating average change in odds of symptoms comparing [1,20] days after 1st dose vs unvaccinated,
>=21 days after first dose through to 13 days post second dose vs [1,20] days after 1st dose, >=14 days post
second dose vs >=21 days after first dose through to 13 days post second dose – ie trend in ymptoms across
the first 4 categories above (excluding re-infection).
COVID-19 Infection Survey – preliminary analysis - p11
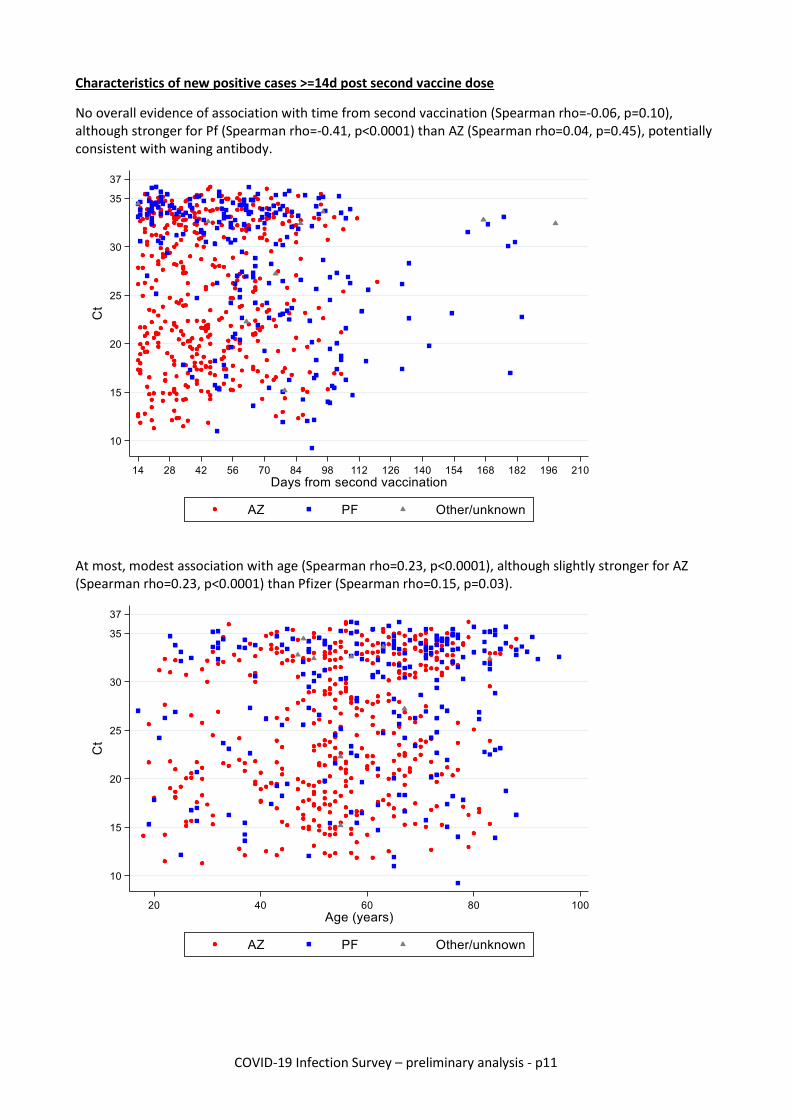
Characteristics of new positive cases >=14d post second vaccine dose
No overall evidence of association with time from second vaccination (Spearman rho=-0.06, p=0.10), although stronger for Pf (Spearman rho=-0.41, p<0.0001) than AZ (Spearman rho=0.04, p=0.45), potentially consistent with waning antibody.
At most, modest association with age (Spearman rho=0.23, p<0.0001), although slightly stronger for AZ (Spearman rho=0.23, p<0.0001) than Pfizer (Spearman rho=0.15, p=0.03).
COVID-19 Infection Survey – preliminary analysis - p12
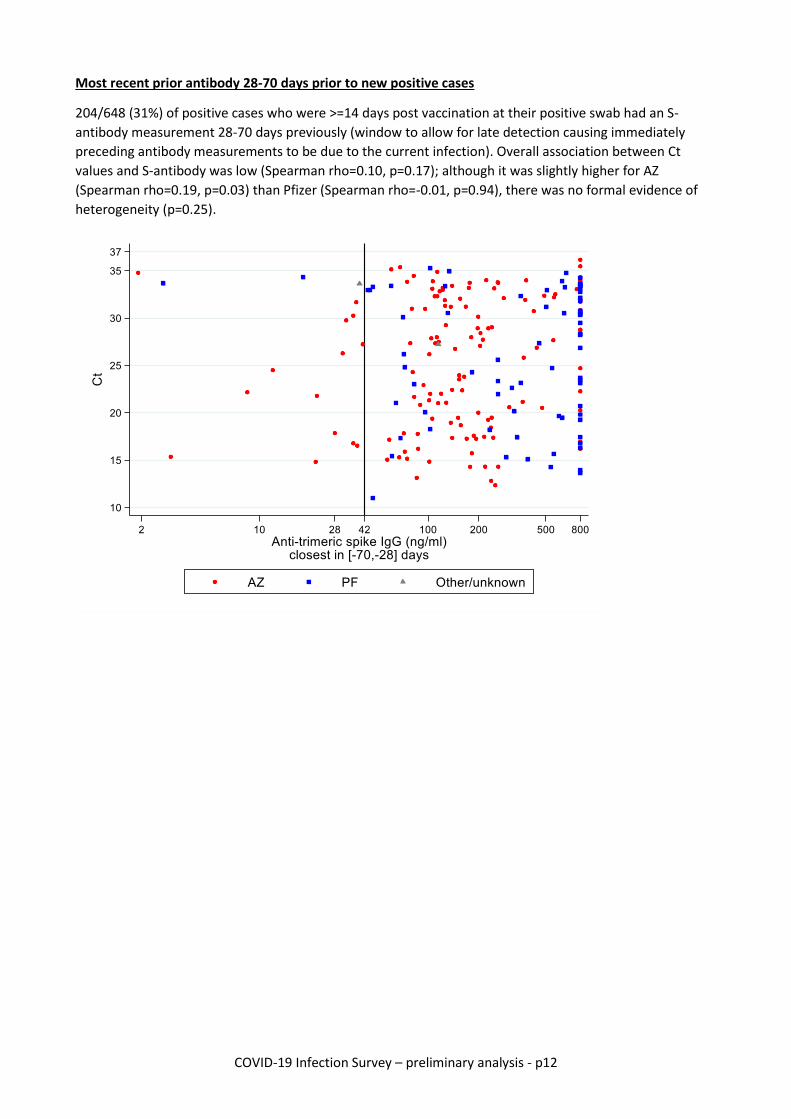
Most recent prior antibody 28-70 days prior to new positive cases
204/648 (31%) of positive cases who were >=14 days post vaccination at their positive swab had an S-
antibody measurement 28-70 days previously (window to allow for late detection causing immediately
preceding antibody measurements to be due to the current infection). Overall association between Ct
values and S-antibody was low (Spearman rho=0.10, p=0.17); although it was slightly higher for AZ
(Spearman rho=0.19, p=0.03) than Pfizer (Spearman rho=-0.01, p=0.94), there was no formal evidence of
heterogeneity (p=0.25).
COVID-19 Infection Survey – preliminary analysis - p13
Additional information on Methods
Associations between the different vaccination/reinfection exposure groups and outcome (first positive
test in an infection episode vs test-negative) were evaluated with generalised linear models with a logit
link. Robust standard errors were used to account for multiple visits per-participant. To adjust for
substantial confounding by calendar time and age, with non-linear effects of age which are also different by
region, we included both as restricted cubic splines with knots at the 20%, 40%, 60%, and 80% percentiles
of unique values and interactions between these splines and region/country (regions for England and
country for Northern Ireland, Scotland and Wales). Furthermore, given previous observations of different
positivity rates by age over time, we added a tensor spline to model the interaction between age and
calendar time with the restriction that the interaction is not doubly non-linear. The following potential
confounders were adjusted for in all models as potential risk factors for acquiring SARS-CoV-2 infection:
geographic area and age in years (see above), sex, ethnicity (white vs non-white as small numbers), index of
multiple deprivation (percentile, calculated separately for each country in the UK), working in a care-home,
having a patient-facing role in health or social care, presence of long-term health conditions, household
size, multigenerational household, rural-urban classification, direct or indirect contact with a hospital or
care-home, smoking status, and visit frequency.
Positive episode
We included in analyses the first positive test in each ‘positive episode’, (arbitrarily) defined as a new
positive >120 days after an index positive with the preceding test being negative, or a new positive after 4
consecutive negative tests. Each positive episode was classified as triple positive if the S-gene was ever
detected within it (by definition, in combination with either N or ORF1ab or both N+ORF1ab), otherwise
Alpha-compatible if positive at least once for ORF1ab+N, and otherwise “other” (all positives N-only or
ORF1ab-only), and by the minimum Ct value across positive tests in the episode. Presence or absence of
specific symptoms and any self-reported symptoms overall (i.e. including the generic symptoms question)
included reports at any (test positive or negative or failed) visit within [0,+35] days of the first positive per
episode (i.e. spanning [-7,+35] days given the question timeframe (over the last 7 days)). We excluded all
negative tests following an infection episode until the first visit where the participant could have been
classified as a new infection episode, were the test to have been positive. All other negative visits formed
the comparator group.

COVID-19 Infection Survey – preliminary analysis - p14
Additional results
Infections with Ct30: <17 May (cyan) vs >=17 May (coral)
Note: see table on last page for VE estimates (=100%*(1-OR)). Unadjusted heterogeneity p-values:
One dose 21 days Second dose 0-13 days ago Second dose 14 days
Pf: pre vs post 17may21 0.62 0.98 0.58
AZ: pre vs post 17may21 0.02 0.99 0.34
Pre 17may21: Pf vs AZ 1.00 1.00 1.00
Post 17may21: Pf vs AZ 0.80 1.00 0.95
Note: re-infection pre vs post 17may21 p=1.00
Second dose 14 days vs one
dose 21 days pre may 2021
Second dose 14 days vs one
dose 21 days post may 2021
Second dose 14 days vs reinfection post may 2021
Pf 1.00 0.99 1.00
AZ 1.00 0.17 1.00
COVID-19 Infection Survey – preliminary analysis - p15
Infections with no symptoms reported within [0,35] days of first positive test: <17 May (cyan) vs >=17
May (coral)
Note: see table on last page for VE estimates (=100%*(1-OR)). Unadjusted heterogeneity p-values:
One dose 21 days Second dose 0-13 days ago Second dose 14 days
Pf: pre vs post 17may21 0.96 0.98 1.00
AZ: pre vs post 17may21 0.26 1.00 1.00
Pre 17may21: Pf vs AZ 0.99 1.00 1.00
Post 17may21: Pf vs AZ 1.00 1.00 0.42
Note: re-infection pre vs post 17may21 p=1.00
Second dose 14 days vs one
dose 21 days pre may 2021
Second dose 14 days vs one
dose 21 days post may 2021
Second dose 14 days vs reinfection post may 2021
Pf 1.00 0.37 0.95
AZ 1.00 0.49 1.00
COVID-19 Infection Survey – preliminary analysis - p16
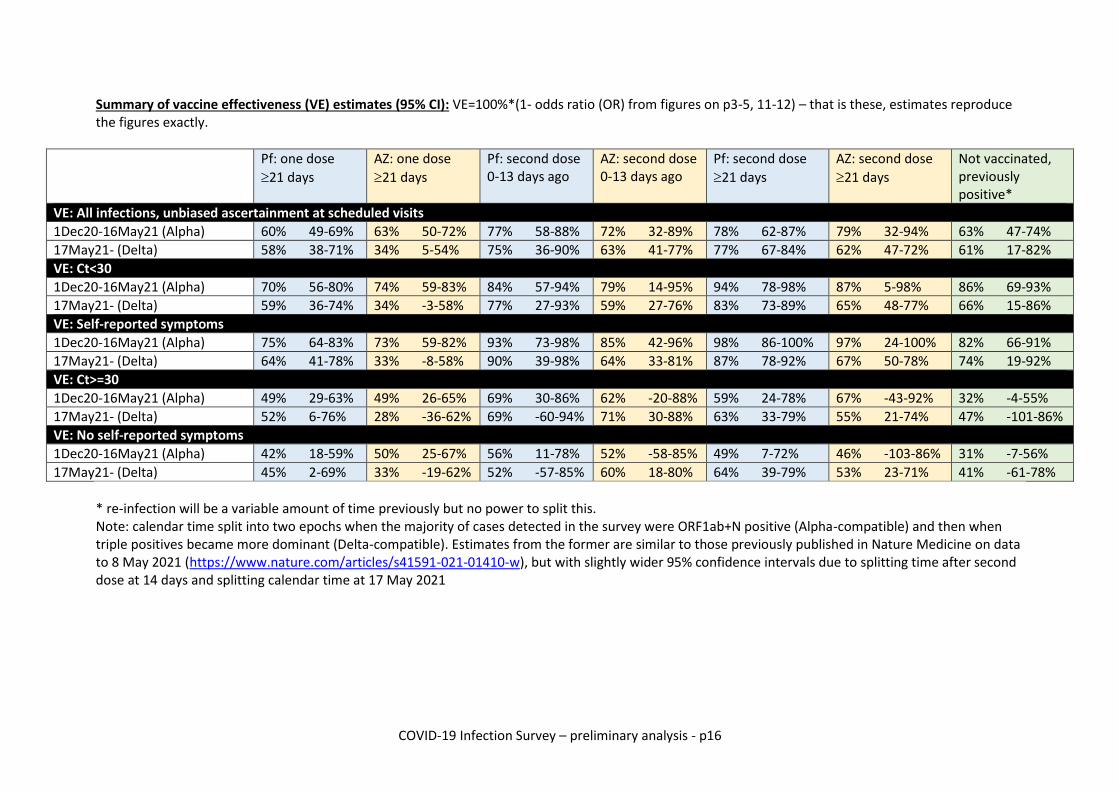
Summary of vaccine effectiveness (VE) estimates (95% CI): VE=100%*(1- odds ratio (OR) from figures on p3-5, 11-12) – that is these, estimates reproduce the figures exactly.
Pf: one dose
21 days
AZ: one dose
21 days
Pf: second dose 0-13 days ago
AZ: second dose 0-13 days ago
Pf: second dose
21 days
AZ: second dose
21 days
Not vaccinated, previously positive*
VE: All infections, unbiased ascertainment at scheduled visits
1Dec20-16May21 (Alpha) 60% 49-69% 63% 50-72% 77% 58-88% 72% 32-89% 78% 62-87% 79% 32-94% 63% 47-74%
17May21- (Delta) 58% 38-71% 34% 5-54% 75% 36-90% 63% 41-77% 77% 67-84% 62% 47-72% 61% 17-82%
VE: Ct<30
1Dec20-16May21 (Alpha) 70% 56-80% 74% 59-83% 84% 57-94% 79% 14-95% 94% 78-98% 87% 5-98% 86% 69-93%
17May21- (Delta) 59% 36-74% 34% -3-58% 77% 27-93% 59% 27-76% 83% 73-89% 65% 48-77% 66% 15-86%
VE: Self-reported symptoms
1Dec20-16May21 (Alpha) 75% 64-83% 73% 59-82% 93% 73-98% 85% 42-96% 98% 86-100% 97% 24-100% 82% 66-91%
17May21- (Delta) 64% 41-78% 33% -8-58% 90% 39-98% 64% 33-81% 87% 78-92% 67% 50-78% 74% 19-92%
VE: Ct>=30
1Dec20-16May21 (Alpha) 49% 29-63% 49% 26-65% 69% 30-86% 62% -20-88% 59% 24-78% 67% -43-92% 32% -4-55%
17May21- (Delta) 52% 6-76% 28% -36-62% 69% -60-94% 71% 30-88% 63% 33-79% 55% 21-74% 47% -101-86%
VE: No self-reported symptoms
1Dec20-16May21 (Alpha) 42% 18-59% 50% 25-67% 56% 11-78% 52% -58-85% 49% 7-72% 46% -103-86% 31% -7-56%
17May21- (Delta) 45% 2-69% 33% -19-62% 52% -57-85% 60% 18-80% 64% 39-79% 53% 23-71% 41% -61-78%
* re-infection will be a variable amount of time previously but no power to split this. Note: calendar time split into two epochs when the majority of cases detected in the survey were ORF1ab+N positive (Alpha-compatible) and then when triple positives became more dominant (Delta-compatible). Estimates from the former are similar to those previously published in Nature Medicine on data to 8 May 2021 (https://www.nature.com/articles/s41591-021-01410-w), but with slightly wider 95% confidence intervals due to splitting time after second dose at 14 days and splitting calendar time at 17 May 2021