impact of convective transport and lightning nox...
TRANSCRIPT

ACPD9, 2289–2317, 2009
Impact of convectivetransport andlightning NOx
production
C. Zhao et al.
Title Page
Abstract Introduction
Conclusions References
Tables Figures
J I
J I
Back Close
Full Screen / Esc
Printer-friendly Version
Interactive Discussion
Atmos. Chem. Phys. Discuss., 9, 2289–2317, 2009www.atmos-chem-phys-discuss.net/9/2289/2009/© Author(s) 2009. This work is distributed underthe Creative Commons Attribution 3.0 License.
AtmosphericChemistry
and PhysicsDiscussions
This discussion paper is/has been under review for the journal Atmospheric Chemistryand Physics (ACP). Please refer to the corresponding final paper in ACP if available.
Impact of convective transport andlightning NOx production over NorthAmerica: dependence on cumulusparameterizationsC. Zhao1, Y. Wang1, Y. Choi2, and T. Zeng1
1School of Earth and Atmospheric Sciences, Georgia Institute of Technology,Atlanta, GA, USA2Jet Propulsion Laboratory, Pasadena, CA, USA
Received: 10 December 2008 – Accepted: 17 December 2008 – Published: 26 January 2009
Correspondence to: C. Zhao ([email protected])
Published by Copernicus Publications on behalf of the European Geosciences Union.
2289

ACPD9, 2289–2317, 2009
Impact of convectivetransport andlightning NOx
production
C. Zhao et al.
Title Page
Abstract Introduction
Conclusions References
Tables Figures
J I
J I
Back Close
Full Screen / Esc
Printer-friendly Version
Interactive Discussion
Abstract
A 3-D regional chemical transport model (REAM) is applied to examine the uncertain-ties in modeling the effects of convective transport and lightning NOx production onupper tropospheric chemical tracer distributions. To assess the model uncertainties,two different cumulus convective parameterizations, KF-eta and Grell, are adopted in5
REAM from the respective meteorological models, WRF and MM5. The model simu-lations are evaluated using INTEX-NA aircraft measurements and satellite measure-ments of NO2 columns and cloud top pressure, and we find that mid and upper tro-pospheric trace gas concentrations are affected strongly by convection and lightningNOx productions. A major improvement of the KF-eta scheme is its inclusion of cloud10
entrainment and detrainment processes. KF-eta scheme simulates larger convectiveupdraft mass fluxes below 150 hPa than the Grell scheme, resulting in more outflow ofpollutants in the mid troposphere. The ratio of C2H6/C3H8 is found to be a sensitiveparameter to convective outflow; the simulation by WRF-REAM is in closer agreementwith INTEX-NA measurements than MM5-REAM, implying that convective mass fluxes15
by KF-eta scheme are more realistic. The inclusion of entrainment and detrainmentprocesses in the KF-eta scheme also leads to lower cloud top heights (10–12 km) thanthe Grell scheme (up to 16 km), and hence smaller amounts of estimated (intra-cloud)lightning NOx and lower emission altitudes. WRF simulated cloud top heights are inbetter agreement with GOES satellite measurements than MM5. The model diver-20
gence on lightning NOx mostly is above 12 km. As a result, both models suggest thatlightning NOx production enhances the concentrations of upper tropospheric NO2 by afactor of >5 (∼100 pptv) and increases O3 by up to ∼20 ppbv at 8–12 km.
1 Introduction
Tropospheric distributions of trace gases are driven in part by meteorological condi-25
tions. Convection and associated lightning NOx production are two important meteo-
2290

ACPD9, 2289–2317, 2009
Impact of convectivetransport andlightning NOx
production
C. Zhao et al.
Title Page
Abstract Introduction
Conclusions References
Tables Figures
J I
J I
Back Close
Full Screen / Esc
Printer-friendly Version
Interactive Discussion
rological processes affecting the production and distribution of tropospheric chemicaltracers (e.g., Wang et al., 2001; Doherty et al., 2005; Hudman et al., 2007; Choi etal., 2005, 2008a). Convection redistributes trace gases vertically and significantly af-fects atmospheric chemical and transport processes during long-range transport (e.g.,Wang et al., 2000, 2001; Doherty et al., 2005; Hess, 2005; Folkins et al., 2006; Kiley5
et al., 2006; Hudman et al., 2007). Li et al. (2005) and Choi et al. (2008b) showedthe importance of convection in ventilating air pollutants from the continental boundarylayer of the United States (US) and providing a conduit for US pollution to the WestAtlantic Ocean.
Simulations of convective transport have large uncertainties. Several studies found10
substantial divergences among Chemical Transport Model (CTM) simulations arisingfrom the difference in various cumulus parameterizations (e.g., Prather and Jacob,1997; Prather et al., 2001; Collins et al., 2002; Doherty et al., 2005). To properly eval-uate model simulations of convective transport and lightning NOx production, exten-sive atmospheric measurements are needed. One such dataset is the Intercontinental15
Chemical Transport Experiment – North America (INTEX-NA) collected during summer(3 July to 15 August 2004) over North America (Singh, et al., 2006), in which a largenumber of cases for active convection and large amounts of lightning NOx productionwere measured (e.g., Human et al., 2007; Bertram et al., 2007).
Lightning is a major source of NOx (NO2+NO) in the upper troposphere. NOx is20
thought to be produced during the return stroke stage of a cloud-to-ground flash andthe leader stage of an intra-cloud flash (e.g., Price et al., 1997). The lightning flashrate is often parameterized as functions of meteorological variables such as convectiveupdraft mass fluxes (UMF), convective available potential energy (CAPE), convectivecloud top height, and precipitation rate (e.g., Price et al., 1993; Allen et al., 1999; Choi25
et al., 2005, 2008a). Lightning NOx significantly enhances tropospheric NO2 columns,in particular, over the ocean, where NO2 columns are more sensitive to lightning NOxproduction due to less impact of surface NOx emissions (e.g., Choi et al. 2005, 2008a;Martin et al., 2006; Bertram et al., 2007). It also increases the concentrations of O3
2291

ACPD9, 2289–2317, 2009
Impact of convectivetransport andlightning NOx
production
C. Zhao et al.
Title Page
Abstract Introduction
Conclusions References
Tables Figures
J I
J I
Back Close
Full Screen / Esc
Printer-friendly Version
Interactive Discussion
and PAN in the free troposphere (e.g., Labrador et al., 2004; Hudman et al., 2007).Hudman et al. (2007) found that lightning enhanced O3 concentration by ∼10 ppbv andPAN by 30% in the upper troposphere based on the INTEX-NA measurements overthe Eastern North America and Western North Altantic during summer 2004 usingthe GOES-CHEM model. Still, lightning remains the most uncertain source of NOx5
with a global range from 1 to 20 Tg N/yr. Recent satellite measurements includingNO2 columns from the SCanning Imaging Absorption spectroMeter for AtmosphericCHartographY (SCIAMACHY) were used to show lightning enhanced NO2 over theNorth Atlantic Ocean, and to constrain the global lightning NOx emissions in the rangeof 4–8 Tg N/yr (Martin et al., 2006, 2007).10
Both convective transport of tracers and lightning NOx production are sensitive withunderlying meteorological fields. A key factor is the convective parameterization used(Emanuel et al., 1994). To study these uncertainties and their impact on trace gassimulations, we use a Regional chEmical trAnsport Model (REAM) with meteorologicalfields generated by two different convective parameterizations based on KF-eta Kain et15
al. (2003) and Grell et al. (2002) convection schemes, respectively. Two meteorologicalmodels, the Weather Research and Forecasting (WRF) model (Skamarock et al., 2005)and the Fifth-Generation NCAR/Penn State Mesoscale Model (MM5) (Grell et al., 1995)are used out of necessity since no shallow convection scheme is provided for usingwith the Grell scheme (for deep convection only) in WRF. The other configurations of20
the two models are set to be the same, except that the KF-eta scheme is used in WRFand the Grell scheme is used in MM5. When compared to the convective transportand lightning NOx features measured during INTEX-NA, the model difference can beattributed to mostly the difference of the convective parameterization schemes, not tothe difference in the other formulations of the meteorological models.25
In this work, we evaluate the simulated convective transport and lighting NOx pro-duction using the INTEX-NA aircraft and satellite measurements to assess their depen-dence on model cumulus parameterizations. In Sect. 2, we describe the REAM modeland the measurements used in the study. The convective impact on tropospheric trac-
2292

ACPD9, 2289–2317, 2009
Impact of convectivetransport andlightning NOx
production
C. Zhao et al.
Title Page
Abstract Introduction
Conclusions References
Tables Figures
J I
J I
Back Close
Full Screen / Esc
Printer-friendly Version
Interactive Discussion
ers is analyzed in Sect. 3. The lightning impact is examined in Sect. 4. Conclusionsare given in Sect. 5.
2 Model and observations
2.1 Model description
The REAM model driven by MM5 assimilated meteorological fields (MM5-REAM) was5
described by Choi et al. (2008a). Previously, this model was applied to investigatea number of tropospheric chemistry and transport problems at northern mid latitudes(Choi et al., 2005, 2008a, b; Jing et al., 2006; Wang et al., 2006; Gillus et al., 2007) andin the polar regions (Zeng et al., 2003, 2006; Wang et al., 2007). In this work, the REAMmodel is developed to use the WRF assimilated meteorological fields (WRF-REAM).10
Large changes are apparent in the free tropospheric chemical distributions when WRFfields are used in place of MM5. We find that these changes are due mostly to theunderlying convection schemes used.
The model has a horizontal resolution of 70 km with 23 vertical layers below 10 hPa.Meteorological fields are assimilated using either MM5 or WRF constrained by the15
NCEP reanalysis products (NNRP). The horizontal domain of MM5 or WRF has 5 ex-tra grids beyond that of REAM on each side to minimize potential transport anomaliesnear the boundary. Most meteorological field inputs are archived every 30 minutes ex-cept those related to convective transport and lightning parameterizations, which arearchived every 5 min. Chemical initial and boundary conditions for chemical tracers in20
REAM are obtained from the global simulation for the same period using the GEOS-CHEM model driven by GEOS-4 assimilated meteorological fields (Bey et al., 2001).Anthropogenic and biogenic emission algorithms and inventories are adapted from theGEOS-CHEM model (Choi et al., 2005, 2008a). One exception is that the emissionsof NOx, CO, and (≥C4 alkanes) over the US are prepared by Sparse Matrix Operator25
Kernel Emissions (SMOKE) model (http://cf.unc.edu/cep/empd/products/smoke/index.
2293

ACPD9, 2289–2317, 2009
Impact of convectivetransport andlightning NOx
production
C. Zhao et al.
Title Page
Abstract Introduction
Conclusions References
Tables Figures
J I
J I
Back Close
Full Screen / Esc
Printer-friendly Version
Interactive Discussion
cfm) for 2004 projected from VISTAS 2002 emission inventory, since we found thatthese emissions are more consistent with INTEX-NA measurements than the defaultinventories in GEOS-CHEM. Biomass burning emissions are included following Tur-quety et al. (2007).
Sub-grid convective transport in WRF-REAM and MM5-REAM is developed to be5
consistent with the KF-eta and Grell schemes implemented in WRF and MM5, respec-tively. Both convective schemes simulate moist updrafts and downdrafts. One notabledifference is that the KF-eta scheme includes cloud entrainment and detrainment dur-ing convection but the Grell scheme does not. Consequently, the vertical distributionof convective mass fluxes and the height of convection are simulated differently be-10
tween the two schemes. These differences are reflected in the vertical distributions ofchemical tracers and are evaluated with INTEX-NA measurements in this study.
The lightning NOx production rate is parameterized as a function of convectivemass fluxes and convective available potential energy (CAPE) as described by Choiet al. (2005) to ensure its consistency with model dynamics. The cloud-to-ground light-15
ning flash rates are parameterized on the basis of the National Lightning DetectionNetwork (NLDN) observations in summer 2004 supplied by the Global Hydrology Re-source Center at the NASA Marshall Space Flight Center (http://ghrc.nsstc.nasa.gov/).The IC/CG flash ratio is calculated following Wang et al. (1998). A key parameter inthis calculation is the cumulus cloud top height. It is assumed that IC and CG flashes20
have the same energy (Ott et al., 2003; Choi et al., 2005). Lightning NOx is distributedvertically following the mid-latitude profile by Pickering et al. (1998). Based on theINTEX-NA measurements, the lightning NOx production rate is set to be 250 molesNO/flash.
2294

ACPD9, 2289–2317, 2009
Impact of convectivetransport andlightning NOx
production
C. Zhao et al.
Title Page
Abstract Introduction
Conclusions References
Tables Figures
J I
J I
Back Close
Full Screen / Esc
Printer-friendly Version
Interactive Discussion
2.2 Chemical observations
2.2.1 Aircraft observations
The Intercontinental Chemical Transport Experiment – North America (INTEX-NA)aims at understanding the transport and transformation of gases and aerosols ontranscontinental and intercontinental scales and their outflow of pollution over North5
America (Singh, et al., 2006). In this study, the measurements of C2H6, C3H8, HNO3,NO2, and O3 from DC-8 are used. The NO measurements on the DC-8 are notused due to its limited sensitivity only suitable for measuring mixing ratios largerthan 100 pptv (Singh et al., 2007). C2H6 and C3H8 are measured with 1 pptv de-tection limit and 2–10% nominal accuracy. HNO3 is measured with 5–10 pptv de-10
tection limit and 10–15% nominal accuracy. NO2 is measured with 1 pptv detectionlimit and 10% nominal accuracy. O3 is measured with 1 ppbv detection limit and 5%nominal accuracy. All the instruments on DC-8 are described in detail by Singh etal. (2006). One-minute merge data from DC-8 from 1 July to 14 August 2004 areused (http://www-air.larc.nasa.gov/cgi-bin/arcstat). Some compounds were measured15
by two different techniques such as HNO3. When both measurements are available,the average values are used.
2.2.2 Satellite measurements
Tropospheric NO2 columns
SCIAMACHY instrument was onboard the ENVISAT satellite with a spatial resolution of20
30×60 km2 and a temporal resolution of 6-day global coverage. Tropospheric columnsof NO2 retrieved from SCIAMACHY and its uncertainties are calculated by Martin etal. (2006). The retrieval uncertainties are due to spectral fitting, spectral artifact fromthe diffuser plate, the removal of stratospheric column, and air mass factor calculation.The measurements with the cloud fraction larger than 30% are excluded in the study25
2295

ACPD9, 2289–2317, 2009
Impact of convectivetransport andlightning NOx
production
C. Zhao et al.
Title Page
Abstract Introduction
Conclusions References
Tables Figures
J I
J I
Back Close
Full Screen / Esc
Printer-friendly Version
Interactive Discussion
in order to reduce the impact of cloud on satellite retrieval. A more detailed descrip-tion regarding the tropospheric NO2 columns from SCIAMACHY and its validation withINTEX-NA measurements can be found in Martin et al. (2006).
Cloud top pressure
The operational data collection phase of the International Satellite Cloud Climatology5
Project (ISCCP) began in July 1983 and the dataset provides a global cloud climatol-ogy processed based on the images from an international network of weather satellites(Rossow and Schiffer, 1991). The measurements of cloud top pressure over NorthAmerica provided by the ISCCP DX dataset with 3-hourly 30 km sampled pixels pro-cessed from the images of GOES-10 and GOES-12 satellites are used to evaluate10
the model simulated cumulus cloud top heights. The measurements with the cloudtop pressure larger than 500 hPa are excluded in the study to filter out the low cloudinformation.
3 Uncertainties in modeling convective impacts on tropospheric trace gasesdistributions15
3.1 Dependence of convective transport on cumulus parameterization
Figure 1a shows the spatial distributions of the mean updraft mass fluxes of deepconvection at three typical pressure levels (800, 500, and 300 hPa) from WRF andMM5 simulations with KF-eta and Grell convection schemes, respectively, for July andAugust 2004. WRF and MM5 simulate generally similar spatial distributions of mass20
fluxes with strong convection events over the Western and Southeastern US, Mexico,and the Western North Atlantic Ocean. One clear difference is that the updraft fluxes at500 and 800 hPa are much higher in WRF than MM5. The mass fluxes in WRF are notas spatially concentrated over Western-Central US and are more over the Southeast
2296

ACPD9, 2289–2317, 2009
Impact of convectivetransport andlightning NOx
production
C. Zhao et al.
Title Page
Abstract Introduction
Conclusions References
Tables Figures
J I
J I
Back Close
Full Screen / Esc
Printer-friendly Version
Interactive Discussion
than MM5. Figure 1b shows the vertical profiles of mass fluxes from the two modelsaveraged over North America (domain shown in Fig. 1a). The difference is large. Theupdraft fluxes in WRF are much larger than MM5 at 300–900 hPa. The downdraftfluxes of WRF occur at lower altitudes than MM5. Entrainment and detrainment only inWRF are high in the lower and upper troposphere. The larger updraft fluxes as well as5
entrainment and detrainment in WRF lead to larger wet scavenging of soluble speciesthan MM5. The convection top simulated by MM5 is higher than that by WRF. While notthat significant in pressure coordinates, the altitude difference is quite large, leading tolarge difference in the distribution of pollutant outflow and lightning NOx emissions.
3.2 Convective impact on exports of pollutants10
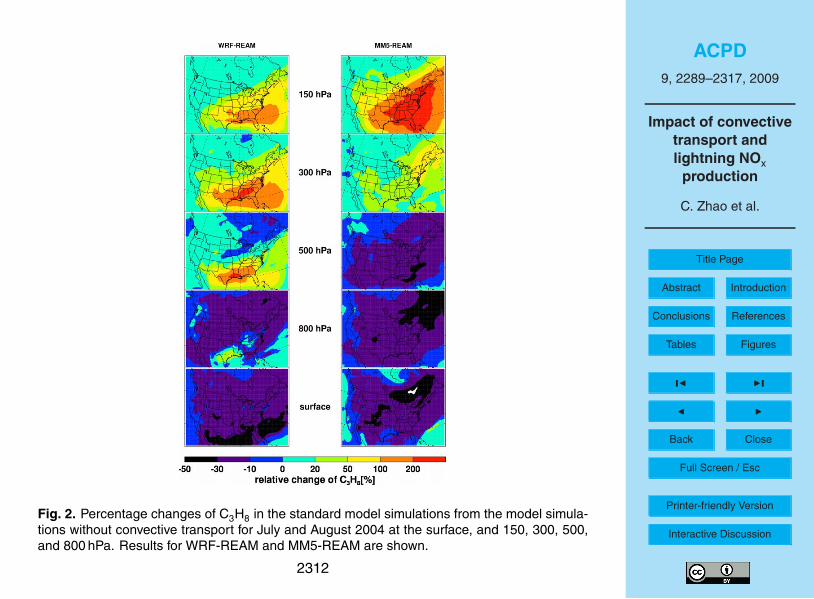
Convective transport lifts non-soluble pollutants from the boundary into the free tropo-sphere. As a result, concentrations increase at higher altitudes and decrease at loweraltitudes. In model simulations, the change of concentrations as a function of altitudereflects the strength of convective transport. Here we use C3H8 as an example. Fig-ure 2 shows the relative changes of C3H8 drived by convection at the surface and four15
typical pressure levels (800, 500, 300, and 150 hPa) for July and August 2004 in the twomodels. Both models show decreases of C3H8 at the surface and 800 hPa. At 500 hPa,convective transport increases C3H8 in WRF-REAM particularly over the Southeast be-cause of entrainment and detrainment and updraft flux convergence. MM5-REAM, incontrast, shows a general convection-driven decrease. At higher altitudes, both models20
show increasing concentrations due to convection. However, the largest increase is at300 hPa in WRF-REAM but at 150 hPa in MM5-REAM. The maximum outflow altitudeis higher in MM5-REAM because the convective top is higher in MM5 (Fig. 1b).
Simulated C3H8 concentrations are 15–35% higher in WRF-REAM than MM5-REAMat 3–8 km, in better agreement with the INTEX-NA observations (not shown). To min-25
imize the effects of emission uncertainties and the large vertical gradient of C3H8 inthis analysis, we investigate the convective effects on C2H6/C3H8 ratios (Wang andZeng, 2004). The chemical lifetime of C3H8 (2 weeks) is shorter than C2H6 (>1 month).
2297

ACPD9, 2289–2317, 2009
Impact of convectivetransport andlightning NOx
production
C. Zhao et al.
Title Page
Abstract Introduction
Conclusions References
Tables Figures
J I
J I
Back Close
Full Screen / Esc
Printer-friendly Version
Interactive Discussion
Long-range transport of C3H8 is less efficient and we expect to see a larger convectivetransport effect on C3H8 than C2H6.
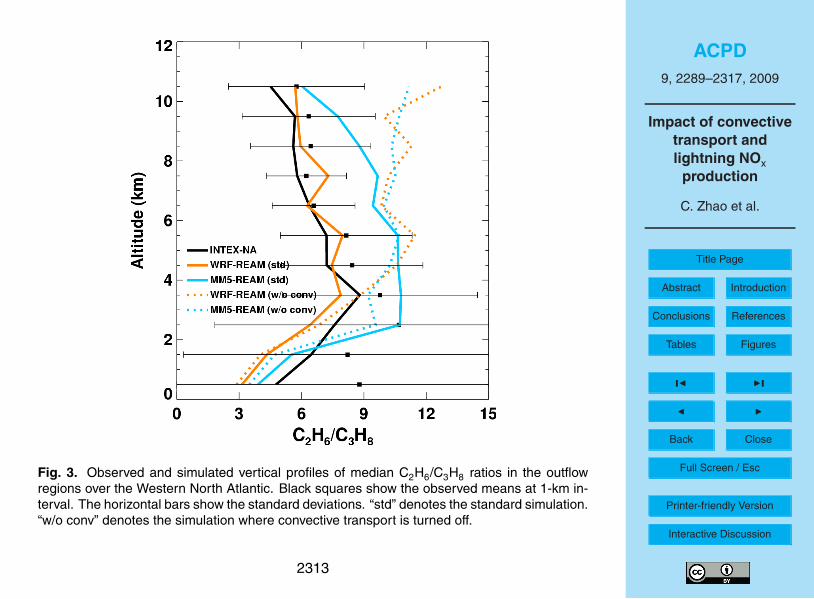
We compare the median profiles of C2H6/C3H8 over the outflow region of the West-ern North Atlantic in both models with the INTEX-NA measurements in Fig. 3. We alsoshow the sensitivity results when convective transport is turned off in the models. The5
observations show the lowest median C2H6/C3H8 ratio of 4–5 in the boundary layer.The observed ratio reaches a maximum of 9 at 3 km and gradually decreases to 4–5at 11 km. Generally speaking, the ratio of C2H6/C3H8 increases in the troposphere asa result of differential chemical aging and atmospheric mixing (Wang and Zeng, 2004).Therefore, the ratio of C2H6/C3H8 tends to increase from the boundary to the free tro-10
posphere. The observed decrease of C2H6/C3H8 ratio reflects the effects of convectivetransport, which mixes upper tropospheric (high C2H6/C3H8 ratio) air mass with lowC2H6/C3H8 ratio air mass lifted from the boundary layer into the free troposphere. Wenote that the amount of mixing is determined by flux vertical convergence, not by thedirect fluxes shown in Fig. 1a. The measurement variability is larger in the lower tro-15
posphere, reflecting a mixture of fresh continental air with low C2H6/C3H8 ratios andaged marine air with high C2H6/C3H8 ratios over the Western North Atlantic.
Among the model simulations, both standard models reproduce the general profilesof the observed C2H6/C3H8 ratio; the profile from WRF-REAM is in closer agreementwith the measurements. MM5-REAM median profile is at the upper bound of the mea-20
surements at 4–9 km. More telling of the model difference is in the sensitivity simula-tions. Without convective transport, the simulated median C2H6/C3H8 ratios in WRF-REAM would be a factor 2–3 too high compared to the measurements. In MM5-REAM,the effect of convective transport is evident only in the upper troposphere (above 7 km)as indicated in Fig. 2. The lack of convective mixing in MM5-REAM results in over-25
estimates of the C2H6/C3H8 ratio in the free troposphere at 3–9 km. The convectiveeffect in MM5-REAM becomes larger than WRF-REAM above 11 km. There is no di-rect in situ observation to evaluate the model performance above 11 km. What we willshow in Sect. 4.1 is that the convective cloud top is overestimated in MM5 compared
2298

ACPD9, 2289–2317, 2009
Impact of convectivetransport andlightning NOx
production
C. Zhao et al.
Title Page
Abstract Introduction
Conclusions References
Tables Figures
J I
J I
Back Close
Full Screen / Esc
Printer-friendly Version
Interactive Discussion
with GOES satellite observations, particularly over the Western North Atlantic. WRFsimulations are in closer agreement with the observations.
We also examine the effects of convective scavenging of soluble HNO3. We as-sume that HNO3 is removed in convective updrafts in the model (e.g., Wang et al.,2001). This wet scavenging pathway effectively removes HNO3 lifted from the bound-5
ary. However, HNO3 produced from lightning NOx is not scavenged in this process.With entrainment (such as in WRF-REAM), background HNO3 entrained into cumulusclouds is also removed. Without entrainment scavenging, upper tropospheric HNO3concentrations can be high from lightning NOx. In general, simulated HNO3 concentra-tions are lower in WRF-REAM than MM5-REAM and are in better agreement with the10
INTEX-NA measurements although both model simulations of median HNO3 profilesare within the standard deviations of the measurements (not shown). WRF simulateshigher convective mass fluxes than MM5 and also includes entrainment fluxes (Fig. 1b).Both factors contribute to larger wet scavenging in WRF-REAM.
4 Uncertainties in modeling lightning NOx production and its impact on tropo-15
spheric O3
4.1 Cumulus cloud top and lightning NOx production
We compare model simulated tropospheric NO2 columns with SCIAMACHY measure-ments for July and August 2004 (Martin et al., 2006) to illustrate the difference of light-ning NOx production between the two models (Fig. 4). The temporal resolution of20
SCIAMACHY is low; it covers the globe every 6 days. After filtering out measurementswith cloud fractions >30%, there are only about 2 measurements over the Eastern US.Therefore, the comparison here is qualitative in nature. Some of the overestimates inthe models can be traced back to simulated lightning influence in one of the measure-ment days. WRF-REAM and MM5-REAM simulations are very similar when lightning25
NOx is excluded. When including lightning NOx, WRF-REAM simulated NO2 columns
2299

ACPD9, 2289–2317, 2009
Impact of convectivetransport andlightning NOx
production
C. Zhao et al.
Title Page
Abstract Introduction
Conclusions References
Tables Figures
J I
J I
Back Close
Full Screen / Esc
Printer-friendly Version
Interactive Discussion
are lower than MM5-REAM and are closer to the limited observations. The spatial cor-relation is also higher in WRF-REAM (R=0.73) than MM5-REAM (R=0.58). LightningNOx production is lower in WRF-REAM than MM5-REAM. For example, NO2 columnsabove 12 km are mainly due to lightning NOx. They are much lower in WRF-REAMthan in MM5-REAM (Fig. 4). Over the Western North Atlantic, NO2 columns above5
12 km account for 10% of the total column in WRF-REAM but ∼50% in MM5-REAM.Specifying a lower NOx production rate per flash in MM5-REAM than WRF-REAM cancorrect the high bias in MM5-REAM. However, the correction will also lead to largeunderestimations in MM5-REAM compared to INTEX-NA aircraft measurements (to bediscussed in the next section).10
The large difference in simulated lightning NOx production between WRF-REAM andMM5-REAM is due mainly to the difference in the simulated cumulus cloud top heights.The simulated vertical distribution of lightning NOx follows the mid-latitude profile byPickering et al. (1998). Figure 5 shows the lightning NOx distributions in the two modelsaveraged over North America. MM5-REAM simulates the lightning NOx maximum at15
∼15 km much higher than that in WRF-REAM at ∼12 km. It is important to note thateven though MM5-REAM simulates much more total lightning NOx than WRF-REAM,two models simulate similar lightning NOx production at 2–12 km, which will explain whytwo models simulate similar lightning impact on the upper tropospheric (8–12 km) NO2and O3 concentrations shown in the next section. Our lightning NOx parameterization20
is based on the observed cloud-ground (CG) flash rates from the NLDN network (Choiet al., 2005, 2008a). The intra-cloud (IC) lightning flash rates are estimated in themodel as a function of the freezing altitude and cumulus cloud top height (Wang et al.,1998). A higher cloud top height generally leads to higher lightning NOx production.
We therefore evaluate model simulated cumulus cloud top heights with the measure-25
ments by GOES-10 and GOES-12 satellites from the DX cloud dataset of the ISCCP(Rossow and Schiffer, 1991) in Fig. 6. Clearly, the problem is in MM5 results, wherecloud top pressures are underestimated over the Gulf of Mexico, the SoutheasternUS and the Western North Atlantic. The overestimates of cloud top heights lead to
2300

ACPD9, 2289–2317, 2009
Impact of convectivetransport andlightning NOx
production
C. Zhao et al.
Title Page
Abstract Introduction
Conclusions References
Tables Figures
J I
J I
Back Close
Full Screen / Esc
Printer-friendly Version
Interactive Discussion
higher IC/CG flash ratios and overestimates of lightning NOx production in these re-gions (Fig. 4). It also becomes apparent that lightning NOx in MM5-REAM is injectedtoo high in altitude (Fig. 5). Convection in WRF KF-eta scheme reaches to a loweraltitude in part because entrainment from drier free tropospheric air and detrainmentreduce the buoyancy in the convective updraft. Without entrainment and detrainment,5
the updraft reaches to 16 km (rather than 10–12 km in WRF) in MM5. Satellite mea-surements of NO2 (indirectly) and cloud top pressure (directly) indicate that KF-etascheme in WRF is more realistic.
4.2 Effects of lightning NOx during INTEX-NA
The large model difference in lightning NOx is not necessarily reflected in the compar-10
ison with aircraft NOx measurements because the flight ceiling of DC-8 is 12 km. Fig-ure 7 shows the comparisons of upper tropospheric NO2 at 8–12 km along the DC-8flight tracks. The difference between WRF-REAM and MM5-REAM is not as signifi-cant as we found in Figs. 4–6 because of the similar lightning NOx emissions from thetwo models at 2–12 km (Fig. 5). Upper tropospheric NOx in both models are driven by15
lightning, which increases NO2 mixing ratios by a factor of up to 5 (∼100 pptv). Bothmodels simulate larger lightning impacts over the Southeastern US than the Northeastand the Eastern Canada. Measurements indicate that model underestimates lightningNOx production in the latter regions. Similar underestimates are also found in previousstudies (e.g., Hudman et al., 2007). Figure 1a shows that convective mass fluxes in20
the upper troposphere in both WRF and MM5 are generally low over those regions.Measurements by the NLDN network also show lower CG flashes there. Therefore,the model underestimates may reflect a higher NOx production rate per flash in thenorthern regions than the Southeastern US.
Lightning NOx is a major source of O3 in the upper troposphere and significantly25
affects the budget of tropospheric O3. Hudman et al. (2007) found lightning can in-crease upper troposphere O3 concentrations by ∼10 ppbv and Cooper et al. (2006)found an increase of 11–13 ppbv during INTEX-NA. We find, here, that, O3 concen-
2301
ACPD9, 2289–2317, 2009
Impact of convectivetransport andlightning NOx
production
C. Zhao et al.
Title Page
Abstract Introduction
Conclusions References
Tables Figures
J I
J I
Back Close
Full Screen / Esc
Printer-friendly Version
Interactive Discussion
trations are increased by up to ∼20 ppbv (Fig. 7). The average O3 enhancement is∼10 ppbv. Despite the difference in the underlying meteorological fields, simulated O3concentrations and their sensitivities to lighting NOx are similar between WRF-REAMand MM5-REAM since lightning enhancements of NO2 are similar between the twomodels at 8–12 km. The enhancements of O3 by lightning NOx improve model simu-5
lations compared to INTEX-NA measurements. Upper tropospheric O3 concentrationsare affected by lightning mainly over the Southeastern US and Eastern Canada. Tropo-spheric O3 production from surface emissions of NOx and volatile organic compounds(VOCs) and transport from the stratosphere also make significant contributions to up-per tropospheric O3 (Choi et al., 2008a).10
4.3 Relative contributions of surface and lightning emissions to tropospheric NOx
The relative importance of the different odd nitrogen sources in the troposphere hasbeen investigated in previous studies (e.g., Lamarque et al., 1996; Levy et al., 1999;Allen et al., 2000; Grewe et al., 2001; Tie et al., 2001). Grewe et al. (2001) investi-gated the origins of the upper tropospheric NOx and summarized the previous work.15
They suggested contribution ranges of 15–60% for lightning and 7–60% for surfaceemissions to upper tropospheric NOx over the northern mid-latitude in July. The wideranges reflect the different treatments of emissions, chemistry, and transport in themodels. In our simulations, WRF-REAM and MM5-REAM show similar results up to12 km. Lightning contribution to NOx increases from ∼10% in the boundary layer to up20
to 70% in the upper troposphere (8–12 km). In contrast, the surface emission contri-butions decrease from 80% in the boundary layer to ∼10% at 8–12 km. Above 12 km,the two models clearly diverge. WRF-REAM simulates ∼50% and MM5-REAM simu-lates ∼90% of the lightning contribution. The NOx concentrations at 12–15 km from theMM5-REAM simulation more than double those from WRF-REAM simulation due to25
lightning. The divergence between WRF-REAM and MM5-REAM above 12 km reflectsthe lightning NOx vertical profiles in Fig. 4. The NOx concentrations due to surfaceemissions from MM5-REAM simulation are ∼50% higher than that from WRF-REAM
2302

ACPD9, 2289–2317, 2009
Impact of convectivetransport andlightning NOx
production
C. Zhao et al.
Title Page
Abstract Introduction
Conclusions References
Tables Figures
J I
J I
Back Close
Full Screen / Esc
Printer-friendly Version
Interactive Discussion
simulation because of the absence of the dilution from entrainment and detrainmentand the higher cloud top height in MM5 simulation. We also estimate contributionsof ∼40 and 10% to total reactive nitrogen (NOy) from lightning and surface emissionsat 8–12 km, respectively. Previously, Allen et al. (2000) estimated a 13% contributionfrom lightning and 16% contribution from surface emissions for October–November5
1997 during the SONEX experiment. More intensive summertime lightning is likely thereason for a larger lightning impact in our results.
5 Conclusions
Two convective schemes, KF-eta scheme in WRF-REAM and Grell scheme in MM5-REAM, are used to evaluate the uncertainties in modeling convective transport and10
lightning NOx production. When compared to the convective transport and lightningNOx features measured during INTEX-NA, we find that the model difference can beattributed to mostly the difference of the convective parameterization schemes, not tothe difference in the other formulations of the meteorological models.
The KF-eta scheme simulates larger updrafts in the lower troposphere, resulting in15
significantly more outflow at 3–9 km than the Grell scheme. A sensitivity chemical in-dicator affected by this outflow is C2H6/C3H8 ratio. While WRF-REAM shows largedecreases (up to a factor of 2) of C2H6/C3H8 ratio at 3–9 km due to convective out-flow, the change is relative small in MM5-REAM. In comparison, the two models arein agreement in the boundary layer and 10–11 km. INTEX-NA observations clearly in-20
dicate WRF-REAM simulations are in closer agreement with the observations. Largermass fluxes as well as entrainment and detrainment in the KF-eta scheme in WRF-REAM also lead to more scavenging of soluble HNO3 in the free troposphere thanMM5-REAM. The simulated median profile of HNO3 by WRF-REAM is in closer agree-ment with the measurements than MM5-REAM, although the observed variation is25
larger than the model difference.Inclusion of entrainment and detrainment in the KF-eta scheme results in lower con-
2303

ACPD9, 2289–2317, 2009
Impact of convectivetransport andlightning NOx
production
C. Zhao et al.
Title Page
Abstract Introduction
Conclusions References
Tables Figures
J I
J I
Back Close
Full Screen / Esc
Printer-friendly Version
Interactive Discussion
vective cloud top in WRF than MM5. The cloud top height directly affects the modelestimates of intra-cloud lightning production. Consequently, WRF-REAM simulatesless lightning NOx than MM5-REAM and the maximum lightning NOx altitude of 12 kmin WRF-REAM is lower than 15 km in MM5-REAM. Measurements of troposphericNO2 columns from SCIAMACHY provide a qualitative comparison, which suggests5
that WRF-REAM is closer to the observations, although the lower temporal resolutionand cloud presence over convective regions greatly reduced the number of valid mea-surements. Evaluation using the ISCCP cloud top height measurements from GOESsatellites clearly demonstrated that MM5 simulated convective cloud tops are too highover the Southeastern US and Western North Atlantic.10
It is interesting to note that the large model difference in lightning NOx production oc-curs mostly above 12 km, where no in situ measurements were available from INTEX-NA. Despite the large differences discussed previously, the two models show similaragreement with upper tropospheric in situ NO2 measurements. Over the observationregions of INTEX-NA, the two models show consistent results for the effects of lightning15
NOx in the upper troposphere (8–12 km): (1) lightning enhances upper troposphericNO2 concentrations by more than a factor of >5 (∼100 ppt) and NO2 columns by a fac-tor of >1.5 over the ocean; (2) lightning and surface emissions contribute ∼70% (40%)and ∼10% (10%), respectively, to the upper tropospheric NOx (NOy); and (3) lightningNOx increases O3 concentrations by up to 20 ppbv with an average of 10 ppbv. These20
results are generally consistent with previous studies.
Acknowledgements. We thank Randall Martin for providing satellite retrieval data and KennethCummins for providing the NLDN effective detection efficiency. The GEOS-CHEM model ismanaged at Harvard University with support from the NASA Atmospheric Chemistry Modelingand Analysis Program. This work was supported by the National Science Foundation Atmo-25
spheric Chemistry program.
2304

ACPD9, 2289–2317, 2009
Impact of convectivetransport andlightning NOx
production
C. Zhao et al.
Title Page
Abstract Introduction
Conclusions References
Tables Figures
J I
J I
Back Close
Full Screen / Esc
Printer-friendly Version
Interactive Discussion
References
Allen, D. J., Pickering, K. E., Stenchikov, G., Thompson, A., and Kondo, Y.: A three-dimensionaltotal odd nitrogen (NOy) simulations during SONEX using a stretched-grid chemical transportmodel, J. Geophys. Res., 105, 3851, doi:10.1029/2002JD002066, 2000.
Allen, D. J. and Pickering, K. E.: Evaluation of lightning flash rate parameterizations for use in a5
global chemical transport model, J. Geophys. Res., 107, 4711, doi:10.1029/2002JD002066,2002.
Bey, I., Jacob, D. J., Yantosca, R. M., Logan, J. A., Field, B. D., Fiore, A. M., Li, Q., Liu, H.,Mickley, L. J., and Schultz, M. G.: Global modeling of tropospheric chemistry with assimilatedmeteorology: Model description and evaluation, J. Geophys. Res., 106, 23073–23096, 2001.10
Bertram, T. H., Perring, A. E., Wooldridge, P. J., Crounse, J. D., Kwan, A. J., Wennberg, P. O.,Scheuer, E., Dibb, J., Avery, M., Sachse, G., Vay, S. A., Crawford, J. H., McNaughton, C.S., Clarke, A., Pickering, K. E., Fuelberg, H., Huey, G., Blake, D. R., Singh, H. B., Hall, S.R., Shetter, R. E., Fried, A., Heikes, B. G., and Cohen, R. C.: Direct Measurements of theConvective Recycling of the Upper Troposphere, Science, 315, 816–820, 2007.15
Choi, Y., Wang, Y., Zeng, T, Martin, R. V., Kurosu, T. P., and Chance, K.: Evidence of light-ning NOx and convective transport of pollutants in satellite observations over North America,Geophys. Res. Lett., 32, L02805, doi:10.1029/2004GL021436, 2005.
Choi, Y., Wang, Y., Zeng, T., Cunnold, D., Yang, E., Martin, R., Chance, K., Thouret, V., andEdgerton, E.: Springtime transitions of NO2, CO, and O3 over North America: Model evalu-20
ation and analysis, J. Geophys. Res., 113, D20311, doi:10.1029/2007JD009632, 2008a.Choi, Y., Wang, Y., Yang, Q., Cunnold, D., Zeng, T., Shim, C., Luo, M., Eldering, A., Bucsela,
E., and Gleanson, J.: Spring to summer northward migration of high O3 over the westernNorth Atlantic, Geophys. Res. Lett., 35, L04818, doi:10.1029/2007GL032276, 2008b.
Collins, W. J., Derwent, R. G., Johnson, C. E., and Stevenson, D. S.: A comparison of two25
schemes for the convective transport of chemical species in a Lagrangian global chemistrymodel, Q. J. Roy. Meteor. Soc., 128, 991–1009, 2002.
Cooper, O. R., Stohl, A., Trainer, M., Thompson, A. M., Witte, J. C., Oltmans, S. J., Morris,G., Pickering, K. E., Crawford, J. H., Chen, G., Cohen, R. C., Bertram, T. H., Wooldridge,P., Perring, A., Brune, W. H., Merrill, J., Moody, J. L., Tarasick, D., Nedelec, P., Forbes, G.,30
Newchurch, M. J., Schmidlin, F. J., Johnson, B. J., Turquety, S., Baughcum, S. L., Ren, X.,Fehsenfeld, F. C., Meagher, J. F., Spichtinger, N., Brown, C. C., Mckeen, S. A., McDermid, I.
2305

ACPD9, 2289–2317, 2009
Impact of convectivetransport andlightning NOx
production
C. Zhao et al.
Title Page
Abstract Introduction
Conclusions References
Tables Figures
J I
J I
Back Close
Full Screen / Esc
Printer-friendly Version
Interactive Discussion
S., and Leblanc, T.: Large upper tropospheric ozone enhancements above midlatitude NorthAmerica during summer: In situ evidence from the IONS and MOZAIC ozone measurementnetwork, J. Geophys. Res., 111, D24S05, doi:10.1029/2006JD007306, 2006.
Doherty, R. M., Stevenson, D. S., Collins, W. J., and Sanderson, M. G.: Influence of convectivetransport on tropospheric ozone and its precursors in a chemistry-climate model, Atmos.5
Chem. Phys., 5, 3205–3218, 2005,http://www.atmos-chem-phys.net/5/3205/2005/.
Emanuel, K. A.: Atmospheric convection, Oxford University Press (New York), New York, USA,580 pp., 1994.
Fehsenfeld, F. C., Ancellet, G., Bates, T. S., Goldstain, A. H., Hardesty, R. M., Honrath, R.,10
Law, K. S., Lewis, A. C., Leaitch, R., McKeen, S., Meagher, J., Parrish, D. D., Pszenny, A.A. P., Russel, P. B., Schlager, H., Seinfeld, J., Trainer, M., Talbot, R., and Zbinden, R.: Inter-national Consortium for Atmospheric Research on Transport and Transformation (ICARTT):North America to Europe: Overview of the 2004 summer field study, J. Geophys. Res., 111,D23S01, doi:10.1029/2006JD007829, 2006.15
Folkins, I., Bernath, P., Boone, C., Donner, L. J., Eldering, A., Lesins, G., Martin, R. V., Sinnhu-ber, B. M., and Walker, K.: Testing convective parameterizations with tropical measurementsof HNO3, CO, H2O, and O3: Implications for the water vapor budget, Geophys. Res. Lett.,111, D23304, doi:10.1029/2006JD007325, 2006.
Grell, G. A.: A description of the fifth-generation Penn State/NCAR mesoscale model (MM5),20
NCAR Tech. Note, June, 1995.Grell, G. A. and Devenyi, D.: A generalized approach to parameterizing convection com-
bining ensemble and data assimilation techniques, Geophys. Res. Lett., 29, 1693,doi:10.1029/2002GL015311, 2002.
Grewe, V., Brunner, D., Dameris, M., Grenfell, J. L., Hein, R., Shindell, D., and Staehelin,25
J.: Origin and variability of upper tropospheric nitrogen oxides and ozone at northern mid-latitudes, Atmos. Environ., 35, 3421–3433, 2001.
Guillas, S., Bao, J., Choi, Y., Wang, Y., Khaing, H., Nesbit, C., and Huey, G.: downscaling ofchemical transport ozone forecasts over Atlanta, Atmos. Environ., 42, 1338–1348, 2008.
Hess, P. G.: A comparison of two paradigms: The relative global roles of moist convective ver-30
sus nonconvective transport, J. Geophys. Res., 110, D20302, doi:10.1029/2004JD005456,2005.
Hudman, R. C., Jacob, D. J., Turquety, S., Leibensperger, E. M., Murray, L. T., Wu, S., Gilliland,
2306

ACPD9, 2289–2317, 2009
Impact of convectivetransport andlightning NOx
production
C. Zhao et al.
Title Page
Abstract Introduction
Conclusions References
Tables Figures
J I
J I
Back Close
Full Screen / Esc
Printer-friendly Version
Interactive Discussion
A. B., Avery, M., Bertram, T. H., Brune, W., Cohen, R. C., Dibb, J. E., Flocke, F. M., Fried, A.,Holloway, J., Neuman, J. A., Orville, R., Perring, A., Ren, X., Ryerson, T. B., Sachse, G. W.,Singh, H. B., Swanson, A., and Wooldridge, P. J.: Surface and lightning sources of nitrogenoxides over the United States: magnitudes, chemical evolution, and outflow, J. Geophys.Res., 112, D12S05, doi:10.1029/2006JD007912, 2007.5
Jing, P., Cunnold, D., Choi, Y., and Wang, Y.: Summertime tropospheric ozone columns fromAura OMI/MLS measurements versus regional model results over the United States, Geo-phys. Res. Lett., 33, L17817, doi:10.1029/2006GL026473, 2006.
Kain, J. S.: The Kain-Fritsch Convective Parameterization: An Update, J. Appl. Meteorol., 43,170-181, doi:10.1175/1520-0450(2004)043 2003.10
Kiley, C. M. and Fuelberg, H. E.: An examination of summertime cyclone transport processesduring Intercontinental Chemical Transport Experiment (INTEX-NA), J. Geophys. Res., 111,D24S06, doi:10.1029/2006JD007115, 2006.
Labrador, L., Kuhlmann, R. V., and Lawrence, M. G.: Strong sensitivity of the global mean OHconcentration and the troposphere’s oxidizing efficiency to the source of NOx from lightning,15
Geophys. Res. Lett., 31, L06102, doi:10.1029/2003GL019229, 2004.Labrador, L. J., von Kuhlmann, R., and Lawrence, M. G.: The effects of lightning-produced NOx
and its vertical distribution on atmospheric chemistry: sensitivity simulations with MATCH-MPIC, Atmos. Chem. Phys., 5, 1815–1834, 2005,http://www.atmos-chem-phys.net/5/1815/2005/.20
Lamarque, J. F., Brasseur, G. P., and Hess, P. G.: Three-dimentional study of the relativecontributions of the different nitrogen sources in the troposphere, J. Geophys. Res., 101,22955–22968, 1996.
Levy, H., Moxim, W. J., Klonecki, A. A., and Kasibhatla, P. S.: Simulated tropospheric NOx:Its evaluation, global distribution and individual source contributions, J. Geophys. Res., 104,25
26279–26306, 1999.Li, Q., Jacob, D. J., Park, R., Wang, Y., Heald, C. L., and Hudman, R.: North American pol-
lution outflow and the trapping of convectively lifted pollution by upper-level anticyclone, J.Geophys. Res., 110, D10301, doi:10.1029/2004JD005039, 2005.
Martin, R. V., Sioris, C. E., Chance, K., Ryerson, T. B., Bertram, T. H., Wooldridge, P. J., Cohen,30
R. C., Neuman, J. A., Swanson, A., and Flocke, F. M.: Evaluation of space-based constraintson global nitrogen oxide emissions with regional aircraft measurements over and downwindof eastern North America, J. Geophys. Res., 111, D15308, doi:10.1029/2005JD006680,
2307

ACPD9, 2289–2317, 2009
Impact of convectivetransport andlightning NOx
production
C. Zhao et al.
Title Page
Abstract Introduction
Conclusions References
Tables Figures
J I
J I
Back Close
Full Screen / Esc
Printer-friendly Version
Interactive Discussion
2006.Martin, R. V., Sauvage, B., Folkins, I., Sioris, C. E., Boone, C. Bernath, P., and Ziemke, J.:
Space-based constraints on the production of nitric oxide by lightning, J. Geophys. Res.,112, D09309, doi:10.1029/2006JD007831, 2007.
Ott, L. E., Pickering, K., Stenchikov, G., Lin, R., Ridley, B., Lopez, J., Loewenstain, M., and5
Richard, E.: Trace gas transport and lightning NOx production during a CRYSTAL-FACEthunderstorm simulated using a 3-D cloud-scale chemical transport model, Eos Trans. AGU,84(46), Fall Meet. Suppl., Abstract AE32A-0156, 2003.
Pickering, K. E., Wang, Y., Tao, W., Price, C., and Muller, J.: Vertical distributions of lightningNOx for use in regional and global chemical transport models, J. Geophys. Res., 103, 31202–10
31216, 1998.Prather, M. J. and Jacob, D. J.: A persistent imbalance in HOx and NOx photochemistry of the
upper troposphere driven by deep tropical convection, Geophys. Res. Lett., 24, 3189–3192,1997.
Prather, M. J.: Atmospheric Chemistry and Greenhouse Gases, in: Climate Change 2001: The15
Scientific Basis, Contribution of WG1 to the Third Assessment report of the IPCC, edited by:Houghton, J. T., Ding, Y., Griggs, D. J., Nogueret, M., et al., Cambridge University Press, UK,2001.
Price, C. and Rind, D.: What determines the cloud-to-ground lightning fraction in thunder-storms?, J. Geophys. Res., 98, 463–466, 1993.20
Price, C., Penner, J., and Prather, M.: NOx from lightning: 1. global distribution based onlightning physics, J. Geophys. Res., 102, 5929–5941, 1997.
Rossow, R. W. and Schiffer, R. A.: ISCCP cloud data products, B. Am. Meteorol. Soc., 72,2–20, 1991.
Singh, H. B., Brune, W. H., Crawford, J. H., Jacob, D. J., and Russell, P. B.: Overview of the25
summer 2004 Intercontinental Chemical Transport Experiment-North America (INTEX-NA),J. Geophys. Res., 111, D24S01, doi:10.1029/2006JD007905, 2006.
Singh, H. B., Salas, L., Herlth, D., Kolyer, R., Czech, E., Avery, M., Crawford, J. H., Pierce,R. B., Sachse, G. W., Blake, D. R., Cohen, R. C., Bertram, T. H., Perring, A., Wooldridge,P. J., Dibb, J., Huey, G., Hudman, R. C., Turquety, S., Emmons, L. K., Flocke, F., Tang, Y.,30
Carmichael, G. R., and Horowitz, L. W.: Reactive nitrogen distribution and partitioning in theNorth American troposphere and lowermost stratosphere, J. Geophys. Res., 111, D12S04,doi:10.1029/2006JD007664, 2007.
2308

ACPD9, 2289–2317, 2009
Impact of convectivetransport andlightning NOx
production
C. Zhao et al.
Title Page
Abstract Introduction
Conclusions References
Tables Figures
J I
J I
Back Close
Full Screen / Esc
Printer-friendly Version
Interactive Discussion
Skamarock, W. C., Klemp, J. B., Dudhia, J., Gill, D. O., Barker, D. M., Wang, W., and Powers,J. G.: A Description of the Advanced Research WRF Version 2, NCAR Tech. Note, June,2005.
Tie, X., Zhang, R., Guy, Brasseur, Emmons, L. K., and Lei, W.: Effects of lightning on reactivenitrogen and nitrogen reservoir species in the troposphere, J. Geophy. Res., 106, 3167–5
3178, 2001.Turquety, S., Logan, J. A., Jacob, D. J., Hudman, R. C., Leung, F. Y., Heald, C. L., Yantosca, R.
M., Wu, S., and Emmons, L. K.: Inventory of boreal fire emissions for North America in 2004:Importance of peat burning and pyroconvective injection, J. Geophys. Res., 112, D12S03,doi:10.1029/2006JD007281, 2007.10
Wang, Y., Jacob, D. J., and Logan, J. A.: Global simulation of tropospheric O3-NOx-hydrocarbonchemistry: 1. Formulation, J. Geophys. Res., 103, 10713–10725, 1998.
Wang, Y., Liu, S. C., Yu, H., and Sandholm, S. T.: Influence of convection and biomass burn-ing on tropospheric chemistry over the tropical Pacific, J. Geophys. Res., 105, 9321–9333,2000.15
Wang, Y., Liu, S. C., Wine, P. H., Davis, D. D., Sandholm, S. T., Atlas, E. L., Avery, M. A., Blake,D. R., Blake, N. J., Brune, W. H., Heikes, B. G., Sachse, G. W., Shetter, R. E., Singh, H. B.,Talbot, R. W., and Tan, D.: Factors controlling tropospheric O3, OH, NOx, and SO2 over thetropical Pacific during PEM-Tropics B, J. Geophys. Res., 106, 32733–32747, 2001.
Wang, Y., Choi, Y., Zeng, T., Ridley, B., Blake, N., Blake, D., and Flocke, F.: Late-spring increase20
of trans-Pacific pollution transport in the upper troposphere, Geophys. Res. Lett., 33, L01811,doi:10.1029/2005GL024975, 2006.
Wang, Y., Choi, Y., Zeng, T., Davis, D., Buhr, M., Huey, G., and Neff, W.: Assessing the photo-chemical impact of snow NOx emissions over Antarctica during ANTCI 2003, Atmos. Envi-ron., 41, 3944–3958, 2007.25
Zeng, T., Wang, Y., Chance, K., Browell, E. V., Ridley, B. A., and Atlas, E. L.: Widespreadpersistent near-surface ozone depletion at northern high latitudes in spring, Geophys. Res.Lett., 30(24), 2298, doi:10.1029/2003GL018587, 2003.
Zeng, T., Wang, Y., Chance, K., Blake, N., Blake, D., and Ridley, B.: Halogen-driven low alti-tude O3 and hydrocarbon losses in spring at northern high latitudes, J. Geophys. Res., 111,30
D17313, doi:10.1029/2005JD006706, 2006.
2309

ACPD9, 2289–2317, 2009
Impact of convectivetransport andlightning NOx
production
C. Zhao et al.
Title Page
Abstract Introduction
Conclusions References
Tables Figures
J I
J I
Back Close
Full Screen / Esc
Printer-friendly Version
Interactive Discussion
29
Figure 1a. Mean deep convective updraft mass fluxes from WRF and MM5 simulations for July and August 2004.
Fig. 1a. Mean deep convective updraft mass fluxes from WRF and MM5 simulations for Julyand August 2004.
2310

ACPD9, 2289–2317, 2009
Impact of convectivetransport andlightning NOx
production
C. Zhao et al.
Title Page
Abstract Introduction
Conclusions References
Tables Figures
J I
J I
Back Close
Full Screen / Esc
Printer-friendly Version
Interactive Discussion
30
Figure 1b. Vertical profiles of mean mass fluxes of deep convection from WRF and MM5 simulations, and the average entrainment and detrainment fluxes from the WRF simulation for July and August 2004 over North America (shown in fig. 1a). Positive (negative) fluxes are updrafts (downdrafts).
Fig. 1b. Vertical profiles of mean mass fluxes of deep convection from WRF and MM5 simu-lations, and the average entrainment and detrainment fluxes from the WRF simulation for Julyand August 2004 over North America (shown in Fig. 1a). Positive (negative) fluxes are updrafts(downdrafts).
2311
ACPD9, 2289–2317, 2009
Impact of convectivetransport andlightning NOx
production
C. Zhao et al.
Title Page
Abstract Introduction
Conclusions References
Tables Figures
J I
J I
Back Close
Full Screen / Esc
Printer-friendly Version
Interactive Discussion
31
Figure 2. Percentage changes of C3H8 in the standard model simulations from the model simulations without convective transport for July and August 2004 at the surface, and 150, 300, 500, and 800 hPa. Results for WRF-REAM and MM5-REAM are shown.
Fig. 2. Percentage changes of C3H8 in the standard model simulations from the model simula-tions without convective transport for July and August 2004 at the surface, and 150, 300, 500,and 800 hPa. Results for WRF-REAM and MM5-REAM are shown.
2312
ACPD9, 2289–2317, 2009
Impact of convectivetransport andlightning NOx
production
C. Zhao et al.
Title Page
Abstract Introduction
Conclusions References
Tables Figures
J I
J I
Back Close
Full Screen / Esc
Printer-friendly Version
Interactive Discussion
32
Figure 3. Observed and simulated vertical profiles of median C2H6/C3H8 ratios in the outflow regions over the western North Atlantic. Black squares show the observed means at 1-km interval. The horizontal bars show the standard deviations. “std” denotes the standard simulation. “w/o conv” denotes the simulation where convective transport is turned off.
Fig. 3. Observed and simulated vertical profiles of median C2H6/C3H8 ratios in the outflowregions over the Western North Atlantic. Black squares show the observed means at 1-km in-terval. The horizontal bars show the standard deviations. “std” denotes the standard simulation.“w/o conv” denotes the simulation where convective transport is turned off.
2313

ACPD9, 2289–2317, 2009
Impact of convectivetransport andlightning NOx
production
C. Zhao et al.
Title Page
Abstract Introduction
Conclusions References
Tables Figures
J I
J I
Back Close
Full Screen / Esc
Printer-friendly Version
Interactive Discussion
33
Figure 4. Tropospheric NO2 columns derived from SCIAMACHY measurements [Martin et al., 2006] and simulated by WRF-REAM and MM5-REAM for July and August 2004. Tropospheric NO2 columns from the standard simulation and a sensitivity simulation without lightning NOx are shown. Also shown are the tropospheric columns above 12 km in the standard simulation. Only the measurements with cloud fractions < 30% and the corresponding simulation results are used. White areas indicate that no measurement data are available.
Fig. 4. Tropospheric NO2 columns derived from SCIAMACHY measurements (Martin et al.,2006) and simulated by WRF-REAM and MM5-REAM for July and August 2004. TroposphericNO2 columns from the standard simulation and a sensitivity simulation without lightning NOxare shown. Also shown are the tropospheric columns above 12 km in the standard simulation.Only the measurements with cloud fractions <30% and the corresponding simulation resultsare used. White areas indicate that no measurement data are available.
2314

ACPD9, 2289–2317, 2009
Impact of convectivetransport andlightning NOx
production
C. Zhao et al.
Title Page
Abstract Introduction
Conclusions References
Tables Figures
J I
J I
Back Close
Full Screen / Esc
Printer-friendly Version
Interactive Discussion
34
Figure 5. Mean lightning NOx mixing ratio profiles in WRF-REAM and MM5-REAM for July and August 2004 averaged over North America.
Fig. 5. Mean lightning NOx mixing ratio profiles in WRF-REAM and MM5-REAM for July andAugust 2004 averaged over North America.
2315

ACPD9, 2289–2317, 2009
Impact of convectivetransport andlightning NOx
production
C. Zhao et al.
Title Page
Abstract Introduction
Conclusions References
Tables Figures
J I
J I
Back Close
Full Screen / Esc
Printer-friendly Version
Interactive Discussion
35
Figure 6. Mean cumulus cloud top pressures measured by GOE-10 and GOE-12 satellites and simulated by WRF and MM5 for July and August 2004. Measurement data > 500 hPa (and corresponding model results) are excluded to filter out the low cloud information.
Fig. 6. Mean cumulus cloud top pressures measured by GOE-10 and GOE-12 satellites andsimulated by WRF and MM5 for July and August 2004. Measurement data >500 hPa (andcorresponding model results) are excluded to filter out the low cloud information.
2316

ACPD9, 2289–2317, 2009
Impact of convectivetransport andlightning NOx
production
C. Zhao et al.
Title Page
Abstract Introduction
Conclusions References
Tables Figures
J I
J I
Back Close
Full Screen / Esc
Printer-friendly Version
Interactive Discussion
36
Figure 7. Observed and simulated upper tropospheric NO2 and O3 concentrations along DC-8 flight tracks at 8-12 km during the INTEX-NA experiment. Results from the standard simulations and sensitivity simulations without lightning NOx using WRF-REAM and MM5-REAM are shown. The impacts of lightning (rightmost column) are estimated by subtracting the sensitivity results from the standard model results.
Fig. 7. Observed and simulated upper tropospheric NO2 and O3 concentrations along DC-8flight tracks at 8–12 km during the INTEX-NA experiment. Results from the standard simula-tions and sensitivity simulations without lightning NOx using WRF-REAM and MM5-REAM areshown. The impacts of lightning (rightmost column) are estimated by subtracting the sensitivityresults from the standard model results.
2317