impact of climate change in andean bolivian communities ... · impact of climate change in andean...
TRANSCRIPT

IMPACT OF CLIMATE CHANGE IN ANDEAN BOLIVIAN COMMUNITIES THAT DEPEND FROM TROPICAL GLACIERS

1
Prepared by:
Adriana Soto Trujillo
Review and complementation:
Matilde Avejera, Danitza Salazar, Paula Pacheco, Martín Vilela,
Edwin Torrez
Agua Sustentable
La Paz
Calle Nataniel Aguirre Nº 82 entre 11 y 12 de Irpavi
Telf/Fax: +591 (2) 2151744
Cochabamba
Calle Irigoyen Nº 150, entre Juan de la Rosa y Yuracaré
(zona Sarco)
Telf/Fax +591 (4) 4423162
Tupiza
Av. Tomás Frias Nº 350 (Zona Plaza San Antonio)
Telf/Fax +591 (2) 6945338

2
In the last years, Bolivia has been affected by the
impacts of climate change (increase of heat waves,
changes in rainy season, floods, droughts and forest
fires.), which mainly affect rural communities, who are
the most vulnerable because of their low adaption
capacity; probably because their way of living is
based on the use of natural resources highly sensitive
to the changes of climatic conditions, such as water.
The impact will be much greater in communities that
live in the highlands (mountainous area) if projections
from the IPCC (2008) are considered, which indicate
that water stored in glaciers and in the snow cover
will decline this century, reducing water availability in
warm and dry seasons in those regions depending on
the principal mountain ranges’ snowmelt.
In this sense, researches were made in basins that
depend on Tropical Glaciers in our country to identify
the impact of climate change on the livelihoods of
communities, establishing adaptation strategies to
cope with this situation.
This brochure shows the decline in two Bolivian
tropical glaciers: The Mururata and Illimani. It also
recommends some adaptation strategies for the
Sajhuaya River micro-basin, which water source
comes from the Illimani glacier.
INTRODUCTION
Illimani Glacier

3
Data recorded for the 1975-2009 periods by El Alto
city station show that the maximum and minimum
temperatures have extreme values.
y = 0.0183x - 22.02
13.0
13.5
14.0
14.5
15.0
15.5
16.0
16.5
1975 1980 1985 1990 1995 2000 2005 2010
TE
MP
ER
ATU
RA
(
ºc)
AÑOS
ANUAL Linea de Tendecia Maxima
Figure 1. Maximum temperature in El Alto city
y = -0.0036x + 7.5982
-0.5
0.0
0.5
1.0
1.5
1975 1980 1985 1990 1995 2000 2005 2010
TE
MP
ER
ATU
RA
(º
c)
AÑOS
ANUAL Linea de Tendencia Minima
Figure 2. Minimum temperature in El Alto city
The registered data for the same period in La Paz city
show increase of maximum and minimum
temperatures. 1
y = 0.0709x - 122.53
16.5
17.0
17.5
18.0
18.5
19.0
19.5
20.0
20.5
21.0
1975 1980 1985 1990 1995 2000 2005 2010
TE
MP
ER
ATU
RA
(
ºc)
AÑOS
ANUAL Linea de Tendecia Maxima
Figure 3. Maximum temperature in La Paz city
y = 0.0281x - 50.458
4.5
5.0
5.5
6.0
6.5
7.0
1975 1980 1985 1990 1995 2000 2005 2010
TE
MP
ER
ATU
RA
(º
c)
AÑOS
ANUAL Linea de Tendencia Minima
Figure 4. Minimum temperature in La Paz city
1 Data obtained from Espinoza D. and Fernandez R.; Analysis of Climate Trends in
the Region of Sajhuaya River basin. 2011
IMPACTS: Maximum and minimum temperature increase in the last
decades
4
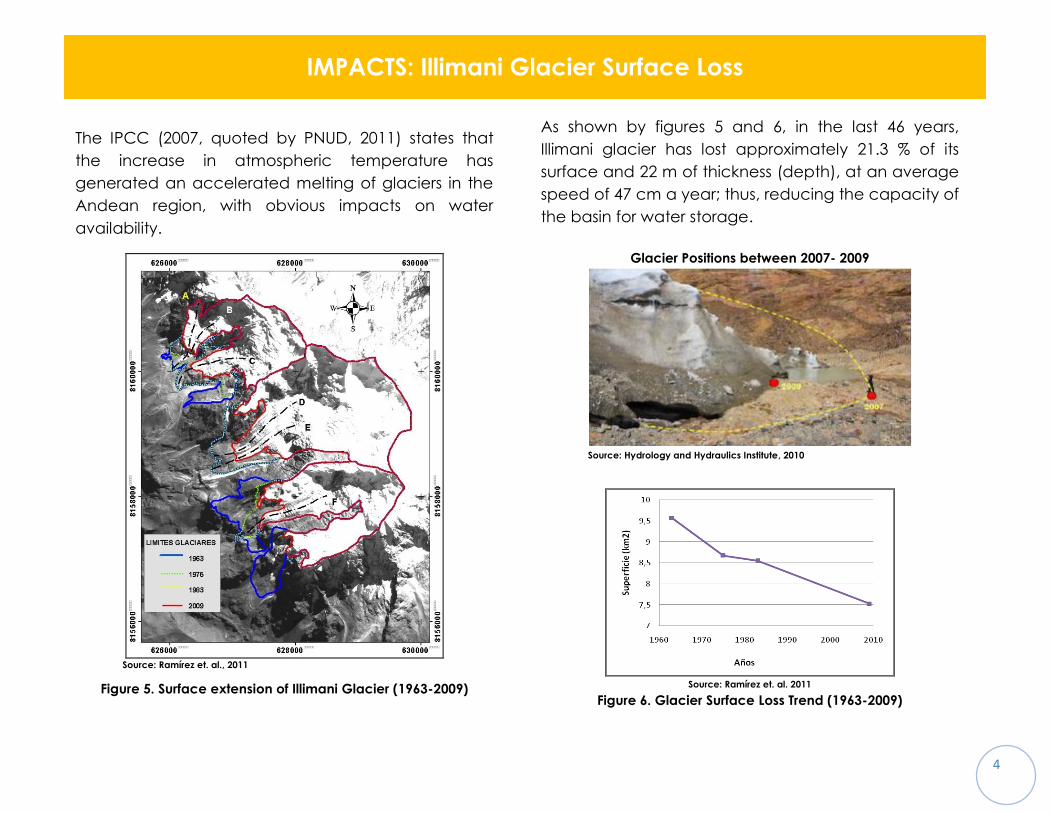
The IPCC (2007, quoted by PNUD, 2011) states that
the increase in atmospheric temperature has
generated an accelerated melting of glaciers in the
Andean region, with obvious impacts on water
availability.
Source: Ramírez et. al., 2011
Figure 5. Surface extension of Illimani Glacier (1963-2009)
As shown by figures 5 and 6, in the last 46 years,
Illimani glacier has lost approximately 21.3 % of its
surface and 22 m of thickness (depth), at an average
speed of 47 cm a year; thus, reducing the capacity of
the basin for water storage.
Glacier Positions between 2007- 2009
Source: Hydrology and Hydraulics Institute, 2010
Source: Ramírez et. al. 2011
Figure 6. Glacier Surface Loss Trend (1963-2009)
IMPACTS: Illimani Glacier Surface Loss

5
According to the National Service for Meteorology
and Hydrology (SENAMHI) (Figure 8), in the last period
(2002 – 2006), the average temperature values are
higher than former periods, showing temperature
increase in the last years2.
Figure 8. Average Temperatures in Mururata glacier region.
2 Results presented in this point correspond to the Project “Adaptation to climate
change in regions affected by the melting of tropical glaciers in Bolivia”,
supported by DANIDA.
At the same time, the results of the study made by
Ramírez (2009) in Mururata Glacier show that this
glacier has lost approximately 20.13% of its surface in
the last 42 years (Figure 9).
Source: Ramírez, 2009.
Figure 9. Mururata glacier surface extensions from
1975 to 2009
IMPACTS: Temperature Increase and Mururata glacier surface loss

6
When analyzing 1946 – 2009 period, it is possible to
see an increase of precipitations with variations in dry
and humid seasons.
However, the population from Sajhuaya micro-basin
perceived that there has been a decrease in rainfall
in the last years, matching with the observed data
from 1976 – 2009 periods.
According to interviews made – to recover the
memories of the population about extreme climate
events - most individuals remember 1983 (El Niño
Southern Oscilation Year), recorded as the driest year
in the Bolivian West. In general, this type of extreme
events (droughts and floods) affect to the families’
economy; in fact more than 50% of the surveyed
families use their savings to cope with the impacts of
extreme climate events, while 17% of community
families – from the upper basin– temporally migrate to
urban centers (García et. al., 2010).
Source: Espinoza and Fernández, 2011
y = 1.4851x - 2434.5
200
300
400
500
600
700
800
1945 1950 1955 1960 1965 1970 1975 1980 1985 1990 1995 2000 2005 2010P
RE
CIP
ITA
CIO
N T
OT
AL
AN
UA
L [
mm
]
AÑOS
Serie Cronologica anual Linea de Tendencia
y = -3.1736x + 6856.4
200
300
400
500
600
700
800
1975 1980 1985 1990 1995 2000 2005 2010
PR
EC
IPIT
AC
ION
TO
TA
L A
NU
AL
(m
m)
AÑOS
Serie Cronologica anual Linea de Tendencia
LA PAZ
y = 0.6103x - 605.93
300
400
500
600
700
800
900
1945 1950 1955 1960 1965 1970 1975 1980 1985 1990 1995 2000 2005 2010
PR
EC
IPIT
AC
ION
TO
TA
L A
NU
AL
[ m
m ]
AÑOS
Serie Cronologica anual
y = -1.6566x + 3919.5
300
400
500
600
700
800
900
1975 1980 1985 1990 1995 2000 2005 2010
PR
EC
IPIT
AC
ION
TO
TA
L A
NU
AL
(m
m)
AÑOS
Serie Cronologica anual
EL ALTO
IMPACTS: Precipitation Changes
PERIOD 1946-2009 PERIOD 1976-2009

7
At the foot of the glacier there are highland wetlands,
known as cushion bogs or “bofedal”. These
ecosystems are fragile and essential because they
produce the necessary food for livestock; what’s more,
they are the habitat for native flora and fauna and
store water coming from the melting glaciers, rainfall or
groundwater, acting as water regulators, especially in dry
season.
Studies carried out by Carafa (2009) indicate that
between 1989 and 2009 the cushion bog area
increased from 33.7 to 107, 6 hectares, which could be
associated with a higher melting of the glacier.
Communities from the high zone use these areas for
pasturing llamas all year long. Another issue that adds to
the climate change impacts is that this area is used as a
tourist campsite.
Signposting to guide tourists to campsites and at the
same time let them know about the melting of the
glacier, also about the importance and caring of
the cushion bogs.
Relocate the tourists’ campsite to an area outside
the cushion bogs.
Conservation of the cushion bogs through
regulatory frameworks (e.g. declaration of the
place as a Protected Area).
IMPACTS: Cushion Bogs ADAPTATION STRATEGY
Promote the development of sustainable tourist
activity
Elaborate a Management and Conservation Plan
for Cushion bogs

8
Together with communities, the
principal climate and non-
climate risks were identified,
having maps showing the
different risks per community.
Climate risks are next:
Hail is common from
December to March. There is
also frost from May to June;
however, the latter has not
been occurring lately.
The lack or bad distribution of
rainfall affects to communities
from the low area especially.
Non-climate risks: these are the
landslides, rock falls and river
overflows caused by the strong
rains and land instability.
IMPACTS: Climate Risks, rock falls and landslides

9
Communities should create their own Early
Warning System for flooding, hail and drought.
Combine the traditional and scientific
knowledge in order to prepare weather
forecast reports.
Through the Municipal government prepare in
communities, a sensitization and broadcast
plan consisting of weather and risk information.
Among communities and led by the Municipal
Government, generate an emergency plan for
river overflowing and flooding.
Strengthen the use of local techniques
(cleaning of channels to avoid river
overflowing, among others).
Present a Food Security Strategy, including
different actions, such as, food storage in case
of loses caused by extreme events.
Build live barriers
with fruit trees or
other local
material.
Recover soil through
gullies (drainage)
management.
ADAPTATION STRATEGIES: Climate risk, rock fall and landslides
Early warning community system What do we need to introduce to avoid
landslides and rock-falls?

10
Communities in the micro-basin are mainly engaged
in agricultural production. In relation to previous years,
their productive systems have suffered some
variations:
Increase in
temperatures has
caused an expansion
of crop areas, going
from a dry production
system to an irrigation
commercial
agriculture with a
tendency towards
monoculture of
lettuce (because of its yield and market value),
especially in the lower basin. This crop is produced in
different times during the year causing in the long-
term, soil degradation.
On the other hand fruit trees have been moved
towards the basin’s upper side.
Moreover, dependency for irrigation in lettuce
production has generated greater demand (Fig. 10).
Source: García, 2011.
Fig. 10. Irrigation requirement (l/s) for Tahuapalca community (low area
of the basin) (1975-2010)
This has also caused a greater
resistance and increase in
pests that attack different
crops. Due to this, farmers
currently use pest controls that
are highly toxic, affecting soil,
water, and their health.
IMPACTS: Production Systems
11
It is recommended to incorporate higher
profitability fruit trees in the middle and lower
basin.
Implementation and production of improved
varieties (seeds and/or seedlings) resistant to
diseases and climate changes.
Elaborate a periodic register for production and
costs.
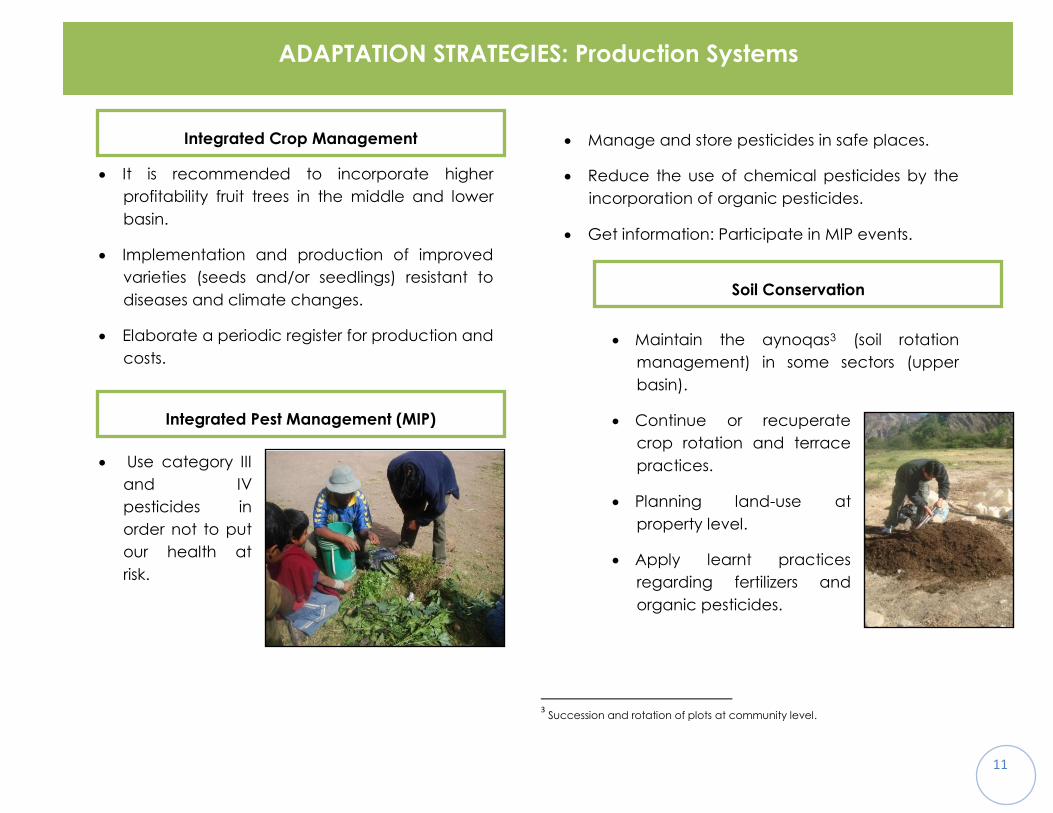
Use category III
and IV
pesticides in
order not to put
our health at
risk.
Manage and store pesticides in safe places.
Reduce the use of chemical pesticides by the
incorporation of organic pesticides.
Get information: Participate in MIP events.
Maintain the aynoqas3 (soil rotation
management) in some sectors (upper
basin).
Continue or recuperate
crop rotation and terrace
practices.
Planning land-use at
property level.
Apply learnt practices
regarding fertilizers and
organic pesticides.
3 Succession and rotation of plots at community level.
ADAPTATION STRATEGIES: Production Systems
Integrated Crop Management
Integrated Pest Management (MIP)
Soil Conservation

12
Currently the snow-melting of the Illimani glacier is
apparently creating greater water availability in the
micro-basin communities.
However, if we consider the loss of the glacier area,
the increase in the evapotranspiration (ET), and
changes in rainfall distribution, in the future, can
generate: water reduction, availability, and quality for
communities.
Although water management in these communities
has adapted to changes, going from a system
without irrigation schedules to one with established
schedules within the community and among
communities with one single irrigation system, today
these agreements are getting very complex. This
could generate greater conflicts, especially among
communities in the basin’s high and low areas.
IMPACTS: Hydro resources and Management

13
Water storage reservoirs have been constructed as
pilot adaptation measures in Khapi and La Granja
communities.
One Aljibe (closed
reservoir) made of
geo-membrane
stores water to
supply controlled
irrigation to an
experimental plot.
Two “Atajados”
(small excavated
ponds) have
been built and
covered with geo-
membrane. They
collect water from
irrigation channels
and store it for
their use during
water shortage periods, they will also be used to try
sprinkle and drip irrigation.
Besides, it is recommended the implementation of
micro-irrigation systems (drip irrigation, sprinklers).
Implement infiltration ditches in pasture
and fruit-tree areas
Building of live barriers
Control of gullies
Sanitation Education
Solid waste management plan
Community monitoring system for water
quality
Improve the alliances between
communities from the low and high areas
of the micro basin.
Promote dialog for the resolution of
conflicts.
ADAPTATION STRATEGIES: Comprehensive Management of Hydro Resources
Conflicts Management
Technologies for water efficient use
Actions for reducing hydro erosion
Quality Control

14
Over time, there is increasing scientific evidence confirming the causes of global warming and its effects, pointing
with certainty to their anthropogenic origin. Consequently, Global Warming and Climate Change will have a
significant impact on hundreds of people in the Andes since the Andean region's ecosystems are particularly
sensitive.
The Andes are known for their rich biological and cultural diversity, and now face the threat of Global Warming
and Climate Change. Since 1939, the temperature of the tropical Andes mountain range has increased from
0.10°C to 0.11ºC per decade, and has accelerated its pace in the last 25 years with a warming of between 0.32ªC
and 0.34ºC per decade4. The current rise has already caused serious damage to the Andean ecosystems,
including the accelerated melting of tropical Andean glaciers, and even more adverse scenarios are expected.
The tropical glaciers of the Andes are particularly sensitive to Climate Change since the process of glacier’s ice
accumulation only occurs under certain conditions during the summer months when rainfall is more intense.
According to the IPCC, accelerated glaciers’ melting is a "critical" matter in Bolivia, where water availability has
been compromised. The IPCC also states that tropical glaciers are "likely” to disappear in the following decades5.
A representative example is the Chacaltaya glacier (4500 m.a.s.l.) which left its condition of glacier in 2009.
The melting of these glaciers associated with other impacts of climate change affect and will significantly keep
affecting hundreds of highly sensitive communities due to their dependence to water provided by glaciers and
their environment. This will involve the violation of their human rights, such as right to life, food and self-
determination among others, which implies that effective measures have to be taken for the adaptation of these
communities.
This year, in the framework of the COP17 negotiations in Durban, steps will be taken towards a new global
agreement to address this threat; with expectation, we hope that governments have the capacity to arrange
mechanisms that curb this disaster in a consistent and disinterested manner, addressing the underlying problems
for the benefit of life on the planet.
4 Vuille & Bradley, 2000 quoted by PNUD, 2011.
5 IPCC, 2008.
CONCLUSIONS

15
Agua Sustentable. Estrategia de adaptación al
cambio climático para comunidades afectadas por
el retroceso del Glaciar Mururata, caso: Microcuenca
del Río Choquecota. 2011
Carafa, T. Informe del Proyecto Illimani: “Evaluación
ecológica de bodefales de la cuenca circundante al
nevado Illimani”. La Paz, Bolivia. 2009
Espinoza D. & Fernández R. Informe del Proyecto
Illimani: “Análisis de Tendencias Climáticas en la
Región de la Cuenca del Río Sajhuaya”. 2011
García, M. Informe del Proyecto Illimani: "Calculo de
las demandas de riego en la Cuenca del Río
Sajhuaya desde 1975 hasta 2009”. La Paz, Bolivia.
2011
García, M., & Taboada, C. Informe del Proyecto
Illimani: "Vulnerabilidad y adaptación al cambio
climático en comunidades de la cuenca del rio
Sajhuaya". La Paz, Bolivia. 2010
IPCC. Documento Técnico VI: El cambio climático y
el agua. 2008
PNUD. “Tras las huellas del cambio climático en
Bolivia: Estado del arte del conocimiento sobre
adaptación al cambio climático, agua y seguridad
alimentaria”. 2011
Ramírez, E. & Machaca, A. Informe del Proyecto
Illimani: “Restitución fotogramétrica, Nevado Illimani.
1963-2009. “La Paz, Bolivia. 2010
Ramírez E. “Deshielo del Nevado Mururata y su
impacto sobre los recursos hídricos de la cuenca de
Palca”. La Paz: Agua Sustentable, 2009.
REFERENCES
