impact of a home sharing platform on therental housing
TRANSCRIPT

Impact of a Home Sharing Platform on the Rental Housing Market in New York City
A Thesis Presented to the
Faculty of Architecture, Planning and Preservation Columbia University in the City of New York
In Partial Fulfillment of the
Requirements for the Degree of Master of Science in Urban Planning
By Jeongwon Seo
May 2016
.

1
Impact of a Home Sharing Platform on the Rental Housing Market in New York City
Jeongwon Seo
Lance Freeman, Ph.D.
ABSTRACT
Home sharing platforms have been creating a disturbance to existing rules and
balances in rental housing market by expanding the use of traditional rental apartments
as places for tourist, by facilitating the conversion of long-term apartment to short-term
rentals, and by providing the way for landlords to capture full market values with their
properties. The alternation of dynamics among stakeholders in rental housing market
triggered a huge debate. In determining whether a home sharing platform affecting on
the rental housing market in New York City, this paper tested if Airbnb units take rental
units off, increase rents, exacerbate rent burdens on renter population, and cause renter
evictions by using difference-in-differences methodology which looks at values in two
different neighborhood groups in two different time periods. The result showed that the
home sharing platform did not have significant influence upon New York City’s rental
housing affordability nor showed any evidence of causing renter evictions. Even though
numbers do not support the existing arguments, things can be interpreted differently by
adding different contexts in the housing market. The number of Airbnb units and
duration of the Airbnb effect may not be yet reached to the point where it starts to effect
on rental housing market and cancels out other factors that effects on the market.
Further studies are necessary in the future to capture its impact on rental housing
market.
2
1. INTRODUCTION 2. BACKGROUND 2.1. Rental Housing Market in New York City 2.2. Home Sharing 2.3. Supporters and Critics 3. LITERATURE REVIEW 3.1. Rent Increase 3.2. Renter Evictions 3.3. Distinguishing Casual and Commercial Listings 4. AIRBNB SHORT-TERM RENTALS IN NEW YORK CITY 4.1. Airbnb Units for the Study 4.2. Number is Increasing 4.3. In Lower Manhattan and Northern Brooklyn 4.4. Mostly 1 Bedroom Apartments 4.5. Incentive Exists 5. RESEARCH DESIGN 5.1. DD Regression Model 5.2. Variables 5.4. Data 6. ANALYSIS 6.1. Median Gross Rent 6.2. Rent in Percentage of Household Income 6.3. Renter Occupancy Rate 6.4. Rental Vacancy Rate 7. LIMITATIONS AND IMPLICATIONS 8. REFERENCES APPENDIX A APPENDIX B

3
1. INTRODUCTION
New York City has about 8 million residents and the majority of those are renting their
homes rather than owning one. As such, fluctuations in the rental housing market may
impinge on 68 percent of the population in the city. The rental housing landscape in
New York City is extremely tight. Demand for rental housing has surpassed its supply
and this is reflected in the city-wide low rental vacancy rate. Since housing is a
necessity and comprises a substantial amount of renter household’s income, the state
government has enacted rent stabilization measures and capped rent increases on
certain types of housing to protect its renter population. Amidst the market’s mismatch
of supply and demand, the introduction of home-sharing platforms have disrupted the
already-tight rental market. Concerns have been raised that short-term rental platforms
provide a loophole for homeowners to opt out of rent stabilization and earn full market-
rate rents, thereby removing housing units from the traditional rental apartment
inventory. If true, such behavior would hinder the ability of affordable housing programs
to operate as designed. These effects have not been verified clearly. This paper
attempts to look at the phenomena closely and validate the effects of a home-sharing
platform.

4
2. BACKGROUND
2.1. RENTAL HOUSING MARKET IN NEW YORK CITY
RENTAL HOUSING DEMAND
Most New Yorkers live in rental housing, so the city’s housing stock is largely renter-
occupied. According to the 2014 American Community Survey, New York City had a
total of 3,407,932 housing units, and renter occupied units comprised 68 percent of
available housing stock, which counted as 2,107,128 and owner units numbered
1,033,226 or 30 percent of the housing stock (American Community Survey, 2014).
New York City has had more renters than homeowners for the last decade, with renters
comprising between 66 and 69 percent of the population from 2006 to 2014. This is
significantly higher than the United States average of around 36 percent during the
same period.
While the majority of New York’s population is living in rental housing, renting an
apartment in New York City can be difficult to afford. In 2014, the city’s median gross
rent was $1,234, about $300 more than the median gross rent at the national level.
About 15 percent of the City’s rental units had a gross rent of less than $800, while 46
percent had a gross rent in the $800 and $1,499 range. 39 percent of rental units cost
more than $1,500 per month (Housing and Vacancy Survey, 2014). In inflation adjusted
terms, the median gross rent rose by 4.3 percent from 2011 to 2014. Because many

5
renters live in rent-stabilized apartments, receive rent subsidies, or pay lower rates as a
result of long-term tenancy, the median gross rent paid by all renters does not
accurately reflect the current landscape for new rental unit seekers in the city (New York
City Rent Guidelines Board, 2015). The median asking rent of apartments advertised for
rent on StreetEasy in 2013 was $2,900—more than double the median rent paid by all
New Yorkers.
Looking at median household income helps us to see population’s purchasing power for
rental housing. The median renter income in 2014 was $41,060. Applying the 30
percent of income threshold, units have to be below $1,026 to be affordable for
households earning the median renter income. The actual median gross rent in 2014
was $1,234, about $200 more than the affordability threshold (Housing and Vacancy
Survey, 2013). From 2006 to 2014, rent increases far outpaced income growth, with
median rent increasing by 12 percent while median renter income increasing by only 2.3
percent. Rental prices surged while median renter income remained stagnant.
Rental housing demand is usually measured by vacancy rate, and New York City’s
vacancy rate has always remained very low. As of 2014, 3.9 percent of rental units were
vacant. With little exception it has been below 4 percent from 2005 to 2014, well below
the 5 percent threshold required for rent regulation under New York State law. As of
2014, the rental vacancy rate in Manhattan was found to be 4.07 percent. The Vacancy
rate in the Bronx was 3.77 percent, while in Brooklyn it was 3.06 percent. In Queens the
rental vacancy rate was only 2.69 percent (Housing and Vacancy Survey, 2014). The

6
rental vacancy rate translated into the availability of just 81,632 vacant units out of 2.1
million rental units in the city.
RENTAL HOUSING SUPPLY
While demand for rental units is very high, New York’s rental stock has grown more
slowly than that of other major cities in the United States (NYU Furman Center, 2015).
In the 9 years between 2006 and 2014, the number of rental housing units in New York
increased by 5.5 percent. During the same period, the number of homeowner units
decreased by nearly as much—5.3 percent—implying that conversions from owner-
occupied units, rather than new construction, might account for much of the increase in
rental units.
The number of permits issued for new housing construction reflects the new dwelling
units that will be completed and ready for occupancy in the near future. The number of
permits issued by the city has increased since their dramatic recession in 2009, but
have not yet returned to the pre-recession levels of 2008. In 2014, permits were issued
for 20,483 new housing units, a 14 percent increase from the 17,995 units in 2013.
Despite five years of consecutive increases, permit levels are still more than 13,000
units lower than the 2008 peak of 33,500 (U.S. Census Bureau). Almost 91 percent of
all permits in 2014 were for units in five-family or greater buildings. Such multi-family
buildings contain 45 units on average for the city as a whole, and 80 units on average in
Manhattan. In 2014, 11,867 new housing units actually entered the rental housing

7
market (New York City Department of City Planning, 2015). The addition of these units
increased the existing rental housing stock by less than 0.5 percent.
RENT STABILIZATION
New York City has attempted to regulate rent prices through various measures,
including rent stabilization, which is unusual in the United States. Rent Stabilization is a
New York State law that restricts how much rent for certain residential housing units can
increase annually. The law applies to buildings constructed before 1974 that have six or
more units. Rent stabilization was adopted to protect renters from abrupt increase in
rents and to protect their right to renew their leases. In 2011, about 1 million units—
roughly 45 percent—of New York City’s rental housing stock were rent stabilized. By
2014, there were slightly more than 1 million rent-stabilized units, comprising 47 percent
of the rental stock (Housing Vacancy Survey, 2014). About 30 percent of rent stabilized
units were located in Brooklyn, 28 percent in Manhattan, 23 percent in the Bronx, 19
percent in Queens, and less than 1 percent in Staten Island (NYU Furman Center,
2014).
2.2. HOME SHARING
SHARING ECONOMY AND HOME SHARING
While demand for housing already far outpaces supply and the city government fighting
to make rental units more affordable, the new platforms for home-sharing have further

8
complicated the rental market. Home-sharing platforms have expanded the use of rental
apartments as temporary lodging for tourists. The search technologies used by such
platforms have made it easier for unit providers and unit seekers to connect, simplifying
the allocation and capitalization of an otherwise idle asset (Sundararajan, 2015). As a
result, more lucrative options are now within reach for providers of rent stabilized
housing units. Converting long-term rentals into short-term rentals enables landlords to
capture full-market rent rates from less price sensitive tourists who are generally willing
to pay more for a for short period of time. The spoils of the home sharing economy go
solely to its participants, while non-participants are left to suffer its negative effects on
the traditional rental market.
AIRBNB
This paper specifically focuses on Airbnb. There have been many companies facilitating
short-term housing rentals before Airbnb entered the market. However, since its
founding in 2008, Airbnb has quickly grown to become the most dominant player in the
industry, with over 1 million listings in 34,000 cities and 190 countries worldwide
(Airbnb). Airbnb was introduced in New York City in 2009, and as of February 2016, the
total number of listings in the city was nearly 36,000.
Airbnb provides a digital digital platform that facilitates the exchange of short-term
housing between hosts and guests. Hosts can be property owners, leaseholders, or a
management company working on behalf of the property owner. Hosts can list three

9
different types of units on Airbnb: entire homes, private rooms, and shared rooms. For
an entire home or apartment, the guest is renting the entire space, and the host is not
present in the unit. For private room rentals, the guest is using a room with some
degree of privacy within a host’s home or apartment. The host is present in the unit
during the stay. For shared rooms, the guest is using the same living space as the host.
Airbnb generates revenue by charging hosts a three percent commission and by
charging guests a six to twelve percent commission, thus generating a nine to fifteen
percent commission for every booking.
Positively reframing perceptions about participating in the home sharing economy has
been critical to Airbnb’s explosive growth. The rating and review systems they provide
enable hosts and guests to publicly share information about one another, which allows
for some degree of screening to take place, and helps to build trust between
participants and the service itself (Lewyn, 2015).
2.3. SUPPORTERS AND CRITICS OF AIRBNB
Short-term rentals provide new supplemental income for hosts. Renting out spaces can
drive up the host’s ability to afford housing costs. Moreover, expanded purchasing
power can provide hosts with more housing options and increase their ability to move to
better rental housing. A survey of 344 hosts conducted by Airbnb found that 56 percent
of hosts did in fact use income from rentals listed on the service to pay for part of their
rent or mortgage. Other supporters of short-term rentals have said that their hosting

10
business allows them to afford the cost of living expenses in New York City (Sperling,
2015). A 2013 survey by Rosen Consulting Group found that 42 percent of Airbnb users
reported using short-term rental income to supplement living expenses. However, it is
rather difficult to evaluate to what degree extra income from home sharing supports
housing costs.
On the other hand, some argue that short-term rentals exacerbate the city’s already-
acute housing shortage by offering more profitable alternatives to the traditional long-
term housing market. Short-term rental platforms may deprive renter populations of
available rental housing and encourage landlords to evict current tenants. The most
common argument against Airbnb is that making short-term lodging more approachable
reduces the supply of apartments that are usually leased for a month or more at a time.
The argument continues that units listed on Airbnb for a few days at a time would, in the
absence of Airbnb, be rented out as traditional apartments. Therefore, Airbnb reduces
the housing supply and raises rents. However, it is also difficult to determine if units that
are currently rented out using Airbnb used to be long-term rental housing or merely
vacant units used for recreational or other purposes before.
3. LITERATURE REVIEW
3.1. RENTS INCREASE
11
Some of the prime neighborhoods in New York City have several hundred Airbnb
rentals. While a few hundred units may not sound like much, it is enough to significantly
impact neighborhood rent prices. A quantifiable relationship has been identified
between changes in total rental inventory and changes in neighborhood rental costs
(Ellen, 2015). In New York, for every 0.5 percent that rental supply contracts, rent rises
by 1 percent. If a rental market consists of 1,000 units with a median price of $1,000 per
month, removing 50 of those units increases median rent in that market by $100, to
$1,100 on average.
The study exemplified the Airbnb units in Williamsburg and Greenpoint. In 2015, Airbnb
units represented around 0.6 to 1.15 percent of the total rental housing stock in these
neighborhoods respectively. Removing that percentage of units elevates median rent by
around 1.2 and 2.3 percent. Based on the claim of this study, if those units were instead
listed on the long-term rental market, neighborhood monthly median asking rent,
$3,055, according to StreetEasy, would be around $35 and $69 lower, respectively.
However, this study connects the supply of rental housing with rent increases rather too
directly without any controls.
Airbnb rentals slightly drive up rents in some prime neighborhoods in major cities
(Davidoff, 2015). It was mentioned that Airbnb “increase[s] the price of a one-bedroom
unit by about $6 a month.” Specifically, in San Francisco, it “increase[s] rent by on average
about $19 a month.” To come up with this estimates, he did not take into account units
that locals can still live in long-term. With the assumption that all listings are renting out

12
solely on Airbnb, in New York, rent would go up around $24 a month. Importance of
dividing listings by possibility of being used as a long-term rentals or solely as short-term
rentals.
According to his findings, listings are not evenly distributed and tend to be clustered in
prime neighborhoods. This implies that popular neighborhoods attract more Airbnb
rentals and this causes more pressure on rents in such neighborhoods. Airbnb is less
an issue of citywide affordability than it is of people’s right to stay in desirable
neighborhoods. Thus Airbnb is affecting housing affordability in New York City’s most
desirable neighborhoods, not throughout the city. This paper hopes to evaluate this
claim by looking at gross rents before and after the emergence of Airbnb.
3.2. RENTER EVICTIONS
LAANE, a union-affiliated policy organization based in Los Angeles, issued a report in
2015 claiming that Airbnb removes 7,316 units from the Los Angeles rental market. This
“is equivalent to seven years of affordable housing construction in Los Angeles”
(Samaan, 2015). Considering that Los Angeles provides little in terms of affordable
housing, this argument might not be very meaningful. The report also pointed out that
Airbnb creates incentives to take units off the rental market. The study exemplified the
Morrison Apartments in Venice Beach, a complex with 21 units covered by the City of
Los Angeles Rent Stabilization Ordinances. Coldwell Banker Commercial (CBC) listed
the Morrison for sale and suggested converting the Morrison to Airbnb rentals as the

13
prudent financial choice for its future owners. CBC estimated that a landlord could earn
about $200,000 in annual income by renting the rent-controlled units out on the market.
Converting the building to Airbnb units could bring more than $477,000 per year,
assuming the 2014 United States hotel occupancy rate of 67 percent. LAANE showed
concern that this new potential income stream may stimulate rental unit conversions.
Moreover, according to the report prepared by San Francisco Budget and Legislative
Analyst, approximately 71.9 percent of San Francisco’s rental stock is rent stabilized
below market rate. Rental rates in San Francisco have been increasing so rapidly over
the past few years that some landlords have been inclined to evict their tenants to
capture full market value. The report continues that Airbnb creates additional incentives
for the higher revenue for landlords. The San Francisco Rent Board reported that
notices of eviction increased from 2,039 to 2,789—or 37 percent—between 2011 and
2014. The Rent Board did not track what happened to units after evictions occurred, so
it is difficult to determine how many evictions resulted in housing units being converted
to short-term rentals.
3.3. DISTINGUISHING CASUAL AND COMMERCIAL LISTINGS
The City and County of San Francisco conducted the impact of Airbnb by creating three
scenarios based on the severity of its impact on rental housing market (San Francisco
Budget and Legislative Analyst's’ Office, 2015). Estimates of these three scenarios are

14
prepared using different assumptions about bookings and the thresholds that
distinguishes causal and commercial short-term rentals.
Casual hosts are defined as those who occasionally make their place available for
short-term rentals for extra income. In the case of renting a room where they live, casual
hosts would not need or choose to have a roommate. The Budget and Legislative
Analyst concluded that casual hosts are assumed not to be affecting the rental housing
market because they would continue to live in their apartment in the absence of the
short-term rental market.
Commercial hosts are defined as those who do not live in their unit and rent it out as a
means of generating income. The report says that in the absence of the short-term
rental market, they would be living in the unit themselves, placing the unit on the long-
term rental market, or getting roommates. The Budget and Legislative Analyst
concluded that commercial hosts are assumed to be removing rental housing units that
would otherwise be available for the long-term rental market.
Three scenarios were developed with variations in assumptions. The medium impact
scenario was the primary scenario and presented as the main analysis in the report.
This scenario applied a threshold of 90 days or more for commercial hosts. While all
scenarios showed an impact on the rental housing market, especially in certain
neighborhoods, the impact varies lower to medium to higher.

15
4. AIRBNB SHORT-TERM RENTALS IN NEW YORK CITY
4.1. AIRBNB UNITS FOR THE STUDY
In this study, Airbnb units that are listed as an entire apartment with high availability are
considered to have impact on the rental housing market because they have a greater
chance of displacing renter housing units. High availability in this paper will be defined
as 90 days or more per year, the most conservative approach in the City and County of
San Francisco study. Airbnb units that are listed as entire apartments with availability of
more than 90 days per year are assumed to be removing housing units otherwise
available for the long-term rental market.
As of February 2016, there were 35,957 Airbnb rentals listed in New York City. Of
those, 53.6 percent were listed as an entire apartment, and 43.4 percent were listed as
private units. More than 60 percent of the total Airbnb listings in the city are rented out

16
more than 90 days per year, and more than 30 percent were rented out for more than 3
months per year.
4.2. NUMBER IS INCREASING
The number of Airbnb listings has increased gradually since 2009. As of February 2016,
the inventory is almost equivalent to the number of rental units supplied from new
constructions in 2013 and 2014 combined. The share of short-term rentals that are
listed as entire units and rented more than 90 days a year was 10,818, which is 30
percent of all Airbnb units. The share was around 38 percent up until 2010. It has been
slowly decreasing as years go by and in 2015, it was around 30 percent of total listings.
Surely Airbnb units have been increasing in numbers, the growth rate has been
decreasing over time. From 2009 to 2011, the number increased by 10 times, from 2011

17
to 2013, the number increased by 3 times, and from 2013 to 2015, number increased by
70 percent. Within 7 years, it has reached to 10,181 units by February 2016. This takes
up 0.5 percent of the total rental housing stock in New York City. For now, portion that
short-term rental takes up from traditional apartment unit seems quite small. The
number is increasing but the pace is getting slower.
4.3. IN MANHATTAN AND BROOKLYN
Entire unit Airbnb rental properties are highly concentrated in Manhattan and Brooklyn.
Out of 10,818 study units, Manhattan accounted for 6,340 Airbnb units, which is 58.6
percent, and Brooklyn accounted for 3,663 units, which is 33.86 percent. Together,
10,003 out of 10,818 units located in Manhattan and Brooklyn and this is over 90
percent of total number of listings. Among neighborhoods in Manhattan and Brooklyn, it
is apparent that most of the Airbnb units are clustered in neighborhoods in lower
Manhattan and the northern part of Brooklyn.

18

19
Out of all 195 neighborhoods, there are five neighborhoods in New York with over 500
Airbnb short-term rental units. The West Village contains more than 600 Airbnb units.
North Side - South Side is the only neighborhood located in Brooklyn on the list. Due to
its relatively smaller rental housing stock, the proportion of Airbnb units to total rental
housing stocks were highest among neighborhoods over 500 or more short-term
rentals. Hudson Yards - Chelsea - Flatiron - Union Square, East Village, and Clinton,
neighborhoods that are located in mid- and lower Manhattan had over 500 Airbnb units
in the neighborhood. Units that are located in these five areas takes up 25 percent of
total number of the short-term rental listings.

20
4.4. MOSTLY 1 BEDROOM APARTMENTS
The most prominent type of short-term rental was multi-family residential in the form of
apartments. 9,690 out of 10,818 units were located in apartments, accounting for nearly
90 percent of the total number of listings. Multi-family housing tends to have higher renter
share than other types. Moreover, it is illegal to rent multi-family homes for less than 30
21
days while the owner is not present in the unit by the state law. Considering this, most of
the study units are outlawed. Over the half of the listings were with 1 bedroom. Combined
with studio and 2 bedrooms, it takes up more than 90 percent of the total listings.
Considering that most newly built residential buildings in New York City are multi-family,
with 45 units on average, new supply of rental housing has higher probability to be taken
off from long-term rental market (New York City Rent Regulation Board, 2014).
4.5. INCENTIVE EXISTS
With the assumption of 67 percent occupancy rate from the LAANE’s study, I compare
the listing prices and median asked rents from StreetEasy since comparing listing prices
with median gross rents does not reflect hosts’ present financial incentives (See
Appenix B). In most neighborhoods, it is financially more lucrative to rent an apartment
out as Airbnb units than as a long-term rental. Homeowners would earn 921 dollars per
month per unit on average. Clinton Hill, Brooklyn was the most profitable neighborhood,
earning an additional 2,335 dollars per month per unit, and Midtown, SoHo-TriBeCa-
Civic Center-Little Italy, Upper East Side followed with more than 2,000 additional
dollars per month per unit. For most of New York City, there are financial incentives for
landlords to convert their units into short-term rentals.

22
5. RESEARCH DESIGN
In determining whether Airbnb units affects the rental housing market in New York City,
this paper attempts to test the following hypotheses: 1) Airbnb units increase rents on
the long-term housing market, 2) Airbnb units exacerbate the rent burden of the renter
population, 3) Airbnb units cause renter eviction and 4) Airbnb units deplete rental
housing stocks. These hypotheses were tested with difference-in-differences
estimations and regressions looking at two different groups in two different times.
5.1. DIFFERENCE-IN-DIFFERENCES
This paper hopes to evaluate the impact of Airbnb on New York’s rental housing market
by looking at two different groups in two different times. There are two neighborhood
groups divided by treatment status, Treat = 0,1 where 0 indicates neighborhoods that do
not receive treatment, i.e. the control group, and 1 indicates neighborhoods that receive
treatment, i.e. the treatment group. Treatment group is the neighborhoods with Airbnb
units more than 1 percent of its rental housing stocks and control group is the
neighborhoods without any Airbnb units. Treatment and control groups are shown in
Figure 2.

23
There are two different time periods, Post = 0,1 where 0 indicates a time period before
the treatment group receives treatment, i.e. pre-treatment, and 1 indicates a time period
after the treatment group receives treatment, i.e. post-treatment. Since Airbnb was

24
introduced to the market in 2009, the study looks at the value before and after 2009,
more specifically value in 2009 and in 2014.
Difference-in-differences estimation uses four points to deduce the impact of a
treatment on the treatment group. Four data points are the averages of the outcome for
the treatment group before and after treatment, the corresponding averages of the
outcome for the control group. The outcome is modeled by the following equation.
Yit = a + b Treati + c Postt + d(Treati * Postt) + eit

25
Based on this equation, observed average of the control group in 2009 is a, which is a
constant term. Observed average of the control group in 2014 is a + c. c is time trend
common to both control and treatment groups. Observed average of the treatment
group in 2009 is a + b. b is a treatment specific effect and this is to account for average
permanent difference between treatment and control groups. Observed average of the
treatment group in 2014 is a + b + c + d. d is the true effect of treatment.
Neighborhood [Y00] = a Neighborhood [Y01] = a + c Neighborhood [Y10] = a + b Neighborhood [Y11] = a + b + c + d Neighborhood ( [Y11] - [Y10] ) - ( [Y01] - [Y00] ) = d

26
The difference-in-differences estimator is defined as the difference in average outcome
in the treatment group before and after treatment deducted by the difference in average
outcome in the control group before and after treatment.
5.3. PARALLEL TREND ASSUMPTION
Difference-in-differences assumes parallel trends in the dependent variable. It assumes
that without treatment, the average change for the treated would have been equal to the
observed average change for the controls. It is often difficult and sometimes impossible
to check the assumptions in the model as they are often unobservable quantities. One
of the most common problem with difference-in-differences estimates is the failure of
parallel assumption. This happens when there is a different trend for the treatment and
control group. If the control group has a time trend of c, while the treatment group has a
trend of c+Δ, the difference-in-differences estimator will be biased as d+Δ. The failure of
the parallel trend assumption is a relatively common problem in many studies, causing
many difference-in-differences estimators to be biased. One way to avoid these problem
is to get more data on other time periods before treatment to see if there are any other
existing differences in trends. This paper examines existing differences in trends by
looking at average values of dependent variables in 2000.

27
5.2. VARIABLES
DUMMIES
Treatment group is neighborhoods that are with Airbnb units more than 1 percent of
their total rental stocks. Control group is neighborhoods that are without any Airbnb
units. Before treatment will be variables in 2009 when Airbnb was first introduced in
New York City. After treatment will be variables in 2014. Airbnb effect is an interaction
term of post and treat dummies. This variable gives us the change in dependent
variables that seems to be occurred due to increase in Airbnb units.

28
RENT
Gross rent is the monthly amount of rent that includes the estimated average monthly
cost of utilities and fuel (U.S. Census Bureau, 2013). This variable was taken into
consideration since it gives an immediate sense that if the treatment has correlation with
rent increase. Looking at gross rents in two different neighborhoods in two different
times would make it possible to prove Thomas Davidoff’s claim: Airbnb rentals pushes
up rent in prime neighborhoods.
RENTINC
Gross rent as a percentage of income is the ratio of gross rent to household income. It
is used as a measure of housing affordability. It is often referred to as a housing cost
burden (U.S. Census Bureau, 2013). This variable was considered since gross rent
variable alone does not cover income status of households in the neighborhood. This
variable will make it possible to look at rent increase compared to the household income
and help us to verify if Airbnb intervention impinge on housing affordability in the
neighborhood.
RENTOCCU
Rental occupancy rate is the proportion of the renter-occupied housing units. It is
computed by dividing the number of renter-occupied housing units by the total occupied
housing units, and then multiplying by 100 (U.S. Census Bureau, 2013). This variable
was considered to verify if increase in number of Airbnb units in the neighborhoods
drive renter households out and to find any signs or evidence of renter evictions.

29
RENTVACA
Rental vacancy rate is defined as the proportion of the rental inventory that is vacant
and “for rent.” It is computed by dividing the number of vacant units “for rent” by the sum
of renter-occupied units, vacant units “for rent”, and vacant units that have been rented
but not yet occupied, and then multiplying by 100 (U.S. Census Bureau, 2013). This
variable was to measure if short-term lodgings lead to decrease in rental vacancy rate
and make rental housing market even tighter than before.
5.4. DATA
Data regarding Airbnb listings in New York City was gathered from Inside Airbnb,
scraped on February 2016 by technology professional Murray Fox. Murray Cox is a
community activist based in New York City who utilizes his technology skills for various
nonprofits and community groups. Webscrapes extract and compile data from the
public-facing websites and allow for analysis that would otherwise not be able or
practical to conduct using a standard browser. The database provides comprehensive
collection of data on short-term rental listings registered from June 2008 to February
2016.
Every Airbnb listing locations was provided with xy coordinates. Airbnb units were
counted by Neighborhood Tabulation Areas (NTAs) and Census Tracts by using spatial
join in ArcGIS. Location points were mostly accurate but the short-term lodging
company intentionally added faulty points and removed some of entire home/apt listings

30
in Manhattan (Cox & Slee, 2016). Fault points were not eliminated in analyses and
instead, added in the neighborhoods in which they were specified in street and city
column in the dataset.
I used NTA boundaries to choose control and treatment group, and actual difference-in-
differences were conducted in census tract level. This is because census tract
boundaries had changed in 2010. Neighborhood Tabulation Areas, or NTAs, are
aggregations of census tracts that are subsets of New York City’s 55 Public Use
Microdata Areas, or PUMAs (New York City Department of City Planning). By using
NTA boundaries, it was able to conduct regression capturing same geographical area
before and after 2010. But due to PUMA constraints, NTA boundaries and their names
may not definitely represent traditionally perceived neighborhoods.
I used secondary data for median gross rent, median household income, total occupied
units, renter occupied units, units that are vacant for rent. It was provided by U.S.
Census Bureau, 2005-2009 and 2010-2014 5-year American Community Survey. All
data are gathered and compiled in census tract level. Since ACS 5-years estimates are
based on data collected from 2010 to 2014, that covers most of the time periods that
Airbnb was present in NYC, it has limitation to capture abrupt change in values after the
Airbnb treatment. It would have been easier to capture change in values with 1-year or
3-years estimates. However, the unit of analysis of the study was the census tract level,
which was only available in 5-years estimates.

31
6. ANALYSIS
6.1. MEDIAN GROSS RENT
RENTit = 1,085.54 + 317.23 Treati + 79.04 Postt + 77.04 (Treati * Postt) + εit
Median gross rent in control group in 2009 was 1,085.54 dollars and it increased 79.04
dollars by 2014. This implies that all neighborhood groups regardless of Airbnb
treatment faced rent increase by about 79 dollars during five years of time. The initial
difference in median gross rents between control and treatment neighborhood was
317.23 dollars in 2009. This assumes that rents in neighborhood with Airbnb units tend
to be 317.23 dollars more expensive constantly over time. In 2014, the difference in
32
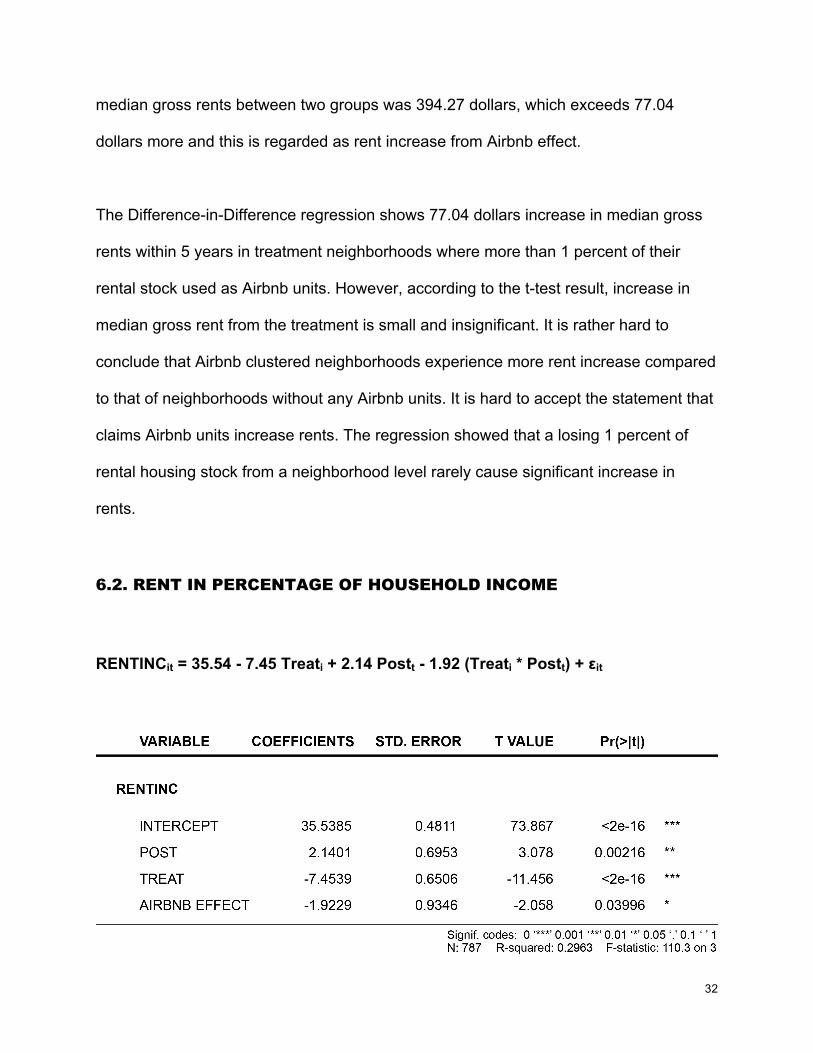
median gross rents between two groups was 394.27 dollars, which exceeds 77.04
dollars more and this is regarded as rent increase from Airbnb effect.
The Difference-in-Difference regression shows 77.04 dollars increase in median gross
rents within 5 years in treatment neighborhoods where more than 1 percent of their
rental stock used as Airbnb units. However, according to the t-test result, increase in
median gross rent from the treatment is small and insignificant. It is rather hard to
conclude that Airbnb clustered neighborhoods experience more rent increase compared
to that of neighborhoods without any Airbnb units. It is hard to accept the statement that
claims Airbnb units increase rents. The regression showed that a losing 1 percent of
rental housing stock from a neighborhood level rarely cause significant increase in
rents.
6.2. RENT IN PERCENTAGE OF HOUSEHOLD INCOME
RENTINCit = 35.54 - 7.45 Treati + 2.14 Postt - 1.92 (Treati * Postt) + εit

33
Rent in percentage of household income in control group was 35.54 percent in 2009. It
increased by 2.14 percentage point in 2014. This implies that households in all
neighborhood groups regardless of Airbnb treatment resulted in spending 2.14 percent
more of their income on rents than before. In 2009, Airbnb-clustered neighborhoods
tend to spend 7.45 percentage point less on housing compared to neighborhoods
without Airbnb units. This tells us that households in treatment neighborhoods tend to
spend less portion of their income on rents constantly over time. Considering that
households in treatment neighborhood pay about 317 dollars more than those in control
group, renter households in treated neighborhoods seem to have higher income than
renters in controlled neighborhoods. Regression result shows that in 2014, the
difference between two groups was about -9.37 percentage point and additional -1.92
percentage point difference is stemmed from 1 percent of rental housing stock used as
Airbnb units.
The Difference-in-Differences regression displays that households in treatment
neighborhood spent 1.92 percentage point less of their income on housing in 2014. The
alleviation in rental cost was statistically significant with 99 percent confidence level.
With this result, it is hard to prove the claim that Airbnb units exacerbate rent burden on

34
renter population. However, this can be also interpreted as renter households’ having
additional income source through renting their unit out to home-sharing platforms and
alleviate their rental cost.
From 2000 to 2009, rent in percentage of household income in treated and controlled
neighborhood showed different trends. Before 2009, rent burden on households in
controlled group deteriorated faster than those in treated group. However, after 2009,
after Airbnb treatment, the trend between two groups became relatively parallel.
6.3. RENTER OCCUPANCY RATE
RENTOCCUit = 68.86 + 6.44 Treati - 0.06 Postt - 0.38 (Treati * Postt) + εit

35
Renter occupancy rate in control group was 68.86 percent in 2009. It decreased by 0.06
percentage point in 2014. This year effect explains 0.06 percentage point change within
5 years in renter occupancy rate in all neighborhood groups. The initial difference in
renter occupancy rate between control and treatment neighborhood was 6.44 percent,
that is to say, renter occupancy rate in treated neighborhood was 75.29 percent in 2009.
This neighborhood effect describes that renter occupancy rate in neighborhood with
Airbnb units have tendency to have more share of renter population continually over
time by 6.44 percentage point. In 2014, the difference in renter occupancy rate between
two groups was 6.06 percentage point, and that fell 0.37 percentage point short of
expected renter occupancy rate. This amount is considered to be correlated with Airbnb
units comprising more than 1 percent of neighborhoods’ rental housing stock.
The Difference-in-Differences regression suggest that Airbnb cause 0.37 percentage
point decrease in the share of renter household within 5 years in treated neighborhoods.
In other words, 1 percent of rental supply contracts force out renter households by 0.37
percent. T-test reports that decrease in renter occupancy rate is negligible and
insignificant. This result refutes the claim that increase in Airbnb units accelerate renter
evictions in neighborhoods.

36
Parallel trends from 2000 to 2009 shows that renter occupancy rate decreased faster in
treated neighborhood. That is to say, until 2009, owner occupant housing units were
growing in treated neighborhood. However, after 2009, the trend between two groups
became relatively parallel.
6.4. RENTAL VACANCY RATE
RENTVACAit = 4.47 - 0.67 Treati - 2.47 Postt + 2.57 (Treati * Postt) + εit

37
Rental vacancy rate in controlled neighborhood was 4.46 percent in 2009. It decreased
by 2.47 percentage point, to 1.99 percent within 5 years. This year effect suggests that
regardless of Airbnb units presenting in rental housing stocks, both controlled and
treated neighborhood groups were assumed to undergo shrinkage in rental vacancy
rate. The gap between two neighborhood groups was -0.67 percentage point in 2009.
This explains that rental vacancy rate in treated neighborhood was 3.8 percent in 2009.
Rental vacancy rate in the neighborhood where 1 percent of rental inventory is taken
over by Airbnb rentals tend to have lower rental vacancy rate by 0.67 percent. In 2014,
the difference in rental vacancy rate between two groups was 1.9 percentage point, that
outpaced point expected rental vacancy rate by 2.57 percentage point. This difference
is considered to be derived from Airbnb units comprising more than 1 percent of
neighborhoods’ rental housing inventory.
The Difference-in-Differences regression suggest that Airbnb cause 2.57 percentage
point increase in rental vacancy rate within 5 years in treated neighborhoods. That is, 1
percent of rental supply contractions creates more vacant units by 2.57 percentage
point. According to T-test, this result is statistically significant. This may sound
counterintuitive to most people who support anti-Airbnb arguments who thought
vacancy rate would fall.

38
7. LIMITATIONS AND IMPLICATIONS
Difference-in-differences analysis showed a lack of correlation between increases in the
number of Airbnb units and increases in rent. Even though rents did not surge in the
treated neighborhoods, rent as in percentage of household income shrunk by about 2
percent. This indicates that renter households’ income after housing cost increased in
treated neighborhoods. This shows that Airbnb’s presence has not influenced the
affordability of rental housing in New York City. It is either household income in the
treated neighborhoods increased more then rent did, or Airbnb-generated income might
have played a bigger role in these neighborhoods. The share of renter population
slightly decreased in Airbnb-popular neighborhoods but it was hard to find strong
evidence of renter evictions in those neighborhoods. In the 5 years Airbnb has operated
in New York, the rental vacancy rate has increased by 2.57 percent. This suggest that
neighborhoods with Airbnb units tend to have more vacant units for rent. The increase
in vacancy rate does not support the argument that home-sharing platforms make the
rental housing market tighter.
Initially, I looked at the rental vacancy rate to see if Airbnb is making therental housing
market tighter by removing rental units from the market. However, based on my initial
the results, I could see that it is not possible to measure the tightness of the rental
housing market using the conventional rental vacancy rate method. It was perplexing to
find the rental vacancy rate in the most desirable neighborhoods to be above the city
wide average rental vacancy rate. One explanation is that landowners are habitually

39
answering “vacant for rent” on the surveys while making their properties permanently
available on Airbnb or other home sharing platforms.
It is still uncertain how vacant units that are rented out as short-term rentals are
classified by the US Census Bureau. ACS 5-Year Estimates divide vacancy status into
several categories: vacant for rent;; rented but not occupied;; for sale;; sold but not
occupied;; for seasonal, recreational, or occasional use;; and other vacant. In treated
neighborhoods, the share of units categorized as vacant for rent increased significantly.
It is possible that this class contains many Airbnb units. Owners may be creating
permanently vacant rental units by classifying them as vacant for rent becuase ACS
does not provide a clear categorization for short-term rental units.
Even though difference-in-differences analysis suggests Airbnb is not disrupting New
York City’s rental housing market, Airbnb should be monitored. Airbnb has only
operated in New York City since 2009, and already taking up 0.5 percent of its rental
housing stock. It is possible that the critical mass needed to effect the rental housing
market has not be yet been reached. Moreover, the time in which Airbnb was introduced
was amid the chaos following the economic panic caused by the subprime mortgage
crisis of 2008. This intervention to the rental housing market might be strongly reflected
in the analysis results. The financial incentives persist for people to take units off of the
rental market, and the number is growing, especially in Manhattan and Brooklyn. If more
units are added to those neighborhoods in long term, the same analysis may be
capable of distilling the effects of Airbnb from those of the subprime mortgage crisis.

40
8. REFERENCES
Angrist, J., & Pischke, J. (2014). Mastering 'metrics: The Path from Cause to Effect. Card, D., & Krueger, A. (2000). Minimum Wages and Employment: A Case Study of the Fast-Food
Industry in New Jersey and Pennsylvania: Reply. American Economic Review, 90(5), 1397-1420. http://dx.doi.org/10.1257/aer.90.5.1397
City Council City of New York,. (2015). Transcript of the Minutes of the Committee on Housing and
Buildings. New York: City Council City of New York. Clampet, J. (2015). Airbnb In NYC: The Real Numbers Behind The Sharing Story. Skift. Retrieved from
http://skift.com/2014/02/13/airbnb-in-nyc-the-real-numbers-behind-the-sharingstory Cox, M., & Slee, T. (2016). How Airbnb’s Data Hid the Facts in New York City. New York: InsideAirbnb.
Retrieved from http://insideairbnb.com/reports/how-airbnbs-data-hid-the-facts-in-new-york-city.pdf Ellen, I. (2015). Housing, Neighborhoods, and Opportunity: The Location of New York City’s Subsidized
Affordable Housing. New York: School of Law, Wagner School of Public Service, New York University.
Ellen, I., & Karfunkel, B. (2015). Renting in America’s Largest Cities: NYU Furman Center/Capital One
National Affordable Rental Housing Landscape. New York. Freeman, L. (2012). The impact of source of income laws on voucher utilization. Housing Policy Debate,
22(2), 297-318. http://dx.doi.org/10.1080/10511482.2011.648210 Galster, G., Tatian, P., & Accordino, J. (2006). Targeting Investments for Neighborhood Revitalization.
Journal Of The American Planning Association, 72(4), 457-474. http://dx.doi.org/10.1080/01944360608976766
Gelina, N. (2015). Airbnb Is a Problem for Cities Like New York and San Francisco. New York Times.
Retrieved from http://www.nytimes.com/roomfordebate/2015/06/16/san-francisco-and-new-york-weigh-airbnbs-effect-on-rent/airbnb-is-a-problem-for-cities-like-new-york-and-san-francisco
Gaumer, E. (2015). Selected Initial Findings of the 2014 New York City Housing and Vacancy Survey.
New York: New York City Department of Housing Preservation and Development. Kusisto, L. (2015). Airbnb Pushes Up Apartment Rents Slightly, Study Says. Wall Street Journal.
Retrieved from http://blogs.wsj.com/developments/2015/03/30/airbnb-pushes-upapartment-rents-slightly-study-says/?mod=WSJBlog
Lewyn, M. (2015). Airbnb and Affordable Housing. Planetizen. Retrieved from
http://www.planetizen.com/node/75968/airbnb-and-affordable-housing Marqusee, A. (2015). Airbnb and San Francisco: Descriptive Statistics and Academic Research. San
Francisco: San Francisco Planning Department.

41
New York City Rent Guidelines Board,. (2014). 2014 Housing Supply Report. New York: New York City Rent Guidelines Board. Retrieved from http://www.nycrgb.org/downloads/research/pdf_reports/14HSR.pdf
New York City Rent Guidelines Board,. (2014). 2014 Income and Affordability Study. New York: New York
City Rent Guidelines Board. Retrieved from http://www.nycrgb.org/downloads/research/pdf_reports/ia14.pdf
New York City Rent Guidelines Board,. (2015). 2015 Housing Supply Report. New York: New York City
Rent Guidelines Board. Retrieved from http://www.nycrgb.org/downloads/research/pdf_reports/15HSR.pdf
New York City Rent Guidelines Board,. (2016). 2015 Income and Affordability Study. New York: New York
City Rent Guidelines Board. Retrieved from http://www.nycrgb.org/downloads/research/pdf_reports/ia15.pdf
NYU Furman Center,. (2014). Profile of Rent-Stabilized Units and Tenants in New York City. New York:
School of Law, Wagner School of Public Service, New York University. NYU Furman Center,. (2014). State of New York City’s Housing and Neighborhoods in 2014. New York:
School of Law, Wagner School of Public Service, New York University. O'Brien, D. (2015). The Cheapest And Most Expensive NYC Neighborhoods For Renters This Fall.
Zumper. Retrieved from https://www.zumper.com/blog/2015/11/the-cheapest-and-mostexpensive-nyc-neighborhoods-for- renters-this-fall
Office of New York State Attorney General,. (2014). Airbnb in the City. New York: Office of New York
State Attorney General. Samaan, R. (2015). Airbnb, Rising Rent, and the Housing Crisis in Los Angeles.
(http://www.laane.org/wp-content/uploads/2015/03/AirBnB-Final.pdf). Los Angeles: LAANE. Samman, R. (2015). Short-Term Rentals and L.A.’s Lost Housing
(http://www.laane.org/wp-content/uploads/2015/08/Short-Term_RentalsLAs-Lost_Housing.pdf). Los Angeles: LAANE.
San Francisco Budget and Legislative Analyst's Office,. (2015). Analysis of the Impact of Short-Term
Rentals on Housing. San Francisco: San Francisco Budget and Legislative Analyst’s Office. San Francisco Planning Department,. (2015). Amendments Relating to Short-Term Rentals. San
Francisco: San Francisco Planning Department. Speri, A. (2014). Airbnb Will Probably Get You Evicted and Priced Out of the City. Vice News. Retrieved
from https://news.vice.com/article/airbnb-will-probably-get-you-evicted-and-priced-out-of-the-city Sperling, G. (2015). How Airbnb Combats Middle Class Income Stagnation. San Francisco: Airbnb. Sundararajan, A. (2013). From Zipcar to the Sharing Economy. Harvard Business Review. Sundararajan, A. (2015). Airbnb Is an Ally to Cities, Not an Adversary. New York Times. Retrieved from
http://www.nytimes.com/roomfordebate/2015/06/16/san-francisco-and-new-york-weigh-airbnbs-effect-on-rent/airbnb-is-an-ally-to-cities-not-an-adversary
42
U.S. Census Bureau. (2013). Rental Housing Market Condition Measure: A Comparison of U.S.
Metropolitan Areas from 2009 to 2011. Watson, S. (2015). Encourage the Use of Extra Space for Roommates. New York Times. Retrieved from
http://www.nytimes.com/roomfordebate/2015/06/16/san-francisco-and-new-york-weigh-airbnbs-effect-on-rent/encourage-the-use-of-extra-space-for-roommates

43
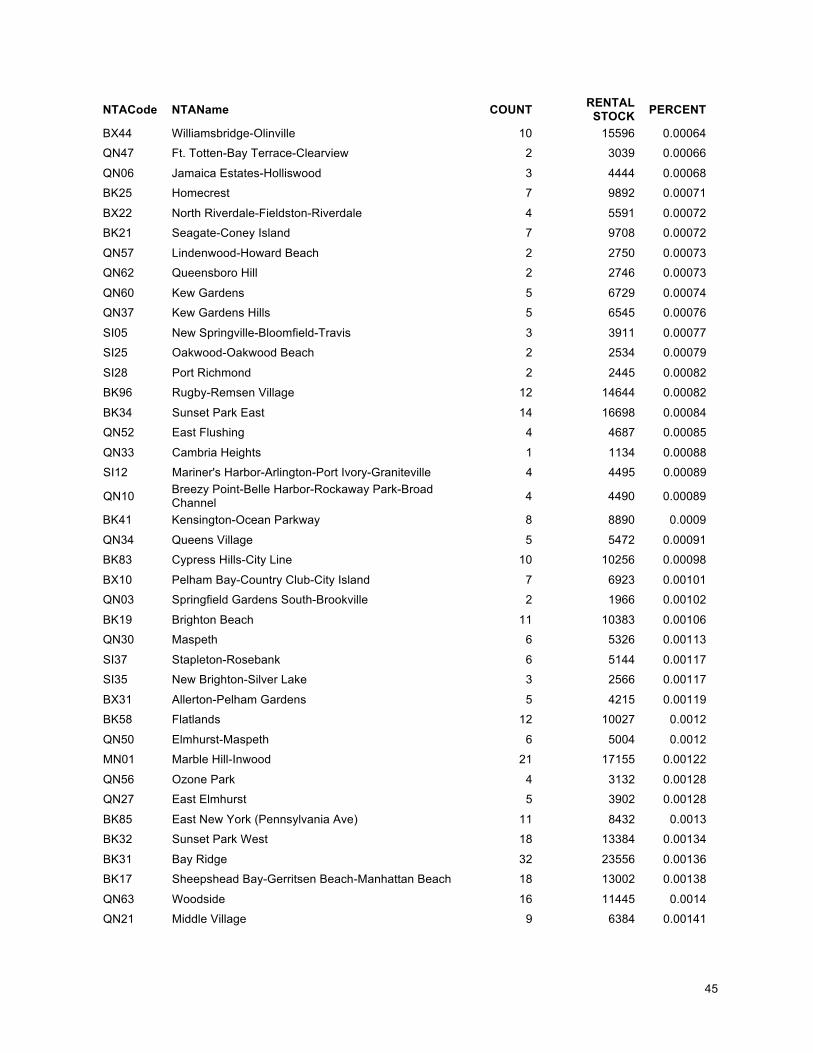
APPENDIX A – Airbnb units in Rental Stock
NTACode NTAName COUNT RENTAL STOCK PERCENT
BK93 Starrett City 0 6230 0 BX06 Belmont 0 8631 0 BX08 West Farms-Bronx River 0 10560 0 BX27 Hunts Point 0 8361 0 BX30 Kingsbridge Heights 0 9374 0 BX36 University Heights-Morris Heights 0 18175 0 BX40 Fordham South 0 8505 0
BX55 Soundview-Bruckner 0 9667 0
BX62 Woodlawn-Wakefield 0 8650 0 BX75 Crotona Park East 0 6693 0 QN07 Hollis 0 2770 0 QN19 Glendale 0 6420 0 QN44 Glen Oaks-Floral Park-New Hyde Park 0 2072 0 QN45 Douglas Manor-Douglaston-Little Neck 0 2315 0 QN48 Auburndale 0 2328 0 SI32 Rossville-Woodrow 0 1584 0 SI48 Arden Heights 0 1067 0 BX01 Claremont-Bathgate 1 10110 0 BX35 Morrisania-Melrose 1 12374 0 QN61 Jamaica 1 12389 0 BX26 Highbridge 1 12586 0 QN25 Corona 1 13260 0 BX17 East Tremont 1 13822 0 QN51 Murray Hill 1 9819 0.0001 BX41 Mount Hope 2 16840 0.00012 BX03 Eastchester-Edenwald-Baychester 1 7492 0.00013 QN01 South Jamaica 1 7062 0.00014 BX59 Westchester-Unionport 1 6795 0.00015 BK88 Borough Park 3 20011 0.00015 BX05 Bedford Park-Fordham North 3 18198 0.00016 BX14 East Concourse-Concourse Village 4 20222 0.0002 BX28 Van Cortlandt Village 3 15046 0.0002 BX46 Parkchester 2 9893 0.0002 BK29 Bensonhurst East 3 14497 0.00021 BK45 Georgetown-Marine Park-Bergen Beach-Mill Basin 1 4731 0.00021 QN53 Woodhaven 2 8686 0.00023 BK30 Dyker Heights 2 8290 0.00024 BX33 Longwood 2 8176 0.00024 BX07 Bronxdale 3 12200 0.00025

44
NTACode NTAName COUNT RENTAL STOCK PERCENT
BX13 Co-op City 3 11482 0.00026 QN22 Flushing 5 18992 0.00026 BK26 Gravesend 2 7521 0.00027 BX37 Van Nest-Morris Park-Westchester Square 2 7231 0.00028 QN26 North Corona 3 10300 0.00029 QN02 Springfield Gardens North 2 6775 0.0003 BK27 Bath Beach 2 6753 0.0003 QN49 Whitestone 1 3331 0.0003 QN15 Far Rockaway-Bayswater 4 12482 0.00032 QN42 Oakland Gardens 1 3096 0.00032 SI54 Great Kills 1 3020 0.00033 BX52 Schuylerville-Throgs Neck-Edgewater Park 3 8780 0.00034 QN55 South Ozone Park 3 8334 0.00036 BX09 Soundview-Castle Hill-Clason Point-Harding Park 5 13851 0.00036 BK44 Madison 3 8231 0.00036 BK81 Brownsville 7 18589 0.00038 SI24 Todt Hill-Emerson Hill-Heartland Village-Lighthouse Hill 1 2471 0.0004 SI07 Westerleigh 1 2461 0.00041 QN29 Elmhurst 9 21208 0.00042 SI08 Grymes Hill-Clifton-Fox Hills 2 4693 0.00043 QN43 Bellerose 1 2328 0.00043 BK23 West Brighton 2 4490 0.00045 QN35 Briarwood-Jamaica Hills 4 8844 0.00045 BX49 Pelham Parkway 4 8781 0.00046 SI01 Annadale-Huguenot-Prince's Bay-Eltingville 1 2194 0.00046 BX29 Spuyten Duyvil-Kingsbridge 4 8747 0.00046 BX34 Melrose South-Mott Haven North 6 13054 0.00046 BX43 Norwood 5 10672 0.00047 QN23 College Point 2 4245 0.00047 BX63 West Concourse 6 12727 0.00047 BK82 East New York 13 26390 0.00049 BK46 Ocean Parkway South 2 3944 0.00051 QN41 Fresh Meadows-Utopia 2 3725 0.00054 QN46 Bayside-Bayside Hills 3 5558 0.00054 BK43 Midwood 7 12848 0.00054 BK28 Bensonhurst West 11 20159 0.00055 QN38 Pomonok-Flushing Heights-Hillcrest 4 6752 0.00059 QN54 Richmond Hill 6 9888 0.00061 SI11 Charleston-Richmond Valley-Tottenville 1 1608 0.00062 BX39 Mott Haven-Port Morris 11 17497 0.00063
45
NTACode NTAName COUNT RENTAL STOCK PERCENT
BX44 Williamsbridge-Olinville 10 15596 0.00064 QN47 Ft. Totten-Bay Terrace-Clearview 2 3039 0.00066 QN06 Jamaica Estates-Holliswood 3 4444 0.00068 BK25 Homecrest 7 9892 0.00071 BX22 North Riverdale-Fieldston-Riverdale 4 5591 0.00072 BK21 Seagate-Coney Island 7 9708 0.00072 QN57 Lindenwood-Howard Beach 2 2750 0.00073 QN62 Queensboro Hill 2 2746 0.00073 QN60 Kew Gardens 5 6729 0.00074 QN37 Kew Gardens Hills 5 6545 0.00076 SI05 New Springville-Bloomfield-Travis 3 3911 0.00077 SI25 Oakwood-Oakwood Beach 2 2534 0.00079 SI28 Port Richmond 2 2445 0.00082 BK96 Rugby-Remsen Village 12 14644 0.00082 BK34 Sunset Park East 14 16698 0.00084 QN52 East Flushing 4 4687 0.00085 QN33 Cambria Heights 1 1134 0.00088 SI12 Mariner's Harbor-Arlington-Port Ivory-Graniteville 4 4495 0.00089
QN10 Breezy Point-Belle Harbor-Rockaway Park-Broad Channel 4 4490 0.00089
BK41 Kensington-Ocean Parkway 8 8890 0.0009 QN34 Queens Village 5 5472 0.00091 BK83 Cypress Hills-City Line 10 10256 0.00098 BX10 Pelham Bay-Country Club-City Island 7 6923 0.00101 QN03 Springfield Gardens South-Brookville 2 1966 0.00102 BK19 Brighton Beach 11 10383 0.00106 QN30 Maspeth 6 5326 0.00113 SI37 Stapleton-Rosebank 6 5144 0.00117 SI35 New Brighton-Silver Lake 3 2566 0.00117 BX31 Allerton-Pelham Gardens 5 4215 0.00119 BK58 Flatlands 12 10027 0.0012 QN50 Elmhurst-Maspeth 6 5004 0.0012 MN01 Marble Hill-Inwood 21 17155 0.00122 QN56 Ozone Park 4 3132 0.00128 QN27 East Elmhurst 5 3902 0.00128 BK85 East New York (Pennsylvania Ave) 11 8432 0.0013 BK32 Sunset Park West 18 13384 0.00134 BK31 Bay Ridge 32 23556 0.00136 BK17 Sheepshead Bay-Gerritsen Beach-Manhattan Beach 18 13002 0.00138 QN63 Woodside 16 11445 0.0014 QN21 Middle Village 9 6384 0.00141

46
NTACode NTAName COUNT RENTAL STOCK PERCENT
QN18 Rego Park 11 7713 0.00143 QN28 Jackson Heights 35 24483 0.00143 QN17 Forest Hills 31 21398 0.00145 BK50 Canarsie 22 14849 0.00148 SI36 Old Town-Dongan Hills-South Beach 5 3163 0.00158 QN08 St. Albans 8 4758 0.00168 BK91 East Flatbush-Farragut 17 9812 0.00173 QN05 Rosedale 5 2881 0.00174 BK72 Williamsburg 13 7244 0.00179 QN66 Laurelton 3 1648 0.00182 MN36 Washington Heights South 54 27505 0.00196 SI22 West New Brighton-New Brighton-St. George 18 7957 0.00226 QN12 Hammels-Arverne-Edgemere 22 9055 0.00243 SI45 New Dorp-Midland Beach 5 2057 0.00243 QN76 Baisley Park 10 4084 0.00245 SI14 Grasmere-Arrochar-Ft. Wadsworth 6 2434 0.00247 QN71 Old Astoria 25 10051 0.00249 BK42 Flatbush 88 32211 0.00273 QN20 Ridgewood 55 19668 0.0028 BK95 Erasmus 25 8381 0.00298 MN35 Washington Heights North 70 22757 0.00308 MN50 Stuyvesant Town-Cooper Village 33 10636 0.0031 QN68 Queensbridge-Ravenswood-Long Island City 24 7026 0.00342 BK79 Ocean Hill 37 10343 0.00358 MN06 Manhattanville 29 8089 0.00359 BK63 Crown Heights South 53 13079 0.00405 QN70 Astoria 125 30108 0.00415 QN72 Steinway 61 14573 0.00419 QN31 Hunters Point-Sunnyside-West Maspeth 96 22666 0.00424 MN33 East Harlem South 110 22178 0.00496 MN09 Morningside Heights 87 16986 0.00512 BK60 Prospect Lefferts Gardens-Wingate 120 22639 0.0053 MN34 East Harlem North 131 22376 0.00585 BK77 Bushwick North 113 18168 0.00622 MN03 Central Harlem North-Polo Grounds 198 31662 0.00625 MN31 Lenox Hill-Roosevelt Island 224 34102 0.00657 MN32 Yorkville 231 34494 0.0067 BK40 Windsor Terrace 39 5718 0.00682 MN12 Upper West Side 340 49020 0.00694 BK09 Brooklyn Heights-Cobble Hill 47 6212 0.00757

47
NTACode NTAName COUNT RENTAL STOCK PERCENT
MN04 Hamilton Heights 130 17041 0.00763 BK78 Bushwick South 177 22757 0.00778 BK61 Crown Heights North 298 37476 0.00795 MN14 Lincoln Square 172 20318 0.00847 MN25 Battery Park City-Lower Manhattan 155 18191 0.00852 MN11 Central Harlem South 143 16503 0.00867 BK33 Carroll Gardens-Columbia Street-Red Hook 119 13435 0.00886 MN40 Upper East Side-Carnegie Hill 117 12617 0.00927 BK75 Bedford 202 21173 0.00954 MN19 Turtle Bay-East Midtown 174 17682 0.00984 MN28 Lower East Side 269 26710 0.01007 BK38 DUMBO-Vinegar Hill-Downtown Brooklyn-Boerum Hill 132 12211 0.01081 BK35 Stuyvesant Heights 259 20435 0.01267 MN20 Murray Hill-Kips Bay 246 18993 0.01295 BK37 Park Slope-Gowanus 258 19514 0.01322 BK68 Fort Greene 130 9389 0.01385 BK90 East Williamsburg 189 13144 0.01438 MN21 Gramercy 168 10171 0.01652 BK64 Prospect Heights 112 6673 0.01678 BK76 Greenpoint 221 12817 0.01724 MN13 Hudson Yards-Chelsea-Flatiron-Union Square 538 30635 0.01756 MN27 Chinatown 321 17371 0.01848 BK69 Clinton Hill 217 10810 0.02007 MN17 Midtown-Midtown South 292 13336 0.0219 MN15 Clinton 503 22439 0.02242 MN23 West Village 632 26258 0.02407 MN22 East Village 526 20445 0.02573 MN24 SoHo-TriBeCa-Civic Center-Little Italy 414 14430 0.02869 BK73 North Side-South Side 539 18381 0.02932

48
APPENDIX B – Listing Prices and Asking Rent
NTACode NTAName
MONTHLY PRICE (100%)
MONTHLY PRICE (67%)
StreetEasy ASKING RENT INCENTIVE
BK69 Clinton Hill 7291.21 4885.11 2550 2335.11 MN17 Midtown-Midtown South 8869.33 5942.45 3695 2247.45 MN24 SoHo-TriBeCa-Civic Center-Little Italy 9196.49 6161.65 4038 2124.15 MN40 Upper East Side-Carnegie Hill 7393.61 4953.72 2870 2083.72 QN31 Hunters Point-Sunnyside-West Maspeth 5398.60 3617.06 1650 1967.06 QN68 Queensbridge-Ravenswood-Long Island City 5769.63 3865.65 2100 1765.65 BK33 Carroll Gardens-Columbia Street-Red Hook 6554.34 4391.41 2750 1641.41 MN09 Morningside Heights 5268.56 3529.94 2000 1529.94 MN27 Chinatown 6021.40 4034.34 2570 1464.34 MN33 East Harlem South 5285.77 3541.47 2095 1446.47 MN28 Lower East Side 5804.80 3889.22 2570 1319.22 MN14 Lincoln Square 7384.38 4947.53 3635 1312.53 MN19 Turtle Bay-East Midtown 7135.61 4780.86 3480 1300.86 BK37 Park Slope-Gowanus 5569.20 3731.37 2450 1281.37 BK79 Ocean Hill 4134.86 2770.36 1550 1220.36 MN23 West Village 7920.95 5307.04 4090 1217.04 BX63 West Concourse 3585.00 2401.95 1200 1201.95 BX35 Morrisania-Melrose 3600.00 2412.00 1230 1182.00 BX39 Mott Haven-Port Morris 3645.45 2442.45 1265 1177.45 MN11 Central Harlem South 4859.83 3256.09 2085 1171.09 MN20 Murray Hill-Kips Bay 6869.14 4602.32 3435 1167.32 BK91 East Flatbush-Farragut 3796.00 2543.32 1395 1148.32 MN22 East Village 6022.81 4035.28 2895 1140.28 MN15 Clinton 6815.43 4566.34 3430 1136.34 MN13 Hudson Yards-Chelsea-Flatiron-Union Square 7581.99 5079.93 3950 1129.93 MN04 Hamilton Heights 4609.21 3088.17 2000 1088.17 BK32 Sunset Park West 4044.44 2709.78 1650 1059.78 BX34 Melrose South-Mott Haven North 3440.00 2304.80 1290 1014.80 BK77 Bushwick North 4833.28 3238.30 2270 968.30 MN36 Washington Heights South 4090.93 2740.92 1785 955.92 BX26 Highbridge 3200.00 2144.00 1250 894.00 BK50 Canarsie 3800.91 2546.61 1680 866.61 BK76 Greenpoint 5163.46 3459.52 2600 859.52 MN34 East Harlem North 4314.57 2890.76 2095 795.76 BK09 Brooklyn Heights-Cobble Hill 5498.13 3683.75 2925 758.75 BK58 Flatlands 3430.00 2298.10 1550 748.10 MN21 Gramercy 7232.67 4845.89 4100 745.89 MN25 Battery Park City-Lower Manhattan 6966.52 4667.57 3933 735.07

49
NTACode NTAName
MONTHLY PRICE (100%)
MONTHLY PRICE (67%)
StreetEasy ASKING RENT INCENTIVE
MN32 Yorkville 5334.34 3574.01 2870 704.01 BK61 Crown Heights North 4138.24 2772.62 2095 677.62 MN03 Central Harlem North-Polo Grounds 4101.69 2748.13 2085 663.13 BK42 Flatbush 3448.89 2310.75 1650 660.75 MN31 Lenox Hill-Roosevelt Island 5269.25 3530.39 2870 660.39 MN06 Manhattanville 3968.90 2659.16 2000 659.16 BK64 Prospect Heights 4672.66 3130.68 2500 630.68 QN70 Astoria 4050.43 2713.79 2100 613.79 BK41 Kensington-Ocean Parkway 3574.00 2394.58 1785 609.58 BK73 North Side-South Side 5830.31 3906.31 3300 606.31 MN01 Marble Hill-Inwood 3539.52 2371.48 1785 586.48 MN12 Upper West Side 6151.44 4121.47 3635 486.47 BK78 Bushwick South 4078.19 2732.38 2270 462.38 BX33 Longwood 2525.00 1691.75 1230 461.75 BK68 Fort Greene 4850.23 3249.65 2825 424.65 MN35 Washington Heights North 3265.36 2187.79 1785 402.79
BK38 DUMBO-Vinegar Hill-Downtown Brooklyn-Boerum Hill 5650.91 3786.11 3441 344.86
QN71 Old Astoria 3510.00 2351.70 2100 251.70 BK88 Borough Park 3266.67 2188.67 1990 198.67 BX14 East Concourse-Concourse Village 2562.50 1716.88 1580 136.88 BK72 Williamsburg 5010.77 3357.22 3300 57.22 BK40 Windsor Terrace 3865.59 2589.95 2570 19.95 BK81 Brownsville 2207.14 1478.79 1490 -11.21 BK63 Crown Heights South 3024.72 2026.56 2095 -68.44 MN50 Stuyvesant Town-Cooper Village 5569.36 3731.47 4100 -368.53