impact - hudson river park a hudson river park business improvement district ... development is...
TRANSCRIPT

Commissioned by
THE IMPACT OF HUDSON RIVER PARK ON PROPERTY VALUES
FA L L 2 0 0 8
ST U DY R E P O R T
Friends of Hudson RIver Park
311 West 43rd StreetSuite 300New York, NY 10036
T. 212.757.0981F. 212.757.0985
Friends of Hudson River Park acknowl-
edges with gratitude the support of The
J. M. Kaplan Fund, which financed this
report and the work that underlies it.
We also acknowledge with
thanks the generous contribution by the
Real Estate Board of New York (Steven
Ross, Chairperson, Steven Spinola,
President, Michael Slattery, Senior Vice
President for Research) of the sales
transactions data used in this report, all
of which were provided to us at no cost.
Friends is also grateful to all
the members of the project Steering
Committee, who served loyally and
without compensation and provided
us with incisive input that
is central to the work
we did and the findings
we have reached.
Thanks also to Andy Manshel,
who served as a consultant for the
study and whose input provided some
of the most important insights reflected
in this report.
Finally, thanks to the Regional
Plan Association (Robert Yaro, President,
Robert Pirani, Director of Environmental
Programs, L. Nicolas Ronderos, Senior
Planner), which prepared the data
analysis and was very much Friends’
partner in this endeavor.
Douglas Durst Ross GrahamCo-Chairs
William J. ZwartTreasurer
John DoswellSecretary
Richard DadeyAssistant Treasurer
Robin B. ShanusAssistant Secretary
Tobi Bergman
Meta Brunzema
Albert Butzel
James Capalino
Cynthia Coulson
Tom Fox
Acknowlegements
BOARD OF DIRECTORS
THE IMPACT OF HUDSON RIVER PARK ON PROPERTY VALUESArthur E. Imperatore Jr.
Ben Korman
John Krevey
Matthew Mayer
Francis X. McArdle
Vince McGowan
David Redden
Steven Salsberg
Arthur Schwartz
Douglas E. Sarini
David Tewksbury
Tim Tompkins
Robert Trentlyon
Peter Tully
Madelyn Wils
Joshua Zamir
A. J. PietrantoneExecutive Director
>
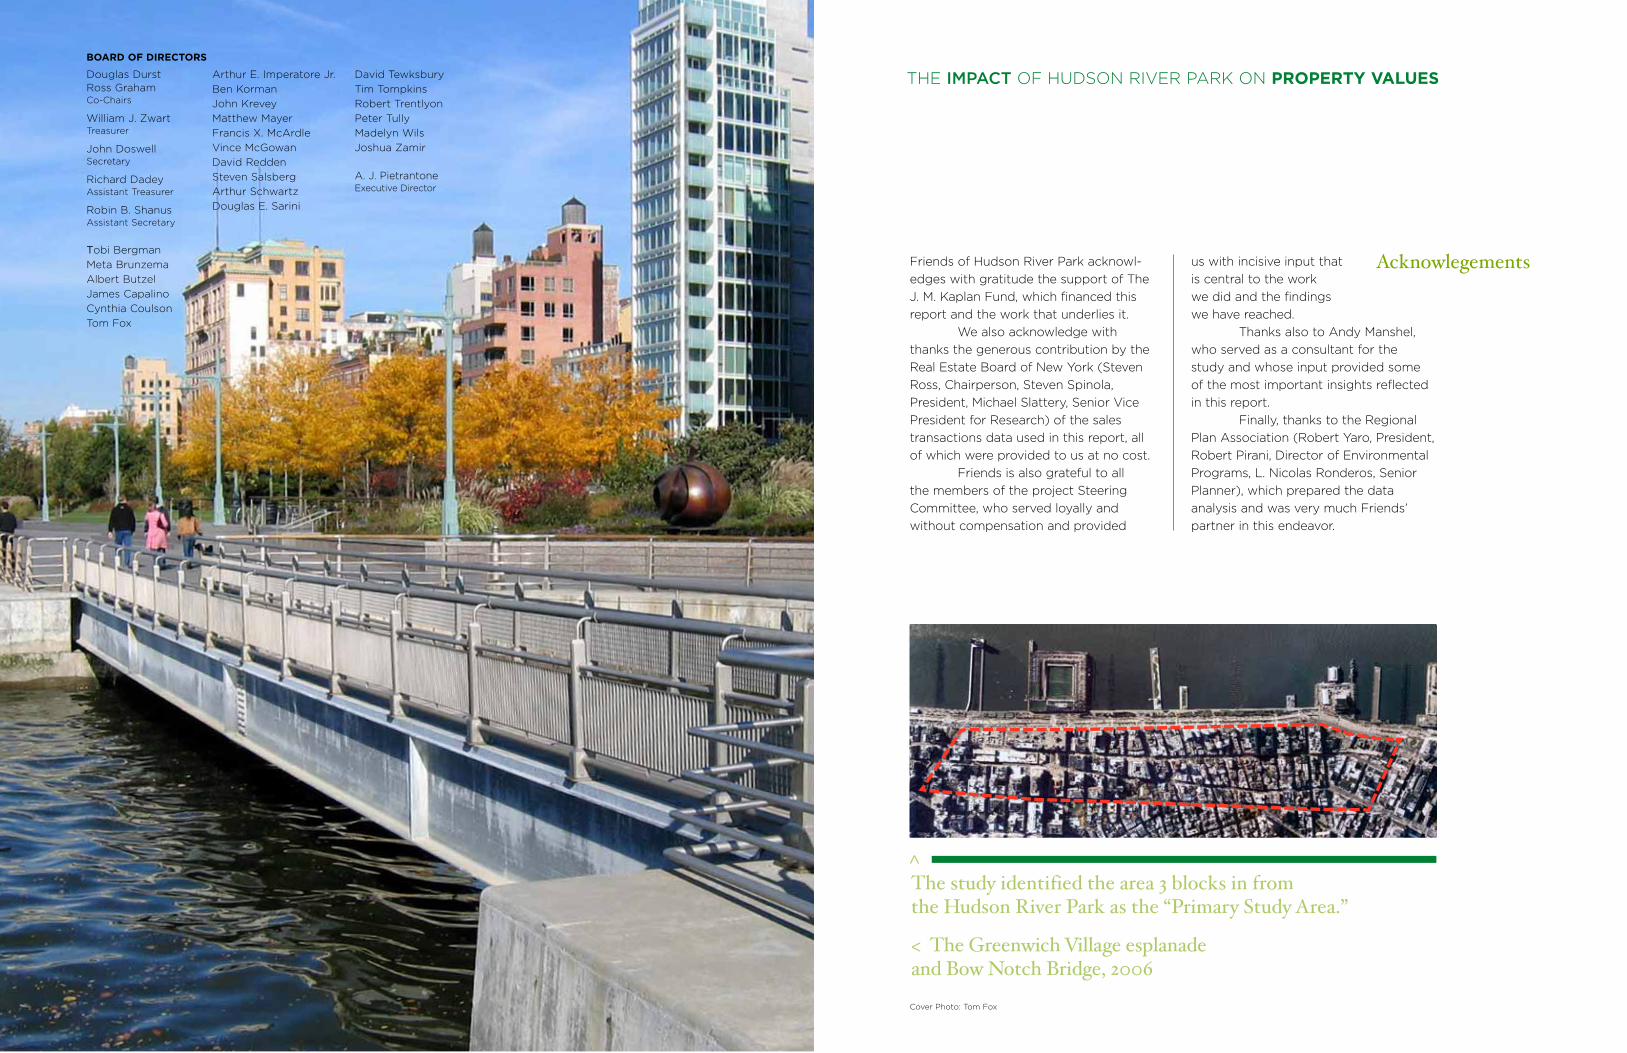
Cover Photo: Tom Fox
The study identified the area 3 blocks in from the Hudson River Park as the “Primary Study Area.”
< The Greenwich Village esplanade and Bow Notch Bridge, 2006
1 Introduction
5 Findings
7 The Study Process7 The Hypothesis and Initial Investigation8 The Study Methodology8 Definitions and Data Gathering
11 The Analysis
17 Discussion of Results17 General Context – Real Property Values
in Manhattan and on the West Side
17 Property Value Increases in the PrimaryStudy Area and Comparison Areas
21 Property Values Increases Attributable to Hudson River Park
23 Next Steps
29 A Hudson River Park Business Improvement District
31 Bibliography
32 Brief Bios for Steering Committee Members & Consultants
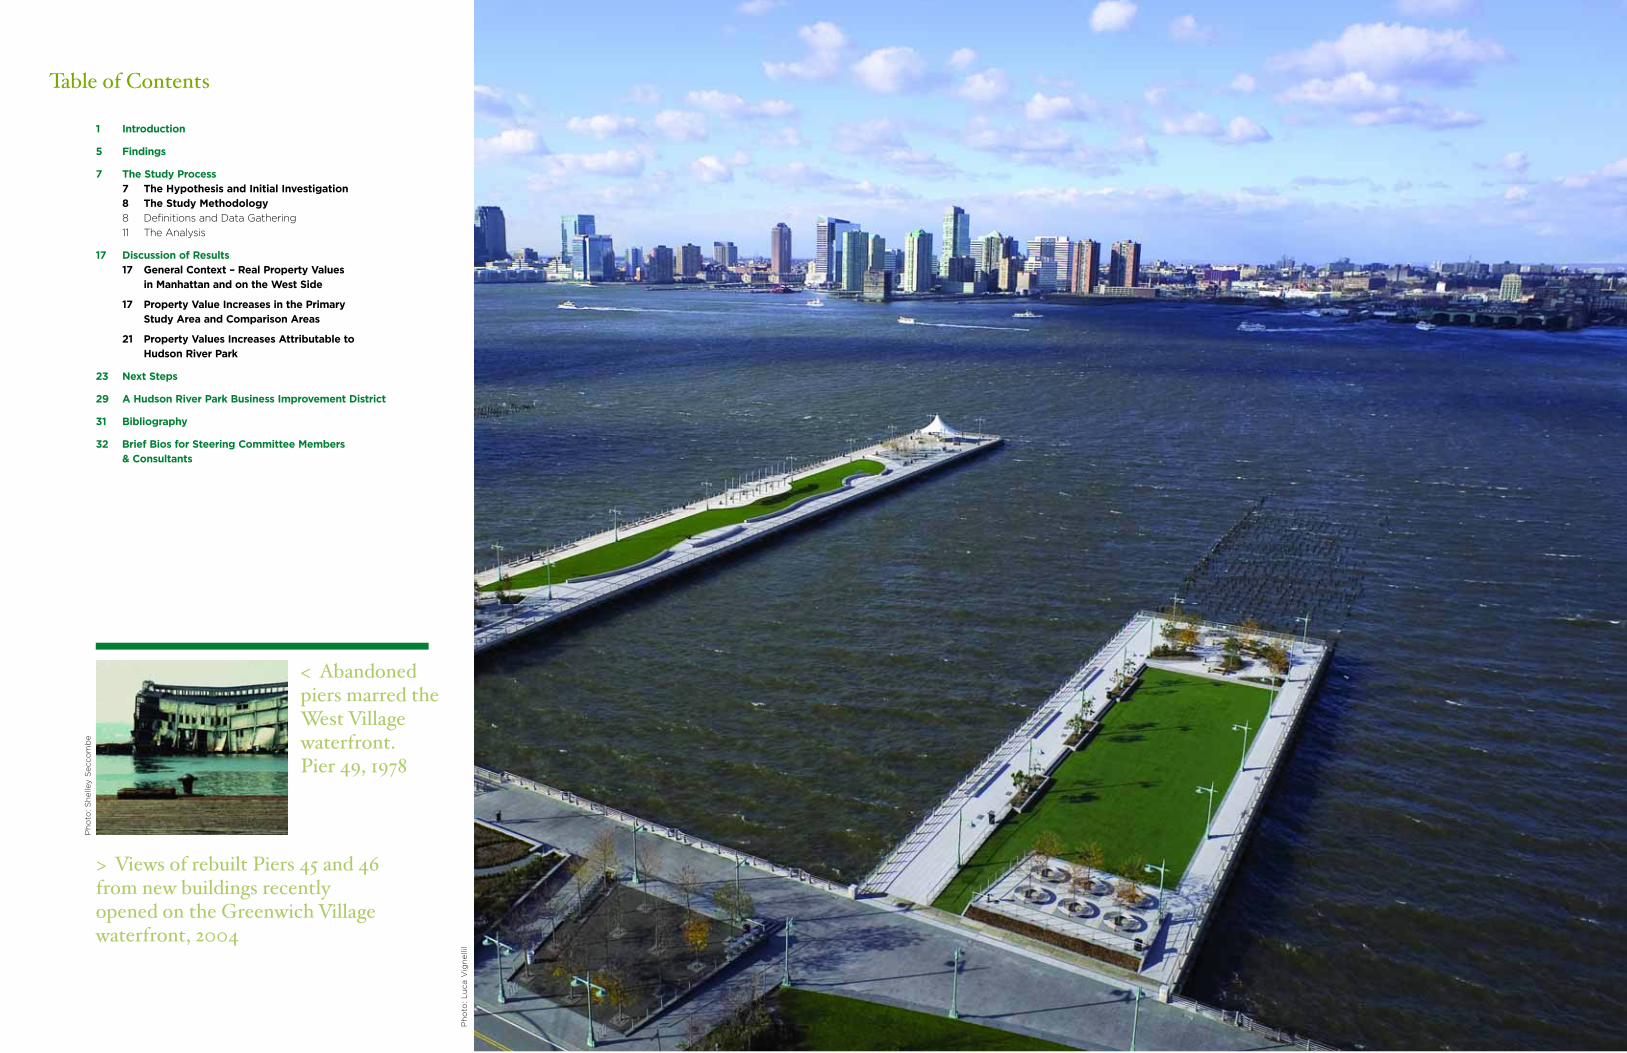
< Abandonedpiers marred theWest Villagewaterfront. Pier 49, 1978
Table of Contents
> Views of rebuilt Piers 45 and 46from new buildings recently opened on the Greenwich Village waterfront, 2004
Ph
oto
: L
uca V
ign
elli
l
Ph
oto
: S
helle
y S
ecco
mb
e
INTRODUCTION PAGE 2INTRODUCTION PAGE 1
Village began almost immediately – in
October 1998. However, while adequate
funding was available, regulatory hurdles
slowed the Trust’s capacity to move
construction ahead quickly, and it was
not until May 2003 that the entire
Greenwich Village section of the Park
opened to the public.
By then, much had changed, and
more was changing, in the area of
Greenwich Village directly opposite the
new section of the Park. Starting in 1997,
some of the larger adjacent properties
had begun to change hands, though
with only modest increases in sales
prices. By 2002, however, three new
residential buildings were under con-
struction in the area. In the years that
have followed, those buildings opened
and were sold out, sales prices have
been among the highest in all of
Manhattan, and new projects have
begun or been announced. What in
1980 had been a wasteland, both along
the waterfront and inland in the far West
Village, has become one of the premier
areas in the City (as the 1990 Waterfront
Panel had suggested would be the case).
From visual observation, it was
evident as early as 2001 that the new
Park was having a positive impact on
adjacent properties and was adding
value to the City’s tax base. And as the
new buildings began to take shape,
anecdotal information – for example,
the advertised prices for the new condo-
miniums – suggested that the added
value was substantial. Moreover, from
the level of construction activity along
the new park, it was also apparent that
new State and City tax dollars were
being generated through construction
wages, materials purchases, and sales
and transfer taxes. There was, in fact,
an economic reawakening underway
along the waterfront, particularly where
Hudson River Park was nearing comple-
tion. The question was how much of this
could be attributed to the Park.
This question became all the
more relevant as the cost of maintaining
the Park became clearer. The goal
had been to use revenues from the
commercial nodes plus some portion of
increased inland real estate taxes, to sus-
tain park operations and maintenance.
However, the concept of capturing a
portion of the increased real estate taxes
was lost sight of early on; and while
lease revenues have been sufficient to
cover operating and maintenance costs
for the first third of the Park, it has
become increasingly clear that because
the commercial nodes are limited by
legislation and cannot be expanded,
these revenues alone will not be enough
to cover the operating and maintenance
costs of the entire Park when its
development is complete. Moreover, no
mechanism is in place to cover the costs
For many years,
Manhattan’s West Side
waterfront south of
59th Street was the center of New York
City’s teeming maritime commerce.
By 1970, however, containerization had
moved much of that commerce to
Staten Island and New Jersey; and when
the old elevated West Side Highway
collapsed in 1972, it simply hastened
the decay and marginalization of the
waterfront. By 1980, the area was
largely a wasteland, with the few remain-
ing businesses and warehouses provid-
ing little return to the public in terms of
usefulness or tax revenues.
Planning for a program to renew
the West Side waterfront began in 1972,
but the initial effort – the mega-project
known as “Westway” – was abandoned
in 1985 after years of controversy and
opposition. In 1986, a West Side Task
Force was formed by the City and the
State to recommend an alternative,
and the seed was planted for what
would grow in place of that project –
a combination of park land providing
public access along the Hudson and
some kind of economic development
to follow.
In 1990, the West Side
Waterfront Panel, which succeeded the
Task Force, proposed what became
Hudson River Park. In an era of reduced
park funding, the Panel recommended
new funding mechanisms to assist in the
construction and maintenance of the
Park once it was built. The first of these
was to set aside three commercial nodes
within the Park itself, with the lease
revenues from these nodes dedicated to
park operations and maintenance; the
second was to capture a portion of the
appreciation in inland real estate values
attributable to the Park to cover any
capital costs that the State and City did
not provide directly.
Over the next several years,
planning for the Park went forward
under the direction of the Hudson River
Park Conservancy, an agency created in
1992 pursuant to a memorandum of
understanding in which the State and
the City also agreed to jointly finance
the project. The City had committed
$100 million to the project but the
money was to be matched and there
was no specific commitment of funding
from the State. Between 1992 and 1995,
the Conservancy cleared much of the
decay that made the waterfront so
threatening, created a walkway and
bike path along the shore that finally
gave the public access to the River,
encouraged temporary public uses of
several of the old piers that were still
usable and carried out a three-year
planning process that resulted in a
Concept and Financial Plan for the Park.
During this period, the financing
concepts developed by the Task Force
continued to guide the Conservancy’s
thinking for the new park, which was
to be built between 59th Street and
Battery Park. Over time, however, the
mechanisms for securing the basic
capital money to build the Park became
more and more uncertain – and the need
more and more urgent. In the end, the
State and City assumed responsibility for
providing the capital, while the revenues
thrown off by the three commercial
nodes were expected to be enough to
support ongoing park operations and
maintenance. At the time, and for the
next 10 years, very little attention was
paid to other economic development
that might be fostered by the new park.
One reason for this is that the
future of Hudson River Park remained
uncertain until 1997, when the State
made an explicit commitment to fund
the Park and match $100 million pledged
by the City and took the steps necessary
to appropriate it. Six months later, in
June 1998, legislation was passed
creating both the Park and a joint City-
State agency – the Hudson River Park
Trust – to build and operate it. Work on
the first section of the park in Greenwich
Introduction
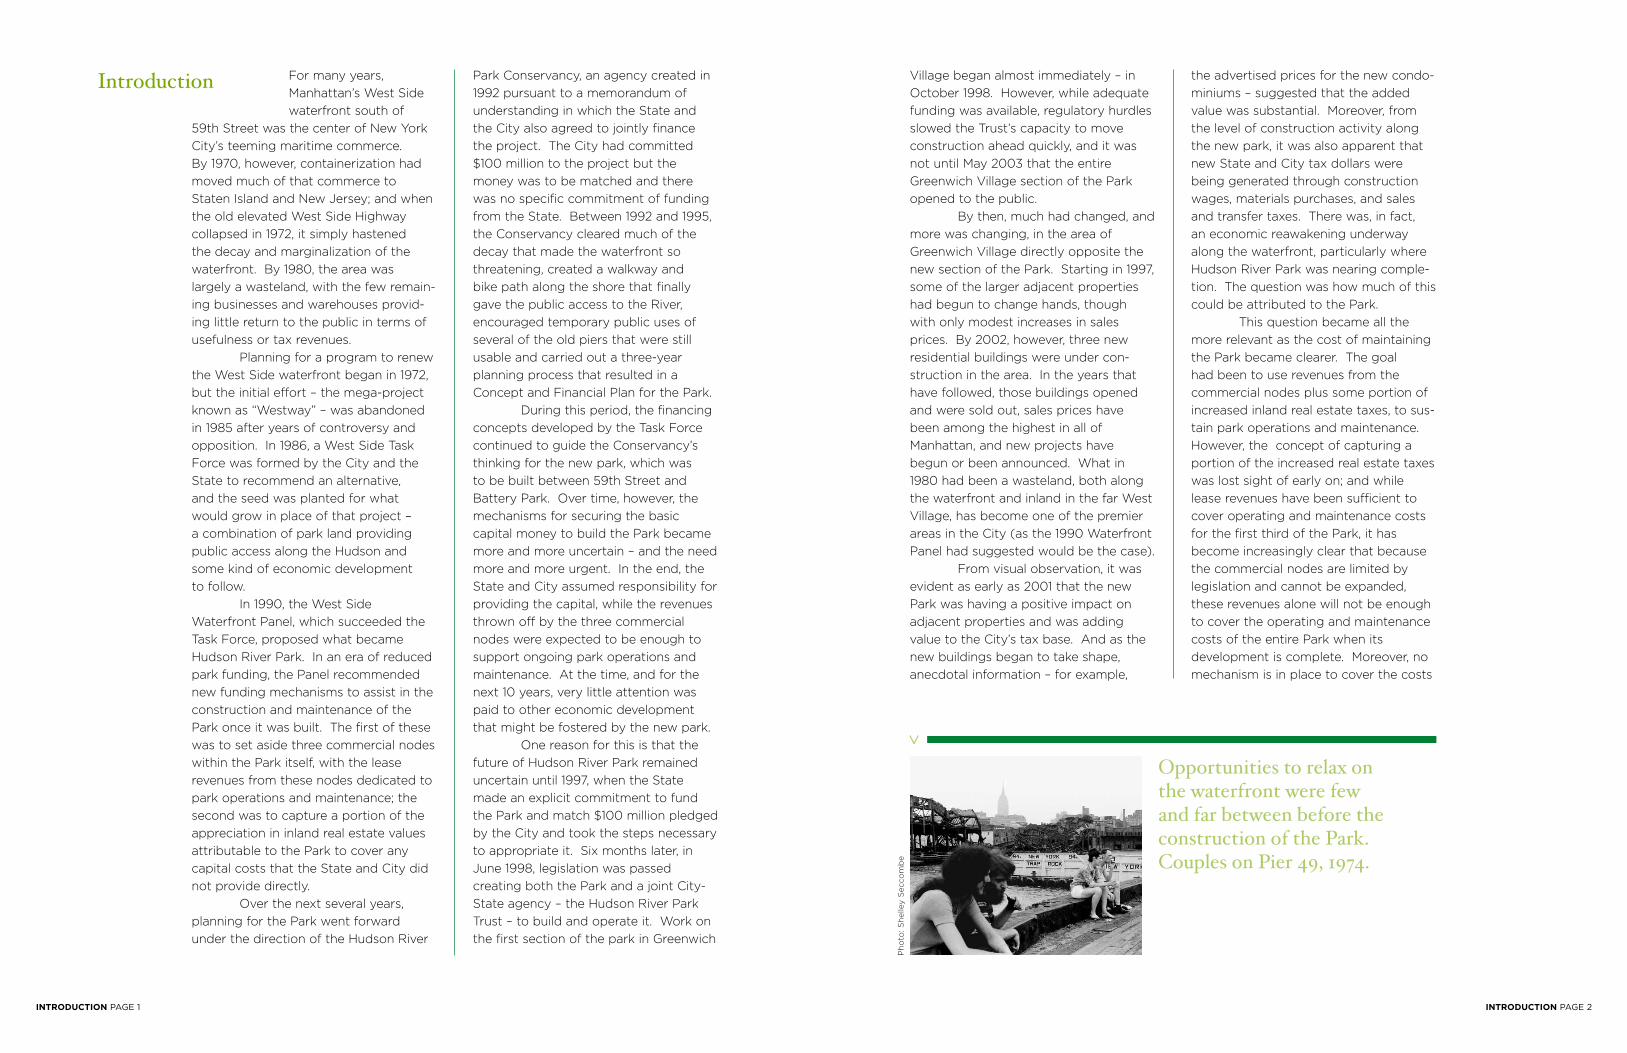
Opportunities to relax on the waterfront were few and far between before theconstruction of the Park.Couples on Pier 49, 1974.
>
Ph
oto
: S
helle
y S
ecco
mb
e
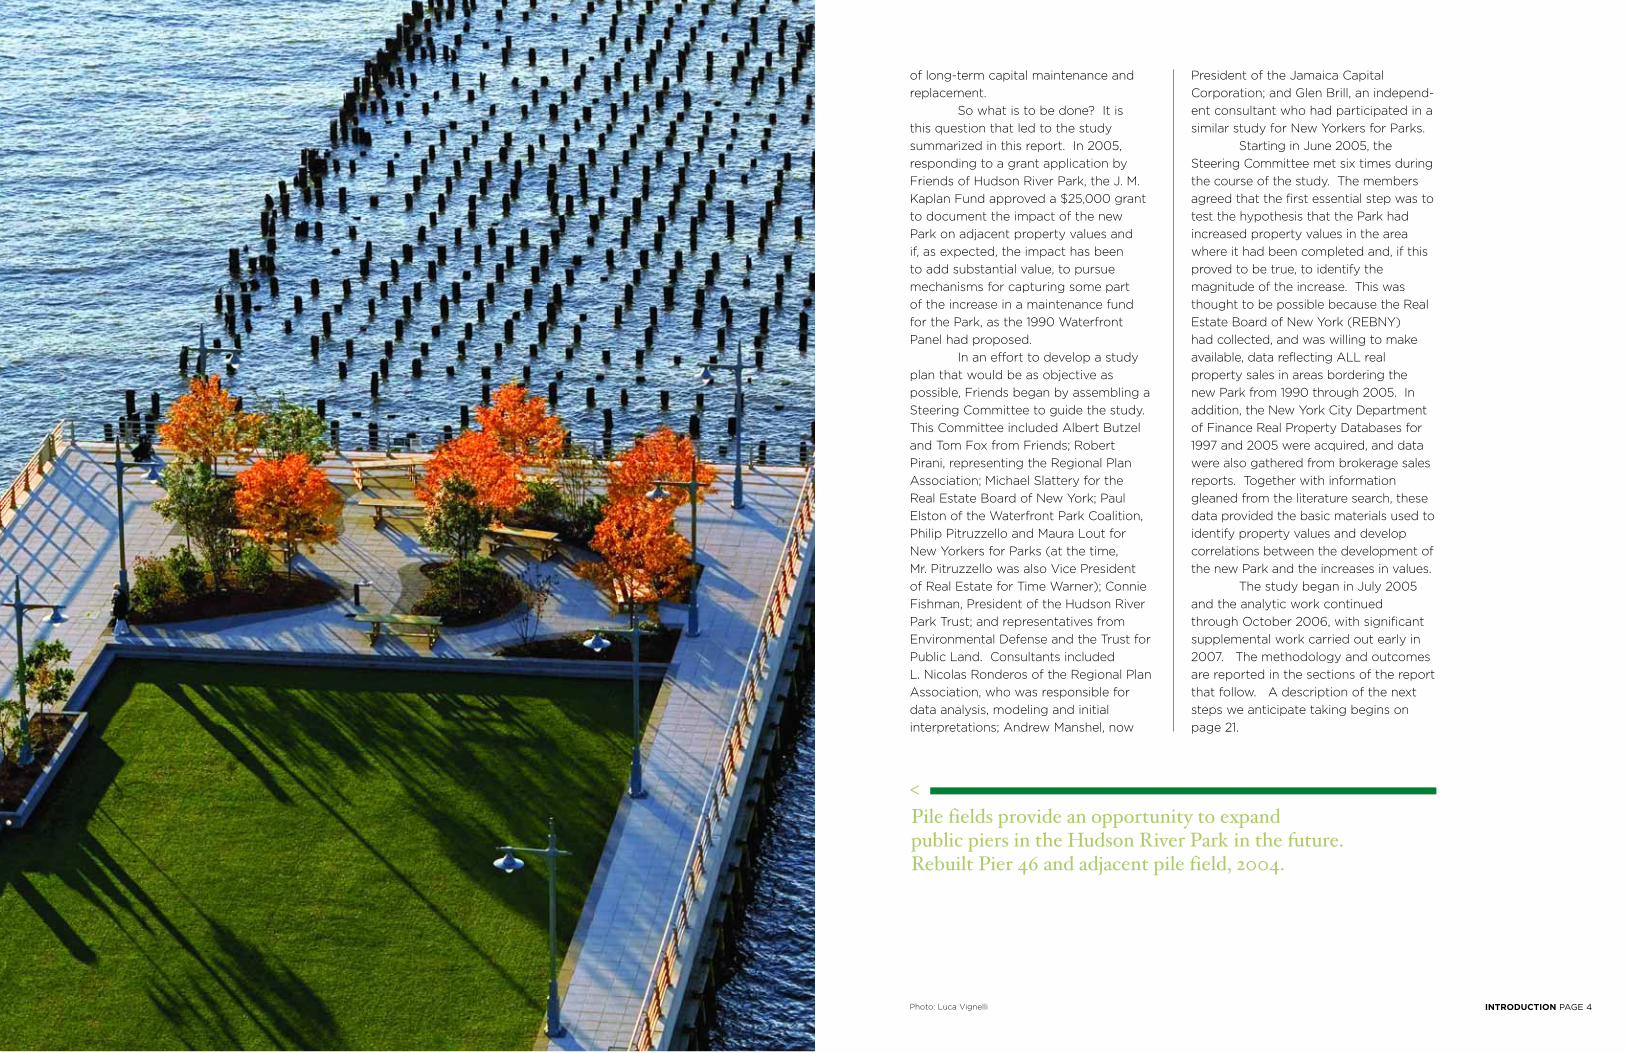
Pile fields provide an opportunity to expand public piers in the Hudson River Park in the future. Rebuilt Pier 46 and adjacent pile field, 2004.
<
of long-term capital maintenance and
replacement.
So what is to be done? It is
this question that led to the study
summarized in this report. In 2005,
responding to a grant application by
Friends of Hudson River Park, the J. M.
Kaplan Fund approved a $25,000 grant
to document the impact of the new
Park on adjacent property values and
if, as expected, the impact has been
to add substantial value, to pursue
mechanisms for capturing some part
of the increase in a maintenance fund
for the Park, as the 1990 Waterfront
Panel had proposed.
In an effort to develop a study
plan that would be as objective as
possible, Friends began by assembling a
Steering Committee to guide the study.
This Committee included Albert Butzel
and Tom Fox from Friends; Robert
Pirani, representing the Regional Plan
Association; Michael Slattery for the
Real Estate Board of New York; Paul
Elston of the Waterfront Park Coalition,
Philip Pitruzzello and Maura Lout for
New Yorkers for Parks (at the time,
Mr. Pitruzzello was also Vice President
of Real Estate for Time Warner); Connie
Fishman, President of the Hudson River
Park Trust; and representatives from
Environmental Defense and the Trust for
Public Land. Consultants included
L. Nicolas Ronderos of the Regional Plan
Association, who was responsible for
data analysis, modeling and initial
interpretations; Andrew Manshel, now
President of the Jamaica Capital
Corporation; and Glen Brill, an independ-
ent consultant who had participated in a
similar study for New Yorkers for Parks.
Starting in June 2005, the
Steering Committee met six times during
the course of the study. The members
agreed that the first essential step was to
test the hypothesis that the Park had
increased property values in the area
where it had been completed and, if this
proved to be true, to identify the
magnitude of the increase. This was
thought to be possible because the Real
Estate Board of New York (REBNY)
had collected, and was willing to make
available, data reflecting ALL real
property sales in areas bordering the
new Park from 1990 through 2005. In
addition, the New York City Department
of Finance Real Property Databases for
1997 and 2005 were acquired, and data
were also gathered from brokerage sales
reports. Together with information
gleaned from the literature search, these
data provided the basic materials used to
identify property values and develop
correlations between the development of
the new Park and the increases in values.
The study began in July 2005
and the analytic work continued
through October 2006, with significant
supplemental work carried out early in
2007. The methodology and outcomes
are reported in the sections of the report
that follow. A description of the next
steps we anticipate taking begins on
page 21.
INTRODUCTION PAGE 4Photo: Luca Vignelli

Park has been a major factor in
adding value to nearby properties and,
ultimately, to the City’s tax base.
5. The impact of the
completed Greenwich Village section
of the Park was especially significant
with respect to condominium sales.
Before this section opened to the
public in June 2003, there were few
condo sales in the area. Several sold
at prices equivalent to condominium
sales in adjacent areas to the north
and south. Two years later, however,
the number of condominium sales
in the area had shot up to 156, and
the average price had increased by
80%. In areas north and south, the
average sale price increased by only
45%. This trend of escalating property
value adjacent to the finished section
of the Park appears to have continued
in 2006.
6. While the figures given
above are impressive, and while the
20% value added correlates closely
with other studies of how parks add
value, it is probable that other factors
besides the Park itself contributed
to the value increases. For example,
it is likely that buyers paid premiums
for the apartments in the new Richard
Meier buildings due to the reputation of
the architect and the quality of the
design; and adjacent landmarking
may have contributed to the high
prices. In addition, part of the added
value is probably due to the removal
of municipal facilities and the clean-up
of derelict piers and warehouses.
However, it is worth noting that
neither the number of sales nor
prices along the Greenwich Village
waterfront increased significantly
between 1992 and 1995 when the
waterfront was cleaned up, but
escalated sharply only when this
section of the Park was nearing
completion in 2003.
7. The study did not
attempt to identify or quantify
other contributions to the City’s
economic base and public health
that may result from construction of
Hudson River Park. But these have
probably been significant. Among
other items deserving of consideration
are real estate transfer taxes based
on the increased sales activity in
proximity to the Park; taxes on
wages paid to construction and
other workers at adjacent properties
(and also in building the Park); and
sales and other taxes associated with
material purchases and professional
services.
1. Based on the
analysis of the sales
data and the correlation
of sales prices with the proximity of
the involved properties to the new
Park, the value of the properties
within three blocks of the completed
Greenwich Village section of the Park
was impacted significantly by the new
Park. Approximately 20% of the value of
properties within the first two blocks of
the Greenwich Village section of the
Hudson River Park can be attributed to
the park. For buildings that actually
changed hands in this two block area
between 2002 and 2005 (less than 25%
of all buildings) approximately 20%
of the value of these buildings – $48.5
million – was attributable to the Park.
Projected over the entire area within two
blocks of the new section of the Park,
the value attributable to the Park would
approach $200 million.
2. The public investment to
build the Greenwich Village section of
the Park was estimated to be $75 million.
This compares to the $48.5 million
of value attributable to the Park for
building sales that took place between
2002 and 2005. Again, these sales
were less than 25% of the total number
of properties in the affected area
and if the attributable value of all
properties in the area was taken
into consideration, the return on the
public investment would approach
$200 million.
3. The announcement of a
new Hudson River Park in 1990 had
no significant impact on real estate
prices adjacent to the Park. After
the State announced its commitment
of $100 million of funding for the
Park in 1997, the sale of buildings and
building lots along the Greenwich
Village waterfront picked up and
property values in the area and along
the length of the Park began to
increase. Escalation in both the number
of sales and prices was modest at
this point.
4. The major increase in
real estate prices along the Greenwich
Village waterfront began in 2003
when this section of the Park was
opened to the public. Prices accelerated
in 2004 and continued at a very high
level in 2005. This represents, in part,
increases in prices of building sales,
but is also reflected in the large number
of high-end condominium apartments
that came on the market and were
snapped up. The sharp increase in
both prices and number of sales
suggests that presence of the finished
Findings
Shipping and other maritimecommerce once blocked riverviews and access for GreenwichVillage residents. Looking atthe waterfront from Westbeth,circa 1980.
Expansive views of theHarbor and new recreational
acess to the river have increased property values
and the quality of life in Greenwich Village since the
construction of the Park. Park at twilight, 2005.
FINDINGS PAGE 6FINDINGS PAGE 5
Ph
oto
: S
helle
y S
ecco
mb
e
Ph
oto
: S
helle
y S
ecco
mb
e
> >
1. The Hypothesis and
Initial Investigation
Based on visual obser-
vation, primarily of the new residential
construction along the waterfront, the
starting hypothesis for the study was
that the construction of Hudson River
Park in Greenwich Village had substan-
tially increased the value of the adjacent
properties. The purpose of the study
was to test this hypothesis by analyzing
actual sales data and other relevant
information and to measure the impact
of the Park along this stretch over time.
As a first step in the analytical
process, Mr. Ronderos undertook
an extensive review of literature that
addressed the impact of new
infrastructure, and parks in particular,
on land values. The materials he
considered also included articles on
appropriate models for such a study.
A full bibliography is included at the
end of this report.
Not surprisingly, most of these
materials indicated that parks and open
space add to the value of adjacent
properties. Generally, the added value
runs between 10% and 20% of the total
value of such properties. As summarized
by John Crompton in a well-regarded
analysis reported in a 2001 article titled
“The Impact of Parks on Property Values:
A Review of the Empirical Evidence” and
in his recent book The Proximate
Principle:
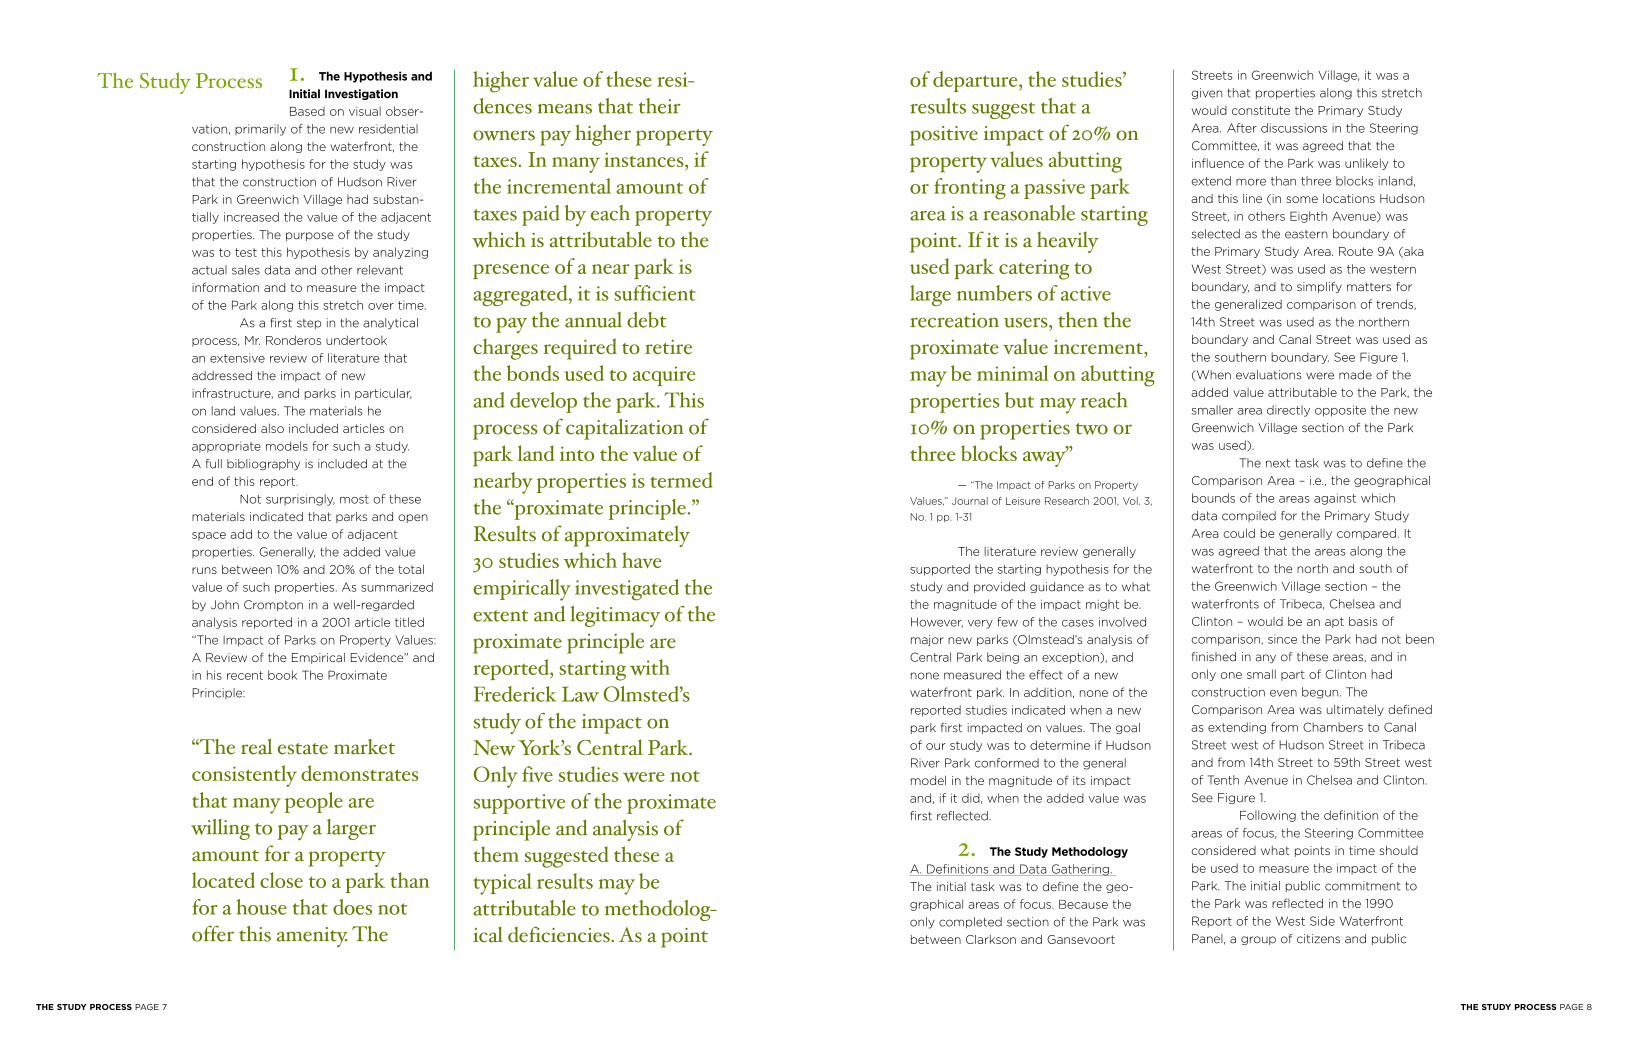
“The real estate marketconsistently demonstratesthat many people are willing to pay a largeramount for a propertylocated close to a park thanfor a house that does notoffer this amenity. The
higher value of these resi-dences means that theirowners pay higher propertytaxes. In many instances, ifthe incremental amount oftaxes paid by each propertywhich is attributable to thepresence of a near park isaggregated, it is sufficientto pay the annual debtcharges required to retirethe bonds used to acquireand develop the park. Thisprocess of capitalization ofpark land into the value ofnearby properties is termedthe “proximate principle.”Results of approximately 30 studies which haveempirically investigated theextent and legitimacy of theproximate principle arereported, starting withFrederick Law Olmsted’sstudy of the impact on New York’s Central Park.Only five studies were notsupportive of the proximateprinciple and analysis ofthem suggested these a typical results may beattributable to methodolog-ical deficiencies. As a point
The Study Process of departure, the studies’results suggest that a positive impact of 20% onproperty values abutting or fronting a passive parkarea is a reasonable startingpoint. If it is a heavily used park catering to large numbers of active recreation users, then theproximate value increment,may be minimal on abuttingproperties but may reach10% on properties two orthree blocks away”
— “The Impact of Parks on Property
Values,” Journal of Leisure Research 2001, Vol. 3,
No. 1 pp. 1-31
The literature review generally
supported the starting hypothesis for the
study and provided guidance as to what
the magnitude of the impact might be.
However, very few of the cases involved
major new parks (Olmstead’s analysis of
Central Park being an exception), and
none measured the effect of a new
waterfront park. In addition, none of the
reported studies indicated when a new
park first impacted on values. The goal
of our study was to determine if Hudson
River Park conformed to the general
model in the magnitude of its impact
and, if it did, when the added value was
first reflected.
2. The Study Methodology
A. Definitions and Data Gathering.
The initial task was to define the geo-
graphical areas of focus. Because the
only completed section of the Park was
between Clarkson and Gansevoort
Streets in Greenwich Village, it was a
given that properties along this stretch
would constitute the Primary Study
Area. After discussions in the Steering
Committee, it was agreed that the
influence of the Park was unlikely to
extend more than three blocks inland,
and this line (in some locations Hudson
Street, in others Eighth Avenue) was
selected as the eastern boundary of
the Primary Study Area. Route 9A (aka
West Street) was used as the western
boundary, and to simplify matters for
the generalized comparison of trends,
14th Street was used as the northern
boundary and Canal Street was used as
the southern boundary. See Figure 1.
(When evaluations were made of the
added value attributable to the Park, the
smaller area directly opposite the new
Greenwich Village section of the Park
was used).
The next task was to define the
Comparison Area – i.e., the geographical
bounds of the areas against which
data compiled for the Primary Study
Area could be generally compared. It
was agreed that the areas along the
waterfront to the north and south of
the Greenwich Village section – the
waterfronts of Tribeca, Chelsea and
Clinton – would be an apt basis of
comparison, since the Park had not been
finished in any of these areas, and in
only one small part of Clinton had
construction even begun. The
Comparison Area was ultimately defined
as extending from Chambers to Canal
Street west of Hudson Street in Tribeca
and from 14th Street to 59th Street west
of Tenth Avenue in Chelsea and Clinton.
See Figure 1.
Following the definition of the
areas of focus, the Steering Committee
considered what points in time should
be used to measure the impact of the
Park. The initial public commitment to
the Park was reflected in the 1990
Report of the West Side Waterfront
Panel, a group of citizens and public
THE STUDY PROCESS PAGE 8THE STUDY PROCESS PAGE 7

was completed – 2003 – was identified
for special attention. Thus, 1990 (the
year in which the plan for the park was
announced), 1997 (the year in which firm
commitments of funding were made)
and 2003 (the year in which the
Greenwich Village section of the Park
was completed and opened to the pub-
lic) were selected as benchmark dates to
evaluate the impact of the new Park
on adjacent property values. See
Figure 2.
The next task was to secure
data that reflected market values over
the time period the Steering Committee
had agreed should be studied. This
was possible because REBNY had
collected and digitized data on all
recorded sales from 1990 through 2005
of real property across Manhattan,
including, of course, the Primary Study
Area and the Comparison Areas.
These data identified actual sales prices
by address, type (buildings, building
lots, condominiums) and date. These
were the data used in this report’s
principal analyses. (During the course
of the study, it was decided to try to
officials appointed by Governor Cuomo
and Mayor Dinkins to recommend a
configuration for the Park. The Panel’s
recommendation, later endorsed by
the State and the City, was for a park-
on-piers combined with nodes of
commercial development – essentially,
the Hudson River Park now under
construction. The Steering Committee
agreed that this was an appropriate start
date for the analysis of property value
impacts, since it was possible that this
soft commitment could have sparked a
heightened interest in properties along
the waterfront. From this, the decision
was reached to begin the analysis
of property values impacts in 1990
and continue it through 2005 (or,
where 2005 data were not available,
through 2004).
Two interim dates were
identified as potentially of particular
relevance. The first of these was 1997,
the year in which the State matched the
City’s commitments of funding for the
Park, each pledging $100 million for con-
struction. Second, the year in which the
Greenwich Village section of the Park
Fig. 1 Primary StudyArea
Fig. 2 Park Development Timeline:
1990 Plan Announced
1997 Governor commitsfunding and support
2003 Greenwich Sectioncompleted
ComparisonArea
PrimaryStudyArea
ComparisonArea
HU
DS
ON
R
IV
ER
P
AR
K
MA
RI
NE
S
AN
CT
UA
RY
NYC
Pass
enge
r Shi
p Te
rmin
al
NYC Tow Pound
NYC SanitationClinton
Hudson River Park
Pile Field
Marine Sanctuary
Bike Path
Municipal
Commercial
Not Part of Park
Chelsea
GreenwichVillage
TribecaDowntown
THE STUDY PROCESS PAGE 10THE STUDY PROCESS PAGE 9
Map
: R
eg
ion
al P
lan
Ass
ocia
tio
n
Map
an
d c
ert
ain
ph
oto
s p
rovid
ed
co
urt
esy
of
Hu
dso
n R
iver
Park
Tru
st
generalized context for the more
detailed evaluation of property value
impacts in the Primary and Comparison
areas. This was done for the period 1990
through 2005 using the Miller Samuel
data to determine average residential
prices in, respectively, Manhattan,
Greenwich Village (defined as the area
bounded by 14th Street, Houston Street,
6th Avenue and the Hudson River),
Clinton/Midtown West (defined as the
area bounded by 34th Street, 57th
Street, 6th Avenue and the Hudson
River), Chelsea (defined as the area
bounded by 14th Street, 34th Street,
Sixth Avenue and the Hudson River) and
Tribeca/Soho (defined as the area
bounded by Houston Street, Vesey
Street, Broadway and the Hudson River).
With one exception, the comparisons
were made for combined coop and
condominium sales in each year. To
make the comparisons as equivalent
as possible, “Average Price per Square
Foot” was used as the basis of
measurement (although “Average Sales
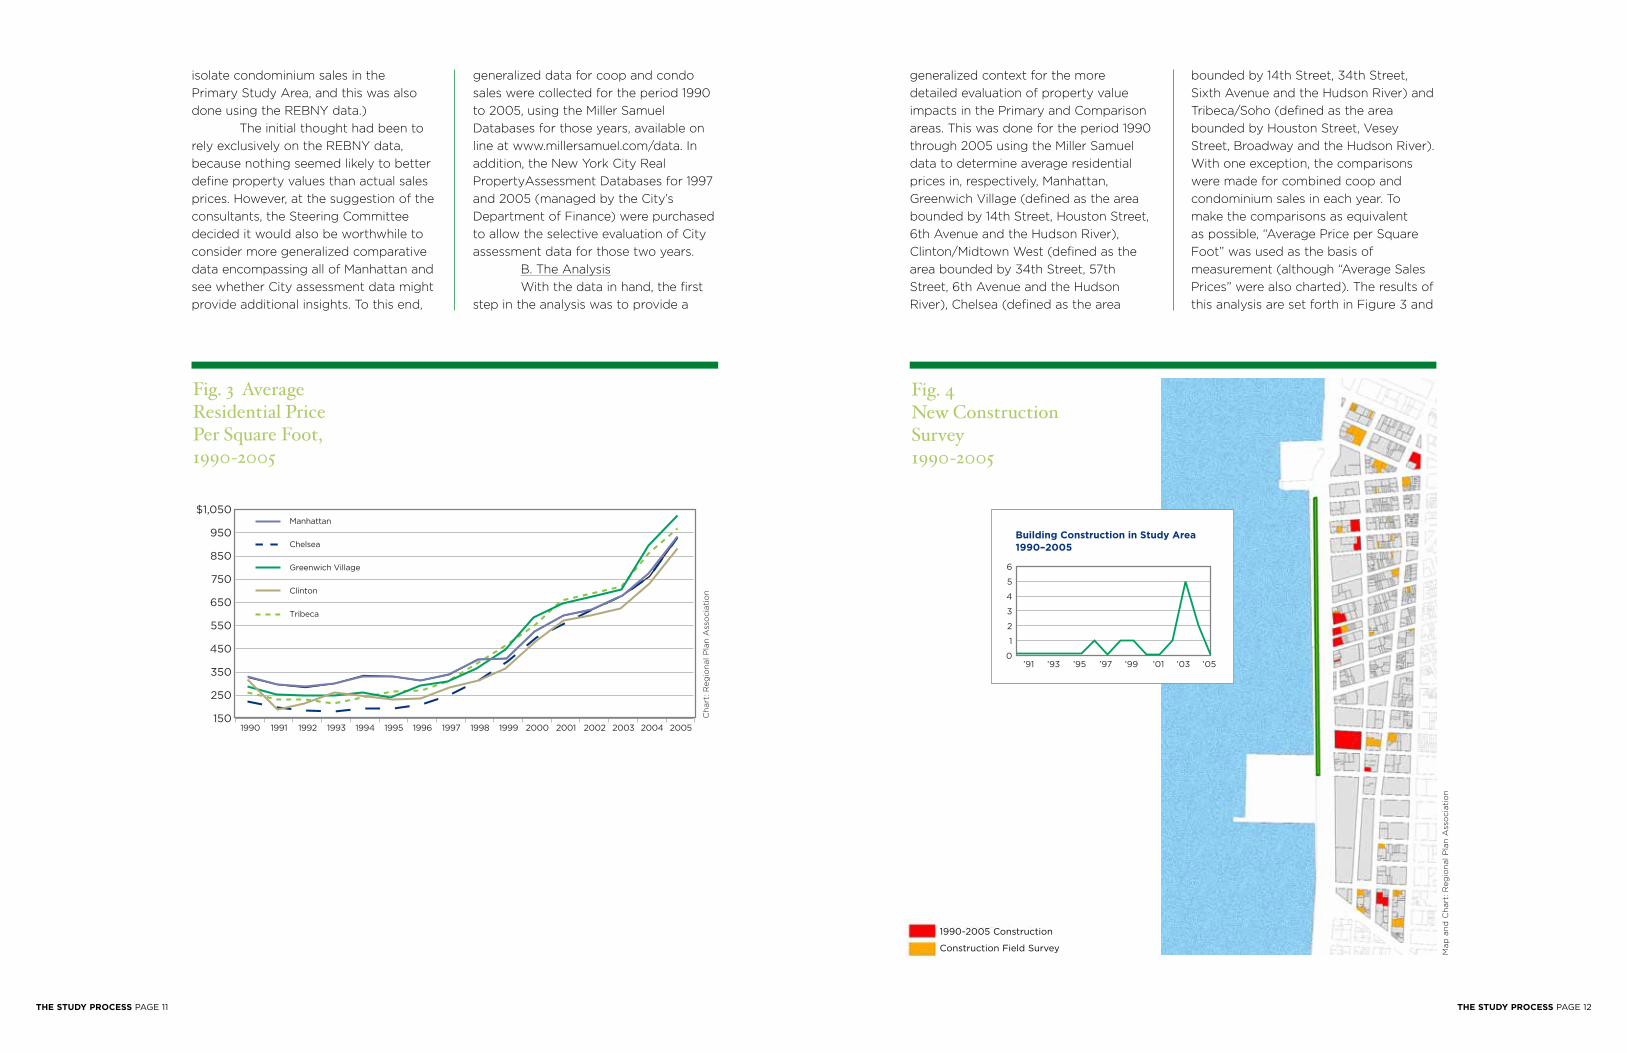
Prices” were also charted). The results of
this analysis are set forth in Figure 3 and
isolate condominium sales in the
Primary Study Area, and this was also
done using the REBNY data.)
The initial thought had been to
rely exclusively on the REBNY data,
because nothing seemed likely to better
define property values than actual sales
prices. However, at the suggestion of the
consultants, the Steering Committee
decided it would also be worthwhile to
consider more generalized comparative
data encompassing all of Manhattan and
see whether City assessment data might
provide additional insights. To this end,
generalized data for coop and condo
sales were collected for the period 1990
to 2005, using the Miller Samuel
Databases for those years, available on
line at www.millersamuel.com/data. In
addition, the New York City Real
PropertyAssessment Databases for 1997
and 2005 (managed by the City’s
Department of Finance) were purchased
to allow the selective evaluation of City
assessment data for those two years.
B. The Analysis
With the data in hand, the first
step in the analysis was to provide a
$1,050
950
850
750
650
550
450
350
250
1501990 1991 1992 1993 1994 1995 1996 1997 1998 1999 2000 2001 2002 2003 2004 2005
Manhattan
Chelsea
Greenwich Village
Clinton
Tribeca
Fig. 4 New ConstructionSurvey 1990-2005
Fig. 3 AverageResidential PricePer Square Foot,1990-2005
6
5
4
3
2
1
0’91 ’93 ’95 ’97 ’99 ’01 ’03 ’05
Building Construction in Study Area1990–2005
1990-2005 Construction
Construction Field Survey
THE STUDY PROCESS PAGE 12THE STUDY PROCESS PAGE 11
Ch
art
: R
eg
ion
al P
lan
Ass
ocia
tio
n
Map
an
d C
hart
: R
eg
ion
al P
lan
Ass
ocia
tio
n
Condominium Declaration
Number of Sales
Aggregate Price
Average Price
Median Price
20042003 2005
2
3
$3,700,000
$1,250,000
$1,350,000
5
158
$280,500,000
$1,775,000
$1,700,000
1
104
$296,000,00
$2,250,000
$1,900,000
Fig. 5 Building Sales and PriceTrends
Average Building Sales Price, 1990-2005
$4,500,000
4,000,000
3,500,000
3,000,000
2,500,000
2,000,000
1,500,000
1,000,000
500,000
01990 1991 1992 1993 1994 1995 1996 1997 1998 1999 2000 2001 2002 2003 2004 2005
Average Sales Price Primary
discussed below in this report.
The second step in the analysis
was to look at property values in the
Primary Study Area (across from and
within three blocks north and south of
the Greenwich Village section of the
Park that opened in 2003) from 1990
through 2005 and compare these values
– and the magnitude of the increases
in values – to those experienced in the
Comparison Areas (Clinton, Chelsea,
Tribeca) during the same period. For this
analysis, the REBNY data of actual sale
prices were used. Initially, the analysis for
the Primary Study Area was limited to
building sales, including sales that led to
new construction. Figure 4 identifies the
new construction in the area between
1990 and 2005. Figure 5 sets forth the
trends in the number of building sales
and building sales prices in the Primary
Study Area from 1990 through 2005.
While the initial analysis, limited
to building sales, was instructive of
trends in the Primary Study Area, it did
not provide a sound basis for compari-
son of trends in Clinton, Chelsea and
Tribeca because sales data for those
Fig. 6 Building SalesTransactions 2003-2005
Number of Building Sales, 1990-2005
250
200
150
100
50
01990 1991 1992 1993 1994 1995 1996 1997 1998 1999 2000 2001 2002 2003 2004 2005
Number of Sales Primary
areas included a substantial number
of condominium sales throughout the
1990-2005 period of study, whereas
condominium sales in the Primary Study
Area were virtually non-existent until
2004. In addition, because the REBNY
sales data for buildings did not identify
the size of the buildings sold or whether
the sales were of old, renovated or new
buildings, comparisons could easily be
skewed by one or two very large build-
ing sales. Accordingly, it was decided to
(1) limit the comparison of prices in the
Primary Study Area and Comparison
Areas to the three most recent years for
which we had data (2003, 2004 and
2005) and (2) separately chart building
and condominium sales and adjust
building sales by eliminating clearly
outsized transactions. In addition, to
adjust for a much larger number of
low-priced sales in the Comparison
Areas, the decision was also made to
include in the analyses only those
buildings that sold for more than
$1 million and condominiums that sold
for more than $500,000. The results
of these analyses are set forth
Buildings $1 Million - $75 MillionAverage Sales Prices and Number of Sales
2003
2004
2005
$5,300,000
16 Sales
$8,300,000
21 Sales
$12,600,000
11 Sales
55%
135%
$6,200,000
63 Sales
$8,100,000
66 Sales
$12,900,000
49 Sales
33%
110%
Primary Area Comparison AreaAggregate %+ Aggregate %+
Condos $500,000+ Average Sales Prices and Number of Sales
$1,250,000
3 Sales
$1.800,000
155 Sales
$2,325,000
127 Sales
45%
80%
$1,275,000
141 Sales
$1,775,000
360 Sales
$1,825,000
156 Sales
40%
45%
Primary Area Comparison AreaAggregate %+ Aggregate %+
2003
2004
2005
Fig. 7 CondominiumSales Trends 2003-2005
Fig. 8 CondominiumTransactions2003-2005
THE STUDY PROCESS PAGE 14THE STUDY PROCESS PAGE 13
Ch
art
s: R
eg
ion
al P
lan
Ass
ocia
tio
n
Ch
art
s: R
eg
ion
al P
lan
Ass
ocia
tio
n
Price variation attributed to Park
Three Blocks (Gansevoort/Clarkson)
Two Blocks (Gansevoort/Clarkson)
One Block (Gansevoort/Clarkson)
1997-20051990-2005AREA 2002-2005
3.1%
4.9%
2.6%
5.4%
9.8%
6.9%
12.3%
19.7%
10.3%
Price variation attributed to Park
Three Blocks (Gansevoort/Clarkson)
Two Blocks (Gansevoort/Clarkson)
One Block (Gansevoort/Clarkson)
2003-20052002-2005AREA 2004-2005
12.3%
19.7%
10.3%
12.9%
19.9%
9.2%
16.1%
26.1%
15.5%
$300,000,000
$250,000,000
$200,000,000
$150,000,000
$100,000,000
$50,000,000
01st Block Row 2nd Block Row
Aggregate Price
$33,387,559
$166,937,793
$48,530,493
$242,652,463
Attributable to Park
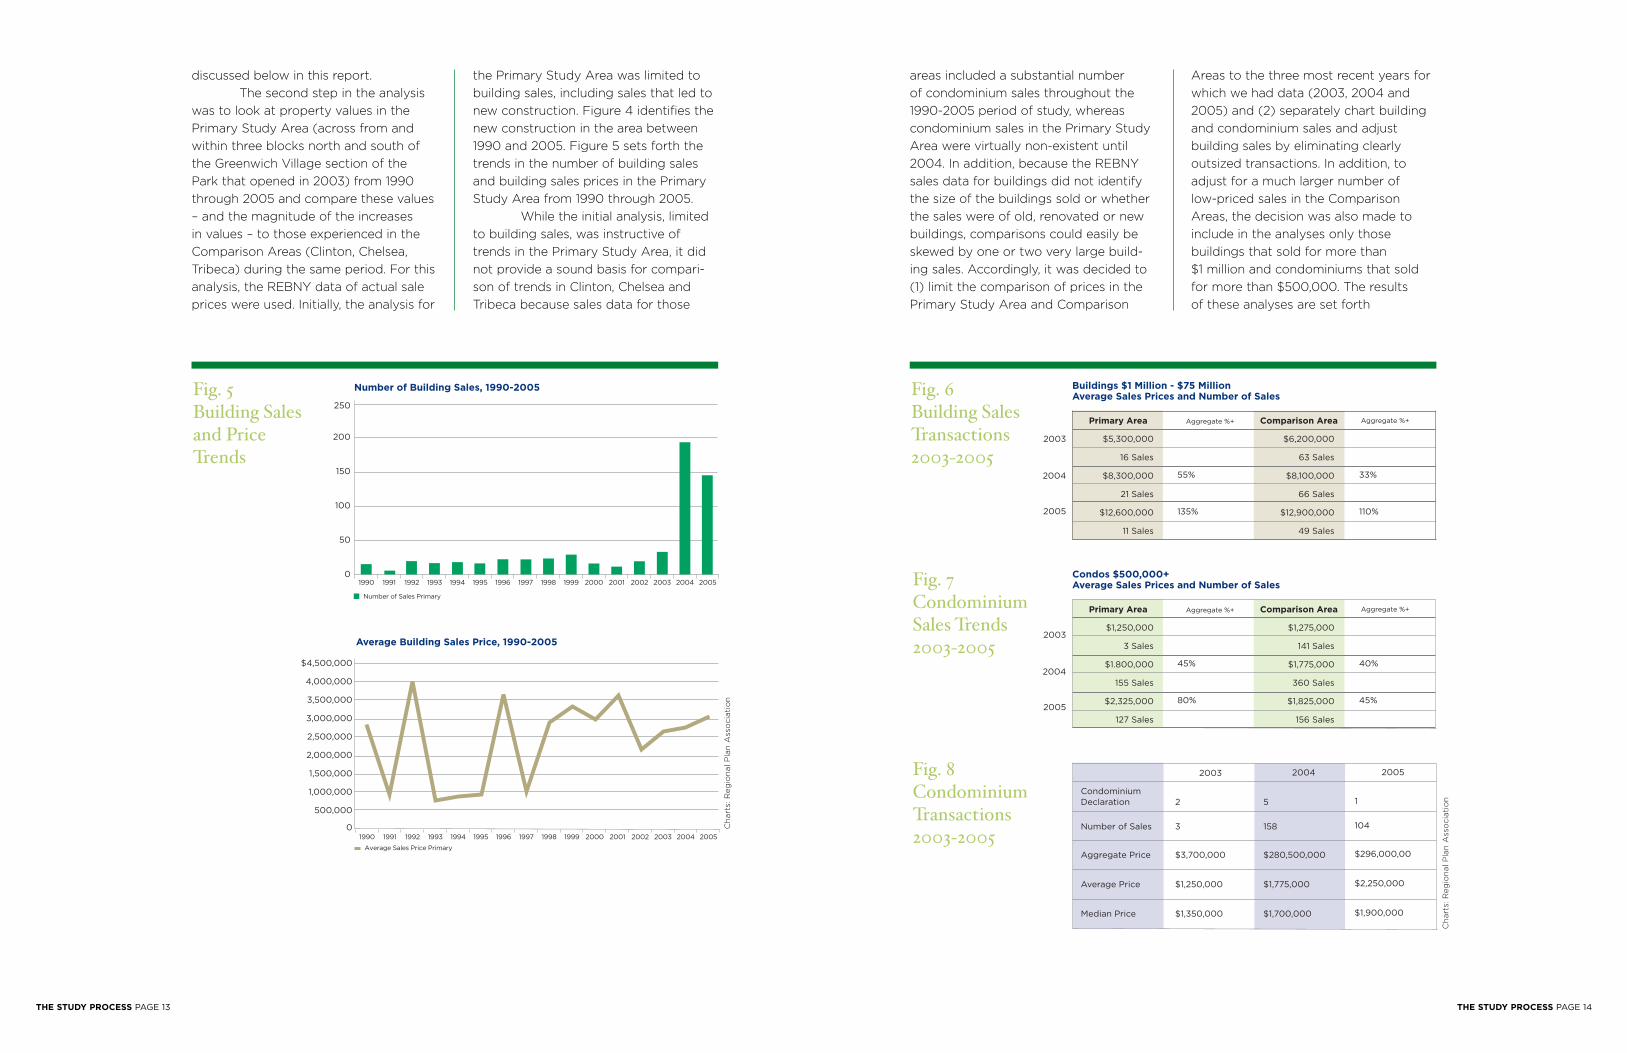
in Figures 6 and 7 and discussed below.
The consultants developed separate
condominium sales information for the
Primary Study Area for 2003, 2004 and
2005, the results of which are reflected
in Figure 8. The figures in this chart
include all recorded transactions for
the identified years, except for transfers
without consideration which clearly did
not reflect value. (Prior to 2003, there
was only one condominium sale in the
Primary Study Area.)
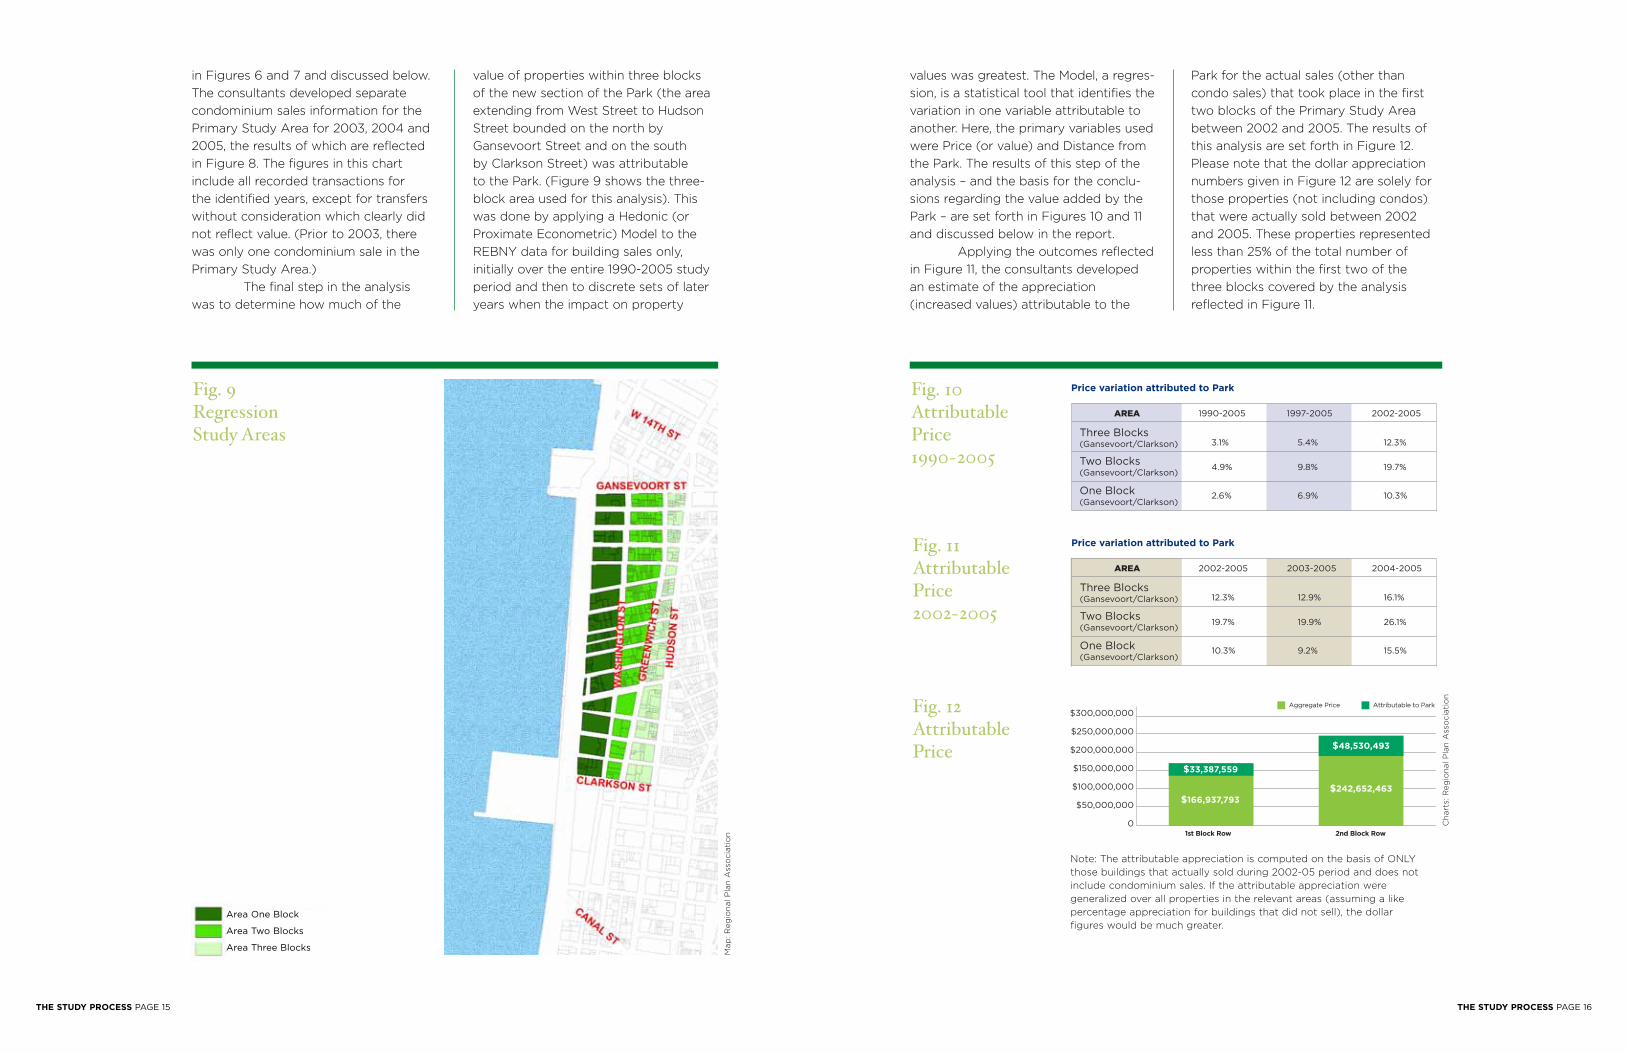
The final step in the analysis
was to determine how much of the
value of properties within three blocks
of the new section of the Park (the area
extending from West Street to Hudson
Street bounded on the north by
Gansevoort Street and on the south
by Clarkson Street) was attributable
to the Park. (Figure 9 shows the three-
block area used for this analysis). This
was done by applying a Hedonic (or
Proximate Econometric) Model to the
REBNY data for building sales only,
initially over the entire 1990-2005 study
period and then to discrete sets of later
years when the impact on property
Fig. 9 Regression Study Areas
Note: The attributable appreciation is computed on the basis of ONLY
those buildings that actually sold during 2002-05 period and does not
include condominium sales. If the attributable appreciation were
generalized over all properties in the relevant areas (assuming a like
percentage appreciation for buildings that did not sell), the dollar
figures would be much greater.
values was greatest. The Model, a regres-
sion, is a statistical tool that identifies the
variation in one variable attributable to
another. Here, the primary variables used
were Price (or value) and Distance from
the Park. The results of this step of the
analysis – and the basis for the conclu-
sions regarding the value added by the
Park – are set forth in Figures 10 and 11
and discussed below in the report.
Applying the outcomes reflected
in Figure 11, the consultants developed
an estimate of the appreciation
(increased values) attributable to the
Park for the actual sales (other than
condo sales) that took place in the first
two blocks of the Primary Study Area
between 2002 and 2005. The results of
this analysis are set forth in Figure 12.
Please note that the dollar appreciation
numbers given in Figure 12 are solely for
those properties (not including condos)
that were actually sold between 2002
and 2005. These properties represented
less than 25% of the total number of
properties within the first two of the
three blocks covered by the analysis
reflected in Figure 11.
Area One Block
Area Two Blocks
Area Three Blocks
Fig. 10 AttributablePrice 1990-2005
Fig. 11AttributablePrice 2002-2005
Fig. 12 AttributablePrice
THE STUDY PROCESS PAGE 16THE STUDY PROCESS PAGE 15
Map
: R
eg
ion
al P
lan
Ass
ocia
tio
n
Ch
art
s: R
eg
ion
al P
lan
Ass
ocia
tio
n

1. General Context –
Real Property
Values in
Manhattan and on the West Side
Figure 3 charts the direction
and movement of property values in
Manhattan and on the West Side south
of 57th Street from 1990 through
2005. The chart is based on the Average
Price Per Square Foot for sales of
condominiums and cooperative apart-
ments during the period, except in the
case of (a) figures for Chelsea, which are
for coop sales only, increased by 7% to
make them more comparable to the
combined coop/condo figures, and (b)
all 2005 figures, which are for coops
only, and also adjusted upwards by 7%
in an effort to make them comparable to
the combined numbers.
The chart shows that property
values have increased steadily through-
out Manhattan and on the West Side
south of 57th Street, but in recent years
the West Side numbers (other than
those for Clinton) have moved ahead of
those for all Manhattan, with the greatest
value increases in Greenwich Village
(55% since 2002). Over the 16 years
since the Park plan was announced,
buildings in Greenwich Village have
increased in value by approximately
300% (from $278 a square foot to
$1,020 a square foot), as compared to
approximately 200% for Manhattan as a
whole (from $319 a square foot to $930
a square foot). Value increases in other
West Side neighborhoods adjacent to
the Park also exceeded those of
Manhattan as a whole, though only
Tribeca approached the Greenwich
Village numbers. This is consistent with
the hypothesis that Hudson River Park
has had a positive impact on property
values in adjacent neighborhoods, and
where the Park has been completed,
the impact has been noticeably greater.
2. Property Value
Increases in the Primary Study Area
and Comparison Areas
Figure 5 charts the number
and average price of sales of
buildings and building lots (excluding
condominium transactions) in the
Primary Study Area from 1990 through
2005. The upper chart shows the
number of sales by year; the lower
chart presents the average sales prices.
Limited to building (and building lot)
sales, these charts do not reflect
household residential decisions, but
rather commercial investments by
developers and other buyers. As can
be seen from the upper chart, the
number of sales picks up in 1996
and continues at a modestly elevated
rate until 2000, then picks up again
in 2004. Sales prices, reflected in
Discussion of Results
< Opportunities to exercise on the waterfront were very limited before the creation of the Park. Pier 49, 1978.
DISCUSSION OF RESULTS PAGE 18DISCUSSION OF RESULTS PAGE 17
> Friends and neighbors can enjoy the piers after work.Evening dog walkers on Pier 45, 2007.
Ph
oto
an
d O
pp
po
site
Pag
e: S
helle
y S
ecco
mb
e
of the finished Park on real estate values.
It is an impact, moreover, that,
based on the Miller Samuel condomini-
um data, increased at an even greater
rate in 2006. The 2006 Miller Samuel
analysis reports that the average
per square foot price for condo sales in
Greenwich Village two years ago was
$1,545. This compares to a $1,142 per
square foot for all Manhattan condomini-
um sales, and per square foot prices
ranging from $1,047 to $1,251 for Clinton,
Chelsea and Tribeca – 20% to 35% lower
than condo sales prices in the areas
adjacent to the completed Park.
While the figures presented in
Figures 6 and 7 provide persuasive
evidence that the completed section of
the Park has had a particularly positive
impact on property values in the areas
adjoining it, it is worth emphasizing
that ALL the prices presented in
Figures 6 and 7, including those for the
Comparison Areas, reflect sales in
neighborhoods that adjoin Hudson River
Park as planned. We have already seen
in Figure 3 how prices since 1990 in each
of these neighborhoods rose higher than
overall apartment prices in Manhattan.
While many factors have undoubtedly
contributed to this outcome, it is not
unreasonable to conclude that some
part of the added value derived from the
increasing reality of Hudson River Park
and its implications to the quality of life
in these neighborhoods. Moreover, the
context of generally increasing property
values on the Lower West Side
neighborhoods adjacent to the Park
makes the comparisons set out in
Figures 6 and 7 all the more powerful,
since the sharp increases in prices shown
in the Primary Study Area are being
measured against a baseline that is itself
increasing, in part, we believe, as more
sections of the new Park are completed.
the lower chart, move up and down
within a relatively narrow band until
2003, when they shoot up and continue
to escalate sharply in 2004 and 2005.
The last phenomenon suggests that
the completion of the Park has had
a major upward impact on adjacent
property, whereas earlier plans,
announcements and commitments
increased the number of sales but had
little impact on prices. (It should be
noted, however, that building sale prices
in the Comparison Areas followed a
similar pattern at similar levels; this may
reflect the impact of the prospective
Hudson River Park.)
Figures 6 and 7 chart the
number of real property sales, including
condominium sales, and the average
price of those sales for BOTH the
Primary Study Area and the Comparison
Areas from 2002 through 2005.
Figure 6 is limited to building and
building lot sales, while Figure 7 presents
condominium sales. Each figure presents
both the number of sales annually
and the average price of those sales.
(For the reasons described earlier in
this report, building sales are for all
transactions between $1,000,000 and
$75,000,000, while condominium sales
are for all transactions of $500,000 or
greater.) The relationship between the
number of building sales in the Primary
Study Area and the Comparison Areas is
consistent over all three years. By con-
trast, condo sales in the Comparison
Areas are much more numerous in 2003.
They are also considerably higher in
2004 and 2005, consistent with the
different sizes of the two areas (the
Comparison Area is almost three times
as large as the Primary Study Area).
However, despite the size differential,
the margin narrows considerably by
2005, reflecting the increasing strength
of the condominium market in the
Primary Study Area.
Figures 6 and 7 also present
the Average Sales Prices for the real
property sales that took place in the
Primary Study Area and the Comparison
Areas in 2003, 2004 and 2005. Figure 6
presents the price data for building
sales and Figure 7 for condominium
sales. Because these charts reflect
sales prices for buildings AND condos,
they account for both commercial
investment decisions (building sales)
and residential decisions.
As can be seen from the lower
chart on Figure 6, building sales prices
in both the Primary Study Area and
the Comparison Areas are quite similar
and have similar trends – i.e., both show
a sharp escalation in building prices
between 2003 and 2005. Indeed, for
both areas, sales prices more than
double in this three year period, with
sales prices in the Primary Area showing
a greater percentage increase (135%
compared to 110%), but with dollar
values slightly higher in the Comparison
Areas. The most that can be drawn
from these figures is with respect to
building sales, all the areas within
three blocks of Hudson River Park
from Clinton to Tribeca experienced
remarkable escalation from 2003 to
2005.
The numbers trend in the same
direction, but with greater differentiation,
in the case of condominium sales during
the same period. This is reflected in
Figure 7, which shows average sales
prices in both the Primary Study Area
and the Comparison Areas escalating
sharply in this three year period. But the
price escalation was much greater in the
Primary Study Area – from $1,250,000
to $2,325,000, or 80% – than in the
Comparison Areas – from $1,275,000
to $1,825,000, or 45%. These figures
reflect a strong escalation of condomini-
um prices along the entire length
of Hudson River Park, but with the
greatest increase in prices in the Primary
Study Area, adjacent to the completed
section of the Park. This is strong
evidence of the positive impact
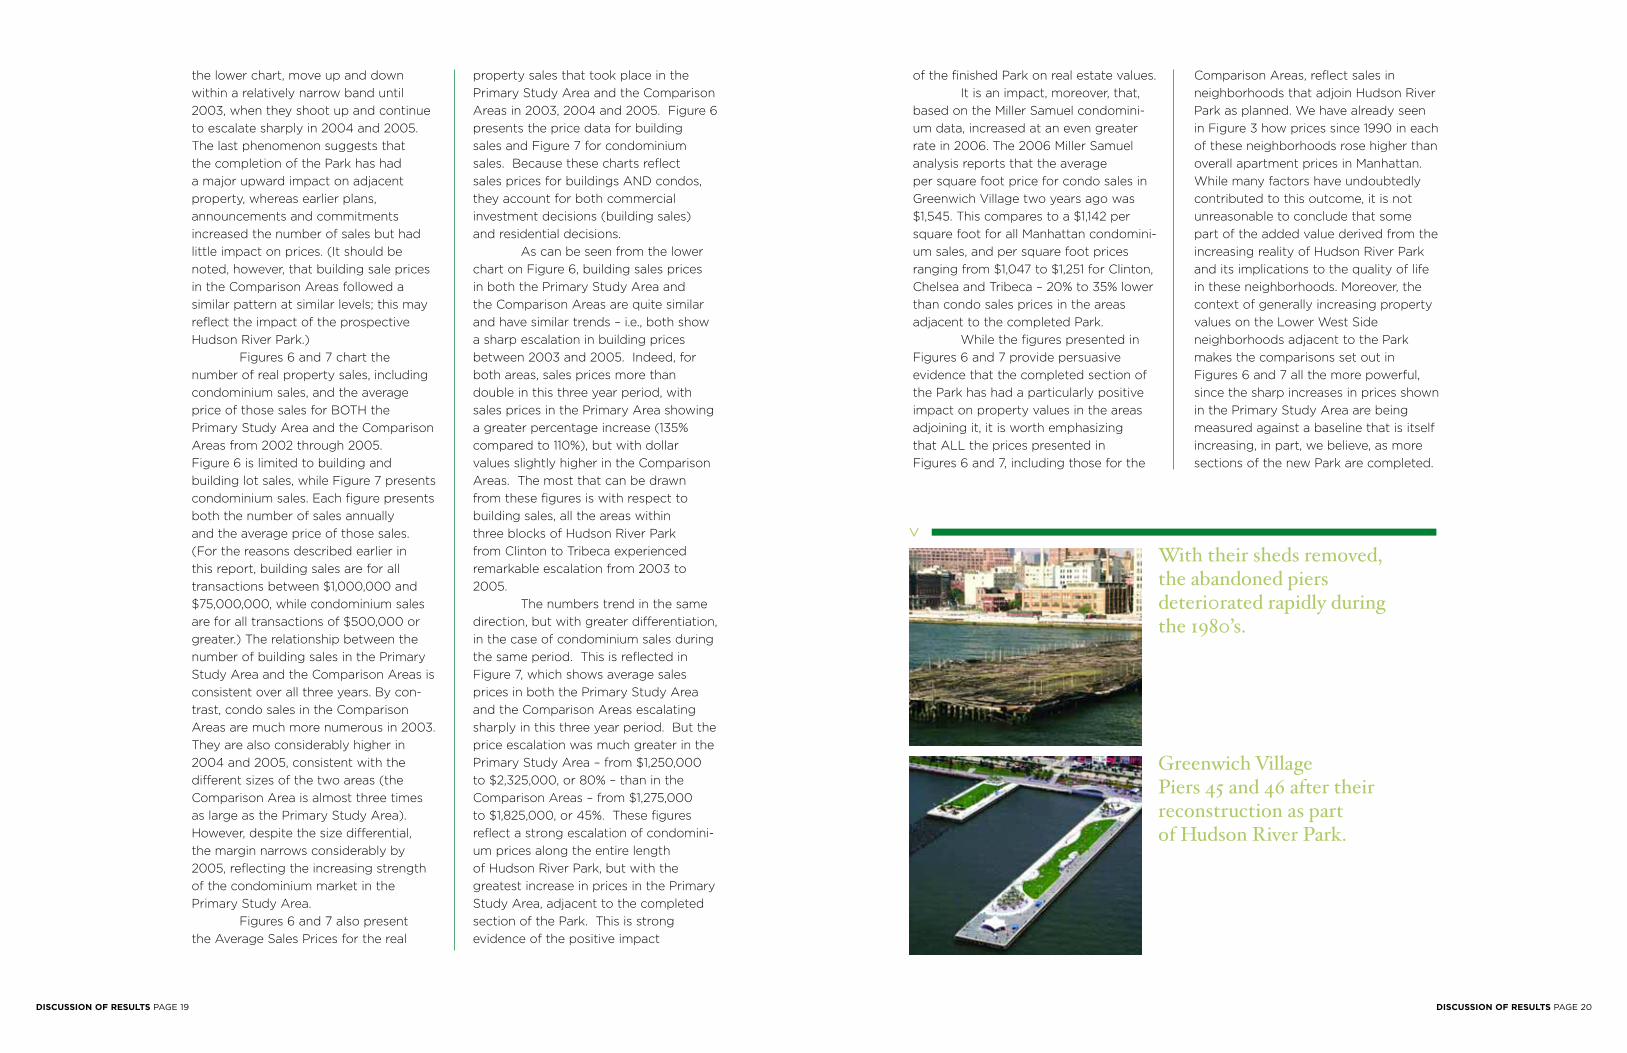
With their sheds removed,the abandoned piersdeteri0rated rapidly duringthe 1980’s.
DISCUSSION OF RESULTS PAGE 20DISCUSSION OF RESULTS PAGE 19
Greenwich Village Piers 45 and 46 after theirreconstruction as part of Hudson River Park.
>

>
minimal in the first seven years after the
Park plan was first announced, but
begins to grow in 1997, when firm
funding commitments are made, and
accelerates rapidly as the Greenwich
Village section of the Park nears
completion and then opens. In short,
the closer the Park is to providing its
benefits in reality, the greater the value
that it adds to adjacent properties
within two blocks.
It is worth noting that the
value added in the blocks directly across
from the Park is somewhat less than
that added in areas one block further
inland. This may due in part to the
limited number of building sales in the
first row of blocks; if condominium
sales had been included, the results
might have been different. Alternatively,
it may reflect the presence of West
Street (Route 9A), and the traffic
it brings to the doorsteps of the
buildings closest to the Park. Still, the
added real estate value in the blocks
closest to the Park is substantial and
may be accelerating.
Figure 12 presents an estimate of
the impact of the Park, in actual dollars,
of those buildings and building lots in
the Primary Study Area that were
sold between 2002 and 2005. In making
these estimates, we have used 20% as
the appropriate factor to apply to
determine attributable value. Applying
this factor to the aggregate value of
sales in the first two blocks of the
Primary Study Area from 2002 to 2005,
Figure 12 shows that $48.5 million of
value was attributable to the Park. This
may seem to be a modest number, but
in fact it is huge, because it represents
the appreciation attributable to ONLY
those buildings sold in the 2002 to
2005 period. Since there are at least
four times this number of buildings,
building lots and condominiums in the
two block area, the total increase in
value attributable to the Park – in
Greenwich Village alone – probably
approaches and may well exceed
$200 million.
It should also be noted the
calculation of Attributable Value
presented in Figure 12 does not reflect
condominium sales, where it might be
expected that the greatest increases in
value would be realized. However, to
include condominiums in the evaluation
would have required the development of
a new model with new factors, including
the amounts invested by the developers
of the condominiums. This was beyond
the scope of this study, as was any
calculation of the tax, wage and other
indirect benefits that would have
resulted from such conversions and the
associated property transfers. We may
seek to develop these benefits more
fully in another study.
3. Property Value Increases
Attributable to Hudson River Park
Figures 10 and 11 present the
results of Hedonic model that was
applied to building sales (not including
condominium sales) in the Primary
Study Area to correlate Price (Value)
with the Distance of the Property from
Hudson River Park, and to thereby
calculate the percentage of Price
(Value) attributable to the presence of
the Park.
Figure 10 presents the results
on this analysis over three periods
between 1990 and 2005. As can be
seen from this Figure, the Park had a
considerable impact on properties
as far as three blocks (1,650 feet)
removed from it. The impact was
greatest, however, in the two blocks
closest to the Park, and increasingly
so as the Greenwich Village section of
the Park neared completion. For sales
that took place between 1997 and
2005, approximately 10% of the value
of properties sold was attributable to
the Park
Figure 11 is an extension of
Figure 10, presenting results for the
more recent years only. Here, the impact
of the Park in increasing property
values becomes even clearer. Again,
the impact on properties was
measurable within all three blocks that
were analyzed, but was greatest for
properties within two blocks of the
Park. Within these blocks, for the period
2002 to 2005, approximately 20% of
the value of the properties sold was
attributable to the Park. When the
analysis is limited to 2004 and 2005,
this percentage increases to 26%.
Of course, it is unlikely that
the new Park is the sole factor in the
increases in value identified in Figures 10
and 11. Among other factors, the
clean-up of the derelict waterfront itself
and the quality of the architecture of
new buildings contributed to the
increases. However, it is worth noting
that while the clean-up of the waterfront
was largely complete by 1995, our
analyses indicate the value of adjacent
properties did not begin to increase
steadily until 1997 and did not increase
significantly until 2003. Similarly, while
the quality of architecture of the Richard
Meier-designed buildings at Perry Street
has undoubtedly increased the value
(price) of the condominiums in those
buildings, the analysis reflected
in Figures 10 and 11 does not include
condominium sales and thus does not
reflect increases in value credited to
design excellence.
In general, the results set out
in Figures 10 and 11 follow the same
patterns identified with the earlier
analyses of sales and sale prices. The
impact of the Park on value added is
Outdoor recreation space is hard to find in the cityand the Park provides newopportunities. ExtremeGymnastics, 2008.
Programming provides entertainment and education for Park visitors and supports
local and citywide arts and cultural organizations.
Concert on Pier 45, 2006.
DISCUSSION OF RESULTS PAGE 22DISCUSSION OF RESULTS PAGE 21
Ph
oto
: S
helle
y S
ecco
mb
e
Ph
oto
: S
helle
y S
ecco
mb
e
>

< Active recreation opportunities close to homeenhance the desirability of the adjacent neighborhoods.
The goal of the study
described in this
report was to determine
whether Hudson River Park added
value to the properties adjacent to it
and, if it did, to estimate the magnitude
of that impact. Other studies of the
relationship between parks and nearby
real estate generally supported the
proposition that parks add value to
adjacent properties, but few, if any,
analyzed the transformation of industrial
waterfront property to parkland or used
as comprehensive a database. In the
view of the Steering Committee, the
results demonstrate quite clearly – and
not surprisingly – what seemed evident
from visual observation: the completed
Greenwich Village section of Hudson
River Park has dramatically increased the
values of the real estate within three
blocks of that section.
While this finding is the outcome
of the immediate study, it is only the
first step in a process that we hope will
ensure that the value added by the
Park is maintained. As noted in the
introduction to this report, the study
originated due to concern that the
mechanisms in place to finance the
operations and maintenance of Hudson
River Park – i.e., the capture of lease
revenues from the three commercial
nodes in the Park (including Pier 40) –
would not generate enough money to
maintain the Park in world-class
condition. Equally important, no
provision has been made for a reserve
(or sinking) fund that will be essential for
capital replacement as the Park ages.
If this situation remains unchanged,
there are only two possible outcomes:
either government or private sector
charity will have to provide the resources
to meet the funding shortfall or the Park
will deteriorate, with a resulting decrease
in the quality of life and property values
in adjacent neighborhoods.
To ignore this would be to ignore
history. Central Park is the foremost
example. Even the City’s greatest park
was allowed to fall into abysmal
conditions, and it was only the efforts
of the Central Park Conservancy that
reversed the decay.
Union Square Park provides
another cautionary lesson. Allowed to
deteriorate to the point where few cared
to use it, the Park’s shabbiness affected
adjacent neighborhoods, leading to a
decline in the quality of life and lower
property values. A decision to rehabili-
tate the Park, along with the work of the
14th Street BID, revitalized the area, and
today the Park is a gathering place for
New Yorkers from all walks of life, while
the Union Square area is one the hottest
real estate markets in the City.
Then there is Bryant Park. In the
late seventies the park was in disrepair
Next Steps
NEXT STEPS PAGE 23
> Shade structures increase the usability of the piers in the summer.

long run. At the same time, the goal
from the beginning has been to avoid
competing with other parks for funding
and minimize the need for government
maintenance money. It is possible that
private sector charity could make up
some of the operating shortfall, but this
is uncertain over time, and it is unlikely
that charity could cover capital mainte-
nance. If these suppositions are correct,
then another mechanism will need to be
found to cover the funding shortfalls, or
else the slow deterioration of the Park
will almost certainly follow. The experi-
ence at Union Square and Bryant Park
suggest that if that happens, property
values will plummet and disinvestment
could follow.
The experience at Bryant Park
suggests one option – the creation of a
Business Improvement District (or BID),
which would raise the funding needed to
maintain the Park by charging those
who benefit the most from the Park a
monthly or annual fee. A Hudson River
Park BID, like the Bryant Park BID, could
collect the funds and then contract out
the maintenance work it deemed neces-
sary and appropriate. The contractor
would presumably be the Hudson River
Park Trust, which is already in place and
expending substantial funds of its own
on Park operations and maintenance.
But the BID should have discretion to
use other contractors if and when this
seemed the better course.
A major difference between the
Bryant Park BID and one that might
be established for Hudson River Park
is that at Bryant Park those who
pay the fees are predominantly business
owners, whereas along Hudson River
Park, the beneficiaries – and thus
those who would pay – are predomi-
nantly residential owners, of both
condominiums and buildings. While the
current law governing the creation of
BIDs makes no distinction between
commercial and residential ownership,
and there are residential properties in
the Bryant Park and Union Square BIDs,
that difference may be an important
one. In addition, there is the underlying
issue of imposing additional fees –
which many will call a tax – on City
residents and, beyond that, singling out
a particular group as responsible for
paying such fees.
The justification, of course, is
that those who would be asked to pay
under a BID structure applicable to
Hudson River Park would be those who
have the biggest benefit from the Park,
have the greatest interest in seeing the
Park maintained (and secured) in the
best possible condition and whose
quality of life and property values will
be the most severely impacted if
the Park deteriorates due to lack of
adequate funding.
and widely felt to be unsafe. Adjacent
buildings had empty office and retail
space even though rents were low. The
Bryant Park Restoration Corporation was
formed in 1980, and a business improve-
ment district to support park mainte-
nance created in 1985. The reconstruc-
tion of the Park was completed in 1992.
The following year, The New York Times
reported that park view property was
already commanding a $3/square foot
premium over adjacent space lacking
that amenity. The turnaround has been
so dramatic that two major building
projects now have “Bryant Park”
addresses. Some rents in these build-
ings exceed $1,000 a square foot.
The process of Bryant Park’s
redevelopment and the increase in the
value of neighboring real estate was
slow but steady, not picking up substan-
tial momentum until the park restoration
was complete and it was demonstrated
that the financing structure was in place
to insure a continuing program of high
quality maintenance. Because of the
Park’s long history of neglect and vio-
lence, it took a number of years for
investors to become convinced that the
park’s renewal was permanent. The pro-
vision of high-quality maintenance and
security services over a period of two to
three years proved essential to attracting
new investment. One of the principal
lessons from the experience of Bryant
Park was that high-quality maintenance
was at least as, if not more, important
than the improved design and physical
amenities.
As in the case of Bryant Park, it
has taken many years to move Hudson
River Park from an idea to reality. Early
removal of derelict piers, municipal facili-
ties and dangerous conditions was not
enough to generate significant increases
in property values. Only when the
Greenwich Village section of the Park
was nearing completion (over a decade
after the Park plan was announced) did
investors have the confidence to commit
private funding to the area. And as in
the case of Bryant Park, there can be
little doubt that high-quality mainte-
nance will be equally important to these
investors – many of whom will be con-
dominium owners – in maintaining the
increased values. It is not simply the
creation of new parks or the renovation
of old ones that makes the difference.
The maintenance of the new infrastruc-
ture is equally important, and when that
fails, disinvestment is the result.
That challenge faces Hudson
River Park even as it is being built. It is
unlikely that the lease revenues from
commercial nodes within the Park will
generate sufficient funding to meet
operating and normal maintenance
costs, much less provide a reserve fund
to cover capital maintenance over the
Over 60% of the Hudson River Park is a marine sanctuary. New Yorkers are sailing, swimming, fishing and venturing out into the river for the first time in a century.
Opportunities for organizedsports enhance public health and teach teamwork.Soccer players, Pier 40.
NEXT STEPS PAGE 26NEXT STEPS PAGE 25
> >

The Real Estate Board of New
York estimates that more than 79 million
square feet of developable space
exist immediately adjacent to the
Hudson River Park. The Hudson River
Park Trust estimates that there will be a
$4 – 5 million/year gap between revenue
generated in the Park and annual
operating costs. Therefore, if a BID were
created the affected property owners
would be asked to make only small
annual contributions to support a
portion of overall maintenance and
programming costs, since the greater
part of these will be derived from
lease revenues in the Park. Indeed,
considering the circumstances surround-
ing Hudson River Park, it is quite
possible that owners close to the Park
would be enthusiastic about paying a
small amount on top of their property
taxes to ensure its upkeep, viewing it as
a more attractive alternative than an
unsafe and decaying waterfront.
In any case, a BID is not some-
thing that could – or should – happen
overnight. To create such a district – or
any other kind of special district – for
the particular purpose of maintaining
park properties involves fundamental
City policy and requires a great deal of
consideration by the potential stakehold-
ers, including the City, the real estate
industry and, to the extent it is feasible,
representatives of the affected property
owners. There are other mechanisms
that could be used – for example, some
kind of tax increment financing district
or a small add-on to the real estate
transfer tax in the affected area.
These and other issues, including
how far a district should extend, were
examined before a conclusion was reached,
one way or another, regarding the wis-
dom and political feasibility of charging
nearby owners a portion of the upkeep
and capital maintenance of the Park.
Consequently, Friends of Hudson
River Park circulated this report in draft
among key public officials, members of
the real estate community and members
of the environmental and parks advoca-
cy community to share our conclusions,
seek their critique of the work, and solic-
it their input on appropriate mechanisms
that would allow a small portion of the
added value identified in the report to
be captured for maintenance and long-
term capital replacement.
Based on this review, consulta-
tion and consideration of a variety of
alternatives to capture a portion of the
appreciated value, Friends recommends
that a process of establishing a Business
Improvement District (BID) for the
Hudson River Park, by which adjacent
property owners would be assessed a
fee and the funds dedicated specifically
to the maintenance and programming of
the Park, be initiated. While the eco-
nomic and political viability of such a
financing mechanism remains to be fully
explored, the principle of assessing
neighboring property owners seems
sound, as these landowners benefit most
from the added value of the Park and
stand to lose the most if the Park were
to fall into disrepair.
NEXT STEPS PAGE 27
The Hudson River Park bikeway is one of the best used in thenation and still provides solitude for early morning rides, 2004.
Photo: Shelley Seccombe
>
There are many Business
Improvement Districts
(BID) in New York City
where property owners
pay into a fund to
enhance maintenance
and programming. The
benefits of the BID are easily illustrated
by the success of comparable initiatives
in Bryant Park and Union Square Park.
Revenue generated in a Hudson
River Park BID could be used for overall
Park operation maintenance and capital
replacement and/or targeted to
improvements in the neighborhoods
generating the revenue i.e. Tribeca,
Greenwich Village, Chelsea and Clinton
so participants see tangible benefit from
BID payments. In addition, BID funds
could be used to leverage, or match,
other sources of public funding.
Establishing a Hudson River Park
BID to finance the entire outstanding
needs of the Park will be challenging,
given the number of residential
properties in the target area and varying
neighborhoods. Friends is aware that
there would be an impact on low-income
residents and long-standing small
business owners who lease nearby
facilities and a mechanism to address
concerns must be developed. There are
legitimate concerns that a BID could be
used as a rationale to reduce public
maintenance funding for the Park. Given
the increased prices paid for properties,
and the increased taxes already being
paid due to Park proximity, residents
might see a BID as an additional burden.
However, without the creation
of a BID the Hudson River Park will
have to compete with other parks for
limited funding or expand development
in the Park to pay for its maintenance
and operation. Otherwise, the Park
itself will deteriorate from insufficient
maintenance and lack of capital
replacement funds. Friends believes
A Hudson RiverPark BusinessImprovementDistrict
that the establishment of a BID can
provide the final element of public park
funding anticipated when the Park was
first recommended: public funding for
the initial capital; funds generated by
commercial nodes in the Park, and a
portion of increased inland real estate
value attributable to the Park for long-
term maintenance and programming;
and private-sector charitable support
augmenting all efforts.
The NYC Department of Small
Business Services (SBS) has a seven-
month statutory process for vetting BID
applications. Based on the results of this
study, strong community support for the
Hudson River Park and our understand-
ing that projected revenue generated in
the Park will not meet maintenance and
programming needs; Friends will initiate
the process to further analyze needs and
opportunities in preparing an application
for the establishment of a Hudson River
Park BID to submit to SBS so a public
review and approval process which
includes local Community Boards, the
City Planning Commission, City Council
and Mayor can begin.
While our immediate focus will
remain Hudson River Park, we believe
the findings in this report are likely
to apply to other new and renovated
parks in the City and State. Although
we have selected a BID as the most
practical mechanism to capture a small
part of resulting benefits for the Hudson
River Park, other mechanisms may be
more suitable for other new and
renovated parks. At the same time, if
our findings are valid, they suggest that
the economic benefits to the City of
well-maintained parks are considerably
greater than has been credited up
to now and, as a result, that special
mechanisms to ensure their upkeep
would not only be justified, but also
constitute a positive economic policy
for the City over the long term.
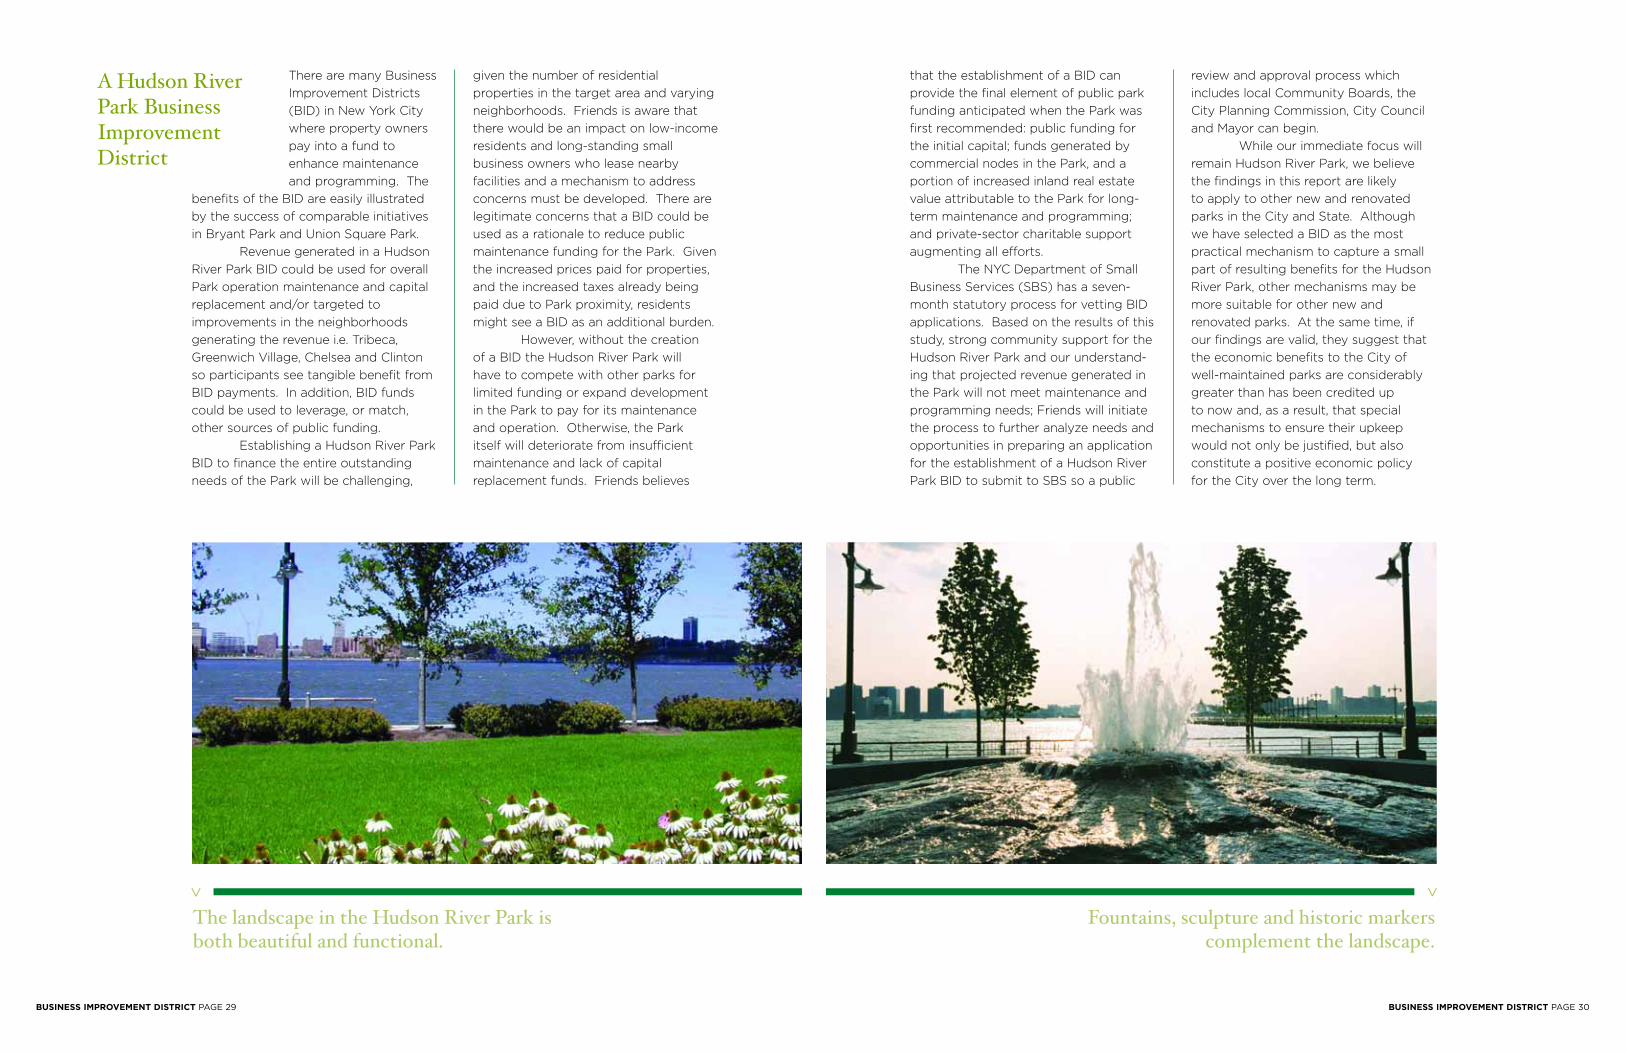
Fountains, sculpture and historic markers complement the landscape.
The landscape in the Hudson River Park isboth beautiful and functional.
BUSINESS IMPROVEMENT DISTRICT PAGE 30BUSINESS IMPROVEMENT DISTRICT PAGE 29
>>
Burton, Mark.
Public Parks,
Housing Values and
Fiscal Flexibility. 2003
Cherinh, Andrew. Geoadditive Hedonic
Pricing Models. 2004
Crompton, John. Parks and Economic
Development. APA/PAS. 2001
Crompton, John. The Impact of Parks
on Property Values: A Review of the
Empirical Evidence. Journal of Leisure
Research 2001, Vol. 3, No. 1 pp. 1-31
Elliott, Peter. The Valuation of National
Parks: Analysis, Methodology and
Application. IASCP Pacific Regional
Meeting, 2001
Epstein, Richard. The Ubiquity of the
Benefit Principle. The Law School of the
University of Chicago. No date.
Ernst & Young/New Yorkers for Parks.
How Smart Parks Investment Pays Its
Way. 2002
Espey, Molly. Parks and Property Values
in Greenville, South Carolina. Department
of Agricultural and Applied Economics,
Clemson University. January 2001
Fausold, Charles and Lillieholm, Robert.
The Economic Value of Open Space: A
Review and Synthesis. Lincoln Institute
of Land Policy. 1996
Fox, Tom. Urban Open Space: An
Investment that Pays. Neighborhood
Open Space Coalition. 1990
Griffith, Daniel. Multivariate Statistical
Analysis for Geographers. Prentice
Hall. 1997
Hamilton, Rabinovitz & Alschuler.
Revenue Generating Measures for Open
Space in New York City. July 1992.
Husted, Jeppe. Cost-Benefit Evaluation
of Infrastructure: Doing it the Hedonic
Way. Centre of Traffic and Transport,
Technical University of Denmark. 2002
Lake, Mary Beth. Hedonic Valuation of
Proximity to Natural Areas and Farmland
in Dakota. No date.
Lutzenhiser, Margot. The Effect of
Open Spaces on a Home’s Sale Price.
Contemporary Economic Policy.
July 2001
Orford, Scott. Location in an Urban
Housing Market. School of Geographical
Sciences, University of Bristol. No date.
The Parks Council/Central Parks
Conservancy. Public Space for Public
Life: A Plan for the Twenty-first Century.
December 1993
Trust for Public Land. Increasing Public
Investment in Parks and Open Space
(Volumes 1 and 2). 1998
Tyrvainen, Lisa. The amenity value of
the urban forest: An Application of the
Hedonic Pricing Method. Landscape and
Urban Planning. 1997
Urban Land Institute. Remaking the
Urban Waterfront. 2004
Waxman, Andrew. Hedonic Modeling of
Open Space in James City County.
No date.
Wolf, Kathleen. Public Value of Nature:
Economics of Urban Trees, Parks and
Open Space. Proceedings of the 35th
Annual Conference of the Environmental
Design Research Association. 2004
Bibliography Albert K. Butzel is the former President
of Friends of Hudson River Park, repre-
sented Friends on the Steering
Committee, oversaw the research and
drafted this Report.
Paul Elston is President of the
Riverside South Planning Corporation
and was previously Chair of the
Waterfront Park Coalition. He served as
the Coalition representative on the
Steering Committee.
Connie Fishman is President and CEO
of the Hudson River Park Trust. She
served as the Trust’s observer on the
Steering Committee.
Tom Fox is President of New York Water
Taxi and a director of Friends of Hudson
River Park, whom he represented on the
Steering Committee. Mr. Fox was the
first President of the Hudson River Park
Conservancy, authored Urban Open
Space: An Investment that Pays (see the
Bibliography) and produced this Report.
Laura Hansen is Program Officer at
The J. M. Kaplan Fund, which provided
the funding for the study and the
Report. Ms. Hansen participated as an
observer on the Steering Committee.
Robert Pirani is Director of
Environmental Programs for the
Regional Plan Association and Executive
Director of the Governors Island Alliance.
He represented RPA on the Steering
Committee.
Philip Pitruzzello is cur-
rently Vice President for
Manhattanville Capital
Construction at
Columbia University
and was previously Vice President for
Real Estate at Time Warner. He is also
Chair of New Yorkers for Parks and
served as its representative on the
Steering Committee (assisted by Micaela
Birmingham and Maura Lout).
Michael Slattery is Senior Vice President
and Head of Research for the Real
Estate Board of New York, whom he
represented on the Steering Committee,
and provided much of the data used in
the Study.
Andrew Manshel is the President of
Jamaica Capital Corporation and was
previously General Counsel for the
Bryant Park Restoration Corporation and
the 34th Street Business Improvement
District. He served as a consultant for
this Study and participated actively in
the Steering Committee discussions.
L. Nicolas Ronderos is Senior Planner
at the Regional Plan Association.
Mr. Ronderos served as a consultant for
this Study, was responsible for much of
the technical work and participated
actively in the Steering Committee
discussions.
Glenn Brill is an independent consultant,
formerly with Ernest & Young, who
researched and wrote the report How
Smart Investment Pays Its Way (see
the Bibliography). As a consultant to
this project, Mr. Brill helped develop
the parameters of the Study and
attended two meetings of the Steering
Committee.
Brief Bios for Steering Committee
Members
BRIEF BIOS PAGE 32BIBLIOGRAPHY PAGE 31