impact findings from the head start cares demonstration impact report... · impact findings from...
TRANSCRIPT

Impact Findings from the Head Start CARES DemonstrationNational Evaluation of Three Approaches to Improving Preschoolers’ Social and Emotional Competence
OPRE Report 2014-44August 2014

THIS PAGE INTENTIONALLY LEFT BLANK

Impact Findings from the Head Start CARES Demonstration: National Evaluation of Three Approaches to Improving
Preschoolers’ Social and Emotional Competence
OPRE Report 2014-44
August 2014
Authors: Pamela Morris (New York University/MDRC), Shira K. Mattera (MDRC), Nina Castells (MDRC), Michael Bangser (MDRC), Karen Bierman (The Pennsylvania State University), Cybele Raver (New York University)
Submitted to:
Ann Rivera, Project Officer Office of Planning, Research and Evaluation
Administration for Children and Families U.S. Department of Health and Human Services
Project Director: Pamela Morris MDRC
16 East 34th Street New York, NY 10016
Contract Number: HHSP23320072909YC
This report is in the public domain. Permission to reproduce is not necessary.
Suggested citation: Morris, Pamela, Shira K. Mattera, Nina Castells, Michael Bangser, Karen Bierman, Cybele Raver (2014). Impact Findings from the Head Start CARES Demonstration: National Evaluation of Three Approaches to Improving Preschoolers’ Social and Emotional Competence. OPRE Report 2014-44. Washington, DC: Office of Planning, Research and
Evaluation, Administration for Children and Families, U.S. Department of Health and Human Services.
Disclaimer: The views expressed in this publication do not necessarily reflect the views or policies of the Office of Planning, Research and Evaluation, the Administration for Children and
Families, or the U.S. Department of Health and Human Services.
This report and other reports sponsored by the Office of Planning, Research and Evaluation are available at http://www.acf.hhs.gov/opre

MDRC is conducting the Head Start CARES project and disseminating its findings under a contract with the Office of Planning, Research and Evaluation in the Administration for Children and Families, U.S. Department of Health and Human Services (HHS), funded by HHS under a competitive award, Contract No. HHSP23320072909YC. The project officer is Ann Rivera. Dissemination of MDRC publications is supported by the following funders that help finance MDRC’s public policy outreach and expanding efforts to communicate the results and implica-tions of our work to policymakers, practitioners, and others: The Annie E. Casey Foundation, The Harry and Jeanette Weinberg Foundation, Inc., The Kresge Foundation, Laura and John Arnold Foundation, Sandler Foundation, and The Starr Foundation. In addition, earnings from the MDRC Endowment help sustain our dissemination efforts. Contrib-utors to the MDRC Endowment include Alcoa Foundation, The Ambrose Monell Foundation, Anheuser-Busch Foundation, Bristol-Myers Squibb Foundation, Charles Stewart Mott Founda-tion, Ford Foundation, The George Gund Foundation, The Grable Foundation, The Lizabeth and Frank Newman Charitable Foundation, The New York Times Company Foundation, Jan Nichol-son, Paul H. O’Neill Charitable Foundation, John S. Reed, Sandler Foundation, and The Stupski Family Fund, as well as other individual contributors. The findings and conclusions in this report do not necessarily represent the official positions or policies of HHS or the other funders listed above. For information about MDRC and copies of our publications, see our website: www.mdrc.org.

iii
Overview
Low-income preschool children face risks to their social-emotional development that can affect them later on. Although there are promising approaches to promoting preschoolers’ social-emotional skills, the evidence base is limited, particularly on their effectiveness when implemented at scale.
The Head Start CARES demonstration evaluated the effects of three distinct classroom-based approaches to enhancing children’s social-emotional development on a large scale. The Incredible Years Teacher Training Program focuses on teachers’ management of the classroom and of children’s behavior. Preschool PATHS uses structured lessons to help children learn about emo-tions and interact with peers appropriately. Tools of the Mind—Play, a one-year program that promotes children’s learning through structured “make-believe” play, is adapted from the original two-year “Tools of the Mind” program. A comprehensive professional development package (including teacher training, ongoing coaching, and related technical assistance) supported delivery of the enhancements over the course of one year.
The demonstration was conducted with 17 Head Start grantees that generally represent the diversity of Head Start settings nationally. Head Start CARES rigorously evaluated the impacts of the interven-tions, or “enhancements,” by randomly assigning approximately 100 Head Start centers within the grantees to a program group that received one of the interventions or to a control condition without any of them. The estimated impacts should be interpreted as the effects of the enhancements beyond any effects of the existing Head Start program in these classrooms. Head Start CARES tested each enhancement’s impacts on teachers’ practices and on children’s outcomes in the spring of the preschool year, comparing those impacts with the team’s theory of change for each approach.
Key Findings • All three enhancements changed observed teachers’ practices in the expected ways, confirming
that their theoretical differences were reflected in classroom implementation. Impacts on class-room climate were fewer and less consistent.
• Two of the three enhancements showed consistent positive impacts on a range of children’s social-emotional outcomes in preschool, although not as predicted.
o As expected, PATHS showed small to moderate improvements in children’s knowledge and understanding of emotions (emotion knowledge), social problem-solving skills, and so-cial behaviors.
o The Incredible Years improved children’s emotion knowledge, social problem-solving skills, and social behaviors. It did not produce expected impacts on children’s problem be-havior and executive function (except for highest-risk children).
o Tools of the Mind—Play did not demonstrate expected impacts on executive function or self-regulation; it produced only positive impacts on emotion knowledge.
• There was no consistent evidence that these enhancements improved children’s pre-academic skills during preschool, although those skills were not key targets of the enhancements. While based on very limited information, there were virtually no impacts on outcomes in kindergarten as reported by teachers and parents.
• Findings show that evidence-based approaches can improve preschoolers’ social-emotional competence when implemented at scale with appropriate supports.

THIS PAGE INTENTIONALLY LEFT BLANK

v
Contents
Overview iii List of Exhibits ix Acknowledgments xv Executive Summary ES-1 Chapter 1 Overview of the Head Start CARES Impact Study 1
Head Start as a Context for Studying the Implementation of Social-Emotional Enhancements 4
How Might Social-Emotional Enhancements Affect Outcomes for Children? 5 The Three Program Enhancements Tested in Head Start CARES 8 The Rationale for Selecting the Three Enhancements 12 Implementation of the CARES Enhancements in Head Start Centers 14 Overview of the Report 17
2 Recruitment, Random Assignment, and Characteristics of the Sample 19 Grantee Selection, Recruitment, and Characteristics 19 Baseline Characteristics of Head Start Centers and Children 23 Random Assignment 27
3 Data Collection and Measures 31 Data Collection 31 Measures 35 Children’s Social-Emotional and Pre-Academic Skills 40 Prioritizing Outcomes 48 Impact Analysis 50
4 Impacts for the Incredible Years Enhancement in Head Start CARES Preschool Classrooms 53 Theory of Change and Primary Expected Impacts 53 Findings in Brief 54 Impacts on Teachers’ Practices and Classroom Climate 56 Impacts on Children’s Social-Emotional Competence 60 Variation in Impacts by Key Child Characteristics: Child Baseline Behavior
and Gender 65 Summary 65

vi
5 Impacts for the Preschool PATHS Enhancement in Head Start CARES Preschool Classrooms 67 Theory of Change and Primary Expected Impacts 67 Findings in Brief 68 Impacts on Teachers’ Practices and Classroom Climate 70 Impacts on Children’s Social-Emotional Competence 74 Variation in Impact by Key Child Characteristics: Child Baseline Behavior
and Gender 78 Summary 78
6 Impacts for the Tools of the Mind‒Play Enhancement in
Head Start CARES Preschool Classrooms 79 Theory of Change and Primary Expected Impacts 79 Findings in Brief 81 Impacts on Teachers’ Practices and Classroom Climate 82 Impacts on Children’s Social-Emotional Competence 84 Variation in Impact by Key Child Characteristics: Child Baseline Behavior
and Gender 88 Summary 89
7 Impacts on Pre-Academic Skills in Preschool 91 Theory of Change and Expected Impacts on Pre-Academic Skills in Preschool 91 Impacts of the Three Head Start CARES Enhancements on Pre-Academic Skills
in Preschool 92
8 Impacts on Children’s Outcomes in Kindergarten 97 Impacts on Children’s Behavior in Kindergarten 99 Impacts on Children’s Academic Skills in Kindergarten 102 Impacts on Grade Retention and Special Education 104
9 Synthesis and Conclusion 107 Unique Contributions of Head Start CARES 107 Synthesis of Major Findings 110 Implications and Conclusions 114
Appendix A Components of the Head Start CARES Enhancements 117 B Baseline Equivalence of Teachers, Classrooms, Children, and Families Across
Program and Control Groups 123 C Sensitivity Analyses: Child-Level Impacts Controlling for Baseline Differences 137 D Measures Used in Head Start CARES 145

vii
E Selected Characteristics for Kindergarten Lead Teacher Sample 161 F Baseline Characteristics of Children in the Head Start CARES Sample 165 G Correlations Between Study Measures 169 H Model Specifications 177 I Impacts on Children’s Social-Emotional Skills: Detailed Impacts for the Emotion
Recognition and Challenging Situation Tasks 183 J Subgroup Analyses: Differences in Preschool Impacts by Baseline Behavior Risk 189 K Subgroup Analyses: Differences in Preschool Impacts by Gender 197 L Subgroup Analyses: PATHS Classroom and Teacher Impacts During Circle Time 205 M Kindergarten Impacts with Standard Errors 209 N Subgroup Analyses: Differences in Kindergarten Impacts by Baseline Behavior Risk 215 O Subgroup Analyses: Differences in Kindergarten Impacts by Gender 223 P Subgroup Analyses: Differences in Kindergarten Impacts by School-Level
Student Support and Safety 231 Q Attrition and Turnover Analyses 245 R Glossary 253 References 257
Earlier Publications on Head Start CARES 267

THIS PAGE INTENTIONALLY LEFT BLANK

ix
List of Exhibits
Table
ES.1 Primary and Secondary Targeted Impacts in Preschool, by Enhancement ES-7
2.1 Selected Baseline Characteristics for Lead Teacher Sample 25
2.2 Head Start CARES Classroom Climate Compared with National Sample 26
2.3 Head Start CARES Baseline Demographics, Full Sample: Four-Year-Old Children 27
3.1 Data Collection Schedule for Preschool 32
3.2 Summary of Measures for the Study’s Data Sources 36
4.1 Classroom-Level Impacts on Teachers’ Practices Based on Observations of Subdimensions at Preschool Follow-Up: The Incredible Years 57
4.2 Classroom-Level Impacts on Classroom Climate Based on Observations at Preschool Follow-Up: The Incredible Years 59
4.3 Child-Level Impacts on Executive Function, Behavior Regulation, and Learning Behaviors at Preschool Follow-Up: The Incredible Years 61
4.4 Child-Level Impacts on Social-Emotional Skills and Social Behaviors at Preschool Follow-Up: The Incredible Years 63
5.1 Classroom-Level Impacts on Teachers’ Practices Based on Observations of Subdimensions at Preschool Follow-Up: Preschool PATHS 71
5.2 Classroom-Level Impacts on Classroom Climate Based on Observations at Preschool Follow-Up: Preschool PATHS 72
5.3 Child-Level Impacts on Social-Emotional Skills and Social Behaviors at Preschool Follow-Up: Preschool PATHS 75
5.4 Child-Level Impacts on Executive Function, Behavior Regulation, and Learning Behaviors at Preschool Follow-Up: Preschool PATHS 77
6.1 Classroom-Level Impacts on Teachers’ Practices Based on Observations of Subdimensions at Preschool Follow-Up: Tools of the Mind 83
6.2 Classroom-Level Impacts on Classroom Climate Based on Observations at Preschool Follow-Up: Tools of the Mind 85

x
6.3 Child-Level Impacts on Executive Function, Behavior Regulation, and Learning Behaviors at Preschool Follow-Up: Tools of the Mind 87
6.4 Child-Level Impacts on Social-Emotional Skills and Social Behaviors at Preschool Follow-Up: Tools of the Mind 88
7.1 Child-Level Impacts on Early Verbal, Literacy, and Math Skills at Preschool Follow-Up: The Incredible Years 93
7.2 Child-Level Impacts on Early Verbal, Literacy, and Math Skills at Preschool Follow-Up: Preschool PATHS 94
7.3 Child-Level Impacts on Early Verbal, Literacy, and Math Skills at Preschool Follow-Up: Tools of the Mind 95
8.1 Child-Level Impacts at Kindergarten Follow-Up: Behavior and Social Skills 100
8.2 Child-Level Impacts at Kindergarten Follow-Up: Teacher-Reported Academic Skills 103
8.3 Child-Level Impacts at Kindergarten Follow-Up: Grade Retention and Special Education Services 105
9.1 Primary and Secondary Targeted Outcomes in Preschool, by Enhancement 111
A.1 Summary of Enhancement Components 121
B.1 Baseline Characteristics of Head Start CARES Teachers 126
B.2 Baseline Characteristics of Teachers in Program and Control Groups, by Program 127
B.3 Baseline Characteristics of Classrooms in Program and Control Groups, by Program 129
B.4 Baseline Characteristics of Children in Full Sample in Program and Control Groups, by Program 131
B.5 Baseline Characteristics of Children in Analysis Sample in Program and Control Groups, by Program 134
C.1 Child-Level Impacts at Preschool Follow-Up Controlling for Baseline Differences in Executive Function and Behavior Regulation: The Incredible Years 140
C.2 Child-Level Impacts at Preschool Follow-Up Controlling for Baseline Differences in Executive Function and Behavior Regulation: Preschool PATHS 141

xi
C.3 Child-Level Impacts at Preschool Follow-Up Controlling for Baseline Differences in Executive Function and Behavior Regulation: Tools of the Mind 142
C.4 Child-Level Impacts at Preschool Follow-Up Controlling for Baseline Differences in Early Verbal, Literacy, and Math Skills 143
D.1 Items and Factor Loadings for the Adapted Teaching Style Rating Scale 148
D.2 Confirmatory Factor Analysis Loadings for the Classroom Assessment Scoring System 150
D.3 Items and Factor Loadings for the Teacher-Reported Behavior Problems Index Subscales 152
E.1 Selected Characteristics for Kindergarten Lead Teacher Sample 163
F.1 Baseline Characteristics for Head Start CARES Child Sample 167
G.1 Baseline Correlations Between Adapted TSRS and CLASS Domains 171
G.2 Baseline Correlations Between Adapted TSRS and CLASS Items 172
G.3 Baseline Correlations Between Measures of Behavior Regulation and Executive Function 174
G.4 Baseline Correlations Between Measures of Emotion Knowledge, Social Problem-Solving, and Social Skills 175
G.5 Baseline Correlations Between Academic Skills 176
I.1 Child-Level Impacts at Preschool Follow-Up: Emotions Identification Task 185
I.2 Child-Level Impacts at Preschool Follow-Up: Emotions Situations Task 186
I.3 Child-Level Impacts at Preschool Follow-Up: Child Responses to Peer Provocation 187
J.1 Child-Level Impacts at Preschool Follow-Up, Differences by Baseline Behavior Risk: The Incredible Years 191
J.2 Child-Level Impacts at Preschool Follow-Up, Differences by Baseline Behavior Risk: Preschool PATHS 193
J.3 Child-Level Impacts at Preschool Follow-Up, Differences by Baseline Behavior Risk: Tools of the Mind 195
K.1 Child-Level Impacts at Preschool Follow-Up, Differences by Child Gender: The Incredible Years 199

xii
K.2 Child-Level Impacts at Preschool Follow-Up, Differences by Child Gender: Preschool PATHS 201
K.3 Child-Level Impacts at Preschool Follow-Up, Differences by Child Gender: Tools of the Mind 203
L.1 Segment-Pair Level Impacts, Differences by Circle Time: Preschool PATHS 207
M.1 Child-Level Impacts at Kindergarten Follow-Up: Behavior and Social Skills 211
M.2 Child-Level Impacts at Kindergarten Follow-Up: Teacher-Reported Academic Skills of Children 213
M.3 Child-Level Impacts at Kindergarten Follow-Up: Grade Retention and Special Education Services 214
N.1 Child-Level Impacts at Kindergarten Follow-Up, Differences by Baseline Behavior Risk: The Incredible Years 217
N.2 Child-Level Impacts at Kindergarten Follow-Up, Differences by Baseline Behavior Risk: Preschool PATHS 219
N.3 Child-Level Impacts at Kindergarten Follow-Up, Differences by Baseline Behavior Risk: Tools of the Mind 221
O.1 Child-Level Impacts at Kindergarten Follow-Up, Differences by Child Gender: The Incredible Years 225
O.2 Child-Level Impacts at Kindergarten Follow-Up, Differences by Child Gender: Preschool PATHS 227
O.3 Child-Level Impacts at Kindergarten Follow-Up, Differences by Child Gender: Tools of the Mind 229
P.1 Child-Level Impacts at Kindergarten Follow-Up, Differences by School-Level Student Support: The Incredible Years 233
P.2 Child-Level Impacts at Kindergarten Follow-Up, Differences by School-Level Student Support: Preschool PATHS 235
P.3 Child-Level Impacts at Kindergarten Follow-Up, Differences by School-Level Student Support: Tools of the Mind 237
P.4 Child-Level Impacts at Kindergarten Follow-Up, Differences by School-Level Safety: The Incredible Years 239
P.5 Child-Level Impacts at Kindergarten Follow-Up, Differences by School-Level Safety: Preschool PATHS 241

xiii
P.6 Child-Level Impacts at Kindergarten Follow-Up, Differences by School-Level Safety: Tools of the Mind 243
Q.1 Baseline Child Characteristics: Differences Between Children Who Leave the Program and Children Who Stay in the Program 248
Q.2 Baseline Teacher Characteristics: Differences Between Teachers who Leave the Program and Children Who Stay in the Program 250
Figure
ES.1 Head Start CARES Theory of Change ES-5
ES.2 Impacts of The Incredible Years on Children’s Social and Emotional Outcomes in the Preschool Year ES-10
ES.3 Impacts of Preschool PATHS on Children’s Social and Emotional Outcomes in the Preschool Year ES-12
ES.4 Impacts of Tools of the Mind on Children’s Social and Emotional Outcomes in the Preschool Year ES-16
1.1 Head Start CARES Theory of Change 6
2.1 Grantee Locations 22
2.2 Randomization Design 29
3.1 Selection for Study: Four-Year-Olds, Full-Sample 33
Box
1.1 What Is Social-Emotional Development? 2
1.2 Praise and Incentives in The Incredible Years: A Vignette 9
1.3 Feelings Lesson in Preschool PATHS: A Vignette 10
1.4 Make-Believe Play Planning in Tools of the Mind: A Vignette 12
3.1 Measuring Teachers’ Practices and Classroom Climate 38
3.2 Measuring Executive Function and Behavior Regulation Skills 41
3.3 Measuring Emotion Knowledge, Social Problem-Solving Skills, and Social Skills 44
3.4 Measuring Pre-Academic Skills 46
3.5 Measuring Grade Retention and Special Education in Kindergarten 47
3.6 Understanding and Contextualizing Effect Sizes 51

THIS PAGE INTENTIONALLY LEFT BLANK

xv
Acknowledgments
The Head Start CARES (Classroom-based Approaches and Resources for Emotion and Social skill promotion) demonstration was sponsored by the Office of Head Start and the Office of Planning, Research and Evaluation (OPRE) in the Administration for Children and Families (ACF), U.S. Department of Health and Human Services (HHS). We are thankful to the follow-ing people at OPRE: Ann Rivera and Lauren Supplee for their careful and thoughtful feedback and guidance, and Naomi Goldstein, Mary Bruce Webb, and Christine Fortunato for reviewing the early drafts of the report.
We are extremely grateful to the many program directors and staff at the 104 Head Start centers who agreed to take part in the CARES study. We also thank the coaches who were the “feet on the ground” for supporting implementation and encouraging teachers. In addition, we are grateful for the dedicated consultation of the developers of the enhancements, Lisa St. George (The Incredible Years), Carolyn Webster-Stratton (The Incredible Years), Celene Domitrovich (Preschool PATHS), Mark Greenberg (Preschool PATHS), Rebecca Cortes (Preschool PATHS), Elena Bodrova (Tools of the Mind), Deborah Leong (Tools of the Mind), and Amy Hornbeck (Tools of the Mind), as well as the hard work of their many trainers who trained teachers and coaches around the country.
This study could not have been completed without a hard-working team devoted to col-lecting the large amount of data we needed all around the country. We appreciate the work of our dedicated research partners, including Linda Kuhn and Tony Lavender and their staff at Survey Research Management, who collected the data used in this report, as well as the MDRC and MEF Associates staff and consultants who participated in the site visits.
This work was a true collaboration with distinguished experts in the field of early child-hood education, who committed their time and energy to ensuring that this project was carefully and thoroughly designed. We would like to thank Stephanie Jones, Howard Bloom, and Mary Louise Hemmeter, whose guidance, advice, and deep dedication were essential to this study. We also thank a broad group of Technical Working Group members who supported the project with their expertise and contributions.
This report is a culmination of the joint energy and effort of a large team who supported the site recruitment, data collection, data management, and technical assistance work on this project. At MDRC, Sharon Rowser played a critical role in overseeing the site recruitment and operations effort. Gordon Berlin, Barbara Goldman, Virginia Knox, JoAnn Hsueh, and John Hutchins provided thoughtful input and reviewed the report drafts. We also thank Magdalena Mello for her careful work as a resource manager at all phases of the project; Jo Anna Hunter for acting as our liaison with Survey Research Management; Ximena Portilla and Matthew Kim
xvi
for supporting and informing the design and sampling work; Electra Small for overseeing data processing; Ezra Cohn, Seata Shyon, Patrizia Mancini, Vinh Nguyen, Molly Alter, Isabelle Bollendorf, and William Pe for their work processing data and conducting the analysis for the report; Natalia Rojas for her survey and design work; Parham Horn for coordinating the production of the report; Alice Tufel for editing the report; and Carolyn Thomas for preparing the report for publication.
Perhaps most important, we thank the children and families who participated in our study and allowed us access into their lives for a few years. Our research would not have been possible without these individuals.
The Authors

ES-1
Executive Summary
Low-income preschool children experience greater risks to their social and emotional develop-ment than their more affluent peers.1 These gaps are observed before children begin their formal schooling, and they remain or increase during the elementary school years.2 Since social and emotional risks may compromise children’s future mental health and peer relationships, addressing them is important in its own right.3 In addition, social-emotional competence may aid learning: children who have difficulty regulating their emotions and behaviors have been found to receive less instruction, to be less engaged in and less positive about their role as learners, and to have fewer opportunities for learning from peers.4
The Head Start CARES (Classroom-based Approaches and Resources for Emotion and Social skill promotion) demonstration tests three distinct approaches to enhancing children’s social-emotional development on a large scale within the Head Start system ― the largest federally funded early-childhood education program in the United States. Conceived and sponsored by the Office of Head Start and the Office of Planning, Research and Evaluation in the Administration for Children and Families within the U.S. Department of Health and Human Services, the Head Start CARES demonstration was conducted by MDRC, a nonprofit, nonpar-tisan education and social policy research organization, in collaboration with MEF Associates and several academic partners.
The three social-emotional approaches tested in Head Start CARES were called “en-hancements” because they complemented and enriched classroom practices that already existed. The effects, or “impacts,” of the enhancements were rigorously evaluated by randomly assign-ing approximately 100 Head Start centers to one of the three enhancements (the program group) or to a control group that continued with “business as usual.” Therefore, estimated impacts should be interpreted as the effects of the enhancements over and above any effects of the existing Head Start program in these sites.
1Dodge, Pettit, and Bates (1994); Brooks-Gunn, Duncan, and Aber (1997). The Center on the Social and
Emotional Foundations for Early Learning defines social-emotional development as the “developing capacity of the child from birth through five years of age to form close and secure adult and peer relationships; experi-ence, regulate, and express emotions in socially and culturally appropriate ways; and explore the environment and learn — all in the context of family, community, and culture” (Center on the Social and Emotional Foundations for Early Learning, 2008; Yates et al., 2008).
2Alexander, Entwisle, and Kabbani (2001); Brooks-Gunn, Duncan, and Aber (1997); Dodge, Pettit, and Bates (1994); Entwisle and Hayduk (1988); Hamre and Pianta (2001); Ladd, Buhs, and Troop (2002).
3Briggs-Gowan and Carter (2008); Caspi, Moffitt, Newman, and Silva (1996); Schwartz et al. (1999). 4Ladd, Birch, and Buhs (1999); McClelland, Morrison, and Holmes (2000); Raver, Garner, and Smith-
Donald (2007).

ES-2
As described in an earlier report on the Head Start CARES demonstration,5 a compre-hensive professional development system for teachers — including four to six training sessions, weekly coaching sessions in the classroom, a “real-time” management information system (MIS) to support monitoring, and technical assistance — supported the scale-up of the en-hancements around the country. The teacher training and coaching were generally implemented as intended, supporting satisfactory implementation (a rating of 3 on a scale of 1 to 5) of the social-emotional enhancements in Head Start classrooms and leading to the expected influences on teachers’ practices, which are described below. Thus, it appears that the demonstration ensured a fair test of large-scale implementation of the three enhancements, providing a sound basis for evaluating their impact on children and classrooms in the Head Start system.
This report presents the impacts of the three enhancements tested in the Head Start CARES demonstration. It focuses on outcomes in the spring of the preschool year for (1) teachers’ practices; (2) the climate of the classroom; (3) children’s behavior regulation, execu-tive function skills,6 knowledge and understanding of emotions (“emotion knowledge”), and social problem-solving skills; and (4) children’s learning behaviors and social behaviors. In addition to changing teachers’ practices, two of the three enhancements had consistent positive impacts on a range of children’s social-emotional outcomes, although not necessarily in ways that would be expected according to the theories of change that the CARES team developed.7
The Head Start CARES study thus demonstrates that preschool children’s social-emotional outcomes can be improved when evidence-based approaches ― that is, approaches that have been shown to result in differences in children’s social and emotional outcomes ― are implemented at scale with appropriate supports. The report also includes an exploratory set of findings, which have not been previously tested for these enhancements, about whether the enhancements might improve children’s early academic skills in preschool and whether they have any sustained effects as preschool children make the transition to elementary school.
The Three Program Enhancements Tested in Head Start CARES The three social-emotional enhancements that Head Start CARES tested were “The Incredible Years Teacher Training Program,” “Preschool PATHS” (Promoting Alternative Thinking Strategies), and “Tools of the Mind—Play.” These enhancements were selected for testing
5Mattera, Lloyd, Fishman, and Bangser (2013). 6Executive function, also known as cognitive regulation, in early childhood includes working memory (or
the ability to keep a number of pieces of information in the mind at once), set-shifting (or the ability to flexibly shift between pieces of information), and inhibition (or the ability to stop or repress an immediate response).
7The CARES team developed the theory of change for each enhancement based on the training and cur-ricular materials and research papers from each one.

ES-3
because each one was thought to exemplify a distinct theory of change for improving children’s social-emotional development, and because prior empirical evidence had shown that they were efficacious with low-income children in smaller-scale tests. In addition, these enhancements had packaged materials and training guidelines available to improve their potential for replication with fidelity to the original model in Head Start centers across the country, and they could be implemented in Head Start classrooms for all children in those classrooms (rather than for just a high-risk subsample) over a single year of implementation. Head Start CARES was the first large-scale test of these enhancements.
The Incredible Years Teacher Training Program focuses on training teachers to cre-ate an organized classroom climate that supports children’s ability to regulate their own behav-ior in the context of positive teacher-child relationships.8 The enhancement includes strengthen-ing and promoting positive teacher-child relationships, classroom organization (rules and predictable routines), clear and consistent limit-setting, praise and incentives to motivate students’ learning, and proactive discipline strategies. For instance, during “circle time” in an Incredible Years classroom, the teacher might say, “I really like the way Juan is sitting with his hands in his lap,” instead of mentioning the children who are still playing and not paying attention to the teacher.9
Preschool PATHS focuses on training teachers to use clearly outlined lessons and teaching strategies to improve children’s emotion knowledge and social problem-solving skills, including the ability to recognize, understand, and communicate about emotions; interpret difficult social situations; and select from a set of various competent solutions to such situations. PATHS provides teachers with weekly lessons that are taught during circle time, and teachers can also use other activities during the rest of the school day to give children opportunities to practice the skills they have learned. In a PATHS classroom, teachers talk about their feelings and encourage children to think about their and others’ feelings. For example, if two children are playing together in the block area, the teacher might say, “How do you think Ann felt when Neveah gave her a hug? That’s right, she felt happy! How do you look when you feel happy? What makes you feel happy?”
8The Teacher Training Program is one of three Incredible Years programs; the other two are the child-
focused Dinosaur School and the parent-focused Parent Program. 9During circle time, which often occurs at the beginning of the day in preschool classrooms, the children
and the teacher gather together in a circle for a particular set of activities such as greeting each other, singing a song, or counting the number of children who are in school that day.

ES-4
Tools of the Mind—Play is a one-year adaptation of Tools of the Mind.10 It trains teachers to support children’s planning and enacting “make-believe” (or “pretend”) play and role-playing games to strengthen children’s ability to regulate their emotions and behavior.11 A central component of Tools is a daily 50-minute period devoted to adult-supported pretend play. This component is organized and scaffolded by teachers to enhance children’s ability to plan for and understand various social roles — such as the role of family members — while enhancing their memory, ability to focus their attention, and understanding of their own and their peers’ perspectives.12 For example, in a Tools classroom, a child might draw a picture showing that she intends to play house and will be the mother. The teacher would then help the child write out and expand on her plans. Then, while the child is playing, the teacher might come over to help her expand the role-play even further, asking questions such as, “What might you need before you are able to cook dinner?” and “How would you get to the grocery store?”
Figure ES.1 shows the pathway through which the CARES enhancements are expected to have an influence on teachers’ practices, classroom climate, children’s social-emotional skills, and children’s behavioral outcomes in the preschool year. Each enhancement has as its primary goal — and, therefore, expected key outcome — the improvement of some aspect(s) of children’s social-emotional competence. Each one attempts to achieve this goal by directly targeting teachers’ practices and, in the case of Preschool PATHS and Tools of the Mind, by delivering instructional content to the children as well. In each case, improved teachers’ practices (and instructional content) are thought to improve the quality of the classroom experi-ences, or classroom climate, for children. It is through changes in teaching practice (and perhaps content) and climate that the enhancements are thought to improve children’s social, emotional, and behavioral outcomes.
Notably, however, while the enhancements share a core goal (improving children’s social-emotional competence), the CARES team hypothesized that each one has quite different mediating or intervening pathways to social-emotional competence for children, and that each one affects somewhat different aspects of children’s social-emotional competence. These hypotheses are discussed later with the findings for each enhancement, since each enhancement is being evaluated primarily in relation to the theory of change developed by the CARES team and the associated expected pattern of impacts.
10In Tools of the Mind—Play, teachers were trained for only one year in the model (instead of two years, as is typical in the Tools of the Mind program) and it was implemented as an enhancement to the existing curricula in the program sites.
11“Make-believe” is a form of high-level play in which children use their imaginations to role-play, pre-tend they are different characters, play out different stories, and enact various scenarios that rely on and encourage creativity.
12Scaffolding is the act of helping a child accomplish a challenging task or acquire a skill that is just be-yond the child’s current ability level.

Incredible Years
Classroom Management
Intervention
Executive function
Behavior regulation
Emotion knowledge
Preschool PATHS
Tools of the Mind-Play
Social problem-solving
Head Start CARES Demonstration
Figure ES.1
Head Start CARES Theory of Change
Teacher practices to
support social-
emotional development
Classroom quality
Improvements in Child’s Social-Emotional Skills
Changes in Teacher Practices
Improvements in Classroom Interactions
Implementation
Coaching
Training of coaches
and teachers
Classroom implementation
(teacher delivery of
program model components)
Contextual factorsSocial behaviors
Learning behaviors
Improvements in Child’s Social-Emotional Behaviors
Incredible Years
Teacher Training
ES-5
ES-6
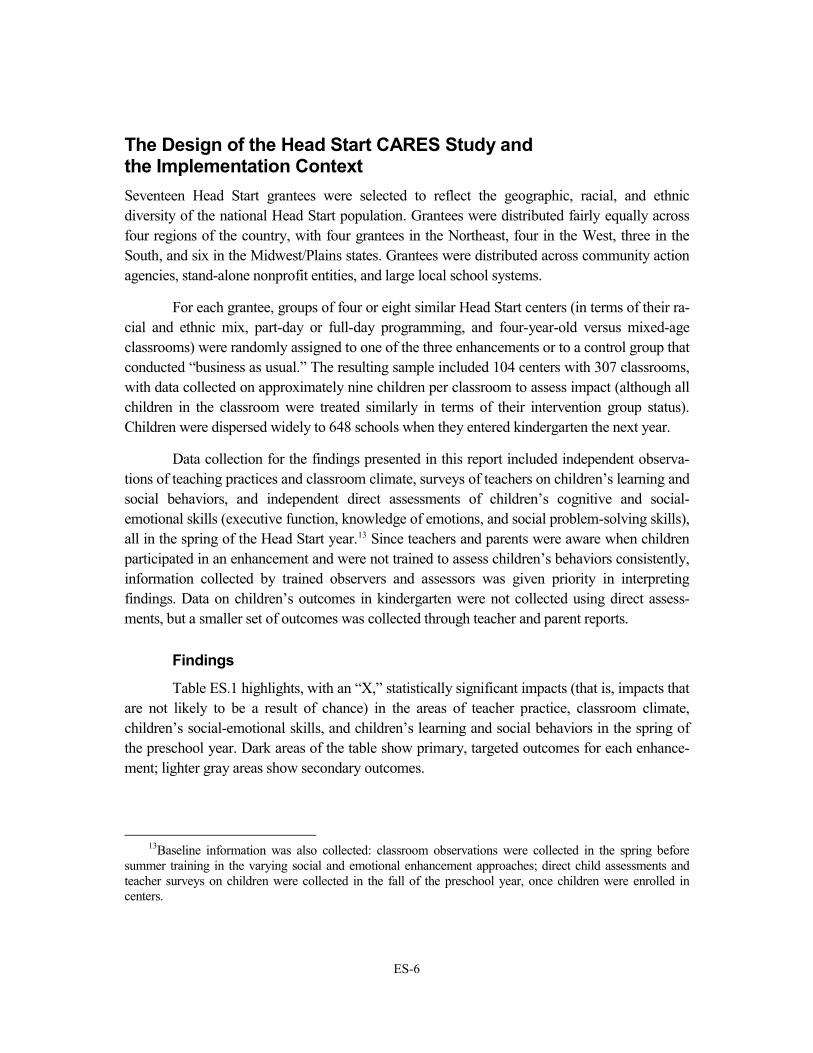
The Design of the Head Start CARES Study and the Implementation Context Seventeen Head Start grantees were selected to reflect the geographic, racial, and ethnic diversity of the national Head Start population. Grantees were distributed fairly equally across four regions of the country, with four grantees in the Northeast, four in the West, three in the South, and six in the Midwest/Plains states. Grantees were distributed across community action agencies, stand-alone nonprofit entities, and large local school systems.
For each grantee, groups of four or eight similar Head Start centers (in terms of their ra-cial and ethnic mix, part-day or full-day programming, and four-year-old versus mixed-age classrooms) were randomly assigned to one of the three enhancements or to a control group that conducted “business as usual.” The resulting sample included 104 centers with 307 classrooms, with data collected on approximately nine children per classroom to assess impact (although all children in the classroom were treated similarly in terms of their intervention group status). Children were dispersed widely to 648 schools when they entered kindergarten the next year.
Data collection for the findings presented in this report included independent observa-tions of teaching practices and classroom climate, surveys of teachers on children’s learning and social behaviors, and independent direct assessments of children’s cognitive and social-emotional skills (executive function, knowledge of emotions, and social problem-solving skills), all in the spring of the Head Start year.13 Since teachers and parents were aware when children participated in an enhancement and were not trained to assess children’s behaviors consistently, information collected by trained observers and assessors was given priority in interpreting findings. Data on children’s outcomes in kindergarten were not collected using direct assess-ments, but a smaller set of outcomes was collected through teacher and parent reports.
Findings
Table ES.1 highlights, with an “X,” statistically significant impacts (that is, impacts that are not likely to be a result of chance) in the areas of teacher practice, classroom climate, children’s social-emotional skills, and children’s learning and social behaviors in the spring of the preschool year. Dark areas of the table show primary, targeted outcomes for each enhance-ment; lighter gray areas show secondary outcomes.
13Baseline information was also collected: classroom observations were collected in the spring before
summer training in the varying social and emotional enhancement approaches; direct child assessments and teacher surveys on children were collected in the fall of the preschool year, once children were enrolled in centers.

ES-7
The Incredible Tools of theYears Preschool PATHS Mind-Play
Outcome
Trains teachers to create an organized classroom climate that supports children’s behavior regulation in the context of positive teacher-child relationships
Trains teachers to use clearly outlined lessons to improve children’s ability to recognize and regulate emotions, define problems, and consider the consequences of various choices
Trains teachers to use adult-supported make-believe play and other activities to strengthen children’s self-regulation
Classroom management XSocial-emotional instruction X XScaffolding X
Classroom organizationEmotional supportInstructional support XLiteracy X
Executive functionBehavior problems
Emotion knowledge X X XSocial problem-solving skills X X
Learning behaviors X XSocial behaviors X X
Learning and social behaviors (teacher reports)
Head Start CARES Demonstration
Table ES.1
Primary and Secondary Targeted Outcomes in Preschool,
Classroom climate (observational assessment)
Teacher practice (observational assessment)
Executive function and behavior regulationa
Emotion knowledge and social problem-solving skills (direct assessments)
by Enhancement
NOTES: In each cell, “X” indicates that there was a statistically significant impact on that outcome. The dark gray cells represent primary targeted outcomes for the enhancement; the light gray cells represent secondary targeted outcomes.
aExecutive function was measured using direct assessments. Behavior problems were measured using teacher reports.

ES-8
In sum, as discussed below and as shown in the table, the success of all three enhance-ments in changing teachers’ practices in the expected ways confirms that the enhancements were differentiated not only in theory but also as delivered in the classroom. Impacts on classroom climate were fewer and less consistent with the theory of change.
Two of the three enhancements showed consistent improvements on a number of chil-dren’s social-emotional outcomes by the spring of the preschool year, although not necessarily in the expected ways. The positive impacts tended to be concentrated on children’s knowledge of emotions and their social skills, rather than on executive function and behavior regulation. Preschool PATHS produced the impacts most consistent with the CARES team’s theory of change; however, positive findings for The Incredible Years also suggest that there is more than one way for Head Start teachers to change their practices to improve children’s emotion knowledge, social problem-solving skills, and social behaviors in the preschool year.
Impacts of “The Incredible Years” in the Preschool Year The Incredible Years’ explicit focus on teachers’ positive classroom management and behavior-al support strategies was expected to produce a more positive classroom climate, especially with regard to the level of emotional support and classroom organization. Children in these class-rooms were expected to demonstrate greater social-emotional competence, with the strongest effects on their behavior problems, executive function, and related engagement in classroom activities. Secondary benefits of The Incredible Years were expected for children’s emotional and social skills (that is, their understanding of the emotions and social problem-solving that are thought to underlie social interactions), as well as for teachers’ ratings of their students’ social skills. While the findings show that The Incredible Years did not reduce children’s behavior problems or improve their executive function skills, the enhancement did improve children’s emotional and social skills and their learning behaviors.
• Incredible Years teachers were rated higher than their control group counterparts on some aspects of classroom management practices and social-emotional instruction.
As expected, teachers in Incredible Years classrooms used more positive behavior man-agement practices (for example, rewarding good behavior and providing clear consequences), used fewer negative behavior-management practices (for example, yelling when there is misbehavior), and were better able to engage children’s attention. These were the central aspects of Incredible Years training. To a slightly lesser extent, this enhancement also improved teachers’ social-emotional instruction, even though the training materials did not focus on it explicitly or as extensively.
ES-9
• Contrary to expectations, the positive impacts on teachers’ practices did not translate into wide-ranging impacts on the quality of the climate in Incredible Years classrooms.
Although the Incredible Years enhancement improved teachers’ behavior management and reduced the negative climate in the classrooms, it did not improve the degree of warmth and sensitivity in the classroom, the extent to which classrooms were organized, or the level of instructional support that was provided.
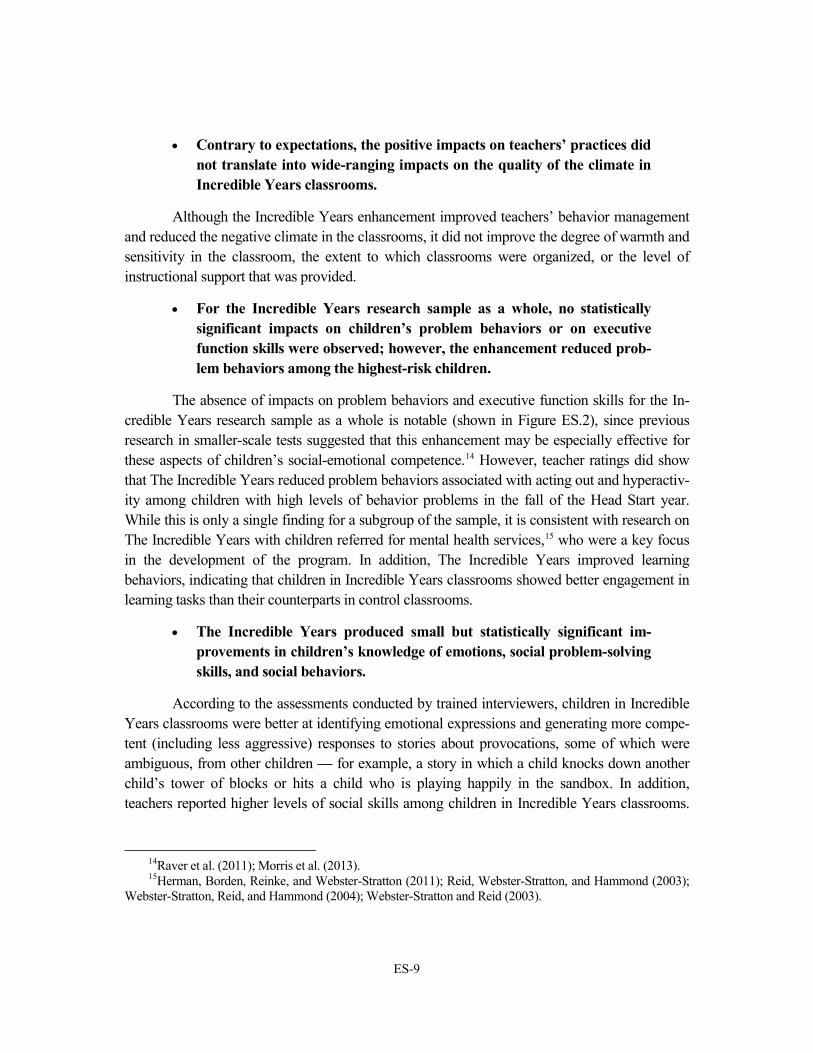
• For the Incredible Years research sample as a whole, no statistically significant impacts on children’s problem behaviors or on executive function skills were observed; however, the enhancement reduced prob-lem behaviors among the highest-risk children.
The absence of impacts on problem behaviors and executive function skills for the In-credible Years research sample as a whole is notable (shown in Figure ES.2), since previous research in smaller-scale tests suggested that this enhancement may be especially effective for these aspects of children’s social-emotional competence.14 However, teacher ratings did show that The Incredible Years reduced problem behaviors associated with acting out and hyperactiv-ity among children with high levels of behavior problems in the fall of the Head Start year. While this is only a single finding for a subgroup of the sample, it is consistent with research on The Incredible Years with children referred for mental health services,15 who were a key focus in the development of the program. In addition, The Incredible Years improved learning behaviors, indicating that children in Incredible Years classrooms showed better engagement in learning tasks than their counterparts in control classrooms.
• The Incredible Years produced small but statistically significant im-provements in children’s knowledge of emotions, social problem-solving skills, and social behaviors.
According to the assessments conducted by trained interviewers, children in Incredible Years classrooms were better at identifying emotional expressions and generating more compe-tent (including less aggressive) responses to stories about provocations, some of which were ambiguous, from other children ― for example, a story in which a child knocks down another child’s tower of blocks or hits a child who is playing happily in the sandbox. In addition, teachers reported higher levels of social skills among children in Incredible Years classrooms.
14Raver et al. (2011); Morris et al. (2013). 15Herman, Borden, Reinke, and Webster-Stratton (2011); Reid, Webster-Stratton, and Hammond (2003);
Webster-Stratton, Reid, and Hammond (2004); Webster-Stratton and Reid (2003).
ES-10
Impacts of The Incredible Years on Children’s Social and Emotional Outcomes
Head Start CARES Demonstration
Figure ES.2
in the Preschool Year
0.01
-0.06
0.17**
0.13** 0.14**
0.28***
-0.1
-0.05
0
0.05
0.1
0.15
0.2
0.25
0.3
Executivefunction
Behaviorproblems
Learningbehaviors
Emotionknowledge
Socialproblem-
solving skills
Socialbehaviors
Eff
ect s
ize
of im
pact
a
Primary targeted outcome Secondary targeted outcome
NOTES: Statistical significance levels are indicated as follows: *** = 1 percent; ** = 5 percent; * = 10 percent.
This figure shows one measure as an exemplar for each outcome area. Executive function was measured by Pencil Tap; behavior problems were measured using the Behavior Problems Index; learning behaviors were measured using the Cooper-Farran Behavioral Rating Scale; emotion knowledge was measured by the Facial Emotions Task; social problem-solving skills were measured by the Challenging Situations Task (specifically, the Competent Response); and social behaviors were measured using the Social Skills Rating Scale.
aThe effect size is the change that is a result of the intervention, as specified in a standardized way that can be compared across different measures and outcomes within a study and across different studies. Technically, the effect size is computed as the impact divided by the standard deviation of the control group.

ES-11
These social skills were not explicitly taught in these classrooms (as they were in Preschool PATHS classrooms, discussed below), suggesting that children can learn these critical skills in a number of ways.
In sum, although many of the outcomes that The Incredible Years targets most directly were not affected (except for the highest-risk subgroup of children), there were impacts for children in both their knowledge of emotions and their ability to provide more competent and less aggressive responses to challenging social situations. Teachers’ reports of children’s social behaviors corroborated these findings. Since researchers theorize that the combination of emotion knowledge and social problem-solving skills can lead to lower levels of aggressive behavior toward peers,16 it may bode well for the longer-term outcomes of children in Incredible Years classrooms.
Impacts of “Preschool PATHS” in the Preschool Year Teachers in Preschool PATHS classrooms were expected to display higher levels of social-emotional instruction than teachers in the control group classrooms, including explicit lessons and activities that help children recognize and then respond to emotions appropriately. The delivery of lessons targeting children’s social-emotional skills was expected to lead to a more emotionally positive and well-organized classroom. Unlike The Incredible Years, which focused on children’s behavior regulation and problem behaviors, the focus of PATHS was on teaching children to understand their emotions and develop social problem-solving skills. This builds on the theory that these skills underlie children’s ability to respond positively, rather than aggressively, to their peers. The impact of PATHS on children’s behavior regulation and executive function skills was thought to be secondary to these outcomes. The findings, as presented in Figure ES.3, show that the impacts of PATHS were positive and quite consistent with the theory of change that the CARES team developed, especially with regard to some of its most proximal targets: teachers’ practices and children’s social-emotional skills.
• Trained observers rated Preschool PATHS teachers higher than control group teachers on all the assessed aspects of social-emotional instruction that were the central focus of PATHS training.
The observations of teachers in Preschool PATHS classrooms revealed that these teachers more often taught children about emotions, supported children’s expression and regulation of emotions, facilitated children’s understanding of their peers’ emotions and their
16Crick and Dodge (1994).

ES-12
Head Start CARES Demonstration
Figure ES.3
Impacts of Preschool PATHS on Children’s Social and Emotional Outcomes in the Preschool Year
0.07
-0.04
0.20**
0.29***
0.17**0.19**
-0.1
-0.05
0
0.05
0.1
0.15
0.2
0.25
0.3
Executivefunction
Behaviorproblems
Learningbehaviors
Emotionknowledge
Socialproblem-
solving skills
Socialbehaviors
Eff
ect s
ize
of im
pact
a
Primary targeted outcome Secondary targeted outcome
NOTES: Statistical significance levels are indicated as follows: *** = 1 percent; ** = 5 percent; * = 10 percent.
This figure shows one measure as an exemplar for each outcome area. Executive function was measured by Pencil Tap; behavior problems were measured using the Behavior Problems Index; learning behaviors were measured using the Cooper-Farran Behavioral Rating Scale; emotion knowledge was measured by the Facial Emotions Task; social problem-solving skills were measured by the Challenging Situations Task (specifically, the Competent Response); and social behaviors were measured using the Social Skills Rating Scale.
aThe effect size is the change that is a result of the intervention, as specified in a standardized way that can be compared across different measures and outcomes within a study and across different studies. Technically, the effect size is computed as the impact divided by the standard deviation of the control group
ES-13
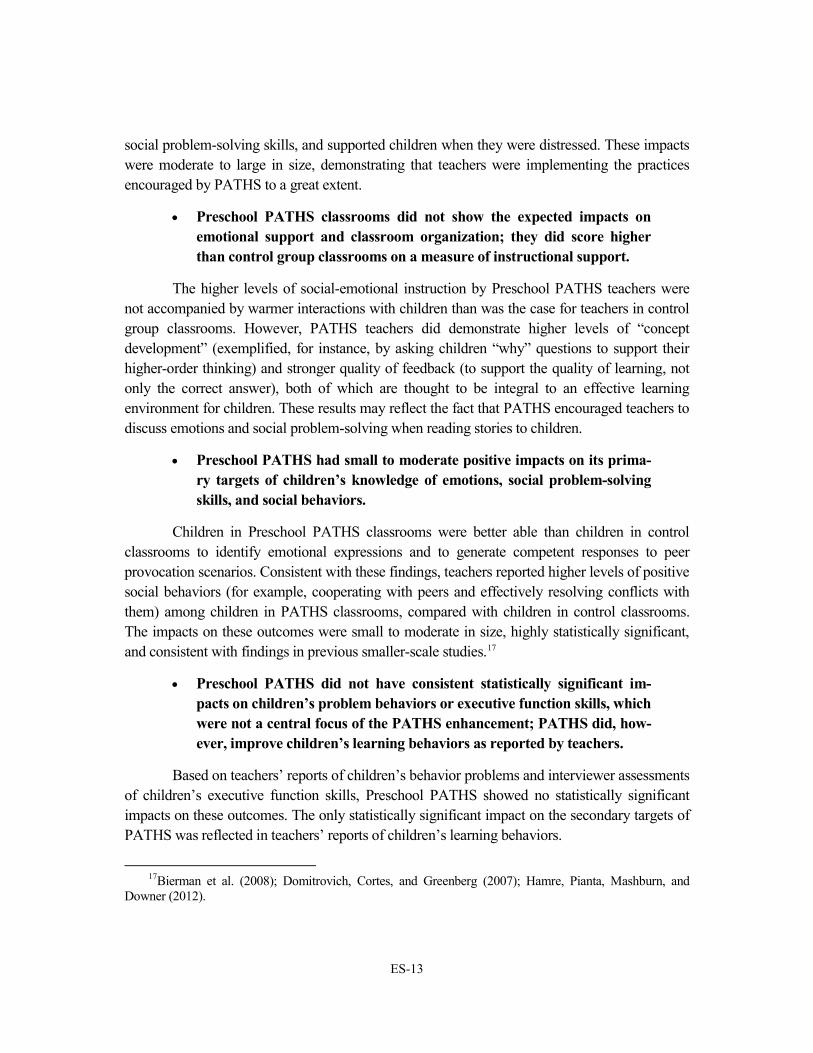
social problem-solving skills, and supported children when they were distressed. These impacts were moderate to large in size, demonstrating that teachers were implementing the practices encouraged by PATHS to a great extent.
• Preschool PATHS classrooms did not show the expected impacts on emotional support and classroom organization; they did score higher than control group classrooms on a measure of instructional support.
The higher levels of social-emotional instruction by Preschool PATHS teachers were not accompanied by warmer interactions with children than was the case for teachers in control group classrooms. However, PATHS teachers did demonstrate higher levels of “concept development” (exemplified, for instance, by asking children “why” questions to support their higher-order thinking) and stronger quality of feedback (to support the quality of learning, not only the correct answer), both of which are thought to be integral to an effective learning environment for children. These results may reflect the fact that PATHS encouraged teachers to discuss emotions and social problem-solving when reading stories to children.
• Preschool PATHS had small to moderate positive impacts on its prima-ry targets of children’s knowledge of emotions, social problem-solving skills, and social behaviors.
Children in Preschool PATHS classrooms were better able than children in control classrooms to identify emotional expressions and to generate competent responses to peer provocation scenarios. Consistent with these findings, teachers reported higher levels of positive social behaviors (for example, cooperating with peers and effectively resolving conflicts with them) among children in PATHS classrooms, compared with children in control classrooms. The impacts on these outcomes were small to moderate in size, highly statistically significant, and consistent with findings in previous smaller-scale studies.17
• Preschool PATHS did not have consistent statistically significant im-pacts on children’s problem behaviors or executive function skills, which were not a central focus of the PATHS enhancement; PATHS did, how-ever, improve children’s learning behaviors as reported by teachers.
Based on teachers’ reports of children’s behavior problems and interviewer assessments of children’s executive function skills, Preschool PATHS showed no statistically significant impacts on these outcomes. The only statistically significant impact on the secondary targets of PATHS was reflected in teachers’ reports of children’s learning behaviors.
17Bierman et al. (2008); Domitrovich, Cortes, and Greenberg (2007); Hamre, Pianta, Mashburn, and
Downer (2012).

ES-14
In sum, as expected from the theory of change that the CARES team developed, Pre-school PATHS trained teachers to deliver more effective instruction in social-emotional skills, and children in PATHS classrooms showed small to moderate improvements in their knowledge of emotions and their social problem-solving skills compared with children in control classrooms in the preschool year. Moreover, these effects on skills were complemented by preschool teachers’ reports of children’s improved social behaviors. Given that these emotional and social skills are thought to underlie children’s reduced aggression in social interactions, the findings indicate that PATHS met its goal of improving the building blocks of children’s social devel-opment in the preschool year.
Impacts of “Tools of the Mind—Play” in the Preschool Year The Tools of the Mind enhancement that was implemented in Head Start CARES focuses on changing the way that “make-believe” (or playing “pretend”) and other learning experiences are structured and supported in the classroom. Teachers are expected to better scaffold children’s pretend play sequences and children’s interactions with peers during these play sequences. While there was no specific focus on teachers’ behavior management, Tools classrooms were expected to be better managed for two primary reasons: First, the restructuring of circle time and other activities in order to reduce whole-group instruction would, it was believed, make it easier to keep children engaged. Second, it was thought that the focus on self-regulation through play would lead to children’s better behavior and fewer classroom management issues. The primary expected impacts for Tools were in children’s executive function skills and learning behaviors. Children’s problem behavior as well as their understanding of emotions and their social problem-solving skills were presumed to be secondary.
Notably, despite the reduction to a one-year enhancement with a focus only on the pri-mary elements of the program, Tools of the Mind was still a somewhat more complex en-hancement to implement than either The Incredible Years or Preschool PATHS. As discussed in the first report on Head Start CARES,18 Tools classrooms had lower levels of implementation fidelity than did the other two enhancements.
• Teachers in Tools of the Mind classrooms engaged in more scaffolding of children’s pretend play and peer interactions than teachers in the control group did.
Consistent with its central focus, Tools of the Mind had moderate-sized impacts on teachers’ scaffolding of pretend play and peer interactions. No statistically significant impacts
18Mattera, Lloyd, Fishman, and Bangser (2013).

ES-15
were observed on teachers’ classroom management practices or on their social-emotional instruction.
• Tools of the Mind classrooms did not demonstrate higher levels of emo-tional support, classroom organization, or instructional support than control classrooms, although they did score higher than control class-rooms on literacy instruction.
Tools’ impact on literacy instruction was not necessarily expected, but it is consistent with the fact that some of the Tools activities (such as asking children to write out their plans for pretend play) involve a focus on children’s literacy.
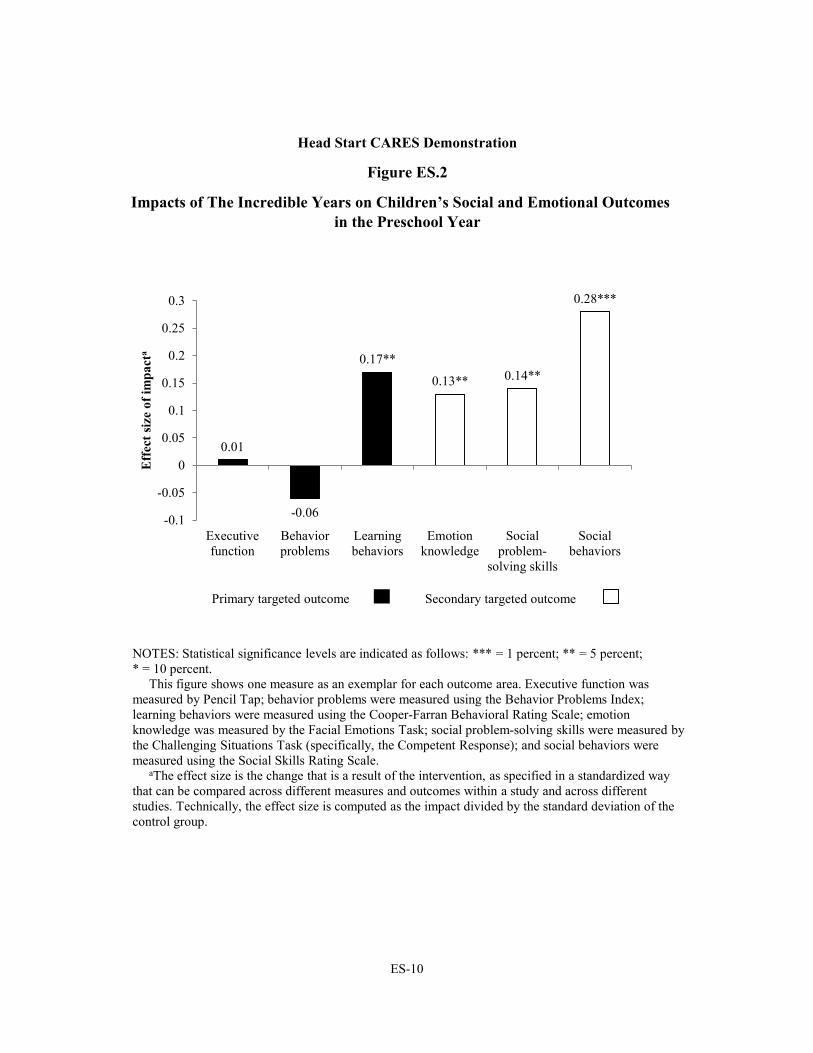
• Children in Tools of the Mind classrooms did not demonstrate better executive function skills or better behavior regulation (fewer problem behaviors) than children in the control group.
The play planning and pretend play sequences in Tools of the Mind intentionally target children’s behavior regulation and executive function skills. However, based on both teacher ratings of problem behaviors and trained interviewers’ direct assessment of tasks, no statistically significant impacts on any of these measures of children’s social-emotional competence were observed (as shown in Figure ES.4).
• Children in Tools of the Mind classrooms demonstrated slightly greater knowledge of emotions, but not better social problem-solving skills, than children in control classrooms.
Although the children did not receive explicit lessons to support their understanding of emotions, they would likely have had an opportunity to improve emotion knowledge through play and interpreting their peers’ emotional expressions in the Tools play sequences. However, no impacts were observed on other aspects of social skills, such as peer interactions and children’s ability to generate more competent social problem-solving solutions.
In sum, as expected, Tools teachers were better able to scaffold children’s pretend play and peer interactions when compared with control teachers. However, children in Tools classrooms did not demonstrate the expected impacts on their executive function or self-regulation skills. While the children did show better knowledge of emotions, this was not accompanied by more competent social problem-solving skills. Earlier research has shown that it is the package of these skills (knowledge of emotions and the ability to

ES-16
Head Start CARES Demonstration
Figure ES.4
Impacts of Tools of the Mind on Children’s Social and Emotional Outcomesin the Preschool Year
0.000.02
0.06
0.12**
0.040.07
-0.1
-0.05
0
0.05
0.1
0.15
0.2
0.25
0.3
Behaviorproblems
Learningbehaviors
Emotionknowledge
Socialproblem-
solving skills
Socialbehaviors
Eff
ect s
ize
of im
pact
a
Primary targeted outcome Secondary targeted outcome
NOTES: Statistical significance levels are indicated as follows: *** = 1 percent; ** = 5 percent; * = 10 percent.
This figure shows one measure as an exemplar for each outcome area. Executive function was measured by Pencil Tap; behavior problems were measured using the Behavior Problems Index; learning behaviors were measured using the Cooper-Farran Behavioral Rating Scale; emotion knowledge was measured by the Facial Emotions Task; social problem-solving skills were measured by the Challenging Situations Task (specifically, the Competent Response); and social behaviors were measured using the Social Skills Rating Scale.
aThe effect size is the change that is a result of the intervention, as specified in a standardized way that can be compared across different measures and outcomes within a study and across different studies. Technically, the effect size is computed as the impact divided by the standard deviation of the control group
bExecutive function, for which the effect size is 0, was a primary targeted outcome.
Executive functionb

ES-17
generate competent responses to peer provocation) that is critical for better social interac-tions later in childhood.19
Impacts on Pre-Academic and Kindergarten Outcomes
Impacts on Pre-Academic Outcomes in the Preschool Year
• There was no consistent evidence that the three social-emotional en-hancements tested in Head Start CARES improved children’s pre-academic skills during preschool.
While social-emotional development is important in its own right (given potential asso-ciations with long-term outcomes like aggression and delinquency),20 this study also examined whether any gains in the social-emotional domain might extend to children’s pre-academic skills during the preschool year, even though such skills were not targeted directly and prior evidence on such effects is inconsistent. This analysis showed that none of the enhancements produced consistent impacts on direct assessments of children’s pre-academic skills during the Head Start year.
Impacts on Teacher- and Parent-Reported Kindergarten Outcomes
The Head Start CARES study also explored the extent to which any impacts on social-emotional outcomes during the Head Start year (1) were sustained into kindergarten; and (2) might lead to improved academic skills, as well as reductions in related schooling outcomes such as grade retention and special education. Prior research suggests that the benefits of The Incredible Years and Preschool PATHS on children’s knowledge of emotions and their social problem-solving skills might result in reduced aggression with peers and better peer interactions during middle childhood. However, since earlier evidence of sustained effects of these en-hancements into kindergarten is limited, and since information on outcomes in kindergarten was collected only from teachers and parents (who are not trained to rate behavior consistently), analyses of these data are considered preliminary.
19Dodge, Pettit, Bates, and Valente (1995); Dodge and Price (1994); Orobio de Castro, Bosch, Veerman,
and Koops (2003). 20Briggs-Gowan and Carter (2008); Caspi, Moffitt, Newman, and Silva (1996); Dodge, Pettit, and Bates
(1994).
ES-18
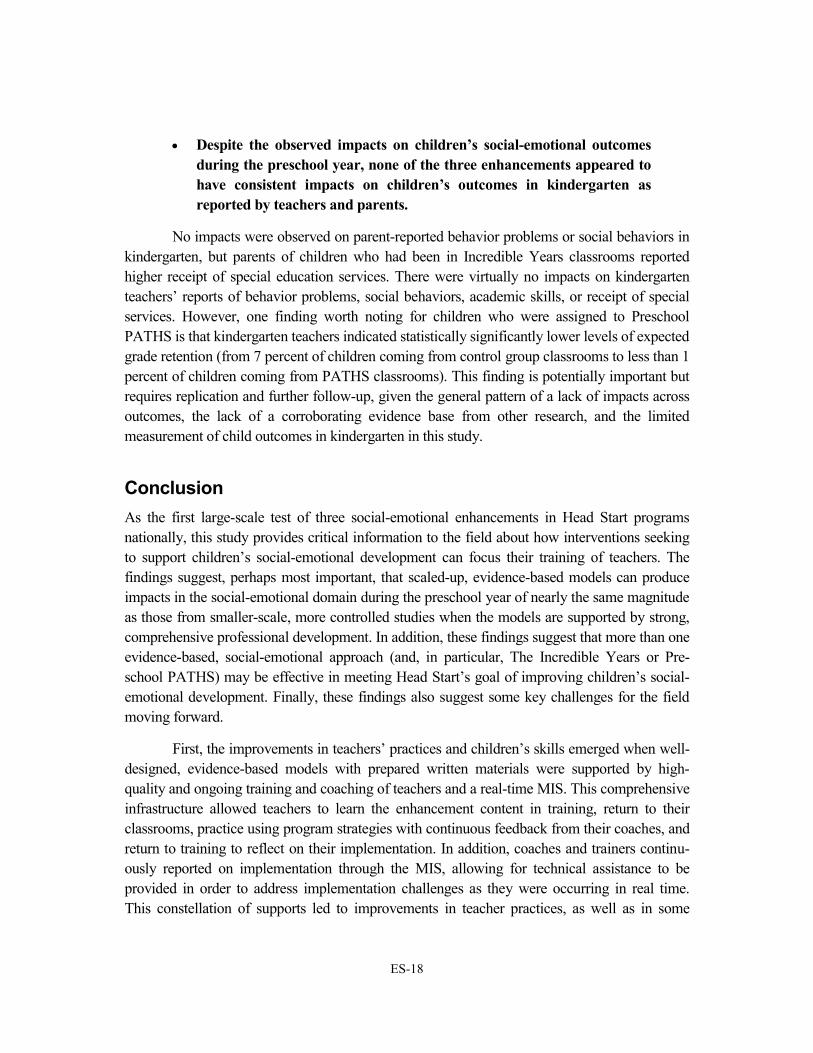
• Despite the observed impacts on children’s social-emotional outcomes during the preschool year, none of the three enhancements appeared to have consistent impacts on children’s outcomes in kindergarten as reported by teachers and parents.
No impacts were observed on parent-reported behavior problems or social behaviors in kindergarten, but parents of children who had been in Incredible Years classrooms reported higher receipt of special education services. There were virtually no impacts on kindergarten teachers’ reports of behavior problems, social behaviors, academic skills, or receipt of special services. However, one finding worth noting for children who were assigned to Preschool PATHS is that kindergarten teachers indicated statistically significantly lower levels of expected grade retention (from 7 percent of children coming from control group classrooms to less than 1 percent of children coming from PATHS classrooms). This finding is potentially important but requires replication and further follow-up, given the general pattern of a lack of impacts across outcomes, the lack of a corroborating evidence base from other research, and the limited measurement of child outcomes in kindergarten in this study.
Conclusion As the first large-scale test of three social-emotional enhancements in Head Start programs nationally, this study provides critical information to the field about how interventions seeking to support children’s social-emotional development can focus their training of teachers. The findings suggest, perhaps most important, that scaled-up, evidence-based models can produce impacts in the social-emotional domain during the preschool year of nearly the same magnitude as those from smaller-scale, more controlled studies when the models are supported by strong, comprehensive professional development. In addition, these findings suggest that more than one evidence-based, social-emotional approach (and, in particular, The Incredible Years or Pre-school PATHS) may be effective in meeting Head Start’s goal of improving children’s social-emotional development. Finally, these findings also suggest some key challenges for the field moving forward.
First, the improvements in teachers’ practices and children’s skills emerged when well-designed, evidence-based models with prepared written materials were supported by high-quality and ongoing training and coaching of teachers and a real-time MIS. This comprehensive infrastructure allowed teachers to learn the enhancement content in training, return to their classrooms, practice using program strategies with continuous feedback from their coaches, and return to training to reflect on their implementation. In addition, coaches and trainers continu-ously reported on implementation through the MIS, allowing for technical assistance to be provided in order to address implementation challenges as they were occurring in real time. This constellation of supports led to improvements in teacher practices, as well as in some

ES-19
social-emotional outcomes, that were nearly as large as those from the less dispersed, more controlled efforts that had been conducted previously.
Second, improving children’s understanding of emotions and their social problem-solving skills and associated social behaviors may be accomplished either by supporting teachers’ positive classroom management practices (as was done in The Incredible Years) or their explicit teaching of emotional understanding and social skills through a more lessons-based approach (as was done in Preschool PATHS). Head Start programs may therefore have some options in selecting models that best meet the needs of their teachers and centers, with likely benefits for the children they are serving.
That said, while it is clearly possible to improve children’s social skills and social be-haviors, it may be more challenging to improve their behavior regulation and related executive function skills. None of the models that was implemented in Head Start CARES improved these outcomes for children. If, as has been suggested,21 children’s academic achievement over the long term is related in part to their “grit” and persistence (which are likely to be influenced by children’s underlying behavior regulation and executive function skills), the field still has some way to go in identifying approaches to support children’s development in this area.
Third, assessing teacher practices may be important for Head Start centers that are in-terested in improving children’s social-emotional development. The Incredible Years and Preschool PATHS improved teachers’ practices as well as children’s emotion knowledge, social problem-solving skills, and social behaviors, without corresponding impacts on CLASS scores.22 As such, the findings suggest the importance of assessing and strengthening specific teacher practices in efforts to enhance children’s social-emotional development.
Finally, the long-term academic (or social) benefits of investing in social-emotional development are not yet clear. The findings presented in this report show that children in Head Start centers that implemented PATHS and The Incredible Years had better social-emotional outcomes than their control-group peers, but the longer-term impact as children proceed through school is still an open question. To gain a better understanding of the long-term outcomes for the Head Start CARES children, it is important to track these children with rich data collection on the kinds of outcomes that are most likely to follow from these early improvements in emotional and social skills.
Supporting children’s social-emotional competence is a primary focus of Head Start, and developmental science has provided an increasingly strong rationale for this important focus. This study provides evidence about the ability of various enhancements to improve
21Duckworth, Peterson, Matthews, and Kelly (2007). 22CLASS is an acronym for Classroom Assessment Scoring System.

ES-20
children’s social and emotional skills and behaviors within the Head Start system. As such, it provides key information that federal policymakers and Head Start providers will need if they are to increase Head Start’s capacity to improve the social-emotional skills of preschool children.

ES-21
References for the Executive Summary
Alexander, Karl L., Doris R. Entwisle, and Nader Kabbani. 2001. “The Dropout Process in Life Course Perspective: Early Risk Factors at Home and School.” Teachers College Record 103, 5: 760-822.
Bierman, Karen L., Celene E. Domitrovich, Robert L. Nix, Scott D. Gest, Janet A. Welsh, Mark T. Greenberg, Clancy Blair, Keith E. Nelson, and Suhkdeep Gill. 2008. “Promoting Academic and Social-Emotional School Readiness: The Head Start REDI Program.” Child Development 79, 6: 1802-1817.
Briggs-Gowan, Margaret, and Alice S. Carter. 2008. “Social-Emotional Screening Status in Early Childhood Predicts Elementary School Outcomes.” Pediatrics 121, 5: 957-962.
Brooks-Gunn, Jeanne, Greg J. Duncan, and J. Lawrence Aber (eds.). 1997. Neighborhood Poverty: Volume 1. Context and Consequences for Children; Volume 2. Policy Implications in Studying Neighborhoods. New York: Russell Sage Foundation.
Caspi, A., T. E. Moffitt, D. L. Newman, and P. A. Silva. 1996. “Behavioral Observations at Age 3 Years Predict Adult Psychiatric Disorders: Longitudinal Evidence from a Birth Cohort.” Archive of General Psychiatry 53, 11: 1033-1039.
Center on the Social and Emotional Foundations for Early Learning. 2008. “Handout 1.7. Definition of Social Emotional Development.” CSEFEL Infant-Toddler Module 1. Nashville, TN: Center on the Social and Emotional Foundations for Early Learning. Website: http://csefel.vanderbilt.edu/resources/inftodd/mod1/1.7.pdf.
Crick, Nicki R., and Kenneth A. Dodge. 1994. “A Review and Reformulation of Social Information-Processing Mechanisms in Children’s Social Adjustment.” Psychological Bulletin 115: 74-101.
Dodge, Kenneth A., Gregory S. Pettit, and John E. Bates. 1994. “Socialization Mediators of the Relation between Socioeconomic Status and Child Conduct Problems.” Child Development 65, 2: 649-665.
Dodge, Kenneth A., Gregory S. Pettit, John E. Bates, and E. Valente. 1995. “Social Information-Processing Patterns Partially Mediate the Effect of Early Physical Abuse on Later Conduct Problems.” Journal of Abnormal Psychology 104: 632-643.
Dodge, Kenneth A., and Joseph M. Price. 1994. “On the Relation Between Social Information Processing and Socially Competent Behavior in Early School-Aged Children.” Child Development 65: 1385-1397.
Domitrovich, Celene E., Rebecca C. Cortes, and Mark T. Greenberg. 2007. “Improving Young Children’s Social and Emotional Competence: A Randomized Trial of the Preschool ‘PATHS’ Curriculum.” The Journal of Primary Prevention 28, 2: 67-91.

ES-22
Duckworth, Angela L., Christopher Peterson, Michael D. Matthews, and Dennis R. Kelly. 2007. “Grit: Perseverance and Passion for Long-term Goals.” Journal of Personality and Social Psychology 92, 6: 1087-1101.
Entwisle, Doris R., and Leslie Alec Hayduk. 1988. “Lasting Effects of Elementary School.” Sociology of Education 61, 3: 147-159.
Erdley, Cynthia A., and Steven R. Asher. 1999. “A Social Goals Perspective on Children’s Social Competence.” Journal of Emotional and Behavioral Disorders 7, 3.
Hamre, Bridget K., and Robert C. Pianta. 2001. “Early Teacher-Child Relationships and the Trajectory of Children’s School Outcomes through Eighth Grade.” Child Development 72, 2: 625-638.
Hamre, Bridget K., Robert C. Pianta, Andrew K. Mashburn, and Jason T. Downer. 2012. “Promoting Young Children’s Social Competence through the Preschool PATHS Curriculum and MyTeachingPartner Professional Development Resources.” Early Education and Development 23: 809-832.
Herman, Keith C., Lindsay A. Borden, Wendy R. Reinke, and Carolyn Webster-Stratton. 2011. “The Impacts of Incredible Years Parent, Child, and Teacher Training Programs on Children’s Co-Occuring Internalizing Symptoms.” School Psychology Quarterly 26, 3: 189-201.
Ladd, Gary W., Sandra H. Birch, and Eric S. Buhs. 1999. “Children’s Social and Scholastic Lives in Kindergarten: Related Spheres of Influence?” Child Development 70, 6: 1373-1400.
Ladd, Gary W., Eric S. Buhs, and Wendy Troop. 2002. “Children’s Interpersonal Skills and Relationships in School Settings: Adaptive Significance and Implications for School-Based Prevention and Intervention Programs.” Pages 394-256 in Peter K. Smith and Craig H. Hart (eds.), Blackwell Handbook of Childhood Social Development. Malden, MA: Blackwell Publishers.
Mattera, Shira, Chrishana M. Lloyd, Mike Fishman, and Michael Bangser. 2013. A First Look at the Head Start CARES Demonstration: Large-Scale Implementation of Programs to Improve Children’s Social-Emotional Competence. OPRE Report 2013-47. Washington, DC: Office of Planning, Research and Evaluation, Administration for Children and Families, U.S. Department of Health and Human Services.
McClelland, Megan M., Frederick J. Morrison, and Deborah L. Holmes. 2000. “Children at Risk for Early Academic Problems: The Role of Learning-Related Social Skills.” Early Childhood Research Quarterly 15, 3: 307-329.
Morris, Pamela A., Chrishana M. Lloyd, Megan Millenky, Nicole Leacock, C. Cybele Raver, and Michael Bangser. 2013. Using Classroom Management to Improve Preschoolers’ Social and Emotional Skills: Final Impact and Implementation Findings from the Foundations of Learning Demonstration in Newark and Chicago. New York: MDRC.

ES-23
Orobio de Castro, Bram, Joop D. Bosch, Jan W. Veerman, and Willem Koops. 2003. “The Effects of Emotion Regulation, Attribution, and Delay Prompts on Aggressive Boys’ Social Problem Solving.” Cognitive Therapy and Research 27: 153-166.
Raver, C. Cybele, Pamela W. Garner, and Radiah Smith-Donald. 2007. “The Roles of Emotion Regulation and Emotion Knowledge for Children’s Academic Readiness: Are the Links Causal?” Pages 121-147 in Robert C. Pianta, Marth J. Cox, and Kyle L. Snow (eds.), School Readiness and the Transition to Kindergarten in the Era of Accountability. Baltimore: Brookes Publishing.
Raver, C. Cybele, Stephanie N. Jones, Christine Li-Grining, Fuhua Zhai, Kristen Bub, and Emily Pressler. 2011. “CSRP’s Impact on Low-Income Preschoolers’ Preacademic Skills: Self-Regulation as a Mediating Mechanism.” Child Development 82, 1: 362-378.
Reid, M. Jamila, Carolyn Webster-Stratton, and Mary Hammond. 2003. “Follow-Up of Children Who Received the Incredible Years Intervention for Oppositional-Defiant Disorder: Maintenance and Prediction of 2-Year Outcome.” Behavior Therapy 34: 471-491.
Schwartz, David, Steven McFadyen-Ketchum, Kenneth A. Dodge, Gregory S. Pettit, and John E. Bates. 1999. “Early Behavior Problems as a Predictor of Later Peer Victimization: Moderators and Mediators in the Pathways of Social Risk.” Journal of Abnormal Child Psychology 27: 191-201.
Webster-Stratton, Carolyn, and M. Jamila Reid. 2003. “Treating Conduct Problems and Strengthening Social and Emotional Competence in Young Children: The Dina Dinosaur Treatment Program.” Journal of Emotional and Behavioral Disorders 11, 3: 130-143.
Webster-Stratton, Carolyn, M. Jamila Reid, and Mary Hammond. 2004. “Treating Children with Early-Onset Conduct Problems: Intervention Outcomes for Parent, Child, and Teacher Training.” Journal of Clinical Child and Adolescent Psychology 33, 1: 105-124.
Yates, Tweety, Michaelene M. Ostrosky, Gregory A. Cheatham, Angel Fettig, LaShorage Shaffer, and Rosa Milagros Santos. 2008. Research Synthesis on Screening and Assessing Social-Emotional Competence. Nashville, TN: Center on the Social and Emotional Foundations for Early Learning. Website: http://csefel.vanderbilt.edu/documents/rs_screening_assessment.pdf.

THIS PAGE INTENTIONALLY LEFT BLANK
1
Chapter 1
Overview of the Head Start CARES Impact Study
Low-income preschool children experience greater risks to their social, emotional, and behav-ioral development than their more affluent peers.1 These gaps are observed before children begin their formal schooling, and remain or increase during the elementary school years.2 Since this may compromise children’s future mental health and peer relationships, and may lead to higher levels of delinquency, improving early social-emotional competence is an important outcome in its own right. In addition, social-emotional competence may be important for learning: children who have difficulty regulating their emotions and behaviors have been found to receive less instruction, to be less engaged in and less positive about their role as learners, and to have fewer opportunities for learning from peers.3
Developmental research has identified several fundamental social and emotional skills that underlie children’s engagement with and attention to the learning tasks encouraged in school (“learning behaviors”) and their social interactions with teachers and peers (“social behaviors”). (See Box 1.1.) These specific skills have been the subject of a number of promising program enhancements that have been implemented and studied in a range of preschool settings.4 However, the evidence about the effectiveness of these interventions comes mostly from smaller-scale tests with program developers actively overseeing implementation, which provides limited information about the potential effectiveness of these programs when imple-mented on a national scale in a larger and more diverse set of classrooms.
This report presents the results of the Head Start CARES (Classroom-based Approach-es and Resources for Emotion and Social skill promotion) demonstration, which was designed to deepen the evidence base by testing three different approaches to improving children’s social-emotional development on a large scale within the regular Head Start system. The Head Start CARES demonstration was conceived and sponsored by the Office of Head Start and the Office of Planning, Research and Evaluation in the Administration for Children and Families within
1Farmer et al. (1999); Dodge, Pettit, and Bates (1994); Brooks-Gunn, Duncan, and Aber (1997). 2Alexander, Entwisle, and Kabbani (2001); Brooks-Gunn, Duncan, and Aber (1997); Dodge, Pettit, and
Bates (1994); Entwisle and Hayduk (1988); Farmer et al. (1999); Hamre and Pianta (2001); Ladd, Buhs, and Troop (2002).
3Ladd, Birch, and Buhs (1999); McClelland, Morrison, and Holmes (2000); Raver, Garner, and Smith-Donald (2007).
4Bierman et al. (2008a); Consortium on the School-Based Promotion of Social Competence (1994); Mor-ris et al. (2010); Raver et al. (2008).

2
the U.S. Department of Health and Human Services. The demonstration was conducted by MDRC, a nonprofit, nonpartisan education and social policy research organization, in collabo-ration with MEF Associates and several academic partners.
A number of features make the Head Start CARES study especially important for poli-cymakers, practitioners, and researchers. Most notably, Head Start CARES tested three evidence-based approaches that drew on distinct theories about how to improve children’s social-emotional development; these approaches were implemented on a large scale in a range
Box 1.1
What Is Social-Emotional Development?
The Center on the Social and Emotional Foundations for Early Learning (CSEFEL) defines social-emotional development as the developing capacity of the child from birth through five years of age to form close and secure adult and peer relationships; experience, regulate, and express emotions in socially and culturally appropriate ways; and explore the environment and learn — all in the context of family, community, and culture.* Social and emotional develop-ment is thought to underlie children’s behaviors, especially in two areas considered to be central to longer-term success: (1) learning behaviors, which refer to children’s ability to focus their attention and behavior during classroom activities; and (2) social behaviors, which are children’s positive interactions with peers and teachers.
Each of these behavioral outcomes comprises a smaller set of discrete skills, which are the “building blocks” of social and emotional development. Children’s skills in regulating their behavior (and the resulting lower levels of behavior problems), for example, support learning behaviors. Learning behaviors are also supported by children’s executive function skills, which consist of (1) the ability to flexibly shift attention between pieces of information; (2) the ability to control one’s immediate or automatic response in favor of a planned response (that is, inhibitory skills); and (3) working (or short-term) memory. Social behaviors are supported by children’s ability to read and effectively interpret others’ emotions, express their own emo-tions, play cooperatively, generate competent solutions to social problems when they arise, and negotiate with peers when there are disagreements.
While learning behaviors and social behaviors each depend on the development of a distinct set of skills, they are also clearly interdependent. For example, children must be able to regu-late their behaviors in order to engage in both learning activities and in social interactions. Thus, even interventions that target a relatively narrow range of skills may ultimately affect a broad range of outcomes, in part through interactions between the skills that are directly affected and other skills that the child possesses.
__________________________ *Center on the Social Emotional Foundations for Early Learning (2008); Yates et al. (2008).
3
of Head Start settings nationally, and a random assignment research design was used to evaluate their impact. Random assignment, in which a program group receives the intervention and a control group does not, ensures that any significant differences between the two groups can be attributed with confidence to the intervention.
The three evidence-based, social-emotional interventions that were selected for the Head Start CARES evaluation included The Incredible Years Teacher Training Program,5 Preschool PATHS (Promoting Alternative Thinking Strategies),6 and a one-year version of Tools of the Mind focused on play (Tools of the Mind—Play).7 The interventions are called “enhancements” in this report because they enriched and complemented existing practices and curricula used in Head Start classrooms.
The Head Start CARES team reviewed the three enhancements and determined that they represent three types of social-emotional programming. That is, while all three were aimed at children’s social-emotional development, they varied in their approach to changing this set of child outcomes by targeting somewhat different teacher practices, because, according to the Head Start CARES team, they were built on differing theories about how social and emotional skills develop. As described in more detail later, The Incredible Years focuses on teachers’ classroom management and behavior management techniques instead of direct instruction or prescribed lesson plans. In contrast, Preschool PATHS uses structured instructional lessons to help children think about emotions and respond to peers in social interactions. Finally, Tools of the Mind promotes children’s intentional and self-regulated learning through structured “make-believe,” or “pretend,” play activities.
In order to support teachers’ implementation of the enhancements in the context of the large-scale effort of Head Start CARES, the demonstration included a comprehensive package of professional development supports, including training, coaching, technical assistance, and program monitoring. An earlier report documented that the professional development supports were provided as planned, and the enhancements were implemented satisfactorily in Head Start classrooms across the country.8 Despite challenges and some variation in implementing the enhancements in the classroom with fidelity to the model, each one led to the changes in teachers’ practices that it was designed to influence. Thus, it appears that the Head Start CARES demonstration ensured a fair test of large-scale implementation of the three enhance-ments, thereby providing a sound basis for evaluating their impacts, which is the focus of the current report.
5The Teacher Training Program, one of three Incredible Years programs, was studied in Head Start CARES (Webster-Stratton, Reid, and Hammond, 2004).
6Domitrovich, Cortes, and Greenberg (2007). 7Bodrova and Leong (2007); Diamond, Barnett, Thomas, and Munro (2007). 8Mattera, Lloyd, Fishman, and Bangser (2013).

4
Impacts were evaluated through a rigorous research design, in which Head Start centers, within grantees/delegate agencies,9 were randomly assigned to receive one of the three en-hancements, or to a control group in which the Head Start program was conducted as usual without any of the special enhancements.
Specifically, this report presents:
1. The extent to which each Head Start CARES enhancement changed specific teach-ers’ practices at the end of the preschool year, compared with teachers in control group classrooms
2. The extent to which each enhancement changed the climate of the classroom at the end of the preschool year, compared with classrooms in the control group
3. The extent to which each enhancement improved children’s social-emotional out-comes (skills and behaviors) at the end of the preschool year, compared with chil-dren in the control group
These findings are supplemented by a more exploratory set of questions:
1. Is the effect of each Head Start CARES enhancement on children’s social-emotional and behavioral outcomes moderated, or shaped, by certain baseline child characteristics?
2. Although none of the enhancements directly targeted children’s pre-academic skills (the cognitive skills that underlie learning in elementary school), did the enhance-ments nonetheless have an effect on these skills at the end of the preschool year, compared with those of children in the control group?
3. To what extent does each Head Start CARES enhancement continue to affect chil-dren’s social-emotional, behavioral, and academic skills (as reported by teachers and parents) in kindergarten?
Head Start as a Context for Studying the Implementation of Social-Emotional Enhancements Head Start, the largest federally funded early childhood program in the United States, is particularly well suited to test varied approaches to improving teachers’ classroom practices. The program addresses the needs of low-income families and children in order to narrow the gap between disadvantaged children and their higher-income peers. Head Start provides early
9Henceforth called “grantees” in this report, a grantee/delegate agency is the local public or private non-profit agency that has been designated as a Head Start provider.
5
childhood education and care combined with comprehensive services (for example, health, nutrition, and social services) during the preschool period to improve children’s social-emotional competence, health, and academic readiness for school.
Because of its origin as a community-based program, Head Start also provides an espe-cially useful setting for testing the delivery of evidence-based enhancements on a larger scale in a range of contexts. While focused on the common goal of serving low-income children and families using a “whole child” approach, Head Start programs reflect a wide range of quality, resources, and pedagogical strategies that could interact with the implementation of new classroom practices. Moreover, Head Start programs are offered in rural, suburban, and urban contexts, serving a diverse group of families across the country. The impact of the enhance-ments in these varied contexts is important to determining whether they can be delivered in diverse settings and support children’s social-emotional development across those settings.
How Might Social-Emotional Enhancements Affect Outcomes for Children? While each of the Head Start CARES enhancements has a distinct theory of change, Figure 1.1 presents a heuristic model that outlines the general pathway by which the enhancements, like other social-emotional interventions implemented in preschool classrooms, could be expected to influence teachers’ practices, classroom climate, and children’s social-emotional outcomes. This heuristic model does not include all possible pathways, but instead focuses on those that the Head Start CARES team hypothesized (based on a review of the program materials) to be most strongly emphasized by each of the enhancements.
The heuristic model hypothesizes that:
1. Implementation of the enhancements with fidelity to the model will lead to changes in teachers’ practices.
2. Changes in teachers’ practices will lead to improved classroom climate.
3. Improved teachers’ practices and improved classroom climate will lead to im-proved social-emotional skills of children, including behavior regulation, executive function skills (ability to shift attention, use inhibitory skills, and exhibit working memory), emotion knowledge (understanding of emotions), and social problem-solving skills.10
10Although not shown in the diagram, PATHS and Tools also attempt to improve child outcomes by de-
livering instructional content to children as well as through changes in teacher practices and classroom climate.

Incredible Years
Classroom Management
Intervention
Executive function
Behavior regulation
Emotion knowledge
Preschool PATHS
Tools of the Mind-Play
Social problem-solving
Head Start CARES Demonstration
Figure 1.1
Head Start CARES Theory of Change
Teacher practices to
support social-
emotional development
Classroom quality
Improvements in Child’s Social-Emotional Skills
Changes in Teacher Practices
Improvements in Classroom Interactions
Implementation
Coaching
Training of coaches
and teachers
Classroom implementation
(teacher delivery of
program model components)
Contextual factorsSocial behaviors
Learning behaviors
Improvements in Child’s Social-Emotional Behaviors
Incredible Years
Teacher Training
6

7
4. Improved skills will lead to better learning behaviors and social behaviors among children.
The earlier report on the implementation of the Head Start CARES enhancements fo-cused on the first of these four steps.11 The current report provides more detailed findings on the changes in teachers’ practices, as well as findings on the last three steps of the theory of change — changes in classroom climate and improvements in children’s skills and behaviors.
The research literature also suggests that changes in children’s social, emotional, and behavioral outcomes might lead to changes in their academic skills.12 As mentioned previously, children with social-emotional difficulties may be less engaged in the classroom and receive less instruction.13 However, any potential impacts on children’s pre-academic skills are exclud-ed from the heuristic model, because they were not expected given the central focus of these enhancements and because there was mixed evidence on whether social-emotional programs may improve such outcomes.14 In fact, any effects on pre-academic skills would have occurred indirectly through changes in social, emotional, and behavioral outcomes (for example, by supporting children’s ability to attend to the learning tasks of school). (The one exception is that Tools includes some direct literacy and math activities.)
Also not reflected in the heuristic model is a smaller follow-up analysis in the Head Start CARES evaluation that examines whether any improvements in children’s preschool outcomes are maintained into the kindergarten year. Many studies have shown that impacts from preschool interventions on academic skills fade over time, sometimes followed by impacts in adulthood on outcomes such as school completion, adult earnings, and criminality.15 While this initial fade-out of effects is disconcerting, some commentators have posited that the impacts observed in adulthood following a lack of impacts earlier could be a result of sustained impacts on children’s social-emotional skills that were not assessed in these studies.16 However, other studies of preschool social-emotional programs have shown mixed results on whether the impacts for children can be sustained beyond the preschool year.17
In Head Start CARES, only teachers’ reports of children’s behavior were collected to speak to these issues regarding the longer-term effects (even though additional information was collected during the preschool year). Teachers’ reports are often less independent than
11Mattera, Lloyd, Fishman, and Bangser (2013). 12Malecki and Elliot (2002); Raver et al. (2008). 13Ladd, Birch, and Buhs (1999); McClelland, Morrison, and Holmes (2000); Raver, Garner, and Smith-
Donald (2007). 14Bierman et al. (2008a); Morris et al. (2013). 15Campbell et al. (2002); Schweinhart, Barnes, and Weikart (1993); Yoshikawa (1995). 16Cunha and Heckman (2010). 17Bierman et al. (2013); Morris et al. (2013); Raver et al. (2008).

8
information about outcomes that is collected by trained assessors or observers, because teachers are not trained to score consistently and because teachers’ scores may be influenced by their own well-being (or lack of it), such as their stress level and their mental health, and, perhaps most important, because their involvement in the intervention can affect their ratings. Therefore, the examination in Head Start CARES of sustained impacts on these teacher-reported outcomes in kindergarten is considered exploratory, given that the findings could not be verified with independent measures such as direct assessments.
The Three Program Enhancements Tested in Head Start CARES The three classroom-based enhancements tested in Head Start CARES are described below.
The Incredible Years Teacher Training Program focuses on training teachers to create an organized classroom climate that supports children’s behavior regulation in the context of positive teacher-child relationships.18 The enhancement includes strengthening and promoting positive teacher-child relationships, classroom organization (rules and predictable routines), clear and consistent limit-setting, praise and incentives to motivate students’ learning, and proactive discipline strategies. For instance, in circle time ― in which teachers and children come together (usually sitting in a circle) for large-group instruction ― some children may be sitting quietly, ready to learn, while other children are still playing with their friends. In an Incredible Years classroom, the teacher might say, “I really like the way Juan is sitting with his hands in his lap,” instead of singling out the children who are still playing.
Box 1.2 provides a vignette about a teacher using Incredible Years practices in a Head Start CARES classroom. A number of key components of the enhancement are demonstrated in this story. First, the teacher coaches children to wait; then she uses specific praise to give attention to positive behavior; and then she praises sharing behavior. Second, she models language to both children to help them manage their interaction more effectively. Finally, she follows through with her promise.
Preschool PATHS focuses on training teachers to use clearly outlined lessons and teaching strategies to improve children’s knowledge of emotions and social problem-solving skills, including the ability to recognize, understand, and communicate about emotions; interpret difficult social situations; and select from a set of various competent solutions to such situations. PATHS provides teachers with weekly lessons that are taught during circle time, and teachers can also use other activities during the rest of the day to give children opportunities to practice
18The Teacher Training Program is one of three Incredible Years programs; the other two, which were not studied in Head Start CARES, are the child-focused Dinosaur School and the parent-focused Parent Program.

9
the targeted skills. In a PATHS classroom, teachers talk about their feelings and encourage children to think about their and others’ feelings. For example, if two children are playing nicely together in the block area, the teacher might talk about the emotions they had been discussing in their lesson that day. She might say, “How do you think Ann felt when Neveah gave her a hug? That’s right, she felt happy! How do you look when you feel happy? What makes you feel happy?”
Box 1.3 provides a vignette about Preschool PATHS in the classroom. As described in the vignette, the primary focus of PATHS is to promote children’s understanding of emotions. Teachers support children by labeling those emotions and helping the children learn those labels, as well as by helping children understand emotions in the context of social interactions.
Box 1.2
Praise and Incentives in The Incredible Years: A Vignette
A preschool teacher sits with two children on the classroom floor. Timmy wants one of the trucks that the other child, José, has. Timmy reaches for the truck and the teacher prompts him by saying, “Timmy, can you say to José, ‘Can I have your truck?’” Timmy repeats after the teacher.
José responds, “Later.”
The teacher then says to Timmy, “You can wait 3 minutes, right?” She holds up three fingers. Then she says to José, “In 3 minutes, it will be Timmy’s turn with the truck.” Timmy sits on his hands watching, and the teacher says, “Wow, Timmy, you are using your strong waiting muscles. Would you like to do something else while you are waiting?” Timmy looks like he wants to reach for the truck again, and the teacher turns to a third child and says, “Look at Timmy waiting his turn; he is being such a good friend waiting.”
After 3 minutes have passed, the teacher prompts José to give Timmy a turn with the truck, and she praises José as he does so by saying, “José, you are also a good friend by sharing your truck with Timmy.” She then helps José find another toy to play with.
__________________________
NOTE: This vignette is based on The Incredible Years Teacher Training Program videos, which are available at www.incredibleyears.com/program/teacher.asp.
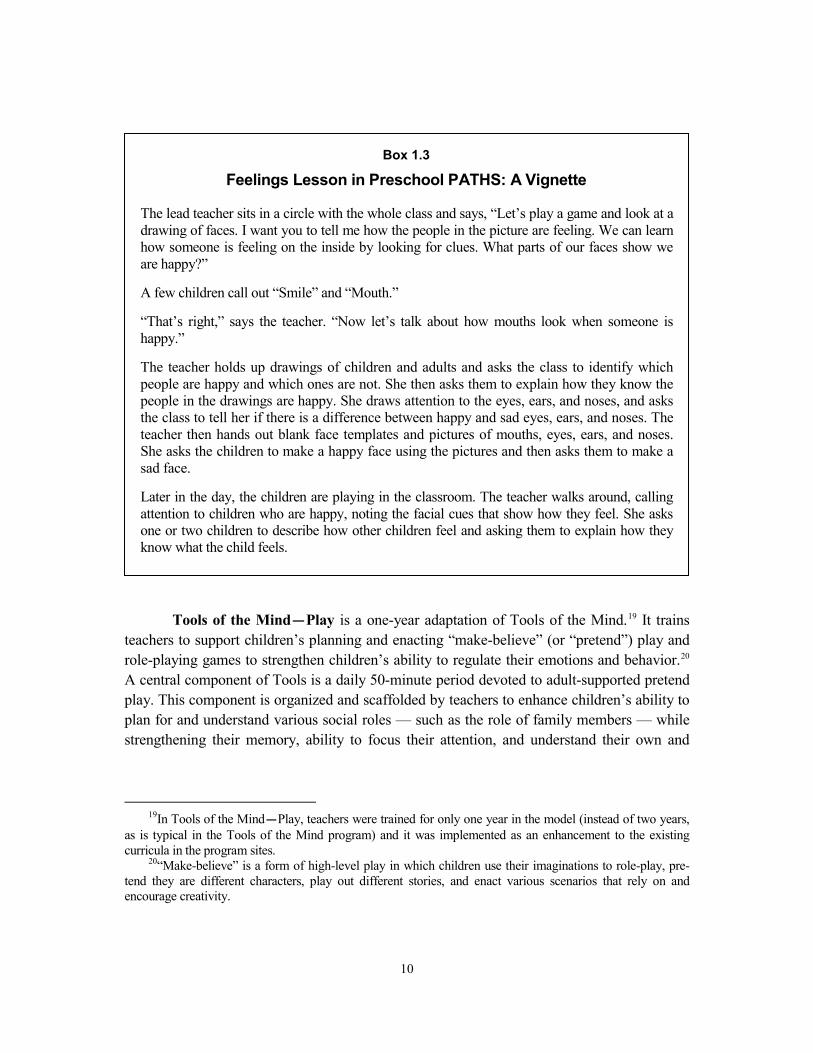
10
Tools of the Mind—Play is a one-year adaptation of Tools of the Mind.19 It trains teachers to support children’s planning and enacting “make-believe” (or “pretend”) play and role-playing games to strengthen children’s ability to regulate their emotions and behavior.20 A central component of Tools is a daily 50-minute period devoted to adult-supported pretend play. This component is organized and scaffolded by teachers to enhance children’s ability to plan for and understand various social roles — such as the role of family members — while strengthening their memory, ability to focus their attention, and understand their own and
19In Tools of the Mind—Play, teachers were trained for only one year in the model (instead of two years,
as is typical in the Tools of the Mind program) and it was implemented as an enhancement to the existing curricula in the program sites.
20“Make-believe” is a form of high-level play in which children use their imaginations to role-play, pre-tend they are different characters, play out different stories, and enact various scenarios that rely on and encourage creativity.
Box 1.3
Feelings Lesson in Preschool PATHS: A Vignette
The lead teacher sits in a circle with the whole class and says, “Let’s play a game and look at a drawing of faces. I want you to tell me how the people in the picture are feeling. We can learn how someone is feeling on the inside by looking for clues. What parts of our faces show we are happy?”
A few children call out “Smile” and “Mouth.”
“That’s right,” says the teacher. “Now let’s talk about how mouths look when someone is happy.”
The teacher holds up drawings of children and adults and asks the class to identify which people are happy and which ones are not. She then asks them to explain how they know the people in the drawings are happy. She draws attention to the eyes, ears, and noses, and asks the class to tell her if there is a difference between happy and sad eyes, ears, and noses. The teacher then hands out blank face templates and pictures of mouths, eyes, ears, and noses. She asks the children to make a happy face using the pictures and then asks them to make a sad face.
Later in the day, the children are playing in the classroom. The teacher walks around, calling attention to children who are happy, noting the facial cues that show how they feel. She asks one or two children to describe how other children feel and asking them to explain how they know what the child feels.

11
their peers’ perspectives.21 For example, in a Tools classroom, a child might first draw a picture showing that she intends to play “house” and will be the mother. The teacher would then sit with the child and help her write out and expand on her plans. The teacher might ask, “What will you do as the mother? How could you make dinner for your children?” She would help the child come up with a more complex role-play scenario. Then, while the child is playing, the teacher might come over and help her expand the role-play even further, asking questions such as, “What might you need before you are able to cook dinner? How would you get to the grocery store?” In this way, the teacher helps the child build self-regulation, including mental flexibility, memory, and inhibitory skills, by creating a plan, sticking with a role for an extended period of time, and shifting between her own perspective and the perspective of the character she is pretending to be.
In the typical implementation of Tools (as implemented outside the Head Start CARES context), teachers are trained in the comprehensive, full-day Tools model over a two-year period. Because this curriculum extends across multiple content areas, components are phased in over time to allow teachers to gradually implement the full curriculum. To accommodate the structure and time frame of the Head Start CARES evaluation, Tools developers adapted the curriculum to allow for implementation in one year, meaning that Tools was condensed into a one-year enhancement rather than a two-year curriculum that was designed to structure all components of the school day. The enhancement did, however, maintain the traditional Tools emphasis on Vygotskian concepts and the focus on pretend play planning and pretend play.22
Box 1.4 provides a vignette about Tools in the classroom. As shown in the discussion, children are asked to plan their play before they engage in it, and teachers are asked to scaffold that play and learning for children. Moreover, much of the learning takes place in extended pretend play sequences, in which children regulate their own behavior as well as that of their friends to fit within the planned play sequence. In some ways, of the three Head Start CARES enhancements, Tools required the most from teachers — both in terms of their ability to match their response to children’s skills and to effectively support children’s play planning and pretend play. In addition, given the number of activities and the way in which the day is structured, Tools required a high level of coordination between the lead and assistant teachers. In this way, it was considered the most complex of the three enhancements.
21Scaffolding is the act of helping a child accomplish a challenging task or acquire a skill that is just be-
yond the child’s current ability level. 22Lev Vygotsky, a Russian psychologist, believed that children use interpersonal communication to learn
and internalize strategies that lead to higher mental functions and allow them to take charge of their own learning.
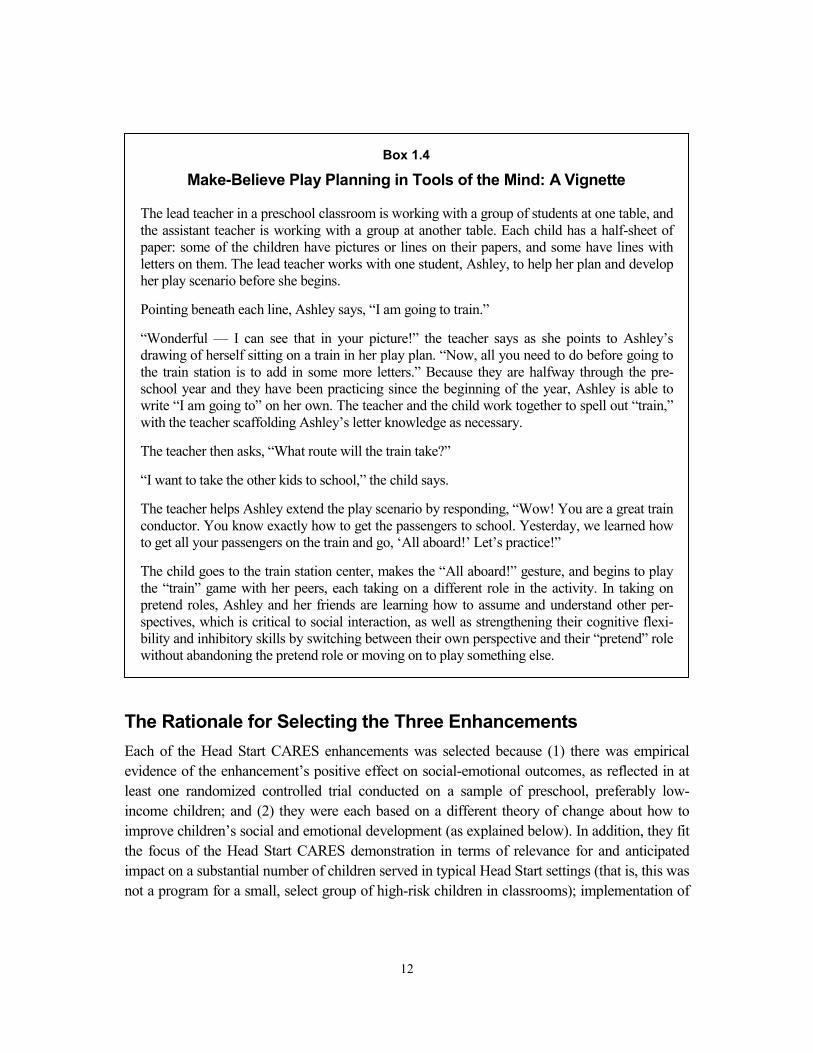
12
The Rationale for Selecting the Three Enhancements Each of the Head Start CARES enhancements was selected because (1) there was empirical evidence of the enhancement’s positive effect on social-emotional outcomes, as reflected in at least one randomized controlled trial conducted on a sample of preschool, preferably low-income children; and (2) they were each based on a different theory of change about how to improve children’s social and emotional development (as explained below). In addition, they fit the focus of the Head Start CARES demonstration in terms of relevance for and anticipated impact on a substantial number of children served in typical Head Start settings (that is, this was not a program for a small, select group of high-risk children in classrooms); implementation of
Box 1.4
Make-Believe Play Planning in Tools of the Mind: A Vignette
The lead teacher in a preschool classroom is working with a group of students at one table, and the assistant teacher is working with a group at another table. Each child has a half-sheet of paper: some of the children have pictures or lines on their papers, and some have lines with letters on them. The lead teacher works with one student, Ashley, to help her plan and develop her play scenario before she begins.
Pointing beneath each line, Ashley says, “I am going to train.”
“Wonderful — I can see that in your picture!” the teacher says as she points to Ashley’s drawing of herself sitting on a train in her play plan. “Now, all you need to do before going to the train station is to add in some more letters.” Because they are halfway through the pre-school year and they have been practicing since the beginning of the year, Ashley is able to write “I am going to” on her own. The teacher and the child work together to spell out “train,” with the teacher scaffolding Ashley’s letter knowledge as necessary.
The teacher then asks, “What route will the train take?”
“I want to take the other kids to school,” the child says.
The teacher helps Ashley extend the play scenario by responding, “Wow! You are a great train conductor. You know exactly how to get the passengers to school. Yesterday, we learned how to get all your passengers on the train and go, ‘All aboard!’ Let’s practice!”
The child goes to the train station center, makes the “All aboard!” gesture, and begins to play the “train” game with her peers, each taking on a different role in the activity. In taking on pretend roles, Ashley and her friends are learning how to assume and understand other per-spectives, which is critical to social interaction, as well as strengthening their cognitive flexi-bility and inhibitory skills by switching between their own perspective and their “pretend” role without abandoning the pretend role or moving on to play something else.

13
the enhancement needed to be feasible within the resources allocated for the Head Start CARES demonstration; and each enhancement needed to have already developed training manuals and some form of professional development that could provide a foundation for large-scale, high-fidelity replication in Head Start centers across the country.
Evidence of Efficacy
All three enhancements had been tested in previous studies to understand their efficacy in improving the outcomes of low-income children. The Incredible Years has been the subject of four randomized controlled trials in the United States conducted with low-income children. Two of the trials combined The Incredible Years with clinical classroom consultation and stress management training;23 impacts on children’s social-emotional outcomes in those two trials, when statistically significant, were moderate to large, ranging from effect sizes of 0.27 to 1.06.24 PATHS alone or with a literacy or professional development component has been tested in three randomized controlled trials involving Head Start, with small to moderate impacts on children’s social-emotional outcomes with effect sizes ranging from 0.21 to 0.50.25 At the outset of the Head Start CARES study, Tools had been tested in one randomized controlled trial, which took place in an urban preschool and had a large impact with an effect size of 0.47 on children’s problem behaviors.26
Distinct Theories of Change
While the three enhancements all target children’s social-emotional development, the Head Start CARES team reviewed the models carefully and determined that each enhancement was based on a different theoretical framework about the most promising mediating pathways to improving social-emotional outcomes for children. Based on this review, the team hypothe-sized that each enhancement was expected to affect a somewhat different aspect of children’s social-emotional competence. At the outset of the Head Start CARES demonstration, the
23See Morris et al. (2013) and Raver et al. (2009). For the other studies of The Incredible Years, which
combine the Teacher Training Program with the other two Incredible Years programs (Dinosaur School and Parent Program), see Murray, Murr, and Rabiner (2012); Reid, Webster-Stratton, and Hammond (2003); and Webster-Stratton, Reid, and Hammond (2001, 2004).
24An effect size provides a way to compare findings across studies with a standardized metric. Technical-ly, it is the impact, or difference between the average program and control group outcomes, divided by the standard deviation.
25For the study of Preschool PATHS alone, see Domitrovich, Cortes, and Greenberg (2007); for the trial that combined PATHS with a literacy curriculum, see Bierman et al. (2008a, 2008b); and for the trial that examined Preschool PATHS plus a professional development component, see Hamre, Pianta, Mashburn, and Downer (2012).
26Barnett et al. (2008). Three additional trials of Tools of the Mind were conducted over the course of the Head Start CARES trial, although none showed positive effects of the Tools program (Clements, Sarama, Unlu, and Layzer, 2012; Farran, Lipsey, and Wilson, 2012; and Lonigan and Phillips, 2012).

14
specific teacher and child skills targeted by each enhancement were carefully examined to compare their content and structure, determine how distinct the approaches actually were, and characterize the key strategies that each one used to improve children’s social-emotional competencies.
As described in Appendix A, this content-focused review of the three enhancements’ lessons or manuals demonstrated that the enhancements share some content, but the emphasis of each enhancement is different, at least in terms of the explicit training and curricular materials. Eighty percent of the core emphasis in The Incredible Years is on classroom management; nearly 90 percent of the core emphasis in PATHS is on social-emotional learning; and about half of the core emphasis in Tools is on deliberative/cooperative play skills (that is, scaffolded pretend play). Notably, this analysis focused on the published materials; trainers and coaches often worked with teachers in other areas as well.
The specified intervention targets in this discussion do not represent all the potential targets of each enhancement. For example, most of the time in The Incredible Years is spent training teachers to support children’s positive behavior and learning techniques for limit-setting, as discussed, but some time is also spent training teachers to support children’s knowledge and understanding of emotions. Similarly, PATHS focuses largely on social-emotional learning, but a small part of the enhancement focuses on deliberative/cooperative play, which is a more Tools-specific emphasis, and teachers who struggled to bring the children together for circle-time lessons were supported in classroom management skills, an Incredible Years focus. Although Tools focuses largely on play and planning, more than one-fourth of Tools’ time addresses behavioral inhibition (an Incredible Years emphasis) and self-regulation of emotions (a PATHS emphasis). In other words, primary targets for one enhancement were sometimes secondary targets for another.
Implementation of the CARES Enhancements in Head Start Centers The heuristic model assumes that the enhancements will be implemented as intended — that is, with fidelity to the original models — in order to realize impacts on teachers’ practices, class-room climate, and children’s outcomes that were found in previous, smaller-scale tests. A fair test of the Head Start CARES theory of change and the enhancements’ impacts required maintaining fidelity to the developers’ intended model while scaling up the program to more than 300 classrooms across the country.
The Head Start CARES demonstration supported the required level of fidelity by creat-ing an expanded professional development system that included ongoing training by creden-tialed trainers and weekly in-classroom coaching. In addition, implementation was monitored

15
through an online management information system (MIS), so that regular feedback and individ-ualized technical assistance could be provided in “real time.”27 This level of support for scale-up meant that the Head Start CARES demonstration falls between an efficacy study (which, as defined by the Institute of Education Science, is designed to evaluate whether a fully developed intervention is efficacious under limited or ideal conditions) and an effectiveness study (which is designed to evaluate whether a fully developed intervention that has evidence of efficacy is effective when implemented under typical conditions through an independent evaluation).28 The implementation support was less than might be seen in small, tightly controlled studies (that is, so-called hothouse studies), but it extended beyond what is typical when preschool centers take on a new initiative.29
As described below and in the earlier report on the implementation of the Head Start CARES demonstration,30 the comprehensive professional development supports helped ensure that each of the three enhancements was delivered in Head Start classrooms with satisfactory fidelity. As a result, each enhancement improved the teachers’ practices that it emphasized in the manner expected, thereby providing a fair test of the theory of change that the Head Start CARES team developed for each enhancement.
Training, Coaching, and Technical Assistance
Teacher training was conceptualized as an ongoing process throughout the year in which lead and assistant teachers could learn enhancement-specific material from highly skilled trainers at regular intervals. The number of training sessions varied by enhancement: the Incredible Years had six days of training; PATHS provided four days of training; and Tools included five days of training. Trainers also visited the classrooms two to three times a year to support implementation on the ground.
The training was implemented as intended across grantees, with high attendance and high quality. Nearly all classrooms sent a lead teacher to the training, and lead and assistant teachers attended together 82.4 percent of the time. Teachers also reported that the training sessions were of high quality and supportive of implementation.
Coaching in the Head Start CARES demonstration was conducted by 52 highly skilled coaches.31 Coaching included a 30-minute weekly meeting with the coach, lead teacher, and
27Mattera, Lloyd, Fishman, and Bangser (2013). 28See University Council for Educational Administration (n.d.) for the Institute of Education Sciences’
definition of an “efficacy study” versus an “effectiveness study.” 29For example, see Odom (2009) and Wise, Silva, Webster, and Sanson (2005). 30Mattera, Lloyd, Fishman, and Bangser (2013). 31See Lloyd and Modlin (2012) for more information on coaches.

16
assistant teacher, as well as a 60-minute weekly observation period in the classroom. Coaches and teachers used the meetings to reflect on the practices that the coach had observed in the classroom.
The coaching was also delivered as intended. Coaching “dosage” (frequency and intensity) and quality were generally high. Coaches met about three times a month with teachers, and the meetings were longer than expected (51 minutes instead of the planned 30 minutes). Trainers and teachers both rated the quality of the coaches as moderately high to high.
Technical assistance and program monitoring were provided by MDRC to support training and coaching. As mentioned above, the MIS was used to collect weekly and monthly data in coaches’ logs about coaching and classroom implementation. As part of ongoing monitoring, a technical assistance threshold was created for satisfactory implementation. On a scale of 1 (low) to 5 (high), classrooms with a rating of 3 or higher were considered to be satisfactory. Technical assistance was provided to developers, trainers, coaches, and site staff when the rating fell below 3. The technical assistance included pre-implementation support, such as the provision of coaching toolkits and a kick-off meeting, as well as regular check-ins and action based on MIS data.
Fidelity to the Enhancement Models as Delivered in the Classroom
Overall, teachers implemented the three Head Start CARES enhancements with satis-factory dosage and quality (fidelity to the model), as reported by coaches and trainers. According to coaches and trainers, the average Head Start CARES classroom scored 3.47 on a scale of 1 (low) to 5 (high) across the year. Coaches reported that implementation was generally consistent and improved across the year, with most (83 percent) of Head Start CARES classrooms scoring higher than the basic technical assistance threshold of a 3 in January, and 60 percent of these classrooms implementing well and consistently (scoring a 4 or higher) in April.
Implementation did, however, vary somewhat across the enhancements. The average fidelity scores for The Incredible Years and PATHS classrooms exceeded the satisfactory threshold (3.69 and 3.73, respectively), while Tools implementation was not as strong (2.97), though still virtually at the rating of a 3 that was considered satisfactory. Teachers reported that the enhancements made sense and were implemented successfully, although they did report that some of the less scripted, more theoretical enhancement components were more difficult to implement than the more highly scripted activities.

17
Overview of the Report This report is organized as follows:
Chapter 2 describes the recruitment of sites, the random assignment process, and the research sample that is the focus of the Head Start CARES impact analysis.
Chapter 3 describes the data collection and measures used in the demonstration.
Chapters 4, 5, and 6 present the impacts of The Incredible Years, PATHS, and Tools, respectively. Each chapter includes:
• A review of the enhancement’s theory of change (as developed by the Head Start CARES team) and expected impacts on teachers’ practices, classroom quality, and children’s social-emotional competence
• A brief summary of the impacts that were found, including whether the im-pacts were consistent with expectations
• A detailed discussion of the impact findings
Chapter 7 includes a discussion of whether the three enhancements had an impact on children’s pre-academic skills.
Chapter 8 explores whether the impacts that were found in the preschool year were sus-tained into kindergarten.
Chapter 9 synthesizes the findings from the prior chapters and summarizes the implica-tions and importance of the findings for the field.
A glossary of select terms that are used throughout the report appears in Appendix R.

THIS PAGE INTENTIONALLY LEFT BLANK
19
Chapter 2
Recruitment, Random Assignment, and Characteristics of the Sample
This chapter describes the process of selecting 17 grantees for the Head Start CARES study, the process of random assignment of 104 centers within these grantees, and the characteristics of the resulting research sample of 2,670 children in the centers.1 The grantees that were selected for this study reflect the racial, ethnic, and cultural diversity of children in Head Start class-rooms across the country. Random assignment was successful; enhancement centers were very similar to control group centers on characteristics that were measured before or close to the time of random assignment.
Grantee Selection, Recruitment, and Characteristics
Grantee Selection and Recruitment
The 17 Head Start grantees were selected to reflect the geographic, racial, and ethnic diversity of the national Head Start population. However, the sample was not designed to be a statistically representative sample of all Head Start grantees.
At the time that Head Start CARES was launched and grantees were being selected for inclusion, there were 2,610 Head Start grantees in the country. Several exclusion criteria were used to narrow down the sampling frame to a set of grantees that was appropriate for the study. A grantee was excluded from the sample if it ran only Early Head Start programs;2 served only migrant children; was located in a U.S. territory, Alaska, or Hawaii; provided only or mostly family child care or home services; was more than 100 miles from a “primary airport;”3 or operated fewer than four centers with two classrooms each. After the exclusions were applied, the final sampling frame consisted of 1,133 grantees.
1Nine-hundred thirty-three 3-year-old children were also included in the Head Start CARES study. A smaller set of impacts on 3-year-old children’s teacher-reported outcomes are presented in another document (Hsueh et al., forthcoming).
2Early Head Start was created for children under 3 years of age and for pregnant women, with the primary goals of nurturing healthy parent-child attachment and providing low-income families with help from the time when pregnancy begins to the child’s third birthday.
3Grantees outside the continental United States and within 100 miles of a primary airport were excluded because of logistical and feasibility constraints regarding intervention training sessions and data collection. The research team also wanted to ensure that travel time and distance were “reasonable” from airports that supply “sufficient service,” both for training and/or data collection visits to the sites, and for teachers from the selected sites to travel to chosen training hubs.

20
These 1,133 grantees were stratified by region of the country, racial/ethnic composition of child enrollment, and the urbanicity of their location.4 Region was defined as one of four strata: Northeast, South, Midwest/Plains, or West. Racial/ethnic composition was defined by child enrollment in the grantee centers, with one of three possible definitions: grantees serving predominantly Hispanic children, grantees serving predominantly African-American children, and grantees serving a mix of children with various racial/ethnic backgrounds. Urbanicity was defined based on the grantee’s location in a metropolitan area, a nonmetropolitan environment, or spread across both metropolitan and rural areas. The number of grantees that was selected in each stratum was based on the proportion of the national Head Start population that the stratum represented (as a means to achieve a sample that reflected the diversity of the Head Start population). At this point, two additional exclusion criteria were imposed, based on information that the grantees provided when they were identified for the next selection phase: grantees that had been in operation for less than two years or were not in compliance with Head Start standards were excluded from the sample.
The remaining grantees were then screened for interest and eligibility. They were asked whether they were willing to participate in a random assignment study and to implement the three enhancements. They were deemed ineligible if they were already systematically imple-menting a social-emotional curriculum or participating in another evaluation.
The final set of grantees was selected based on logistical considerations and information from the Head Start centers. For example, proximity to grantees in other strata was a considera-tion, since it was cost-effective to combine training sessions for multiple grantees, and teachers from grantees that were close together could attend training sessions in centralized locations. Finally, to be eligible for random assignment (and to increase the likelihood that randomization would result in balanced groups), grantees had to have at least four centers with a similar racial/ethnic composition, an equal number of classrooms with full-day or part-day programs, and at least two classrooms with a minimum of eight 4-year-olds each.5
The recruitment process led to a set of grantees that met the diversity and randomization criteria for the Head Start CARES demonstration. However, the process of recruitment likely resulted in a set of grantees that did not represent the full range of Head Start centers nationally. On the one hand, the grantees’ cooperation in replying to the team’s initial inquiry, providing
4Urbanicity is based on the Beale Code of the listed city or town of the grantee. The Beale Code is a wide-
ly used geographic code developed by the U.S. Department of Agriculture. Codes are calculated by examining the size of a county and its proximity to a metropolitan area. More detailed information about this coding system is available at www.ers.usda.gov/briefing/rurality/RuralUrbCon.
5Classrooms with only 3-year-olds and classrooms with mixed ages that had fewer than eight 4-year-olds were excluded from the sample. Among the eligible mixed-age classrooms, those with a majority of 4-year-olds were prioritized for selection to ensure a sufficient sample size of 4-year-olds.
21
the follow-up information, and agreeing to a site visit indicates that they were amenable to participating in a demonstration effort to support children’s social-emotional development. On the other hand, the exclusion of programs that were already implementing strong social-emotional curricula meant that those who were the most invested in supporting children in this area were not part of the final sample of sites. Nevertheless, as shown later, the resulting sample of grantees in the Head Start CARES demonstration was quite similar on a number of dimen-sions to nationally representative samples of Head Start centers.
Grantee Characteristics
The 17 grantees that were selected to participate in the Head Start CARES demonstra-tion were located in 10 states across the nation. (See Figure 2.1.) Grantees were recruited (and implemented the enhancements) in two phases, with two cohorts. Cohort One consisted of 4 grantees in the Northeast that participated during the 2009-2010 school year, and Cohort Two consisted of 13 grantees from the rest of the country that participated during the 2010-2011 school year. Grantees varied on a number of characteristics, including geographic location, organizational setting, size, and neighborhood context. They generally reflected the diversity within the Head Start system on these dimensions.
Grantees were distributed fairly equally across the four designated regions of the coun-try, with four grantees in the Northeast, four in the West, three in the South, and six in the Midwest/Plains. Seven grantees were situated within community action agencies,6 six were operated by stand-alone nonprofit entities, and four were located in large local school systems. The grantees were spread approximately evenly among three size categories: about a third of the grantees were “small” (enrolling fewer than 800 children), a third were “medium” (enrolling between 800 and 1,500 children), and another third were “large” (enrolling more than 1,500 children). Across the two cohorts, nine grantees had 4 participating centers, seven grantees had 8 participating centers, and one grantee had 12 participating centers.
The centers were located in a variety of neighborhoods. Just under half (48 percent) of the centers were in primarily residential areas. The centers were generally situated in safe areas and were in fair condition. Observers of the classrooms who were asked to rate the
6A community action agency is a public or private nonprofit organization, funded primarily by a Commu-
nity Services Block Grant (CSBG) to administer and coordinate programs on a communitywide basis. These agencies provide services that address the full range of family needs, from child development programs to youth and adult employment and training programs, and services for seniors. Stand-alone nonprofit entities are organizations without governmental affiliations, such as churches or nonprofit hospitals. For more information, see the National Community Action Foundation website at https://www.ncaf.org/understanding-community-action.

Head Start CARES Demonstration
Figure 2.1
Grantee Locations
Cohort One grantees
Cohort Two grantees
PennsylvaniaMaryland
New Jersey
Massachusetts
Colorado
Illinois (2)Ohio (3)
California (4)
Mississippi
Texas (2)
t
22
23
neighborhood context during site visits indicated that buildings and houses surrounding the center were in slightly better than fair condition, and the observers felt comfortable in the area for the most part.
Child enrollment in the Head Start CARES study was generally similar to the geo-graphic distribution nationally. Just under one-fourth of the study’s children were in the Mid-west/Plains (23 percent, compared with 26 percent nationally), and more than one in five children in the sample were in the Northeast (23 percent, compared with 18 percent nationally).7 The study somewhat overrepresented the child sample in the West, with 26 percent of the children in the sample from the West (compared with 19 percent of children nationally), and somewhat underrepresented the South, with 29 percent of the study sample in the South (compared with 36 percent of the Head Start population nationally).
Baseline Characteristics of Head Start Centers and Children This section describes the characteristics of the centers participating in the Head Start CARES study, including characteristics of participating teachers and children in the sample. It also compares the teachers and children in the Head Start CARES sample with those from the 2009 Head Start Family and Child Experiences Survey (FACES), a nationally representative sample of the Head Start population.8 Comparative data are available for some characteristics but not for others.
Characteristics of Participating Centers
All centers had between one and six classrooms participating in the Head Start CARES demonstration, with an average of three per center. While there was variation across grantees, a typical Head Start CARES classroom had a minimum of one lead teacher and one assistant teacher. Two-thirds of classrooms were full-day, with the remaining ones being part-day.9 Some of the part-day classrooms operated as double sessions, with one class in the morning and a second, separate class in the afternoon. In multiple-session classrooms, only the first session was included in the Head Start CARES study.10
7National comparisons are drawn from the 2006-2007 Program Information Report (PIR) database, which
were the most recent PIR data available when Head Start CARES sampling was conducted. The PIR database is held by the Office of Head Start.
8Moiduddin et al. (2012). 9In Head Start CARES, a part-day classroom met for 3.5 hours or less either in the morning or in the after-
noon. A full-day class was defined as having met for more hours than a part-day class. 10Double sessions are classrooms with morning and afternoon sessions taught by the same teaching team
but with different students.

24
The Head Start CARES social-emotional enhancements were implemented on top of base curricula that varied by grantee. As is typical for Head Start, in which nearly 70 percent of programs use the Creative Curriculum or High/Scope curricula,11 the majority of Head Start CARES grantees used Creative Curriculum (12 grantees) or High/Scope (3 grantees).12 One grantee reported that High/Scope and a state-adapted core curriculum served as its primary classroom curricula, and another grantee reported that DLM Early Childhood Express was its primary classroom curriculum.13
Head Start CARES teachers were relatively similar to the general population of Head Start teachers. As shown in Table 2.1, lead teachers in Head Start CARES classrooms were predominantly female (96 percent); the majority had at least a bachelor’s degree (62 percent); and they were 43 years of age, on average. The majority (63 percent) had taught for 10 years or more. More than half (64 percent) of Head Start lead teachers nationally have at least a bache-lor’s degree, and the average Head Start teacher has been in the classroom for nearly nine years (not shown in table).14 Appendix Q contains the results of an analysis comparing teachers who left the sample between the spring of the year before the implementation year (when baseline data were collected for teachers) and the fall of the implementation year with teachers who remained in the sample.
As shown in Table 2.2, Head Start CARES classrooms were also similar to classrooms in a nationally representative study of Head Start centers on the three most widely used dimen-sions of the Classroom Assessment Scoring System (CLASS)—Preschool Version, which
11Aikens et al. (2011). 12The Creative Curriculum for Preschool is based on the following five fundamental principles, which
guide practice and help intentionally set up preschool programs: (1) positive interactions and relationships with adults provide a critical foundation for successful learning; (2) social-emotional competence is a significant factor in school success; (3) constructive, purposeful play supports essential learning; (4) the physical environ-ment affects the type and quality of learning interactions; and (5) teacher-family partnerships promote development and learning. See www.creativecurriculum.net for more information. High/Scope is a compre-hensive curriculum and teaching practice that focuses on six dimensions of school readiness: (1) approaches to learning; (2) language, literacy, and communication; (3) social and emotional development; (4) physical development; (5) health and well-being; and (6) arts and sciences. Children engage in both individual and social play, participate in small and large groups, assist with clean-up, socialize during meals, develop self-care skills, and exercise their small and large muscles. See www.highscope.com for more information.
13DLM Early Childhood Express offers a comprehensive, child-centered curriculum with strong teacher support consisting of daily “read-alouds” to enrich students’ imagination; nonfiction focus to build background, vocabulary, and oral language; rhymes, songs, and dances to develop phonological awareness; “how-to science” to teach observing and investigating; manipulatives (hands-on objects) and games to convey math and science concepts; and social emotional instruction to develop interpersonal skills. See www.mheonline.com for more information.
14Office of Head Start (n.d.).

25
measures classroom quality. (See Chapter 3 for a detailed discussion of this measure and the dimensions it assesses.) Nationally, scores on the CLASS Instructional Support domain are usually the lowest, with higher Emotional Support and Classroom Organization scores indicat-ing that preschool classrooms are generally emotionally warmer and more structured than they are academically focused.15
Although teaching can be a stressful job, teachers reported fairly low levels of emotion-al exhaustion and psychological distress (as shown in Appendix Table B.1). They scored an average of 14 out of 54 on a scale measuring emotional exhaustion, which asks teachers about burnout, stress, and fatigue at work. Teachers scored a 3 on the K-6 Kessler Psychological
15National Center on Quality Teaching and Learning (n.d.); MELF (2011).
Characteristic Full Baseline Sample
Age (years) 42.87Female (%) 96.17Race and ethnicity (%)
White, non-Hispanic 27.21African-American, non-Hispanic 37.81Hispanic 29.33Other/multiraciala 5.65
Education (%)Less than an associate's degree 10.42Associate's degree but no bachelor's 27.43Bachelor's but no graduate degree 54.17Graduate degree 7.99
Teaching experience (%)<3 years 6.973 to <10 years 30.31≥10 years 62.72
Sample sizeb (classrooms) 307
Head Start CARES Demonstration
Table 2.1
Selected Baseline Characteristics for Lead Teacher Sample
SOURCE: MDRC calculations based on teacher reports.
NOTES: a“Other” includes Asian, Native Hawaiian/Pacific Islander, and American Indian/Alaska Native.
bFor all variables in the table, data are available for at least 90 percent of the sample.

26
Distress Scale, a scale of 0 to 24 that measures psychological distress, where a threshold of 13 is generally used to identify mental illness.16 When asked how strongly they valued academic readiness compared with social-emotional readiness for school, almost 80 percent of teachers said they valued the two equally, almost 20 percent said they valued children’s social-emotional readiness more, and only 4 percent said they valued academic readiness more.
Characteristics of Children
Table 2.3 shows demographic information for the children in the Head Start CARES sample and their families. Forty-three percent of the children were Hispanic, 33 percent were non-Hispanic African-American, and 16 percent were non-Hispanic white. The national Head Start population is also about one-third non-Hispanic African-American; however, Hispanic children were somewhat overrepresented in the Head Start CARES sample (as they make up 36 percent of Head Start children nationally), and non-Hispanic white children were somewhat underrepresented (accounting for 23 percent nationally). The average monthly household income for Head Start CARES families was about $1,800, compared with $1,900 for Head Start families nationally; 11 percent of Head Start CARES households were receiving Temporary Assistance for Needy Families, and 59 percent were receiving food stamps (from the Supple-mental Nutrition Assistance Program, or SNAP). Nineteen percent of parents of Head Start
16Kessler et al. (2003).
Domain Head Start CARES FACES 2009a
CLASS Instructional Support 2.5 2.3CLASS Emotional Support 5.2 5.3CLASS Classroom Organization 4.7 4.7
Sample sizeb (classrooms) 307 370
Head Start CARES Demonstration
Table 2.2
Head Start CARES Classroom Climate Compared with National Sample
SOURCES: MDRC calculations based on baseline observational assessments completed using the Classroom Assessment Scoring System (Pianta, LaParo, and Hamre, 2008) and Moiduddin et al. (2012).
NOTES: CLASS = Classroom Assessment Scoring System.aThe Head Start Family and Child Experiences Survey (FACES) is a nationally representative study
of program performance (Moiduddin et al., 2012).bFor all variables in the table, data are available for at least 98 percent of the Head Start sample.

27
CARES children owned their own home (compared with 23 percent nationally), and 18 percent lived in transient housing. As shown in Chapter 3, children in the Head Start CARES sample were comparable on measures of social and emotional development with children in other low-income samples, with lower levels of risk than clinical samples (those referred for mental health services) or especially high-risk samples.
Random Assignment Random assignment was conducted within groups of similar centers within grantees. In some cases, all centers within a grantee were similar enough in racial/ethnic composition and part-
Demographics Full Baseline Sample
Child demographicsAge (years)Race and ethnicity (%)
White, non-HispanicAfrican-American, non-HispanicHispanicOther/multiraciala
Female (%)
Household demographicsMonthly income, best estimate ($)Household receiving TANF (%)Owns home (%)Lives in transient housing (%)Receives food stamps (%) 58.97
Sample sizeb (children) 2,114
Head Start CARES Demonstration
Table 2.3
Head Start CARES Baseline Demographics,Full Sample: Four-Year-Old Children
4.42
16.2333.1743.26
7.3548.82
10.8418.6717.52
1,763.77
SOURCES: MDRC calculations based on direct assessment and parent reports.
NOTES: Rounding may cause slight discrepancies in sums and differences.
a“Other” includes Asian, Native Hawaiian/Pacific Islander, and American Indian/Alaska Native.
bFor all variables in the table, data are available for between 85 and 87 percent of the sample, with the exception of monthly income, which is available for 70 percent of the sample.

28
day/full-day programming that all of them could be randomly assigned in a single block. However, for some larger grantees, there were differences among groups of centers in racial/ethnic composition and/or part-day/full-day programming. The centers in these larger grantees were grouped into smaller four- or eight-center random assignment blocks so that all the centers in each block were comparable across these characteristics. Centers within each block (within grantees) were then randomly assigned to one of four groups: (1) the Incredible Years enhancement group, (2) the Preschool PATHS enhancement group, (3) the Tools of the Mind—Play enhancement group, or (4) the control group. Figure 2.2 illustrates three different grantee structures for random assignment in such blocks: Grantee 1 illustrates all centers randomly assigned as part of a four-center block (with each center randomly assigned either to one of the three enhancements or to the control group); Grantee 2 illustrates all centers random-ly assigned as part of an eight-center block (with two centers randomly assigned to each enhancement group or the control group); and Grantee 3 illustrates centers grouped into two blocks of four centers each for randomization (with each center assigned to one of the three enhancements or to the control group).
A total of 104 centers across 22 blocks were randomly assigned to one of these four groups. Eighteen blocks included four centers in the study, and four blocks included eight centers. Up to six classrooms and an average of nine children per classroom were included in the study.17
The demographics of teachers and children in the sample were very similar across the four research groups. Appendix Tables B.2 and B.4 show that there were very few statistically significant differences, indicating that the groups were comparable and random assignment was successful. Also, baseline data collected on the study’s outcome measures indicate that the four groups were very similar on measures of baseline teachers’ practices, classroom climate, children’s social and emotional skills, and children’s cognitive skills (as shown in Appendix Tables B.3 and B.4).18
17In centers with five or six classrooms, all classrooms participated in the study. In centers with more than
six classrooms, five classrooms were randomly selected. 18Appendix Table B.5 shows these comparisons for only the sample of children whose data were used for
the impact analyses because they were still in the sample at the end of the Head Start year, and the results are very similar.
Since baseline data for children were collected from September to December of the preschool year during which teacher training and enhancement implementation took place, there are some differences in the pre-tests that are consistent with the study’s theory of change. For example, PATHS centers had higher scores on the emotion identification task, suggesting that the enhancement may have started to have the intended effects on directly targeted skills fairly early in the school year. Analyses were conducted to assess whether impacts on outcomes presented in Chapters 4, 5, and 6 were underestimated because this potentially contaminated baseline measure was included, and there is no evidence of this issue. (See Appendix C.)
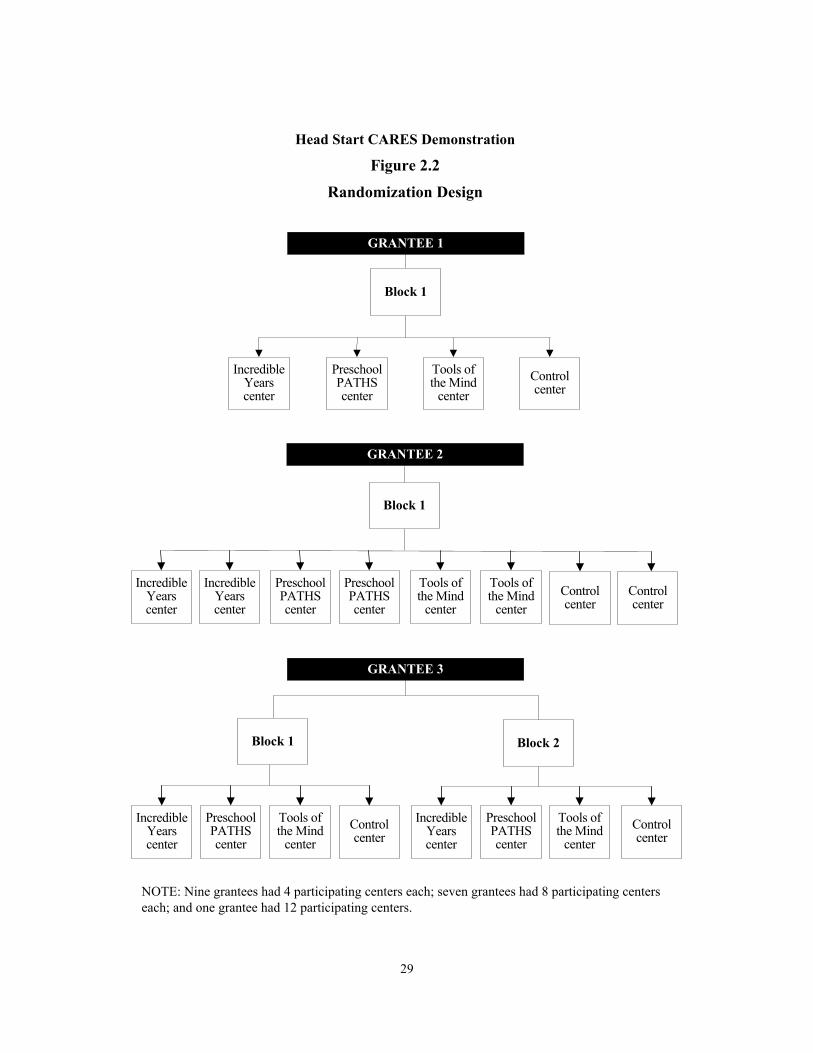
29
Head Start CARES Demonstration
Figure 2.2
Randomization Design
GRANTEE 1
Block 1
Preschool PATHS center
Preschool PATHS center
Incredible Years center
Control center
Tools of the Mind
center
Incredible Years center
Tools of the Mind
centerControl center
Block 1
NOTE: Nine grantees had 4 participating centers each; seven grantees had 8 participating centers each; and one grantee had 12 participating centers.
GRANTEE 2
Incredible Years center
Preschool PATHS center
Tools of the Mind
centerControl center
Incredible Years center
Preschool PATHS center
Tools of the Mind
centerControl center
Block 1 Block 2
GRANTEE 3
Incredible Years center
Preschool PATHS center
Tools of the Mind
centerControl center

THIS PAGE INTENTIONALLY LEFT BLANK

31
Chapter 3
Data Collection and Measures
This chapter describes the data collected and the measures used to estimate the impacts of the Head Start CARES enhancements on teachers, classrooms, and children. (Further details on these measures, including additional descriptive statistics, reliability scores, administration and scoring rules, and individual item details, are in Appendix D.) The first section of the chapter includes a description of the data sources that were used to collect information on the measures, the data collection period for each source, and the response rates for each data source. The second section presents a more detailed description of each of the measures and the baseline scores of classrooms, teachers, and children on these measures to provide an understanding of the “starting point” for the impacts that are described in Chapters 4 through 6.
Data Collection Data for the study were collected from multiple sources at four different points in time: (1) in the spring before the preschool year in which the enhancements were implemented; (2) at the beginning of the implementation preschool year (in the fall); (3) at the end of the preschool implementation year (in the spring); and (4) in the late winter/spring of the kindergarten year, one year after the enhancements were implemented. Table 3.1 (on page 32) shows the data collection schedule for each data source.
Baseline information on teachers and classrooms was collected in the spring (between April and June) before the implementation year — that is, before training for the enhancements started in the summer and before the teachers had any exposure to the enhancements. Baseline information on children was collected in the fall of the year in which the enhancements were implemented. Informed consent forms for children were collected as soon as the school year started and child rosters were available. Direct assessment data, teacher reports on children, and parent survey data were collected soon after consents were obtained, from September to December.1
1As noted in Chapter 2, the fact that child data were collected into December meant that children had al-
ready been exposed to the enhancements at the time of baseline data collection — some for a few months. This creates the possibility of some differences at baseline reflecting the early effects of the enhancements rather than differences arising by chance.

32
Preschool follow-up data were collected for teachers, classrooms, and children in the
spring of the implementation year. Independent observers conducted classroom observations from March to April. Teachers submitted self-surveys and reports on individual children from March to May. Assessors conducted child assessments from March to May.
Kindergarten teachers submitted reports on individual children, along with responses to a few additional questions that asked for demographic and other information about themselves, in the late winter/spring of the children’s kindergarten school year (from February to June). Parents were interviewed in the late winter/spring (from February to June) of the kindergarten school year.
Consent and Response Rates
Figure 3.1 presents the process by which the child sample was defined. At baseline, 3,581 children were eligible for the study. Children were eligible for the study if (1) they were 4 years old at the time of the school district’s cut-off date, (2) English or Spanish was their primary language, and (3) they were not foster children. Consent to participate in the study was requested from parents of all eligible children. At baseline, 79 percent of eligible children’s parents consented to let them participate in the study. After the baseline sample was selected, the study team continued to collect informed consent forms from parents until eight weeks after school started.2 By the time of follow-up, the percentage of eligible children whose parents consented to let them participate in the study was even higher — an average of 90 percent across sites.
2The study team continued to collect consent forms after baseline child sample selection for Cohort Two only. Cohort One followed a slightly different selection process, in which collection of consent forms and selection of the child sample occurred simultaneously.
Spring Baseline Fall Baseline Pre-K Follow-Up K Follow-Up(Spring before (Fall of (Spring of (Spring ofImplementation Implementation Implementation Kindergarten
Data Source Year) Year) Year) Year)
Classroom observations X XTeacher self-survey X XDirect assessments X XTeacher reports on children X X XParent surveys X X
Head Start CARES Demonstration
Table 3.1
Data Collection Schedule for Preschool

33
Head Start CARES Demonstration
Figure 3.1Selection for Study: Four-Year-Olds, Full Sample
Children: 3,581Classrooms: 307
Centers/Schools: 104
2,667
2,362
Eligible
2,845
2,138 376707
8682,128
Children: 2,670Classrooms: 307
Centers/Schools: 104
Still in center at baseline
Additional selected at follow-up
2,067
1,846
1,991 Direct assessments
Parent reports
Teacher reports
Consented at baseline
Not selected at baseline
2,213
2,637
Children: 2,599Classrooms: 1,199
Centers/Schools: 648
Still in center at follow-up
Selected for baseline
Consented after baseline
Tracked into kindergarten
Preschool direct
assessments
Preschool teacherreports
Kindergartenteacherreports
Kindergartenparent reports

34
Budgetary constraints precluded the collection of data on all eligible and consented children in Head Start CARES classrooms. Instead, an average of 7 children per classroom were randomly selected at baseline, and an average of 3 additional children per classroom were selected at follow-up, for a total average of 10 children per classroom.3 After all consent forms were collected, the 3 additional children were selected from the pool of children who (1) were eligible and whose parents had consented at baseline child selection but who were not selected for the baseline sample, or (2) whose parents had not yet consented at the time of baseline child selection but later submitted their informed consent form. A total of 2,670 children were selected for the follow-up sample.
Response rates were very high across data sources. Independent observers completed observational assessments of all 307 classrooms in the study at both baseline and follow-up.4 Ninety-five percent of teachers filled out surveys about themselves at baseline, and 100 percent did so at follow-up. For the child-level data sources, data were only collected for children who were still enrolled at the Head Start center at the time of data collection and who had been selected for data collection (as explained above). Independent assessors completed direct assessments with 94 percent of eligible children at baseline and 99 percent of eligible children at follow-up. Teachers filled out reports for 97 percent of eligible children at baseline and almost 100 percent of eligible children at follow-up. The response rate for baseline parent interviews was lower but still high at 87 percent.5
The study attempted to follow the 2,670 children selected for the follow-up sample into kindergarten for further data collection. Of these children, 2,599 were tracked to their kindergar-ten classrooms. Kindergarten tracking information was collected on 97 percent of these chil-dren. Teacher report data were collected on 91 percent of children, and parent report data were collected on 85 percent of children.
3The Head Start CARES team prioritized follow-up data collection over baseline data collection since data
collected at follow-up would determine the number of children included in the analysis, while baseline data were collected primarily to increase the precision of impact estimates. Analyses conducted for this study found that baseline data can be collected on a smaller subset of children without losing the gains in precision provided by those baseline data. Therefore, when making decisions in response to budget cuts, the team decided to preserve the number of children for follow-up data collection (selecting an average of 10 children per class-room with the expectation that data would be collected on an average of 8 children per classroom) but reduce the number of children for which baseline data would be collected to an average of 5 children per classroom (and selecting an average of 7 children per classroom to meet that target).
4Six classrooms dropped from the study and were replaced by other classrooms after spring baseline data collection, so the study has baseline data on 301 of the 307 classrooms in the follow-up sample.
5As a result of budgetary constraints, fielding the parent survey was stopped once it passed an 80 percent response rate in a site.
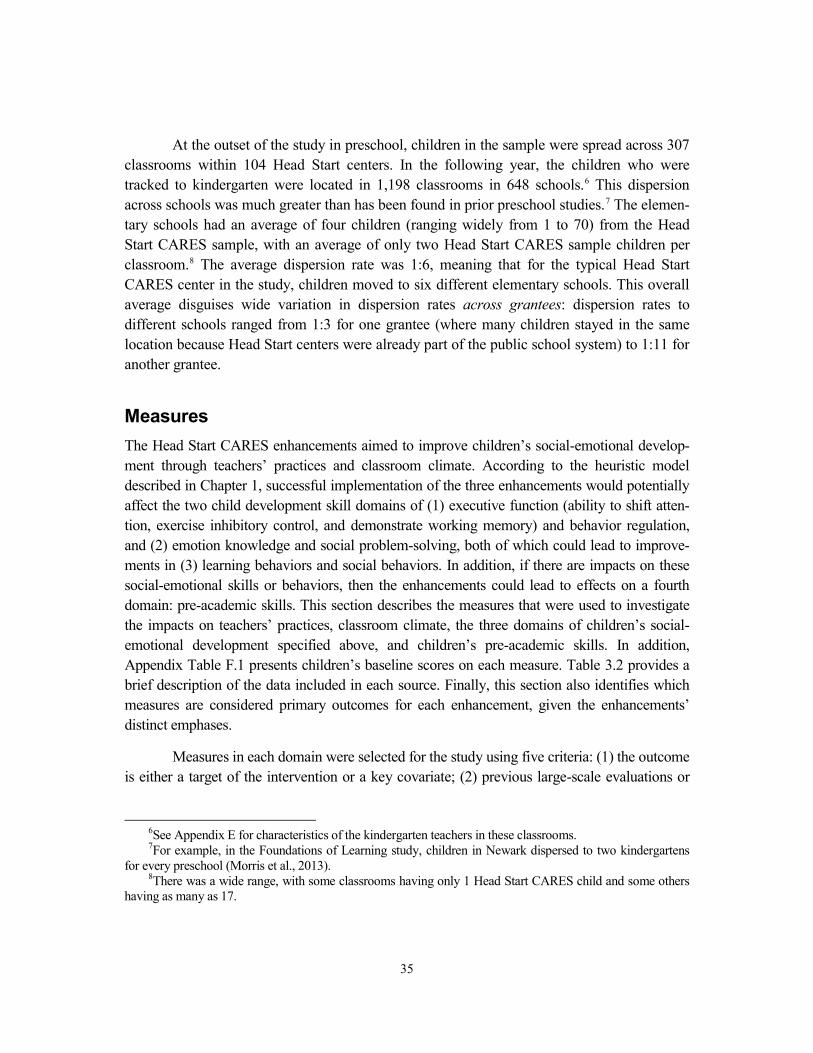
35
At the outset of the study in preschool, children in the sample were spread across 307 classrooms within 104 Head Start centers. In the following year, the children who were tracked to kindergarten were located in 1,198 classrooms in 648 schools.6 This dispersion across schools was much greater than has been found in prior preschool studies.7 The elemen-tary schools had an average of four children (ranging widely from 1 to 70) from the Head Start CARES sample, with an average of only two Head Start CARES sample children per classroom.8 The average dispersion rate was 1:6, meaning that for the typical Head Start CARES center in the study, children moved to six different elementary schools. This overall average disguises wide variation in dispersion rates across grantees: dispersion rates to different schools ranged from 1:3 for one grantee (where many children stayed in the same location because Head Start centers were already part of the public school system) to 1:11 for another grantee.
Measures The Head Start CARES enhancements aimed to improve children’s social-emotional develop-ment through teachers’ practices and classroom climate. According to the heuristic model described in Chapter 1, successful implementation of the three enhancements would potentially affect the two child development skill domains of (1) executive function (ability to shift atten-tion, exercise inhibitory control, and demonstrate working memory) and behavior regulation, and (2) emotion knowledge and social problem-solving, both of which could lead to improve-ments in (3) learning behaviors and social behaviors. In addition, if there are impacts on these social-emotional skills or behaviors, then the enhancements could lead to effects on a fourth domain: pre-academic skills. This section describes the measures that were used to investigate the impacts on teachers’ practices, classroom climate, the three domains of children’s social-emotional development specified above, and children’s pre-academic skills. In addition, Appendix Table F.1 presents children’s baseline scores on each measure. Table 3.2 provides a brief description of the data included in each source. Finally, this section also identifies which measures are considered primary outcomes for each enhancement, given the enhancements’ distinct emphases.
Measures in each domain were selected for the study using five criteria: (1) the outcome is either a target of the intervention or a key covariate; (2) previous large-scale evaluations or
6See Appendix E for characteristics of the kindergarten teachers in these classrooms. 7For example, in the Foundations of Learning study, children in Newark dispersed to two kindergartens
for every preschool (Morris et al., 2013). 8There was a wide range, with some classrooms having only 1 Head Start CARES child and some others
having as many as 17.

36
Data Source Measure Sample
Classroom observations Classroom quality (CLASS)a and teachers' practices (Adapted TSRS)b
Teachers
Direct assessments Executive function (Head-to-Toes, Pencil Tap), emotion knowledge and social problem-solving skills (emotions identification and situations, Challenging Situations), and pre-academic skills (WJ III Letter-Word Identification and Applied Problems, EOWPVT)c
Children
Teacher report on individual children
Behavior regulation (BPI, CFBRS work-related skills),d social skills (SSRS, CFBRS interpersonal skills, STRS),e and pre-academic skills (ARS)f
Children
Parent survey Family demographics, behavior regulation (BPI), social skills (SSRS), and parental psychosocial variables (K-6 Kessler Psychological Distress Scale, PSI)g
Children/Families
Teacher self-report survey Teacher demographics, teacher psychosocial variables (Maslach Burnout Inventory, K-6)
Teachers
Head Start CARES Demonstration
Table 3.2
Summary of Measures for the Study's Data Sources
NOTES: aCLASS = Classroom Assessment Scoring System.bAdapted TSRS = Adapted Teaching Style Rating Scale.cWJ III = Woodcock-Johnson III. EOWPVT = Expressive One-Word Picture Vocabulary Test.dBPI = Behavior Problems Index. CFBRS = Cooper-Farran Behavioral Ratings Scale.eSSRS = Social Skills Rating Scale. STRS = Student-Teacher Relationship Scale.fARS = Academic Rating Scale.gPSI = Parenting Stress Index.
37
efficacy trials have shown evidence of program impacts on the measure; (3) there is a low likelihood of compromised statistical power; (4) it has been used with low-income populations of young children, with evidence that it is capturing the same outcome in ethnic minority and English Language Learners populations; and (5) it is brief, so that the reporting burden on teachers, parents, and children is low. A wide range of measures in each domain was evaluated, and a small subset that best met these criteria was identified for use in the Head Start CARES study.
Teacher Practices and Classroom Climate
Independent observers who were blind to the intervention status of the classrooms scored all enhancement and control group teachers and classrooms on aspects of teachers’ practices and classroom climate during the spring before the preschool year and the spring of the preschool year. For the measures of teachers’ practices, observers focused on the lead teacher’s behavior in the classroom. When scoring for classroom climate, the focus was not just on the lead teacher, but also on the climate of the whole classroom, characterized by interactions between all adults and children in the room.
Lead teachers’ practices were measured with the Adapted Teaching Style Rating Scale (Adapted TSRS), which is described in Box 3.1.9 Observers assessed the teacher and classroom for two hours. Teachers were rated on classroom structure and management, discipline, emo-tional communication and support, social awareness and problem-solving, preventing misbe-havior, and scaffolding. Factor analyses showed three groupings of items that are consistent with the study’s distinct theory of change for each enhancement: (1) classroom management (a central component of the Incredible Years enhancement), (2) social-emotional instruction (a central component of the Preschool PATHS enhancement), and (3) scaffolding (a central component of the Tools of the Mind enhancement):
• The classroom management subscale assesses teachers’ use of a consistent routine; preparedness for classroom activities; awareness of what is happen-ing in the classroom at all times; use of persistence, social and emotional coaching strategies, and proactive behavior management techniques, such as praising and rewarding good behavior and providing clear consequences; minimal use of negative behavior techniques, such as yelling or harshness; and use of gestures and cues to get the class’s attention.
9The Adapted TSRS was created by C. Cybele Raver, Celene E. Domitrovich, Mark T. Greenberg, Pame-la A. Morris, and Shira Kolnik Mattera as part of the Head Start CARES demonstration (Raver et al., 2012). See Appendix F in Mattera, Lloyd, Fishman, and Bangser (2013), 141-144.

38
• The social-emotional instruction subscale assesses teachers’ ability to model emotion identification and labeling, create an environment that is supportive of children’s emotional expression, use encouraging techniques for calming children down, facilitate social awareness as reflected through empathy, help problem-solve in social situations, and support children’s efforts to regain emotional control.
• The scaffolding subscale assesses teachers’ use of scaffolding — a practice that supports a child’s activity or response at his or her current level of under-
Box 3.1
Measuring Teachers’ Practices and Classroom Climate
Adapted Teaching Style Rating Scale (TSRS). The Adapted TSRS measures three areas of teacher practices through direct observations of the classroom:
• The classroom management subscale assesses teachers’ use of a consistent routine and preparedness for classroom activities; positive behavior management techniques, such as praising and providing clear consequences; and minimal use of negative behavior tech-niques, such as yelling.
• The social-emotional instruction subscale assesses teachers’ ability to model emotion labeling, support children’s emotional expression, help problem-solve in social situations, and support children’s efforts to regain emotional control.
• The scaffolding subscale assesses teachers’ use of scaffolding of children’s pretend play through planning and expanding on pretend play themes, as well as scaffolding interac-tions between children when they are playing together.
Classroom Assessment Scoring System (CLASS). CLASS characterizes interactions be-tween teachers and students through direct observations in the classroom:
• Emotional support captures the emotional tone of the classroom, focusing on teachers’ enjoyment of the children, their expressions of anger or sarcasm, and their responsiveness to the children’s needs and views.
• Classroom organization captures teachers’ ways of structuring the classroom so that the children know what is expected of them, and teachers’ use of appropriate redirection for children when needed.
• Instructional support captures teachers’ encouragement of students’ use of language and higher-order thinking skills, and how teachers respond to children’s ideas.
• Literacy focus measures teachers’ instruction of literacy in the classroom.

39
standing while extending the activity or response in order to help the child advance to the next level of ability. In this case, the teacher’s practice was coded for instances of scaffolding of (1) children’s pretend play by support-ing their planning of that activity and expanding the play as it is being enact-ed, and (2) interactions between children when they are playing together.
In the spring before implementation began, teachers had moderately high scores on the Adapted TSRS classroom management practices (3.69 on a scale of 1 to 5), but fewer practices related to social-emotional instruction and scaffolding were observed (1.74 and 1.40 on the same scale, respectively).
The Classroom Assessment Scoring System (CLASS)–Preschool Version,10 rated by in-dependent observers in four cycles across a two-hour observation period, characterizes interac-tions between teachers and students using three domains (as described in Box 3.1) — emotional support, classroom organization, and instructional support. A fourth, less widely used domain of the CLASS instrument that was collected in the Head Start CARES demonstration was literacy focus.
1. Emotional support, which captures the emotional tone of the classroom, focuses on teachers’ enjoyment of the children and enthusiasm for teaching; their expressions of anger, sarcasm, or harshness; their responsiveness to children’s needs; and their emphasis on children’s point of view.
2. Classroom organization captures teachers’ ways of structuring the classroom so that the children know what is expected of them, the use of appropriate redirection when children demonstrate challenging behavior, the way in which the classroom runs with respect to routines, and how teachers maximize children’s learning.
3. Instructional support captures teachers’ encouragement of students’ use of lan-guage and higher-order thinking skills, and how teachers respond to students’ comments, ideas, and work.
4. Literacy focus, unlike the other three domains, includes only one dimension, which measures teachers’ instruction of literacy in the classroom.
Table 2.2 in Chapter 2 shows that for the first three domains, for which national data are available, scores from classrooms in the Head Start CARES study were very similar to scores from a nationally representative sample. Appendix Table G.1 presents correlations between these same three CLASS domains and the three Adapted TSRS measures described above, and
10See La Paro, Pianta, and Stuhlman (2004) and Pianta, La Paro, and Hamre (2008) for a discussion of CLASS.

40
Appendix Table G.2 shows correlations between the individual items of these three CLASS domains and the Adapted TSRS.
Children’s Social-Emotional and Pre-Academic Skills The Head Start CARES study used two main data sources to assess children’s social-emotional and pre-academic skills in the fall and spring of the preschool year: (1) independent assessors were trained to assess children’s executive function skills, emotion knowledge, social problem-solving skills, and pre-academic skills through a series of games and tasks; and (2) teachers were asked questions about children’s behavior regulation, social behavior, learning behaviors, and pre-academic skills. In addition, for kindergarten follow-up, teachers and parents were asked questions about children’s behavior problems and social behavior. It is generally under-stood that independent assessors can provide more objective assessments of children’s out-comes than teachers can. This is especially true here, since the preschool teachers were not blind to intervention group status and their ratings may have been affected by their knowledge of being in an enhancement condition as much as by children’s actual behavior. They also were not trained to rate children in a similar way, and therefore their ratings may reflect their interpre-tation of the items assessed as well as children’s actual behavior. These aspects of measurement quality and their implications for the analysis are discussed in more detail below.
This section describes the measures used in the study, by domain. Head Start CARES is notable in its collection of data on these executive function, emotion identification, and problem-solving skills for a large-scale study with a diverse sample. Where comparative information for measures used in the CARES evaluation is available, baseline means and standard deviations are presented alongside national averages. Appendix Table F.1 presents baseline scores for all the measures described in this section.
Executive Function, Behavior Regulation, and Learning Behaviors
The Head Start CARES study uses several measures to assess executive function skills, behavior regulation, and learning behaviors. (See Box 3.2.) Executive function is a combination of skills, including set-shifting (or the ability to flexibly shift between pieces of information), inhibition (or the ability to stop or repress an immediate response in favor of a planned response), and working memory (or short-term memory). The behavior regulation domain includes children’s ability to calm themselves down, limit disruptive behavior, and control aggressive responses. Learning behaviors include children’s ability to attend to and engage in the learning tasks of school. Independent assessors measured children’s executive function skills, while teachers rated children’s behavior regulation and learning behaviors. Appendix Table G.3 presents correlations between these outcomes.

41
In the Head-to-Toes task,11 children played a game in which they were instructed to touch their head when the interviewer directed them to touch their toes, and then to touch their toes when the interviewer directed them to touch their head. Children were directly assessed in the fall and spring of the preschool year. The activity is intended to tap children’s ability to suppress a dominant response (to follow the assessor’s directions) in order to carry out a subdominant response (to do the opposite of what the assessor asks them to do) and draws on children’s inhibitory control, attention skills, and working memory. Unlike the Pencil Tap task described below, the Head-to-Toes task requires inhibitory control of gross motor skills. Children are scored on the number of trials they answer correctly out of 10 trials. At baseline, children’s average score was 2 correct responses out of 10 trials. In a small study with children from middle- and high-socioeconomic status backgrounds, children at age 4 years got about 7 out of 10 trials correct.12 Higher scores on the Head-to-Toes task have been associated with higher teacher ratings of self-control on the Social Skills Rating Scale—Social Skills Scale
11Ponitz et al. (2008). 12Ponitz et al. (2008).
Box 3.2
Measuring Executive Function and Behavior Regulation Skills
Head-to-Toes: This task assesses children’s working memory and inhibitory control skills. Children play a game in which an independent assessor instructs them to touch their head when she directs them to touch their toes, and then to touch their toes when she directs them to touch their head.
Pencil Tap: In this task, an independent assessor asks the child to tap on a table twice with a pencil when she taps once, and once when she taps twice, to assess the child’s working memory and inhibitory control skills.
Behavior Problems Index (BPI): This measure, reported by teachers and parents, assesses three types of childhood behavior — children’s externalizing problems (acting out or aggres-sive behavior), internalizing problems (depression and anxiety), and hyperactivity. The parent report, collected in kindergarten, includes a total problem behaviors score, while the teacher report, collected in preschool and kindergarten, includes a score for each of these subscales.
Work-Related Skills: This subscale of the Cooper-Farran Behavioral Rating Scales measures children’s learning behaviors in the classroom. Teachers rate children’s ability to stay focused during academic tasks.
42
(SSRS) as well as higher literacy, vocabulary, and math achievement on the Woodcock-Johnson Test of Achievement in the fall and spring of the preschool year.13
In the Pencil Tap task,14 children are asked to tap on a table twice with a pencil when the experimenter taps once, and once when the experimenter taps twice. Children were directly assessed in the fall and spring of the preschool year. Like the Head-to-Toes task, this task also requires children to inhibit a natural tendency to mimic the action of the experimenter while remembering the rule for the correct response, and is thought to assess inhibitory control, attention skills, and working memory. The Pencil Tap task also requires greater fine-motor skill than Head-to-Toes does. Children are scored on the proportion of trials they answer correctly out of 16 trials. Children got an average of 44 percent of responses correct at baseline. National-ly, Head Start children get an average of 43 percent of responses correct.15 This task was included in efficacy trials with low-income preschool children, such as Head Start REDI and the Chicago School Readiness Project (CSRP),16 and has been shown to be predictive of mathemat-ics ability in a study with low-income Head Start children.17
The Behavior Problems Index (BPI) measures the frequency, range, and type of child-hood behavior problems for preschoolers across 28 items on a three-point Likert scale.18 Teachers filled out the BPI in the fall and spring of the preschool year, and parents and teachers responded to the BPI in the spring of the kindergarten year. Factor analyses of the teacher-reported BPI revealed three subscales, consistent with prior research: children’s externalizing problems (acting out or aggressive behavior), internalizing problems (depression and anxiety), and hyperactivity. At baseline, children in the Head Start CARES sample scored an average of 3.0 on a scale of 0 to 22 for externalizing behavior, an average of 1.6 on a scale of 0 to 20 for internalizing behavior, and an average of 1.8 on a scale of 0 to 10 for hyperactivity, as rated by their teachers. Parents were asked the same set of questions about their children’s behavior problems during the children’s kindergarten year. Since factor analysis did not show the same clear grouping of items found in the factor analysis for the teacher version of the BPI, only the total score was used in the analysis. Parents rated children at 9 on a scale of 0 to 56. Parent and teacher ratings of children’s total behavior problems in kindergarten were not highly correlated (r = 0.29, p < 0.01). In a smaller trial of low-income Head Start children, children had a baseline internalizing score of 1.59 with a standard deviation of 1.98 and overall externalizing scores of
13McClelland et al. (2007). 14Diamond and Taylor (1996). 15Moiduddin et al. (2012). 16REDI is an acronym for Research-based, Developmentally Informed. CSRP is not associated with The
Chicago School®, which is a trademark of The Chicago School of Professional Psychology. 17Blair and Razza (2007). 18Zill (1990).

43
4.18 with a standard deviation of 4.57.19 High levels of externalizing problems in early child-hood have been shown to be predictive of continued behavior problems and maladjustment in later childhood.20
Teachers provided assessments of children’s learning behaviors in the classroom using the work-related skills subscale of the Cooper-Farran Behavioral Rating Scales (CFBRS) in the fall and spring of the preschool year and in the spring of the kindergarten year.21 This measure is designed for teachers to assess the behavior of children in the classroom. Teachers report on children’s behavior during classroom activities such as “designated work time.” The 16-item subscale asks teachers to rate a child’s ability to stay on task during school-related activities. Children in the sample scored an average of 4.85 on a scale of 1 to 7 at baseline. In a similar sample, children at age 4 years had average scores of 4.76 out of 7.22 Scores from the work-related skills subscale have been shown to predict academic skills in elementary school, specifically for reading and mathematics.23
Emotion Knowledge, Social Problem-Solving Skills, and Social Behaviors
Independent assessors measured children’s understanding of emotions and their social problem-solving skills. (See Box 3.3.) Teachers reported on children’s social behavior in the classroom and their social problem-solving behavior with peers. Appendix Table G.4 presents correlations between these outcomes.
The facial emotions identification task and emotions situations task were used to direct-ly assess children’s knowledge of emotions in the fall and spring of preschool.24 In the emotions identification task, children are presented with pictures showing happy, mad, sad, and scared expressions and are asked to label faces with these emotions. With the emotions situations task,25 children listen to stories describing characters in emotionally evocative situations and identify the characters’ feelings by pointing to pictures of happy, mad, sad, or scared faces. On average, children identified 60 percent of emotions correctly in the emotions identification task and labeled 38 percent of characters’ feelings correctly in the emotions situations task at baseline. Previous research shows that preschool children’s ability to recognize and interpret emotional cues in facial expressions have effects in later childhood on social behavior and
19Raver et al. (2009). 20Campbell, Shaw, and Gilliom (2000). 21Cooper and Farran (1991). 22Morris, Millenky, Raver, and Jones (2013). 23McClelland, Morrison, and Holmes (2000). 24Ribordy, Camras, Stefani, and Spaccarelli (1988). 25Garner, Jones and Miner (1994).

44
academic competence, above and beyond verbal ability and temperament.26 Further, emotion situation knowledge is shown to be a positive predictor of preschoolers’ performance on direct assessments of school competence (such as general positive classroom behavior, learning behaviors, and interpersonal classroom behaviors).27
The Challenging Situations Task (CST) was used to directly assess children’s social problem-solving skills in the fall and spring of preschool.28 Children are presented with pictures of four peer scenarios (a peer knocking down the focal child’s blocks, a peer hitting the focal child, the focal child entering a group, and a peer taking a ball from the focal child). The stories focus on peer entry and peer provocation, both challenging situations likely to elicit an affective response from young children. After each scenario, children are asked what they would do in the situation. Two of the scenarios ask children to choose from a set of possible responses, while the other two scenarios require open-ended responses. Responses were coded as compe-tent (appropriately asserting oneself or calmly negotiating a solution), aggressive (responding with verbal or physical antagonism, intimidation, or force), adult intervention (bringing the problem to the teacher’s attention), emotion labeling (describing how the situation would make
26Izard et al. (2001); Rhoades, Warren, Domitrovich, and Greenberg (2011). 27Garner and Waajid (2008). 28Denham and Bouril (1994).
Box 3.3
Measuring Emotion Knowledge, Social Problem-Solving Skills, and Social Skills
Facial Emotions Identification and Emotions Situations Tasks: These tasks assess chil-dren’s knowledge of emotions. In the emotions identification task, children are asked to label the emotions on pictures showing happy, mad, sad, and scared expressions. In the emotions situations task, children are asked to label the emotion of the protagonist in a story.
Challenging Situations Task: This task assesses children’s social problem-solving skills. Children are presented with four peer scenarios and are asked what they would do in the situation.
Social Skills Rating Scale (SSRS): SSRS is a teacher- and parent-reported measure that assesses children’s ability to cooperate with others, assert themselves to solve conflicts with peers, and regulate their behavior.
Interpersonal Skills: This subscale of the Cooper-Farran Behavioral Rating Scales is a teacher-reported measure that rates children’s levels of peer interaction, respect for others’ feelings, and resolving peer conflicts.

45
the child feel), or inept (passive avoidance). At baseline, children provided an average of 1.4 competent responses to these four scenarios (out of a possible high score of 10) and 1.0 aggres-sive response (also out of 10 possible responses). In a similar sample to Head Start CARES, at baseline children had a somewhat higher mean score: 1.96 for the CST aggressive response score, with a standard deviation of 2.27, and 2.51 for the CST competent response score, with a standard deviation of 2.16.29 The CST has been found to predict later social competence and classroom adjustment.30
Teachers assessed children’s social behavior in the fall and spring of the preschool year and in the spring of the kindergarten year using the SSRS.31 The SSRS measures children’s ability to cooperate with others, assert themselves to solve conflicts with peers, and regulate their behavior. On average, teachers rated children 41 on a scale of 0 to 60 on the SSRS. The national average for the teacher-reported SSRS is 40.32
In the children’s kindergarten year, parents also reported on children’s social behavior in the home using the parent version of the SSRS. This measure includes only two of three subscales that were used in the teacher-reported measure: cooperation (children’s ability to cooperate with others) and self-control (children’s ability to regulate their behavior), but asks these questions in the context of the home environment with family members and peers instead of the classroom. Parents rated children 31 on a scale of 0 to 40, compared with the national average of 25 on this scale. Parent and teacher ratings of children’s social skills were not highly correlated (r = 0.27, p < 0.01), which is not surprising given that they were rating children’s behaviors in different contexts — parents at home and teachers at school.
Teachers also reported on children’s interpersonal behavior using the interpersonal skills subscale of the CFBRS in preschool.33 The subscale includes questions about level of peer interaction, children’s respect for others’ feelings, and resolving peer conflicts. Teachers rated children 5.4 on a scale of 1 to 7 on this measure.
Pre-Academic Skills
Children’s pre-academic skills were assessed with cognitive tests during direct assess-ments and through teacher reports. (See Box 3.4.) These skills include verbal, literacy, and math skills. Appendix Table G.5 presents correlations between these pre-academic outcomes.
29Bierman et al. (2008a). The standard deviation indicates the amount of variation or dispersion from the
mean. 30Denham et al. (2013). 31Gresham and Elliot (1990). 32Gresham and Elliot (1990). 33Cooper and Farran (1991).

46
The Letter-Word Identification subscale of the Woodcock-Johnson III (WJ-III) was used to assess children’s literacy skills in the fall and spring of preschool.34 The WJ-III is a nationally normed, widely used direct assessment of cognitive, language, and literacy skills. Children are asked to identify (through pointing) letters and words from a test page of choices. On average, children in the Head Start CARES sample scored 315 using a standardized W-score,35 slightly below the national average for 4-year-olds of approximately 332.
The Expressive One-Word Picture Vocabulary Test (EOWPVT) was used to directly assess children’s vocabulary in the fall and spring of preschool.36 In this task, children are asked to produce the word that best describes pictures they are shown (also known as their “expressive language”). On average, children in the Head Start CARES sample scored 85 at baseline on a nationally normed scale that has an average score of 100 and a standard deviation of 15. In other words, children in the Head Start CARES sample scored, on average, approximately one standard deviation below the national average (a relatively large difference). The EOWPVT is moderately to highly correlated with a number of language development measures (Renfrew
34Woodcock, McGrew, and Mather (2001). 35A standardized W-score is an age-standardized version of the measure. Technically, it is a transfor-
mation of raw scores onto a Rasch scale with equal-interval units. 36Brownell (2000).
Box 3.4
Measuring Pre-Academic Skills
Letter-Word Identification (Woodcock-Johnson III): This subtest assesses children’s pre-reading skills as children are asked to identify letters and words from a test page of choices.
Expressive One-Word Picture Vocabulary Test (EOWPVT): The EOWPVT assesses children’s expressive vocabulary by asking them to produce the word that best describes pictures they are shown.
Applied Problems (Woodcock-Johnson III): This subtest assesses children’s pre-math skills as they are asked to identify numbers and perform simple math functions (addition and sub-traction).
Academic Rating Scale (ARS): This scale is a teacher-reported measure that rates children’s pre-literacy skills, pre-math skills, and general knowledge, asking, for example, whether they can produce rhyming words, predict what comes next in stories, understand quantity, and sort math materials.

47
Language Tests, the Reynell Development Language Scales-Revise, the Test of Language Development-Intermediate, and the Test for Reception of Grammar).37
The Applied Problems subscale of the WJ-III was used to assess children’s math skills in the fall and spring of preschool.38 Children are asked to identify numbers and quantities and engage in basic math tasks (addition and subtraction). On average, children in the Head Start CARES sample scored 398 using a standardized W-score. The national average for 4-year-olds is a score of approximately 399.
In addition to direct assessments of children’s early academic skills, teachers were asked in preschool and kindergarten to report on children’s early literacy, math, and general knowledge skills using the Academic Rating Scale.39 The literacy subscale includes questions about whether children use complex sentence structures (for example, “If she had brought her umbrella, she wouldn’t have gotten wet”), can produce rhyming words, and can predict what will happen next in stories by using the pictures and storyline for clues. The math subscale includes questions about whether children can sort, classify, and compare math materials by various rules and attributes, put a group of objects in order, and show an understanding of the relationship between quantities. Baseline average scores were fairly similar across the three subscales, with an overall average of approximately 2.4 on a scale of 1 to 5.
Grade Retention and Special Education in Kindergarten
Information about grade retention and special education were collected in the kinder-garten year. (See Box 3.5.) Kindergarten teachers reported on their expectations about
37Martin et al. (2000). 38Woodcock, McGrew, and Mather (2001). 39National Center for Education Statistics (n.d.).
Box 3.5
Measuring Grade Retention and Special Education in Kindergarten
Child Retention: This teacher-reported measure indicates whether the kindergarten teacher expects the child to be retained in kindergarten.
Receipt of Special Services: This teacher-reported measure indicates whether the child receives speech or language therapy, occupational therapy, or mental health consultation in kindergarten.
Receipt of Special Education Services: This parent-reported measure indicates whether the child receives special education services in kindergarten.

48
children’s retention in kindergarten and on children’s receipt of special services. Parents reported on their children’s receipt of special education services.
Child retention. Kindergarten teachers were asked whether they expected that each child would be retained in kindergarten or promoted to first grade. Teachers expected about 7 percent of children in the control group to be retained in kindergarten. Nationwide, 6 percent of children repeated kindergarten in the 2009-2010 school year.40
Receipt of special services. Kindergarten teachers indicated whether children receive any of the following special services: speech or language therapy, occupational therapy, or mental health consultation. Teachers reported that 13 percent of children in the control group were receiving at least one of these services.
Receipt of special education services. Parents were asked during the kindergarten year whether their child receives special education services. Six percent of parents in the control group reported that their children were receiving these services.
Prioritizing Outcomes The rich set of data sources in the Head Start CARES study provides the opportunity to under-stand how and to what extent social-emotional interventions can affect multiple aspects of teacher practices and classroom quality, as well as multiple dimensions of child development. However, the large number of outcomes available in the study means that estimating impacts on the full set of outcomes would likely lead to erroneous conclusions because of the high proba-bility of finding some statistically significant effects where no true effects exist. Two steps were taken to minimize this problem: (1) the number of outcomes in the analysis was carefully limited; and (2) the outcomes in the analysis were prioritized into three categories — primary, secondary, and exploratory.41 Prioritization was based on the theory of change that the Head Start CARES team developed for each enhancement.
Primary outcomes are those that an enhancement was expected to affect based on the theory of change that was developed by the Head Start CARES team and prior evidence. If an enhancement had statistically significant impacts on a primary outcome, it is reasonable to
40National Center for Education Statistics (2013). 41These steps were taken instead of explicitly adjusting the p-values of the impact estimates to correct for
multiple comparisons, given the lack of consensus among statisticians and evaluators on the most appropriate methods for doing so. The approach of carefully limiting the number of outcomes in the analysis builds from the notion, set forth by Darlington (1990), that “logically independent” tests — analyses for which knowing the findings from one of them does not provide any information about the findings from another — do not need to be adjusted for one another. In this study, the set of tests for each enhancement are considered to be logically independent from the set of tests for the other two enhancements.
49
conclude with some confidence that the enhancement actually affected that outcome, regardless of whether there were also impacts on secondary or exploratory outcomes. Secondary outcomes are those that were not as strongly hypothesized as primary outcomes because they were secondary in the theory of change. For secondary outcomes, impacts, if found, may suggest some potential effects of the enhancement, but the conclusions would be strengthened if they could be replicated in another study. Exploratory outcomes are those that were interesting to examine but for which there was little a priori expectation of program impact. Impacts on exploratory outcomes should be interpreted with more caution.
The Head Start CARES team hypothesized that each enhancement targets some out-comes more directly than others, and therefore determined that each enhancement has different primary and secondary outcomes. Chapters 4, 5, and 6 outline the theory of change for each enhancement, as developed by the CARES team, and thus which outcomes they believe are most central to each enhancement. The primary expected outcomes for each enhancement are summarized below.
• The Incredible Years Teacher Training Program trains teachers to use effec-tive classroom management strategies, and the most direct expected effect on children is their ability to manage their own behavior in the classroom. Therefore, classroom management, executive function, behavior problems, and learning behaviors are all primary outcomes for this enhancement, while emotion knowledge and social problem-solving skills are considered secondary.
• Preschool PATHS provides teachers with lessons that teach children to un-derstand emotions and to better handle difficult social situations; therefore, teachers’ social-emotional instruction and children’s emotion knowledge and social problem-solving skills are all considered primary outcomes for the PATHS enhancement, with the primary outcomes of The Incredible Years (behavior problems and learning behaviors) as secondary outcomes for PATHS.
• The focus of the Tools of the Mind—Play enhancement is to train teachers to actively support children’s “pretend” play, which was thought to lead to chil-dren’s improved executive function skills. Therefore, for Tools, teachers’ scaffolding of play and children’s executive function skills (measured by the Head-to-Toes and Pencil Tap tasks) are considered primary outcomes, with emotion knowledge and social problem-solving skills as secondary.

50
For all three enhancements, children’s pre-academic skills were exploratory outcomes because they were not targeted by the enhancements and prior evidence on whether social-emotional programs improve these outcomes is mixed.42
The quality of the measures is important to keep in mind when interpreting the impact estimates for each enhancement. Overall, directly assessed measures of teacher, classroom, and child outcomes are considered stronger than teacher-reported measures. Independent observers and assessors did not know whether the classroom they were observing or the child they were assessing was in one of the enhancement groups or the control group, and thus could not be influenced by this knowledge. Also, independent observers and assessors, unlike the teachers in the sample, were trained to score consistently, so their personal characteristics, such as compre-hension skills or mental health, were less likely to influence their ratings. Therefore, evidence of program impacts on teacher-reported measures should be considered corroborating evidence if program impacts are also seen on directly assessed measures of related outcomes. However, evidence of program impacts on teacher-reported outcomes, without evidence of program impacts on similar directly assessed outcomes, should be interpreted with more caution.
Impact Analysis To estimate the impacts that each enhancement had on child, classroom, and teacher outcomes, the average outcomes for each enhancement group were compared with the average outcomes in the control group. Multilevel modeling was used to account for the nesting of children within classrooms, and classrooms within centers. To account for the study’s random assign-ment of centers within blocks, block indicator variables were also included in each model. For all child outcomes, in addition to the block indicator variables, the regression adjustment included the baseline measure of the outcome (a “pretest”), child age, and a baseline measure of the child’s expressive language. For classroom and teacher outcomes, the block indicator variables and pre-tests were included as covariates. These covariates were selected based on theory and information about their predictive power. See Appendix H for model specifications.
Differences between the groups of children or teachers who were randomly assigned to the program and control group centers are presented in the following chapters as the effect, or impact, of the enhancement.43 Those differences that are unlikely to have occurred by chance
42Bierman et al. (2008a); Morris et al. (2013). 43To estimate impacts, mean outcomes for each enhancement group were compared with corresponding
means for the control group, in models pooled across all three enhancements. Models also controlled for key background characteristics, typically including at least a pre-test on the outcome measure. Multilevel modeling was used to account for the nested nature of the data, where classrooms are nested within centers and centers are nested within blocks. Fixed effects accounted for the nesting of centers within blocks.

51
are described as “statistically significant differences” and are noted by one or more asterisks. As discussed in Box 3.6, impacts are shown in effect size units, which allows for the comparison of findings across outcomes within this study that were measured on different scales, and to allow for comparison of findings across studies.
The analysis of kindergarten outcomes used the same statistical models that were used for the preschool analysis. Multilevel modeling accounted for the nesting of children within classrooms, and classrooms within centers. The kindergarten analysis accounted for nesting in
Box 3.6
Understanding and Contextualizing Effect Sizes
Effect sizes provide a way to compare the findings in Head Start CARES with findings from other studies, yielding a standardized form of the impact across different measures. Technical-ly, the effect size is computed as the mean impact, adjusted for covariates, divided by the standard deviation of the control group. Bloom and colleagues suggest that the magnitude of effects in educational interventions can be understood by comparing the size of the effects in similar policy-relevant contexts.*
Other preschool interventions that have focused on early social-emotional development have been smaller in scale, have had extensive resources, and have been more intensive. For in-stance, in the Foundations of Learning demonstration and CSRP (formerly known as the Chicago School Readiness Project),† highly credentialed and clinically licensed coaches provided a full day of consultation for teachers, at times directly intervening one-on-one with children. In the Head Start REDI Program,‡ another early childhood intervention, teachers received support for both the social-emotional and literacy domains. In these more intensive early childhood interventions, effect sizes on teachers’ practices ranged from about 0.40 to about 0.90.§ Effect sizes on children ranged from 0.21 to 1.06.|| In the current study, effect sizes for teachers were considered moderate at around 0.50 and large at around 0.80. Given that effects on children must occur as a result of changes in teachers’ practices, effects were expected to be smaller on child outcomes than on teachers’ practices. As such, effects below 0.20 were considered small, those between 0.20 and 0.40 were considered moderate, and those above 0.40 were considered large, for the Head Start CARES study. __________________________
*Bloom, Hill, Black, and Lipsey (2008). †Raver et al. (2011). CSRP is not associated with The Chicago School®. ‡Bierman et al. (2008a). §For instance, in the Foundations of Learning demonstration, which evaluated impacts on preschool
classroom management, the effect sizes of teachers’ practices that were measured using CLASS were moderate (0.46 for teacher sensitivity) to large (–0.90 for negative climate) (Morris et al., 2010). In CSRP, CLASS impacts ranged from 0.52 to 0.89 (Raver et al., 2008). In REDI, CLASS impacts ranged from 0.39 to 0.61 (Domitrovich et al., 2009). These impacts on teacher practice were also sufficiently large to lead to impacts on child outcomes (Morris et al., 2010).
||Bierman et al. (2008a); Morris et al. (2010); Raver et al (2009).
52
preschool centers and classrooms, since random assignment had been conducted at the Head Start center level. However, children were now also nested within kindergarten classrooms and schools; in order to account for the shared variance in teacher-reported data for children whose reports were completed by the same teacher, kindergarten teacher baseline characteristics were included as covariates in models that estimated impacts on teacher-reported outcomes.

53
Chapter 4
Impacts for the Incredible Years Enhancement in Head Start CARES Preschool Classrooms
This chapter presents findings on the impacts of The Incredible Years Teacher Training Pro-gram in the Head Start CARES demonstration.1 It begins with a review of the Incredible Years theory of change, including the primary impacts that would be expected on teacher practices, classroom climate, and children’s social-emotional competence. This is followed by a brief summary of the impacts of The Incredible Years that were actually found, including whether the impacts were consistent with expectations. The remainder of the chapter presents a more detailed discussion of the impacts. All measures presented in this chapter are summarized in Boxes 3.1 through 3.5, in Chapter 3, to allow for easy reference.
Theory of Change and Primary Expected Impacts The Incredible Years focuses on training teachers to implement positive classroom-wide management and behavioral support strategies that promote children’s adaptive social behavior and reduce their problem behaviors (acting out or withdrawn behavior). Building on a founda-tion of positive teacher-student relationships, the enhancement includes attention to behavioral support, problem-solving strategies, classroom organization (rules and routines), clear com-mands, consistent setting of limits, and positive reward structures.
The Head Start CARES team determined that the Incredible Years approach draws on research suggesting that children’s socialization is influenced by the interactions between teachers and children in classrooms.2 In some classrooms, teachers and children can become caught in escalating cycles of negative interactions that reinforce children’s acting-out behav-ior.3 Conversely, when teachers maintain positive, firm control over classrooms, they reinforce children’s compliance with simple directives and provide a supportive environment in which children learn to better regulate their behavior in classrooms.4 These more emotionally positive and behaviorally well-organized classrooms are hypothesized to provide key support for developing self-regulatory skills both to children who have behavior problems and to children who are better able to regulate their behavior. A secondary component of The Incredible Years
1For The Incredible Years Teacher Training Program, see Webster-Stratton, Reid, and Hammond (2001,
2004); Reid, Webster-Stratton, and Hammond (2003); Webster-Stratton, Reid, and Stoolmiller (2008). 2Hamre and Pianta (2005); Fantuzzo, Bulotsky-Shearer, Fusco, and McWayne (2005). 3Arnold et al. (1999); Brouwers and Tomic (2000). 4Webster-Stratton, Reid, and Hammond (2001).

54
targets certain changes in children’s social and emotional skills; in particular, the model sup-ports teachers’ labeling of children’s emotions during play time and teaches children social problem-solving skills.
In sum, the Head Start CARES team hypothesized that The Incredible Years’ explicit focus on teachers’ positive classroom management and behavioral support strategies would produce a more positive classroom climate, especially with regard to levels of emotional support and classroom organization. Children in these classrooms were thought to demonstrate greater social-emotional competence, with the strongest effects on their behavior problems and executive function skills (the ability to shift attention, exercise inhibitory control, and demon-strate working memory) because of children’s greater self-regulatory skills. Secondary benefits of The Incredible Years were expected for children’s emotional and social skills (their under-standing of emotions and social problem-solving, which are thought to underlie social interac-tions), as well as teachers’ ratings of their social behaviors.
Findings in Brief In the preschool year, The Incredible Years produced a number of positive impacts, although not always in the ways that the theory of change would predict.
• Incredible Years teachers were rated higher on overall classroom management practices; they also were rated higher on social-emotional instruction.
As expected, lead teachers in Incredible Years classrooms demonstrated higher levels of classroom management, in part because they were more positive (for example, rewarding good behavior and providing clear consequences) and less negative (for example, yelling at children who are acting out) in their behavior management practices and used practices that supported children’s attention and engagement. These were central aspects of the Incredible Years training. In addition, this enhancement improved teachers’ social-emotional instructional practices, particularly their modeling of emotions and their ability to draw children’s attention to peers’ emotions and to support children’s social problem-solving skills.
• Contrary to expectations, the positive impacts on teachers’ practices did not translate into wide-ranging impacts on the quality of the cli-mate in Incredible Years classroom.
The Incredible Years enhancement had favorable impacts on a few key subdimensions of the widely used Classroom Assessment Scoring System (CLASS) observation tool that coincide most closely with impacts on targeted teacher practices. However, these did not translate into what were expected to be broader impacts on classroom climate, in terms of three

55
key summary dimensions that the research literature has identified as being important for children’s development (emotional support, classroom organization, and instructional support).
• For the Incredible Years research sample as a whole, there were no sta-tistically significant impacts on children’s problem behaviors (as rated by teachers) or on children’s executive function skills (as assessed by interviewers).
The improvements in Incredible Years teachers’ classroom management practices did not lead to impacts on children’s problem behavior and executive function, which were hypoth-esized to be the primary outcomes for children. However, teachers in Incredible Years class-rooms did rate children higher on “learning behaviors,” meaning that they were better able to engage in the learning tasks of preschool. One exception to the lack of Incredible Years impacts on children’s behavior was for children who had high levels of behavior problems at the beginning of the Head Start year: teachers’ ratings for this group showed a statistically signifi-cant reduction in their acting out and hyperactive behavior. This is important, since The Incred-ible Years was originally developed for, and has been studied extensively with, children who have been referred for mental health services who might demonstrate similarly high rates of problem behavior.
• The Incredible Years produced generally small to moderate but statisti-cally significant improvements in children’s social-emotional skills — their knowledge of emotions and social problem-solving skills — and social behaviors.
Trained interviewers assessed children in Incredible Years classrooms as better able to identify emotional expressions and to generate more competent responses to vignettes in which a child faces an ambiguous situation that could be construed as a provocation — for example, a story about a child who knocks down another child’s tower of blocks. In addition, teachers reported higher levels of social behaviors among children in Incredible Years classrooms, compared with those in control classrooms. While these skills were not explicitly taught in Incredible Years classrooms, this finding suggests that changes in teachers’ classroom man-agement practices can lead to changes in these aspects of social and emotional development.
Thus, although many of the outcomes that The Incredible Years targets most directly were not affected (except for outcomes among the highest-risk subgroup of children, for whom there were statistically significant impacts), there were consistent impacts for children across the emotion and social problem-solving skills domain that were corroborated by teachers’ reports of children’s social behaviors. The association of these skills with lower levels of aggressive

56
behavior in other studies bodes well for the longer-term outcomes of children in Incredible Years classrooms.5
In the next sections, these findings are discussed in greater detail.
Impacts on Teachers’ Practices and Classroom Climate The first-order question was whether the Incredible Years enhancement affected teachers’ practices, particularly on the key subdimensions related to classroom management that were the core focus of the training in this enhancement. The impacts were measured using the Adapted Teaching Style Rating Scale (Adapted TSRS), as conducted by classroom observers who were deliberately kept uninformed of intervention group status.
• The Incredible Years improved teachers’ classroom management and, to a lesser extent, social-emotional instruction.
As shown in Table 4.1, the findings on the subscales of the larger classroom man-agement dimension show that Incredible Years teachers were rated higher on the positive behavior management and attention/engagement subdimensions and lower on the negative behavior management subdimension of the Adapted TSRS; however, there were no impacts on three other subdimensions of classroom management (consistency/routines, preparedness, and awareness of what is occurring in the classroom), which were also direct targets of the enhancement.
The Incredible Years trains teachers extensively in positive behavior management — such as using specific praise — while encouraging teachers to use negative behavior manage-ment selectively at most. Attention and engagement, which include behaviors such as using gestures to get the attention of the classroom, is also a core component of training and coaching in The Incredible Years. The impacts on these outcomes were of moderate size — around half a standard deviation improvement in what were already moderate levels of positive behavior management and attention/engagement among teachers, and a third of a standard deviation reduction from relatively low levels of negative behavior management. This brought the average teacher from a moderate level (3 to 3.5 on a 5-point scale) to a moderately high level (3.5 to 4 on a 5-point scale) on positive behavior management and attention/engagement dimensions. For positive behavior management, a score of 3 indicates that the teacher may occasionally use “effective praise” and other supportive practices to elicit the desired behavior,
5Crick and Dodge (1994); Dodge, Pettit, Bates, and Valente (1995); and Orobio de Castro, Bosch, Veer-
man, and Koops (2003).

57
but at other times may resort to less effective methods (such as raising his or her voice or mentioning consequences but not following through). In comparison, scores that range from 4 to 5 are indicative of a teacher who is successfully controlling children’s behavior, relying on positive behavior management strategies (such as rewarding good behavior with specific praise)
Control Incredible DifferenceGroup Years (IY) (IY vs. Effect
Outcomea Mean Mean Control) Sizeb
Classroom management (1-5) 3.79 4.09 0.30 ** 0.44Consistency/routine 3.99 4.20 0.21 0.26Preparedness 3.93 4.11 0.18 0.20Classroom awareness 3.76 3.80 0.05 0.06Positive behavior management 3.57 4.09 0.52 *** 0.55Negative behavior management 1.47 1.20 -0.27 ** -0.32Attention/engagement 2.96 3.52 0.55 *** 0.53
Social-emotional instruction (1-5) 1.76 1.98 0.22 * 0.30Emotion modeling 1.50 1.75 0.26 * 0.38Emotion expression 1.84 1.96 0.12 0.13Emotion regulation 1.81 2.05 0.23 0.26Social awareness 1.64 1.94 0.30 * 0.40Social problem-solving 1.62 1.95 0.33 ** 0.40Provision of interpersonal support 2.14 2.22 0.08 0.08
Scaffolding (1-5) 1.44 1.41 -0.03 -0.06Scaffolding dramatic play 1.47 1.44 -0.04 -0.06Scaffolding peer interaction 1.40 1.38 -0.02 -0.03
Sample sizec
Centers 26 26Classrooms 77 77
Classroom-Level Impacts on Teachers' Practices Based on Observations of
Head Start CARES Demonstration
Subdimensions at Preschool Follow-Up: The Incredible Years
Table 4.1
SOURCE: MDRC calculations based on observational assessments completed using the Adapted Teaching Style Rating Scale (Raver et al., 2012).
NOTES: Statistical significance levels are indicated as follows: *** = 1 percent; ** = 5 percent; * = 10percent.
Rounding may cause slight discrepancies in sums and differences. aThe rating scale for each outcome measure is shown in parentheses, from low to high.bEffect size is calculated by dividing the impact of the program (the difference between the means
for the program group and the control group) by the standard deviation for the control group.cFor all variables in the table, data are available for the full sample.

58
and clear contingencies (such as reminding children of rules and the logical consequences of their actions). The teacher also regularly uses eye contact, simple verbal cues (such as giving clear directions and mentioning children by name), touch, and other positive strategies to keep the class on track.
The overall positive impact on social-emotional instruction appears to be driven by teachers’ higher levels of instruction on emotion modeling (labeling emotions for children and talking about them), social awareness (drawing children’s attention to their peers’ emotions to build empathy and understanding), and social problem-solving (actively supporting children during peer conflicts). By contrast, there were no impacts on emotion expression, emotion regulation, or provision of interpersonal support. As expected, there were no impacts on teachers’ scaffolding of children’s pretend play and peer interactions.6
• The Incredible Years did not improve the general classroom climate (emotional support or classroom organization), but it did affect two spe-cific aspects of climate: the enhancement improved teachers’ use of be-havior management strategies and it decreased the negative climate in the classroom.
Next, the CLASS measure was used to assess the impacts of The Incredible Years on the overall climate of the preschool classroom. In contrast to the Adapted TSRS, CLASS (1) measures a broader set of teacher-child interactions, rather than only teacher practices; and (2) focuses on all adults (and children) in the classroom, not just the lead teacher. Two key dimensions of CLASS — classroom organization and emotionally supportive teacher-child interactions — were most in line with the theory of change that the Head Start CARES team developed for the Incredible Years enhancement, and were expected to be affected positively. But the analyses also examined the effects of the enhancement on the two other dimensions — instructional support and literacy — that make up CLASS and are considered critical for classroom climate.
As shown in Table 4.2, The Incredible Years did not have the impact that the Head Start CARES team’s theory of change would predict on the CLASS dimensions of classroom organization and emotional support. These findings indicate that while the enhancement changed the practices in which teachers were trained, it did not change the overall climate of the classroom in terms of how warm and sensitive it was or how organized it was.
6Scaffolding is the act of helping a child accomplish a challenging task or acquire a skill that is just beyond
the child’s current ability level.

59
However, when looking at the subdimensions of CLASS that make up the larger di-
mensions of classroom organization and emotional support, Incredible Years classrooms showed significantly lower levels of negative climate, indicating that teaching staff displayed less sarcasm and anger in their interactions with children (with an effect-size reduction of one-fourth of a standard deviation), and had higher levels of behavior management, consistent with
Control Incredible DifferenceGroup Years (IY) (IY vs. Standard Effect
Outcomea Mean Mean Control) Error Sizeb
Emotional support (1-7) 5.35 5.50 0.16 0.14 0.17Positive climate 5.40 5.62 0.22 0.18 0.20Negative climate 1.52 1.24 -0.27 ** 0.14 -0.26Teacher sensitivity 4.96 5.12 0.16 0.18 0.14Regard for student perspectives 4.54 4.51 -0.02 0.15 -0.02
Classroom organization (1-7) 4.90 5.13 0.23 0.15 0.22Behavior management 5.20 5.61 0.41 ** 0.19 0.39Productivity 5.32 5.41 0.09 0.18 0.08Instructional learning formats 4.19 4.34 0.14 0.15 0.13
Instructional support (1-7) 2.43 2.46 0.04 0.12 0.04Concept development 1.90 2.02 0.12 0.11 0.14Quality of feedback 2.46 2.61 0.15 0.14 0.15Language modeling 2.92 2.76 -0.16 0.17 -0.15
Literacy focus (1-7) 1.48 1.58 0.10 0.08 0.20
Sample sizec
Centers 26 26Classrooms 77 77
Classroom-Level Impacts on Classroom Climate Based on Observations at
Head Start CARES Demonstration
Preschool Follow-Up: The Incredible Years
Table 4.2
SOURCE: MDRC calculations based on observational assessments completed using the Classroom Assessment Scoring System (Pianta, La Paro, and Hamre, 2008).
NOTES: Statistical significance levels are indicated as follows: *** = 1 percent; ** = 5 percent;* = 10 percent.
Rounding may cause slight discrepancies in sums and differences.aThe rating scale for each outcome measure is shown in parentheses, from low to high.bEffect size is calculated by dividing the impact of the program (the difference between
the means for the program group and the control group) by the standard deviation for the control group.
cFor all variables in the table, data are available for the full sample.

60
the findings on the Adapted TSRS, with an effect size of a little more than a third of a standard deviation. Notably, in contrast to an earlier study of The Incredible Years at scale,7 these better classroom management skills did not translate into more productivity (for example, maximizing learning time, having clear routines, taking less time to make the transition from activity to activity, and being fully prepared for lessons) in the classroom.
Thus, The Incredible Years was most effective at changing the specific strategies that teachers used in classrooms to support children’s behavior management and engagement in classroom activities; the changes were on similar constructs and were roughly the same size as the lower range of statistically significant effects in two smaller, more intensive trials of The Incredible Years,8 in which statistically significant changes in teachers’ practices ranged from effect sizes of 0.72 to 0.90.9 However, The Incredible Years did not affect other key aspects of classroom management, including positive classroom climate, a key target of the enhancement.
As shown in the bottom panel of Table 4.2, The Incredible Years did not have statisti-cally significant impacts on other dimensions measured by CLASS — instructional support and literacy. This was not surprising, as these were not thought to be targets of the enhancement.
Impacts on Children’s Social-Emotional Competence
Impacts on Executive Function, Behavior Regulation, and Learning Behaviors
The Incredible Years’ focus on teachers’ effective management of children’s behavior was intended to directly target children’s problem behaviors, particularly to reduce externalizing problems (the extent to which children act out). Hence, these outcomes are considered “prima-ry” for The Incredible Years. Indeed, The Incredible Years was originally created to improve outcomes for children with clinically elevated acting-out behaviors who were identified for mental health services. Further, it was expected that improved outcomes would also be demon-strated in children’s greater executive function skills. The Head Start CARES team hypothe-sized that the more positive classroom management skills of Incredible Years teachers would support children’s ability to regulate their behavior more effectively in the classroom context.
• The Incredible Years did not have an effect on children’s problem be-haviors or executive function skills for the sample as a whole during the preschool year. However, Incredible Years teachers did rate children as
7Morris et al. (2010). 8Morris et al. (2010); Raver et al. (2011). 9Morris et al. (2010); Raver et al. (2008).

61
having stronger attention skills and engagement in learning activities (higher levels of learning behaviors) than children in the control group.
Contrary to expectations, as shown in Table 4.3, The Incredible Years had very few sta-tistically significant impacts on children’s problem behaviors and executive function or behav-ior regulation skills, as assessed by trained interviewers and as reported by teachers. In contrast, previous trials found that The Incredible Years reduced teachers’ ratings of behavior problems ranging from nonsignificant to an effect size of –0.70 (a reduction in behavior problems) and
Control Incredible DifferenceGroup Years (IY) (IY vs. Standard Effect
Outcomea Mean Mean Control) Error Sizeb
Executive function (direct assessment)Head-to-Toes (0-10) 4.08 3.92 -0.16 0.24 -0.04Pencil Tap (0-1) 0.67 0.67 0.00 0.02 0.01
Behavior problems (teacher report)Total score (0-52) 5.99 5.49 -0.50 0.71 -0.06
Externalizing (0-22) 3.02 2.53 -0.48 0.33 -0.11Hyperactivity (0-10) 1.63 1.45 -0.18 0.18 -0.08Internalizing (0-20) 1.36 1.47 0.11 0.26 0.05
Learning behaviors (teacher report)Work-related skills (1-7) 5.08 5.26 0.18 ** 0.08 0.17
Sample sizec
Centers 26 26Classrooms 77 77Children 621 702
Head Start CARES Demonstration
Table 4.3
Child-Level Impacts on Executive Function, Behavior Regulation, andLearning Behaviors at Preschool Follow-Up: The Incredible Years
SOURCES: MDRC calculations based on the direct assessments and teachers' reports.
NOTES: Statistical significance levels are indicated as follows: *** = 1 percent; ** = 5 percent; * = 10 percent.
Rounding may cause slight discrepancies in sums and differences.aThe rating scale for each outcome measure in shown in parentheses, from low to high.bEffect size is calculated by dividing the impact of the program (the difference between the means
for the program group and the control group) by the standard deviation for the control group. cFor all variables in the table, data are available for at least 98 percent of the sample.

62
improved executive function skills in the range of effect sizes of 0.30 to 0.40.10 Notably, despite their substantial poverty-related risks, children in both the Head Start CARES and control group classrooms had scores of only 5 to 6 out of 52 on teachers’ reports of behavior problems, and two-thirds of their trials were correct on the Pencil Tap task, although only 40 percent of their trials were correct in the Head-to-Toes task.11
The one positive finding in the area of executive function and behavior regulation was in teachers’ assessment of children’s learning behaviors, which measures children’s attention and engagement in learning activities on a scale of 1 to 7. Children in control classrooms were scored at a relatively high 5.08, and children in Incredible Years classrooms scored a small amount higher, with an average score of 5.26. This is a statistically significant effect size of 0.17. These findings might suggest that teachers observed differences in children’s behavior in the classroom setting that were not reflected during one-on-one tasks with the interviewer.
Impacts on Social-Emotional Skills and Social Behaviors
The Head Start CARES evaluation also assessed the impact of The Incredible Years on children’s social and emotional skills, particularly those skills thought to underlie children’s social behavior. Since The Incredible Years does not explicitly focus on emotion knowledge and social problem-solving skills, and these skills have rarely been assessed in previous studies of this enhancement, they are considered to be secondary outcomes. Since little if any research on these measures is available for comparison with the Head Start CARES findings, further studies are needed to confirm whether the impacts described here can be replicated.12
• The Incredible Years improved children’s recognition of facial expres-sions of emotion. The enhancement also had positive impacts on chil-dren’s responses to challenging peer situations (as assessed by inter-viewers) and on children’s social behaviors in the classroom (as rated by teachers). These outcomes were not thought to be primary foci of the Incredible Years enhancement.
As shown in Table 4.4, The Incredible Years improved children’s skills in recognizing emotions and in social problem-solving, based on their scores on tasks administered by trained observers as well as teachers’ reports of children’s behavior.
10Raver et al. (2011); Morris et al. (2013). 11See Chapter 3 for descriptions of the Pencil Tap and Head-to-Toes tasks. 12Webster-Stratton, Reid, and Hammond (2004).

63
When asked to identify emotional expressions on faces (facial emotions identification),
children in Incredible Years classrooms correctly identified more faces than their counterparts in control classrooms. The impacts are small — from 71 percent of faces identified correctly in the control group to 74 percent in the enhancement group — but the effects are positive and statistically significant. Similarly, when asked how the protagonist in an emotions-laden story might feel (emotions situations identification), children in Incredible Years classrooms were 2 percentage points more likely (also statistically significant) than children in the control group to indicate the correct emotional expression.
Control Incredible DifferenceGroup Years (IY) (IY vs. Standard Effect
Outcomea Mean Mean Control) Error Sizeb
Emotion knowledge (direct assessment)Facial emotions identification (0-1) 0.71 0.74 0.03 ** 0.01 0.13Emotions situations identification (0-1) 0.47 0.49 0.02 * 0.01 0.10
Social problem-solving (direct assessment)Challenging Situations competent 1.46 1.63 0.17 ** 0.08 0.14
response (0-10)Challenging Situations aggressive 0.99 0.81 -0.19 ** 0.08 -0.14
response (0-10)
Social behaviors (teacher report)Social Skills Rating Scale (total score) (0-60) 44.55 47.61 3.05 *** 0.99 0.28Interpersonal skills (1-7) 5.51 5.60 0.09 0.08 0.09
Sample sizec
Centers 26 26Classrooms 77 77Children 621 702
Head Start CARES Demonstration
Table 4.4
Child-Level Impacts on Social-Emotional Skills and Social Behaviors at Preschool Follow-Up: The Incredible Years
SOURCES: MDRC calculations based on the direct assessments and teachers' reports.
NOTES: Statistical significance levels are indicated as follows: *** = 1 percent; ** = 5 percent; * = 10 percent.
Rounding may cause slight discrepancies in sums and differences.aThe rating scale for each outcome measures is shown in parentheses, from low to high.bEffect size is calculated by dividing the impact of the program (the difference between the means
for the program group and the control group) by the standard deviation for the control group. cFor all variables in the table, data are available for at least 94 percent of the sample.

64
Additional analyses (presented in Appendix I) examined whether the Incredible Years enhancement was particularly effective in supporting children’s identification of certain emotions. These analyses show that children in Incredible Years classrooms were less likely to misidentify faces as “mad” when they identified an emotional expression incorrectly during the facial emotions identification tasks. In that same task, children overall appeared to have had particular difficulty identifying “scared” faces. (Children in the control group typically received correct scores of only 1.82 out of a possible score of 4 for “scared” faces, compared with scores of over 3 on the emotions of “happy,” “mad,” and “sad.”) Children in Incredible Years class-rooms were more likely to identify “scared” faces correctly than their peers in control class-rooms (with an effect size of 0.21). They were also less likely to identify the emotion as “mad” incorrectly. Surprisingly, however, this pattern was not found for the emotions situations identification task (in which children are asked to identify the emotion of a protagonist in a story). For that task, children in Incredible Years classrooms were more likely to correctly identify both “happy” and “scared” emotions for the protagonist, but when they got the answer wrong, they were equally as likely as control children to indicate that the emotion was “mad.” In other words, overall, children in Incredible Years classrooms were better able to identify “scared” faces across multiple contexts. However, only in some cases did they learn to avoid misidentifying faces as “mad.” This is important because theory suggests that children who over-identify anger in social situations may become aggressive, but the question remains whether it is sufficient to understand the facial expressions or whether it is equally important to be able to infer emotions from vignettes.13
The impacts of The Incredible Years on children’s responses to peer provocation sce-narios are presented in the second panel of Table 4.4. As with the emotions identification tasks, the impacts of The Incredible Years were favorable: in tasks where children are shown pictures of four peer provocation scenarios and asked what they would do in the situation, children in Incredible Years classrooms reported significantly more competent responses (indicating, for example, that they would go find another toy if someone took theirs), with a small effect size of 0.14. The children in Incredible Years classrooms also indicated statistically significantly fewer aggressive responses (for example, that they would hit another child), with a small effect size of –0.14. Interestingly, in analyses presented in Appendix I, children in Incredible Years class-rooms showed a greater likelihood to seek an adult for help in such peer provocation circum-stances. Given The Incredible Years’ focus on the teacher-child relationship and the teacher’s role in providing support for children’s regulation of emotions and behavior, it is not surprising that children would indicate that they would use the teacher in these challenging peer situations.
13Crick and Dodge (1994).

65
Finally, consistent with these impacts on directly assessed social skills, teachers in In-credible Years classrooms reported higher levels of children’s social skills (with a measure assessing children’s cooperation, assertion, and self-control) than did teachers in control classrooms. The effect size for this impact is more moderate in size — about one-fourth of a standard deviation. There were no statistically significant impacts on children’s interpersonal skills, also as reported by teachers.
Variation in Impacts by Key Child Characteristics: Child Baseline Behavior and Gender Two key subgroups were examined to determine how program impacts on children’s social-emotional development might vary by children’s level of behavior problems upon entering preschool and by child gender.
First, impacts were examined for children with low and high levels of behavior prob-lems, as rated by teachers at the beginning of the Head Start year. The expectation was that children with higher levels of behavior problems might demonstrate the greatest benefits to their social-emotional development in a program like The Incredible Years, which focuses on reducing children’s problem behavior. As shown in Appendix Table J.1, teachers did report fewer behavior problems (in particular, lower levels of externalizing and hyperactivity) among the children in Incredible Years classrooms who had high levels of behavior problems when the Head Start year began. (These impacts were statistically significantly different from those for children who had low levels of behavior problems at the beginning of the Head Start year.) However, there were no statistically significant differences in impacts for children’s emotional and social skills (emotion knowledge and social problem-solving skills).
Second, impacts were examined separately for boys and girls. An initial question was whether impacts might be somewhat stronger for boys than for girls, given The Incredible Years’ focus on reducing problem behaviors and boys’ typically higher rates of such behaviors. As shown in Appendix Table K.1, only a few outcomes had statistically significant differences in impacts for boys than for girls, but the two that were found (for Pencil Tap executive function tasks and for the competent responses in the peer provocation stories) suggest stronger positive impacts of The Incredible Years for boys.
Summary Over the preschool year, The Incredible Years had small, favorable effects on improving teachers’ behavior management strategies and reducing negative classroom climate. While The Incredible Years did not affect what the Head Start CARES team had hypothesized to be the

66
primary targeted outcome for children (reducing children’s behavior problems and improving behavior regulation as assessed through executive function skills), its focus on managing behavior and positive relations did lead to improvement in children’s social-emotional skills and social behaviors (as well as learning behaviors).

67
Chapter 5
Impacts for the Preschool PATHS Enhancement in Head Start CARES Preschool Classrooms
This chapter presents the impacts of the Preschool PATHS (Promoting Alternative Thinking Strategies) enhancement. It begins with a review of the theory of change developed by the Head Start CARES team for this enhancement, including the primary impacts that would be expected on teachers’ practices, classroom climate, and children’s social-emotional competence. This is followed by a brief summary of findings on the impacts of PATHS, including whether the impacts were consistent with expectations based on the team’s theory of change. The remainder of the chapter presents a more detailed discussion of the impacts. All measures presented in this chapter are summarized in Boxes 3.1 through 3.5, in Chapter 3, to allow for easy reference.
Theory of Change and Primary Expected Impacts PATHS builds on research indicating that some children find it difficult to identify both their own and others’ emotions and to develop appropriate solutions to common social problems, such as resolving conflicts with peers.1 These children consistently misinterpret social situations (such as perceiving other children’s motives as hostile rather than benign), and they then may respond aggressively, leading their peers to eventually dislike and reject them.2
To address these concerns, the PATHS enhancement provides teachers with structured lessons to help children develop the social and emotional skills needed to recognize and label emotions in others, express those emotions, and know how to respond to social overtures or rejections. These improved skills are considered to be precursors to improved social behaviors. Unlike The Incredible Years, which tries to change the language that teachers use with children, PATHS uses scripted lessons to change teachers’ direct instruction. PATHS also trains teachers to engage in “emotion labeling” (labeling their own and the children’s feelings) and to encour-age children to use emotion-regulation techniques and social problem-solving skills throughout the Head Start day.
In the Head Start CARES demonstration, the PATHS curriculum included 30 lessons taught once a week during “circle time” (a large-group instruction activity), along with exten-sion activities (or “teachable moments”) for teachers to incorporate at other times during the day so children can practice the targeted cooperation, communication, self-control, and social
1Denham (1997); Raver and Spagnola (2002). 2Dodge and Price (1994); Erdley and Asher (1999).

68
problem-solving skills. Many of the lessons covered the identification of various feelings, while others covered compliments, a self-control strategy, and problem-solving skills.
In sum, based on the training and curricular materials, the Head Start CARES team ex-pected teachers in Preschool PATHS classrooms to display higher levels of social-emotional instruction, including explicit lessons and activities that help children recognize emotions and then respond appropriately. The delivery of lessons targeting children’s social and emotional skills is expected to lead to a more emotionally positive and well-organized classroom. Unlike The Incredible Years, for which the central focus of the enhancement and hence the key primary set of outcomes identified by the Head Start CARES team is children’s problem behaviors, the focus of the PATHS enhancement, as determined by the Head Start CARES team, is on teaching children to understand their and their peers’ emotions and develop social problem-solving skills. Impacts on children’s behavior regulation and executive function skills (ability to shift attention, exercise inhibitory control, and demonstrate working memory) are thought to be secondary to these outcomes for PATHS.
Findings in Brief The impacts of Preschool PATHS were positive and highly consistent with expectations in the areas of teachers’ practices and children’s social-emotional outcomes.
• Trained observers rated PATHS teachers higher than control group teachers on all of the assessed aspects of social-emotional instruction, which were the central focus of PATHS training.
Specifically, teachers in PATHS classrooms were more often observed to teach children about emotions, support children’s expression and regulation of emotions, facilitate children’s understanding of their peers’ emotions and their social problem-solving skills, and support children when they were distressed.
• PATHS classrooms did not show the expected impacts on levels of emo-tional support and classroom organization, but they scored higher than control group classrooms on instructional support.
While training in the PATHS enhancement improved teachers’ practices related to social-emotional instruction, this did not change the overall climate of the classroom in terms of how warm and sensitive it was for children, or how well organized and well managed the classroom was. However, PATHS teachers did demonstrate higher levels of “concept develop-ment” (for example, teachers asking children “Why?” to support their higher-order thinking) and stronger quality of feedback (for example, supporting the quality of learning and not only the correct answer), both key aspects of an effective learning environment for children. These

69
impacts are consistent with the PATHS training, as PATHS encouraged teachers to discuss emotions and social problem-solving approaches when reading PATHS stories to children and throughout the day.
• PATHS had positive impacts on children’s social-emotional skills (their knowledge of emotions and social problem-solving skills) and social be-haviors, which were the central target of the enhancement.
As assessed by trained interviewers, children in PATHS classrooms were better able than their control group counterparts to identify emotional expressions of faces, as well as emotions in pictures and in short scenarios that were read aloud to them. Children in PATHS classrooms were also assessed to be better able to generate competent responses to peer-provocation scenarios. Teachers also reported higher levels of positive social behaviors among children in PATHS classrooms, compared with children in control classrooms. The impacts on these outcomes were small to moderate in size and highly statistically significant. All of these positive impacts suggest potential benefits over the long term for PATHS children, particularly in terms of mitigating aggressive behavior.3
• With one exception, PATHS had no statistically significant impacts on children’s problem behaviors, executive function skills, and learning behaviors, which were not thought to be a central focus of the PATHS enhancement.
Based on teachers’ reports and interviewers’ assessments, the PATHS enhancement had no statistically significant impacts, respectively, on children’s behavior problems and executive function skills. The one exception was a positive impact on teachers’ reports of children’s learning behaviors, suggesting that children in PATHS classrooms were better able to engage in the learning tasks of the Head Start classroom than their counterparts in control classrooms.
Thus, as expected, PATHS teachers delivered more effective instruction in social and emotional skills, and children in PATHS classrooms improved their knowledge of emotions and social problem-solving skills compared with their counterparts in control classrooms. Moreover, these “skill” effects were complemented by teachers’ reports on children’s social behaviors.
The next section of this chapter discusses these findings in greater detail.
3Crick and Dodge (1994).

70
Impacts on Teachers’ Practices and Classroom Climate As with The Incredible Years, the first-order question was whether PATHS had positive impacts on targeted dimensions and subdimensions of lead teachers’ practices (as assessed by trained observers using the Adapted Teaching Style Rating Scale, or Adapted TSRS) and on the more global classroom climate (as assessed by the same observers using the Classroom Assessment Scoring System, or CLASS).
• PATHS had consistent moderate to mostly large effects on teachers’ social-emotional instruction overall and across all subdomains.
As shown in Table 5.1, teachers in PATHS classrooms demonstrated more natural in-teractions to teach children about their emotions (emotion modeling), greater support for children’s expression and regulation of emotions, understanding of peers’ emotions (social awareness), and social problem-solving. PATHS teachers also showed greater support for children during times of distress (provision of interpersonal support). Notably, the levels of teachers’ practices in these areas were relatively low in the control group — 1 to 2 on a 5-point scale — while levels in the PATHS group were closer to the mid-range (approximately 2.5 on the 5-point scale). These levels indicate that teachers moved from never or rarely saying emotion words or supporting peer conflict resolution to sometimes or inconsistently doing so.
These findings stand in contrast to the findings for classroom management practices, which were used more widely in the absence of the enhancement than social-emotional instruc-tion and scaffolding.4 With one exception (positive behavior management), teachers in PATHS classrooms were not statistically significantly different from their control group counterparts on classroom management dimensions of teachers’ practices, which was a key target of The Incredible Years but not of PATHS. Teachers in PATHS classrooms also did not show higher levels of scaffolding of pretend play and peer interactions, which was a key target of Tools of the Mind but not of PATHS.
• PATHS did not improve the expected aspects of classroom climate (emo-tional support, classroom organization). It had a small to moderate im-pact on instructional support, which was not one of its primary targets.
Somewhat surprisingly, PATHS had no overall impacts on emotional support, as de-fined by CLASS. (See Table 5.2.) While the PATHS enhancement improved teachers’ practices related to social-emotional instruction, it did not change the overall climate of the classroom in terms of how warm and sensitive it was for children. Similarly, there were no impacts on the
4Scaffolding is the act of helping a child acquire a skill that is just beyond the child’s current ability level.

71
Control Preschool DifferenceGroup PATHS (PATHS vs. Effect
Outcomea Mean Mean Control) Sizeb
Classroom management (1-5) 3.79 3.90 0.12 0.17Consistency/routine 3.99 4.02 0.02 0.03Preparedness 3.93 3.92 -0.01 -0.02Classroom awareness 3.76 3.76 0.00 0.00Positive behavior management 3.57 3.88 0.31 ** 0.33Negative behavior management 1.47 1.40 -0.07 -0.08Attention/engagement 2.96 3.23 0.27 0.26
Social-emotional instruction (1-5) 1.76 2.42 0.66 *** 0.92Emotion modeling 1.50 2.42 0.92 *** 1.36Emotion expression 1.84 2.64 0.80 *** 0.82Emotion regulation 1.81 2.32 0.51 *** 0.58Social awareness 1.64 2.34 0.70 *** 0.92Social problem-solving 1.62 2.30 0.68 *** 0.82Provision of interpersonal support 2.14 2.52 0.38 ** 0.34
Scaffolding (1-5) 1.44 1.48 0.05 0.09Scaffolding dramatic play 1.47 1.55 0.07 0.12Scaffolding peer interaction 1.40 1.43 0.03 0.06
Sample sizec
Centers 26 26Classrooms 77 77
Head Start CARES Demonstration
Table 5.1
Classroom-Level Impacts on Teachers' Practices Based on Observations of Subdimensions at Preschool Follow-Up: Preschool PATHS
SOURCE: MDRC calculations based on observational assessments completed using the Adapted Teaching Style Rating Scale (Raver et al., 2012).
NOTES: Statistical significance levels are indicated as follows: *** = 1 percent; ** = 5 percent;* = 10 percent.
Rounding may cause slight discrepancies in sums and differences.aThe rating scale for each outcome measure in shown in parentheses, from low to high.bEffect size is calculated by dividing the impact of the program (the difference between the
means for the program group and the control group) by the standard deviation for the control group.cFor all variables in the table, data are available for the full sample.

72
Control Preschool DifferenceGroup PATHS (PATHS vs. Standard Effect
Outcomea Mean Mean Control) Error Sizeb
Emotional support (1-7) 5.35 5.46 0.12 0.14 0.13Positive climate 5.40 5.39 -0.01 0.18 -0.01Negative climate 1.52 1.33 -0.19 0.13 -0.18Teacher sensitivity 4.96 5.15 0.19 0.18 0.17Regard for student perspectives 4.54 4.65 0.12 0.15 0.11
Classroom organization (1-7) 4.90 4.93 0.03 0.15 0.02Behavior management 5.20 5.30 0.10 0.19 0.10Productivity 5.32 5.19 -0.13 0.18 -0.11Instructional learning formats 4.19 4.28 0.09 0.15 0.08
Instructional support (1-7) 2.43 2.67 0.24 ** 0.12 0.27Concept development 1.90 2.17 0.27 ** 0.11 0.33Quality of feedback 2.46 2.75 0.29 ** 0.14 0.29Language modeling 2.92 3.09 0.17 0.16 0.16
Literacy focus (1-7) 1.48 1.50 0.01 0.08 0.02
Sample sizec
Centers 26 26Classrooms 77 77
Head Start CARES Demonstration
Table 5.2
Classroom-Level Impacts on Classroom Climate Based on Observations atPreschool Follow-Up: Preschool PATHS
SOURCE: MDRC calculations based on observational assessments completed using the Classroom Assessment Scoring System (Pianta, La Paro, and Hamre, 2008).
NOTES: Statistical significance levels are indicated as follows: *** = 1 percent; ** = 5 percent; * = 10 percent.
Rounding may cause slight discrepancies in sums and differences.aThe rating scale for each outcome measure is shown in parentheses, from low to high.bEffect size is calculated by dividing the impact of the program (the difference between the
means for the program group and the control group) by the standard deviation for the control group.cFor all variables in the table, data are available for the full sample.

73
CLASS dimension of classroom organization. These findings differ from the positive CLASS impacts on emotional support found in a previous test of PATHS conducted in conjunction with a language intervention (the Head Start REDI intervention).5
At the same time, PATHS classrooms demonstrated statistically significantly higher levels of the CLASS dimension of instructional support relative to control classrooms, with an effect size of 0.27 on the overall dimension. As a benchmark, in the only previous PATHS trial in which CLASS was used to measure outcomes, PATHS showed moderate (0.45 effect size) impacts on instructional support.6 The impact on the overall score for instructional support was driven by improvements on the subdimensions of concept development and quality of feedback but not language modeling (for example, teachers’ use of rich, open-ended dialogue to expand children’s language use). While not necessarily expected a priori, these findings are consistent with the training that PATHS teachers received in supporting children’s learning about emo-tions and social problem-solving strategies by discussing PATHS stories with them.
A key question that arises from these analyses is the extent to which the PATHS im-pacts on teachers’ practices were driven solely by the teachers’ implementation of PATHS lessons, which typically are implemented during circle time. The power of PATHS is also thought to come from teachers’ delivery of related practices during extension activities through-out the school day.
To address this question, the four 20-minute observational segments conducted in each classroom were divided into those with and without circle time. Then, impacts on social-emotional instruction were examined for these two types of observational segments. Notably, impacts on social-emotional instruction were observed in both cases. (See Appendix Table L.1.) This suggests that teachers not only demonstrated higher levels of social-emotional instruction when delivering the PATHS lessons (potentially leading to the large impacts during circle time), but also likely generalized these lessons during extension activities (as social-emotional instruc-tion was higher during non-circle times as well), as outlined by the program goals.
However, a parallel analysis conducted on the CLASS instructional support dimension showed that impacts on instructional support were concentrated during circle-time segments, but not during other times of the school day. (See Appendix Table L.1.) This finding suggests that teachers’ greater support of children’s learning accompanied the delivery of PATHS lessons but did not occur during extension activities.
5Domitrovich et al. (2009). REDI is an acronym for Research-based, Developmentally Informed. 6Domitrovich et al. (2009).

74
Impacts on Children’s Social-Emotional Competence
Impacts on Social-Emotional Skills and Social Behaviors
The Head Start CARES team expected the PATHS enhancement to improve children’s knowledge of emotions and their social problem-solving skills, with benefits, in turn, for children’s social behaviors (their ability to refrain from acting aggressively when approached by a peer, particularly in an ambiguous situation, and to know how to join and engage effectively in a group interaction). PATHS includes explicit lessons on these domains of functioning, with the expectation that improving children’s understanding of emotions and providing them with tools to handle challenging social situations will improve their interactions with their peers.
• PATHS had small to moderate effects on its primary targeted outcomes: children’s identification of emotions, responses to ambiguous peer situa-tions, and social behaviors in the classroom.
As shown in Table 5.3, children in the control group correctly identified about 71 per-cent of the emotions in the facial emotions identification task (when prompted with a picture of a child showing a particular facial expression) and a little less than half (47 percent) in the emotions situations identification task (when presented with a vignette and asked to infer the protagonist’s feelings). The levels for children in PATHS classrooms were higher on both measures, at 77 percent and 52 percent, respectively. Effect sizes on these measures were 0.23 to 0.29, suggesting small to moderate-sized impacts that are highly statistically significant (meaning the confidence level, or p, was lower than 0.01).
As with The Incredible Years, additional analyses were conducted to examine whether children in PATHS classrooms, who were better able than control group children to identify emotional expressions overall, understood certain emotions more than others. These additional analyses showed which emotions PATHS children identified correctly and which they identi-fied incorrectly. Appendix I indicates that, as was the case for The Incredible Years, children in PATHS classrooms were less likely than their control group counterparts to incorrectly identify faces as “mad” (with an effect size of –0.36). In addition, they were less likely to incorrectly identify faces as “scared” and more likely to correctly identify faces as “scared,” “mad,” and “happy” (with effect sizes of 0.45, 0.11, and 0.14, respectively). The central premise of PATHS is that a root cause of aggression in children is the over-identification of anger in ambiguous social situations. Thus, the fact that PATHS children are less likely to incorrectly identify faces as being angry suggests that the enhancement had the intended effects on children’s processing of social information, at least with respect to emotional expressions in pictured faces.
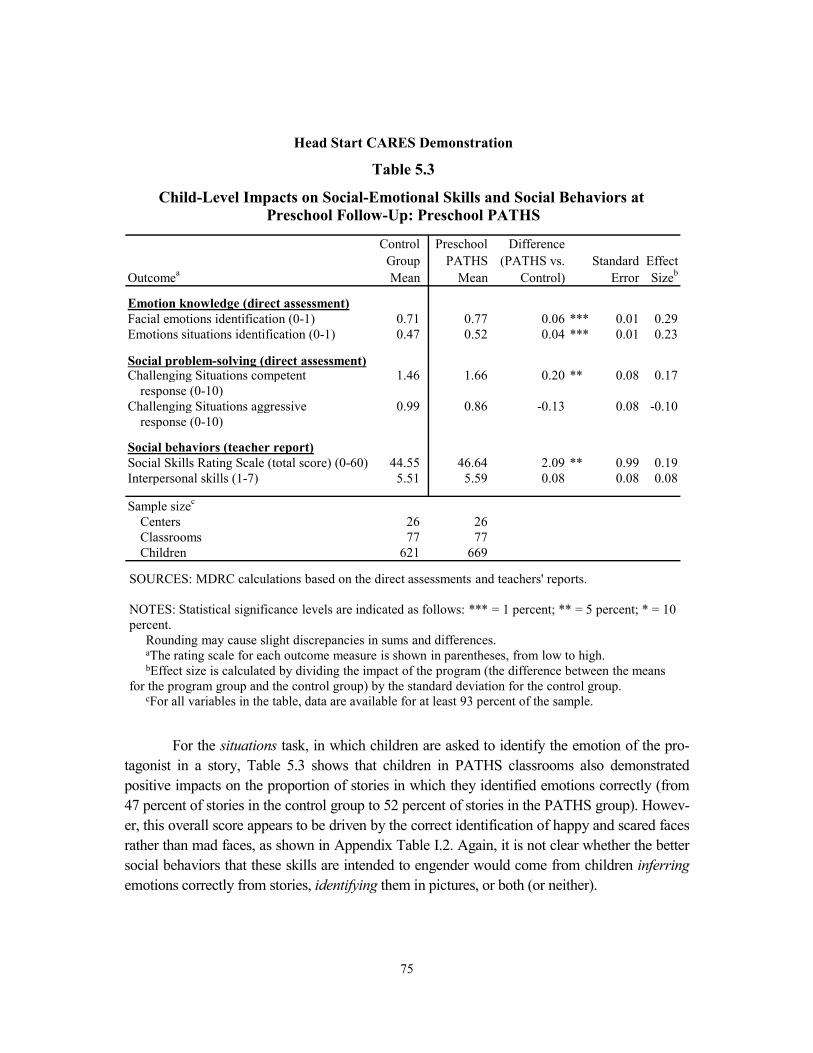
75
For the situations task, in which children are asked to identify the emotion of the pro-
tagonist in a story, Table 5.3 shows that children in PATHS classrooms also demonstrated positive impacts on the proportion of stories in which they identified emotions correctly (from 47 percent of stories in the control group to 52 percent of stories in the PATHS group). Howev-er, this overall score appears to be driven by the correct identification of happy and scared faces rather than mad faces, as shown in Appendix Table I.2. Again, it is not clear whether the better social behaviors that these skills are intended to engender would come from children inferring emotions correctly from stories, identifying them in pictures, or both (or neither).
Control Preschool DifferenceGroup PATHS (PATHS vs. Standard Effect
Outcomea Mean Mean Control) Error Sizeb
Emotion knowledge (direct assessment)Facial emotions identification (0-1) 0.71 0.77 0.06 *** 0.01 0.29Emotions situations identification (0-1) 0.47 0.52 0.04 *** 0.01 0.23
Social problem-solving (direct assessment)Challenging Situations competent 1.46 1.66 0.20 ** 0.08 0.17
response (0-10)Challenging Situations aggressive 0.99 0.86 -0.13 0.08 -0.10
response (0-10)
Social behaviors (teacher report)Social Skills Rating Scale (total score) (0-60) 44.55 46.64 2.09 ** 0.99 0.19Interpersonal skills (1-7) 5.51 5.59 0.08 0.08 0.08
Sample sizec
Centers 26 26Classrooms 77 77Children 621 669
Head Start CARES Demonstration
Table 5.3
Child-Level Impacts on Social-Emotional Skills and Social Behaviors at Preschool Follow-Up: Preschool PATHS
SOURCES: MDRC calculations based on the direct assessments and teachers' reports.
NOTES: Statistical significance levels are indicated as follows: *** = 1 percent; ** = 5 percent; * = 10 percent.
Rounding may cause slight discrepancies in sums and differences.aThe rating scale for each outcome measure is shown in parentheses, from low to high.bEffect size is calculated by dividing the impact of the program (the difference between the means
for the program group and the control group) by the standard deviation for the control group. cFor all variables in the table, data are available for at least 93 percent of the sample.

76
Turning back to Table 5.3, impacts on social problem-solving skills for PATHS were somewhat weaker than those for emotion knowledge, but still positive: as shown in the middle panel of Table 5.3, PATHS produced a positive impact on children’s use of competent respons-es in vignettes that were designed to assess social problem-solving skills, with a statistically significant effect size of 0.17 (indicating that an effect is very unlikely to be the result of chance). The reduction in children’s aggressive responses was just short of statistical signifi-cance, with a p-value equal to 0.10. As shown in Appendix Table I.3, children in PATHS classrooms were not only more likely to provide competent responses to these stories of challenging peer interactions, but they were also more likely than children in the control group to provide information about the emotions that children were feeling.
Previous evaluations of PATHS have consistently found small to moderate effects on emotion knowledge and social behaviors. Effect sizes for emotion knowledge have ranged from 0.21 to 0.36,7 and effect sizes for social behaviors have ranged from 0.22 to 0.48.8 Thus, the effect sizes reported here — 0.23 to 0.29 for emotion knowledge, and 0.08 to 0.19 for social behaviors — are at the lower range of prior studies of PATHS.
Consistent with impacts on the responses to the peer provocation vignettes, there were also small impacts in teachers’ reports of children’s social behaviors (an effect size of 0.19), although there were no impacts on a separate measure of children’s interpersonal skills.
Impacts on Executive Function, Behavior Regulation, and Learning Behaviors
• PATHS did not have impacts on independent assessments of children’s executive function skills or on teachers’ ratings of children’s problem behaviors. However, teachers’ ratings of children’s learning behaviors were higher in PATHS classrooms than in control classrooms.
While PATHS had positive impacts on the primary outcomes it targeted, it did not gen-erally have impacts on the secondary outcomes of executive function and behavior regulation, as shown in Table 5.4. These outcomes were considered secondary because they were not the central focus of the PATHS model as determined by the Head Start CARES team, with any effects likely to occur as a result of the primary outcomes of children’s greater knowledge of emotions, social problem-solving skills, and social behaviors. There were no statistically significant impacts on children’s directly assessed executive function skills or on teachers’ reports of children’s behavior problems. However, PATHS did produce statistically significant
7Domitrovich, Cortes, and Greenberg (2007); Bierman et al. (2008a). 8Domitrovich, Cortes, and Greenberg (2007); Hamre, Pianta, Mashburn, and Downer (2012).

77
positive impacts on teachers’ reports of children’s learning behaviors, with the PATHS group rated an average of 5.29 out of a possible 7 compared with the control group level of 5.08, for a small to moderate effect size of 0.20. Prior evaluations of the effect of PATHS on these behav-ior regulation and executive function outcomes have been inconsistent, with some studies showing positive effects and others showing no statistically significant findings.9
9Bierman et al. (2008b); Bierman et al. (2010).
Control Preschool DifferenceGroup PATHS (PATHS vs. Standard Effect
Outcomea Mean Mean Control) Error Sizeb
Executive function (direct assessment)Head-to-Toes (0-10) 4.08 3.84 -0.24 0.24 -0.06Pencil Tap (0-1) 0.67 0.69 0.02 0.02 0.07
Behavior problems (teacher report)Total score (0-52) 5.99 5.64 -0.35 0.71 -0.04
Externalizing (0-22) 3.02 2.66 -0.35 0.33 -0.08Hyperactivity (0-10) 1.63 1.47 -0.16 0.18 -0.07Internalizing (0-20) 1.36 1.57 0.22 0.26 0.09
Learning behaviors (teacher report)Work-related skills (1-7) 5.08 5.29 0.21 ** 0.08 0.20
Sample sizec
Centers 26 26Classrooms 77 77Children 621 669
Head Start CARES Demonstration
Table 5.4
Child-Level Impacts on Executive Function, Behavior Regulation, and Learning Behaviors at Preschool Follow-Up: Preschool PATHS
SOURCES: MDRC calculations based on the direct assessments and teachers' reports.
NOTES: Statistical significance levels are indicated as follows: *** = 1 percent; ** = 5 percent; * = 10 percent.
Rounding may cause slight discrepancies in sums and differences.aThe rating scale for each outcome measure is shown in parentheses, from low to high.bEffect size is calculated by dividing the impact of the program (the difference between the means
for the program group and the control group) by the standard deviation for the control group. cFor all variables in the table, data are available for at least 97 percent of the sample.

78
Variation in Impact by Key Child Characteristics: Child Baseline Behavior and Gender Like The Incredible Years, two key subgroups — children’s level of behavior problems and gender — were examined to learn about the extent to which the impacts of PATHS on chil-dren’s social and emotional development differed across these subgroups of children.
First, impacts were examined for children with low and high levels of behavior prob-lems at the beginning of the Head Start year, as reported by teachers. As shown in Appendix Table J.2, there were no statistically significant differences in impacts for these two groups of children, and the pattern of impacts is very similar across the two groups.
Second, with regard to gender differences, the question was whether PATHS had larger impacts for boys or for girls. On the one hand, girls might be more open to the lessons of PATHS that rely on girls’ greater language skills;10 on the other hand, boys’ lower levels of emotion knowledge might make them benefit more from explicit teaching of these skills.11 As shown in the far-right column of Appendix Table K.2, there were no statistically significant differences in the size of positive impacts for boys and girls in their understanding of emotions or in their social problem-solving skills (although impacts were slightly stronger for boys than for girls for competent and aggressive responses to peer provocation stories).
Summary Consistent with the theory of change developed by the Head Start CARES team, Preschool PATHS had moderate to large effects on teachers’ social-emotional instruction during the preschool year. PATHS also had moderate effects on the instructional climate of the classroom. The impacts of PATHS on children were highly aligned with the hypothesized primary targeted child outcomes: children in PATHS classrooms demonstrated better knowledge of emotions, more competent responses to challenging social situations, and better social behavior in the classroom (as well as stronger learning behaviors). PATHS did not demonstrate impacts on children’s problem behaviors or on executive function skills, which were not thought to be direct targets of this enhancement.
10Hyde and Linn (1988). 11Izard et al. (2001).
79
Chapter 6
Impacts for the Tools of the Mind—Play Enhancement in Head Start CARES Preschool Classrooms
This chapter presents the impacts of the Tools of the Mind—Play (Tools) enhancement,1 as implemented in the Head Start CARES demonstration. It begins with a review of the theory of change that the Head Start CARES team developed for Tools, including the primary impacts that would be expected on teachers’ practices, classroom climate, and children’s social-emotional competence. This is followed by a brief summary of findings on the impacts of Tools, including whether the impacts were consistent with expectations. The remainder of the chapter presents a more detailed discussion of the impacts. All measures presented in this chapter are summarized in Boxes 3.1 through 3.5, in Chapter 3, to allow for easy reference.
Theory of Change and Primary Expected Impacts As determined by the Head Start CARES team review, Tools of the Mind—Play focuses on developing self-regulation through “pretend” or “make-believe” play, in which children use their imaginations to role-play, pretend they are different characters, play out different stories, and enact various scenarios that rely on and encourage creativity. It is normally a two-year program but was condensed into a one-year enhancement for the Head Start CARES demon-stration. The hypothesized targeted outcomes for Tools overlap with those of social-emotional learning programs such as The Incredible Years and Preschool PATHS, including cooperative play skills, self-regulation, and social problem-solving skills. However, Tools places much greater emphasis on fostering executive function skills and related learning behaviors (that is, children’s engagement in the learning tasks of school).
Executive function in early childhood includes set-shifting (the ability to shift flexibly between different pieces of information), inhibitory control (the ability to stop or repress an immediate response in favor of a planned response), and working (short-term) memory. Children with higher levels of executive function skills have been found to be less aggressive than their peers,2 and are at significantly lower risk for later adjustment problems.3
1Diamond, Barnett, Thomas, and Munro (2007); Leong, Bodrova, Wilder-Smith, and Hensen (2009-
2011). In Tools of the Mind–Play, teachers were trained for only one year in the model (instead of two years, as is typical in the Tools of the Mind program) and it was implemented as an enhancement to the existing curricula in the program sites.
2Blair, Granger, and Razza (2005). 3Olson et al. (2005); Raver (2002).

80
Rather than providing explicit lessons on these skills, Tools changes the way that make-believe play and other learning experiences are structured and supported in the classroom. A central component of Tools is a daily 50-minute time block devoted to interactive pretend play, which is organized and scaffolded by teachers in very specific ways.4 The teachers help children build self-regulation skills (including mental flexibility, deliberate memory, focused attention, and inhibitory skills) by creating a plan, staying with a role for an extended period of time, shifting between their own perspectives and the perspectives of the characters they are pretend-ing to be, and cooperating with peers during play times. Children’s planning of their activities, retaining these plans in memory, and enacting them during the pretend play sequence block all support key aspects of executive function.
In addition, the Tools enhancement includes self-regulation games, restructures “circle time” (a large-group learning activity), and incorporates the emphasis on planning and organiza-tion into literacy, math, and science activities throughout the preschool day. In this way, Tools seeks to influence the quality of teachers’ instruction and to promote children’s active, self-directed learning from peers. By restructuring a number of activities in preschool classrooms, Tools reduces the need for teachers to focus on behavior management during “whole-class” instruction by reducing the amount of whole-class instruction and increasing the amount of structured peer-to-peer interaction (for example, peers sharing one-on-one after being instructed to do so by a teacher). However, the comprehensiveness of Tools and the amount of restructur-ing needed to implement it can make Tools difficult to deliver with fidelity to the program as it was designed, even in this modified form for the Head Start CARES study as a one-year enhancement focused on play. In Head Start CARES, the implementation of Tools was satisfac-tory (rated slightly below 3 on a scale from 1 to 5). The quality of Tools implementation was, however, lower (2.97) than the quality of implementation in The Incredible Years (3.69) and Preschool PATHS (3.73). Given the same support and resources, teachers implementing Tools of the Mind—Play were slightly less able to provide all the critical components of the enhance-ment than were the teachers who implemented The Incredible Years and Preschool PATHS.
In sum, the primary changes in teachers’ practices as a result of this modified version of the original Tools of the Mind program are expected to be higher levels of scaffolding of children’s pretend play and peer interactions. The Head Start CARES team expected Tools classrooms to be better managed than control classrooms, not because of teachers’ better behavior management skills per se (as in The Incredible Years), but because of the restructuring of circle time and other activities to reduce whole-group instruction and because of children’s better regulatory skills. The primary expected impacts on children were in their executive function skills, while children’s understanding of emotions and social problem-solving skills
4Scaffolding is when a teacher helps a child to achieve a challenging task or skill that is just beyond the child’s current ability level.

81
(which were the primary focus of the Preschool PATHS enhancement) were presumed to be secondary in the case of Tools of the Mind—Play.
Findings in Brief Tools of the Mind, like The Incredible Years and Preschool PATHS, demonstrated impacts as expected (based on the theory of change that the CARES team developed) on teachers’ practic-es in preschool. Also, like The Incredible Years and PATHs, the changes in Tools teachers’ practices did not, for the most part, lead to changes in the classroom climate. With regard to outcomes for children, while Tools produced some small positive impacts on children’s social and emotional competence, these impacts were only for a limited number of outcomes and not on those that were expected from the CARES team’s theory.
• Tools teachers engaged in more scaffolding of children’s pretend play and peer interactions than control group teachers did.
Consistent with its central focus, Tools had moderate impacts of about two-thirds of a standard deviation on teachers’ scaffolding of pretend play and peer interactions. As expected, there were no impacts on teachers’ classroom management practices or their social-emotional instruction, key aspects of the Incredible Years and PATHS enhancements but not of Tools.
• Tools classrooms did not demonstrate better quality in terms of their classroom organization, emotional support, or instructional support, although they did score higher than control classrooms in literacy instruction.
These findings suggest that while Tools changed teachers’ practices in the expected ways, this did not change the climate of the classroom in terms of how warm and sensitive it was (emotional support), how organized it was (classroom organization), or how effectively teachers delivered instruction (instructional support). The increase in literacy instruction for Tools was not expected a priori, but likely reflects the use of literacy activities as part of the Tools implementation.
• Children in Tools classrooms did not demonstrate better behavior regu-lation or executive function skills than children in the control group, nor did they demonstrate better learning behaviors.
These findings, based on both teachers’ ratings and trained observers’ direct assess-ments of tasks, were not expected given the central focus of the Tools enhancement (modified for the Head Start CARES demonstration) on children’s self-regulatory skills and related behaviors.

82
• Children in Tools classrooms demonstrated greater knowledge of emo-tions than children in control classrooms, but not greater social problem-solving skills.
Although they did not receive explicit lessons to support their understanding of emo-tions, children in Tools classrooms were better able than their control group counterparts to identify emotions correctly when presented with facial expressions in a picture and when asked to identify the emotion of the protagonist in a vignette. The children in Tools classrooms did not, however, generate more competent social problem-solving solutions, nor did teachers rate these children higher in social behaviors than their control group counterparts. This finding suggests that the small positive impacts on knowledge of emotions may not have translated into teachers’ observation that Tools children are more socially competent than children in control classrooms.
Impacts on Teachers’ Practices and Classroom Climate As with The Incredible Years and PATHS, the impact of Tools on specific lead teachers’ practices was rated by observers using the Adapted Teaching Style Rating Scale (Adapted TSRS). The Tools enhancement focused mainly on supporting teachers’ scaffolding of pretend play and related peer interactions. The findings are presented in Table 6.1.
• Tools had a positive impact on teachers’ support and extension of chil-dren’s pretend play and peer interactions.
As shown in the bottom panel of the table, scores for control group teachers were lower in the scaffolding dimension (for the dimension as a whole and for each subdimension) than for any other dimension or subdimension in the table (less than 1.5 on a scale of 1 to 5). Teachers in Tools classrooms scored statistically significantly higher than their control group counterparts in this dimension, with moderate effect sizes of about two-thirds of a standard deviation. In a previous small-scale Tools trial in which teachers were given two years to learn the curriculum, even larger effect sizes of about 2 standard deviations were found on teachers’ scaffolding practices and on the classroom environment.5
As expected, no statistically significant impacts were observed on classroom manage-ment or social-emotional instruction, teacher practices that were central foci of The Incredible Years and PATHS, respectively, but not of Tools.
5Barnett et al. (2008).

83
Control Tools of DifferenceGroup the Mind (Tools vs. Effect
Outcomea Mean Mean Control) Sizeb
Classroom management (1-5) 3.79 3.89 0.10 0.15Consistency/routine 3.99 3.99 0.00 0.00Preparedness 3.93 4.08 0.15 0.17Classroom awareness 3.76 3.75 -0.01 -0.01Positive behavior management 3.57 3.71 0.14 0.15Negative behavior management 1.47 1.38 -0.09 -0.10Attention/engagement 2.96 3.18 0.22 0.21
Social-emotional instruction (1-5) 1.76 1.78 0.02 0.02Emotion modeling 1.50 1.48 -0.02 -0.02Emotion expression 1.84 1.74 -0.10 -0.10Emotion regulation 1.81 2.02 0.21 0.23Social awareness 1.64 1.64 0.00 0.00Social problem-solving 1.62 1.63 0.01 0.01Provision of interpersonal support 2.14 2.16 0.02 0.02
Scaffolding (1-5) 1.44 1.78 0.35 *** 0.68Scaffolding dramatic play 1.47 1.86 0.39 *** 0.66Scaffolding peer interaction 1.40 1.70 0.30 *** 0.57
Sample sizec
Centers 26 26Classrooms 77 76
Head Start CARES Demonstration
Table 6.1
Classroom-Level Impacts on Teachers' Practices Based on Observations ofSubdimensions at Preschool Follow-Up: Tools of the Mind
SOURCE: MDRC calculations based on observational assessments completed using the Adapted Teaching Style Rating Scale (Raver et al., 2012).
NOTES: Statistical significance levels are indicated as follows: *** = 1 percent; ** = 5 percent; * = 10 percent.
Rounding may cause slight discrepancies in sums and differences.aThe rating scale for each outcome measure is shown in parentheses, from low to high.bEffect size is calculated by dividing the impact of the program (the difference between
the means for the program group and the control group) by the standard deviation for the control group.
cFor all variables in the table, data are available for the full sample.

84
The observers also scored classrooms using the Classroom Assessment Scoring System (CLASS) measure to assess the climate of the Head Start classrooms.
• Tools did not improve the classroom climate (emotional support, class-room organization, and instructional support) of the preschool class-room. It did, however, have a moderate positive impact on teachers’ use of literacy strategies in the classroom. This is consistent with the imple-mentation of Tools’ many supplementary activities, some of which are literacy activities.
These findings, shown in Table 6.2, indicate that while the Tools enhancement changed the practices in which teachers were trained, that did not result in changes to the overall climate of the classroom in terms of how warm and sensitive it was, how organized it was, or how effectively teachers delivered instruction.6
There is, however, one important exception to this relative lack of impacts on classroom climate: there was a highly statistically significant positive impact on literacy focus for Tools classrooms compared with controls. This impact was, at half a standard deviation, moderate in size, with control group classrooms scoring about 1.5 on a scale of 1 to 7, and Tools classrooms scoring about 1.7. This finding is not surprising, since some components of Tools specifically involve literacy activities (such as make-believe play planning, in which the teacher helps children write down their play plan; buddy reading, in which children take turns reading aloud with a friend; and graphics practice, in which children practice writing on white boards).
Impacts on Children’s Social-Emotional Competence
Impacts on Executive Function, Behavior Regulation, and Learning Behaviors
The central intended outcome of Tools is improvement in children’s executive function and self-regulation skills. The improvement in these skills that was found in an earlier trial was a principal reason for including the Tools enhancement in the Head Start CARES demonstra-tion. This previous finding in a small randomized trial of the original two-year Tools program
6At the outset, it was expected that Tools, as a somewhat more complicated program than The Incredible
Years and PATHS, might be implemented most effectively on top of a foundation of strong classroom management. Although there was limited statistical power to test this hypothesis, exploratory analyses suggest that Tools’ impacts on teachers’ practices and on classroom climate did not differ depending on teachers’ baseline levels of classroom management skills (data not shown).

85
Control Tools of DifferenceGroup the Mind (Tools vs. Standard Effect
Outcomea Mean Mean Control) Error Sizeb
Emotional support (1-7) 5.35 5.43 0.08 0.14 0.09Positive climate 5.40 5.46 0.06 0.18 0.05Negative climate 1.52 1.39 -0.13 0.13 -0.12Teacher sensitivity 4.96 5.04 0.09 0.18 0.07Regard for student perspectives 4.54 4.60 0.06 0.15 0.06
Classroom organization (1-7) 4.90 5.04 0.14 0.15 0.14Behavior management 5.20 5.29 0.09 0.19 0.09Productivity 5.32 5.43 0.11 0.18 0.10Instructional learning formats 4.19 4.41 0.22 0.15 0.20
Instructional support (1-7) 2.43 2.53 0.10 0.12 0.12Concept development 1.90 1.98 0.08 0.11 0.10Quality of feedback 2.46 2.66 0.20 0.14 0.20Language modeling 2.92 2.95 0.02 0.17 0.02
Literacy focus (1-7) 1.48 1.73 0.25 *** 0.08 0.50
Sample sizec
Centers 26 26Classrooms 77 76
Head Start CARES Demonstration
Table 6.2
Classroom-Level Impacts on Classroom Climate Based on Observations atPreschool Follow-Up: Tools of the Mind
SOURCE: MDRC calculations based on observational assessments completed using the Classroom Assessment Scoring System (Pianta, La Paro, and Hamre, 2008).
NOTES: Statistical significance levels are indicated as follows: *** = 1 percent; ** = 5 percent; * = 10 percent.
Rounding may cause slight discrepancies in sums and differences.aThe rating scale for each outcome measure is shown in parentheses, from low to high.bEffect size is calculated by dividing the impact of the program (the difference between
the means for the program group and the control group) by the standard deviation for the control group.
cFor all variables in the table, data are available for the full sample.

86
found significant effects on children’s executive function skills.7 However, more recent studies that were completed after the Head Start CARES study began have not shown positive impacts of the original two-year Tools program on children’s executive function skills.8
• The Tools enhancement did not have an impact on children’s executive function skills, problem behaviors, or learning behaviors.
As shown in Table 6.3, children in Tools classrooms did not perform better on tasks of executive function skills, and teachers did not rate children in Tools classrooms lower on behavior problems or higher on learning behaviors than children in the control group.
Impacts on Social-Emotional Skills and Social Behaviors
• The Tools enhancement had small, positive impacts on children’s ability to identify emotions correctly.
In tasks involving facial emotions identification (identification of emotions on faces) and emotions situations identification (identifying the emotion of the protagonist in a story), Tools produced small but statistically significant positive impacts. Children in Tools classrooms showed a gain of around 3 percentage points relative to control group children in correctly identifying emotions on faces, and a gain of around 2 percentage points in the number of emotions they identified when asked to identify the emotions of a protagonist in a story (for effect sizes of about 0.12 to 0.13).
There were, however, no statistically significant impacts on children’s social problem-solving skills or on teachers’ reports of children’s social behaviors.
Further analysis of children’s emotion knowledge skills, shown in Appendix Table I.1, shows statistically significant reductions in children incorrectly identifying faces as “mad” (with a small effect size of ‒0.16). This is consistent with the findings for The Incredible Years and PATHS, both of which also saw similar reductions in incorrectly identifying “mad” faces. As discussed earlier, previous research suggests that misattribution of anger is a particularly strong factor in children’s later aggressive behavior. As with the other enhancements, children strug-gled the most in identifying “scared” faces overall, but those in Tools classrooms (similar to children in Incredible Years and PATHS classrooms) correctly identified this emotion more often than their control group peers did (with an effect size of 0.21). By contrast, for the
7Diamond, Barnett, Thomas, and Munro (2007). 8Clements, Sarama, Unlu, and Layzer (2012); Farran, Lipsey, and Wilson (2012); Lonigan and Phillips
(2012).

87
situations tasks, there were statistically significant impacts on children’s correct identification of both “happy” and “mad” emotions, but not “scared” or “sad” ones.
Interestingly, in the category of social problem-solving tasks, Tools had no statistically significant impacts on the number of competent and aggressive responses to peer-provocation stories (as discussed above and shown in Table 6.4).
Control Tools of DifferenceGroup the Mind (Tools vs. Standard Effect
Outcomea Mean Mean Control) Error Sizeb
Executive function (direct assessment)Head-to-Toes (0-10) 4.08 4.03 -0.04 0.24 -0.01Pencil Tap (0-1) 0.67 0.66 0.00 0.02 0.00
Behavior problems (teacher report)Total score (0-52) 5.99 6.17 0.18 0.71 0.02
Externalizing (0-22) 3.02 3.00 -0.02 0.33 0.00Hyperactivity (0-10) 1.63 1.69 0.06 0.18 0.03Internalizing (0-20) 1.36 1.49 0.13 0.27 0.06
Learning behaviors (teacher report)Work-related skills (1-7) 5.08 5.15 0.07 0.08 0.06
Sample sizec
Centers 26 26Classrooms 77 76Children 621 678
Head Start CARES Demonstration
Table 6.3
Child-Level Impacts on Executive Function, Behavior Regulation, and Learning Behaviors at Preschool Follow-Up: Tools of the Mind
SOURCES: MDRC calculations based on the direct assessments and teachers' reports.
NOTES: Statistical significance levels are indicated as follows: *** = 1 percent; ** = 5 percent; * = 10 percent.
Rounding may cause slight discrepancies in sums and differences.aThe rating scale for each outcome measure is shown in parentheses, from low to high.bEffect size is calculated by dividing the impact of the program (the difference between the means
for the program group and the control group) by the standard deviation for the control group. cFor all variables in the table, data are available for at least 98 percent of the sample.

88
Variation in Impact by Key Child Characteristics: Child Baseline Behavior and Gender As was done for The Incredible Years and for Preschool PATHS, analyses were conducted to determine whether there were statistically significant differences in impacts across key sub-groups — baseline levels of children’s behavior problems as rated by teachers in the fall of the Head Start year and child gender. For Tools of the Mind—Play, the expectation was that impacts might be somewhat larger for children with low levels of behavior problems and for
Control Tools of DifferenceGroup the Mind (Tools vs. Standard Effect
Outcomea Mean Mean Control) Error Sizeb
Emotion knowledge (direct assessment)Facial emotions identification (0-1) 0.71 0.73 0.03 ** 0.01 0.12Emotions situations identification (0-1) 0.47 0.50 0.02 ** 0.01 0.13
Social problem-solving (direct assessment)Challenging Situations competent 1.46 1.50 0.04 0.08 0.04
response (0-10)Challenging Situations aggressive 0.99 0.97 -0.02 0.08 -0.02
response (0-10)
Social behaviors (teacher report)Social Skills Rating Scale (total score) (0-60) 44.55 45.29 0.74 0.99 0.07Interpersonal skills (1-7) 5.51 5.55 0.04 0.08 0.04
Sample sizec
Centers 26 26Classrooms 77 76Children 621 678
Head Start CARES Demonstration
Table 6.4
Child-Level Impacts on Social-Emotional Skills and Social Behaviors at Preschool Follow-Up: Tools of the Mind
SOURCES: MDRC calculations based on the direct assessments and teachers' reports.
NOTES: Statistical significance levels are indicated as follows: *** = 1 percent; ** = 5 percent; * = 10 percent.
Rounding may cause slight discrepancies in sums and differences.aThe rating scale for each outcome measure is shown in parentheses, from low to high.bEffect size is calculated by dividing the impact of the program (the difference between the means
for the program group and the control group) by the standard deviation for the control group. cFor all variables in the table, data are available for at least 94 percent of the sample.

89
girls, since both may be better able to engage in the complex play planning and pretend play that is a central focus of the Tools enhancement. Because such children may be better able to engage in the Tools activities, it was thought they would then benefit more from them. The findings are presented in Appendixes J and K.
As shown in Appendix Table J.3, there were no statistically significant differences in impacts for children who had a low versus a high initial level of behavior problems. As shown in Appendix Table K.3, the only outcome for which the impacts of Tools were statistically significantly different across child gender (children’s social problem-solving) actually shows stronger positive impacts for boys. By contrast, the positive impacts on children’s ability to identify emotions, which were observed for the full sample, were found for both boys and girls.
Summary Tools of the Mind—Play, which had been modified for the Head Start CARES demonstration to a one-year program focused on play, had moderate impacts on teachers’ support and exten-sion of pretend play. These impacts did not lead to changes in the general classroom climate, except in teachers’ use of literacy instruction. Changes in teachers’ practices and classroom climate did not ultimately lead to the expected changes in children’s executive function skills or to changes in their behavior regulation. Tools did have a small effect on children’s ability to identify emotions (which was not targeted directly), but these positive impacts were not accom-panied by improvements in social problem-solving skills or social behaviors.

THIS PAGE INTENTIONALLY LEFT BLANK

91
Chapter 7
Impacts on Pre-Academic Skills in Preschool
This chapter presents the findings from analyses of possible impacts on outcomes beyond those that were directly targeted by the three preschool social-emotional enhancements in Head Start CARES ― The Incredible Years, Preschool PATHS, and Tools of the Mind—Play. These exploratory analyses yield no consistent evidence that any of the enhancements led to improved pre-academic skills in the Head Start year.1
Theory of Change and Expected Impacts on Pre-Academic Skills in Preschool The central target of all three Head Start CARES enhancements was children’s social-emotional competence. As such, the Head Start CARES demonstration focused primarily on whether the enhancements did in fact produce impacts on social-emotional skills and behaviors in preschool.
On the one hand, the emphasis on social-emotional development might make it difficult for teachers to focus on supporting children’s pre-academic skills. However, it is also possible that supporting children’s social-emotional skills and behaviors, with related benefits to chil-dren’s learning behaviors, could translate into improved pre-academic outcomes in preschool.2 The research to date on whether social-emotional interventions influence pre-academic skills has produced mixed results: some research has shown benefits of preschool social-emotional interventions for children’s pre-academic skills,3 while other studies have found no statistically significant effects.4 Notably, none shows negative effects on pre-academic skills. For children from kindergarten through high school, a meta-analysis of social and emotional learning programs found modest but positive effects of such programs on academic outcomes across a range of studies.5 In the Head Start CARES demonstration, possible effects on pre-academic outcomes were considered exploratory because none of the enhancements focused directly on improving them.
1Pre-academic skills are the cognitive skills that underlie learning in elementary school. For example, in
preschool, children learn to identify letters and the sounds that letters make, to provide a foundation for reading in kindergarten.
2Raver (2002). 3Raver et al. (2011). 4Morris et al. (2013). 5Durlak et al. (2011).

92
Impacts of the Three Head Start CARES Enhancements on Pre-Academic Skills in Preschool
The Incredible Years
• The Incredible Years did not produce statistically significant improve-ments in children’s pre-academic skills in the spring of the preschool year, as measured by standardized cognitive assessments.
As shown in the top panel of Table 7.1, direct assessments of children’s pre-reading skills (“Letter-Word Identification”), pre-math skills (“Applied Problems”), and expressive language (that is, their understanding of words, or “One-Word Picture”) showed no evidence of program impacts. However, as shown in the second panel of the table, teachers did report improvements in children’s pre-academic skills across all three subscales (general knowledge, language and literacy, and math), with an average moderate effect size of approximately 0.30 of a standard deviation. While interesting, these findings should be interpreted cautiously, given the lack of convergence in findings between the standardized assessments and teachers’ reports. As discussed in Chapter 3, the direct assessments were scored by highly trained assessors who were not involved in the delivery of the enhancements.
Preschool Paths
• Preschool PATHS did not produce statistically significant improvements in children’s pre-academic skills as assessed by either the standardized assessments or as reported by teachers.
For PATHS, as shown in Table 7.2, these findings indicate that the focus on social-emotional instruction and related impacts on social-emotional skills did not translate into better pre-academic skills; however, the findings also show that providing lessons on these topics during instructional opportunities such as “circle time” (when the whole group participates in lessons or activities together) did not reduce academic instruction enough to diminish children’s emerging pre-academic skills.
Tools of the Mind
• Tools of the Mind generally did not produce statistically significant im-provements in children’s pre-academic skills, as reflected in standard-ized cognitive assessments as well as in teachers’ reports.
Statistically significant impacts were generally not observed using standardized assess-ments of children’s pre-reading, pre-math, and vocabulary skills (as shown in Table 7.3).

93
Control The Incredible DifferenceGroup Years (IY) (IY vs. Standard Effect
Outcomea Mean Mean Control) Error Sizeb
Pre-academic skills (direct assessment)Woodcock-Johnson - Letter-Word Identification (mean = 332)c 333.95 333.22 -0.72 1.75 -0.03Woodcock-Johnson - Applied Problems (mean = 399)d 414.38 414.79 0.42 1.63 0.01Expressive One-Word Picture Vocabulary Test (50-150) 85.81 84.96 -0.85 0.87 -0.06
Pre-academic skills (teacher report)General knowledge (1-5) 3.46 3.75 0.29 ** 0.13 0.29Language and literacy (1-5) 3.17 3.44 0.27 ** 0.10 0.27Mathematical thinking (1-5) 3.16 3.49 0.32 ** 0.14 0.32
Sample sizee
Centers 26 26Classrooms 77 77Children 621 702
Head Start CARES Demonstration
Table 7.1
Child-Level Impacts on Early Verbal, Literacy, and Math Skills at Preschool Follow-Up: The Incredible Years
SOURCES: MDRC calculations based on the direct assessments and teachers' reports.
NOTES: Statistical significance levels are indicated as follows: *** = 1 percent; ** = 5 percent; * = 10 percent.Rounding may cause slight discrepancies in sums and differences.aThe rating scale for each outcome measure except for the Woodcock-Johnson is shown in parentheses, from low to high.bEffect size is calculated by dividing the impact of the program (the difference between the means for the program group and the
control group) by the standard deviation for the control group. cThe mean indicated is the national average for 4-year-olds on the Letter-Word Identification subtest of the Woodcock-Johnson III.dThe mean indicated is the national average for 4-year-olds on the Applied Problems subtest of the Woodcock-Johnson III.eFor all variables in the table, data are available for at least 97 percent of the sample.

94
Control Preschool DifferenceGroup PATHS (PATHS vs. Standard Effect
Outcomea Mean Mean Control) Error Sizeb
Pre-academic skills (direct assessment)Woodcock-Johnson - Letter-Word Identification (mean = 332)c 333.95 333.74 -0.20 1.76 -0.01Woodcock-Johnson - Applied Problems (mean = 399)d 414.38 416.54 2.16 1.65 0.07Expressive One-Word Picture Vocabulary Test (50-150) 85.81 84.88 -0.93 0.87 -0.06
Pre-academic skills (teacher report)General knowledge (1-5) 3.46 3.56 0.11 0.13 0.11Language and literacy (1-5) 3.17 3.34 0.17 0.10 0.17Mathematical thinking (1-5) 3.16 3.30 0.14 0.14 0.14
Sample sizee
Centers 26 26Classrooms 77 77Children 621 669
Head Start CARES Demonstration
Table 7.2
Child-Level Impacts on Early Verbal, Literacy, and Math Skills at Preschool Follow-Up: Preschool PATHS
SOURCES: MDRC calculations based on the direct assessments and teachers' reports.
NOTES: Statistical significance levels are indicated as follows: *** = 1 percent; ** = 5 percent; * = 10 percent.Rounding may cause slight discrepancies in sums and differences.aThe rating scale for each outcome measure except for the Woodcock-Johnson is shown in parentheses, from low to high.bEffect size is calculated by dividing the impact of the program (the difference between the means for the program group and the control
group) by the standard deviation for the control group. cThe mean indicated is the national average for 4-year-olds on the Letter-Word Identification subtest of the Woodcock-Johnson III.dThe mean indicated is the national average for 4-year-olds on the Applied Problems subtest of the Woodcock-Johnson III.eFor all variables in the table, data are available for at least 96 percent of the sample.

95
Control Tools of DifferenceGroup the Mind (Tools vs. Standard Effect
Outcomea Mean Mean Control) Error Sizeb
Pre-academic skills (direct assessment)Woodcock-Johnson - Letter-Word Identification (mean = 332)c 333.95 333.36 -0.59 1.76 -0.02Woodcock-Johnson - Applied Problems (mean = 399)d 414.38 417.17 2.79 * 1.64 0.09Expressive One-Word Picture Vocabulary Test (50-150) 85.81 85.36 -0.45 0.87 -0.03
Pre-academic skills (teacher report)General knowledge (1-5) 3.46 3.42 -0.03 0.13 -0.03Language and literacy (1-5) 3.17 3.25 0.08 0.10 0.08Mathematical thinking (1-5) 3.16 3.16 -0.01 0.14 -0.01
Sample sizee
Centers 26 26Classrooms 77 76Children 621 678
Head Start CARES Demonstration
Table 7.3
Child-Level Impacts on Early Verbal, Literacy, and Math Skills at Preschool Follow-Up: Tools of the Mind
SOURCES: MDRC calculations based on the direct assessments and teachers' reports.
NOTES: Statistical significance levels are indicated as follows: *** = 1 percent; ** = 5 percent; * = 10 percent.Rounding may cause slight discrepancies in sums and differences.aThe rating scale for each outcome measure except for the Woodock-Johnson is shown in parentheses, from low to high.bEffect size is calculated by dividing the impact of the program (the difference between the means for the program group and the
control group) by the standard deviation for the control group. cThe mean indicated is the national average for 4-year-olds on the Letter-Word Identification subtest of the Woodcock-Johnson III.dThe mean indicated is the national average for 4-year-olds on the Applied Problems subtest of the Woodcock-Johnson III.eFor all variables in the table, data are available for at least 96 percent of the sample.

96
Similarly, teachers did not report higher levels of pre-academic skills for children in Tools classrooms, compared with children in control classrooms. The one exception was a small (effect size of 0.09) but statistically significant impact on children’s scores on the math-related portion of the cognitive assessment (the Applied Problems subscale of the Woodcock-Johnson). This impact may reflect Tools’ incorporation of literacy and math activities into the daily lessons as a means to improve children’s self-regulation skills.

97
Chapter 8
Impacts on Children’s Outcomes in Kindergarten
This chapter explores whether the impacts of each Head Start CARES enhancement ― The Incredible Years, Preschool PATHS, and Tools of the Mind—Play ― on children’s social-emotional competence in preschool were sustained one year later, when the children had entered new schools and classrooms for kindergarten. The analysis also explores whether the social-emotional gains in preschool might lead to children’s gains in other outcomes (such as achievement) in the early elementary grades.
There was little evidence that any of the three enhancements had sustained impacts into kindergarten, based on the limited information collected. Two exceptions worth noting are that The Incredible Years led to a small reduction in kindergarteners’ externalizing problems (that is, acting out or aggressive behavior), and PATHS led to a reduction in kindergarten teachers’ expectation that children would be retained for a second year in kindergarten. While these findings are promising, they need to be confirmed with high-quality, longer-term outcome data (for example, from standardized assessments or school records).
Many studies of preschool have shown a pattern in which early academic impacts from preschool interventions fade out during the elementary school years; in some cases when long-term follow-up is available, however, impacts emerge in adulthood on outcomes such as school completion, adult earnings, and criminality, suggesting that sustained effects likely did occur on some outcomes that were not assessed.1 With regard to social-emotional programs in particular, prior studies have shown mixed effects on longer-term impacts. For example, positive impacts on literacy and social-emotional outcomes in kindergarten were found in the Head Start REDI trial,2 which tested Preschool PATHS with a literacy curriculum;3 sustained impacts were found, but only for a subgroup of children, in the Chicago School Readiness Project (CSRP),4 which combined The Incredible Years with strong clinical coaching;5 and no long-term impacts were found using teacher-reported measures in Foundations of Learning, which tested the same intervention as CSRP in a larger sample.6
1Campbell et al. (2002); Schweinhart, Barnes, and Weikart (1993); Yoshikawa (1995). 2REDI is an acronym for Research-based, Developmentally Informed. 3Bierman et al. (2013). 4CSRP is not associated with The Chicago School®, which is a trademark of The Chicago School of Pro-
fessional Psychology. 5Zhai, Raver, and Jones (2012). 6Morris et al. (2013).

98
The findings on sustained impacts into kindergarten are mixed for a number of reasons. First, the extent to which impacts are sustained into kindergarten could depend on the quality of the schools that students enter after they leave Head Start. If students make a transition to large classrooms with high student-teacher ratios and greater expectations of independence, or to schools that do not reinforce the social and emotional skills taught in preschool, early gains may be lost (similar to the fade-out seen in some early interventions such as Perry Preschool or Abecedarian).7 In contrast, if children move to small, well-equipped classrooms with a strong social-emotional focus, their preschool experiences may be reinforced and retained.
Another important factor may be the way in which children disperse from preschool to kindergarten. If children move into a large number of schools serving a diverse student popula-tion with few peers from their preschool intervention in their kindergarten classes, it may be harder to maintain impacts. Previous research on classroom composition suggests that the level of skills that children encounter among their peers in a new classroom can affect their future skills.8 If children move into classrooms with peers who lack strong social and emotional skills, they may find it harder to maintain their own social-emotional skills. However, if the children stay together and move to classrooms where all the children have roughly the same level of social-emotional skills, impacts may be more detectable. Notably, as discussed in Chapter 3, children in Head Start CARES dispersed to a large number of schools in kindergarten, with children moving to six schools for every one Head Start center. On average, only two children from Head Start CARES were together in kindergarten classrooms. This dispersion is much greater than in prior preschool studies and might result in a diffusion of impacts over time, if peers are a source of support for children’s gains in social-emotional skills.
Finally, measures may differ in their potential to detect longer-term impacts. Teacher- and parent-reported measures may be more prone to measurement error than direct assessments of children’s skills or direct observations of children’s behavior. If previous studies used teacher- and parent-reported outcomes in kindergarten instead of direct assessment, any long-term impacts may have been harder to detect because of measurement error.
The kindergarten analysis in this report is therefore considered exploratory for two reasons: (1) previous studies have not generated clear findings about whether to expect longer-term impacts of social and emotional programs; and (2) the kindergarten follow-up was con-strained to a smaller and much less comprehensive set of measures than was used during the Head Start year.
7Campbell et al. (2002); Schweinhart, Barnes, and Weikart (1993). 8Justice, Petscher, Schatschneider, and Mashburn (2011).

99
Impacts on Children’s Behavior in Kindergarten Prior research suggests that the benefits observed for children’s knowledge of emotions and social problem-solving skills in PATHS and The Incredible Years might lead to better peer interactions, including reduced aggression, during middle childhood.9 This is because deficits in children’s ability to process information about emotions (identifying emotional expres-sions) and to select from a repertoire of responses when faced with a provocative situation are thought to be the roots of aggression later in childhood, as children misinterpret ambiguous social cues as hostile.10
• There were almost no statistically significant impacts on kindergarten children’s behavior problems, their learning behaviors, or their social behaviors for any of the three enhancements.
Teachers rated children on the extent to which they demonstrated problem behaviors, including both externalizing problems (acting out or aggressive behavior) and internalizing problems (depression and withdrawn behavior). As shown in Table 8.1, teachers reported that children in the control group scored an 8 out of a maximum of 52 on this measure (relatively low levels of problem behaviors). Children who had been in Incredible Years, PATHS, or Tools classrooms in preschool did not generally demonstrate higher or lower scores than their control group peers on this measure. (The one notable exception is that, consistent with its theory of change, Incredible Years children were reported to have fewer externalizing behavior problems than their counterparts in the control group.) The findings from parent reports were similar, with an average problem-behavior score of 9 out of 56 for children in the control group and no statistically significant impacts for children in any of the Head Start CARES enhancement groups. Finally, teachers reported on the extent to which children were engaged in the learning tasks of school (learning behaviors). Children in the control group averaged 5 on a scale of 1 to 7, and none of the enhancements had a statistically significant impact on this measure of self-regulation during the kindergarten year.
Teachers also reported on children’s social behaviors. The reported average for control group children’s social behaviors (43 on a scale from 0 to 60) was consistent with parents’ reports of these behaviors (31 on a scale of 0 to 40).
Impacts were also examined for children who entered preschool with lower and higher levels of behavior problems, for boys and girls, and for children who attended schools that
9Dodge and Price (1994); Dodge, Pettit, Bates, and Valente (1995); Orobio de Castro, Bosch, Veerman,
and Koops (2003). 10Dodge and Price (1994); Dodge, Pettit, Bates, and Valente (1995); Orobio de Castro, Bosch, Veerman,
and Koops (2003).

100
Control Program Difference Program Difference Program DifferenceGroup Group (IY vs. Effect Group (PATHS vs. Effect Group (Tools vs. Effect
Outcomea Mean Mean Control) Sizeb Mean Control) Sizeb Mean Control) Sizeb
Behavior regulationBehavior problemsTotal score(teacher report) (0-52) 8.03 6.96 -1.07 -0.12 7.34 -0.69 -0.07 8.08 0.05 0.01
Externalizing (0-22) 3.67 3.01 -0.65 * -0.13 3.20 -0.47 -0.09 3.63 -0.03 -0.01Hyperactivity (0-10) 2.43 2.36 -0.07 -0.03 2.28 -0.15 -0.06 2.56 0.12 0.05Internalizing (0-20) 1.91 1.59 -0.32 -0.11 1.86 -0.05 -0.02 1.88 -0.02 -0.01
Total score (parent report) (0-56) 8.55 8.98 0.43 0.05 8.50 -0.05 -0.01 8.70 0.15 0.02
Learning behaviors(teacher report)Work-related skills (1-7) 4.83 4.83 0.00 0.00 4.90 0.07 0.06 4.84 0.02 0.01
Social behaviorsSocial Skills Rating Scale
(teacher report) (0-60) 43.06 43.00 -0.06 -0.01 42.97 -0.10 -0.01 43.23 0.16 0.01Social Skills Rating Scale
(parent report) (0-40) 31.28 31.59 0.31 0.05 30.81 -0.47 -0.08 31.32 0.04 0.01
Sample sizec
Teachers 319 349 313 348Children 604 683 656 656
(continued)
Head Start CARES Demonstration
Child-Level Impacts at Kindergarten Follow-Up: Behavior and Social Skills
Table 8.1
The Incredible Years (IY) Preschool PATHS Tools of the Mind

Table 8.1 (continued)SOURCES: MDRC calculations based on the teachers' reports and parents' reports.NOTES: Statistical significance levels are indicated as follows: *** = 1 percent; ** = 5 percent; * = 10 percent.
Rounding may cause slight discrepancies in sums and differences.aThe rating scale for each outcome measure is shown in parentheses, from low to high.bEffect size is calculated by dividing the impact of the program (the difference between the means for the program group and the control
group) by the standard deviation for the control group.cFor all teacher-reported variables in the table, data are available for at least 90 percent of the sample. For all parent-reported variables in the
table, data are available for 85 percent of the sample.
101
102
teachers reported were more supportive and parents reported were safer. These findings are presented in Appendixes N, O, and P.
• There were limited differences in impacts across subgroups of children (as defined by gender, baseline behavior problems, or characteristics of the children’s kindergarten schools) in the kindergarten year.
If there is any pattern to the effects across schools, they weakly suggest greater effects in lower-quality schools (as measured by teachers’ and parents’ reports of school safety and student support). The authors of an evaluation of the Head Start REDI program found a similar pattern and posited that this might reflect resilience among program children in lower-quality schools.11 Future research is needed to explore the reliability of this finding across samples and studies, as well as the mediating mechanisms involved.
Impacts on Children’s Academic Skills in Kindergarten Another exploratory question for the Head Start CARES study was whether improvements in children’s preschool social-emotional skills could lead to better academic gains in kindergarten. As described earlier, however, improvements in children’s behavior regulation and pre-academic skills, the most likely determinants of any gains in kindergarten, were not observed for any of the three enhancements, although both The Incredible Years and PATHS did demon-strate gains in teachers’ reports of children’s learning behaviors, which can contribute to children’s academic outcomes.
• None of the three enhancements had statistically significant impacts on measures of children’s academic skills in kindergarten.12
Kindergarten teachers were asked to rate children’s academic skills overall and in two core subjects (language/literacy and math). As shown in Table 8.2, teachers of control group children gave a relatively high average rating of about 4 on a scale of 1 to 5. And, like the findings for social-emotional outcomes in kindergarten, there were few differences by baseline levels of behavior problems, gender, or school environment.
11Bierman et al. (2013). 12Kindergarten teachers also rated children relative to their peers in language and literacy, math, and sci-
ence and social studies. Those “relative” measures similarly did not show statistically significant impacts, except for a small positive impact on science and social studies skills for Incredible Years students. This could have been a result of chance, given the general lack of statistically significant findings and the lack of a theoretical basis for The Incredible Years to affect this particular outcome.
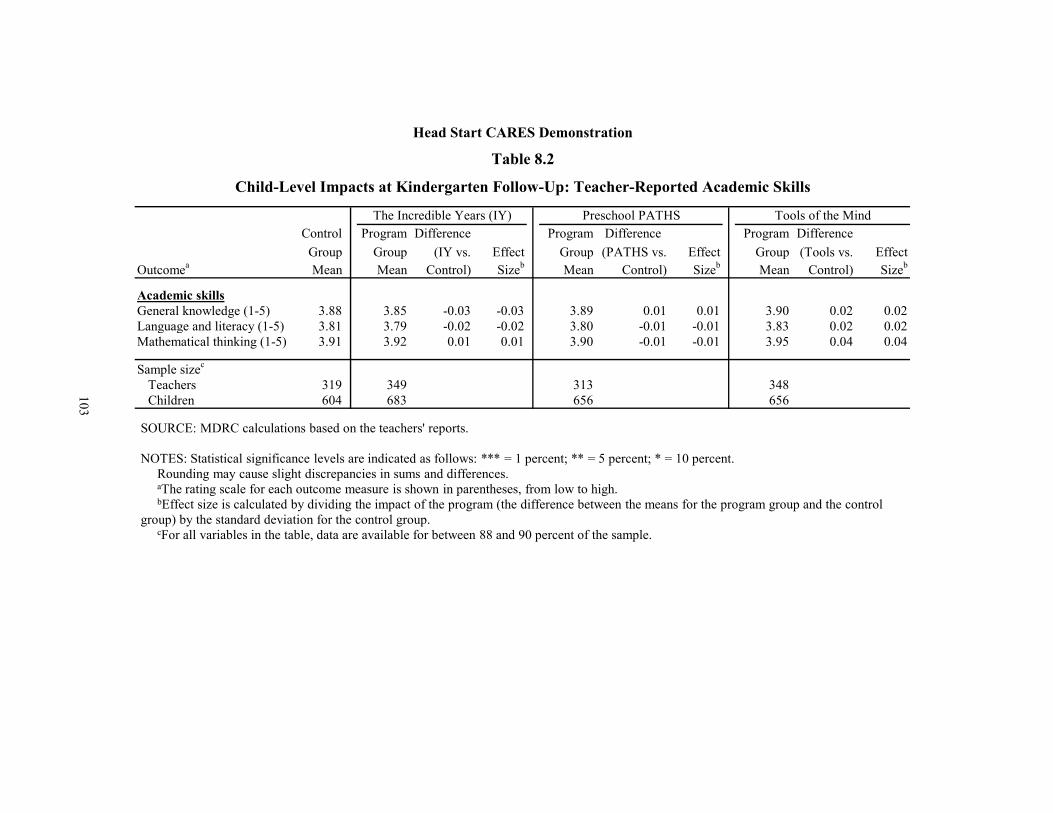
Control Program Difference Program Difference Program DifferenceGroup Group (IY vs. Effect Group (PATHS vs. Effect Group (Tools vs. Effect
Outcomea Mean Mean Control) Sizeb Mean Control) Sizeb Mean Control) Sizeb
Academic skillsGeneral knowledge (1-5) 3.88 3.85 -0.03 -0.03 3.89 0.01 0.01 3.90 0.02 0.02Language and literacy (1-5) 3.81 3.79 -0.02 -0.02 3.80 -0.01 -0.01 3.83 0.02 0.02Mathematical thinking (1-5) 3.91 3.92 0.01 0.01 3.90 -0.01 -0.01 3.95 0.04 0.04
Sample sizec
Teachers 319 349 313 348Children 604 683 656 656
Head Start CARES Demonstration
Child-Level Impacts at Kindergarten Follow-Up: Teacher-Reported Academic Skills
Table 8.2
The Incredible Years (IY) Preschool PATHS Tools of the Mind
SOURCE: MDRC calculations based on the teachers' reports.
NOTES: Statistical significance levels are indicated as follows: *** = 1 percent; ** = 5 percent; * = 10 percent.Rounding may cause slight discrepancies in sums and differences.aThe rating scale for each outcome measure is shown in parentheses, from low to high.bEffect size is calculated by dividing the impact of the program (the difference between the means for the program group and the control
group) by the standard deviation for the control group. cFor all variables in the table, data are available for between 88 and 90 percent of the sample.
103

104
Impacts on Grade Retention and Special Education Data were collected on kindergarten teachers’ expectations of children’s on-time promotion to first grade; children’s receipt of special education services (reported by parents); and children’s receipt of other special services, including mental health consultation, physical therapy, occupa-tional therapy, and speech or language therapy. These outcomes were considered to be especial-ly exploratory because the already low rates of occurrence made it unlikely that the enhance-ments would further reduce rates on these outcomes, so there was little expectation of program impact. The findings are shown in Table 8.3.
• PATHS substantially reduced (from 7 percent to less than 1 percent) teachers’ expectations that children would be retained in kindergarten.
This reduction in expectation of grade retention is somewhat unexpected given that, overall, no statistically significant impacts on children’s problem behaviors were observed. However, it is possible that PATHS benefited children who had especially high rates of prob-lem behaviors. In fact, further analyses showed a pattern of results that is consistent with these effects: reductions in teacher-reported behavior problems and improvements in teacher-reported social behaviors in kindergarten were somewhat larger (although not statistically significant, given limited statistical power) for children who had the very highest baseline levels of behavior problems (results not shown).
• The Incredible Years increased the likelihood of receiving special educa-tion services in kindergarten from 6 percent to 11 percent.13
This impact on special education is plausible, since The Incredible Years may have made teachers more likely to identify serious behavior problems and therefore refer children to special services when they entered kindergarten. While evaluations in elementary school often examine impacts on the use of special education because of its cost implications for the school system, increases in the use of these services in kindergarten might bode well if it meant that children’s problems were being identified early.
• Tools had no statistically significant impacts on grade retention or special education services.
Rates of grade retention and special education in kindergarten were not different between children who had experienced Tools as preschoolers and children who had not.
13Data are based on parents’ response to the question, “Does [CHILD] receive special education
services?”

105
Control The Incredible Difference Preschool Difference Tools of DifferenceGroup Years (IY) (IY vs. Effect PATHS (PATHS vs. Effect the Mind (Tools vs. Effect
Outcomea Mean Mean Control) Sizeb Mean Control) Sizeb Mean Control) Sizeb
Teacher reportExpectation of child
retention (0-1) 0.07 0.04 -0.03 -0.11 0.00 -0.07 *** -0.24 0.04 -0.03 -0.11Child receipt of special
services (0-1) 0.13 0.15 0.02 0.06 0.13 0.00 -0.01 0.10 -0.03 -0.08
Parent reportChild receipt of special
education services (0-1) 0.06 0.11 0.05 ** 0.19 0.06 0.00 0.01 0.07 0.01 0.06
Sample sizec
Teachers 319 349 313 348Children 604 683 656 656
Head Start CARES Demonstration
Table 8.3
Child-Level Impacts at Kindergarten Follow-Up: Grade Retention and Special Education Services
SOURCES: MDRC calculations based on the teachers' reports and parents' reports.
NOTES: Statistical significance levels are indicated as follows: *** = 1 percent; ** = 5 percent; * = 10 percent.Rounding may cause slight discrepancies in sums and differences.aThe rating cale for each outcome measure is shown in parentheses, from low to high.bEffect size is calculated by dividing the impact of the program (the difference between the means for the program group and the control
group) by the standard deviation for the control group. cFor all variables in the table, data are available for at least 84 percent of the sample.

THIS PAGE INTENTIONALLY LEFT BLANK
107
Chapter 9
Synthesis and Conclusion
The Head Start CARES demonstration tested the large-scale implementation, in Head Start centers across the country, of three program “enhancements” (so called because they were developed to enhance existing Head Start practices and curricula) that were designed to improve children’s social-emotional development. The enhancements had impacts on teachers’ practices that were consistent with the theory of change that the Head Start CARES team developed, and two of the three enhancements demonstrated consistent improvements in children’s social and emotional development.
To provide a context for understanding the impacts, this chapter begins with a discus-sion of how the unique elements of the study position it to make an especially important contribution not only to Head Start policy but also to the field of early intervention and child development more generally. This is followed by a review and synthesis of the major impact findings. The chapter concludes with a discussion of the relevance of these findings for the field and the implications of these findings for policy and practice.
Unique Contributions of Head Start CARES A number of features of the Head Start CARES study make its findings especially important for policymakers, practitioners, and researchers. These include:
1. Evidence-based approaches with distinct theories of change. Most important, Head Start CARES simultaneously tested the effects of three different approaches, or program “enhancements” ― The Incredible Years Teacher Training Program, Pre-school PATHS, and Tools of the Mind—Play ― for improving children’s social-emotional development. The Head Start CARES team hypothesized that each en-hancement reflected a conceptually distinct theory of change regarding the root causes of challenges in social-emotional development and the key skills that should therefore be targeted to overcome those challenges. As such, the study provides an opportunity not only to understand whether a particular enhancement “worked,” but also to understand potential alternative pathways to improving children’s social-emotional development. This design also provides the opportunity to identify some of the essential ingredients of any strategy for improving children’s social-emotional development. Such ingredients might emphasize teachers’ relationships with the children, the way teachers manage their classes, lessons about the emo-

108
tional skills that underlie children’s social-emotional competence, or approaches to support positive interactions between children in pretend play.
2. Implementation at scale and in a range of Head Start settings. A large number of centers were included in the study, requiring a professional development system that was very different from what was used in small-scale, university-led tests of these same programs. A persistent challenge of implementing evidence-based pro-grams on a larger scale is maintaining adequate fidelity to the original model and generating program impacts; thus, success in building a professional development model provides very important information to the field. In addition, although the centers in the Head Start CARES study were not a statistically representative sam-ple of the Head Start system, the grantees were located in a number of different areas of the country, in both urban and rural contexts, under the auspices of community-based providers and school districts. The grantees served white non-Hispanic, Hispanic, and African-American children. Therefore, the findings may generalize to a diverse group of centers and families.
3. Random assignment either to a program group that received one of the enhance-ments or to a control condition. A rigorous random assignment design was used to assess the impact of the three approaches, compared with a “business as usual” con-trol condition, on teachers, classrooms, and children. This study design provides the strongest basis for assessing the incremental impact that each enhancement pro-duced on top of the services that Head Start is already providing.
4. Testing these approaches within the same grantee. Because the three enhancements were tested within the same Head Start grantees, the baseline characteristics of chil-dren, teachers, and centers were the same for all four research groups (that is, the three program groups and the control group). Thus, differences in the impacts of each of the enhancements can be attributed to the enhancements themselves, rather than to differences in the research samples, as typically happens when comparing diverse approaches implemented in different sites or in separate studies.
5. A strong, diverse set of outcomes collected. The combination of data collected by trained observers and assessors, as well as from teachers, provided information about a strong and diverse set of potential impacts. The Head Start CARES study examined a wider range of outcomes than has been previously tested for the three enhancements.
These features mean that the Head Start CARES study provides some of the first exper-imental evidence regarding (1) whether preschool social-emotional interventions can be implemented in a range of regular Head Start settings and improve children’s social-emotional
109
development; (2) the domains of social-emotional development (such as social problem-solving skills or executive function skills) that each approach most improves; and (3) the extent to which changes in teachers’ practices that differed across the approaches led to differing effects on aspects of children’s social-emotional development. As such, this study provides critical information for policy and practice, and it represents a leap forward in understanding the pathways by which children’s social and learning behaviors evolve.
In this study, the social-emotional enhancements were implemented at scale with the support of a strong, comprehensive professional development model. The improvements in teachers’ practices and children’s skills emerged because well-designed, “manualized” (that is, with prepared manuals and other materials to support consistent implementation), evidence-based models were supported by high-quality and ongoing training and coaching of teachers and a real-time management information system (MIS). This comprehensive infrastructure allowed teachers to learn the enhancement content in training, return to the classroom, practice using program strategies with continuous feedback from their coaches, and return to training to reflect on their implementation. In addition, coaches and trainers continuously reported on implementation through an MIS, allowing for technical assistance to be provided in order to address challenges with implementation as they were occurring in real time. With training and coaching delivered as intended, teachers implemented the enhancements as intended in the classrooms.
Particularly in such a wide-scale national context, having a comprehensive professional development and technical assistance model developed and in place was essential to ensuring that the enhancements were delivered as intended, and the findings described below should be considered impacts of the joint curriculum and professional development model. This constella-tion of supports, along with a well-manualized enhancement that includes prepared teaching materials, led to improvements in teachers’ practices and in some social-emotional outcomes that were not substantially smaller than those from previous, smaller-scale efforts.
In order to learn the most from the simultaneous testing of three models with distinct theories, each enhancement was evaluated primarily in relation to the theory of change that the Head Start CARES team developed for it. And, not all outcomes were considered to be equally strong for assessing impact: data collected from trained observers and assessors were given priority over outcome information collected from teachers, since the observers and assessors were not provided with information about the intervention status of the children and were trained to assess children relative to a common protocol and a common standard.

110
Synthesis of Major Findings The impacts of the three Head Start CARES enhancements are summarized in Table 9.1. For each enhancement, an X indicates statistically significant impacts in the areas of teacher practice, classroom climate, children’s social-emotional skills (executive function, behavior regulation, emotion knowledge, and social problem-solving skills), and children’s learning and social behaviors. Dark gray areas of the table show primary, targeted outcomes; lighter grey areas show secondary outcomes. This presentation helps in understanding the findings for each enhancement relative to its respective theory of change as developed by the Head Start CARES team, and comparing and contrasting the pattern of findings across enhancements.
• All three enhancements affected teachers’ practices in the ways that were expected, providing a strong basis for understanding the poten-tial of different approaches to improving children’s social-emotional development.
The Incredible Years targeted teachers’ positive behavioral strategies; Preschool PATHS relied on emotions-based curricula; and Tools of the Mind—Play attempted to strengthen scaffolded pretend play.1 These improvements in teachers’ practices emerged in the context of a comprehensive package of professional development services that included training, coaching, ongoing monitoring, and real-time technical assistance. Given the success of the study’s professional development in improving teaching behaviors as intended for each enhancement, Head Start CARES provides an especially strong basis for evaluating the impacts of the three distinct approaches. That is, the models were not only differentiated in theory; they were also differentiated in practice.
• Two of the three enhancements had consistent positive impacts on chil-dren’s social-emotional outcomes.
The positive impacts emerged across diverse and widely dispersed Head Start centers, suggesting that, when implemented satisfactorily, different approaches can be used to improve children’s social-emotional development (a central focus of Head Start programs nationally). Notably, these effects were observed over and above the Head Start services that children were already receiving. As such, the findings indicate that it is possible to improve children’s social-emotional development through evidence-based, well-implemented approaches on top of Head Start’s historical commitment to these outcomes.
• Changes in classroom climate were not observed as frequently as either impacts on teachers’ practices or outcomes for children.
1Scaffolding involves helping children to achieve a skill that is just beyond their current level of ability.

111
The Incredible Preschool Tools of theYears PATHS Mind-Play
Outcome
Trains teachers to create an organized classroom climate that supports children’s behavior regulation in the context of positive teacher-child relationships
Trains teachers to use clearly outlined lessons to improve children’s ability to recognize and regulate emotions, define problems, and consider the consequences of various choices
Trains teachers to use adult-supported make-believe play and other activities to strengthen children’s self-regulation
Classroom management XSocial-emotional instruction X XScaffolding X
Classroom organizationEmotional supportInstructional support XLiteracy X
Executive functionBehavior problems
Emotion knowledge X X XSocial problem-solving skills X X
Learning behaviors X XSocial behaviors X X
Learning and social behaviors (teacher reports)
Head Start CARES Demonstration
Table 9.1
Primary and Secondary Targeted Outcomes in Preschool,
Classroom climate (observational assessment)
Teacher practice (observational assessment)
Executive function and behavior regulationa
Emotion knowledge and social problem-solving skills (direct assessments)
by Enhancement
NOTES: In each cell, “X” indicates that there was a statistically significant impact on that outcome. The dark gray cells represent primary targeted outcomes for the enhancement; the light gray cells represent secondary targeted outcomes.
aExecutive function was measured using direct assessments. Behavior problems were measured using teacher reports.
112
Impacts were observed on teachers’ practices and, at least for two of the enhance-ments, on children’s social-emotional skills and behavior. However, the enhancements had relatively few impacts on measures of classroom climate, and not on the expected dimensions. One interpretation of these findings is that improvements in children’s social-emotional out-comes may have resulted directly from changes in specific teaching practices, rather than as mediated through changes in the overall classroom climate that children experienced.
• PATHS produced the most consistent positive impacts with regard to the theory of change that the Head Start CARES team had developed, with especially consistent impacts on children’s skills.
PATHS had positive and statistically significant impacts on its primary targeted out-comes in preschool: knowledge of emotions, social problem-solving skills, and related social behavior. These impacts show that PATHS children were better able to gain critical social-emotional skills, including the ability to process information about emotions (identifying emotions both from faces and from stories) and to select from a repertoire of responses when faced with a provocative situation. The impacts were small to moderate in size. While most of the impacts were on skills, there was some evidence that PATHS also improved children’s behavior, as teachers rated PATHS children higher on levels of social behavior. Prior research has shown that deficits in these skills are the roots of aggression in later childhood, since children misinterpret ambiguous social cues as hostile.2 The findings therefore may bode well for curbing children’s aggression and improving interactions with their peers as they age.
• The Incredible Years produced positive impacts on knowledge of emo-tions and social problem-solving skills but not on the behavior regula-tion and executive function skills that it targeted directly.
Contrary to expectations, children in Incredible Years classrooms did not demonstrate fewer problem behaviors in preschool (except, notably, for the children who had the highest levels of behavior problems at baseline, a population that is a key focus of this enhancement). However, The Incredible Years did produce a consistent pattern of positive impacts on emotion knowledge and social problem-solving skills, as well as on related teacher reports of social behaviors. The findings therefore suggest that The Incredible Years benefited children’s social-emotional development; however, since emotion knowledge and social problem-solving skills have not been examined in previous studies of The Incredible Years, it may be beneficial to replicate these results in future studies.
2Crick and Dodge (1994).

113
• Tools of the Mind—Play did not affect the outcomes it targeted directly, and it had few impacts on other aspects of children’s social-emotional development in preschool.
Despite improvements in teacher’s scaffolding of children’s play, children in Tools classrooms did not demonstrate better behavior regulation or executive function skills. And, while Tools did produce changes to children’s understanding of emotions, impacts were not observed on the full complement of social-emotional skills and social behaviors. The limited findings for Tools may have been a result of reducing the program to a single-year enhancement focused on play from its typical two-year model, as well as the complexity of this program, which made it challenging for teachers to implement.
• There appears to be more than one way for preschool teachers to change their practices to improve children’s social-emotional skills.
The findings from Preschool PATHS and The Incredible Years suggest that children’s emotion knowledge and social problem-solving skills can improve either by using clearly outlined lessons to teach these skills (as in PATHS) or by training teachers to use more positive classroom management practices and modeling of emotions (as in The Incredible Years).
Results of Analyses on Pre-Academic Skills and Longer-Term Outcomes in Kindergarten
In addition to its primary focus, the Head Start CARES study included exploratory analyses of (1) the possibility that improved social-emotional outcomes would lead to stronger pre-academic skills (that is, the cognitive skills that underlie future learning); and (2) longer-term effects of the enhancements as children made the transition into kindergarten. Exploratory conclusions on these questions are summarized below.
• None of the three enhancements showed evidence of improvements in children’s pre-academic skills.
Some researchers and practitioners have suggested that investing in children’s social-emotional development may improve their pre-academic skills, as children who are better able to regulate their behavior and emotions may be better able to focus on the learning tasks of schooling. However, the improvements in children’s social-emotional outcomes that were found in this study did not appear to lead to improvements in their pre-academic skills. This may be because the benefits of these enhancements, when found, were concentrated in the emotional and social skills that underlie social behaviors, as opposed to behavior problems and executive function skills that may more strongly underlie their learning behaviors.

114
• None of the three enhancements led to consistent observed impacts on children’s outcomes in kindergarten, although strong conclusions about these findings are hampered by substantially weaker measurement than in preschool.
There are two potential explanations for the general absence of observed impacts on kindergarten outcomes: (1) program impacts in preschool were not sustained into kindergarten, perhaps because children were widely dispersed across kindergarten contexts; or (2) in the absence of information about impacts on direct assessments, more limited measurement of outcomes for children during the kindergarten year may have made it difficult to detect program impacts that did exist. One potentially important exception to the general lack of impacts is PATHS’ teachers’ reduced expectations (by 7 percentage points) that children would be retained in kindergarten. This intriguing finding could be important for children’s longer-term outcomes, but it requires replication and further follow-up because of the limited measurement of child outcomes in kindergarten and the general lack of impacts across outcomes that were collected.
Implications and Conclusions As the first large-scale test of three social-emotional enhancements in Head Start programs nationally, this study provides critical information to the field about how interventions seeking to support children’s social-emotional development can focus their training of teachers. The findings suggest the following.
Perhaps most important, it is possible for scaled-up, evidence-based models to produce impacts on some social-emotional outcomes for preschool children that are nearly as large as those from smaller-scale, more controlled studies (which are typically in the moderate range). This was only possible, however, because well-designed, manualized, evidence-based models were supported by high-quality training and coaching of teachers and a real-time management information system. This constellation of supports led to improvements in teachers’ practices and children’s social-emotional outcomes that were not substantially smaller than those from the less dispersed, more controlled efforts that had come previously.
More than one evidence-based social-emotional approach may be effective in meeting Head Start’s goal of improving children’s social-emotional development. That is, improving children’s understanding of emotions and their social problem-solving skills, and associated social behaviors, may be accomplished by supporting teachers’ positive classroom management practices (as was done in The Incredible Years) or their explicit teaching of emotion knowledge and social skills through a more lessons-based approach (as was done in PATHS). The result is

115
that Head Start programs may have some options in selecting models that best meet the needs of their teachers and centers, with likely benefits for the children they serve.
For Head Start and other preschool programs that want to invest in improving chil-dren’s social-emotional development, implementing PATHS or The Incredible Years is likely to help them meet this goal. These enhancements demonstrated small to moderate but consistent improvements in children’s social-emotional development during the preschool year. These effect sizes are in line with the size of impacts in studies of similar programs, such as Founda-tions of Learning, the Chicago School Readiness Project (CSRP),3 and Head Start REDI,4 although Head Start CARES did not find the same effects on pre-academic skills or executive function that some of these studies did.5 Given Head Start’s long-standing commitment to, and substantial investments in, children’s social-emotional development, these findings suggest ways to spend those resources effectively.
While it is clearly possible to improve children’s social-emotional skills and social be-haviors, it may be more challenging to improve their behavior regulation and related executive function skills. None of the models that was implemented in Head Start CARES, even those that explicitly targeted children’s behavior regulation and executive function skills (that is, The Incredible Years and Tools of the Mind—Play), improved these outcomes for children. Meas-urement of these outcomes is still in its infancy, and while measurement of self-regulation is advancing, the measures are still being developed and streamlined, and few, if any, have national norms or have been widely tested. It is still possible that what seems to be a lack of impacts could also be a lack of precision in measuring those outcomes, although experts in this field do recommend the measures that were used here. With these measurement caveats in mind, these three programs generally did not show improvements in children’s behavior regulation and executive function skills, even though they were the field’s “best bets” in terms of the prior evidence in improving children’s social-emotional development in preschool classrooms. If, as has been suggested,6 children’s academic achievement over the long term is related in part to their “grit” and persistence (which are likely to be influenced by children’s underlying behavior regulation and executive function skills), the field still has some way to go in identifying approaches to support children’s development in this area. Research teams that are developing and testing new models to address executive function could provide further options to Head Start programs in the future.7
3CSRP is not associated with The Chicago School®. 4REDI is an acronym for Research-based, Developmentally Informed. 5Bierman et al. (2008a, 2008b); Morris et al. (2010); Raver et al. (2008). 6Duckworth, Peterson, Matthews, and Kelly (2007). 7Tominey and McClelland (2011); Bailey and Jones (2013).

116
Assessing teacher practices may be important for Head Start centers that are interested in improving children’s social-emotional development. The Incredible Years and Preschool PATHS improved teachers’ classroom management practices and social-emotional instruction, respectively. This led to improvement in children’s emotion knowledge, social problem-solving skills, and social behaviors. Both of these enhancements demonstrated these impacts on children’s social-emotional outcomes without corresponding impacts on CLASS scores.8 As such, they suggest the importance of assessing and strengthening specific teacher practices in efforts to enhance children’s social-emotional development.
The long-term academic (or social) benefits of investing in social-emotional develop-ment are not yet clear. The findings presented in this report show that children in Head Start centers that implemented PATHS and The Incredible Years had better social-emotional out-comes than their control group peers, but the longer-term impact as children proceed through school is still an open question. There are limited data on the predictive power of small to moderate improvements in preschool children’s social-emotional development for the long term. To gain a better understanding of the long-term outcomes for the Head Start CARES children, as well as to begin to build this evidence base, it is important to track these children with outcomes that are well measured and to assess the kinds of outcomes that are most likely to follow from these early improvements in emotional and social skills.
Improving children’s social-emotional development is a primary focus of Head Start, but there is currently a relatively thin base of rigorous research about how to do this effectively through the implementation of evidence-based programming at scale. This study provides key information that federal policymakers and Head Start providers will need if they are to increase Head Start’s capacity to improve the social-emotional skills of preschool-age children.
8CLASS is an acronym for Classroom Assessment Scoring System.

Appendix A
Components of the Head Start CARES Enhancements

THIS PAGE INTENTIONALLY LEFT BLANK
119
This appendix outlines the distinct and overlapping foci of the three social-emotional enhance-ments implemented in the Head Start CARES demonstration: The Incredible Years Teacher Training Program, Preschool PATHS, and Tools of the Mind—Play.1
A number of interventions aimed at improving preschool children’s social-emotional development were considered for inclusion in the demonstration. The process used to identify them involved three phases. First, the research team reviewed a list of candidate interventions to determine which were ready to go to scale in a national effectiveness trial. Second, the team reviewed the research base of the small number of enhancements that satisfied the first criterion. Finally, the team reviewed the content and organization of the identified candidates to deter-mine the similarities and differences among them.
Three enhancements were identified as being ready to be implemented at scale and hav-ing a solid research base. Each of the three was selected to represent a different approach to enhancing social-emotional development: (1) an implicit approach to enhancing social-emotional development via effective classroom management (The Incredible Years); (2) an explicit, instructional approach (Preschool PATHS); and (3) a scaffolded play approach using peer-mediated play and learning structures to foster social-emotional development and self-regulation skills (Tools of the Mind).
In the final phase of the selection process, the research team examined the content and organization of the three identified candidate enhancements to determine whether they were well differentiated from each other, based upon clear differences in the content and organization of their training and implementation manuals. The team also examined the structure of training and professional development support, as well as the implementation demands on teacher and class time.
Notably, this review focused on those aspects of the training and implementation manu-als that were listed explicitly in the written materials gathered on each of the enhancements. There was no attempt to gather further information from the developers on the more implicit information imparted in training or to observe training sessions or implementation to understand whether the written materials provided a comprehensive picture of each enhancement. There are two key advantages of such an approach: first, it concentrated the review on those aspects of the enhancements that were so central that they were described in the written materials; second, more than one reviewer could check the material that was coded, which reduced subjectivity. The disadvantage of this approach is that some aspects of the enhancements may have been missed. Indeed, the developers indicated that this approach did neglect to identify some aspects
1This appendix draws from a document developed at the start of Head Start CARES by Karen Bierman,
Pamela Morris, Emily Snell, and Marcela Torres.

120
of their enhancements: The Incredible Years developers noted that the program also has a strong focus on the social and emotional skills of children; Preschool PATHS developers noted that their approach also supports teachers’ classroom management; and the developers of Tools of the Mind noted that social-emotional skills such as problem-solving or identifying emotions are embedded in children’s learning through “pretend play” scenarios.
Appendix Table A.1 shows the results of this content-focused review (conducted before the start of the demonstration) and provides an overview of which elements of each enhance-ment are unique and which are emphasized by more than one enhancement. Intervention emphasis was computed based on the number of hours or lessons devoted to each domain of skills. The estimates for Tools of the Mind were based on the program’s first manual, which introduces the core approach to scaffolded play and other basic classroom learning structures. (Additional Tools of the Mind manuals add learning structures and more advanced activities.)
Interventions were examined module by module, and each lesson (or hour of teacher training) was assigned a primary target skill based on its content. Modules that targeted multiple skill areas were assigned the skill area that was primarily targeted, so that each module was counted only once. The emphasis of each intervention by skill area is documented in the top portion of the table. The table clearly shows the differences in the relative emphasis of each intervention: The Incredible Years focuses on classroom management, Preschool PATHS on social-emotional learning, and Tools of the Mind on restructuring and scaffolding “pretend play” and learning activities.

121
The Incredible Years Teacher Tools of the Mind:Training Program: Preschool PATHS: Scaffolded Play and Learning
Program Emphasis and Component Classroom Management Social-Emotional Learning Activities
Program emphasisSocial-emotional learning (SEL) 2.7 88.6 27.5Classroom management (CM) 80.3 Embedded in lessons and extension Embedded in restructured
activities classroom organizationDeliberative/cooperative play skills
and communication (DPS) Not a core program emphasis 9.1 47.8Other (OTH) 16.6 — 24.7
Child skills targeteda
Emotional self-regulation/behavioral inhibition (SEL) Embedded in CM 15.9 27.5
Emotion knowledge/expression empathy (SEL) >2.7 54.5 Embedded in play sessions
Deliberative/cooperative playskills and communication (DPS) >2.7 9.1 47.8
Social problem-solving (SEL) >2.7 2.3 Embedded in play sessionsSelf-esteem (OTH) Not a core program emphasis 9.1 Not a core program emphasisPlanning/organization (DPS) Not a core program emphasis Not a core program emphasis 9.8Literacy/math/science (OTH) Not a core program emphasis Not a core program emphasis 14.9
Teacher skills targeteda
Positive behavior support (CM) 8.3 Embedded in lessons Embedded in restructuredclassroom organization
Behavioral control strategies (CM) 33.3 Not a core program emphasis Not a core program emphasisBehavior management (CM) 16.6 Not a core program emphasis Not a core program emphasisLimit-setting (CM) 16.6 Not a core program emphasis Not a core program emphasisTeacher-child relationship (CM) 5.5 Embedded in lessons Embedded in restructured
teacher-student interactionsClassroom climate/structure (OTH) 13.9 9.1 Embedded in restructured
classroom organization
Head Start CARES Demonstration
Appendix Table A.1
Summary of Enhancement ComponentsCore Program Emphasis (%)
SOURCE: Calculations drawn from content analysis of enhancement documents at the start of Head Start CARES by Karen Bierman, Pamela Morris, Emily Snell, and Marcela Torres.
aThe program emphasis for each skill is shown in parentheses, as defined in the first panel.

THIS PAGE INTENTIONALLY LEFT BLANK

Appendix B
Baseline Equivalence of Teachers, Classrooms, Children, and Families Across Program
and Control Groups

THIS PAGE INTENTIONALLY LEFT BLANK

125
As discussed in Chapter 2, the baseline characteristics of teachers, classrooms, and children across enhancement and control groups were examined to determine if random assignment “worked,” in that it resulted in balanced treatment and control groups with few statistically significant differences.
As shown in Appendix Tables B.2 through B.4, there were a few differences between enhancement and control groups; however, those differences that were found do not suggest that the teachers, classrooms, or children in the enhancement group were systematically more advantaged relative to the teachers, classrooms, or children in the control group (which would have led to a greater likelihood of observing program impacts at follow-up that were not due to the assignment to the enhancement condition).
With regard to teachers, as shown in Appendix Table B.2, only a few statistically signif-icant differences were found. Teachers in The Incredible Years were found to have higher levels of burnout, higher levels of depression, and lower levels of emotion coaching than their control group counterparts, but there are few of these differences and they appear to favor the control group. For Preschool PATHS, a similar story emerges, with higher levels of depression among PATHS teachers than control group teachers.
Fortunately, however, these small differences in teachers’ reported characteristics do not translate into any observed differences in teacher practices or classroom climate. (See Appendix Table B.3.) Not one of the observed measures of the Adapted Teaching Style Rating Scale (Adapted TSRS) or the Classroom Assessment Scoring System (CLASS) shows a statistically significant difference across enhancement and control groups. This provides important evidence that the teaching practices and classroom climate of enhancement and control classrooms were well matched at baseline.
Few differences emerged in child characteristics for any of the enhancements. The dif-ferences in The Incredible Years and Tools of the Mind—Play groups were not greater than would be expected by chance. Even for PATHS, however, these findings do not show a general pattern of better or worse characteristics among PATHS children compared with their peers in the control group: findings show that PATHS children had higher levels of aggressive responses and higher teacher-reported academic skills but not stronger academic skills when assessed by trained interviewers.
These findings thus suggest that random assignment was successful in producing groups of centers, classrooms, teachers, and children that did not systematically differ across enhancement and control groups.

126
StandardCharacteristica Mean Deviation
DemographicsAge (years) 42.87 11.84Race and ethnicity (%)
White, non-Hispanic 27.21African-American, non-Hispanic 37.81Hispanic 29.33Other/multiracialb 5.65
Bachelor’s degree or higher (%) 61.51
Teacher burnoutBurnout (0-54)c 13.62 10.85
Teacher depressionK-6 depression score (0-24) 3.01 3.33
Teacher emotion and socialization practicesViews on social-emotional development (%)
Focus on academics 4.21Neutral focus 77.89Focus on social-emotional development 17.89
Emotion coaching (0-4)d 3.56 0.53
Sample sizee
Teachers 307
Head Start CARES Demonstration
Appendix Table B.1
Baseline Characteristics of Head Start CARES Teachers
SOURCE: MDRC calculations based on the spring lead teacher self-survey (conducted at baseline).NOTES: Rounding may cause slight discrepancies in sums and differences.
aThe rating scale for each outcome is shown in parentheses, from low to high.b“Other” includes Asian, Native Hawaiian/Pacific Islander, and American
Indian/Alaska Native.cTeacher burnout was measured by the Maslach Burnout Inventory.dEmotion coaching was defined as teachers’ ability to positively support children’s
navigation of negative or difficult emotions.eFor all variables in the table, data are available for at least 90 percent of the
sample.

127
Control Program Difference Program Difference Program DifferenceGroup Group (IY vs. Standard Group (PATHS vs. Standard Group (Tools vs. Standard
Characteristica Mean Mean Control) Error Mean Control) Error Mean Control) Error
DemographicsAge (years) 40.38 41.09 0.71 2.00 43.48 3.10 1.96 43.83 3.45 * 1.99Race and ethnicity (%)
White, non-Hispanic 28.02 30.39 2.37 0.05 31.59 3.57 0.06 27.25 -0.77 0.06African-American,
non-Hispanic 30.68 25.77 -4.91 0.05 32.91 2.24 0.06 30.40 -0.27 0.06Hispanic 36.24 34.05 -2.19 0.06 29.11 -7.13 0.06 34.38 -1.86 0.06Other/multiracialb 4.54 9.80 5.26 0.04 6.35 1.81 0.04 7.95 3.41 0.04
Bachelor's degree or higher (%) 64.69 68.77 4.08 0.08 66.41 1.72 0.08 59.38 -5.31 0.08
Teacher burnoutBurnout (0-54)c 13.28 16.72 3.45 * 1.97 14.50 1.23 1.99 13.98 0.70 1.98
Teacher depressionK-6 depression score (0-24) 2.14 3.17 1.04 * 0.56 3.74 1.60 *** 0.57 3.04 0.90 0.57
Teacher emotion and socialization practicesViews on social-emotionaldevelopment (%)
Focus on academics 2.57 8.06 5.49 0.03 1.21 -1.37 0.03 9.22 6.64 * 0.03Neutral focus 79.63 73.72 -5.91 0.07 75.34 -4.30 0.07 72.43 -7.21 0.07Focus on social-emotional
development 17.79 18.28 0.50 0.06 23.45 5.67 0.06 18.37 0.58 0.07Emotion coaching (0-4)d 3.61 3.41 -0.20 ** 0.09 3.50 -0.11 0.09 3.55 -0.06 0.09
Sample sizee
Teachers 77 77 77 76
Head Start CARES Demonstration
Appendix Table B.2
Baseline Characteristics of Teachers in Program and Control Groups, by Program
(continued)
The Incredible Years (IY) Preschool PATHS Tools of the Mind
Appendix Table B.2 (continued)
SOURCE: MDRC calculations based on the spring lead teacher self-survey (conducted at baseline).
NOTES: Statistical significance levels are indicated as follows: *** = 1 percent; ** = 5 percent; * = 10 percent.Rounding may cause slight discrepancies in sums and differences.aThe rating scale for each outcome is shown in parentheses, from low to high.b“Other” includes Asian, Native Hawaiian/Pacific Islander, and American Indian/Alaska Native.cTeacher burnout was measured by the Maslach Burnout Inventory.dEmotion coaching was defined as teachers’ ability to positively support children’s navigation of negative or difficult emotions.eFor all variables in the table, data are available for at least 90 percent of the sample.
128

129
Difference Difference DifferenceControl Program (IY vs. Standard Program (PATHS vs. Standard Program (Tools vs. Standard
Characteristica Group Group Control) Error Group Control) Error Group Control) Error
Teacher practiceClassroom management (1-5) 3.73 3.64 -0.08 0.14 3.64 -0.09 0.14 3.82 0.10 0.14Consistency/routine 3.71 3.72 0.01 0.16 3.65 -0.06 0.17 3.99 0.27 0.16Preparedness 3.79 3.67 -0.12 0.16 3.65 -0.14 0.16 3.91 0.12 0.16Classroom awareness 3.56 3.55 -0.01 0.18 3.57 0.01 0.18 3.74 0.18 0.18Positive behavior management 3.55 3.45 -0.10 0.17 3.31 -0.24 0.17 3.52 -0.03 0.17Negative behavior management 1.39 1.59 0.20 0.16 1.49 0.11 0.16 1.40 0.01 0.16Attention/engagement 3.15 3.05 -0.09 0.17 3.11 -0.04 0.17 3.16 0.01 0.17
Social-emotional instruction (1-5) 1.73 1.68 -0.05 0.14 1.74 0.00 0.14 1.89 0.16 0.14Emotion modeling 1.60 1.63 0.03 0.16 1.63 0.03 0.16 1.74 0.15 0.16Emotion expression 1.86 1.79 -0.07 0.19 1.76 -0.10 0.19 1.94 0.09 0.19Emotion regulation 1.69 1.57 -0.12 0.16 1.70 0.01 0.16 1.87 0.18 0.16Social awareness 1.65 1.55 -0.10 0.15 1.66 0.01 0.15 1.76 0.11 0.15Social problem-solving 1.65 1.63 -0.02 0.14 1.67 0.02 0.14 1.77 0.12 0.14Provision of interpersonal
support 1.95 1.88 -0.07 0.19 2.02 0.07 0.19 2.25 0.30 0.19
Scaffolding (1-5) 1.37 1.36 -0.01 0.11 1.37 0.00 0.11 1.48 0.11 0.11Scaffolding dramatic play 1.35 1.33 -0.02 0.11 1.32 -0.03 0.11 1.45 0.10 0.11Scaffolding peer interaction 1.40 1.39 0.00 0.12 1.42 0.02 0.12 1.51 0.11 0.12
(continued)
The Incredible Years (IY) Preschool PATHS Tools of the Mind
Head Start CARES Demonstration
Appendix Table B.3
Baseline Characteristics of Classrooms in Program and Control Groups, by Program

130
Classroom climateEmotional support (1-7) 5.19 5.14 -0.05 0.17 5.18 -0.01 0.17 5.20 0.01 0.17Positive climate 5.28 5.22 -0.06 0.19 5.25 -0.03 0.19 5.31 0.03 0.19Negative climate 1.50 1.60 0.10 0.16 1.68 0.18 0.16 1.64 0.14 0.16Teacher sensitivity 4.62 4.55 -0.07 0.23 4.73 0.11 0.23 4.72 0.11 0.23Regard for student perspectives 4.36 4.41 0.05 0.19 4.43 0.07 0.19 4.40 0.03 0.19
Classroom organization (1-7) 4.65 4.65 0.00 0.18 4.60 -0.05 0.18 4.76 0.11 0.18Behavior management 4.90 4.97 0.07 0.21 4.79 -0.11 0.21 5.04 0.15 0.21Productivity 5.13 4.99 -0.14 0.17 5.06 -0.07 0.18 5.18 0.05 0.17Instructional learning formats 3.92 4.00 0.08 0.20 3.96 0.05 0.21 4.05 0.13 0.20
Instructional support (1-7) 2.55 2.47 -0.08 0.18 2.64 0.09 0.18 2.61 0.05 0.18Concept development 2.17 2.22 0.05 0.19 2.26 0.09 0.19 2.30 0.13 0.19Quality of feedback 2.55 2.44 -0.11 0.19 2.63 0.08 0.19 2.58 0.03 0.19Language modeling 2.94 2.74 -0.20 0.21 3.04 0.10 0.21 2.94 0.00 0.21
Literacy focusb (1-7) 1.35 1.35 -0.01 0.10 1.46 0.11 0.10 1.38 0.03 0.10
Sample sizec
Classrooms 77 77 77 76
Appendix Table B.3 (continued)
SOURCE: MDRC calculations based on the baseline observational assessments.
NOTES: Statistical significance levels are indicated as follows: *** = 1 percent; ** = 5 percent; * = 10 percent.Rounding may cause slight discrepancies in sums and differences.aThe rating scale for each outcome is shown in parentheses, from low to high.bLiteracy focus was only collected for Cohort 2. Cohort 2 sample sizes are: n = 58 for the control group, n = 57 for IY, n = 55 for PATHS, and n = 59 for
Tools.cFor all variables in the table, data are available for at least 97 percent of the fielded sample.

131
Control Program Difference Program Difference Program DifferenceGroup Group (IY vs. Group (PATHS vs. Group (Tools vs.
Characteristica Mean Mean Control) Mean Control) Mean Control)
Child demographicsAge (years) 4.40 4.38 -0.03 4.39 -0.01 4.41 0.01Race and ethnicity (%)
White, non-Hispanic 15.60 17.72 2.12 17.45 1.84 19.06 3.46African-American, non-Hispanic 26.78 25.49 -1.29 26.71 -0.08 26.43 -0.36Hispanic 48.37 50.25 1.88 47.75 -0.62 47.33 -1.04Other/multiracialb 9.24 6.79 -2.45 7.59 -1.65 7.74 -1.50
Female (%) 48.96 48.08 -0.88 50.15 1.19 48.14 -0.82
Child outcomesExecutive function (direct assessment)Head-to-Toes (0-10) 2.38 2.10 -0.28 2.23 -0.15 2.46 0.08Pencil Tap (0-1) 0.45 0.40 -0.05 0.42 -0.03 0.46 0.01
Behavior problems (teacher report)Total score (0-52) 6.26 5.60 -0.66 6.74 0.49 6.76 0.50
Externalizing (0-22) 2.87 2.63 -0.24 3.11 0.24 3.11 0.25Hyperactivity (0-10) 1.76 1.65 -0.11 1.74 -0.02 1.86 0.10Internalizing (0-20) 1.62 1.35 -0.27 1.89 0.27 1.80 0.18
Learning behaviors (teacher report)Work-related skills (1-7) 4.89 4.81 -0.09 4.87 -0.02 4.77 -0.13
Emotion knowledge (direct assessment)Facial emotions identification (0-1) 0.62 0.60 -0.02 0.66 0.03 * 0.64 0.02Situations emotions identification (0-1) 0.38 0.37 -0.01 0.38 0.00 0.39 0.01
Head Start CARES Demonstration
Appendix Table B.4
Baseline Characteristics of Children in Full Sample in Program and Control Groups, by Program
(continued)
The Incredible Years (IY) Preschool PATHS Tools of the Mind

132
Control Program Difference Program Difference Program DifferenceGroup Group (IY vs. Group (PATHS vs. Group (Tools vs.
Characteristica Mean Mean Control) Mean Control) Mean Control)
Social problem-solving (direct assessment)Challenging Situations competent response (0-10) 1.56 1.39 -0.17 ** 1.46 -0.10 1.38 -0.18 **Challenging Situations aggressive response (0-10) 0.88 0.88 0.00 1.04 0.15 * 0.99 0.11
Social behaviors (teacher report)Social Skills Rating Scale (total score)
(0-60) 40.97 42.05 1.07 41.83 0.86 40.49 -0.49Interpersonal skills (1-7) 5.46 5.51 0.05 5.46 0.00 5.38 -0.08
Pre-academic skills (direct assessment)Woodcock-Johnson - Letter-Word Identification
(mean = 332)c 315.51 313.54 -1.98 314.61 -0.90 314.15 -1.36Woodcock-Johnson - Applied Problems
(mean = 399)d 394.99 394.06 -0.94 397.41 2.41 396.93 1.93Expressive One-Word Picture Vocabulary Test
(50-150) 86.64 85.60 -1.04 86.79 0.15 87.31 0.67
Pre-academic skills (teacher report)General knowledge (1-5) 2.44 2.50 0.06 2.70 0.26 * 2.42 -0.02Language and literacy (1-5) 2.20 2.25 0.05 2.52 0.32 *** 2.17 -0.03Mathematical thinking (1-5) 2.07 2.11 0.04 2.41 0.34 *** 2.07 0.00
Parent demographicsMonthly income, best estimate 1,816.35 1,786.90 -29.44 1,821.07 4.72 1,829.02 12.67Household receiving TANFe (%) 12.74 10.42 -2.32 13.23 0.49 9.42 -3.33Owns home (%) 18.69 19.03 0.34 17.92 -0.77 17.66 -1.03Lives in transient housing (%) 16.47 16.37 -0.10 16.78 0.31 20.10 3.62Receives food stamps (%) 55.67 55.83 0.16 57.95 2.28 54.71 -0.96
Sample sizef
Children 512 541 544 517(continued)
The Incredible Years (IY) Preschool PATHS Tools of the Mind
Appendix Table B.4 (continued)

Appendix Table B.4 (continued)
SOURCES: MDRC calculations from the parents’ reports, teachers’ reports, and direct assessments.
NOTES: Statistical significance levels are indicated as follows: *** = 1 percent; ** = 5 percent; * = 10 percent.Rounding may cause slight discrepancies in sums and differences.aThe rating scale for each outcome except for the Woodcock-Johnson is shown in parentheses, from low to high.b“Other” includes Asian, Native Hawaiian/Pacific Islander, and American Indian/Alaska Native. cThe mean indicated is the national average for 4-year-olds on the Letter-Word Identification subtest of the Woodcock-Johnson III.dThe mean indicated is the national average for 4-year-olds on the Applied Problems subtest of the Woodcock-Johnson III.eTANF is Temporary Assistance for Needy Families.fFor all teacher-reported variables in the table, data are available for at least 94 percent of the sample. For all directly assessed variables in the table,
data are available for between 84 and 92 percent of the sample. For all parent-reported variables in the table, data are available for between 85 and 87 percent of the sample, with the exception of monthly income, which is available for 70 percent of the sample. Age and percentage female are available for at least 99.9 percent of the sample.
133

134
Control Program Difference Program Difference Program DifferenceGroup Group (IY vs. Group (PATHS vs. Group (Tools vs.
Characteristica Mean Mean Control) Mean Control) Mean Control)
Child demographicsAge (years) 4.40 4.38 -0.02 4.40 -0.01 4.42 0.02Race and ethnicity (%)
White, non-Hispanic 14.84 17.75 2.91 17.91 3.07 19.24 4.40 *African-American, non-Hispanic 26.31 25.98 -0.33 27.52 1.21 26.44 0.13Hispanic 48.88 50.30 1.42 47.32 -1.56 47.18 -1.70Other/multiracialb 9.78 6.20 -3.59 6.79 -3.00 7.47 -2.32
Female (%) 49.52 48.21 -1.30 50.70 1.19 48.86 -0.66
Child outcomesExecutive function (direct assessment) Head-to-Toes (0-10) 2.41 2.12 -0.29 2.34 -0.07 2.50 0.09Pencil Tap (0-1) 0.45 0.41 -0.04 0.43 -0.02 0.46 0.01
Behavior problems (teacher report)Total score (0-52) 6.03 5.70 -0.32 6.71 0.68 6.57 0.55
Externalizing (0-22) 2.74 2.67 -0.06 3.10 0.36 3.06 0.32Internalizing (0-20) 1.57 1.38 -0.19 1.87 0.30 1.76 0.19Hyperactivity (0-10) 1.70 1.67 -0.03 1.71 0.01 1.77 0.07
Learning behaviors (teacher report)Work-related skills (1-7) 4.91 4.82 -0.09 4.89 -0.02 4.81 -0.10
Emotion knowledge (direct assessment)Facial emotions identification (0-1) 0.63 0.61 -0.02 0.66 0.03 0.64 0.01Situations emotions identification (0-1) 0.38 0.37 -0.01 0.39 0.00 0.39 0.01
The Incredible Years (IY) Preschool PATHS Tools of the Mind
Head Start CARES Demonstration
Appendix Table B.5
Baseline Characteristics of Children in Analysis Sample in Program and Control Groups, by Program
(continued)

135
Control Program Difference Program Difference Program DifferenceGroup Group (IY vs. Group (PATHS vs. Group (Tools vs.
Characteristica Mean Mean Control) Mean Control) Mean Control)
Social problem-solving (direct assessment)Challenging Situations competent response (0-10) 1.58 1.40 -0.17 ** 1.47 -0.10 1.40 -0.18 **Challenging Situations aggressive response (0-10) 0.86 0.88 0.02 1.03 0.17 * 0.97 0.10
Social behaviors (teacher report)Social Skills Rating Scale (0-60) 41.40 42.24 0.84 42.17 0.77 40.80 -0.59Interpersonal skills (1-7) 5.47 5.52 0.05 5.45 -0.02 5.41 -0.06
Pre-academic skills (direct assessment) Woodcock-Johnson - Letter-Word Identification
(mean = 332)c 315.65 313.85 -1.81 314.70 -0.96 314.31 -1.34Woodcock-Johnson - Applied Problems
(mean = 399)d 395.36 394.50 -0.86 397.95 2.59 396.60 1.24Expressive One-Word Picture
Vocabulary Test (50-150) 87.16 85.89 -1.27 87.34 0.18 87.58 0.42
Pre-academic skills (teacher report)General knowledge (1-5) 2.44 2.52 0.08 2.73 0.29 ** 2.42 -0.02Language and literacy (1-5) 2.21 2.27 0.06 2.55 0.34 *** 2.18 -0.03Mathematical thinking (1-5) 2.12 2.13 0.01 2.45 0.33 *** 2.09 -0.03
Parent demographicsMonthly income, best estimate 1,841.47 1,786.45 -55.03 1,850.81 9.34 1,844.08 2.61Household receiving TANFe (%) 11.59 11.02 -0.57 13.92 2.33 9.31 -2.28Owns home (%) 17.91 18.99 1.08 18.35 0.44 16.52 -1.39Lives in transient housing (%) 18.23 16.89 -1.35 16.87 -1.36 20.73 2.49Receives food stamps (%) 54.64 54.54 -0.10 55.81 1.17 52.81 -1.83
Sample sizef
Children 448 496 477 457
Appendix Table B.5 (continued)
(continued)
The Incredible Years (IY) Preschool PATHS Tools of the Mind

136
Appendix Table B.5 (continued)
SOURCES: MDRC calculations from the parents’ reports, teachers’ reports, and direct assessments.
NOTES: Statistical significance levels are indicated as follows: *** = 1 percent; ** = 5 percent; * = 10 percent.Rounding may cause slight discrepancies in sums and differences.aThe rating scale for each outcome except for the Woodcock-Johnson is shown in parentheses, from low to high.b“Other” includes Asian, Native Hawaiian/Pacific Islander, and American Indian/Alaska Native. cThe mean indicated is the national average for 4-year-olds on the Letter-Word Identification subtest of the Woodcock-Johnson III.dThe mean indicated is the national average for 4-year-olds on the Applied Problems subtest of the Woodcock-Johnson III.eTANF is Temporary Assistance for Needy Families.fFor all teacher-reported variables in the table, data are available for at least 95 percent of the sample. For all directly assessed variables in the table, data are
available for between 87 and 95 percent of the sample. For all parent-reported variables in the table, data are available for between 86 and 87 percent of the sample, with the exception of monthly income, which is available for 70 percent of the sample. Age and percentage female are available for 100 percent of the sample.

Appendix C
Sensitivity Analyses: Child-Level Impacts Controlling for Baseline Differences

THIS PAGE INTENTIONALLY LEFT BLANK
139
Baseline data for children were collected from September to December of the Head Start year. As discussed in Appendix B, some small differences were observed between children assigned to each of the enhancements and those assigned to the control group. Some of these minor differences seem to be due to chance (for example, the fact that children in the control group had higher levels of competent responses to stories about challenging situations than those in the Incredible Years group). Others (such as the fact that children in the Preschool PATHS group had higher scores on the facial emotions identification Task than those in the control group) may reflect “early impacts” of the enhancements, since the baseline data were collected on children up to a few months after the initial teacher training and enhancement implementa-tion had already begun. Appendix Table B.4 shows some baseline differences that are consistent with both of these explanations. To assess the effect of these baseline differences on the impact estimates, analyses were conducted to estimate impacts on the outcomes presented in Chapters 4 through 7 while controlling for any additional baseline differences (beyond the pretest controls) for each enhancement. Findings are shown in Appendix Tables C.1 through C.4. When controlling for these baseline differences, the estimated effects of each enhancement were very similar to the effects from the main analysis.

140
Control The Incredible DifferenceGroup Years (IY) (IY vs. Standard Effect
Outcomea Mean Mean Control) Error Sizeb
Executive function (direct assessment)Head-to-Toes (0-10) 4.08 3.96 -0.12 0.24 -0.03Pencil Tap (0-1) 0.66 0.67 0.01 0.02 0.02
Behavior problems (teacher report)Total score (0-52) 6.02 5.56 -0.46 0.71 -0.06
Externalizing (0-22) 3.04 2.56 -0.47 0.33 -0.11Hyperactivity (0-10) 1.63 1.46 -0.17 0.17 -0.08Internalizing (0-20) 1.37 1.49 0.13 0.27 0.06
Learning behaviors (teacher report)Work-related skills (1-7) 5.08 5.26 0.18 ** 0.08 0.17
Emotion knowledge (direct assessment)Facial emotions identification (0-1) 0.71 0.74 0.03 ** 0.01 0.14Emotions situations identification (0-1) 0.47 0.49 0.02 * 0.01 0.12
Social problem-solving (direct assessment)Challenging Situations competent response (0-10) 1.46 1.63 0.17 ** 0.08 0.15Challenging Situations aggressive response (0-10) 1.00 0.84 -0.16 ** 0.08 -0.12
Social behaviors (teacher report)Social Skills Rating Scale (total score) (0-60) 44.58 47.59 3.01 *** 0.99 0.27Interpersonal skills (1-7) 5.50 5.60 0.09 0.08 0.09
Sample sizec
Centers 26 26Classrooms 77 77Children 621 702
Head Start CARES Demonstration
Appendix Table C.1
Child-Level Impacts at Preschool Follow-Up Controlling for Baseline Differences inExecutive Function and Behavior Regulation: The Incredible Years
SOURCES: MDRC calculations based on the direct assessments and teachers’ reports.
NOTES: Statistical significance levels are indicated as follows: *** = 1 percent; ** = 5 percent; * = 10 percent.
Rounding may cause slight discrepancies in sums and differences.aThe rating scale for each outcome is shown in parentheses, from low to high.bEffect size is calculated by dividing the impact of the program (the difference between the means for the
program group and the control group) by the standard deviation for the control group.cFor all variables in the table, data are available for at least 94 percent of the sample.

141
Control Preschool DifferenceGroup PATHS (PATHS vs. Standard Effect
Outcomea Mean Mean Control) Error Sizeb
Executive function (direct assessment)Head-to-Toes (0-10) 4.05 3.61 -0.44 * 0.25 -0.10Pencil Tap (0-1) 0.66 0.67 0.01 0.02 0.03
Behavior problems (teacher report)Total score (0-52) 6.04 5.81 -0.23 0.71 -0.03
Externalizing (0-22) 3.04 2.72 -0.32 0.34 -0.07Hyperactivity (0-10) 1.63 1.51 -0.12 0.18 -0.06Internalizing (0-20) 1.38 1.64 0.27 0.27 0.12
Learning behaviors (teacher report)Work-related skills (1-7) 5.07 5.27 0.20 ** 0.08 0.20
Emotion knowledge (direct assessment)Facial emotions identification (0-1) 0.71 0.77 0.06 *** 0.01 0.28Emotions situations identification (0-1) 0.47 0.50 0.04 *** 0.01 0.20
Social problem-solving (direct assessment)Challenging Situations competent response (0-10) 1.45 1.61 0.16 ** 0.08 0.14Challenging Situations aggressive response (0-10) 1.00 0.86 -0.14 0.08 -0.10
Social behaviors (teacher report)Social Skills Rating Scale (total score) (0-60) 44.49 46.44 1.96 * 0.99 0.18Interpersonal skills (1-7) 5.49 5.59 0.10 0.08 0.10
Sample sizec
Centers 26 26Classrooms 77 77Children 621 669
Head Start CARES Demonstration
Appendix Table C.2
Child-Level Impacts at Preschool Follow-Up Controlling for Baseline Differences inExecutive Function and Behavior Regulation: Preschool PATHS
SOURCES: MDRC calculations based on the direct assessments and teachers’ reports.
NOTES: Statistical significance levels are indicated as follows: *** = 1 percent; ** = 5 percent; * = 10 percent.
Rounding may cause slight discrepancies in sums and differences.aThe rating scale for each outcome is shown in parentheses, from low to high.bEffect size is calculated by dividing the impact of the program (the difference between the means for the
program group and the control group) by the standard deviation for the control group. cFor all variables in the table, data are available for at least 93 percent of the sample.
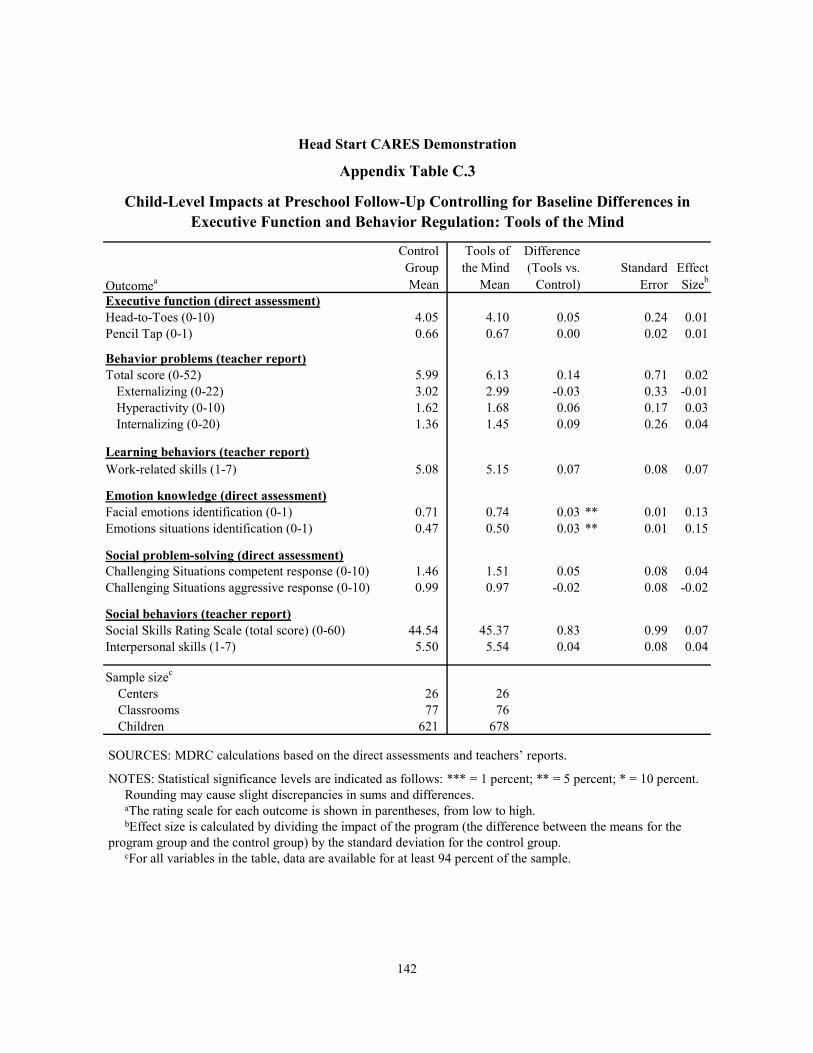
142
Control Tools of DifferenceGroup the Mind (Tools vs. Standard Effect
Outcomea Mean Mean Control) Error Sizeb
Executive function (direct assessment)Head-to-Toes (0-10) 4.05 4.10 0.05 0.24 0.01Pencil Tap (0-1) 0.66 0.67 0.00 0.02 0.01
Behavior problems (teacher report)Total score (0-52) 5.99 6.13 0.14 0.71 0.02
Externalizing (0-22) 3.02 2.99 -0.03 0.33 -0.01Hyperactivity (0-10) 1.62 1.68 0.06 0.17 0.03Internalizing (0-20) 1.36 1.45 0.09 0.26 0.04
Learning behaviors (teacher report)Work-related skills (1-7) 5.08 5.15 0.07 0.08 0.07
Emotion knowledge (direct assessment)Facial emotions identification (0-1) 0.71 0.74 0.03 ** 0.01 0.13Emotions situations identification (0-1) 0.47 0.50 0.03 ** 0.01 0.15
Social problem-solving (direct assessment)Challenging Situations competent response (0-10) 1.46 1.51 0.05 0.08 0.04Challenging Situations aggressive response (0-10) 0.99 0.97 -0.02 0.08 -0.02
Social behaviors (teacher report)Social Skills Rating Scale (total score) (0-60) 44.54 45.37 0.83 0.99 0.07Interpersonal skills (1-7) 5.50 5.54 0.04 0.08 0.04
Sample sizec
Centers 26 26Classrooms 77 76Children 621 678
Head Start CARES Demonstration
Appendix Table C.3
Child-Level Impacts at Preschool Follow-Up Controlling for Baseline Differences inExecutive Function and Behavior Regulation: Tools of the Mind
SOURCES: MDRC calculations based on the direct assessments and teachers’ reports.
NOTES: Statistical significance levels are indicated as follows: *** = 1 percent; ** = 5 percent; * = 10 percent.Rounding may cause slight discrepancies in sums and differences.aThe rating scale for each outcome is shown in parentheses, from low to high.bEffect size is calculated by dividing the impact of the program (the difference between the means for the
program group and the control group) by the standard deviation for the control group. cFor all variables in the table, data are available for at least 94 percent of the sample.
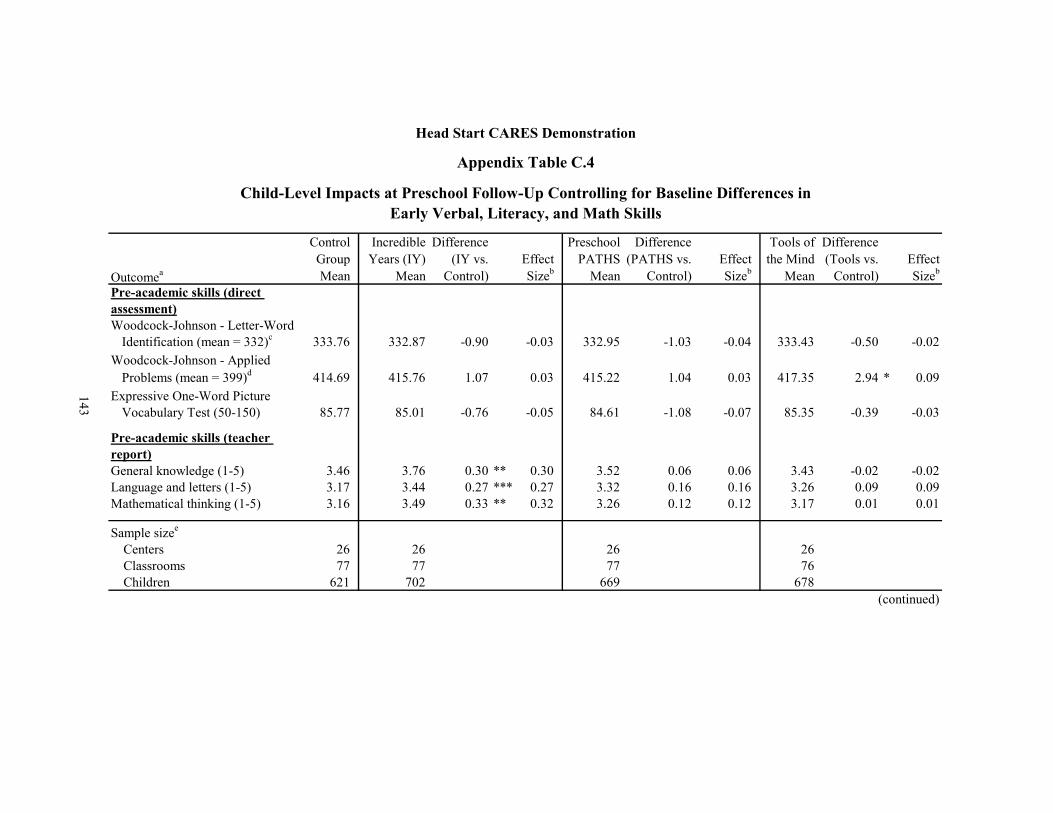
143
Control Incredible Difference Preschool Difference Tools of DifferenceGroup Years (IY) (IY vs. Effect PATHS (PATHS vs. Effect the Mind (Tools vs. Effect
Outcomea Mean Mean Control) Sizeb Mean Control) Sizeb Mean Control) Sizeb
Pre-academic skills (direct assessment)Woodcock-Johnson - Letter-Word
Identification (mean = 332)c 333.76 332.87 -0.90 -0.03 332.95 -1.03 -0.04 333.43 -0.50 -0.02Woodcock-Johnson - Applied
Problems (mean = 399)d 414.69 415.76 1.07 0.03 415.22 1.04 0.03 417.35 2.94 * 0.09Expressive One-Word Picture
Vocabulary Test (50-150) 85.77 85.01 -0.76 -0.05 84.61 -1.08 -0.07 85.35 -0.39 -0.03
Pre-academic skills (teacher report)General knowledge (1-5) 3.46 3.76 0.30 ** 0.30 3.52 0.06 0.06 3.43 -0.02 -0.02Language and letters (1-5) 3.17 3.44 0.27 *** 0.27 3.32 0.16 0.16 3.26 0.09 0.09Mathematical thinking (1-5) 3.16 3.49 0.33 ** 0.32 3.26 0.12 0.12 3.17 0.01 0.01
Sample sizee
Centers 26 26 26 26Classrooms 77 77 77 76Children 621 702 669 678
Head Start CARES Demonstration
Appendix Table C.4
Child-Level Impacts at Preschool Follow-Up Controlling for Baseline Differences inEarly Verbal, Literacy, and Math Skills
(continued)

144
Appendix Table C.4 (continued)
SOURCES: MDRC calculations based on the direct assessments and teachers' reports.
NOTES: Statistical significance levels are indicated as follows: *** = 1 percent; ** = 5 percent; * = 10 percent.Rounding may cause slight discrepancies in sums and differences.aThe rating scale for each outcome except for the Woodcock-Johnson is shown in parentheses, from low to high.bEffect size is calculated by dividing the impact of the program (the difference between the means for the program group and the control group) by the
standard deviation for the control group. cThe mean indicated is the national average for 4-year-olds on the Letter-Word Identification subtest of the Woodcock-Johnson III.dThe mean indicated is the national average for 4-year-olds on the Applied Problems subtest of the Woodcock-Johnson III.eFor all variables in the table, data are available for at least 97 percent of the sample.

Appendix D
Measures Used in Head Start CARES

THIS PAGE INTENTIONALLY LEFT BLANK
147
This appendix provides further details on each of the measures described in Chapter 3 and additional measures used in the study. These include information on how subscales were created, reliability scores, and scoring rules.
Teacher Practices and Classroom Climate
Adapted Teaching Style Rating Scale (Adapted TSRS)
In the spring before implementation and in the spring of the implementation year, observers who did not know the intervention status of the classrooms observed the lead teacher in each classroom for a two-hour observation period. The Adapted TSRS was adapted for the Head Start CARES project by Dr. Cybele Raver from the original TSRS,1 used in the Head Start REDI study.2 The Adapted TSRS was created to measure the teacher practices targeted by each of the three enhancements as they were implemented in the classroom. Teachers are rated on a five-point Likert scale on three practices: (1) classroom management, which includes consisten-cy and routine, preparedness, classroom awareness, positive behavior management, negative behavior management, and attention and engagement; (2) social-emotional instruction, which includes emotion modeling, emotion expression, emotion regulation, social awareness, social problem-solving, and the provision of interpersonal support; and (3) scaffolding, which includes scaffolding dramatic play and scaffolding peer interaction. The Adapted TSRS was coded in two segments at the same time as the Classroom Assessment Scoring System observation (see below). Each Adapted TSRS segment was made up of 40 minutes of observation followed by 10 minutes of coding.
Exploratory factor analysis (EFA) was used to group the items into subscales. The data imply a clear three-factor solution that aligns with the distinct theories of change that the CARES team hypothesized for each enhancement. Factor loadings are presented in Appendix Table D.1. For the scaffolding variable a third item, Talk Aloud, was dropped because of a low loading (0.34) and a lack of theoretical convergence with the other items on the scale.
At least 20 percent of classrooms were observed by two observers at the same time to check for inter-rater reliability. An item was considered reliable if the observers’ scores on it differed by no more than one point. All of the reliability scores across segments in an observa-tion were averaged to calculate reliability for that observation. The average reliability was 96 percent across all baseline observations and 93 percent across all follow-up observations. When reliability coding took place in a classroom and two sets of scores were obtained, the Adapted
1Raver et al. (2012). 2Domitrovich, Cortes, and Greenberg (2007). REDI is an acronym for Research-based, Developmentally
Informed.

148
TSRS scores of the two observers in these classrooms were averaged. The three scales are internally consistent (social-emotional instruction Cronbach’s α = 0.89-0.90 classroom man-agement Cronbach’s α = 0.89-0.92, and scaffolding Cronbach’s α = 0.80-0.87).
Classroom Assessment Scoring System (CLASS): Preschool Version
In the spring before implementation and in the spring of the implementation year, ob-servers who did not know the intervention status of the classrooms observed all adults (includ-ing both teachers) in each classroom for half a day. CLASS is a nationally used measure of classroom quality.3 It provides global, seven-point Likert scores relating to four aspects of the
3Pianta, La Paro, and Hamre (2008).
Social-Emotional ClassroomItem Instruction Management ScaffoldingEmotion modeling 0.80Emotion expression 0.88Emotion regulation 0.81Social awareness 0.87Social problem-solving 0.81Provision of interpersonal support 0.72Consistency/routine 0.96Preparedness 0.92Classroom awareness 0.92Positive behavior management 0.82Negative behavior management -0.70Attention/engagement 0.61Scaffolding dramatic play 0.96Scaffolding peer interaction 0.88Cronbach's coefficient alpha for scale 0.90 0.92 0.87
Factor Loading
Head Start CARES Demonstration
Table D.1
Items and Factor Loadings for the Adapted Teaching Style Rating Scale
SOURCE: MDRC calculations based on the observational assessments completed using the Adapted Teaching Style Rating Scale (Raver et al., 2012).
NOTES: A promax rotation, three-factor structure was used to identify subscales. Only factor items with loadings greater than or equal to |.40| are shown, based on factor analysis. Factor loadings indicate items that were used to create the respective scales. Items were included on the factors on which they most highly loaded.

149
classroom climate (the first three of which are made up of 10 dimensions in total): (1) emotional support, which includes positive climate, negative climate, teacher sensitivity, and regard for student perspectives; (2) classroom organization, which includes behavior management, productivity, and instructional learning formats; (3) instructional support, which includes concept development, quality of feedback, and language modeling; and (4) literacy focus.
CLASS was coded in four segments; each segment consisted of 20 minutes of observa-tion followed by 10 minutes of coding. The score for each of the 10 CLASS dimensions listed above plus literacy focus was calculated as the average of the scores on that dimension across the four segments. The score for each of the three major domains (emotional support, classroom organization, and instructional support) was calculated as the average of the scores of its dimensions. (For example, the score for emotional support was the average of the scores for positive climate, negative climate, teacher sensitivity, and regard for student perspectives.) At least 20 percent of classrooms were observed by two observers at the same time to check for inter-rater reliability on the CLASS (the same classrooms used for inter-rater reliability for the Adapted TSRS). An item was considered reliable if observers’ ratings were within one point of each other. The average reliability score was 95 percent across all baseline observations and 93 percent across all follow-up observations. Also, as was done for the Adapted TSRS, the CLASS scores of the two observers in these classrooms were averaged.
The items were categorized into three domains based on the original factor analysis work for the measure conducted by Pianta and colleagues.4 These domains (emotional support, classroom organization, and instructional support) are widely used for educational research and for administrative and assessment purposes in schools. To confirm that these three domains were the most appropriate grouping domains for the study sample, an exploratory and a con-firmatory factor analysis (CFA) were conducted using the study’s data. The EFA yielded a two-factor solution whose fit was compared with the original three-domain structure using CFA (Appendix Table D.2). The goodness-of-fit statistics for the three domains were fair; however, the fit statistics of the two-factor solution were not better and the two-factor solution was less theoretically justified based on previous use of this measure. A Root Mean Square Error of Approximation (RMSEA) of less than 0.08 and a Bentler Comparative Fit Index (CFI) greater than 0.90 indicate acceptable fit.5 Model-fit indices for the three-domain model were 0.14 for the RMSEA and 0.93 for the CFI, and for the two-factor solution were 0.15 for the RMSEA and 0.91 for the CFI. The three scales are internally consistent (emotional support Cronbach’s α = 0.87, classroom organization Cronbach’s α = 0.87-0.89, and instructional support Cronbach’s α = 0.89-0.92).
4Hamre, Pianta, Mashburn, and Downer (2007). 5Kline (2005).

150
Children’s Executive Function, Behavior Regulation, and Learning Behaviors
Head-to-Toes
In this task, children play a game where they are instructed to touch their heads when the assessor directs them to touch their toes, and then to touch their toes when the assessor directs them to touch their heads.6 The activity is intended to tap children’s ability to suppress a dominant response (to follow the assessor’s directions) in order to carry out a subdominant response (to do the opposite of what the assessor asks them to do), and draws on children’s inhibitory control, attention, and working memory.
6Ponitz et al. (2008).
Emotional Classroom InstructionalDimension Support Organization Support
-0.890.60
-0.91-0.79
0.860.790.82
0.840.950.88
Cronbach's coefficient alpha for scale 0.87 0.87 0.92
Language modeling
Positive climateNegative climateTeacher sensitivityRegard for student perspectivesBehavior managementProductivityInstructional learning formatsConcept developmentQuality of feedback
Head Start CARES Demonstration
Appendix Table D.2
Confirmatory Factor Analysis Loadings for the Classroom Assessment
Factor Loading
Scoring System
SOURCE: MDRC calculations based on the observational assessments completed using the Classroom Assessment Scoring System (Pianta, La Paro, and Hamre, 2008).

151
The task includes 10 trials, and assessors score each trial as “correct,” “incorrect,” or “self-correct” if the child starts to perform the incorrect action but then catches himself and ultimately performs the correct action. In Head Start CARES, “self-correct” responses were recoded as “correct,” and each item was scored as a 0 or 1. The range of the measure is 0 to 10, with a 0 indicating that the child got no trials correct and a 10 indicating that the child got all 10 trials correct.7 Children completed this task during the preschool year.
Pencil Tap
In this task, children are asked to tap on a table twice with a pencil when the assessor taps once, and once when the assessor taps twice.8 The task includes 16 trials, and each item is coded as a 1 if the child answers correctly and coded as a 0 if the child answers incorrectly. The final score is the proportion of trials the child gets correct. Like the Head-to-Toes task, this task also requires children to inhibit a natural tendency to mimic the action of the assessor while remembering the rule for the correct response, and is thought to assess inhibitory control, attention, and working memory. Children completed this task during the preschool year.
Behavior Problems Index (BPI)
The Behavior Problems Index (BPI) was used as both a parent and teacher measure of the frequency, range, and type of children’s behavior problems.9 An EFA of the teacher data revealed three subscales, consistent with prior research, related to children’s externalizing behavior (acting out or aggressive behavior), internalizing behavior (depression and anxiety), and hyperactivity. Appendix Table D.3 shows the factor loadings from this EFA. An EFA of the parent data did not show similarly clear empirical and theoretical groupings of items for the creation of subscales, and therefore only the total score was used for the parent measure.
The 28-item survey uses a three-point Likert scale (where 0 = often true, 1 = sometimes true, and 2 = not true). For the total score and each subscale, the score was calculated as the sum of the survey items. Internal consistency for the total score was high for both the parent-reported total BPI (Cronbach’s α = 0.89) and the teacher-reported total BPI (Cronbach’s α = 0.94-0.95). It was also high for the teacher-reported externalizing subscale (11 items, Cronbach’s α = 0.93), internalizing subscale (10 items, Cronbach’s α = 0.82-0.86), and hyperactivity subscale (5 items, Cronbach’s α = 0.84-0.85). This measure was collected from teachers when the children were in preschool and kindergarten, and from parents when the children were in kindergarten.
7For all baseline scales in the study, missing values for individual items in the scale were imputed where
25 percent or less of the items were missing, and the score for the scale was set to “missing” where more than 25 percent were missing.
8Diamond and Taylor (1996). 9Zill (1990).

152
Externalizing Internalizing HyperactivityItem in Total Scalea Behavior Behavior Behavior
Has sudden changes in mood or feelings. 0.50Cheats or tells lies. 0.70Argues too much. 0.78Bullies, or is cruel or mean to others. 0.86Is disobedient at school. 0.72Does not seem to feel sorry after he/she
misbehaves. 0.71Has trouble getting along with other children. 0.72Has trouble getting along with teachers. 0.70Is stubborn, sullen, or irritable. 0.65Has a very strong temper and loses it easily. 0.75Breaks things on purpose or deliberately destroys
his/her own or another's things. 0.57Feels or complains that no one loves him/her. 0.54Is rather high strung, tense, or nervous. 0.39Is too fearful or anxious. 0.60Feels worthless or inferior. 0.67Has difficulty getting his/her mind off certain
thoughts, has obsessions. 0.42Is unhappy, sad, or depressed. 0.68Is withdrawn, does not get involved with others. 0.71Clings to adults. 0.60Cries too much. 0.58Is too dependent on others. 0.60Has difficulty concentrating, cannot pay
attention for long. 0.74Is easily confused, seems to be in a fog. 0.62Is impulsive, or acts without thinking. 0.46Is restless or overly active, cannot sit still. 0.62Demands a lot of attention. 0.39Is disobedient at home.b
Is not liked by other children.c
Cronbach's coefficient alpha for scale 0.93 0.86 0.85(continued)
Head Start CARES Demonstration
Appendix Table D.3Items and Factor Loadings for the Teacher-Reported Behavior Problems Index
Factor Loading

153
Cooper-Farran Behavioral Rating Scales (CFBS): Work-Related Skills
The Work-Related Skills subscale of the Cooper-Farran Behavioral Rating Scales is a 16-item survey based on a seven-point Likert scale.10 Teachers rated children on their ability to stay on task during school-related activities. The score for each child was calculated as the average of the survey items. Internal consistency is high (Cronbach’s α = 0.93-0.95). This measure was collected from preschool and kindergarten teachers.
Children’s Knowledge of Emotions, Social Problem-Solving Skills, and Social Behaviors
Facial Emotions Identification Task
The Facial Emotions Identifications Task was used to assess children’s knowledge of emotions.11 For each trial, children are presented with a page showing a picture of happy, sad, mad, and scared facial expressions and asked to identify a specified emotion by pointing at one of the four pictures in the page. For example, when the assessor asks the child to identify a happy emotion, the child is expected to point at the happy facial expression. A total of 16 items are sequentially presented to children (the order of facial expressions is different for each page), with a total of 4 items for each emotion. The final score is the proportion of answers that are correct. Children completed this task during preschool.
10Cooper and Farran (1991). 11Ribordy, Camras, Stefani, and Spaccarelli (1988).
Appendix Table D.3 (continued)
SOURCE: MDRC calculations based on the teachers' reports.
NOTES: This analysis was based on 3-year-olds and 4-year-olds from the study sample.The exploratory factor analysis (EFA) was conducted using the full sample. A promax rotation, three-factor
structure was used to identify subscales. Factor loadings greater than or equal to |.30| are shown. The set of items included in each factor was based on the items’ factor loadings and on theory. An EFA using a varimax rotation was also conducted and results were very similar.
ªAll items in this table were rescaled and reversed.bThis item was dropped from the teacher-reported version of this measure because of a high number of
missing values.cThis item was dropped from the teacher-reported version of this measure because it double-loads and is not
theoretically convergent with the other items.
154
Emotion Situations Task
The Emotions Situations Task was also used to assess children’s knowledge of emo-tions.12 Children listen to 16 stories describing characters in emotionally evocative situations and after each story they are presented with a page of four facial expressions (showing happy, sad, mad, and scared faces). For each story, children are asked to point to the expression that best represents how they feel about the story. A total of 16 stories are presented — 4 stories for each emotion. The final score is the proportion of answers that are correct. Children completed this task during preschool.
Challenging Situations Task
The Challenging Situations Task was used to assess children’s social problem-solving skills.13 Children are presented with pictures of four peer scenarios (a peer knocking down the focal child’s blocks, a peer hitting the focal child, the focal child entering a group, and a peer taking a ball from the focal child). The stories focus on peer entry and peer provocation, both challenging situations likely to elicit an emotional response from young children. After each scenario, children are asked what they would do in the situation. Two of the scenarios ask children to choose from a set of possible responses, while the other two scenarios require open-ended responses.
The open-ended responses are coded as competent (appropriately asserting oneself or calmly negotiating a solution), aggressive (responding with verbal or physical antagonism, intimidation, or force), adult intervention (telling the teacher), emotion labeling (for example, feeling angry), or inept (passive avoidance). Each open-ended situation allows for four possible responses (the child’s first response is coded for up to two clauses, and then the assessor asks what else the child would do, and that response is also coded for up to two clauses). The close-ended responses correspond with the competent, aggressive, and adult intervention categories. Therefore, the child has a total of 10 opportunities to provide an aggressive response and 10 opportunities to provide a competent response. For competent and aggressive responses, the number of responses in each category is summed so that the resulting variables range from 0 to 10. Children were given this assessment in preschool.
Social Skills Rating System (SSRS)
The Social Skills Rating System (SSRS)—Social Skills Scale measures children’s abil-ity to cooperate with others, assert themselves to solve conflicts with peers, and regulate their
12Garner, Jones, and Miner (1994). 13Denham and Bouril (1994).
155
own behavior.14 Preschool teachers, kindergarten teachers, and parents reported on how often the child displayed these social skills. The teacher-reported SSRS is a 30-item survey based on a three-point Likert scale. The total score was calculated as the sum of these 30 items and was internally consistent (Cronbach’s α = 0.95-0.96). The SSRS reported by parents at kindergarten follow-up includes only the cooperation and self-control subscales in a 20-item survey (also based on a three-point Likert scale), and the total score was also internally consistent (Cronbach’s α = 0.88). The three subscales for the teacher-reported SSRS — cooperation, assertion, and self-control — were calculated as the sum of the 10 items in each subscale. The subscales also showed high internal consistency (cooperation Cronbach’s α = 0.88-0.90, assertion Cronbach’s α = 0.88-0.89, and self-control Cronbach’s α = 0.91-0.93).
Cooper-Farran Behavioral Rating Scales (CFBS): Interpersonal Skills
The Interpersonal Skills subscale of the CFBS is a 21-item survey based on a seven-point Likert scale.15 The score for each child was calculated as the average of the survey items and showed high internal consistency (Cronbach’s α = 0.93-0.94). This measure was collected from preschool and kindergarten teachers.
Pre-Academic Skills
Woodcock-Johnson III (WJ-III): Letter-Word Identification
The Woodcock-Johnson Letter-Word Identification subscale was used to assess chil-dren’s pre-literacy and literacy skills.16 Children are asked to identify or read letters and words from a test page of choices. The level of difficulty of each item increases as children continue through the assessment. For example, in one of the first items the assessor asks the child to point to the letter “B” among a group of six letters. Later, the assessor asks the child to point to a word (for example, “dog”) from a list of words, and the words gradually become more complex (for example, “usually”). Raw scores were converted into standardized “W” scores using the software “WJ III NU Compuscore and Profiles Program” that used the child’s age, gender, language, and test date together with the raw score to calculate a standardized score based on U.S. population norms. Children completed this assessment in preschool.
14Gresham and Elliot (1990). 15Cooper and Farran (1991). 16Woodcock, McGrew, and Mather (2001).
156
WJ-III: Applied Problems
The Applied Problems subscale of the WJ-III was used to assess children’s math skills.17 Children are asked to identify numbers and quantities and engage in basic math tasks (addition and subtraction). The assessment starts with the assessor pointing to a picture showing a dog and a cup and asking the child, “How many dogs are there in this picture?” As children continue answering correctly, the items become gradually more complex. For example, children are shown a picture of six flowers and asked, “If you picked three of these flowers, how many flowers would be left?” Like the Letter-Word Identification subscale, raw scores were convert-ed into standardized “W” scores using the “WJ III NU Compuscore and Profiles Program” software. Children completed this assessment in preschool.
Expressive One-Word Picture Vocabulary Test (EOWPVT)
The EOWPVT was used to assess children’s vocabulary in English and Spanish.18 In this task children are asked to produce the word that best describes pictures they are shown (for example, “computer”), and the words gradually become more difficult as the child answers questions correctly (for example, “fireplace”). Children were identified by the teacher or the assessor as Spanish-speaking, and Spanish-speaking children were assessed using the bilingual EOWPVT, in which children could answer in either English or Spanish. The bilingual EOWPVT allows for the use of dialectical synonyms, while the English version does not allow for synonyms as answers. The raw scores were converted into standard scores using norms published in the EOWPVT manual, based on each child’s language and age.19 This assessment was given to children during preschool.
Academic Rating Scale (ARS)
The ARS assesses children’s early language and literacy, math, and general knowledge skills.20 It is a 21-item survey based on a five-point Likert scale, and scores are averages across the survey items in the scale or subscale. The literacy subscale includes questions about whether children use complex sentence structures (for example, “If she had brought her umbrella, she wouldn’t have gotten wet”), can produce rhyming words, and can predict what will happen next in stories by using the pictures and storyline for cues. The mathematical thinking subscale includes questions about whether children can sort, classify, and compare math materials by various rules and attributes, order a group of objects, and show an understanding of the relation-
17Woodcock, McGrew, and Mather (2001). 18Brownell (2000). 19In a few cases the final scores were below or above thresholds in the norms tables, and more specifically
below 55 or above 145. In these cases scores below the threshold of 55 were assigned a standardized score of 50 and scores above the threshold of 145 were assigned a standardized score of 150.
20National Center for Education Statistics (n.d.).

157
ship between quantities. The general knowledge subscale includes questions about whether children can explain their observations and explorations, and recognize, classify, and compare habits and living patterns. The total score and all three subscales showed internal consistency (total score Cronbach’s α = 0.97-0.98, language and literacy Cronbach’s α = 0.94-0.95, mathe-matical thinking Cronbach’s α = 0.95-0.97, and general knowledge Cronbach’s α = 0.94-0.96). Preschool and kindergarten teachers completed this measure.
Academic Skills Ratings
Kindergarten teachers were asked to rate children’s skills in three domains compared with other children at the same grade level: (1) language and literacy, (2) science and social studies, and (3) mathematics. Each domain consisted of one survey question, and responses ranged from 1 (far below average) to 5 (far above average).
Teacher Characteristics
Race and Ethnicity
Race and ethnicity were coded into four mutually exclusive categories: (1) Hispanic (teacher indicated she was of Spanish, Hispanic, or Latino origin, regardless of race), (2) non-Hispanic white, (3) non-Hispanic black or African-American, and (4) non-Hispanic other (American Indian or Alaska Native; Asian; native Hawaiian or Pacific Islander; or multiracial).
Emotion Coaching
Emotion coaching was defined as teachers’ ability to positively support children’s navi-gation of negative or difficult emotions. Five items from the short version of the emotion coaching subscale of the Emotion-Related Parenting Styles Self-Test were included on the teacher self-survey.21 At baseline, lead teachers responded to questions such as “When a child in my classroom is sad, we sit down to talk over the sadness” and “When a child in my classroom gets angry, my goal is to get him/her to stop.” One item, “When my child gets angry, it’s time to solve a problem,” had a low correlation with the full scale (0.42 in cohort 1 and 0.27 in cohort 2) and was dropped from the subscale. The remaining four items showed high internal con-sistency (Cronbach’s α = 0.84-0.86).
21Hakim-Larson et al. (2006).

158
Maslach Burnout Inventory (MBI): Emotional Exhaustion Subscale
Lead teachers’ rating of emotional exhaustion and overextension at work was assessed using the Maslach Burnout Inventory educator rating scale.22 Teachers rated nine items on a scale of 0 to 6. The scale was internally consistent (Cronbach’s α = 0.90-0.91). The overall score was a sum of the nine items and ranged from 0 to 54.
Kessler Psychological Distress Scale (K-6)
The Kessler Psychological Distress Scale includes six questions that ask teachers about their emotional state.23 The survey responses were collected on a scale from 1 (none of the time) to 5 (all of the time) and rescaled to a range from 0 (none of the time) to 4 (all of the time). The scale was internally consistent (Cronbach’s α = 0.72-0.82). The individual items were summed, producing an overall score ranging from 0 to 24. Low scores indicate low levels of psychologi-cal distress, and high scores indicate high levels of psychological distress. Example questions include “During the last 30 days, about how often do you feel nervous?” and “During the last 30 days, about how often do you feel worthless?” Lead teachers in Head Start CARES generally rated themselves as having low distress, reporting psychological distress of 3.01 at baseline and 2.73 at first follow-up.
Views on Social-Emotional Development
Teachers responded to a question about the relative value they placed on “academic readiness” and “social-emotional readiness.” Teachers were considered to have an academic focus if they valued children’s academic readiness a lot more or a little more than social-emotional readiness. Teachers were considered to have a neutral focus if they valued academic readiness as much as social-emotional readiness. Teachers were considered to have a social-emotional focus if they valued academic readiness a little less or a lot less than social-emotional readiness.
Kindergarten School Environment
Teacher-Reported School Environment
Kindergarten teachers were asked about their perceptions of their school environment using items from the School-Level Environment Questionnaire (SLEQ), Actual Form. The survey instrument includes (1) the student support subscale of the SLEQ, which assesses teachers’ perceptions of student behavior and student-staff relationships; (2) two questions from the
22Maslach, Jackson, and Leiter (1996). 23Kessler et al. (2003).

159
resource adequacy subscale, which assesses teachers’ perceptions of the adequacy of resources to which they had access; and (3) four questions from the work pressure subscale, which assesses teachers’ perceptions of the sources of work stress in their school environment. Scores on all items range from 1 to 5 and the final score is an average of the items in the subscale. All three subscales showed adequate internal consistency (student support Cronbach’s α = 0.83, resource adequacy Cronbach’s α = 0.72, and work pressure Cronbach’s α = 0.86).
Parent-Reported School Safety
During the kindergarten year, parents reported about their experiences with safety at their children’s current school. The school safety subscale was adapted from a CSRP student connections survey and Wyoming Survey Analysis Center (WYSAC) parent safety survey, and asks respondents to agree or disagree with statements such as, “Students are often threatened or bullied at my child’s school” and “My child’s school is a safe place.”24 Scores on all items range from 1 to 5 and the final score is an average of the items in the subscale. Both the general environment subscale and the school safety subscale were internally consistent (Cronbach’s α = 0.83 and 0.72, respectively).
Other Child Outcomes in Kindergarten
Child Retention
Kindergarten teachers were asked whether they expected that each child would be re-tained in kindergarten or promoted to the next grade level.
Receipt of Special Services
Kindergarten teachers indicated whether children received any of the following special services: speech or language therapy, occupational therapy, or mental health consultation.
Receipt of Special Education Services
At kindergarten follow-up, parents were asked “Does [CHILD] receive special educa-tion services?”
24For the CSRP (formerly called the Chicago School Readiness Project) student connections survey, see
Bierman, Greenberg, and CPPRG (1996). For the WYSAC parent safety survey see Canen, Anatchakova, and Furgeson (2007).

160
Family Baseline Characteristics
Monthly Income
Parents were asked the total income of all members of the household (including them-selves) from all sources in the last month.
Lives in Transient Housing
Parents were asked what type of housing the family lived in. Emergency housing, tem-porary housing, and living with friends or relatives were considered transient housing, while owning or renting a home or apartment were not.

Appendix E
Selected Characteristics for Kindergarten Lead Teacher Sample

THIS PAGE INTENTIONALLY LEFT BLANK

163
Characteristic Full Sample
Age (years) 40.84
Race and ethnicity (%)White, non-Hispanic 62.40African-American, non-Hispanic 9.18Hispanic 23.05Other/multiraciala 5.37
More than a bachelor's degree (%) 63.20
Teaching experience (%)< 3 years 12.823 to < 10 years 34.59≥ 10 years 52.59
Sample sizeb
Teachers 1,081
Head Start CARES Demonstration
Appendix Table E.1
Selected Characteristics for Kindergarten Lead Teacher Sample
SOURCE: MDRC calculations based on the teachers' reports.
NOTES: a“Other” includes Asian, Native Hawaiian/Pacific Islander, and American Indian/Alaska Native.
bFor all variables in the table, data are available for at least 94 percent of the sample.

THIS PAGE INTENTIONALLY LEFT BLANK
Appendix F
Baseline Characteristics of Children in the Head Start CARES Sample

THIS PAGE INTENTIONALLY LEFT BLANK

167
StandardCharacteristica Mean Deviation
Executive function (direct assessment)Head-to-Toes (0-10) 2.18 3.46Pencil Tap (0-1) 0.44 0.35
Behavior problems (teacher report) Total score (0-52) 6.46 8.84
Externalizing (0-22) 2.99 4.59Internalizing (0-20) 1.64 2.86Hyperactivity (0-10) 1.82 2.44
Learning behaviors (teacher report)Work-related scale (1-7) 4.85 1.06
Emotion knowledge (direct assessment)Facial emotions identification (0-1) 0.60 0.24Emotions situations identification (0-1) 0.38 0.17
Social problem-solving (direct assessment)Challenging Situations competent response (0-10) 1.42 1.17Challenging Situations aggressive response (0-10) 1.04 1.22
Social behaviors (teacher report)Social Skills Rating Scale (0-60) 41.28 11.64Interpersonal skills (1-7) 5.44 0.99
Pre-academic skills (direct assessment) Woodcock-Johnson - Letter-Word Identification (mean = 332)b 315.16 24.87Woodcock-Johnson - Applied Problems (mean = 399)c 397.54 31.84Expressive One-Word Picture Vocabulary Test (50-150) 84.67 15.21
Pre-academic skills (teacher report)General knowledge (1-5) 2.57 0.98Language and literacy (1-5) 2.33 0.92Mathematical thinking (1-5) 2.25 0.94
Sample sized
Children 2,114(continued)
Head Start CARES Demonstration
Appendix Table F.1
Baseline Characteristics for Head Start CARES Child Sample

168
Appendix Table F.1 (continued)
SOURCES: MDRC calculations based on direct assessments and teachers' reports.
NOTES: Rounding may cause slight discrepancies in sums and differences.aThe rating scale for each outcome except for the Woodcock-Johnson is shown in
parentheses, from low to high.bThe mean indicated is the national average for 4-year-olds on the Letter-Word
Identification subtest of the Woodcock-Johnson III.cThe mean indicated is the national average for 4-year-olds on the Applied Problems
subtest of the Woodcock-Johnson III.dFor all teacher-reported variables in the table, data are available for at least 94
percent of the sample. For all directly assessed variables in the table, data are available for between 84 and 92 percent of the sample.

Appendix G
Correlations Between Study Measures

THIS PAGE INTENTIONALLY LEFT BLANK

171
TSRS DomainaEmotional
SupportClassroom
OrganizationInstructional
SupportClassroom management 0.83 0.83 0.60Social-emotional instruction 0.49 0.39 0.55Scaffolding 0.35 0.36 0.52Sample sizec
Classrooms 307
Head Start CARES Demonstration
Appendix Table G.1
Baseline Correlations Between Adapted TSRS and CLASS Domains
CLASS Domainb
SOURCE: MDRC calculations based on the observational assessments.
NOTES: aTSRS is Teaching Style Rating Scale.bCLASS is Classroom Assessment Scoring System.cFor all variables in this table, data are available for 98 percent of the sample.

172
Literacy Focus
TSRS Domain/ItemaPositive Climate
Negative Climate
Teacher Sensitivity
Regard for Student
PerspectivesBehavior
ManagementPro-
ductivity
Instructional Learning Formats
Concept Develop-
mentQuality of Feedback
Language Modeling
Literacy Focus
ClassroommanagementConsistency/routine 0.66 -0.61 0.67 0.46 0.77 0.59 0.56 0.38 0.45 0.42 0.25Preparedness 0.70 -0.58 0.71 0.53 0.74 0.71 0.63 0.40 0.49 0.47 0.22Classroom awareness 0.68 -0.65 0.73 0.48 0.74 0.59 0.54 0.31 0.42 0.45 0.21Positive behavior
management 0.67 -0.55 0.62 0.53 0.69 0.56 0.57 0.45 0.55 0.54 0.28Negative behavior
management -0.49 0.73 -0.57 -0.46 -0.60 -0.32 -0.33 -0.25 -0.34 -0.36 -0.15Attention/
engagement 0.51 -0.36 0.60 0.56 0.56 0.46 0.57 0.44 0.55 0.55 0.17
Social-emotional instructionEmotion modeling 0.32 -0.17 0.36 0.34 0.28 0.25 0.38 0.45 0.43 0.46 0.20Emotion expression 0.35 -0.21 0.45 0.43 0.30 0.25 0.37 0.41 0.42 0.45 0.16Emotion regulation 0.29 -0.12 0.32 0.35 0.18 0.17 0.26 0.42 0.37 0.41 0.19Social awareness 0.37 -0.18 0.41 0.45 0.28 0.27 0.34 0.49 0.54 0.53 0.19Social problem-
solving 0.34 -0.16 0.39 0.44 0.28 0.26 0.29 0.44 0.48 0.47 0.16Provision of
interpersonal support 0.30 -0.18 0.41 0.36 0.30 0.27 0.31 0.39 0.34 0.32 0.14
Head Start CARES Demonstration
Appendix Table G.2
Baseline Correlations Between Adapted TSRS and CLASS Items
(continued)
CLASS Domain/Itemb
Emotional Support Classroom Organization Instructional Support

173
ScaffoldingScaffolding
dramatic play 0.27 -0.18 0.31 0.31 0.32 0.22 0.38 0.46 0.46 0.37 0.20Scaffolding peer
interaction 0.25 -0.17 0.33 0.33 0.34 0.19 0.37 0.52 0.53 0.45 0.24Sample sizec
Classrooms 307
Appendix Table G.2 (continued)
SOURCE: MDRC calculations based on the observational assessments.
NOTES: aTSRS is Teaching Style Rating Scale.bCLASS is Classroom Assessment Scoring System.cFor all variables in this table, data are available for 73 percent of the sample.

Learning Behaviors
Head-to-Toes
Pencil Tap
Behavior Problems (Total Score) Externalizing Hyperactivity Internalizing
Work-Related Skills
Executive functionHead-to-Toes 1Pencil Tap 0.38 1
Behavior problems Behavior problems -0.03 -0.12 1(total score)
Externalizing -0.02 -0.09 0.94 1Hyperactivity -0.05 -0.17 0.87 0.77 1Internalizing -0.02 -0.07 0.83 0.65 0.62 1
Learning behaviorsWork-related skills 0.10 0.27 -0.59 -0.54 -0.66 -0.40 1
Sample sizea
Children 2,114
Head Start CARES Demonstration
Appendix Table G.3
Baseline Correlations Between Measures of Behavior Regulation and Executive Function
Outcome
Executive Function Behavior Problems
SOURCES: MDRC calculations based on the direct assessments and teachers' reports.
NOTE: aFor all variables in this table, data are available for 88 percent of the sample.
174

OutcomeFacial Emotions
IdentificationSituations Emotions
IdentificationChallenging Situations
Competent ResponseChallenging Situations
Aggressive ResponseSocial Skills Rating Scale
Interpersonal Skills
Emotion knowledgeFacial emotions identification 1Situations emotions identification 0.49 1
Social problem-solvingChallenging Situations competent 0.13 0.13 1
responseChallenging Situations aggressive -0.06 -0.03 -0.18 1
response
Social behaviorsSocial Skills Rating Scale 0.18 0.15 0.09 -0.07 1Interpersonal skills 0.11 0.07 0.08 -0.13 0.59 1
Sample sizea
Children 2,114
Emotion Knowledge Social Problem-Solving Social Behaviors
Head Start CARES Demonstration
Appendix Table G.4
Baseline Correlations Between Measures of Emotion Knowledge, Social Problem-Solving, and Social Skills
SOURCES: MDRC calculations based on the direct assessments and teachers' reports.
NOTE: aFor all variables in this table, data are available for 81 percent of the sample.
175

176
OutcomeLetter-Word
IdentificationApplied
Problems
Expressive One-Word Picture
Vocabulary TestGeneral
KnowledgeLanguage and
LiteracyMathematical
ThinkingDirect assessmentWoodcock-Johnson - Letter-Word
Identification 1Woodcock-Johnson - Applied
Problems 0.29 1Expressive One-Word Picture
Vocabulary Test 0.31 0.22 1
Teacher reportGeneral knowledge 0.21 0.26 0.08 1Language and literacy 0.33 0.32 0.10 0.81 1Mathematical thinking 0.25 0.24 0.05 0.83 0.81 1Sample sizea
Children 2,114
Academic Rating ScaleDirect Assessment Teacher Report
Head Start CARES Demonstration
Appendix Table G.5
Baseline Correlations Between Academic Skills
Woodcock-Johnson
SOURCES: MDRC calculations based on the direct assessments and teachers' reports.
NOTE: aFor all variables in this table, data are available for 79 percent of the sample.

Appendix H
Model Specifications

THIS PAGE INTENTIONALLY LEFT BLANK

179
The following two-level model with fixed-effects dummy variables for the block level was used for the preschool classroom and teacher outcomes:
Level 1: Classrooms in centers
µββ kcj
jkcjckc WY ++= ∑>0
0
Level 2: Centers
υγβ ccb
bcc TZ ++= Π∑=
26
10
Reduced-form two-level model for student outcomes:
υµβγ ckcj
jkcjcb
bckc WTZY ++++= ∑Π∑>= 0
26
1
Where:
Y kc = the outcome for classroom k in center c
W jkc = baseline characteristic j for classroom k in center c
Z bc = an indicator variable for random assignment block b
T c = the treatment indicator, which equals one if center c was randomized to treatment (an intervention) and zero if it was randomized to control status
µ kc = a random error for classroom k in center c that is independently and identical-ly distributed across classrooms in centers
υ c = a random error for center c that is independently and identically distributed across centers

180
The following three-level model was used for the preschool child outcomes:1
Level 1: Students in classrooms
εαα skci
iskcikcskc XY ++= ∑>0
0
Level 2: Classrooms in centers
µβα kcckc +=00
Level 3: Centers
υγβ ccb
bcc TZ ++= Π∑=
26
10
Reduced-form three-level model for student outcomes:
υµεαγ ckcskciskcicb
bcskc XTZY +++++= ∑Π∑=
26
1
Where:
Y skc = the outcome for student s from classroom k in center c
X iskc = baseline characteristic i for student s from classroom k in center c
Z bc = an indicator variable for random assignment block b
T c = the treatment indicator, which equals one if center c was randomized to treatment (an intervention) and zero if it was randomized to control status
ε skc = a random error for student s from classroom k in center c that is independent-ly and identically distributed across students in classrooms
1As described in Chapter 3, the level 2 model used to estimate impacts on the kindergarten outcomes was
slightly different: µββα kcj
jldjckc V ++= ∑>0
00 , where V jld = baseline characteristic j for
kindergarten teacher l in school d.

181
µ kc = a random error for classroom k in center c that is independently and identical-ly distributed across classrooms in centers
υ c = a random error for center c that is independently and identically distributed across centers

THIS PAGE INTENTIONALLY LEFT BLANK

Appendix I
Impacts on Children’s Social-Emotional Skills: Detailed Impacts for the Emotion Recognition
and Challenging Situation Tasks

THIS PAGE INTENTIONALLY LEFT BLANK

185
Control Program Difference Program Difference Program DifferenceGroup Group (IY vs. Effect Group (PATHS vs. Effect Group (Tools vs. Effect
Outcomea Mean Mean Control) SE Sizeb Mean Control) SE Sizeb Mean Control) SE Sizeb
Direct assessmentsFacial emotions identification (0-1) 0.71 0.74 0.03 ** 0.01 0.13 0.77 0.06 *** 0.01 0.29 0.73 0.03 ** 0.01 0.12
Child incorrectly answered:
Happy (0-12) 0.42 0.41 -0.01 0.07 -0.01 0.34 -0.08 0.07 -0.06 0.34 -0.08 0.07 -0.06Mad (0-12) 1.97 1.48 -0.49 *** 0.13 -0.24 1.22 -0.76 *** 0.13 -0.36 1.65 -0.32 ** 0.13 -0.16Scared (0-12) 0.99 0.96 -0.02 0.08 -0.02 0.83 -0.16 ** 0.08 -0.14 0.95 -0.04 0.08 -0.03Sad (0-12) 1.09 1.25 0.15 * 0.08 0.11 1.05 -0.05 0.08 -0.04 1.08 -0.01 -0.01
Child correctly answered:
Happy (0-4) 3.39 3.42 0.03 0.06 0.03 3.53 0.13 ** 0.06 0.14 3.49 0.09 0.06 0.10Mad (0-4) 3.14 3.23 0.09 0.08 0.07 3.29 0.14 * 0.08 0.11 3.21 0.07 0.08 0.05Scared (0-4) 1.82 2.13 0.32 *** 0.09 0.21 2.48 0.66 *** 0.10 0.45 2.13 0.31 *** 0.09 0.21Sad (0-4) 3.01 3.03 0.01 0.08 0.01 3.13 0.12 0.08 0.09 3.00 -0.01 0.08 -0.01
Sample sizec
Children 621 702 669 678
The Incredible Years (IY) Preschool PATHS Tools of the Mind
Head Start CARES Demonstration
Appendix Table I.1
Child-Level Impacts at Preschool Follow-Up: Emotions Identification Task
SOURCE: MDRC calculations based on the direct assessments.
NOTES: Statistical significance levels are indicated as follows: *** = 1 percent; ** = 5 percent; * = 10 percent.Rounding may cause slight discrepancies in sums and differences.SE represents standard error.aThe rating scale for each outcome except is shown in parentheses, from low to high.bEffect size is calculated by dividing the impact of the program (the difference between the means for the program group and the control group) by the
standard deviation for the control group.cFor all variables in the table, data are available for at least 96 percent of the sample.
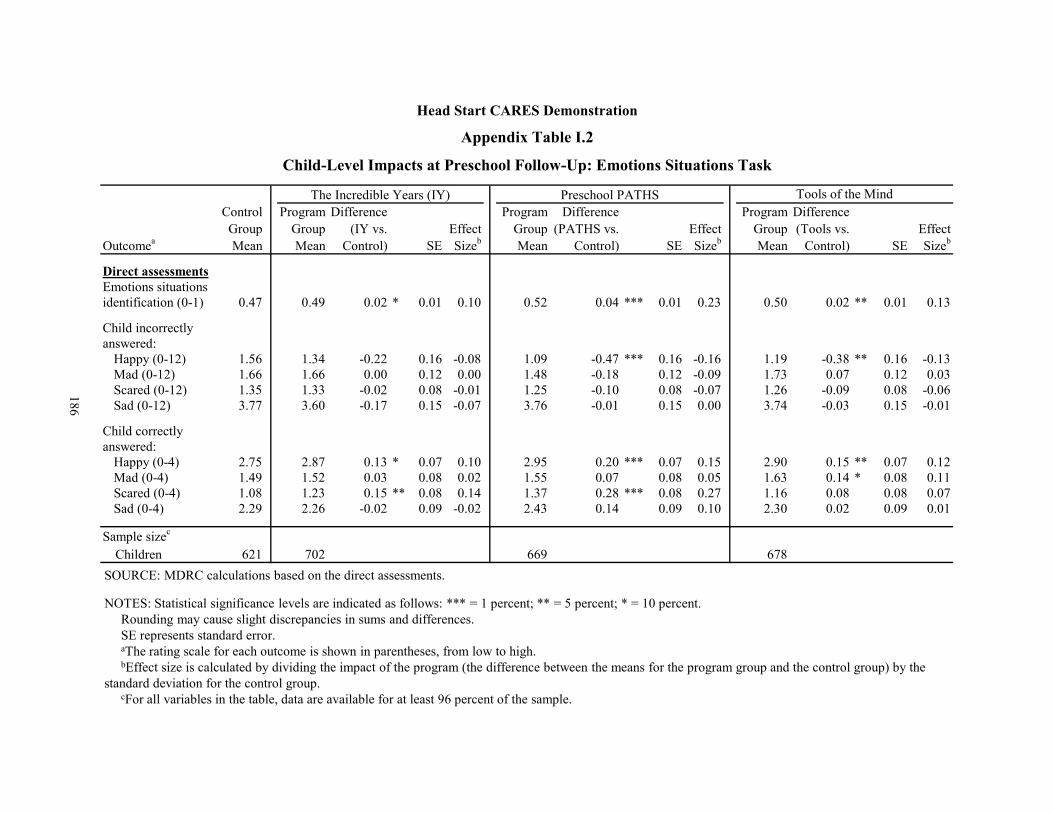
Control Program Difference Program Difference Program DifferenceGroup Group (IY vs. Effect Group (PATHS vs. Effect Group (Tools vs. Effect
Outcomea Mean Mean Control) SE Sizeb Mean Control) SE Sizeb Mean Control) SE Sizeb
Direct assessmentsEmotions situationsidentification (0-1) 0.47 0.49 0.02 * 0.01 0.10 0.52 0.04 *** 0.01 0.23 0.50 0.02 ** 0.01 0.13
Child incorrectly answered:
Happy (0-12) 1.56 1.34 -0.22 0.16 -0.08 1.09 -0.47 *** 0.16 -0.16 1.19 -0.38 ** 0.16 -0.13Mad (0-12) 1.66 1.66 0.00 0.12 0.00 1.48 -0.18 0.12 -0.09 1.73 0.07 0.12 0.03Scared (0-12) 1.35 1.33 -0.02 0.08 -0.01 1.25 -0.10 0.08 -0.07 1.26 -0.09 0.08 -0.06Sad (0-12) 3.77 3.60 -0.17 0.15 -0.07 3.76 -0.01 0.15 0.00 3.74 -0.03 0.15 -0.01
Child correctly answered:
Happy (0-4) 2.75 2.87 0.13 * 0.07 0.10 2.95 0.20 *** 0.07 0.15 2.90 0.15 ** 0.07 0.12Mad (0-4) 1.49 1.52 0.03 0.08 0.02 1.55 0.07 0.08 0.05 1.63 0.14 * 0.08 0.11Scared (0-4) 1.08 1.23 0.15 ** 0.08 0.14 1.37 0.28 *** 0.08 0.27 1.16 0.08 0.08 0.07Sad (0-4) 2.29 2.26 -0.02 0.09 -0.02 2.43 0.14 0.09 0.10 2.30 0.02 0.09 0.01
Sample sizec
Children 621 702 669 678
Head Start CARES Demonstration
Appendix Table I.2
Child-Level Impacts at Preschool Follow-Up: Emotions Situations Task
The Incredible Years (IY) Preschool PATHS Tools of the Mind
SOURCE: MDRC calculations based on the direct assessments.
NOTES: Statistical significance levels are indicated as follows: *** = 1 percent; ** = 5 percent; * = 10 percent.Rounding may cause slight discrepancies in sums and differences.SE represents standard error.aThe rating scale for each outcome is shown in parentheses, from low to high.bEffect size is calculated by dividing the impact of the program (the difference between the means for the program group and the control group) by the
standard deviation for the control group.cFor all variables in the table, data are available for at least 96 percent of the sample.
186
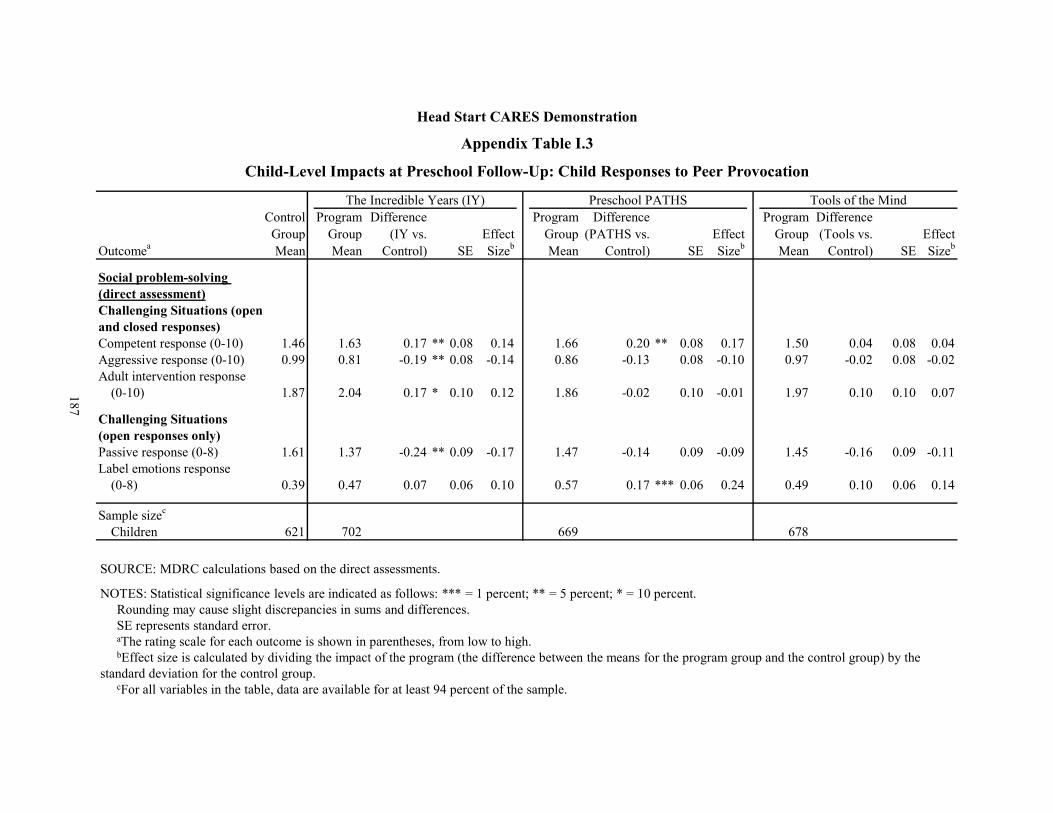
187
Control Program Difference Program Difference Program DifferenceGroup Group (IY vs. Effect Group (PATHS vs. Effect Group (Tools vs. Effect
Outcomea Mean Mean Control) SE Sizeb Mean Control) SE Sizeb Mean Control) SE Sizeb
Social problem-solving (direct assessment)Challenging Situations (open and closed responses)Competent response (0-10) 1.46 1.63 0.17 ** 0.08 0.14 1.66 0.20 ** 0.08 0.17 1.50 0.04 0.08 0.04Aggressive response (0-10) 0.99 0.81 -0.19 ** 0.08 -0.14 0.86 -0.13 0.08 -0.10 0.97 -0.02 0.08 -0.02Adult intervention response
(0-10) 1.87 2.04 0.17 * 0.10 0.12 1.86 -0.02 0.10 -0.01 1.97 0.10 0.10 0.07
Challenging Situations (open responses only)Passive response (0-8) 1.61 1.37 -0.24 ** 0.09 -0.17 1.47 -0.14 0.09 -0.09 1.45 -0.16 0.09 -0.11Label emotions response
(0-8) 0.39 0.47 0.07 0.06 0.10 0.57 0.17 *** 0.06 0.24 0.49 0.10 0.06 0.14
Sample sizec
Children 621 702 669 678
Head Start CARES Demonstration
Appendix Table I.3
Child-Level Impacts at Preschool Follow-Up: Child Responses to Peer Provocation
The Incredible Years (IY) Preschool PATHS Tools of the Mind
SOURCE: MDRC calculations based on the direct assessments.
NOTES: Statistical significance levels are indicated as follows: *** = 1 percent; ** = 5 percent; * = 10 percent.Rounding may cause slight discrepancies in sums and differences.SE represents standard error.aThe rating scale for each outcome is shown in parentheses, from low to high.bEffect size is calculated by dividing the impact of the program (the difference between the means for the program group and the control group) by the
standard deviation for the control group. cFor all variables in the table, data are available for at least 94 percent of the sample.

THIS PAGE INTENTIONALLY LEFT BLANK

Appendix J
Subgroup Analyses: Differences in Preschool Impacts by Baseline Behavior Risk

THIS PAGE INTENTIONALLY LEFT BLANK

191
Control Difference Control Difference DifferenceGroup (IY vs. Standard Effect Group (IY vs. Standard Effect Between
Outcomea Mean Control) Error Sizeb Mean Control) Error Sizeb Subgroups Sig.
Executive function and behavior regulationExecutive function (direct assessment)Head-to-Toes (0-10) 4.90 -0.68 * 0.38 -0.16 4.07 -0.46 0.35 -0.11 -0.22Pencil Tap (0-1) 0.73 0.00 0.03 0.01 0.64 -0.02 0.03 -0.06 0.02
Behavior problems (teacher report)Total score (0-52) 1.80 1.07 0.74 0.28 9.28 -1.64 1.07 -0.18 2.71 ††
Externalizing (0-22) 0.88 0.12 0.33 0.06 4.75 -1.06 ** 0.52 -0.21 1.18 †Hyperactivity (0-10) 0.42 0.21 0.18 0.20 2.55 -0.48 * 0.27 -0.20 0.69 ††Internalizing (0-20) 0.50 0.70 ** 0.29 0.50 1.95 -0.13 0.37 -0.05 0.83 †
Learning behaviors (teacher report)Work-related skills (1-7) 5.62 0.14 0.11 0.18 4.69 0.17 0.11 0.16 -0.03
Social-emotional skillsEmotion knowledge (direct assessment)Facial emotions identification (0-1) 0.75 0.02 0.02 0.12 0.69 0.02 0.02 0.07 0.00Emotions situations identification (0-1) 0.51 -0.01 0.02 -0.03 0.47 0.03 0.02 0.14 -0.03
Social problem-solving (direct assessment)Challenging Situations
competent response (0-10) 1.64 0.03 0.14 0.02 1.41 0.09 0.13 0.08 -0.06Challenging Situations
aggressive response (0-10) 0.84 -0.20 * 0.11 -0.17 1.11 -0.13 0.13 -0.09 -0.08Social behaviors (teacher report)Social Skills Rating Scale (total score) (0-60) 49.73 1.82 1.18 0.21 41.36 2.68 ** 1.34 0.25 -0.85Interpersonal skills (1-7) 6.06 0.01 0.09 0.01 5.11 0.09 0.10 0.09 -0.08
(continued)
Head Start CARES Demonstration
Child-Level Impacts at Preschool Follow-Up, Differences by Baseline Behavior Risk: The Incredible Years (IY)Low Risk High Risk
Appendix Table J.1

Control Difference Control Difference DifferenceGroup (IY vs. Standard Effect Group (IY vs. Standard Effect Between
Outcomea Mean Control) Error Sizeb Mean Control) Error Sizeb Subgroups Sig.
Sample sizec
Centers 25 26Classrooms 58 72Children 193 242
Low Risk High Risk
Appendix Table J.1 (continued)
SOURCES: MDRC calculations based on the direct assessments and teachers' reports.
NOTES: Statistically significant differences between outcomes for the program and control groups are indicated as follows: *** = 1 percent; ** = 5 percent; * = 10 percent. The H-statistic test was used to test for statistically significant differences in impact estimates across different subgroups. Statistical significance levels (Sig.) are indicated as follows: ††† = 1 percent; †† = 5 percent; † = 10 percent.
Rounding may cause slight discrepancies in sums and differences.Children with total Behavior Problems Index (BPI) scores equal to or above the median total BPI score were included in the high-behavior-risk subgroup,
and children with total BPI scores below the median were included in the low-behavior-risk subgroup.aThe rating scale for each outcome is shown in parentheses, from low to high.bEffect size is calculated by dividing the impact of the program (the difference between the means for the program group and the control group) by the
standard deviation for the control group.cFor all variables in the table, data are available for at least 94 percent of the sample.
192

193
Control Difference Control Difference DifferenceGroup (PATHS vs. Standard Effect Group (PATHS vs. Standard Effect Between
Outcomea Mean Control) Error Sizeb Mean Control) Error Sizeb Subgroups Sig.
Executive function and behavior regulationExecutive function (direct assessment)Head-to-Toes (0-10) 4.90 -0.96 ** 0.39 -0.22 4.07 -0.13 0.35 -0.03 -0.83Pencil Tap (0-1) 0.73 0.03 0.03 0.12 0.64 0.01 0.03 0.03 0.02Behavior problems (teacher report)Total score (0-52) 1.80 -0.18 0.75 -0.05 9.28 -0.79 1.07 -0.09 0.61
Externalizing (0-22) 0.88 -0.25 0.33 -0.12 4.75 -0.54 0.52 -0.10 0.29Hyperactivity (0-10) 0.42 0.09 0.18 0.08 2.55 -0.33 0.27 -0.13 0.42Internalizing (0-20) 0.50 0.01 0.30 0.01 1.95 0.18 0.37 0.07 -0.17
Learning behaviors (teacher report)Work-related skills (1-7) 5.62 0.21 * 0.11 0.26 4.69 0.22 ** 0.11 0.21 -0.01Social-emotional skillsEmotion knowledge (direct assessment)Facial emotions identification (0-1) 0.75 0.04 ** 0.02 0.23 0.69 0.08 *** 0.02 0.32 -0.03Situations emotions identification (0-1) 0.51 0.04 ** 0.02 0.23 0.47 0.04 *** 0.02 0.24 0.00
Social problem-solving (direct assessment)Challenging Situations competent
response (0-10) 1.64 0.04 0.14 0.03 1.41 0.17 0.13 0.16 -0.13Challenging Situations aggressive
response (0-10) 0.84 -0.13 0.12 -0.11 1.11 -0.12 0.12 -0.09 -0.01Social behaviors (teacher report)Social Skills Rating Scale (total score) (0-60) 49.73 1.56 1.22 0.18 41.36 2.22 1.33 0.21 -0.65Interpersonal skills (1-7) 6.06 0.12 0.09 0.19 5.11 0.00 0.10 0.00 0.11
(continued)
Head Start CARES Demonstration
Child-Level Impacts at Preschool Follow-Up, Differences by Baseline Behavior Risk: Preschools PATHS
Low Risk High Risk
Appendix Table J.2
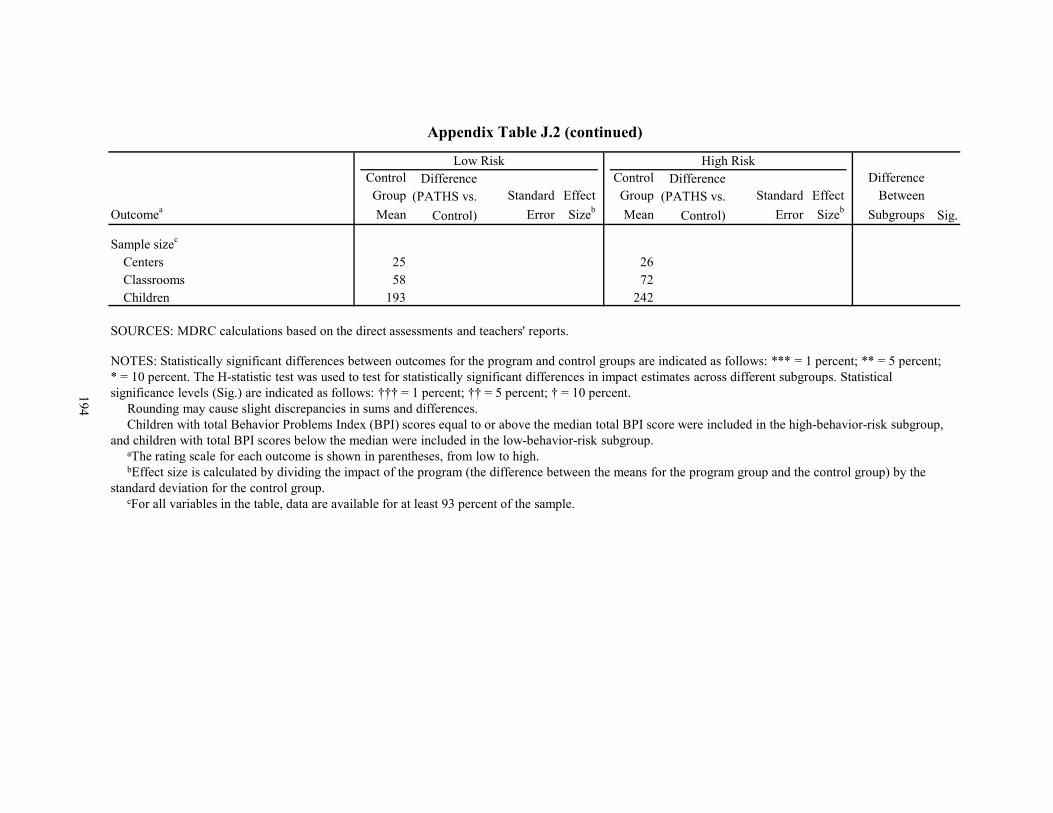
194
Control Difference Control Difference DifferenceGroup (PATHS vs. Standard Effect Group (PATHS vs. Standard Effect Between
Outcomea Mean Control) Error Sizeb Mean Control) Error Sizeb Subgroups Sig.
Sample sizec
Centers 25 26Classrooms 58 72Children 193 242
Low Risk High Risk
Appendix Table J.2 (continued)
SOURCES: MDRC calculations based on the direct assessments and teachers' reports.
NOTES: Statistically significant differences between outcomes for the program and control groups are indicated as follows: *** = 1 percent; ** = 5 percent; * = 10 percent. The H-statistic test was used to test for statistically significant differences in impact estimates across different subgroups. Statistical significance levels (Sig.) are indicated as follows: ††† = 1 percent; †† = 5 percent; † = 10 percent.
Rounding may cause slight discrepancies in sums and differences.Children with total Behavior Problems Index (BPI) scores equal to or above the median total BPI score were included in the high-behavior-risk subgroup,
and children with total BPI scores below the median were included in the low-behavior-risk subgroup.aThe rating scale for each outcome is shown in parentheses, from low to high.bEffect size is calculated by dividing the impact of the program (the difference between the means for the program group and the control group) by the
standard deviation for the control group.cFor all variables in the table, data are available for at least 93 percent of the sample.

195
Control Difference Control Difference DifferenceGroup (Tools vs. Standard Effect Group (Tools vs. Standard Effect Between
Outcomea Mean Control) Error Sizeb Mean Control) Error Sizeb Subgroups Sig.
Executive function and behavior regulationExecutive function (direct assessment)Head-to-Toes (0-10) 4.90 -0.15 0.39 -0.04 4.07 -0.59 * 0.35 -0.14 0.44Pencil Tap (0-1) 0.73 0.00 0.03 0.01 0.64 0.00 0.03 0.00 0.00
Behavior problems (teacher report)Total score (0-52) 1.80 0.76 0.74 0.20 9.28 0.00 1.05 0.00 0.76
Externalizing (0-22) 0.88 0.28 0.33 0.14 4.75 -0.11 0.51 -0.02 0.39Hyperactivity (0-10) 0.42 0.23 0.18 0.22 2.55 -0.02 0.27 -0.01 0.25Internalizing (0-20) 0.50 0.24 0.29 0.17 1.95 0.17 0.36 0.07 0.07
Learning behaviors (teacher report)Work-related skills (1-7) 5.62 0.00 0.11 0.00 4.69 0.14 0.11 0.13 -0.14Social-emotional skillsEmotion knowledge (direct assessment)Facial emotions identification (0-1) 0.75 0.00 0.02 0.01 0.69 0.04 * 0.02 0.15 -0.03Emotions situations identification (0-1) 0.51 0.02 0.02 0.08 0.47 0.03 0.02 0.14 -0.01
Social problem-solving (direct assessment)Challenging Situations competent
response (0-10) 1.64 -0.03 0.14 -0.02 1.41 0.02 0.13 0.02 -0.05Challenging Situations aggressive -0.01
response (0-10) 0.84 -0.03 0.12 -0.03 1.11 -0.02 0.12 -0.02
Social behaviors (teacher report)Social Skills Rating Scale (total score) (0-60) 49.73 -0.23 1.19 -0.03 41.36 0.85 1.32 0.08 -1.08Interpersonal skills (1-7) 6.06 -0.10 0.09 -0.15 5.11 0.06 0.10 0.05 -0.15
(continued)
Head Start CARES Demonstration
Child-Level Impacts at Preschool Follow-Up, Differences by Baseline Behavior Risk: Tools of the Mind
Low Risk High Risk
Appendix Table J.3

196
Control Difference Control Difference DifferenceGroup (Tools vs. Standard Effect Group (Tools vs. Standard Effect Between
Outcomea Mean Control) Error Sizeb Mean Control) Error Sizeb Subgroups Sig.
Sample sizec
Centers 25 26Classrooms 58 72Children 193 242
Low Risk High Risk
Appendix Table J.3 (continued)
SOURCES: MDRC calculations based on the direct assessments and teachers' reports.
NOTES: Statistically significant differences between outcomes for the program and control groups are indicated as follows: *** = 1 percent; ** = 5 percent; * = 10 percent. The H-statistic test was used to test for statistically significant differences in impact estimates across different subgroups. Statistical significance levels (Sig.) are indicated as follows: ††† = 1 percent; †† = 5 percent; † = 10 percent.
Rounding may cause slight discrepancies in sums and differences.Children with total Behavior Problems Index (BPI) scores equal to or above the median total BPI score were included in the high-behavior-risk subgroup,
and children with total BPI scores below the median were included in the low-behavior-risk subgroup.aThe rating scale for each outcome is shown in parentheses, from low to high.bEffect size is calculated by dividing the impact of the program (the difference between the means for the program group and the control group) by the
standard deviation for the control group.cFor all variables in the table, data are available for at least 94 percent of the sample.

Appendix K
Subgroup Analyses: Differences in Preschool Impacts by Gender

THIS PAGE INTENTIONALLY LEFT BLANK
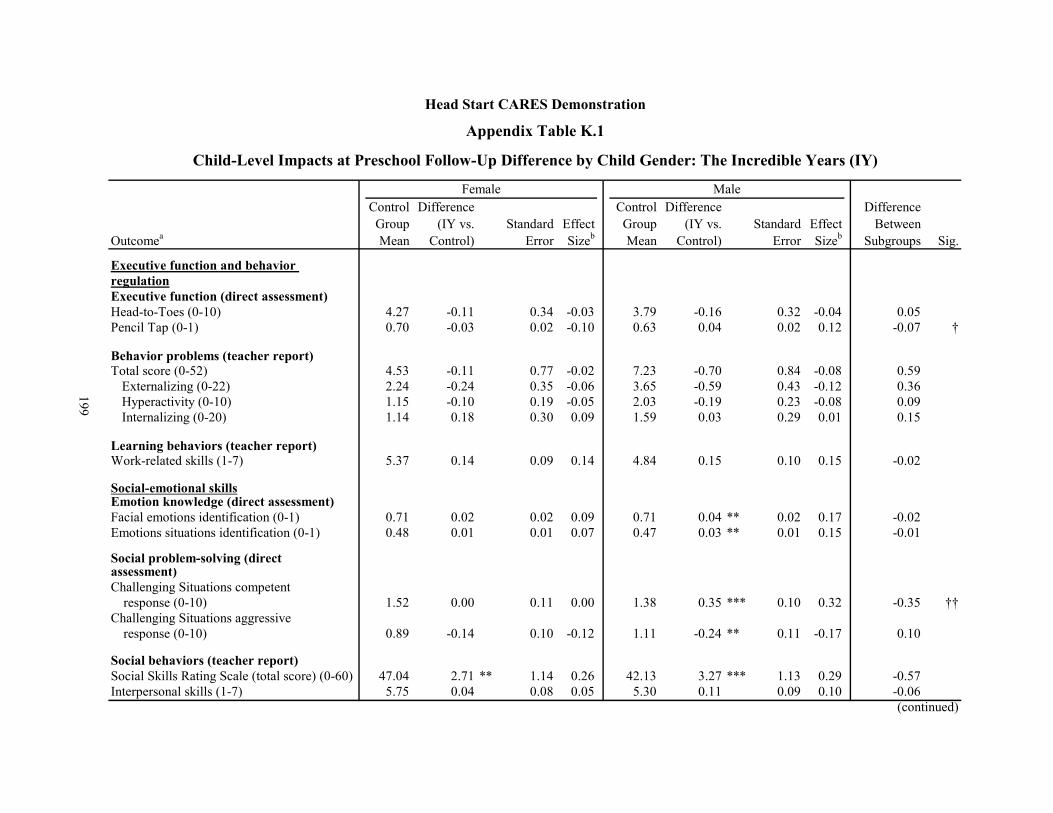
199
Control Difference Control Difference DifferenceGroup (IY vs. Standard Effect Group (IY vs. Standard Effect Between
Outcomea Mean Control) Error Sizeb Mean Control) Error Sizeb Subgroups Sig.
Executive function and behavior regulationExecutive function (direct assessment)Head-to-Toes (0-10) 4.27 -0.11 0.34 -0.03 3.79 -0.16 0.32 -0.04 0.05Pencil Tap (0-1) 0.70 -0.03 0.02 -0.10 0.63 0.04 0.02 0.12 -0.07 †
Behavior problems (teacher report)Total score (0-52) 4.53 -0.11 0.77 -0.02 7.23 -0.70 0.84 -0.08 0.59
Externalizing (0-22) 2.24 -0.24 0.35 -0.06 3.65 -0.59 0.43 -0.12 0.36Hyperactivity (0-10) 1.15 -0.10 0.19 -0.05 2.03 -0.19 0.23 -0.08 0.09Internalizing (0-20) 1.14 0.18 0.30 0.09 1.59 0.03 0.29 0.01 0.15
Learning behaviors (teacher report)Work-related skills (1-7) 5.37 0.14 0.09 0.14 4.84 0.15 0.10 0.15 -0.02
Social-emotional skillsEmotion knowledge (direct assessment)Facial emotions identification (0-1) 0.71 0.02 0.02 0.09 0.71 0.04 ** 0.02 0.17 -0.02Emotions situations identification (0-1) 0.48 0.01 0.01 0.07 0.47 0.03 ** 0.01 0.15 -0.01
Social problem-solving (direct assessment)Challenging Situations competent
response (0-10) 1.52 0.00 0.11 0.00 1.38 0.35 *** 0.10 0.32 -0.35 ††Challenging Situations aggressive
response (0-10) 0.89 -0.14 0.10 -0.12 1.11 -0.24 ** 0.11 -0.17 0.10
Social behaviors (teacher report)Social Skills Rating Scale (total score) (0-60) 47.04 2.71 ** 1.14 0.26 42.13 3.27 *** 1.13 0.29 -0.57Interpersonal skills (1-7) 5.75 0.04 0.08 0.05 5.30 0.11 0.09 0.10 -0.06
(continued)
Head Start CARES Demonstration
Child-Level Impacts at Preschool Follow-Up Difference by Child Gender: The Incredible Years (IY)
Female Male
Appendix Table K.1

200
Control Difference Control Difference DifferenceGroup (IY vs. Standard Effect Group (IY vs. Standard Effect Between
Outcomea Mean Control) Error Sizeb Mean Control) Error Sizeb Subgroups Sig.
Sample sizec
Centers 26 26Classrooms 70 76Children 308 313
Female Male
Appendix Table K.1
SOURCES: MDRC calculations based on the direct assessments and teachers' reports.
NOTES: Statistically significant differences between outcomes for the program and control groups are indicated as follows: *** = 1 percent; ** = 5 percent; * = 10 percent. The H-statistic test was used to test for statistically significant differences in impact estimates across different subgroups. Statistical significance levels (Sig.) are indicated as follows: ††† = 1 percent; †† = 5 percent; † = 10 percent.
Rounding may cause slight discrepancies in sums and differences.aThe rating scale for each outcome is shown in parentheses, from low to high.bEffect size is calculated by dividing the impact of the program (the difference between the means for the program group and the control group) by the
standard deviation for the control group.cFor all variables in the table, data are available for at least 94 percent of the sample.

201
Control Difference Control Difference DifferenceGroup (PATHS vs. Standard Effect Group (PATHS vs. Standard Effect Between
Outcomea Mean Control) Error Sizeb Mean Control) Error Sizeb Subgroups Sig.
Executive function and behavior regulationExecutive function (direct assessment)Head-to-Toes (0-10) 4.27 -0.21 0.34 -0.05 3.79 -0.31 0.32 -0.07 0.10Pencil Tap (0-1) 0.70 0.02 0.02 0.06 0.63 0.02 0.02 0.06 0.00
Behavior problems (teacher report)Total score (0-52) 4.53 0.17 0.77 0.02 7.23 -0.58 0.85 -0.07 0.75
Externalizing (0-22) 2.24 -0.07 0.35 -0.02 3.65 -0.44 0.44 -0.09 0.37Hyperactivity (0-10) 1.15 -0.06 0.19 -0.03 2.03 -0.16 0.23 -0.07 0.10Internalizing (0-20) 1.14 0.34 0.30 0.16 1.59 0.04 0.29 0.02 0.29
Learning behaviors (teacher report)Work-related skills (1-7) 5.37 0.17 * 0.09 0.18 4.84 0.21 ** 0.10 0.20 -0.04
Social-emotional skillsEmotion knowledge (direct assessment)Facial emotions identification (0-1) 0.71 0.06 *** 0.02 0.30 0.71 0.06 *** 0.02 0.26 0.00Emotions situations identification (0-1) 0.48 0.04 *** 0.01 0.25 0.47 0.04 *** 0.01 0.20 0.01
Social problem-solving (direct assessment)Challenging Situations competent
response (0-10) 1.52 0.14 0.11 0.12 1.38 0.26 ** 0.10 0.24 -0.12Challenging Situations aggressive
response (0-10) 0.89 -0.05 0.10 -0.04 1.11 -0.25 ** 0.11 -0.18 0.20
Social behaviors (teacher report)Social Skills Rating Scale (total score) (0-60) 47.04 1.84 1.14 0.18 42.13 2.57 ** 1.14 0.23 -0.74Interpersonal skills (1-7) 5.75 0.03 0.08 0.03 5.30 0.11 0.09 0.10 -0.08
(continued)
Head Start CARES Demonstration
Child-Level Impacts at Preschool Follow-Up, Differences by Child Gender: Preschool PATHS
Female Male
Appendix Table K.2

202
Control Difference Control Difference DifferenceGroup (PATHS vs. Standard Effect Group (PATHS vs. Standard Effect Between
Outcomea Mean Control) Error Sizeb Mean Control) Error Sizeb Subgroups Sig.
Sample sizec
Centers 26 26Classrooms 70 76Children 308 313
Female Male
Appendix Table K.2
SOURCES: MDRC calculations based on the direct assessments and teachers' reports.
NOTES: Statistically significant differences between outcomes for the program and control groups are indicated as follows: *** = 1 percent; ** = 5 percent; * = 10 percent. The H-statistic test was used to test for statistically significant differences in impact estimates across different subgroups. Statistical significance levels (Sig.) are indicated as follows: ††† = 1 percent; †† = 5 percent; † = 10 percent.
Rounding may cause slight discrepancies in sums and differences.aThe rating scale for each outcome is shown in parentheses, from low to high.bEffect size is calculated by dividing the impact of the program (the difference between the means for the program group and the control group) by the
standard deviation for the control group.cFor all variables in the table, data are available for at least 93 percent of the sample.

203
Control Difference Control Difference DifferenceGroup (Tools vs. Standard Effect Group (Tools vs. Standard Effect Between
Outcomea Mean Control) Error Sizeb Mean Control) Error Sizeb Subgroups Sig.
Executive function and behavior regulationExecutive function (direct assessment)Head-to-Toes (0-10) 4.27 0.20 0.34 0.05 3.79 -0.25 0.32 -0.06 0.45Pencil Tap (0-1) 0.70 -0.01 0.02 -0.02 0.63 0.01 0.02 0.02 -0.01
Behavior problems (teacher report)Total score (0-52) 4.53 0.26 0.77 0.04 7.23 0.05 0.85 0.01 0.22
Externalizing (0-22) 2.24 0.11 0.35 0.03 3.65 -0.12 0.44 -0.02 0.23Hyperactivity (0-10) 1.15 0.06 0.19 0.03 2.03 0.11 0.23 0.05 -0.05Internalizing (0-20) 1.14 0.13 0.30 0.06 1.59 0.03 0.29 0.01 0.10
Learning behaviors (teacher report)Work-related skills (1-7) 5.37 0.05 0.09 0.05 4.84 0.05 0.10 0.05 -0.01
Social-emotional skillsEmotion knowledge (direct assessment)Facial emotions identification (0-1) 0.71 0.04 ** 0.02 0.17 0.71 0.02 0.02 0.07 0.02Emotions situations identification (0-1) 0.48 0.02 0.01 0.13 0.47 0.02 * 0.01 0.13 0.00
Social problem-solving (direct assessment)Challenging Situations competent
response (0-10) 1.52 -0.11 0.11 -0.09 1.38 0.20 * 0.10 0.18 -0.31 ††Challenging Situations aggressive
response (0-10) 0.89 0.05 0.10 0.04 1.11 -0.10 0.11 -0.07 0.15
Social behaviors (teacher report)Social Skills Rating Scale (total score) (0-60) 47.04 0.70 1.13 0.07 42.13 1.04 1.14 0.09 -0.34Interpersonal skills (1-7) 5.75 0.05 0.08 0.06 5.30 0.01 0.09 0.01 0.04
(continued)
Head Start CARES Demonstration
Child-Level Impacts at Preschool Follow-Up, Differences by Child Gender: Tools of the Mind
Female Male
Appendix Table K.3

204
Control Difference Control Difference DifferenceGroup (Tools vs. Standard Effect Group (Tools vs. Standard Effect Between
Outcomea Mean Control) Error Sizeb Mean Control) Error Sizeb Subgroups Sig.
Sample sizec
Centers 26 26Classrooms 70 76Children 308 313
Female Male
Appendix Table K.3 (continued)
SOURCES: MDRC calculations based on the direct assessments and teachers' reports.
NOTES: Statistically significant differences between outcomes for the program and control groups are indicated as follows: *** = 1 percent; ** = 5 percent; * = 10 percent. The H-statistic test was used to test for statistically significant differences in impact estimates across different subgroups. Statistical significance levels (Sig.) are indicated as follows: ††† = 1 percent; †† = 5 percent; † = 10 percent.
Rounding may cause slight discrepancies in sums and differences.aThe rating scale for each outcome is shown in parentheses, from low to high.bEffect size is calculated by dividing the impact of the program (the difference between the means for the program group and the control group) by the
standard deviation for the control group.cFor all variables in the table, data are available for at least 94 percent of the sample.
Appendix L
Subgroup Analyses: PATHS Classroom and Teacher Impacts During Circle Time

THIS PAGE INTENTIONALLY LEFT BLANK
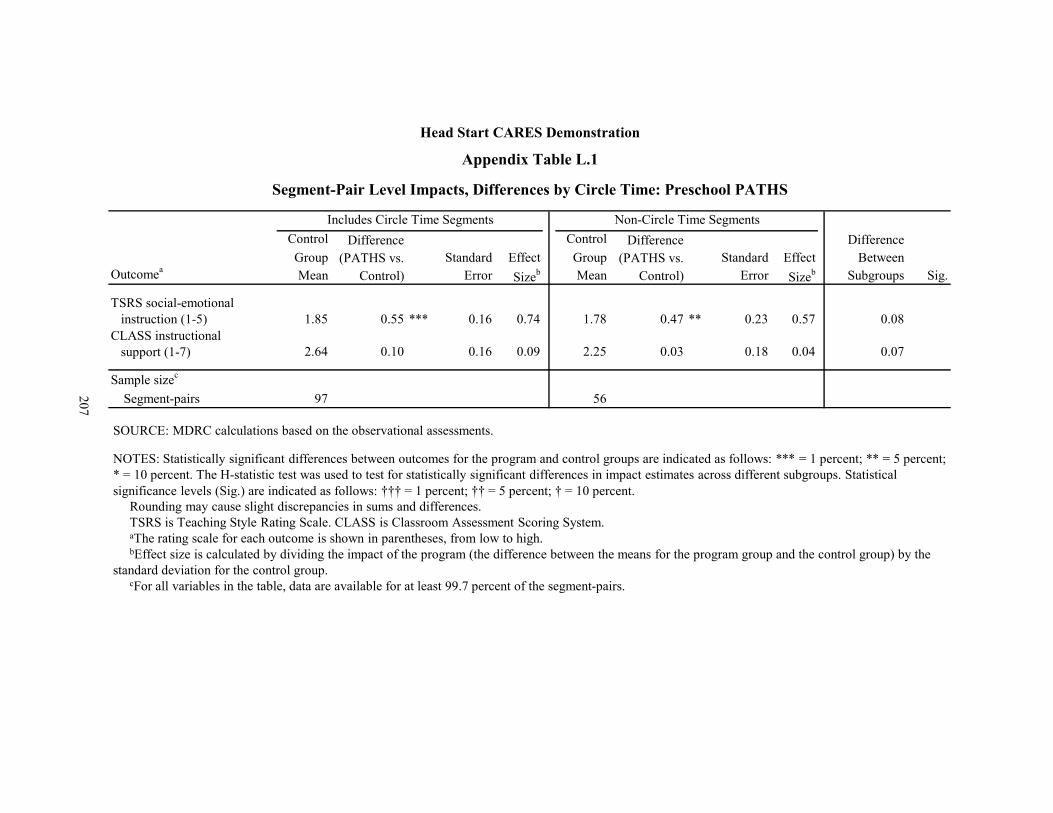
207
Control Difference Control Difference DifferenceGroup (PATHS vs. Standard Effect Group (PATHS vs. Standard Effect Between
Outcomea Mean Control) Error Sizeb Mean Control) Error Sizeb Subgroups Sig.
TSRS social-emotional instruction (1-5) 1.85 0.55 *** 0.16 0.74 1.78 0.47 ** 0.23 0.57 0.08
CLASS instructional support (1-7) 2.64 0.10 0.16 0.09 2.25 0.03 0.18 0.04 0.07
Sample sizec
Segment-pairs 97 56
Head Start CARES Demonstration
Appendix Table L.1
Segment-Pair Level Impacts, Differences by Circle Time: Preschool PATHS
Includes Circle Time Segments Non-Circle Time Segments
SOURCE: MDRC calculations based on the observational assessments.
NOTES: Statistically significant differences between outcomes for the program and control groups are indicated as follows: *** = 1 percent; ** = 5 percent; * = 10 percent. The H-statistic test was used to test for statistically significant differences in impact estimates across different subgroups. Statistical significance levels (Sig.) are indicated as follows: ††† = 1 percent; †† = 5 percent; † = 10 percent.
Rounding may cause slight discrepancies in sums and differences.TSRS is Teaching Style Rating Scale. CLASS is Classroom Assessment Scoring System.aThe rating scale for each outcome is shown in parentheses, from low to high.bEffect size is calculated by dividing the impact of the program (the difference between the means for the program group and the control group) by the
standard deviation for the control group. cFor all variables in the table, data are available for at least 99.7 percent of the segment-pairs.

THIS PAGE INTENTIONALLY LEFT BLANK

Appendix M
Kindergarten Impacts with Standard Errors

THIS PAGE INTENTIONALLY LEFT BLANK
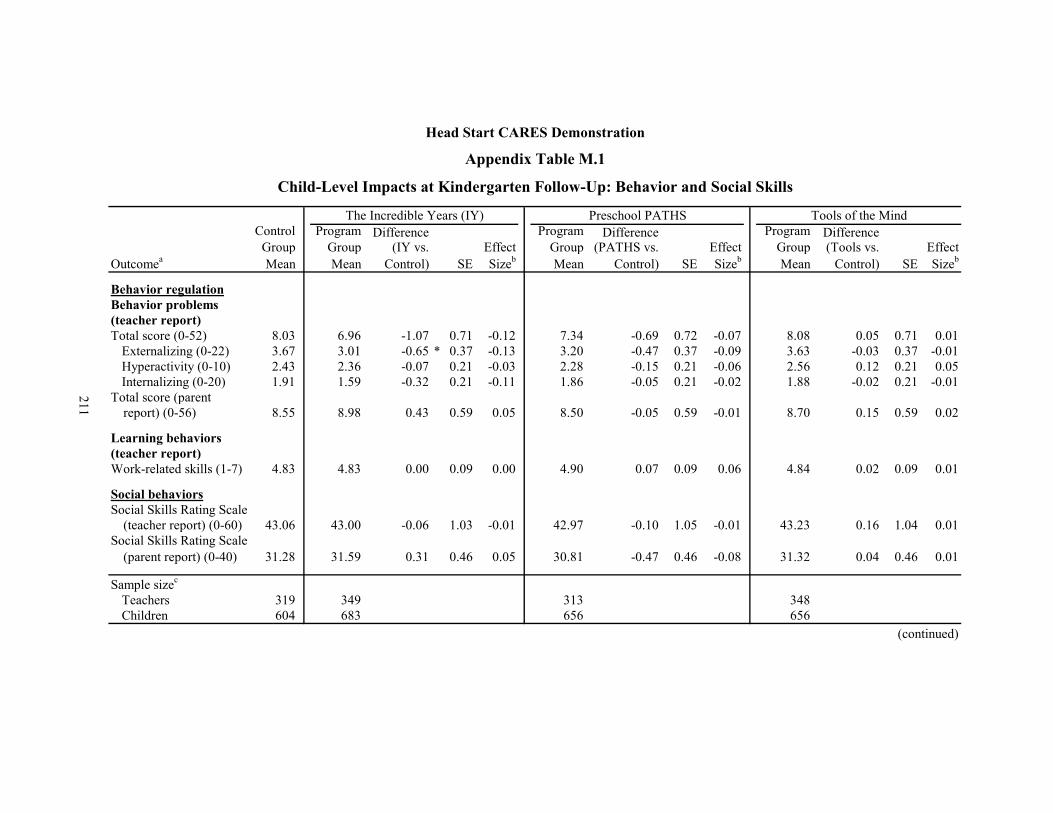
211
Control Program Difference Program Difference Program DifferenceGroup Group (IY vs. Effect Group (PATHS vs. Effect Group (Tools vs. Effect
Outcomea Mean Mean Control) SE Sizeb Mean Control) SE Sizeb Mean Control) SE Sizeb
Behavior regulationBehavior problems (teacher report)Total score (0-52) 8.03 6.96 -1.07 0.71 -0.12 7.34 -0.69 0.72 -0.07 8.08 0.05 0.71 0.01
Externalizing (0-22) 3.67 3.01 -0.65 * 0.37 -0.13 3.20 -0.47 0.37 -0.09 3.63 -0.03 0.37 -0.01Hyperactivity (0-10) 2.43 2.36 -0.07 0.21 -0.03 2.28 -0.15 0.21 -0.06 2.56 0.12 0.21 0.05Internalizing (0-20) 1.91 1.59 -0.32 0.21 -0.11 1.86 -0.05 0.21 -0.02 1.88 -0.02 0.21 -0.01
Total score (parent report) (0-56) 8.55 8.98 0.43 0.59 0.05 8.50 -0.05 0.59 -0.01 8.70 0.15 0.59 0.02
Learning behaviors (teacher report)Work-related skills (1-7) 4.83 4.83 0.00 0.09 0.00 4.90 0.07 0.09 0.06 4.84 0.02 0.09 0.01
Social behaviorsSocial Skills Rating Scale
(teacher report) (0-60) 43.06 43.00 -0.06 1.03 -0.01 42.97 -0.10 1.05 -0.01 43.23 0.16 1.04 0.01Social Skills Rating Scale
(parent report) (0-40) 31.28 31.59 0.31 0.46 0.05 30.81 -0.47 0.46 -0.08 31.32 0.04 0.46 0.01
Sample sizec
Teachers 319 349 313 348Children 604 683 656 656
(continued)
Head Start CARES Demonstration
Child-Level Impacts at Kindergarten Follow-Up: Behavior and Social Skills
Appendix Table M.1
The Incredible Years (IY) Preschool PATHS Tools of the Mind

212
Appendix Table M.1 (continued)
SOURCES: MDRC calculations based on the teachers' reports and parents' reports.
NOTES: Statistical significance levels are indicated as follows: *** = 1 percent; ** = 5 percent; * = 10 percent.Rounding may cause slight discrepancies in sums and differences.SE represents standard error.aThe rating scale for each outcome is shown in parentheses, from low to high.bEffect size is calculated by dividing the impact of the program (the difference between the means for the program group and the control group) by the
standard deviation for the control group.cFor all teacher-reported variables in the table, data are available for at least 90 percent of the sample. For all parent-reported variables in the table, data are
available for 85 percent of the sample.
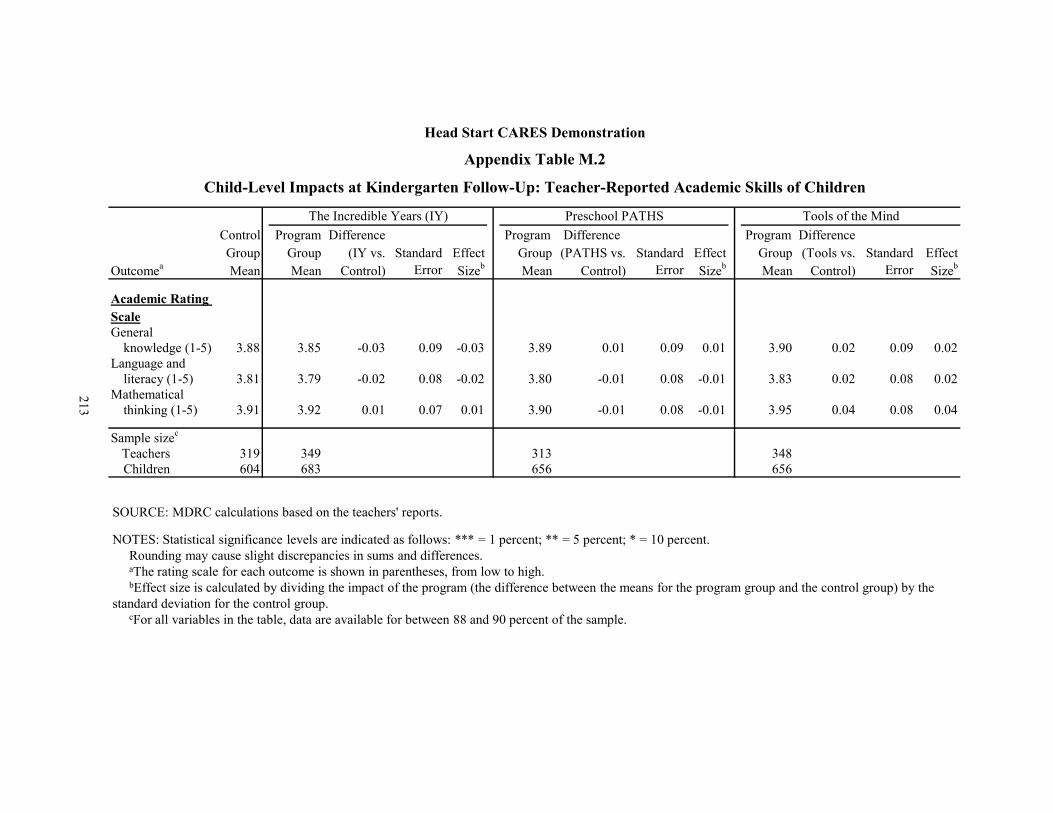
213
Control Program Difference Program Difference Program DifferenceGroup Group (IY vs. Standard Effect Group (PATHS vs. Standard Effect Group (Tools vs. Standard Effect
Outcomea Mean Mean Control) Error Sizeb Mean Control) Error Sizeb Mean Control) Error Sizeb
Academic Rating ScaleGeneral
knowledge (1-5) 3.88 3.85 -0.03 0.09 -0.03 3.89 0.01 0.09 0.01 3.90 0.02 0.09 0.02Language and
literacy (1-5) 3.81 3.79 -0.02 0.08 -0.02 3.80 -0.01 0.08 -0.01 3.83 0.02 0.08 0.02Mathematical
thinking (1-5) 3.91 3.92 0.01 0.07 0.01 3.90 -0.01 0.08 -0.01 3.95 0.04 0.08 0.04
Sample sizec
Teachers 319 349 313 348Children 604 683 656 656
Head Start CARES Demonstration
Child-Level Impacts at Kindergarten Follow-Up: Teacher-Reported Academic Skills of Children
Appendix Table M.2
The Incredible Years (IY) Preschool PATHS Tools of the Mind
SOURCE: MDRC calculations based on the teachers' reports.
NOTES: Statistical significance levels are indicated as follows: *** = 1 percent; ** = 5 percent; * = 10 percent.Rounding may cause slight discrepancies in sums and differences.aThe rating scale for each outcome is shown in parentheses, from low to high.bEffect size is calculated by dividing the impact of the program (the difference between the means for the program group and the control group) by the
standard deviation for the control group. cFor all variables in the table, data are available for between 88 and 90 percent of the sample.

214
Control Program Difference Program Difference Program DifferenceGroup Group (IY vs. Effect Group (PATHS vs. Effect Group (Tools vs. Effect
Outcomea Mean Mean Control) SE Sizeb Mean Control) SE Sizeb Mean Control) SE Sizeb
Teacher reportExpectation of
child retention (0-1) 0.07 0.04 -0.03 0.02 -0.11 0.00 -0.07 *** 0.02 -0.24 0.04 -0.03 0.02 -0.11Child receipt of
special services (0-1) 0.13 0.15 0.02 0.03 0.06 0.13 0.00 0.03 -0.01 0.10 -0.03 0.03 -0.08
Parent reportChild receipt of special
education services (0-1) 0.06 0.11 0.05 ** 0.02 0.19 0.06 0.00 0.02 0.01 0.07 0.01 0.02 0.06
Sample sizec
Teachers 319 349 313 348Children 604 683 656 656
Head Start CARES Demonstration
Appendix Table M.3
Child-Level Impacts at Kindergarten Follow-Up: Grade Retention and Special Education Services
The Incredible Years Preschool PATHS Tools of the Mind
SOURCES: MDRC calculations based on the teachers' reports and parents' reports.
NOTES: Statistical significance levels are indicated as follows: *** = 1 percent; ** = 5 percent; * = 10 percent.Rounding may cause slight discrepancies in sums and differences.SE represents standard error.aThe rating scale for each outcome is shown in parentheses, from low to high.bEffect size is calculated by dividing the impact of the program (the difference between the means for the program group and the control group) by the
standard deviation for the control group. cFor all variables in the table, data are available for between 84 and 90 percent of the sample.

Appendix N
Subgroup Analyses: Differences in Kindergarten Impacts by Baseline Behavior Risk

THIS PAGE INTENTIONALLY LEFT BLANK

Control Difference Control Difference DifferenceGroup (IY vs. Standar Effect Group (IY vs. Standard Effect Between
Outcomea Mean Control) Error Sizeb Mean Control) Error Sizeb Subgroups Sig.
Behavior regulationBehavior problems (teacher report)Total score (0-52) 4.41 -0.10 0.73 -0.02 10.40 -1.37 1.20 -0.13 1.27
Externalizing (0-22) 1.81 -0.14 0.39 -0.05 4.94 -0.87 0.65 -0.16 0.72Hyperactivity (0-10) 1.34 0.27 0.25 0.14 3.09 -0.10 0.33 -0.03 0.37Internalizing (0-20) 1.25 -0.12 0.22 -0.05 2.40 -0.52 0.37 -0.15 0.40
Total score (parent report) (0-56) 7.82 -0.31 0.79 -0.05 9.08 0.69 0.89 0.08 -1.00
Learning behaviors (teacher report)Work-related skills (1-7) 5.15 0.07 0.13 0.07 4.57 -0.13 0.14 -0.09 0.20
Social-emotional skillsSocial behaviorsSocial Skills Rating Scale (teacher
report) (0-60) 47.13 -0.56 1.41 -0.06 40.99 -2.00 1.52 -0.16 1.44Social Skills Rating Scale (parent
report) (0-40) 31.80 1.13 * 0.62 0.20 30.72 -0.32 0.66 -0.05 1.44
Academic skills (teacher report)General knowledge (1-5) 4.10 -0.15 0.11 -0.17 3.79 -0.09 0.13 -0.08 -0.05Language and literacy (1-5) 4.04 -0.09 0.11 -0.11 3.70 -0.13 0.11 -0.11 0.05Mathematical thinking (1-5) 4.14 -0.07 0.10 -0.09 3.86 -0.12 0.12 -0.10 0.04
Sample sizec
Children 190 236(continued)
Low Risk High Risk
Head Start CARES Demonstration
Appendix Table N.1
Child-Level Impacts at Kindergarten Follow-Up, Differences by Baseline Behavior Risk: The Incredible Years (IY)
217

218
Appendix Table N.1 (continued)
SOURCES: MDRC calculations based on the parents' reports and teachers' reports.
NOTES: Statistically significant differences between outcomes for the program and control groups are indicated as follows: *** = 1 percent; ** = 5 percent; * = 10 percent. The H-statistic test was used to test for statistically significant differences in impact estimates across different subgroups. Statistical significance levels (Sig.) are indicated as follows: ††† = 1 percent; †† = 5 percent; † = 10 percent.
Rounding may cause slight discrepancies in sums and differences. Children with total Behavior Problems Index (BPI) scores equal to or above the median total BPI score were included in the high-behavior-risk subgroup,
and children with total BPI scores below the median were included in the low-behavior-risk subgroup.aThe rating scale for each outcome is shown in parentheses, from low to high.bEffect size is calculated by dividing the impact of the program (the difference between the means for the program group and the control group) by the
standard deviation for the control group.cFor all variables in the table, data are available for between 87 and 91 percent of the sample.

219
Control Difference Control Difference DifferenceGroup (PATHS vs. Standard Effect Group (PATHS vs. Standard Effect Between
Outcomea Mean Control) Error Sizeb Mean Control) Error Sizeb Subgroups Sig.
Behavior regulationBehavior problems (teacher report)Total score (0-52) 4.41 -0.17 0.75 -0.03 10.40 0.13 1.20 0.01 -0.30
Externalizing (0-22) 1.81 -0.14 0.40 -0.04 4.94 -0.06 0.65 -0.01 -0.07Hyperactivity (0-10) 1.34 0.02 0.26 0.01 3.09 0.10 0.33 0.03 -0.07Internalizing (0-20) 1.25 -0.06 0.22 -0.03 2.40 0.05 0.37 0.01 -0.11
Total score (parent report) (0-56) 7.82 -1.16 0.80 -0.17 9.08 0.76 0.87 0.09 -1.92
Learning behaviors (teacher report)Work-related skills (1-7) 5.15 0.12 0.13 0.12 4.57 -0.05 0.14 -0.03 0.16
Social-emotional skillsSocial behaviorsSocial Skills Rating Scale (teacher
report) (0-60) 47.13 -0.84 1.44 -0.09 40.99 -1.30 1.53 -0.10 0.45Social Skills Rating Scale (parent
report) (0-40) 31.80 0.52 0.63 0.09 30.72 -0.98 0.64 -0.15 1.50 †
Academic skills (teacher report)General knowledge (1-5) 4.10 -0.05 0.12 -0.05 3.79 0.07 0.13 0.06 -0.11Language and literacy (1-5) 4.04 -0.08 0.12 -0.10 3.70 0.03 0.11 0.02 -0.11Mathematical thinking (1-5) 4.14 -0.11 0.11 -0.13 3.86 0.00 0.12 0.00 -0.10
Sample sizec
Children 190 236(continued)
Low Risk High Risk
Head Start CARES Demonstration
Appendix Table N.2
Child-Level Impacts at Kindergarten Follow-Up, Differences by Baseline Behavior Risk: Preschool PATHS
220
Appendix Table N.2 (continued)
SOURCES: MDRC calculations based on the parents' reports and teachers' reports.
NOTES: Statistically significant differences between outcomes for the program and control groups are indicated as follows: *** = 1 percent; ** = 5 percent; * = 10 percent. The H-statistic test was used to test for statistically significant differences in impact estimates across different subgroups. Statistical significance levels (Sig.) are indicated as follows: ††† = 1 percent; †† = 5 percent; † = 10 percent.
Rounding may cause slight discrepancies in sums and differences. Children with total Behavior Problems Index (BPI) scores equal to or above the median total BPI score were included in the high-behavior-risk subgroup,
and children with total BPI scores below the median were included in the low-behavior-risk subgroup.aThe rating scale for each outcome is shown in parentheses, from low to high.bEffect size is calculated by dividing the impact of the program (the difference between the means for the program group and the control group) by the
standard deviation for the control group.cFor all variables in the table, data are available for between 86 and 90 percent of the sample.

221
Control Difference Control Difference DifferenceGroup (Tools vs. Standard Effect Group (Tools vs. Standard Effect Between
Outcomea Mean Control) Error Sizeb Mean Control) Error Sizeb Subgroups Sig.
Behavior regulationBehavior problems (teacher report)Total score (0-52) 4.41 1.17 0.75 0.19 10.40 -0.01 1.19 0.00 1.18
Externalizing (0-22) 1.81 0.61 0.40 0.20 4.94 -0.12 0.64 -0.02 0.73Hyperactivity (0-10) 1.34 0.41 0.26 0.22 3.09 0.22 0.33 0.07 0.19Internalizing (0-20) 1.25 0.17 0.23 0.07 2.40 -0.15 0.37 -0.04 0.32
Total score (parent report) (0-56) 7.82 -0.79 0.80 -0.12 9.08 0.64 0.88 0.07 -1.43
Learning behaviors (teacher report)Work-related skills (1-7) 5.15 0.02 0.13 0.02 4.57 0.05 0.14 0.04 -0.04
Social-emotional skillsSocial behaviorsSocial Skills Rating Scale (teacher
report) (0-60) 47.13 -0.37 1.44 -0.04 40.99 -0.71 1.52 -0.06 0.34Social Skills Rating Scale (parent
report) (0-40) 31.80 1.08 * 0.63 0.19 30.72 -0.80 0.65 -0.12 1.88 ††
Academic skills (teacher report)General knowledge (1-5) 4.10 -0.12 0.11 -0.14 3.79 0.13 0.13 0.12 -0.24Language and literacy (1-5) 4.04 -0.06 0.11 -0.08 3.70 0.10 0.11 0.09 -0.16Mathematical thinking (1-5) 4.14 -0.09 0.10 -0.11 3.86 0.11 0.11 0.10 -0.20
Sample sizec
Children 190 236(continued)
Low Risk High Risk
Head Start CARES Demonstration
Appendix Table N.3
Child-Level Impacts at Kindergarten Follow-Up, Differences by Baseline Behavior Risk: Tools of the Mind

222
Appendix Table N.3 (continued)SOURCES: MDRC calculations based on the parents' reports and teachers' reports.
NOTES: Statistically significant differences between outcomes for the program and control groups are indicated as follows: *** = 1 percent; ** = 5 percent; * = 10 percent. The H-statistic test was used to test for statistically significant differences in impact estimates across different subgroups. Statistical significance levels (Sig.) are indicated as follows: ††† = 1 percent; †† = 5 percent; † = 10 percent.
Rounding may cause slight discrepancies in sums and differences. Children with total Behavior Problems Index (BPI) scores equal to or above the median total BPI score were included in the high-behavior-risk
subgroup, and children with total BPI scores below the median were included in the low-behavior-risk subgroup.aThe rating scale for each outcome is shown in parentheses, from low to high.bEffect size is calculated by dividing the impact of the program (the difference between the means for the program group and the control group) by the
standard deviation for the control group.cFor all variables in the table, data are available for between 86 and 92 percent of the sample.

Appendix O
Subgroup Analyses: Differences in Kindergarten Impacts by Gender

THIS PAGE INTENTIONALLY LEFT BLANK

225
Control Difference Control Difference DifferenceGroup (IY vs. Standard Effect Group (IY vs. Standard Effect Between
Outcomea Mean Control) Error Sizeb Mean Control) Error Sizeb Subgroups Sig.
Behavior regulationBehavior problems (teacher report)Total score (0-52) 5.97 -0.32 0.74 -0.04 9.80 -1.49 0.95 -0.15 1.17
Externalizing (0-22) 2.67 -0.15 0.41 -0.03 4.47 -0.90 * 0.48 -0.17 0.76Hyperactivity (0-10) 1.69 0.10 0.20 0.05 3.08 -0.19 0.30 -0.06 0.30Internalizing (0-20) 1.59 -0.30 0.25 -0.11 2.24 -0.34 0.29 -0.11 0.05
Total score (parent report) (0-56) 7.70 0.94 0.70 0.13 9.36 -0.04 0.80 0.00 0.98
Learning behaviors (teacher report)Work-related skills (1-7) 5.09 0.03 0.11 0.03 4.60 -0.05 0.12 -0.04 0.08
Social-emotional skills Social BehaviorsSocial Skills Rating Scale (teacher
report) (0-60) 46.16 -0.57 1.10 -0.05 40.59 -0.14 1.42 -0.01 -0.44Social Skills Rating Scale (parent
report) (0-40) 32.19 0.52 0.52 0.09 30.46 0.14 0.65 0.02 0.38
Academic skills (teacher report)General knowledge (1-5) 3.98 -0.10 0.10 -0.10 3.79 0.00 0.11 0.00 -0.10Language and literacy (1-5) 3.92 -0.04 0.09 -0.05 3.71 -0.01 0.11 -0.01 -0.03Mathematical thinking (1-5) 3.99 -0.04 0.08 -0.04 3.85 0.02 0.11 0.02 -0.06
Sample sizec
Children 299 305(continued)
Female Male
Head Start CARES Demonstration
Appendix Table O.1
Child-Level Impacts at Kindergarten Follow-Up, Differences by Child Gender: The Incredible Years (IY)

Appendix Table O.1 (continued)
SOURCES: MDRC calculations based on the parents' reports and teachers' reports.
NOTES: Statistically significant differences between outcomes for the program and control groups are indicated as follows: *** = 1 percent; ** = 5 percent; * = 10 percent. The H-statistic test was used to test for statistically significant differences in impact estimates across different subgroups. Statistical significance levels (Sig.) are indicated as follows: ††† = 1 percent; †† = 5 percent; † = 10 percent.
Rounding may cause slight discrepancies in sums and differences. aThe rating scale for each outcome is shown in parentheses, from low to high.bEffect size is calculated by dividing the impact of the program (the difference between the means for the program group and the control group) by the
standard deviation for the control group. cFor all variables in the table, data are available for between 85 and 92 percent of the sample.
226
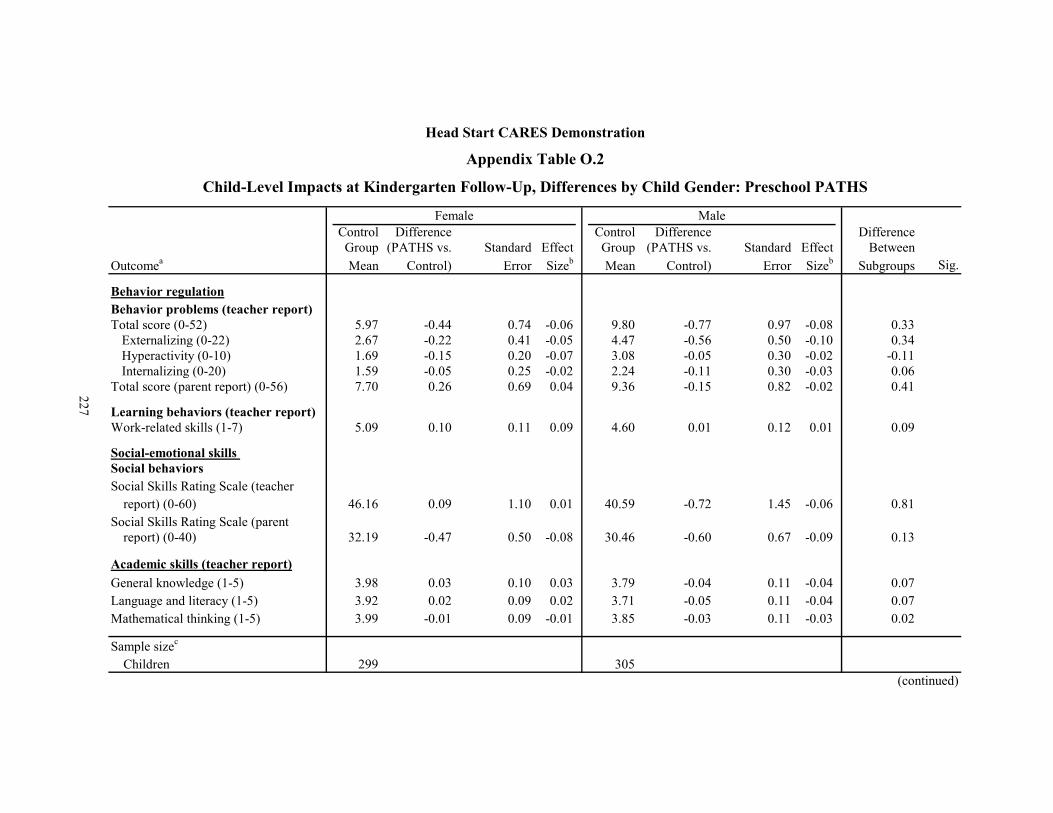
227
Control Difference Control Difference DifferenceGroup (PATHS vs. Standard Effect Group (PATHS vs. Standard Effect Between
Outcomea Mean Control) Error Sizeb Mean Control) Error Sizeb Subgroups Sig.
Behavior regulationBehavior problems (teacher report)Total score (0-52) 5.97 -0.44 0.74 -0.06 9.80 -0.77 0.97 -0.08 0.33
Externalizing (0-22) 2.67 -0.22 0.41 -0.05 4.47 -0.56 0.50 -0.10 0.34Hyperactivity (0-10) 1.69 -0.15 0.20 -0.07 3.08 -0.05 0.30 -0.02 -0.11Internalizing (0-20) 1.59 -0.05 0.25 -0.02 2.24 -0.11 0.30 -0.03 0.06
Total score (parent report) (0-56) 7.70 0.26 0.69 0.04 9.36 -0.15 0.82 -0.02 0.41
Learning behaviors (teacher report)Work-related skills (1-7) 5.09 0.10 0.11 0.09 4.60 0.01 0.12 0.01 0.09
Social-emotional skills Social behaviorsSocial Skills Rating Scale (teacher
report) (0-60) 46.16 0.09 1.10 0.01 40.59 -0.72 1.45 -0.06 0.81Social Skills Rating Scale (parent
report) (0-40) 32.19 -0.47 0.50 -0.08 30.46 -0.60 0.67 -0.09 0.13
Academic skills (teacher report)General knowledge (1-5) 3.98 0.03 0.10 0.03 3.79 -0.04 0.11 -0.04 0.07Language and literacy (1-5) 3.92 0.02 0.09 0.02 3.71 -0.05 0.11 -0.04 0.07Mathematical thinking (1-5) 3.99 -0.01 0.09 -0.01 3.85 -0.03 0.11 -0.03 0.02
Sample sizec
Children 299 305(continued)
Female Male
Head Start CARES Demonstration
Appendix Table O.2
Child-Level Impacts at Kindergarten Follow-Up, Differences by Child Gender: Preschool PATHS

228
Appendix Table O.2 (continued)SOURCES: MDRC calculations based on the parents' reports and teachers' reports.
NOTES: Statistically significant differences between outcomes for the program and control groups are indicated as follows: *** = 1 percent; ** = 5 percent; * = 10 percent. The H-statistic test was used to test for statistically significant differences in impact estimates across different subgroups. Statistical significance levels (Sig.) are indicated as follows: ††† = 1 percent; †† = 5 percent; † = 10 percent.
Rounding may cause slight discrepancies in sums and differences. aThe rating scale for each outcome is shown in parentheses, from low to high.bEffect size is calculated by dividing the impact of the program (the difference between the means for the program group and the control group) by the
standard deviation for the control group. cFor all variables in the table, data are available for between 85 and 90 percent of the sample.

229
Control Difference Control Difference DifferenceGroup (Tools vs. Standard Effect Group (Tools vs. Standard Effect Between
Outcomea Mean Control) Error Sizeb Mean Control) Error Sizeb Subgroups Sig.
Behavior regulationBehavior problems (teacher report)Total score (0-52) 5.97 0.34 0.74 0.04 9.80 -0.15 0.96 -0.01 0.49
Externalizing (0-22) 2.67 0.08 0.41 0.02 4.47 -0.09 0.49 -0.02 0.17Hyperactivity (0-10) 1.69 0.10 0.20 0.04 3.08 0.20 0.30 0.07 -0.10Internalizing (0-20) 1.59 0.17 0.25 0.06 2.24 -0.24 0.29 -0.08 0.41
Total score (parent report) (0-56) 7.70 0.21 0.69 0.03 9.36 0.24 0.83 0.03 -0.02
Learning behaviors (teacher report)Work-related skills (1-7) 5.09 0.09 0.11 0.08 4.60 -0.09 0.12 -0.07 0.18
Social-emotional skills Social behaviorsSocial Skills Rating Scale (teacher
report) (0-60) 46.16 0.13 1.10 0.01 40.59 -0.24 1.43 -0.02 0.37Social Skills Rating Scale (parent
report) (0-40) 32.19 0.01 0.50 0.00 30.46 0.03 0.67 0.01 -0.03
Academic skills (teacher report)General knowledge (1-5) 3.98 -0.04 0.10 -0.04 3.79 0.09 0.11 0.08 -0.12Language and literacy (1-5) 3.92 -0.02 0.09 -0.02 3.71 0.04 0.11 0.03 -0.06Mathematical thinking (1-5) 3.99 -0.02 0.08 -0.02 3.85 0.07 0.11 0.06 -0.09
Sample sizec
Children 299 305(continued)
Female Male
Head Start CARES Demonstration
Appendix Table O.3
Child-Level Impacts at Kindergarten Follow-Up, Differences by Child Gender: Tools of the Mind
230
Appendix Table O.3 (continued)
SOURCES: MDRC calculations based on the parents' reports and teachers' reports.
NOTES: Statistically significant differences between outcomes for the program and control groups are indicated as follows: *** = 1 percent; ** = 5 percent; * = 10 percent. The H-statistic test was used to test for statistically significant differences in impact estimates across different subgroups. Statistical significance levels (Sig.) are indicated as follows: ††† = 1 percent; †† = 5 percent; † = 10 percent.
Rounding may cause slight discrepancies in sums and differences. aThe rating scale for each outcome is shown in parentheses, from low to high.bEffect size is calculated by dividing the impact of the program (the difference between the means for the program group and the control group) by the
standard deviation for the control group. cFor all variables in the table, data are available for between 85 and 92 percent of the sample.

Appendix P
Subgroup Analyses: Differences in Kindergarten Impacts by School-Level Student Support and Safety

THIS PAGE INTENTIONALLY LEFT BLANK
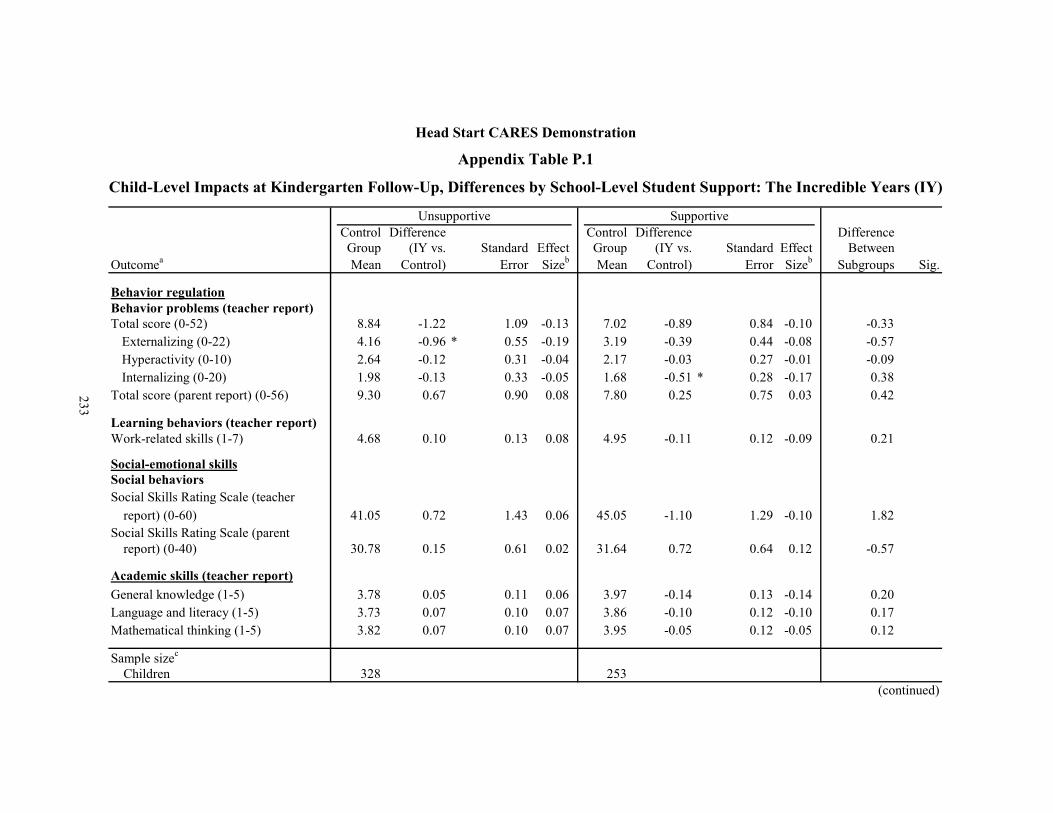
233
Control Difference Control Difference DifferenceGroup (IY vs. Standard Effect Group (IY vs. Standard Effect Between
Outcomea Mean Control) Error Sizeb Mean Control) Error Sizeb Subgroups Sig.
Behavior regulationBehavior problems (teacher report)Total score (0-52) 8.84 -1.22 1.09 -0.13 7.02 -0.89 0.84 -0.10 -0.33
Externalizing (0-22) 4.16 -0.96 * 0.55 -0.19 3.19 -0.39 0.44 -0.08 -0.57Hyperactivity (0-10) 2.64 -0.12 0.31 -0.04 2.17 -0.03 0.27 -0.01 -0.09Internalizing (0-20) 1.98 -0.13 0.33 -0.05 1.68 -0.51 * 0.28 -0.17 0.38
Total score (parent report) (0-56) 9.30 0.67 0.90 0.08 7.80 0.25 0.75 0.03 0.42
Learning behaviors (teacher report)Work-related skills (1-7) 4.68 0.10 0.13 0.08 4.95 -0.11 0.12 -0.09 0.21
Social-emotional skillsSocial behaviorsSocial Skills Rating Scale (teacher
report) (0-60) 41.05 0.72 1.43 0.06 45.05 -1.10 1.29 -0.10 1.82Social Skills Rating Scale (parent
report) (0-40) 30.78 0.15 0.61 0.02 31.64 0.72 0.64 0.12 -0.57
Academic skills (teacher report)General knowledge (1-5) 3.78 0.05 0.11 0.06 3.97 -0.14 0.13 -0.14 0.20Language and literacy (1-5) 3.73 0.07 0.10 0.07 3.86 -0.10 0.12 -0.10 0.17Mathematical thinking (1-5) 3.82 0.07 0.10 0.07 3.95 -0.05 0.12 -0.05 0.12
Sample sizec
Children 328 253(continued)
Unsupportive Supportive
Head Start CARES Demonstration
Appendix Table P.1
Child-Level Impacts at Kindergarten Follow-Up, Differences by School-Level Student Support: The Incredible Years (IY)

234
Appendix Table P.1 (continued)
SOURCES: MDRC calculations based on the parents' reports and teachers' reports.
NOTES: Statistically significant differences between outcomes for the program and control groups are indicated as follows: *** = 1 percent; ** = 5 percent; * = 10 percent. The H-statistic test was used to test for statistically significant differences in impact estimates across different subgroups. Statistical significance levels (Sig.) are indicated as follows: ††† = 1 percent; †† = 5 percent; † = 10 percent.
Rounding may cause slight discrepancies in sums and differences.aThe rating scale for each outcome is shown in parentheses, from low to high.bEffect size is calculated by dividing the impact of the program (the difference between the means for the program group and the control group) by the
standard deviation for the control group.cFor all teacher-reported variables in the table, data are available for at least 95 percent of the sample. For all parent-reported variables in the table, data
are available for 86 percent of the sample.

235
Control Difference Control Difference DifferenceGroup (PATHS vs. Standard Effect Group (PATHS vs. Standard Effect Between
Outcomea Mean Control) Error Sizeb Mean Control) Error Sizeb Subgroups Sig.
Behavior regulationBehavior problems (teacher report)Total score (0-52) 8.84 -1.11 1.10 -0.12 7.02 -0.21 0.94 -0.02 -0.90
Externalizing (0-22) 4.16 -0.76 0.56 -0.15 3.19 -0.42 0.49 -0.09 -0.34Hyperactivity (0-10) 2.64 -0.31 0.31 -0.11 2.17 0.10 0.30 0.04 -0.40Internalizing (0-20) 1.98 0.03 0.34 0.01 1.68 0.14 0.31 0.05 -0.11
Total score (parent report) (0-56) 9.30 -0.43 0.91 -0.05 7.80 0.29 0.83 0.04 -0.72
Learning behaviors (teacher report)Work-related skills (1-7) 4.68 0.24 * 0.13 0.19 4.95 -0.19 0.13 -0.16 0.43 ††
Social-emotional skills Social behaviorsSocial Skills Rating Scale (teacher
report) (0-60) 41.05 1.57 1.45 0.12 45.05 -2.72 * 1.42 -0.24 4.29 ††Social Skills Rating Scale (parent
report) (0-40) 30.78 -0.44 0.61 -0.07 31.64 -0.22 0.70 -0.04 -0.21
Academic skills (teacher report)General knowledge (1-5) 3.78 0.12 0.11 0.12 3.97 -0.17 0.14 -0.17 0.29Language and literacy (1-5) 3.73 0.09 0.10 0.09 3.86 -0.18 0.13 -0.17 0.27Mathematical thinking (1-5) 3.82 0.05 0.10 0.05 3.95 -0.09 0.13 -0.09 0.14
Sample sizec
Children 328 253(continued)
Unsupportive Supportive
Head Start CARES Demonstration
Appendix Table P.2
Child-Level Impacts at Kindergarten Follow-Up, Differences by School-Level Student Support: Preschools PATHS

236
Appendix Table P.2 (continued)
SOURCES: MDRC calculations based on the parents' reports and teachers' reports.
NOTES: Statistically significant differences between outcomes for the program and control groups are indicated as follows: *** = 1 percent; ** = 5 percent; * = 10 percent. The H-statistic test was used to test for statistically significant differences in impact estimates across different subgroups. Statistical significance levels (Sig.) are indicated as follows: ††† = 1 percent; †† = 5 percent; † = 10 percent.
Rounding may cause slight discrepancies in sums and differences.aThe rating scale for each outcome is shown in parentheses, from low to high.bEffect size is calculated by dividing the impact of the program (the difference between the means for the program group and the control group) by the
standard deviation for the control group.cFor all teacher-reported variables in the table, data are available for at least 92 percent of the sample. For all parent-reported variables in the table, data are
available for 85 percent of the sample.

237
Control Difference Control Difference DifferenceGroup (Tools vs. Standard Effect Group (Tools vs. Standard Effect Between
Outcomea Mean Control) Error Sizeb Mean Control) Error Sizeb Subgroups Sig.
Behavior regulationBehavior problems (teacher report)Total score (0-52) 8.84 0.76 1.14 0.08 7.02 -0.53 0.86 -0.06 1.29
Externalizing (0-22) 4.16 0.19 0.58 0.04 3.19 -0.25 0.46 -0.05 0.44Hyperactivity (0-10) 2.64 0.29 0.33 0.11 2.17 0.02 0.28 0.01 0.27Internalizing (0-20) 1.98 0.22 0.35 0.08 1.68 -0.22 0.29 -0.07 0.44
Total score (parent report) (0-56) 9.30 0.32 0.95 0.04 7.80 0.06 0.77 0.01 0.25
Learning behaviors (teacher report)Work-related skills (1-7) 4.68 0.04 0.14 0.03 4.95 0.02 0.12 0.02 0.02
Social-emotional skills Social behaviorsSocial Skills Rating Scale (teacher
report) (0-60) 41.05 0.57 1.51 0.04 45.05 0.08 1.32 0.01 0.49Social Skills Rating Scale (parent
report) (0-40) 30.78 -0.09 0.64 -0.01 31.64 -0.18 0.66 -0.03 0.09
Academic skills (teacher report)General knowledge (1-5) 3.78 0.11 0.11 0.11 3.97 -0.01 0.13 -0.01 0.12Language and literacy (1-5) 3.73 0.09 0.10 0.09 3.86 0.01 0.12 0.01 0.08Mathematical thinking (1-5) 3.82 0.07 0.10 0.07 3.95 0.06 0.12 0.06 0.02
Sample sizec
Children 328 253(continued)
Unsupportive Supportive
Head Start CARES Demonstration
Appendix Table P.3
Child-Level Impacts at Kindergarten Follow-Up, Differences by School-Level Student Support: Tools of the Mind

238
Appendix Table P.3 (continued)
SOURCES: MDRC calculations based on the parents' reports and teachers' reports.
NOTES: Statistically significant differences between outcomes for the program and control groups are indicated as follows: *** = 1 percent; ** = 5 percent; * = 10 percent. The H-statistic test was used to test for statistically significant differences in impact estimates across different subgroups. Statistical significance levels (Sig.) are indicated as follows: ††† = 1 percent; †† = 5 percent; † = 10 percent.
Rounding may cause slight discrepancies in sums and differences.aThe rating scale for each outcome is shown in parentheses, from low to high.bEffect size is calculated by dividing the impact of the program (the difference between the means for the program group and the control group) by the
standard deviation for the control group.cFor all teacher-reported variables in the table, data are available for at least 93 percent of the sample. For all parent-reported variables in the table, data
are available for 85 percent of the sample.

239
Control Difference Control Difference DifferenceGroup (IY vs. Standard Effect Group (IY vs. Standard Effect Between
Outcomea Mean Control) Error Sizeb Mean Control) Error Sizeb Subgroups Sig.
Behavior regulationBehavior problems (teacher report)Total score (0-52) 8.84 -0.78 0.83 -0.09 7.15 -1.40 1.21 -0.15 0.62
Externalizing (0-22) 4.10 -0.59 0.42 -0.12 3.28 -0.68 0.67 -0.13 0.09Hyperactivity (0-10) 2.61 0.02 0.26 0.01 2.19 -0.22 0.35 -0.08 0.24Internalizing (0-20) 2.11 -0.24 0.26 -0.08 1.66 -0.42 0.36 -0.15 0.18
Total score (parent report) (0-56) 9.75 -0.22 0.77 -0.03 6.55 1.80 ** 0.83 0.28 -2.03 †
Learning behaviors (teacher report)Work-related skills (1-7) 4.71 0.02 0.11 0.02 4.86 0.08 0.15 0.07 -0.06
Social-emotional skills Social behaviorsSocial Skills Rating Scale (teacher
report) (0-60) 42.03 -0.07 1.24 -0.01 43.40 1.39 1.75 0.11 -1.46Social Skills Rating Scale (parent
report) (0-40) 30.90 0.20 0.60 0.03 31.72 0.46 0.73 0.08 -0.26
Academic skills (teacher report)General knowledge (1-5) 3.86 -0.08 0.11 -0.08 3.80 0.13 0.14 0.13 -0.21Language and literacy (1-5) 3.73 -0.08 0.08 -0.07 3.78 0.14 0.13 0.14 -0.22Mathematical thinking (1-5) 3.84 -0.01 0.09 -0.01 3.89 0.14 0.13 0.14 -0.15
Sample sizec
Children 355 225(continued)
Unsafe Safe
Head Start CARES Demonstration
Appendix Table P.4
Child-Level Impacts at Kindergarten Follow-Up, Differences by School-Level Safety: The Incredible Years (IY)

240
Appendix Table P.4 (continued)
SOURCES: MDRC calculations based on the parents' reports and teachers' reports.
NOTES: Statistically significant differences between outcomes for the program and control groups are indicated as follows: *** = 1 percent; ** = 5 percent; * = 10 percent. The H-statistic test was used to test for statistically significant differences in impact estimates across different subgroups. Statistical significance levels (Sig.) are indicated as follows: ††† = 1 percent; †† = 5 percent; † = 10 percent.
Rounding may cause slight discrepancies in sums and differences. aThe rating scale for each outcome is shown in parentheses, from low to high.bEffect size is calculated by dividing the impact of the program (the difference between the means for the program group and the control group) by the
standard deviation for the control group.cFor all variables in the table, data are available for between 87 and 92 percent of the sample.

241
Control Difference Control Difference DifferenceGroup (PATHS vs. Standard Effect Group (PATHS vs. Standard Effect Between
Outcomea Mean Control) Error Sizeb Mean Control) Error Sizeb Subgroups Sig.
Behavior regulationBehavior problems (teacher report)Total score (0-52) 8.84 -0.92 0.88 -0.10 7.15 0.18 1.17 0.02 -1.10
Externalizing (0-22) 4.10 -0.59 0.44 -0.12 3.28 -0.08 0.65 -0.02 -0.51Hyperactivity (0-10) 2.61 -0.24 0.28 -0.09 2.19 0.11 0.34 0.04 -0.35Internalizing (0-20) 2.11 -0.08 0.28 -0.03 1.66 0.17 0.35 0.06 -0.26
Total score (parent report) (0-56) 9.75 -0.36 0.80 -0.04 6.55 1.08 0.80 0.17 -1.44
Learning behaviors (teacher report)Work-related skills (1-7) 4.71 0.16 0.11 0.13 4.86 0.00 0.15 0.00 0.16
Social-emotional akills Social behaviorsSocial Skills Rating Scale (teacher
report) (0-60) 42.03 -0.03 1.31 0.00 43.40 -0.06 1.72 0.00 0.03Social Skills Rating Scale (parent
report) (0-40) 30.90 -0.81 0.62 -0.12 31.72 -0.08 0.71 -0.01 -0.72
Academic skills (teacher report)General knowledge (1-5) 3.86 0.05 0.11 0.05 3.80 0.05 0.14 0.05 -0.01Language and literacy (1-5) 3.73 0.00 0.09 0.00 3.78 -0.01 0.13 -0.01 0.02Mathematical thinking (1-5) 3.84 0.03 0.10 0.03 3.89 0.01 0.13 0.01 0.02
Sample sizec
Children 355 225(continued)
Unsafe Safe
Head Start CARES Demonstration
Appendix Table P.5
Child-Level Impacts at Kindergarten Follow-Up, Differences by School-Level Safety: Preschools PATHS

242
Appendix Table P.5 (continued)
SOURCES: MDRC calculations based on the parents' reports and teachers' reports.
NOTES: Statistically significant differences between outcomes for the program and control groups are indicated as follows: *** = 1 percent; ** = 5 percent; * = 10 percent. The H-statistic test was used to test for statistically significant differences in impact estimates across different subgroups. Statistical significance levels (Sig.) are indicated as follows: ††† = 1 percent; †† = 5 percent; † = 10 percent.
Rounding may cause slight discrepancies in sums and differences. aThe rating scale for each outcome is shown in parentheses, from low to high.bEffect size is calculated by dividing the impact of the program (the difference between the means for the program group and the control group) by the
standard deviation for the control group.cFor all variables in the table, data are available for between 87 and 91 percent of the sample.

243
Control Difference Control Difference DifferenceGroup (Tools vs. Standard Effect Group (Tools vs. Standard Effect Between
Outcomea Mean Control) Error Sizeb Mean Control) Error Sizeb Subgroups Sig.
Behavior regulationBehavior problems (teacher report)Total score (0-52) 8.84 -1.12 0.86 -0.12 7.15 1.91 1.24 0.20 -3.03 ††
Externalizing (0-22) 4.10 -0.48 0.43 -0.10 3.28 0.57 0.68 0.11 -1.05Hyperactivity (0-10) 2.61 -0.17 0.27 -0.06 2.19 0.81 ** 0.36 0.30 -0.98 ††Internalizing (0-20) 2.11 -0.47 * 0.27 -0.16 1.66 0.57 0.37 0.20 -1.04 ††
Total score (parent report) (0-56) 9.75 -0.33 0.79 -0.04 6.55 0.40 0.84 0.06 -0.73
Learning behaviors (teacher report)Work-related skills (1-7) 4.71 0.14 0.11 0.11 4.86 -0.15 0.16 -0.12 0.30
Social-emotional skills Social behaviorsSocial Skills Rating Scale (teacher
report) (0-60) 42.03 1.59 1.28 0.13 43.40 -1.90 1.80 -0.15 3.49Social Skills Rating Scale (parent
report) (0-40) 30.90 -0.10 0.62 -0.02 31.72 0.64 0.75 0.11 -0.74
Academic skills (teacher report)General knowledge (1-5) 3.86 0.08 0.11 0.08 3.80 -0.06 0.14 -0.05 0.13Language and literacy (1-5) 3.73 0.08 0.09 0.08 3.78 -0.07 0.13 -0.07 0.16Mathematical thinking (1-5) 3.84 0.12 0.09 0.12 3.89 -0.07 0.13 -0.07 0.19
Sample sizec
Children 355 225(continued)
Unsafe Safe
Head Start CARES Demonstration
Appendix Table P.6
Child-Level Impacts at Kindergarten Follow-Up, Differences by School-Level Safety: Tools of the Mind
244
Appendix Table P.6 (continued)SOURCES: MDRC calculations based on the parents' reports and teachers' reports.
NOTES: Statistically significant differences between outcomes for the program and control groups are indicated as follows: *** = 1 percent; ** = 5 percent; * = 10 percent. The H-statistic test was used to test for statistically significant differences in impact estimates across different subgroups. Statistical significance levels (Sig.) are indicated as follows: ††† = 1 percent; †† = 5 percent; † = 10 percent.
Rounding may cause slight discrepancies in sums and differences. aThe rating scale for each outcome is shown in parentheses, from low to high.bEffect size is calculated by dividing the impact of the program (the difference between the means for the program group and the control group) by the
standard deviation for the control group.cFor all variables in the table, data are available for between 87 and 93 percent of the sample.

Appendix Q
Attrition and Turnover Analyses

THIS PAGE INTENTIONALLY LEFT BLANK

247
Child-Level Attrition Overall, approximately 11 percent of the child sample left the Head Start centers between the time of baseline data collection (in the fall of the preschool year) and the time of follow-up data collection (in the spring of the preschool year). While this is a not a substantial number of children and is to be expected for a sample of low-income children, two questions are important to address: (1) Were the children who left centers throughout the year different from those who stayed for the entire year? (2) Was there differential attrition across enhancement and control groups? Answering the first question provides an understanding of the differences between the baseline and follow-up samples of children; however, any differences that may exist do not by themselves imply a bias to the impact estimates that are presented. The second question allows for the investigation of any potential bias in the impact estimates as a result of attrition. Notably, however, the magnitude and direction of that bias will depend on whether there is substantially differential attrition across enhancement and control groups and whether that differential attrition resulted in different groups of children remaining in the enhancement and control classrooms.
With regard to the first question, an analysis comparing children who left the centers with those who remained suggests that children who left were more likely to be male; be rated as having lower levels of social behavior, learning behavior, and pre-academic skills; and perform poorly on executive function and cognitive tests. (See Appendix Table Q.1.) This also aligns with previous work demonstrating that children who leave preschool classrooms tend to be a more high-risk group.1
With regard to the second question, attrition was calculated for each enhancement and control group. Preschool PATHS and Tools of the Mind—Play had similar levels of child attrition as the control group (at 15 percent), while The Incredible Years had a lower rate of attrition (11 percent, and statistically significant at p < 0.10). If this lower level of attrition had resulted in a higher-risk sample remaining in Incredible Years classrooms (if The Incredible Years had caused some higher-risk children to stay who otherwise would have left their centers), it would have biased the impact estimates downward. To examine whether this differential attrition resulted in a group of Incredible Years children who were different from those in control centers, baseline differences between Incredible Years and control group children were tested, for those children who were still remaining at follow-up. Among the children who did not leave the sample, the Incredible Years group and the control group were still very similar, suggesting that while there was a lower rate of attrition, it did not result in an unbalanced sample in the Incredible Years and control groups.
1Raver, Garner, and Smith-Donald (2007).

248
Difference(Leavers vs. Effect
Characteristica Stayers Leavers Stayers) Sizeb
Child demographicsAge (years) 4.40 4.38 -0.02 -0.06Race and ethnicity (%)
White, non-Hispanic 17.29 18.66 1.37 0.04African-American, non-Hispanic 26.39 26.11 -0.27 -0.01Hispanic 48.76 46.20 -2.56 -0.05Other/multiracialc 7.53 9.82 2.29 0.09
Female (%) 49.92 42.15 -7.77 ** -0.16
Child outcomesExecutive function (direct assessment)Head-to-Toes (0-10) 2.32 2.03 -0.29 -0.08Pencil Tap (0-1) 0.44 0.38 -0.06 * -0.16
Behavior problems (teacher report)Total score (0-52) 6.23 7.06 0.82 0.09
Externalizing (0-22) 2.87 3.30 0.43 0.09Hyperactivity (0-10) 1.71 2.02 0.31 * 0.13Internalizing (0-20) 1.65 1.74 0.08 0.03
Learning behaviors (teacher report)Work-related scale (1-7) 4.87 4.60 -0.27 *** -0.26
Emotion knowledge (direct assessment)Facial emotions identification (0-1) 0.64 0.60 -0.04 * -0.14Emotions situations identification (0-1) 0.38 0.37 -0.01 -0.06
Social problem-solving (direct assessment)Challenging Situations competent response (0-10) 1.46 1.32 -0.14 -0.12Challenging Situations aggressive response (0-10) 0.93 1.07 0.13 0.11
Social behaviors (teacher report)Social Skills Rating Scale (0-60) 41.69 38.98 -2.71 *** -0.24
Assertion (0-20) 13.42 12.45 -0.97 *** -0.22Cooperation (0-20) 14.52 13.57 -0.94 *** -0.23Self-control (0-20) 13.73 12.92 -0.81 ** -0.18
Interpersonal skills (1-7) 5.47 5.30 -0.17 ** -0.18
Pre-academic skills (direct assessment) Woodcock-Johnson - Letter-Word Identification (M = 332)d 314.84 309.83 -5.02 * -0.20Woodcock-Johnson - Applied Problems (M = 399)e 396.16 392.16 -4.00 -0.13Expressive One-Word Picture Vocabulary Test (50-150) 87.00 82.98 -4.02 *** -0.27
(continued)
Head Start CARES Demonstration
Appendix Table Q.1
Baseline Child Characteristics: Differences Between Children Who Leave the Programand Children Who Stay in the Program

249
Teacher-Level Turnover Teacher turnover was also examined. Since data were collected on teachers who took the place of the teachers who left, this is not an “attrition” challenge per se. Rather, it is instructive for understanding how well the baseline data might represent the follow-up sample of teachers, and the extent to which implementation might have been compromised if changes in teaching staff occurred after implementation of the enhancements began. Overall, approximately 24 percent of
Difference(Leavers vs. Effect
Characteristica Stayers Leavers Stayers) Sizeb
Pre-academic skills (teacher report) 2.32 2.18 -0.14 *** -0.16General knowledge (1-5) 2.53 2.40 -0.13 ** -0.13Language and literacy (1-5) 2.30 2.16 -0.14 ** -0.15Mathematical thinking (1-5) 2.19 2.04 -0.15 *** -0.16
Parent demographicsMonthly income, best estimate ($) 1,821.73 1,758.77 -62.96 -0.06Household receiving TANF (%) 18.02 20.27 2.24 0.06Owns home (%) 17.88 14.42 -3.47 -0.09Lives in transient housing (%) 17.88 14.42 -3.47 -0.09Receives food stamps (%) 54.53 66.02 11.49 *** 0.23
Sample sizef
Children 1,878 236
Appendix Table Q.1 (continued)
SOURCE: MDRC calculations from the direct assessments, teachers' reports, and parents' reports.
NOTES: Statistical significance levels are indicated as follows: *** = 1 percent; ** = 5 percent; * = 10 percent.Rounding may cause slight discrepancies in sums and differences.aThe rating scale for each outcome except for the Woodcock-Johnson is shown in parentheses, from low to high.bEffect size is calculated by dividing the impact of the program (the difference between the means for the
program group and the control group) by the standard deviation for the control group. c“Other” includes Asian, Native Hawaiian/Pacific Islander, and American Indian/Alaska Native. dThe mean indicated is the national average for 4-year-olds on the Letter-Word Identification subtest of the
Woodcock-Johnson III.eThe mean indicated is the national average for 4-year-olds on the Applied Problems subtest of the Woodcock-
Johnson III.fFor all teacher-reported variables in the table, data are available for at least 94 percent of the sample. For all
directly assessed variables in the table, data are available for between 84 and 92 percent of the sample. For all parent-reported variables in the table, data are available for between 85 and 87 percent of the sample, with the exception of monthly income, which is available for 70 percent of the sample. Age and percentage female are available for at least 99.9 percent of the sample.

250
Difference(Leavers vs. Effect
Characteristica Stayers Leavers Stayers) Sizeb
DemographicsAge (years) 42.89 40.39 -2.49 -0.21Race and ethnicity (%)
White, non-Hispanic 28.25 32.39 4.14 0.09African-American, non-Hispanic 30.24 28.98 -1.26 -0.03Hispanic 33.25 33.84 0.59 0.01Other/multiracialc 8.09 4.76 -3.33 -0.14
Bachelor's degree or higher (%) 63.56 68.51 4.95 0.10Teaching experience (%)
< 3 years 4.47 13.31 8.84 ** 0.403 to < 10 years 27.89 36.02 8.13 0.18≥ 10 years 67.60 50.51 -17.09 ** -0.36
Teacher burnout Burnout (0-54)d 13.96 16.62 2.66 * 0.26
Teacher depressionK-6 depression score (0-24) 2.89 3.43 0.54 0.17
Teacher emotion and socialization practicesSocial-emotional practices (%)
Focus on academic 4.05 8.39 4.35 0.25Neutral focus 78.50 66.53 -11.96 * -0.30Focus on social-emotional development 17.49 25.16 7.67 0.21
Emotion coaching (0-4) 3.53 3.47 -0.06 -0.11
Sample sizee
Teachers 223 69
Head Start CARES Demonstration
Appendix Table Q.2
Baseline Teacher Characteristics: Differences Between Teachers Who Leave the Program and Teachers Who Stay in the Program
SOURCE: MDRC calculations based on the spring lead teacher self-survey.NOTES: Statistical significance levels are indicated as follows: *** = 1 percent; ** = 5 percent; * = 10 percent.
Rounding may cause slight discrepancies in sums and differences.aThe rating scale for each outcome is shown in parentheses, from low to high.bEffect size is calculated by dividing the impact of the program (the difference between the means for the
program group and the control group) by the standard deviation for the control group.c“Other” includes Asian, Native Hawaiian/Pacific Islander, and American Indian/Alaska Native. dTeacher burnout was measured by the Maslach Burnout Inventory.eFor all variables in the table, data are available for at least 95 percent of the sample.

251
teachers left the Head Start CARES classrooms between baseline data collection (in the spring before the preschool year) and follow-up (in the spring of the preschool year). Fortunately for implementation, most of the teachers who left the sample left over the summer before imple-mentation in the classroom began. Teachers who left the sample were more likely to have fewer than 3 years of experience and less likely to have 10 years of experience or more; more likely to report being burned out; and less likely to report a neutral teaching focus. (See Appendix Table Q.2.) Notably, teacher turnover rates for The Incredible Years, PATHS, and Tools enhancement centers were not statistically significantly different from those for the control centers.

THIS PAGE INTENTIONALLY LEFT BLANK
Appendix R
Glossary

THIS PAGE INTENTIONALLY LEFT BLANK

255
GLOSSARY
Circle time: A large-group activity period in early childhood classrooms.
Classroom climate: Children’s experiences and interactions in the classroom.
Coaching: In this study, coaching entailed a 30-minute meeting with the coach, lead teacher, and assistant teacher, as well as a 60-minute observation period in the classroom.
Effectiveness study: A study designed to evaluate whether a fully developed intervention that has evidence of efficacy is effective when implemented under typical conditions through an independent evaluation.
Efficacy study: A study designed to evaluate whether or not a fully developed intervention is efficacious under limited or ideal conditions.
Emotion knowledge: An awareness of one’s emotions and those of others as well as an understanding of how to identify emotions both from facial expressions and in emotionally evocative situations.
Executive function: Set-shifting skills (or the ability to flexibly shift between different pieces of information), inhibitory skills (or the ability to stop or repress an immediate or spontaneous response in favor of a planned response), and working (or short-term) memory.
Externalizing problems: A form of behavior problems that manifests through acting-out or aggressive behavior.
Fidelity: In the field of program evaluation, “fidelity” denotes how closely a set of procedures, as delineated by a program model, was implemented as intended.
Grantee: The local public or private nonprofit agency that has been designated as a Head Start provider.
Impact: The difference between the average outcomes of groups randomized to differing program or control conditions, as measured during some period following random assignment. That difference is referred to as the “impact” of the program (or intervention) and, because of randomization, can be confidently attributed to assignment to the program.
Internalizing problems: A form of behavior problems that manifests through internalizing or withdrawn behavior such as depression or anxiety.

256
Learning behaviors: Children’s ability to focus their attention and behavior during classroom activities. Sometimes referred to as “approaches to learning.” This encompasses skills such as persistence, curiosity, and engagement.
Scaffolding: A teacher helping to support a child to reach a challenging task or skill that is just beyond the child’s current ability level.
Skills: “Building blocks” that are the prerequisites to behaviors.
Social behaviors: Children’s positive interactions with peers and teachers.
Social-emotional development/competence: The developing capacity of the child to form close and secure adult and peer relationships; experience, regulate, and express emotions in socially and culturally appropriate ways; and explore the environment and learn.1
Social problem-solving: A multistep process including the assessment of the problem, devel-oping solutions and understanding the outcomes of various solutions, and selecting a competent response from among the set of possible responses.
Teacher training: In this study, teacher training was an ongoing set of workshops offered throughout the year in which lead and assistant teachers could learn enhancement-specific material from highly skilled trainers at regular intervals.
Technical assistance: In this study, technical assistance included both pre-implementation support, such as the provision of coaching toolkits and a kick-off meeting, as well as regular check-ins and action based on data from a management information system.
1Yates et al. (2008).

257
References
Aikens, Nikki, Lara Kristin Hulsey, Emily Moiduddin, Ashley Kopack, Amy Takyi-Laryea, Louisa Tarullo, and Jerry West. 2011. Data Tables for FACES 2009 Head Start Children, Families, and Programs: Present and Past Data from FACES Report. OPRE Report 2011-33b. Washington, DC: Office of Planning, Research and Evaluation, Administration for Children and Families, U.S. Department of Health and Human Services.
Alexander, Karl L., Doris R. Entwisle, and Nader Kabbani. 2001. “The Dropout Process in Life Course Perspective: Early Risk Factors at Home and School.” Teachers College Record 103, 5: 760-822.
Arnold, David H., Camilo Ortiz, Justin C. Curry, Rebecca M. Stowe, Naomi E. Goldstein, Paige H. Fisher, Alexandra Zeljo, and Kseniya Yershova. 1999. “Promoting Academic Success and Preventing Disruptive Behavior Disorders through Community Partnership.” Journal of Community Psychology 27, 5: 589-598.
Bailey, Rebecca, and Stephanie Jones. 2013. “SECURe: An Applied Developmental Model for Social-Emotional and Self-Regulation-Related Skills from Birth to 3rd Grade.” Presented at NGA Policy Academy, Salt Lake City, UT, July 24-25.
Barnett, Steven W., Kwanghee Jung, Donald J. Yarosz, Jessica Thomas, Amy Hornbeck, Robert Stechuk, and Susan Burns. 2008. “Educational Effects of the Tools of the Mind Curriculum: A Randomized Trial.” Early Childhood Research Quarterly 23: 299-313.
Bierman, Karen L., Celene E. Domitrovich, Robert L. Nix, Scott D. Gest, Janet A. Welsh, Mark T. Greenberg, Clancy Blair, Keith E. Nelson, and Suhkdeep Gill. 2008a. “Promoting Academic and Social-Emotional School Readiness: The Head Start REDI Program.” Child Development 79, 6: 1802-1817.
Bierman, Karen L., Mark T. Greenberg, and the Conduct Problems Prevention Research Group (CPPRG). 1996. “Social Skills Training in the Fast Track Program.” Pages 65-86 in R. Dev. Peters and Robert J. McMahon (eds.), Preventing Childhood Disorders, Substance Abuse, and Delinquency. Thousand Oaks, CA: Sage.
Bierman, Karen L., Robert L. Nix, Mark T. Greenberg, Clancy Blair, and Celene E. Domitrovich. 2008b. “Executive Functions and School Readiness Intervention: Impact, Moderation, and Mediation in the Head Start REDI Program.” Development and Psychopathology 20: 821-843.
Bierman, Karen L., John D. Coie, Kenneth A. Dodge, Mark T. Greenberg, John E. Lochman, Robert J. McMahon, and Ellen Pinderhughes. 2010. “The Effects of a Multiyear Universal Social-Emotional Learning Program: The Role of Student and School Characteristics.” Journal of Consulting and Clinical Psychology 78, 2: 156-168.
Bierman, Karen L., Robert L. Nix, Brenda S. Heinrichs, Celene E. Domitrovich, Scott D. Gest, Janet A. Welsh, and Sukhdeep Gill. 2013. “Effects of Head Start REDI on Children’s Outcomes 1 Year Later in Different Kindergarten Contexts.” Child Development 85, 1: 140-159.

258
Blair, Clancy, Douglas Granger, and Rachel Peters Razza. 2005. “Cortisol Reactivity Is Positively Related to Executive Function in Preschool Children Attending Head Start.” Child Development 76, 3: 554-567.
Blair, Clancy B., and Rachel Peters Razza. 2007. “Relating Effortful Control, Executive Function, and False Belief Understanding to Emerging Math and Literacy Ability in Kindergarten.” Child Development 78, 2: 647-663.
Bloom, Howard, Carolyn J. Hill, Alison Rebeck Black, and Mark W. Lipsey. 2008. Performance Trajectories and Performance Gaps as Achievement Effect-Size Benchmarks for Educational Interventions. New York: MDRC.
Bodrova, Elena, and Deborah J. Leong. 2007. Tools of the Mind: The Vygotskian Approach to Early Childhood Education. Second Edition. Columbus, OH: Merrill/Prentice Hall.
Briggs-Gowan, Margaret, and Alice S. Carter. 2008. “Social-Emotional Screening Status in Early Childhood Predicts Elementary School Outcomes.” Pediatrics 121, 5: 957-962.
Brooks-Gunn, Jeanne, Greg J. Duncan, and J. Lawrence Aber (eds.). 1997. Neighborhood Poverty: Vol. 1. Context and Consequences for Children; Vol. 2. Policy Implications in Studying Neighborhoods. New York: Russell Sage Foundation.
Brouwers, Andre, and Welco Tomic. 2000. “A Longitudinal Study of Teacher Burnout and Perceived Self-Efficacy in Classroom Management.” Teaching and Teacher Education 16: 2: 239-253.
Brownell, R. 2000. Expressive One-Word Picture Vocabulary Test Manual. Novata, CA: Academic Therapy Publications
Campbell, Frances A., Craig T. Ramey, Elizabeth Pungello, Joseph Sparling, and Shari Miller-Johnson. 2002. “Early Childhood Education: Young Adult Outcomes from the Abecedarian Project.” Applied Developmental Science 6, 1: 42-57.
Campbell, Susan B., Daniel D. Shaw, and Miles Gilliom. 2000. “Early Externalizing Behavior Problems: Toddlers and Preschoolers at Risk for Later Maladjustment.” Developmental Psychopathology 12, 3: 467-488.
Canen, Eric L., Bistra Anatchakova, and Thomas A. Furgeson. 2007. Parent Survey on School Safety and Security. WYSAC Technical Report No. CJR-706. Laramie, WY: Wyoming Survey & Analysis Center, University of Wyoming.
Caspi, A., T. E. Moffitt, D. L. Newman, and P. A. Silva. 1996. “Behavioral Observations at Age 3 Years Predict Adult Psychiatric Disorders: Longitudinal Evidence from a Birth Cohort.” Archive of General Psychiatry 53, 11: 1033-1039.
Center on the Social and Emotional Foundations for Early Learning. 2008. “Handout 1.7. Definition of Social Emotional Development.” CSEFEL Infant-Toddler Module 1. Nashville, TN: Center on the Social and Emotional Foundations for Early Learning. Website:
http://csefel.vanderbilt.edu/resources/inftodd/mod1/1.7.pdf.

259
Clements, Douglas H., Julie Sarama, Fatih Unlu, and Carolyn Layzer. 2012. “The Efficacy of an Intervention Synthesizing Scaffolding Designed to Promote Self-Regulation with an Early Mathematics Curriculum: Effects on Executive Function.” Paper presented at the Spring 2012 Society for Research on Educational Effectiveness (SREE) Conference.
Consortium on the School-Based Promotion of Social Competence. 1994. “The School-Based Promotion of Social Competence: Theory, Research, Practice, and Policy.” Pages 269-315 in Robert J. Haggerty, Lonnie R. Sherrod, Norman Garmezy, and Michael Rutter (eds.), Stress, Risk and Resilience in Children and Adolescence: Processes, Mechanisms, and Interventions. New York: Cambridge University Press.
Cooper, David H., and Dale Clark Farran.1991. The Cooper-Farran Behavioral Rating Scales. Brandon, VT: Clinical Psychology Publishing.
Crick, Nicki R., and Kenneth A. Dodge. 1994. “A Review and Reformulation of Social Information-Processing Mechanisms in Children’s Social Adjustment.” Psychological Bulletin 115:74-101.
Cunha, Flavio, and James J. Heckman. 2010. “Investing in Our Young People.” NBER Working Paper Series. Cambridge, MA: National Bureau of Economic Research.
Darlington, Richard B. 1990. Regression and Linear Models. New York: McGraw-Hill Education.
Denham, Susanne A. 1997. “When I Have a Bad Dream, Mommy Holds Me”: Preschoolers’ Conceptions of Emotions, Parental Socialisation, and Emotional Competence.” International Journal of Behavioral Development 20, 2: 301-319.
Denham, Susanne A., and Beverly Bouril. 1994. “Preschoolers’ Affect and Cognition about Challenging Peer Situations.” Child Study Journal 24, 1.
Denham, Susanne A., Sara Kalb, Erin Way, Heather Warren-Khot, Brittany L. Rhoads, and Hideko H. Bassett. 2013. “Social and Emotional Information Processing in Preschoolers: Indicator of Early School Success?” Early Child Developmental Care 183, 5: 667-688.
Diamond, Adele, Steven W. Barnett, Jessica Thomas, and Sarah Munro. 2007. “Supporting Online Material for Preschool Program Improves Cognitive Control.” Science 318: 1387-1411.
Diamond, Adele, and C. Taylor. 1996. “Development of an Aspect of Executive Control: Development of the Abilities to Remember What I Said and to Do as I Say, Not as I Do.” Developmental Psychobiology 29: 315-334.
Dodge, Kenneth A., Gregory S. Pettit, and John E. Bates. 1994. “Socialization Mediators of the Relation between Socioeconomic Status and Child Conduct Problems.” Child Development 65, 2: 649-665.
Dodge, Kenneth A., Gregory S. Pettit, John E. Bates, and E. Valente. 1995. “Social Information-Processing Patterns Partially Mediate the Effect of Early Physical Abuse on Later Conduct Problems. Journal of Abnormal Psychology 104: 632-643.

260
Dodge, Kenneth A., and Joseph M. Price. 1994. “On the Relation between Social Information Processing and Socially Competent Behavior in Early School-Aged Children.” Child Development 65: 1385-1397.
Domitrovich, Celene E., Rebecca C. Cortes, and Mark T. Greenberg. 2007. “Improving Young Children’s Social and Emotional Competence: A Randomized Trial of the Preschool ‘PATHS’ Curriculum.” The Journal of Primary Prevention 28, 2: 67-91.
Domitrovich, Celene E., Scott D. Gest, Sukhdeep Gill, Karen L. Bierman, Janet A. Welsh, and Da-mon Jones. 2009. “Fostering High-Quality Teaching with an Enriched Curriculum and Profes-sional Development Support: The Head Start REDI Program.” American Educational Re-search 46, 2: 567-597.
Duckworth, Angela L., Christopher Peterson, Michael D. Matthews, and Dennis R. Kelly. 2007. “Grit: Perseverance and Passion for Long-term Goals.” Journal of Personality and Social Psychology 92, 6: 1087-1101.
Durlak, Joseph A., Roger P. Weissberg, Allison B. Dymnicki, Rebecca D. Taylor, and Kriston B. Schellinger. 2011. “The Impact of Enhancing Students’ Social and Emotional Learning: A Meta-analysis of School-based Universal Intervention.” Child Development 82, 1: 405-432.
Entwisle, Doris R., and Leslie Alec Hayduk. 1988. “Lasting Effects of Elementary School.” Sociology of Education 61, 3: 147-159.
Erdley, Cynthia A. and Steven R. Asher. 1999. “A Social Goals Perspective on Children’s Social Competence.” Journal of Emotional and Behavioral Disorders 7, 3: 156-167.
Fantuzzo, John W., Rebecca Bulotsky-Shearer, Rachel A. Fusco, and Christine McWayne. 2005. “An Investigation of Preschool Classroom Behavioral Adjustment Problems and Social-Emotional School Readiness Competencies.” Early Childhood Research Quarterly 20 3: 259-275.
Farmer, Elizabeth M. Z., Dalene K. Stangl, Barbara J. Burns, E. Jane Costello, and Adrian Angold. 1999. “Use, Persistence, and Intensity: Patterns of Care for Children’s Mental Health Across One Year.” Community Mental Health Journal 35: 31-46.
Farran, Dale, Mark W. Lipsey, and Sandra Jo Wilson. 2012. “Experimental Evaluation of the Tools of the Mind Curriculum.” Paper presented at the Society for Research on Educational Effectiveness (SREE) Spring Conference, Washington, DC, March 8-11.
Garner, Pamela W., Diane Carlson Jones, Gaylyn Gaddy, and Kimberley M. Rennie. 1997. “Low-income Mother’s Conversations about Emotions and Their Children’s Emotional Competence.” Social Development 6, 1: 37-52.
Garner, Pamela W., Diane Carlson Jones, and Jennifer L. Miner. 1994. “Social Competence among Low-Income Preschoolers: Emotion Socialization Practices and Social Cognitive Correlates.” Child Development 65, 2: 622-637.

261
Garner, Pamela W., and Badiyyah Waajid. 2008. “The Associations of Emotion Knowledge and Teacher-Child Relationships to Preschool Children’s School-related Developmental Competence.” Journal of Applied Developmental Psychology 29: 89-100.
Gresham, Frank, and Stephen N. Elliott. 1990. Social Skills Rating System Manual. Minneapolis, MN: NCS Pearson, Inc.
Hakim-Larson, Julie, Alison Parker, Catharine Lee, Jacqueline Goodwin, and Sylvia Voelker. 2006. “Measuring Parental Meta-Emotion: Psychometric Properties of the Emotion-Related Parent-ing Styles Self-Test.” Early Education and Development 17, 2: 229-251.
Hamre, Bridget K., and Robert C. Pianta. 2001. “Early Teacher-Child Relationships and the Trajectory of Children’s School Outcomes through Eighth Grade.” Child Development 72, 2: 625-638.
Hamre, Bridget K. and Robert C. Pianta. 2005. “Can Instructional and Emotional Support in the First-Grade Classroom Make a Difference for Children at Risk of School Failure?” Child Development 76: 949-967.
Hamre, Bridget K., Robert C. Pianta, Andrew J. Mashburn, and Jason T. Downer. 2007. Building a Science of Classrooms: Application of the CLASS Framework in over 4,000 U.S. Early Childhood and Elementary Classrooms. New York: Foundation for Child Development.
Hamre, Bridget K., Robert C. Pianta, Andrew J. Mashburn, and Jason T. Downer. 2012. “Promoting Young Children’s Social Competence through the Preschool PATHS Curriculum and MyTeachingPartner Professional Development Resources.” Early Education and Development 23, 6: 809-832.
Herman, Keith C., Lindsay A. Borden, Wendy R. Reinke, and Carolyn Webster-Stratton. 2011. “The Impacts of Incredible Years Parent, Child, and Teacher Training Programs on Children’s Co-Occuring Internalizing Symptoms.” School Psychology Quarterly 26, 3: 189-201.
Hsueh, JoAnn, Amy E. Lowenstein, Pamela A. Morris, Shira Kolnik Mattera, and Michael Bangser. Forthcoming. Impacts on Three-Year-Old Children in the Head Start CARES Demonstration (working title). Washington, DC: Office of Planning, Research and Evaluation, Administration for Children and Families, U.S. Department of Health and Human Services.
Hyde, Janet Shibley, and Marcia C. Linn. 1988. “Gender Differences in Verbal Ability: A Meta-Analysis.” Psychological Bulletin 104, 1: 53-69.
Izard, Carroll, Sarah Fine, David Schultz, Allison Mostow, Brian Ackerman, and Eric Youngstrom. 2001. “Emotion Knowledge as a Predictor of Social Behavior and Academic Competence in Children at Risk.” American Psychological Society 12, 1: 18-23.
Justice, L. M., Y. Petscher, C. Schatschneider, and A. Mashburn. 2011. “Peer Effects in Preschool Classrooms: Is Children’s Language Growth Associated with Their Classmates’ Skills?” Child Development 82, 6: 1768-1777.
262
Kessler, Ronald C., Peggy R. Barker, Lisa J. Colpe, Joan F. Epstein, Joseph C. Gfroerer, Eva Hiripi, Mary J. Howes, Sharon-Lise T. Normand, Ronald W. Manderscheid, Ellen E. Walters, and Alan M. Zaslavsky. 2003. “Screening for Serious Mental Illness in the General Population.” Archives of General Psychiatry 60: 184-189.
Kline, Rex B. 2005. Principles and Practice of Structural Equation Modeling. Second Edition. New York: The Guilford Press.
La Paro, K. M., R. C. Pianta, and M. Stuhlman. 2004. “The Classroom Assessment Scoring System: Findings from the Pre-kindergarten Year.” The Elementary School Journal 104, 5: 409-426.
Ladd, Gary W., Sandra H. Birch, and Eric S. Buhs. 1999. “Children’s Social and Scholastic Lives in Kindergarten: Related Spheres of Influence?” Child Development 70, 6: 1373-1400.
Ladd, Gary W., Eric S. Buhs, and Wendy Troop. 2002. “Children’s Interpersonal Skills and Relationships in School Settings: Adaptive Significance and Implications for School-Based Prevention and Intervention Programs.” Pages 394-256 in Peter K. Smith and Craig H. Hart (eds.), Blackwell Handbook of Childhood Social Development. Malden, MA: Blackwell Publishers.
Leong, Deborah J., Elena Bodrova, Barbara Wilder-Smith, and Ruth Hensen, with Amy Hornbeck, Danielle Erickson, Sheila Williams, and Juanita Regher. 2009-2011. Tools of the Mind Pre-K Condensed Manual. Sixth Edition. Denver, CO: Center for Improving Early Learning, Metropolitan State College of Denver.
Lloyd, Chrishana M., and Emily L. Modlin. 2012. Coaching as a Key Component in Teachers’ Professional Development: Improving Classroom Practices in Head Start Settings. Washington, DC: Office of Planning, Research, and Evaluation, Administration for Children and Families, U.S. Department of Health and Human Services.
Lonigan, Christopher J., and Beth M. Phillips. 2012. “Comparing Skills-Focused and Self-Regulation Focused Preschool Curricula: Impacts on Academic and Self-Regulatory Skills.” Paper presented at SREE: Washington, DC, March 8-11.
Malecki, Christine Kerres, and Stephen N. Elliot. 2002. “Children’s Social Behaviors as Predictors of Academic Achievement: A Longitudinal Analysis.” School Psychology Quarterly 17, 1: 1-22.
Maslach, Christina, Susan E. Jackson, and Michael P. Leiter. 1996. Maslach Burnout Inventory Manual. Third Edition. Menlo Park, CA: Mind Garden.
Mattera, Shira, Chrishana M. Lloyd, Mike Fishman, and Michael Bangser. 2013. A First Look at the Head Start CARES Demonstration: Large-Scale Implementation of Programs to Improve Children’s Social-Emotional Competence. OPRE Report 2013-47. Washington, DC: Office of Planning, Research and Evaluation, Administration for Children and Families, U.S. Department of Health and Human Services.

263
McClelland, Megan M., Claire E. Cameron, Carol McDonald Connor, Carrie L. Farris, Abigail M. Jewkes, and Frederick J. Morrison. 2007. “Links Between Behavioral Regulation and Preschoolers’ Literacy, Vocabulary, and Math Skills.” Developmental Psychology 43, 4: 947-959.
McClelland, Megan M., Frederick J. Morrison, and Deborah. L. Holmes. 2000. “Children at Risk for Early Academic Problems: The Role of Learning-Related Social Skills.” Early Childhood Research Quarterly 15, 3: 307-329.
Minnesota Early Learning Foundation (MELF). 2011. MELF Kindergarten Follow-Up: Preliminary Report. Minneapolis, MN: Minnesota Early Learning Foundation.
Moiduddin, E., N. Aikens, L. Tarullo, J. West, and Y. Xue. 2012. Child Outcomes and Classroom Quality in FACES 2009. OPRE Report No. 2012-37a. Washington, DC: Office of Planning, Research and Evaluation, Administration for Children and Families, U.S. Department of Health and Human Services.
Morris, Pamela, Chrishana M. Lloyd, Megan Millenky, Nicole Leacock, C. Cybele Raver, and Michael Bangser. 2013. Using Classroom Management to Improve Preschoolers’ Social and Emotional Skills: Final Impact and Implementation Findings from the Foundations of Learning Demonstration in Newark and Chicago. New York: MDRC.
Morris, Pamela, Megan Millenky, C. Cybele Raver, and Stephanie Jones. 2013. “Does a Preschool Social and Emotional Learning Intervention Pay Off for Classroom Instruction and Children’s Behavior and Academic Skills? Evidence From the Foundations of Learning Project.” Early Education and Development 24: 1020-1042.
Morris, Pamela, C. Cybele Raver, Megan Millenky, Stephanie Jones, and Chrishana M. Lloyd. 2010. Making Preschool More Productive: How Classroom Management Training Can Help Teachers. New York: MDRC.
Murray, Desiree W., Natalie Murr, and David L. Rabiner. 2012. “Preliminary Effects of the Incredible Years Teacher Training Program on Classroom Management Skills.” Paper presented at the Society for Research on Educational Effectiveness (SREE) Spring Conference: Washington, DC, March 8-11.
National Center for Education Statistics. 2013. Kindergarten Entry Status: On-Time, Delayed-Entry, and Repeating Kindergartners. Washington, DC: National Center for Education Statistics.
National Center for Education Statistics. n.d. Academic Rating Scale. Washington, DC: National Center for Education Statistics. Website: http://nces.ed.gov/ECLS/kinderinstruments.asp.
National Center on Quality Teaching and Learning. n.d. “Understanding and Using the CLASS for Program Improvement.” Washington, DC: Office of Head Start. Website:
http://eclkc.ohs.acf.hhs.gov/hslc/tta-system/teaching/docs/CLASS.pdf
Odom, Samuel L. 2009. “The Tie That Binds: Evidence-based Practice, Implementation Science, and Outcomes for Children.” Topics in Early Childhood Special Education 29, 1: 53-61.

264
Office of Head Start. n.d. Program Information Report (PIR). Washington, DC: U.S. Department of Health and Human Services, Administration for Children and Families.
Olson, Sheryl L., Arnold J. Sameroff, David C. Kerr, Nestor L. Lopez, and Henry M. Wellman. 2005. “Developmental Foundations of Externalizing Problems in Young Children: The Role of Effortful Control.” Development and Psychopathology 17, 1: 25-45.
Orobio de Castro, Bram, Joop D. Bosch, Jan W. Veerman, and Willem Koops. 2003. “The Effects of Emotion Regulation, Attribution, and Delay Prompts on Aggressive Boys’ Social Problem Solving. Cognitive Therapy and Research 27: 153-166.
Pianta, Robert C., Karen M. La Paro, and Bridget K. Hamre. 2008. Classroom Assessment Scoring System Manual: Pre-K. Baltimore, MD: Paul H. Brookes Publishing Co.
Ponitz, Claire E. Cameron, Megan M. McClelland, Abigail M. Jewkes, Carol McDonald Conoor, Carrie L. Farris, and Frederick J. Morrison. 2008. “Touch Your Toes! Developing a Direct Measure of Behavioral Regulation in Early Childhood.” Early Childhood Research Quarterly 23: 141-158.
Raver, C. Cybele. 2002. “Emotions Matter: Making the Case for the Role of Young Children’s Emotional Development for Early School Readiness.” Social Policy Report 16, 3.
Raver, C. Cybele, Celene E. Domitrovich, Mark T. Greenberg, Pamela A. Morris, and Shira Kolnik Mattera. 2012. “Adapted Teaching Style Rating Scale.” Unpublished. New York: MDRC.
Raver, C. Cybele, Pamela W. Garner, and Radiah Smith-Donald. 2007. “The Roles of Emotion Regulation and Emotion Knowledge for Children’s Academic Readiness: Are the Links Causal?” Pages 121-147 in Robert C. Pianta, Martha J. Cox, and Kyle L. Snow (eds.), School Readiness and the Transition to Kindergarten in the Era of Accountability. Baltimore, MD: Brookes Publishing.
Raver, C. Cybele, Stephanie M. Jones, Christine P. Li-Grining, Molly Metzger, Kina Smallwood, and Latriese Sardin. 2008. “Improving Preschool Classroom Processes: Preliminary Findings from a Randomized Trial Implemented in Head Start Settings.” Early Childhood Research Quarterly 63, 3: 253-255.
Raver, C. Cybele, Stephanie M. Jones, Christine Li-Grining, Fuhua Zhai, Molly W. Metzger, and Bonnie Solomon. 2009. “Targeting Children’s Behavior Problems in Preschool Classrooms: A Cluster-Randomized Controlled Trial.” Journal of Consulting and Clinical Psychology 77, 2: 302-316.
Raver, C. Cybele, Stephanie M. Jones, Christine Li-Grining, Fuhua Zhai, Kristen Bub, and Emily Pressler. 2011. “CSRP’s Impact on Low-Income Preschoolers’ Preacademic Skills: Self-Regulation as a Mediating Mechanism.” Child Development 82, 1: 362-378.
Raver, C. Cybele, and M. Spagnola. 2002. “When My Mommy Was Angry, I Was Speechless: Children’s Perceptions of Maternal Emotional Expressiveness within the Context of Economic Hardship.” Marriage and Family Review 34, 1-2: 63-88.

265
Reid, M. Jamila, Carolyn Webster-Stratton, and Mary Hammond. 2003. “Follow-Up of Children Who Received the Incredible Years Intervention for Oppositional-Defiant Disorder: Maintenance and Prediction of 2-Year Outcome.” Behavior Therapy 34: 471-491.
Rhoades, Brittany L., Heather K. Warren, Celene E. Domitrovich, and Mark T. Greenberg. 2011. “Examining the Link between Preschool Social-emotional Competence and First Grade Academic Achievement: The Role of Attention Skills.” Early Childhood Research Quarterly 26: 182-191.
Ribordy, Sheila, Linda A. Camras, Roger Stefani, and Steven Spaccarelli. 1988. “Vignettes for Emotion Recognition Research and Affective Therapy with Children. Journal of Clinical Child Psychology 17, 4.
Schwartz, David, Steven McFadyen-Ketchum, Kenneth A. Dodge, Gregory S. Pettit, and John E. Bates. 1999. “Early Behavior Problems as a Predictor of Later Peer Group Victimization: Moderators and Mediators in the Pathways of Social Risk.” Journal of Abnormal Child Psychology 27: 191-201.
Schweinhart, Lawrence J., Helen V. Barnes, and David P. Weikart. 1993. Significant Benefits: The High/Scope Perry Preschool Study through Age 27. Monographs of the High/Scope Educational Research Foundation. Ypsilanti, MI: High/Scope Educational Research Foundation.
Tominey, Shauna L., and Megan M. McClelland. 2011. “Red Light, Purple Light: Findings from a Randomized Trial Using Circle Time Games to Improve Behavioral Self-regulation in Preschool.” Early Education and Development 22, 3: 489-519.
University Council for Educational Administration. n.d. “IES Funding Opportunities for Improving Education Systems.” PowerPoint presentation. Washington, DC: U.S. Department of Education, Institute of Education Sciences. Website:
http://ies.ed.gov/funding/webinars/previous_webinars.asp.
U.S. Department of Agriculture. 2004. “Measuring Rurality: Rural-Urban Continuum Codes.” Website: http://www.ers.usda.gov/briefing/rurality/RuralUrbcon/.
Webster-Stratton, Carolyn, and M. Jamila Reid. 2003. “Treating Conduct Problems and Strengthening Social and Emotional Competence in Young Children: The Dina Dinosaur Treatment Program.” Journal of Emotional and Behavioral Disorders 11, 3: 130-143.
Webster-Stratton, Carolyn, M. Jamila Reid, and Mary Hammond. 2001. “Preventing Conduct Problems, Promoting Social Competence: A Parent and Teacher Training Partnership in Head Start.” Journal of Clinical Child Psychology 30, 3: 238-302.
Webster-Stratton, Carolyn, M. Jamila Reid, and Mary Hammond. 2004. “Treating Children with Early-Onset Conduct Problems: Intervention Outcomes for Parent, Child, and Teacher Training.” Journal of Clinical Child and Adolescent Psychology 33, 1: 105-124.
266
Webster-Stratton, Carolyn, M. Jamila Reid, and Mike Stoolmiller. 2008. “Preventing Conduct Problems and Improving School Readiness: Evaluation of the Incredible Years Teacher and Child Training Programs in High-Risk Schools.” Journal of Child Psychology and Psychiatry 49, 5: 471-488.
Wise, Sarah, Lisa da Silva, Elizabeth Webster, and Ann Sanson. 2005. The Efficacy of Early Child-hood Interventions. No. 14. Melbourne, Australia: Department of Family and Community Ser-vices.
Woodcock, Richard W., Kevin S. McGrew, and Nancy Mather. 2001. Woodcock-Johnson III. Rolling Meadows, IL: Riverside Publishing.
Yates, Tweety, Michaelene M. Ostrosky, Gregory A. Cheatham, Angel Fettig, LaShorage Shaffer, and Rosa Milagros Santos. 2008. Research Synthesis on Screening and Assessing Social-Emotional Competence. Nashville, TN: Center on the Social and Emotional Foundations for Early Learning. Website: http://csefel.vanderbilt.edu/documents/rs_screening_assessment.pdf.
Yoshikawa, Hirokazu. 1995. “Long-term Effects of Early Childhood Programs on Social Outcomes and Delinquency.” The Future of Children 5, 3: 51-75.
Zhai, Fuhua, C. Cybele Raver, and Stephanie M. Jones. 2012. “Academic Performance of Subsequent Schools and Impacts of Early Interventions: Evidence from a Randomized Controlled Trial in Head Start Settings.” Children and Youth Services Review 34, 5: 946-954.
Zill, Nicholas. 1990. Behavior Problems Index Based on Parent Report. Washington, DC: Child Trends.
267
Earlier Publications on Head Start CARES
Head Start CARES for Migrant and Seasonal Families Adapting a Preschool Social-Emotional Curriculum 2014. Mike Fishman, Jessica Wille. A First Look at the Head Start CARES Demonstration Large-Scale Implementation of Programs to Improve Children’s Social-Emotional Competence 2013. Shira Kolnik Mattera, Chrishana M. Lloyd, Mike Fishman, Michael Bangser. Coaching as a Key Component in Teachers’ Professional Development Improving Classroom Practices in Head Start Settings 2012. Chrishana M. Lloyd, Emily L. Modlin.
____________________________ NOTE: A complete publications list is available from MDRC and on its Web site (www.mdrc.org), from which copies of reports can also be downloaded.

THIS PAGE INTENTIONALLY LEFT BLANK