impact evaluation report for 2018 and 2019 production
TRANSCRIPT

Impact Evaluation Report for 2018 and 2019 Production Efficiency Program April 9, 2021
Prepared for:
Energy Trust of Oregon
421 SW Oak Street, Suite 300
Portland, OR 97204

Prepared by:
Jeff Cropp
Joel Zahlan
Bonnie Powell
Maggie Buffum
i
Table of Contents Acronyms ......................................................................................................................................... iii
Acknowledgements........................................................................................................................... iv
Executive Summary ............................................................................................................................ 1
Realization Rates Summary .................................................................................................................... 2
Introduction .................................................................................................................................... 10
2018 and 2019 Program Savings .......................................................................................................... 10
Report Organization ............................................................................................................................. 14
Impact Evaluation Overview ............................................................................................................. 15
Evaluation Goals and Key Research Objectives .................................................................................... 15
Impact Evaluation Methodology .......................................................................................................... 15
Evaluation Sample ................................................................................................................................ 15
Sample Design ...................................................................................................................................... 17
Review Project Files .............................................................................................................................. 20
Develop Site Investigation Plans (Site-Specific M&V Plans) ................................................................. 21
Impact Evaluation Results and Findings ............................................................................................ 27
Realization Rates .................................................................................................................................. 27
Categorized Adjustments ..................................................................................................................... 29
Custom Capital Projects ....................................................................................................................... 33
Custom O&M Projects .......................................................................................................................... 35
Streamlined Industrial Projects (Green Motor Rewind, Lighting, Prescriptive, and Small Industrial) . 37
Strategic Energy Management Projects ............................................................................................... 40
Conclusions and Recommendations.................................................................................................. 43
Status of Recommendations from Prior Impact Evaluation Report ..................................................... 48
Appendix A. Customer Introduction Letter ............................................................................... A-1
Appendix B. Customer Interview Guides .................................................................................. B-1
Appendix C. Energy Trust Industrial Impact Evaluation Policies...................................................... C-1
Appendix D. Virtual Site Visit Memorandum ............................................................................. D-1
Appendix E. Confidential – Non-SEM Final Site Reports ................................................................. E-1
Appendix F. Confidential – SEM Final Site Reports ........................................................................ F-1

ii
Tables Table 1. 2018-2019 Program and Sample Total Electricity Project Quantities and Reported Savings ......... 1
Table 2. 2018-2019 Program and Sample Total Natural Gas Project Quantities and Reported Savings ...... 2
Table 3. Production Efficiency Program Realization Rates by Year and Fuel Type ....................................... 2
Table 4. Production Efficiency Program Realization Rates by Subtrack, Electric Savings ............................. 3
Table 5. Production Efficiency Program Realization Rates by Subtrack, Gas Savings .................................. 3
Table 6. Production Efficiency Program Savings Adjustment Category Summarya ...................................... 5
Table 7. Production Efficiency Program Completed Projects and Reported Savings, 2018 ....................... 11
Table 8. Production Efficiency Program Completed Projects and Reported Savings, 2019 ....................... 11
Table 9. Program and Sampled Savings by Program Track, 2018 ............................................................... 16
Table 10. Program and Sampled Savings by Program Track, 2019 ............................................................. 17
Table 11. Achieved Levels of Confidence and Precision by Program Track ................................................ 18
Table 12. Production Efficiency Program Realization Rate by Year and Fuel Type .................................... 27
Table 13. Electric Realization Rates by Track, Subtrack, and Year .............................................................. 27
Table 14. Gas Realization Rates by Track, Subtrack, and Year .................................................................... 28
Table 15. Production Efficiency Program Realization Rates for 2016, 2017, 2018, 2019 by Fuel Type ..... 29
Table 16. Production Efficiency Program Savings Adjustment Category Summarya .................................. 31
Table 17. Custom Capital Realization Rates Summary for 2018, 2019 and Combined .............................. 33
Table 18. Custom O&M Realization Rates Summary .................................................................................. 35
Table 19. Streamlined Industrial Realization Rates Summary .................................................................... 38
Table 20. SEM Rates Summary ................................................................................................................... 40
Figures Figure 1. Production Efficiency Electric Savings by Subtrack, 2018 and 2019 ............................................ 12
Figure 2. Production Efficiency Gas Savings by Subtrack, 2018 and 2019 .................................................. 12
Figure 3. Production Efficiency Electric Savings by Subtrack, 2018 and 2019 ............................................ 13
Figure 4. Production Efficiency Gas Savings by Subtrack, 2018 and 2019 .................................................. 13
Figure 5. Realization Rate Calculations for Convenience and Randomly Sampled Projects ....................... 19
Figure 6. Verification Methods Selection .................................................................................................... 25
Figure 7. Production Efficiency Electric Savings Cumulative Impact Evaluation Adjustments ................... 32
Figure 8. Production Efficiency Gas Savings Cumulative Impact Evaluation Adjustments ......................... 32

iii
Acronyms C Confidence
EMS Emergency Management System
HDD Heating Degree Days
IPMVP International Performance Measurement and Verification Protocol
M&V Measurement and Verification
MAD Measure Approval Document
O&M Operations and Maintenance
P Precision
PDCs Program Delivery Contractors
PE Production Efficiency
PPS Probability Proportional to Size
RR Realization Rates
SEM Strategic Energy Management
TAS Technical Analysis Study

iv
Acknowledgements The impact evaluation of the Production Efficiency program was made possible through the significant
support of Energy Trust evaluation and program staff, along with staff from the program delivery
contractors. Their collective assistance with customer outreach, ensuring the evaluation team had the
necessary data and information to verify and measure project savings, and the review of project
evaluation reports was a tremendous help with this evaluation. We sincerely thank each and all for their
support.

1
Executive Summary Energy Trust of Oregon (Energy Trust) is an independent nonprofit organization governed by a volunteer
board of directors and accountable to the Oregon Public Utility Commission. Energy Trust delivers
energy savings programs to Oregon customers of Portland General Electric, Pacific Power, NW Natural,
Cascade Natural Gas, and Avista, and customers of NW Natural in southwest Washington. As part of
Energy Trust’s ongoing efforts to improve program performance, it regularly completes impact and
process evaluations of its programs.
This report documents the impact evaluation Cadmus conducted of the Production Efficiency (PE)
program for program years 2018 and 2019. We evaluated each PE program track by year and by fuel
type. The PE program includes three main program tracks:
• Streamlined (prescriptive, small industrial, lighting, and green motor rewind)
• Custom
• Strategic energy management (SEM)
Eligible customers can participate in one, two, or all three program tracks.
For the evaluation of the 2018-2019 program, Cadmus sampled 216 distinct projects at 73 sites to
provide a mix of measure types. At those sites we also evaluated electricity savings for 19 additional
projects and gas savings for five additional projects as convenience measures. For each program year,
we estimated the total program electricity and natural gas savings with 90% confidence and ±10%
precision. We based these estimates on a representative sample of the project population, stratified by
program year, fuel type, and track (custom, streamlined, and SEM), as well as track substratification to
target custom capital and custom operations and maintenance (O&M) projects for more robust
evaluation.
Cadmus sampled projects using probability proportional to size (PPS) within each stratum. As shown in
Table 1 and Table 2, the final sample represented 30% of electric savings and 85% of gas savings for the
program’s total reported savings.
Table 1. 2018-2019 Program and Sample Total Electricity Project Quantities and Reported Savings
Program
Year
Program
Projectsa
Sampled
Projectsa
Electric Savings (kWh)
Program Sampled Convenience Percent Sampled
2018 1,202 85 144,520,414 42,734,092 815,841 30%
2019 1,345 86 148,327,704 42,546,254 1,092,542 29%
Total 2,547 171 292,848,118 85,280,346 1,908,383 30% a A project is defined as a unique project ID within a program year.
2
Table 2. 2018-2019 Program and Sample Total Natural Gas Project Quantities and Reported Savings
Program
Year
Program
Projectsa
Sampled
Projectsa
Natural Gas Savings (Therms)
Program Sampled Convenience Percent Sampled
2018 90 35 2,634,532 2,299,750 6,019 88%
2019 94 39 1,144,386 827,435 60,653 78%
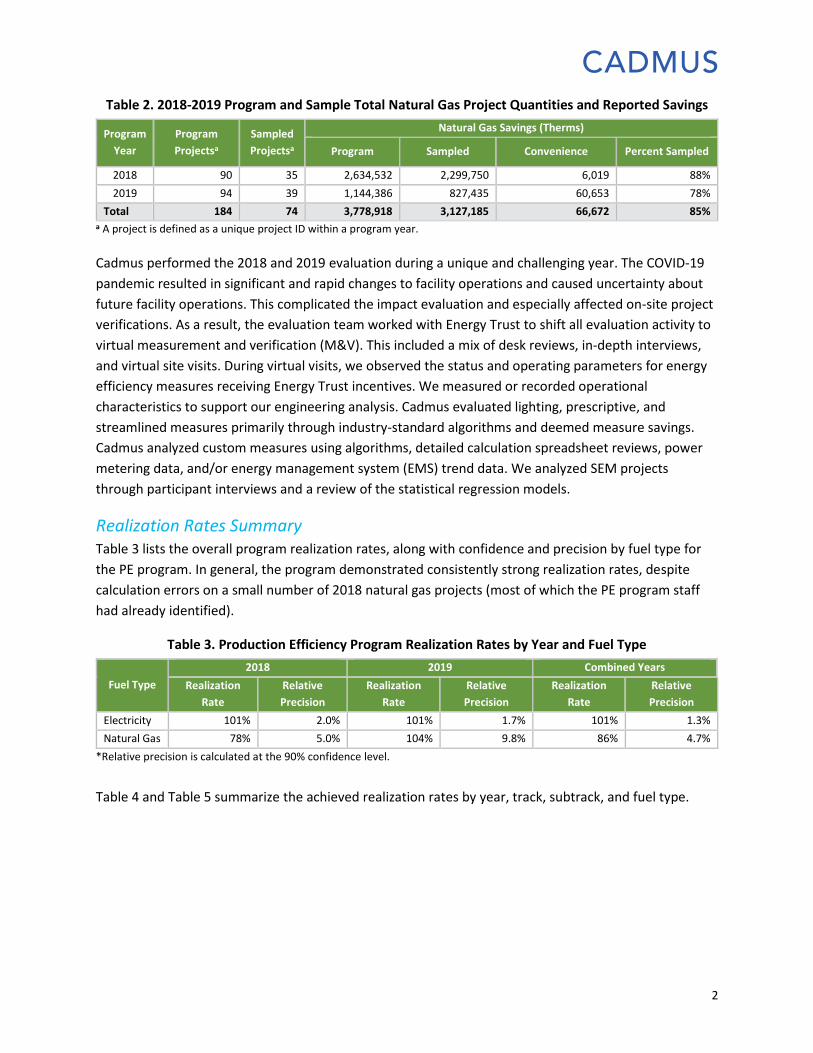
Total 184 74 3,778,918 3,127,185 66,672 85% a A project is defined as a unique project ID within a program year. Cadmus performed the 2018 and 2019 evaluation during a unique and challenging year. The COVID-19
pandemic resulted in significant and rapid changes to facility operations and caused uncertainty about
future facility operations. This complicated the impact evaluation and especially affected on-site project
verifications. As a result, the evaluation team worked with Energy Trust to shift all evaluation activity to
virtual measurement and verification (M&V). This included a mix of desk reviews, in-depth interviews,
and virtual site visits. During virtual visits, we observed the status and operating parameters for energy
efficiency measures receiving Energy Trust incentives. We measured or recorded operational
characteristics to support our engineering analysis. Cadmus evaluated lighting, prescriptive, and
streamlined measures primarily through industry-standard algorithms and deemed measure savings.
Cadmus analyzed custom measures using algorithms, detailed calculation spreadsheet reviews, power
metering data, and/or energy management system (EMS) trend data. We analyzed SEM projects
through participant interviews and a review of the statistical regression models.
Realization Rates Summary Table 3 lists the overall program realization rates, along with confidence and precision by fuel type for
the PE program. In general, the program demonstrated consistently strong realization rates, despite
calculation errors on a small number of 2018 natural gas projects (most of which the PE program staff
had already identified).
Table 3. Production Efficiency Program Realization Rates by Year and Fuel Type
Fuel Type
2018 2019 Combined Years
Realization
Rate
Relative
Precision
Realization
Rate
Relative
Precision
Realization
Rate
Relative
Precision
Electricity 101% 2.0% 101% 1.7% 101% 1.3%
Natural Gas 78% 5.0% 104% 9.8% 86% 4.7%
*Relative precision is calculated at the 90% confidence level.
Table 4 and Table 5 summarize the achieved realization rates by year, track, subtrack, and fuel type.

3
Table 4. Production Efficiency Program Realization Rates by Subtrack, Electric Savings
Track Subtrack 2018 2019 Combined Years
Realization
Rate
Relative
Precision*
Realization
Rate
Relative
Precision*
Realization
Rate
Relative
Precision*
Custom
Custom Capital 101% 3.3% 99% 1.2% 100% 1.6%
Custom O&M 93% 7.9% 97% 4.3% 95% 4.8%
Total 100% 3.0% 99% 1.1% 100% 1.5%
SEM SEM 99% 0.6% 97% 1.8% 98% 1.1%
Total 99% 0.6% 97% 1.8% 98% 1.1%
Streamlined
Industrial
Green Rewind 100% 0.0% 100% 0.0% 100% 0.0%
Lighting 103% 4.1% 103% 5.4% 103% 3.0%
Prescriptive 100% 0.0% 100% 0.0% 100% 0.0%
Small Industrial 94% 10.8% 105% 4.8% 99% 5.3%
Total 101% 3.1% 103% 3.3% 102% 2.2%
Total Total 101% 2.0% 101% 1.7% 101% 1.3%
*Relative precision is calculated at the 90% confidence level.
Table 5. Production Efficiency Program Realization Rates by Subtrack, Gas Savings
Track Subtrack
2018 2019 Combined Years
Realization
Rate
Relative
Precision*
Realization
Rate
Relative
Precision*
Realization
Rate
Relative
Precision*
Custom
Custom Capital 83% 10.5% 95% 2.3% 87% 6.0%
Custom O&M 100% 0.0% NA NA 100% 0.0%
Total 86% 8.2% 95% 2.3% 89% 5.2%
Streamlined
Industrial
SEM 100% 0.0% 100% 0.0% 100% 0.0%
Total 100% 0.0% 100% 0.0% 100% 0.0%
Prescriptive 62% 3.8% 124% 32.7% 77% 11.9%
Small Industrial 100% 0.0% 101% 0.6% 101% 0.5%
Total 63% 3.7% 119% 25.8% 79% 10.8%
Total Total 78% 5.0% 104% 9.8% 86% 4.7%
*Relative precision is the calculated at 90% confidence level.
Cadmus organized savings adjustments into the following categories:
• Different operating hours: Equipment operating hours differed from what was specified in the
ex ante savings calculations.
• Different equipment setpoints: Different equipment setpoints from those used in the ex ante
savings calculations. This included different temperature and pressure setpoints.
• Incorrect equipment specifications or quantities: This included incorrect equipment capacity,
wattage, efficiency, and quantity.
• Incorrect analysis methodology: We used a different analysis methodology from the ex ante
savings such as using energy management system trend data to build a new regression analysis,
normalizing baseline and installed periods, applying a day type methodology to air compressors,
or using a different Measure Approval Document (MAD) to calculate savings.

4
• Measure removal: This involved the removal of a measure at a closed or operational facility.
• Inappropriate baseline: This involved baseline equipment specifications that did not align with
code or industry standard practice.
• Inappropriate assumption: Any assumed values or conditions that were used in the calculation
of baseline or measure savings. This included cooling and heating efficiencies, fan affinity
exponents, and theoretical performance values.
• Calculation or engineering error: Situations where values in the ex ante savings calculation
workbook, invoices, or verification report did not match values used in the analysis; this
included spreadsheet formula errors or hard coded values that were not updated.
• (SEM) Non-SEM project realization rate adjustment: To avoid double counting savings from the
non-SEM projects incentivized through the Custom and Streamlined Industrial tracks, Cadmus
confirmed that these savings were subtracted from the SEM claimed savings. However, the
amount of savings subtracted from the SEM claimed savings differed between the ex ante and
ex post savings because Cadmus applied the track-level 2018-2019 PE impact evaluation
realization rates to the non-SEM projects. SEM savings for a site increased when the 2018-2019
non-SEM projects were assigned a realization rate of less than 100% and decreased when the
2018-2019 non-SEM projects were assigned a realization of more than 100%. Most SEM
adjustments were due to non-SEM project realization rates and did not indicate errors in the
claimed savings.
• (SEM) Decommissioned SEM project: Some SEM customers decommissioned projects after the
reporting period such that the savings for these projects were included in the annual estimate of
SEM savings. We applied a 90% realization rate to the site if we determined that the
decommissioned project contributed at least 10% of the SEM claimed savings.
• (SEM) Incorrect non-SEM project adjustment: Some sites incorrectly adjusted SEM savings for
non-SEM projects by either incorrectly prorating non-SEM project savings or not accounting for
a non-SEM project at all. Cadmus directly calculated realization rates for these sites by
correcting the adjustments.
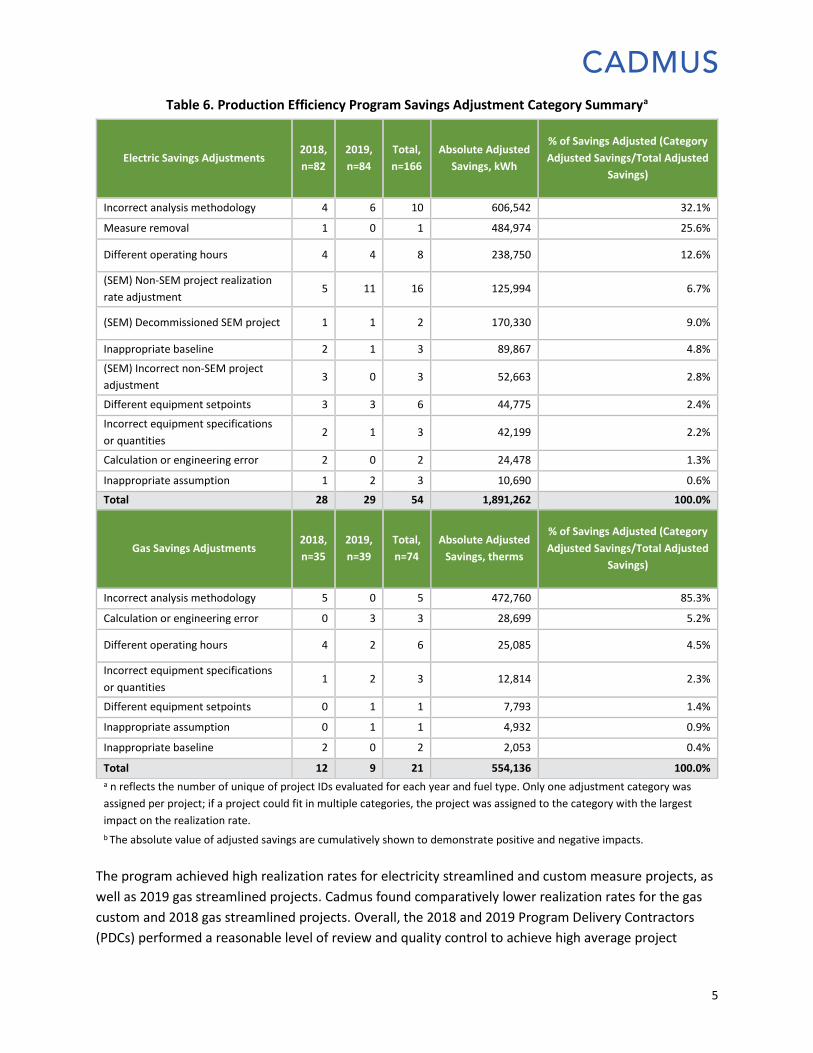
Table 6 shows the number of projects with adjustments and the absolute value of adjusted savings for
each category. For both electric and gas, the incorrect analysis methodology was the most prevalent
adjustment category.
Where multiple categories applied to one project, Cadmus assigned the project to the single category
that had the greatest impact on its realization rate.
5
Table 6. Production Efficiency Program Savings Adjustment Category Summarya
Electric Savings Adjustments 2018,
n=82
2019,
n=84
Total,
n=166
Absolute Adjusted
Savings, kWh
% of Savings Adjusted (Category
Adjusted Savings/Total Adjusted
Savings)
Incorrect analysis methodology 4 6 10 606,542 32.1%
Measure removal 1 0 1 484,974 25.6%
Different operating hours 4 4 8 238,750 12.6%
(SEM) Non-SEM project realization
rate adjustment 5 11 16 125,994 6.7%
(SEM) Decommissioned SEM project 1 1 2 170,330 9.0%
Inappropriate baseline 2 1 3 89,867 4.8%
(SEM) Incorrect non-SEM project
adjustment 3 0 3 52,663 2.8%
Different equipment setpoints 3 3 6 44,775 2.4%
Incorrect equipment specifications
or quantities 2 1 3 42,199 2.2%
Calculation or engineering error 2 0 2 24,478 1.3%
Inappropriate assumption 1 2 3 10,690 0.6%
Total 28 29 54 1,891,262 100.0%
Gas Savings Adjustments 2018,
n=35
2019,
n=39
Total,
n=74
Absolute Adjusted
Savings, therms
% of Savings Adjusted (Category
Adjusted Savings/Total Adjusted
Savings)
Incorrect analysis methodology 5 0 5 472,760 85.3%
Calculation or engineering error 0 3 3 28,699 5.2%
Different operating hours 4 2 6 25,085 4.5%
Incorrect equipment specifications
or quantities 1 2 3 12,814 2.3%
Different equipment setpoints 0 1 1 7,793 1.4%
Inappropriate assumption 0 1 1 4,932 0.9%
Inappropriate baseline 2 0 2 2,053 0.4%
Total 12 9 21 554,136 100.0%
a n reflects the number of unique of project IDs evaluated for each year and fuel type. Only one adjustment category was
assigned per project; if a project could fit in multiple categories, the project was assigned to the category with the largest
impact on the realization rate.
b The absolute value of adjusted savings are cumulatively shown to demonstrate positive and negative impacts.
The program achieved high realization rates for electricity streamlined and custom measure projects, as
well as 2019 gas streamlined projects. Cadmus found comparatively lower realization rates for the gas
custom and 2018 gas streamlined projects. Overall, the 2018 and 2019 Program Delivery Contractors
(PDCs) performed a reasonable level of review and quality control to achieve high average project
6
savings realization rates. PDCs proved extremely knowledgeable about facilities with which they worked
and were receptive to supporting evaluation efforts. Cadmus worked directly with PDCs on a few
occasions to contact facilities and acquire analysis files and data. We found that most PDCs quickly
provided any documentation they could access, identified appropriate facility contacts, and went out of
their way to assist with recruitment efforts.
We also found that Energy Trust implementation staff maintained a thorough understanding of project
details and participant sensibilities. Cadmus developed a large number of M&V plans for Energy Trust’s
staff review. Even though PDCs were more directly involved with project review and approval, senior
Energy Trust staff for this program had a strong knowledge of project and analysis details and could
provide significant feedback to improve M&V efforts. This was especially helpful when considering the
shift to virtual site visits where, in many cases, Cadmus had to rely on Energy Trust staff for data
requests and additional project files. Energy Trust staff were responsive and supportive of all evaluation
activities, which contributed to the success of the 2018-2019 impact evaluation.
Based on our evaluation findings, Cadmus recommends the following opportunities for program
improvements. We divide our recommendations into their respective tracks. If a recommendation
applies to multiple tracks, we have included it in the” Other Recommendations” section.
Custom Capital
• For compressed air savings analysis, we recommend the program use the day type analysis
methodology. This methodology looks at energy savings for each day type accounting for
differences in air demand across weekdays and weekends. This is particularly useful when
developing 8,760 load shapes and is beneficial when calculating air leak and air dryer savings.
We recommend avoiding averaging data across entire metering/trend data periods as this
eliminates some of the important and intricate changes over a metered period that should be
considered in the savings analysis. The day type methodology is referenced in the Uniform
Methods Protocol (UMP) Compressed Air Evaluation protocol1 and also used by the Department
of Energy’s Air Master Tool to estimate savings2.
Custom O&M
• For compressed air leak savings projects, we recommend using the system leak-down test as
highlighted in the UMP Compressed Air Protocol to estimate the combined loss (CFM) of
compressed-air leaks. This approached can be used in the baseline and retrofit case to estimate
the effect of leak fixes in the system. In cases where the system leak-down test is impractical,
flow should be estimated by measuring compressor power and correlating to flow using CAGI
sheets or standard flow tables. This compressor power should be measured during non-
1 Benton, Nathanael; Patrick Burns, and Joel Zahlan. (2021). Chapter 22: Compressed Air Evaluation Protocol. The Uniform
Methods Project: Methods for Determining Energy Efficiency Savings for Specific Measures. Golden, CO; National
Renewable Energy Laboratory. NREL/SR-7A40-77820. http://www.nrel.gov/docs/fy21osti/77820.pdf.
2 https://www.energy.gov/eere/amo/articles/airmaster.

7
production periods and all non-leak uses of air should be discounted from the data to determine
actual leak volume. Lastly, the most accurate approach is to measure actual flow rate in the
baseline and retrofit non-production periods and discount for any non-leak air uses. Installing
flow meters can sometimes be invasive and prove impractical and hence the two prior methods
are more common approaches. Ultrasonic leak detectors are good for identifying leaks and
estimating savings at a high level; however, the three approaches detailed above provide a more
accurate way of estimating leak loss.
• We recommend the program standardize the approach used to determine air-leak savings. Our
analysis found that there were a few leak projects that claimed more savings than available air
flow during nonproduction periods. This generally meant that the ultrasonic leak detector was
overestimating savings. Contractors used different methodologies to adjust leak rates and to
calculate savings for each of these projects, which resulted in different savings estimates. If pre-
and post-metered data are not available, standardize the approach to using findings from the
ultrasonic leak detector and adjust accordingly to reflect compressor flow during nonproduction
periods.
Streamlined Industrial
• We recommend the program use light loggers more frequently to determine lighting hours of
use and occupancy sensor savings for projects with significant electricity savings (i.e., greater
than 500,000 kWh) and those projects that also have occupancy sensors). This will provide more
accurate energy savings estimates.
• We recommend the program apply a uniform approach to calculating HVAC interactive effects
across all lighting projects. Upgrades to LED lights generally result in an increase in electricity
savings through cooling savings and an increase in gas or electric consumption due to additional
heating requirements. The program should apply a standardized approach to calculate
interactive effects across all lighting projects to ensure these effects are accounted for
appropriately. Lighting-related HVAC interactive effects are also covered in the Uniform
Methods Protocol (UMP) Commercial and Industrial Lighting Evaluation Protocol3
Strategic Energy Management
• The in-depth interviews with site contacts confirmed that the COVID-19 pandemic affected
facilities participating in SEM in a variety of ways. Some of these impacts may be long-lasting,
and many of the energy intensity models, as they stand now, could provide inaccurate forecasts
of baseline energy consumption in future program years. We recommend reviewing the effects
of COVID-19 at each facility to determine if projects require re-baselining and new energy
intensity models once normal operations resume post-pandemic.
3 Gowans, Dakers. (2013). Chapter 2: Commercial and Industrial Lighting Evaluation Protocol. The Uniform Methods Project:
Methods for Determining Energy Efficiency Savings for Specific Measures. Golden, CO; National Renewable Energy
Laboratory. NREL/SR-7A30-53827. https://www.energy.gov/sites/prod/files/2013/11/f5/53827-2.pdf.

8
• The Energy Trust SEM M&V Guidelines recommend sites use a 90-day or 12-month reporting
period for claiming annual program savings. Energy Trust should consider formally testing how
changes to the reporting period definition (months covered and length of the period) impacts
the annual savings claimed for a variety of facility types. Savings rates may remain consistent
across all 12 months for certain production sectors, but a formal investigation would provide
guidance on which facilities may suffer from greater inaccuracies under this assumption.
• When higher-frequency energy consumption data, such as daily data, are available for building
the energy intensity models, we recommend interacting production variables with indicators at
known change points to reduce modeling error and improve observed nonlinearity between
energy drivers and energy consumption. Change points should be driven by knowledge of the
facility to avoid overfitting.
• When appropriate, we recommend using heating and cooling degree-days in energy models
rather than average temperature and higher-order polynomials. Energy consumption tends to
correlate better to heating and cooling degree-days, especially when a high percentage of
facility energy use is for space and process heating and cooling.
• When SEM facilities diverge from IPMVP Option C for claiming energy savings due to their SEM
engagement, we recommend treating these projects like separate custom track projects
requiring a distinct impact evaluation approach and interview or site visit with a different site
contact – specifically, one most familiar with the major projects implemented.
• To assist with future qualitative assessments of SEM savings, Energy Trust should consider
requiring sites to include the expected energy savings generated from major SEM projects as
part of the opportunity register to increase the accuracy of realization rate adjustments based
on these activities.
Other Recommendations
Virtual Site Visits
• We recommend the program consider virtual site visits as an evaluation tool for verifying
savings moving forward, especially for straight-forward measures that do not require additional
metering or spot measurements. Cadmus developed a memo for Energy Trust titled, Virtual Site
Visit Memorandum, which details considerations for virtual site selection and for the most
appropriate measures for this verification method. See Appendix D. Virtual Site Visit
Memorandum for a copy of the memo.
Metering Periods
• We recommend the program use a minimum metering period of two weeks. Two weeks is
typically enough to capture a full production cycle, but this is also dependent on the type of
equipment, production schedule, seasonality, weather, and other factors. For example, HVAC
systems may require months of data at longer intervals or multiple metering periods to
characterize operation in the shoulder months. PDCs should take these dependencies into
consideration whenever metering.

9
Operations
• We recommend the program assign one PE number for each program track for Energy Trust
projects with multiple program tracks. For example, PE14040 had two measures, one in the
Custom Capital track and another in the Custom O&M track. Cadmus sampled at the project and
track level, and in this case, sampled the measure associated with the Custom O&M track.
Cadmus evaluated the savings of the measure in the Custom Capital track as part of the
convenience sample. Assigning one PE number for each program track will help distinguish
between the savings associated with the two tracks, aiding with sampling at the track level and
confidence and precision calculations.
• We recommend the program clearly specify projects that are located on the same site by
assigning unique site IDs for each site. In the 2018-2019 program data, projects located at the
same address did not always have the same site ID. In some cases, this resulted in contacting
sites on different occasions for verification activity. Assigning a clear and unique ID per site will
allow Energy Trust to filter for all projects at a specific site and reduce the amount of outreach
to sites with multiple projects.
421 SW Oak St., Suite 300 Portland, OR 97204 1.866.368.7878 energytrust.org
Memo To: Board of Directors
From: Erika Kociolek, Evaluation Sr. Project Manager Eric Braddock, Sr. Technical Manager – Industry and Agriculture
Date: August 9, 2021
Re: Staff Response to 2018-2019 Production Efficiency Impact Evaluation
The 2018-2019 Production Efficiency impact evaluation, conducted by Cadmus, demonstrates the program generated substantial energy savings and accurately estimated the majority of these savings, as evidenced by relatively high realization rates.
This impact evaluation kicked off at the beginning of the COVID-19 pandemic; the pandemic necessitated adjustments to the workplan, which was developed before the beginning of the pandemic. The evaluator performed all data collection virtually; in lieu of on-site visits, the evaluator performed desk reviews, interviews, and virtual site visits. Energy Trust evaluation staff, program staff, and the evaluator also worked to develop impact evaluation guidelines for broad social and economic changes such as the 2008 recession and the COVID-19 pandemic, both of which resulted in relatively rapid changes to facility operations and significant uncertainty about the future. These events, and the resulting changes to facility operations, complicate impact evaluation due to uncertainty about the duration of these events and the durability of the resulting changes to facility operations. Energy Trust evaluation staff, program staff, and the evaluator agreed for the 2018-2019 Production Efficiency impact evaluation, the evaluator would not use production, billing, or operational data from the COVID-19 pandemic period in the impact evaluation for sites that experienced changes to facility operations as a direct result of the COVID-19 pandemic; for those sites, the COVID-19 pandemic would essentially be considered a blackout period.
The evaluator made two key recommendations: (1) perform virtual site visits in lieu of on-site visits, especially for straightforward measures that do not require metering or spot measurements and (2) require a minimum metering period of two weeks. Regarding the first recommendation, Energy Trust evaluation staff agree virtual site visits worked well and has updated the impact evaluation RFP template to clarify on-site visits and/or virtual site visits are acceptable for future impact evaluations. Regarding the second recommendation, program staff is updating its study guidelines for the custom PDCs to include recommended metering periods.
Energy Trust evaluation staff initially proposed a 2020-2021 Production Efficiency impact evaluation and planned to transition to an “evaluation in waves” approach. The “evaluation in waves” approach would likely involve sampling projects and measures and evaluating sampled projects and measures quarterly or semi-annually, ensuring faster delivery of evaluation results. Ultimately, Energy Trust evaluation staff decided to move forward with a 2020 Production Efficiency impact evaluation and is not planning to transition to an “evaluation in waves” approach at this time. The drivers of this decision were significant differences in program operations between 2020 and 2021 (namely, the creation of a new business lighting program delivered by a new program delivery contractor) and anticipated challenges with evaluating 2020 (which has been anomalous in terms of facility operations). Energy Trust evaluation staff will revisit transitioning to an “evaluation in waves” approach in future impact evaluations.
10
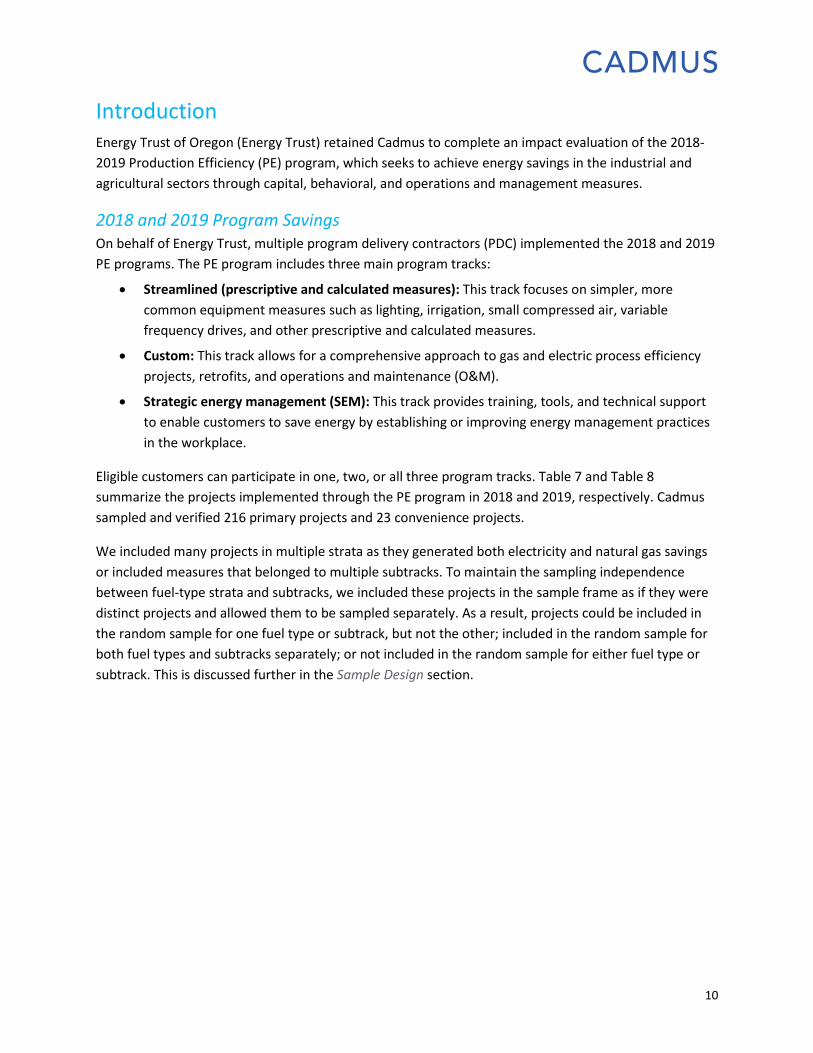
Introduction Energy Trust of Oregon (Energy Trust) retained Cadmus to complete an impact evaluation of the 2018-
2019 Production Efficiency (PE) program, which seeks to achieve energy savings in the industrial and
agricultural sectors through capital, behavioral, and operations and management measures.
2018 and 2019 Program Savings On behalf of Energy Trust, multiple program delivery contractors (PDC) implemented the 2018 and 2019
PE programs. The PE program includes three main program tracks:
• Streamlined (prescriptive and calculated measures): This track focuses on simpler, more
common equipment measures such as lighting, irrigation, small compressed air, variable
frequency drives, and other prescriptive and calculated measures.
• Custom: This track allows for a comprehensive approach to gas and electric process efficiency
projects, retrofits, and operations and maintenance (O&M).
• Strategic energy management (SEM): This track provides training, tools, and technical support
to enable customers to save energy by establishing or improving energy management practices
in the workplace.
Eligible customers can participate in one, two, or all three program tracks. Table 7 and Table 8
summarize the projects implemented through the PE program in 2018 and 2019, respectively. Cadmus
sampled and verified 216 primary projects and 23 convenience projects.
We included many projects in multiple strata as they generated both electricity and natural gas savings
or included measures that belonged to multiple subtracks. To maintain the sampling independence
between fuel-type strata and subtracks, we included these projects in the sample frame as if they were
distinct projects and allowed them to be sampled separately. As a result, projects could be included in
the random sample for one fuel type or subtrack, but not the other; included in the random sample for
both fuel types and subtracks separately; or not included in the random sample for either fuel type or
subtrack. This is discussed further in the Sample Design section.

11
Table 7. Production Efficiency Program Completed Projects and Reported Savings, 2018
Program
Year Track Subtrack Sitesa Projectsa Measuresa
Electricity
Savings
(kWh)
Gas
Savings
(therms)
Total
Evaluated
Projectsb
2018
Custom Custom Capital 102 116 161 43,277,676 1,230,131 28
Custom O&M 31 33 46 7,544,950 263,126 13
Custom Subtotal 133 149 207 50,822,626 1,493,257 41
Streamlined
Industrial
Green Rewind 21 32 33 92,496 - 6
Lighting 378 480 1,687 61,331,858 - 7
Prescriptive 306 369 828 7,153,486 987,712 20
Small Industrial 189 207 207 11,407,727 10,950 14
Streamlined Industrial
Subtotal 894 1,088 2,755 79,985,567 998,662 47
SEM SEM 35 35 35 13,712,221 142,613 21
Total 1,062 1,272 2,997 144,520,414 2,634,532 109
aSites, projects, and measures are defined as the number of unique site IDs, unique project IDs, and unique measure IDs per subtrack, respectively. bTotal sampled projects included 106 primary electricity projects and three convenience projects.
Table 8. Production Efficiency Program Completed Projects and Reported Savings, 2019
Program
Year Track Subtrack Sitesa Projectsa Measuresa
Electricity
Savings
(kWh)
Gas
Savings
(therms)
Total
Evaluated
Projectsb
2019
Custom Custom Capital 101 164 250 50,100,290 710,575 31
Custom O&M 28 30 34 4,859,875 - 12
Custom Subtotal 129 194 284 54,960,165 710,575 43
Streamlined
Industrial
Green Rewind 16 25 29 87,690 - 5
Lighting 439 534 2,200 51,586,461 - 7
Prescriptive 318 374 734 10,664,602 313,792 15
Small Industrial 222 248 249 12,160,759 74,852 18
Streamlined Industrial
Subtotal 995 1,181 3,212 74,499,511 388,643 45
SEM SEM 41 41 41 18,868,028 45,168 24
Total 1,165 1,416 3,537 148,327,704 1,144,386 112 aSites, projects, and measures are defined as the number of unique site IDs, unique project IDs, and unique measure IDs per subtrack, respectively. bTotal sampled projects included 110 primary gas projects and two convenience projects.
The custom capital and lighting subtracks contributed the most electric savings in 2018 (42% and 30%,
respectively) and 2019 (35% and 34%, respectively), as shown in Figure 1.

12
Figure 1. Production Efficiency Electric Savings by Subtrack, 2018 and 2019
The custom capital and prescriptive subtracks collectively represented over 84% of natural gas savings in
2018 and 89% of gas savings in 2019, as shown in Figure 2.
Figure 2. Production Efficiency Gas Savings by Subtrack, 2018 and 2019

13
Figure 3 and Figure 4 show electric and gas program savings, respectively, for the 2018 and 2019
program years. As shown in Figure 3, the majority of program electric savings in the 2018 and 2019
program years were in the lighting subtrack, followed by the custom capital subtrack.
Figure 3. Production Efficiency Electric Savings by Subtrack, 2018 and 2019
More gas savings were achieved in program year 2019 compared to program year 2018, as shown in
Figure 4.
Figure 4. Production Efficiency Gas Savings by Subtrack, 2018 and 2019
14
Report Organization The remainder of this report is organized into the following sections:
• Impact Evaluation Overview: This section provides the impact evaluation objectives,
methodology (including sampling), and analysis.
• Impact Evaluation Results, Findings, and Recommendations: This section provides the
realization rates, types of impact evaluation adjustments made (categorized adjustments),
findings and recommendations for each subtrack, and an assessment of the recommendations
made in the 2016-2017 PE impact evaluation. Note that the 2016-2017 impact evaluation was
not completed until after the 2018 and 2019 program year; therefore, recommendations from
the 2016-2017 impact evaluation report were not available for action by PE program staff or
PDCs in the 2018 and 2019 program years.
• Appendices: The appendices provide supporting information for this impact evaluation.

15
Impact Evaluation Overview
Evaluation Goals and Key Research Objectives Cadmus’ evaluation goals for the PE program included the following:
• Develop reliable estimates of PE program electric and gas savings and realization rates for the
2018 and 2019 program years with 90% confidence and ±10% precision.
• Offer recommendations to help Energy Trust understand deviations from claimed savings.
• Provide information to refine ex ante savings estimates and to improve the effectiveness of
future engineering studies and impact evaluations of industrial efficiency projects.
In addition to these objectives, Cadmus collected data to answer the following questions:
• Are there any aspects of the energy savings analyses by PDCs, trade allies, Allied Technical
Assistance Contractors, or SEM implementers that may be of concern to Energy Trust?
• Are there obvious errors in any of the assumptions used in energy savings analyses, either in the
original savings estimates or in verification of energy savings?
• What are the factors that result in large variances in measure savings (e.g., assumptions too
conservative, incorrect hours of operation)?
• Are there any recommendations regarding energy savings analysis approaches and assumptions
or customer behavior or decision-making that would be helpful to Energy Trust in designing,
implementing, and evaluating its programs in the future?
Impact Evaluation Methodology To verify reported program participation and to estimate gross energy savings in the impact evaluation,
Cadmus estimated changes in gross energy consumption using data collected through phone
verification, virtual site visits, program tracking data, and engineering calculation models.
We used the following approaches to determine gross energy savings attributable to the program:
• Sample development
• Data collection
• Engineering analysis
Cadmus calculated savings based on changes between baseline and installed efficiency measures, using
program tracking data and assessing the assumptions and accuracy in the calculations.
Evaluation Sample Energy Trust staff provided 2018 and 2019 population data for sample development. We developed a
summary of the population savings from values reported in the program tracking system and sampled
savings, shown in Table 9 and Table 10. The sampled savings resulted from those projects sampled for
the impact evaluation. Sampled electricity savings represented 30% and 29% of the total program

16
electricity savings in 2018 and 2019, respectively. Sampled gas savings represented 88% and 78% of
total program gas savings for 2018 and 2019, respectively.
Table 9. Program and Sampled Savings by Program Track, 2018
Program
Year Track Subtrack
Electricity
Program
Savings (kWh)
Sampled Savings
(kWh)
Convenience
Savings (kWh)
Percent
Evaluated (by
kWh)
2018
Custom Custom Capital 43,277,676 18,979,648 509,179 45%
Custom O&M 7,544,950 5,105,053 - 68%
Custom Subtotal 50,822,626 24,084,701 509,179 48%
Streamlined
Industrial
Green Rewind 92,496 23,190 - 25%
Lighting 61,331,858 5,015,700 - 8%
Prescriptive 7,153,486 1,681,215 8,780 24%
Small Industrial 11,407,727 1,740,558 - 15%
Streamlined Industrial Subtotal 79,985,567 8,460,663 8,780 11%
SEM SEM 13,712,221 10,188,728 297,882 76%
Total 144,520,414 42,734,092 815,841 30%
Track Subtrack
Natural Gas
Program
Savings
(therms)
Sample Savings
(therms)
Convenience
Savings (therms)
Percent
Evaluated (by
therns)
Custom Custom Capital 1,230,131 1,202,846 5,829 98%
Custom O&M 263,126 263,126 - 100%
Custom Subtotal 1,493,257 1,465,972 5,829 99%
Streamlined
Industrial
Prescriptive 987,712 680,405 - 69%
Small Industrial 10,950 10,950 - 100%
Streamlined Industrial Subtotal 998,662 691,355 - 69%
SEM SEM 142,613 142,423 190 100%
Total 2,634,532 2,299,750 6,019 88%

17
Table 10. Program and Sampled Savings by Program Track, 2019
Program
Year Track Subtrack
Electricity
Program
Savings (kWh)
Sampled
Savings
(kWh)
Convenience
Savings (kWh)
Percent
Evaluated (by
kWh)
2019
Custom Custom Capital 50,100,290 16,841,371 905,301 35%
Custom O&M 4,859,875 3,852,827 58,402 80%
Custom Subtotal 54,960,165 20,694,198 963,703 39%
Streamlined
Industrial
Green Rewind 87,690 37,920 - 43%
Lighting 51,586,461 3,493,800 - 7%
Prescriptive 10,664,602 2,913,895 - 27%
Small Industrial 12,160,759 1,844,717 - 15%
Streamlined Industrial Subtotal 74,499,511 8,290,332 - 11%
SEM SEM 18,868,028 13,561,724 128,839 73%
Total 148,327,704 42,546,254 1,092,542 29%
Track Subtrack
Natural Gas
Program
Savings
(therms)
Sample
Savings
(therms)
Convenience
Savings (therms)
Percent
Evalauted (by
therns)
Custom Custom Capital 710,575 622,525 58,828 96%
Custom O&M - - -
Custom Subtotal 710,575 622,525 58,828 96%
Streamlined
Industrial
Prescriptive 313,792 91,405 - 29%
Small Industrial 74,852 71,662 - 96%
Streamlined Industrial Subtotal 388,643 163,066 - 42%
SEM SEM 45,168 41,844 1,825 97%
Total 1,144,386 827,435 60,653 78%
Sample Design For each program year, Cadmus estimated the total program electricity and natural gas savings with
90% confidence and ±10% precision. We based these estimates on a representative sample of the
project population, stratified by program year, fuel type, and track (custom, streamlined, and SEM), as
well as track substratification to target custom capital and custom O&M projects for more robust
evaluation, which were of particular interest to Energy Trust.
Cadmus sampled projects using probability proportional to size within each stratum and then evaluated
these sampled projects using a combination of engineering desk reviews and virtual measurement and
verification (M&V). We sampled sites with probabilities proportional to the reported electricity and
natural gas savings associated with each project, where projects with larger reported savings had a
higher probability of being sampled. This sampling method led to efficient samples and population
estimates and provided an effective alternative to using a certainty stratum (which can lead to

18
incomplete evaluations of certainty strata and subsequent complications with weighting and
estimation). For the evaluation, Cadmus allocated resources to strata and substrata with respect to
evaluation rigor requirements so that fewer sample points were needed to evaluate strata with lower
rigor requirements and larger sample sizes were used to evaluate strata and substrata with higher rigor
requirements.
Cadmus determined the evaluation methodology within tracks based on the rigor requirements for each
sampled project. We primarily relied on desk reviews for projects where historical data provided robust
estimates that had not changed over time (such as lighting and motor projects) and for projects where
interviews provided robust data for evaluation purposes (such as certain types of O&M projects). We
conducted virtual site visits for projects requiring direct observation of measures and equipment to
determine the persistence of SEM activities (such as SEM projects with capital measures installed during
the same period as the SEM engagement).
Table 11 provides the targeted and achieved confidence and precision around gas and electricity
savings. Based on our experience, we estimated the expected coefficients of variation within each
stratum and used these to determine the target number of completed projects. The achieved precision
was generally lower (more precise) than our expected target.
Table 11. Achieved Levels of Confidence and Precision by Program Track
Track Subtrack
Target Precision
(90% Confidence
Level)
Achieved Precision
(90% Confidence Level)
Electricity Natural Gas
2018 2019 Combined
Years 2018 2019
Combined
Years
Custom Custom Capital ±20% 3.3% 1.2% 1.6% 10.5% 2.3% 6.0%
Custom Custom O&M ±20% 7.9% 4.3% 4.8% 0.0% NA 0.0%
Custom Total ±20% 3.0% 1.1% 1.5% 8.2% 2.3% 5.2%
SEM SEM ±20% 0.6% 1.8% 1.1% 0.0% 0.0% 0.0%
SEM Total ±20% 0.6% 1.8% 1.1% 0.0% 0.0% 0.0%
Streamlined
Industrial Green Rewind ±20% 0.0% 0.0% 0.0% N/A N/A N/A
Streamlined
Industrial Lighting ±20% 4.1% 5.4% 3.0% N/A N/A N/A
Streamlined
Industrial Prescriptive ±20% 0.0% 0.0% 0.0% 3.8% 32.7% 11.9%
Streamlined
Industrial Small Industrial ±20% 10.8% 4.8% 5.3% 0.0% 0.6% 0.5%
Streamlined
Industrial Total ±20% 3.1% 3.3% 2.2% 3.7% 25.8% 10.8%
Total Total ±10% 2.0% 1.7% 1.3% 5.0% 9.8% 4.7%
We included many projects in multiple strata as they generated both electricity and natural gas savings.
To maintain the sampling independence between fuel-type strata, we included dual-fuel projects in both
strata as if they were distinct projects and allowed them to be sampled separately. As a result, projects
19
could be included in the random sample for one fuel type, but not the other; included in the random
sample for both fuel types separately; or not included in the random sample for either fuel type.
If a project was included in any random sample, we verified savings for both fuel types. However,
because of the stratified random sampling approach, we only assumed that the sampled project
represented all projects in the fuel-type strata from which it was actually selected in the random
sample. For example, evaluated gas savings of a dual-fuel project sampled for electricity will not
necessarily represent other gas savings if it was not selected as part of the gas random sample. In this
situation, we called the project a primary sampled project in the electricity stratum and a convenience
sampled project in the gas stratum.
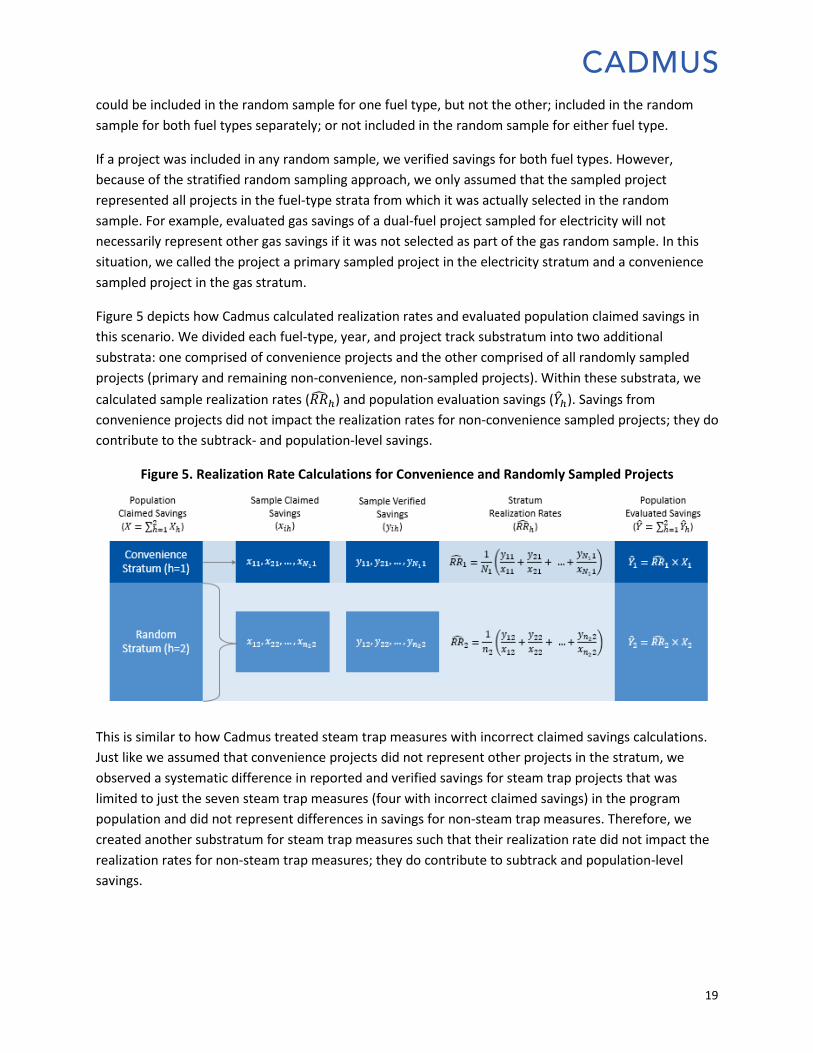
Figure 5 depicts how Cadmus calculated realization rates and evaluated population claimed savings in
this scenario. We divided each fuel-type, year, and project track substratum into two additional
substrata: one comprised of convenience projects and the other comprised of all randomly sampled
projects (primary and remaining non-convenience, non-sampled projects). Within these substrata, we
calculated sample realization rates (𝑅�̂�ℎ) and population evaluation savings (�̂�ℎ). Savings from
convenience projects did not impact the realization rates for non-convenience sampled projects; they do
contribute to the subtrack- and population-level savings.
Figure 5. Realization Rate Calculations for Convenience and Randomly Sampled Projects
This is similar to how Cadmus treated steam trap measures with incorrect claimed savings calculations.
Just like we assumed that convenience projects did not represent other projects in the stratum, we
observed a systematic difference in reported and verified savings for steam trap projects that was
limited to just the seven steam trap measures (four with incorrect claimed savings) in the program
population and did not represent differences in savings for non-steam trap measures. Therefore, we
created another substratum for steam trap measures such that their realization rate did not impact the
realization rates for non-steam trap measures; they do contribute to subtrack and population-level
savings.
20
Review Project Files Cadmus reviewed the available documentation (e.g., verification reports, analysis workbooks,
monitoring, reporting, and tracking workbooks) for the sampled projects, paying attention to the
calculation procedures and documentation for savings estimates. The methods applied for
documentation review varied according to whether the project involved a capital measure or an SEM
engagement. For any missing project files and calculation models, Cadmus worked with Energy Trust
and the PDCs to collect these. Cadmus kept a running list of data requests that it shared with Energy
Trust on a weekly basis. Due to the effects of the COVID-19 pandemic and the shift to more desk reviews
and virtual site visits, acquiring all available files to support the analysis was critical and Energy Trust and
the PDCs were extremely supportive with our requests.
Streamlined Industrial
Cadmus reviewed all project files, analysis workbooks, and MAD’s documentation to verify energy
savings estimates. Our review generally included the following:
• Project checklist
• Incentive application
• Measure calculator
• Invoices and receipts
• Any additional documentation such as emails, summaries, calculations, equipment spec sheets,
etc.
• Any applicable MADs
Custom
To the extent possible, Cadmus reviewed analyses originally used to calculate reported savings and
operating parameters. We reviewed all technical analysis study (TAS) and verification reports and
analysis. Cadmus worked with Energy Trust and the PDCs to acquire any missing documentation. This
was especially important due to the shift to virtual site visits where additional emphasis was placed on
the file reviews and existing baseline and installed data.
To evaluate each sampled project, we began by reviewing relevant documentation and other program
materials from Energy Trust, the PDCs, and Allied Technical Assistance Contractors. Cadmus reviewed
information including program application forms, the tracking database extract, and project reports for
each incentivized measure (if applicable). The review examined each project file for the following
information:
• Documentation on equipment installed or O&M measures performed:
▪ Descriptions
▪ Schematics
▪ Performance data
▪ Other supporting information

21
• Information about savings calculation methodologies:
▪ Methodologies used
▪ Assumption on specifications and the sources for these specifications
SEM
For each sampled SEM project, Energy Trust provided the energy intensity model workbooks and final
annual savings reports for the energy savings evaluation. Cadmus reviewed the annual savings report
and engineering calculations used to estimate SEM savings for errors and reasonableness to qualitatively
assess the energy models and savings calculations using the following rubric:
• Check for errors in modeling methods:
▪ Missing capital measures
▪ Incorrect accounting of capital measure savings
▪ Incorrect accounting for other factors affecting energy use
▪ Unexplained data excluded from regression model
• Check for trends in baseline model residuals based on data in annual savings report and models:
▪ Residuals equal the difference between actual metered energy and predicted energy use for
the baseline regression model
▪ A trend in residuals against fitted values or over time indicates that the model systematically
underpredicts or overpredicts energy consumption and savings and suggests than an
important energy driver has been omitted from the model
• Examine time period dates:
▪ Baseline and reporting periods should be distinct
▪ Baseline and reporting periods are the standard length of either 12 months or three months,
and those different than the standard should be explained and justified
Develop Site Investigation Plans (Site-Specific M&V Plans) For all custom and SEM track projects, Cadmus developed a site-specific measurement and verification
plan to outline the data and information to be gathered. We also identified critical parameters to be
monitored or verified, such as measures and operating conditions with significant impact on savings and
those with a high level of uncertainty.
Site-Specific Evaluation Plan Development for Custom Projects
Cadmus engineers developed comprehensive evaluation plans for each custom project using guidelines
outlined in the International Performance Measurement and Verification Protocol (IPMVP). This
technique allowed us to develop evaluation plans that conform to Energy Trust protocols and to each

22
project’s unique needs. Upon completing the evaluation plans, Cadmus provided a draft to Energy Trust
technical staff for review and further discussion. The evaluation plan followed a three-part format:
• Project summary. The summary provided an overview of the facility and the efficiency measures
implemented through the project.
• Savings analysis methodology. This section outlined the methods and assumptions the PDC
employed to estimate energy savings.
• M&V methodology. This section provided several details:
▪ The M&V methodology Cadmus proposed (whether IPMVP options or other M&V
guidelines)
▪ A complete list of parameters for collection or monitoring on the site
▪ The monitoring duration and frequency.
▪ Data logging equipment (quantities and type) for use during monitoring (if applicable), as
well as the site-specific sampling plan, if required
Site-Specific Evaluation Plan Development for SEM Projects
After reviewing the opportunity register and the annual savings report associated with each sampled
SEM project, Cadmus developed site-specific evaluation plans that included the following:
• Basic information about the facility, such as the baseline, engagement, reporting period dates,
and claimed energy savings
• Details of the methodology used to claim energy savings at each site (IPMVP Option C or a
bottom-up engineering approach)
• A list of the major projects completed at the site that were verified during the in-depth
interview
• An outline of the major verification activities required for the site, which typically included a file
review, interview with the site contact, model review and savings analysis, and a bottom-up
savings analysis when necessary
Conduct Facility Operator Interviews and Site Visits
To achieve Energy Trust’s impact evaluation objectives, Cadmus deployed a range of methods and tools
and adopted a consistent, integrated, and transparent approach to collecting primary program and
participant data. We sought participant data for three primary reasons:
• To perform rigorous investigations during our site visits
• To fully explain discrepancies between expected and evaluated impacts
• To provide insights that help Energy Trust improve ex ante estimates
Due to the ongoing COVID-19 pandemic, Cadmus and Energy Trust had to adjust the evaluation
approach significantly to meet the Center for Disease Control and Prevention’s guidelines and
accomplish the evaluation objectives. This resulted in a shift of all planned on-site activity to remote
interviews and virtual site visits. This shift was successful, and Cadmus developed a virtual site visit

23
memo, virtual site visit protocols, and virtual site visit trainings to assist in the transition. This is
discussed further in the Virtual Site Visits section.
Cadmus scheduled all interviews and virtual site visits in coordination with the PDCs and Energy Trust, in
accordance with the customer recruitment and communications plan. We clearly relayed our
expectations for interviews and virtual site visits by providing day-of-visit timelines to each participant,
as well as an overview of the project and M&V plans for review ahead of the interviews and virtual
visits. We adjusted our schedules as needed to accommodate participants’ schedules and were
considerate of availability, especially considering the ongoing COVID-19 pandemic.
Conducting Customer Interviews
Non-SEM Participant Interviews
Cadmus completed interviews for all custom capital, custom O&M, and SEM sites, as well as several
streamlined industrial sites where we determined interviews would be useful to the evaluation. There
was additional emphasis placed on interviews during this evaluation cycle due to the ongoing COVID-19
pandemic and the lack of access to facilities.
The purpose of the customer interviews was to confirm several factors:
• Installation and functionality of all equipment
• Current occupancy or facility use
• Adjustments in control schemes
• Other items significantly impacting energy consumption
The interviews helped to further verify the accuracy of assumptions relating to energy-savings
calculations and to recalculate savings, as needed. Cadmus interviewed staff at each sampled site,
including facility operators, energy team members, and energy champions. The interview guide Cadmus
used during interviews is included as Appendix B. Customer Interview Guides. We supplemented
information in the interview guides with project-specific information and project-specific M&V plans.
For projects not warranting a virtual visit, Cadmus conducted the interviews via phone.
Strategic Energy Management Participant Interviews
Cadmus updated the most recent SEM participant interview guide (developed for the 2016-2017 PE
program impact evaluation) according to Energy Trust’s objectives for the 2018-2019 PE impact
evaluation. Cadmus gathered the following information about each site’s engagement with the SEM
program through participant interviews:
• The site contact’s role at the facility and with the SEM engagement
• Challenges with implementing SEM and changes in their engagements
• Descriptions of the energy champion, energy champion, and executive sponsor roles
• The facility’s energy policies or goals
• The extent to which the facility used energy management tools such as the energy management
assessment, energy map, and opportunity register
24
• Employee engagement activities
• The energy intensity model developed for the facility
• The plan for future SEM engagement or changes to tracking energy use
• Facility operations since the SEM engagement
Cadmus used the interview responses to confirm that major projects listed in the annual savings reports
were completed and remained operational, verify specific inputs to bottom-up savings calculations
(when necessary), and gauge qualitatively whether the energy intensity models produced sensible
results given the facility operations.
We also used the interview responses to determine whether each participant fully or somewhat
adopted each subelement of the Consortium for Energy Efficiency minimum elements for SEM
engagement, which provide guidance on initiatives participating SEM facilities should adopt as part of
their energy management efforts.
Before conducting the interviews, Cadmus thoroughly reviewed project files and regression models to
ensure that the interviews covered the relevant SEM activities and facility information specific to each
site and required for the qualitative evaluation. Cadmus engineers and evaluators with SEM expertise
conducted the SEM participant interviews.
Cadmus provided participants with interview questions ahead of time, giving them adequate time to
prepare for the interview. Participants for the most part found this option amenable, given their busy
schedules and the ongoing COVID-19 pandemic. Each completed interview required significant recruiting
and explanation to engage participants and to provide them with information. Cadmus coordinated the
initial outreach via the PDCs and begun scheduling outreach after all sites were initially contacted and
informed. This approach shortened the interview times and decreased costs associated with recruitment
and interviews.
Conducting Virtual Site Visits
Cadmus originally planned to conduct 69 desk reviews (which include customer interviews) and
interviews and 147 on-site visits for the 2018-2019 program evaluation. However, due to the COVID-19
pandemic and associated stay-at-home orders, Cadmus and Energy Trust decided to increase the
number of desk reviews and shift on-site visits to virtual site visits. Due to the fluidity of the COVID-19
situation, Cadmus shifted the verification method of projects each month, in case on-site visits would be
safely possible again. Due to the success of virtual site visits and for the safety of Cadmus staff and
Energy Trust customers, Cadmus did not complete any on-site visits for the 2018-2019 evaluation.
Figure 6 shows the shift of planned desk reviews, on-site visits, and virtual site visits throughout the
duration of the project. Cadmus completed 131 desk reviews and interviews and 85 virtual site visits.

25
Figure 6. Verification Methods Selection
To successfully complete the virtual site visits, Cadmus developed a memo specific to virtual site visit
consideration and site selection, which is included Appendix D. Virtual Site Visit Memorandum Cadmus
also created a virtual site visit guidelines PowerPoint slide deck as a reference for customers. This slide
deck included software options and equipment-specific guidelines, such as how to read a motor
nameplate. We also developed a virtual site visit protocol and checklist for our engineers and staff to
follow during site visits. When scheduling a virtual site visit, we sent customers a customer introduction
letter, which is included in Appendix A. Customer Introduction Letter, as well as a data collection
checklist specific to the measure of interest.
Impact Analysis
Across the three tracks, Cadmus verified evaluation methods ranging from simple verifications to
statistical regression analyses. We used straightforward, well-understood M&V analysis methods that
are based on verifiable inputs and—most importantly—that align with methods that utility program
staff and PDCs use during program planning and project development.
The impact analysis included multiple components:
• Site-level savings, realization rates, and descriptions of adjusted parameters, along with
rationales for adjustments
• Program, stratum, and measure categories
• Savings and realization rates
• Observations and recommendations for program improvements
Streamlined Industrial and Custom Projects
Cadmus completed site-level analyses, as outlined in the approved site-specific evaluation plans. For
each project, we determined evaluated savings by means of simple verification, engineering calculation
0
50
100
150
200
250
InitialPlan
Jun-20 Jul-20 Aug-20 Sep-20 Oct-20 Nov-20 Dec-20
Nu
mb
er o
f P
roje
cts
Month
Desk Reviews and Interviews Virtual Site Visits On-Site Visits
26
models, metering analysis, and utility billing analysis. We used a mix of provided analysis files, along
with our library of tools and custom spreadsheets, to determine appropriate savings. For streamlined
industrial projects, we followed the appropriate MADs provided by Energy Trust.
Cadmus verified savings for each project and calculated a corresponding realization rate. At two
different stages of the evaluation Cadmus developed a realization rate summary covering all projects
with variances and providing commentary on the reasons for adjustments. We reviewed and discussed
these with Energy Trust. As needed, Cadmus discussed specific projects with larger variations (generally
above ±10% variance) with Energy Trust and with the PDCs. We requested additional data and project
files to support the evaluations and worked with PDCs where appropriate to achieve consensus on the
evaluated savings results. This helped to ensure alignment on any program issues and reduce iterations
of report development.
Strategic Energy Management Analysis
Cadmus reviewed the project files and interviewed the site contacts to verify savings at each site. We
did not build independent baseline models, but qualitatively verified energy savings by confirming that
baseline, engagement, and reporting period definitions met Energy Trust’s requirements. Cadmus also
confirmed that the site implemented the major projects included in the opportunity register, reviewed
the energy savings reported model specification, assessed whether capital projects were appropriately
prorated and deducted from SEM savings (after applying track-level 2018-2019 Production Efficiency
realization rates), and verified that reporting period savings were correctly annualized.
Cadmus directly calculated realization rates when we found computational errors in the capital project
savings or annualization of reporting period savings. However, when the qualitative review found
problems with other components of the SEM engagement, we assigned realizations rates of 90% or
110% depending on whether these problems likely overestimated or underestimated the energy
savings. When we did not find any problems, problems were likely to have small, if any, impacts on
energy savings, or we could not determine how savings may be impacted, we assigned a realization rate
of 100%. Cadmus assumed that the claimed savings were adequate by default and assigned non-100%
realization rates only with sufficient evidence against that assumption.
As part of the in-depth interviews with site contacts, Cadmus verified whether the major projects listed
in the annual savings report that contributed to the SEM savings were implemented and remained
operational. We did not estimate savings for the major projects completed at sites that claimed savings
using an energy intensity model following IPMVP Option C. However, if the site contact indicated that a
major project contributing to SEM savings was dismantled after the reporting period, we applied our
engineering expertise to gauge whether the relative size of the project would significantly impact overall
savings. Cadmus assigned a 90% realization rate to the claimed savings in cases where it could.
When sites claimed savings using a bottom-up approach, we verified key inputs to the engineering
calculations to verify that the claimed savings aligned with the methods outlined in the annual savings
report and were reasonable.

27
Impact Evaluation Results and Findings This section presents track level realization rates and provides discussion on the types of impact
evaluation adjustments Cadmus made (categorized adjustments), as well as findings. The section also
includes general observations regarding discrepancies and other factors influencing measure-level RRs.
Cadmus uses the site measure ID foreach facility to maintain participant anonymity
Realization Rates As shown in Table 12, electric realization rates for the 2018-2019 program overall were 100% and 101%,
respectively.
Gas realization rates for the 2018 and 2019 program overall were 78% and 104%, respectively.
Table 12. Production Efficiency Program Realization Rate by Year and Fuel Type
Fuel Type
2018 2019 Combined Years
Realization
Rate
Relative
Precision
Realization
Rate
Relative
Precision
Realization
Rate
Relative
Precision
Electricity 101% 2.0% 101% 1.7% 101% 1.3%
Natural Gas 78% 5.0% 104% 9.8% 86% 4.7%
*Relative precision is calculated at the 90% confidence level.
Table 13 and Table 14 provide a summary of the realization rates by track and subtrack for each year
evaluated and overall. Explanations for what led to each realization rate are provided in the following
specific program track and subtrack subsections.
Table 13. Electric Realization Rates by Track, Subtrack, and Year
Track Subtrack
2018 2019 Combined Years
Realization
Rate
Relative
Precision*
Realization
Rate
Relative
Precision*
Realization
Rate
Relative
Precision*
Custom
Custom Capital 101% 3.3% 99% 1.2% 100% 1.6%
Custom O&M 93% 7.9% 97% 4.3% 95% 4.8%
Total 100% 3.0% 99% 1.1% 100% 1.5%
SEM SEM 99% 0.6% 97% 1.8% 98% 1.1%
Total 99% 0.6% 97% 1.8% 98% 1.1%
Streamlined
Industrial
Green Rewind 100% 0.0% 100% 0.0% 100% 0.0%
Lighting 103% 4.1% 103% 5.4% 103% 3.0%
Prescriptive 100% 0.0% 100% 0.0% 100% 0.0%
Small Industrial 94% 10.8% 105% 4.8% 99% 5.3%
Total 101% 3.1% 103% 3.3% 102% 2.2%
Total Total 101% 2.0% 101% 1.7% 101% 1.3%
*Relative precision is calculated at the 90% confidence level.

28
Table 14. Gas Realization Rates by Track, Subtrack, and Year
Track Subtrack
2018 2019 Combined Years
Realization
Rate
Relative
Precision*
Realization
Rate
Relative
Precision*
Realization
Rate
Relative
Precision*
Custom
Custom Capital 83% 10.5% 95% 2.3% 87% 6.0%
Custom O&M 100% 0.0% NA NA 100% 0.0%
Total 86% 8.2% 95% 2.3% 89% 5.2%
Streamlined
Industrial
SEM 100% 0.0% 100% 0.0% 100% 0.0%
Total 100% 0.0% 100% 0.0% 100% 0.0%
Prescriptive 62% 3.8% 124% 32.7% 77% 11.9%
Small Industrial 100% 0.0% 101% 0.6% 101% 0.5%
Total 63% 3.7% 119% 25.8% 79% 10.8%
Total Total 78% 5.0% 104% 9.8% 86% 4.7%
*Relative precision is calculated at the 90% confidence level.
Overall, the program achieved high realization rates for 2018 electric, 2019 electric, and 2019 gas. The
primary reason for the lower 2018 gas realization rate was one large project that used a theoretical
model to calculate baseline energy use; however, during the verification period we had the opportunity
to use actual historical data to calculate savings. The provided data suggested that the expected
increase in production during the implementation period did not occur, which reduced the achieved
energy savings. For 2018 prescriptive gas projects, the lower realization rate was a result of using a MAD
that was later found to use an incorrect savings calculation methodology on four large steam trap
projects. This resulted in lower savings and impacted the overall realization rate. As mentioned
previously, these measures were projects did not represent other projects in the stratum and did not
represent differences in savings for non-steam trap measures. Therefore, we created another
substratum for steam trap measures such that their realization rate did not impact the realization rates
for non-steam trap measures. However, due to the size of the savings associated with these projects,
the overall program realization rate was still impacted significantly.
The realization rates for 2018 and 2019 program years are compared below to the prior impact
evaluation for program years 2016 and 2017 (Table 15). The electricity fuel track achieved a higher RR in
both 2018 and 2019 and the 2019 gas fuel type achieved a higher RR in 2019. It was unclear what factors
resulted in the improvements since Cadmus did not conduct the evaluation for the 2016-2017
evaluation. However, it is worth noting that there were fewer facility closures and measure removals in
the 2018-2019 program years than in 2016-2017. We considered this surprising considering the impact
of the ongoing COVID-19 pandemic. For the most part, facilities were operating as they normally would
with minor effects from COVID-19. The reduced number of facility closures and measure removals
factored into the higher RR values.

29
Table 15. Production Efficiency Program Realization Rates for 2016, 2017, 2018, 2019 by Fuel Type
Fuel Type 2016 2017 2018 2019
Electricity 86% 90% 101% 101%
Natural Gas 98% 94% 78% 104%
Categorized Adjustments To better understand why projects are adjusted, Cadmus categorized each adjustment at the project
level into one of the following categories:
• Different operating hours: Equipment operating hours differed from what was specified in the
ex ante savings calculations.
• Different equipment setpoints: Different equipment setpoints from those used in the ex ante
savings calculations. This included different temperature and pressure setpoints.
• Incorrect equipment specifications or quantities: This included incorrect equipment capacity,
wattage, efficiency, and quantity.
• Incorrect analysis methodology: We used a different analysis methodology from the ex ante
savings such as using energy management system trend data to build a new regression analysis,
normalizing baseline and installed periods, applying a day type methodology to air compressors,
or using a different Measure Approval Document (MAD) to calculate savings.
• Measure removal: This involved the removal of a measure at a closed or operational facility.
• Inappropriate baseline: This involved baseline equipment specifications that did not align with
code or industry standard practice.
• Inappropriate assumption: Any assumed values or conditions that were used in the calculation
of baseline or measure savings. This included cooling and heating efficiencies, fan affinity
exponents, and theoretical performance values.
• Calculation or engineering error: Situations where values in the ex ante savings calculation
workbook, invoices, or verification report did not match values used in the analysis; this
included spreadsheet formula errors or hard coded values that were not updated.
• (SEM) Non-SEM project realization rate adjustment: To avoid double counting savings from the
non-SEM projects incentivized through the Custom and Streamlined Industrial tracks, Cadmus
confirmed that these savings were subtracted from the SEM claimed savings. However, the
amount of savings subtracted from the SEM claimed savings differed between the ex ante and
ex post savings because Cadmus applied the track-level 2018-2019 PE impact evaluation
realization rates to the non-SEM projects. SEM savings for a site increased when the 2018-2019
non-SEM projects were assigned a realization rate of less than 100% and decreased when the
2018-2019 non-SEM projects were assigned a realization rate of more 100%. Most SEM
adjustments were due to non-SEM project realization rates and did not indicate errors in the
claimed savings.
30
• (SEM) Decommissioned SEM project: When Cadmus found through interviews with the site
contacts that a major project contributing to SEM savings was decommissioned after the
reporting period, and therefore included in the claimed annual SEM savings, Cadmus assigned a
realization rate of 90% if the project was expected to contribute at least 10% of the SEM savings.
• (SEM) Incorrect non-SEM project adjustment: Some sites made incorrect adjustments to the
SEM savings for installed non-SEM savings at the facility by either subtracting to much or too
little from SEM savings or not accounting for a project entirely. Cadmus directly calculated
realization rates for these facilities by making the appropriate adjustments.
Where multiple categories applied to one project, Cadmus assigned the project to the single category
that had the greatest impact on its realization rate.
Table 16 summarizes the number of categorized adjustments by fuel type and by year. Figure 7 and
Figure 8 illustrate the cumulative energy savings adjustments for each adjustment category. Incorrect
analysis methodology was the number one issue found for both gas and electric projects and produced
the largest adjustments to the estimated savings.

31
Table 16. Production Efficiency Program Savings Adjustment Category Summarya
Electric Savings Adjustments 2018,
n=82
2019,
n=84
Total,
n=166
Absolute Adjusted
Savings, kWh
% of Savings Adjusted (Category
Adjusted Savings/Total Adjusted
Savings)
Incorrect analysis methodology 4 6 10 606,542 32.1%
Measure removal 1 0 1 484,974 25.6%
Different operating hours 4 4 8 238,750 12.6%
(SEM) Non-SEM project realization
rate adjustment 5 11 16 125,994 6.7%
(SEM) Decommissioned SEM project 1 1 2 170,330 9.0%
Inappropriate baseline 2 1 3 89,867 4.8%
(SEM) Incorrect non-SEM project
adjustment 3 0 3 52,663 2.8%
Different equipment setpoints 3 3 6 44,775 2.4%
Incorrect equipment specifications
or quantities 2 1 3 42,199 2.2%
Calculation or engineering error 2 0 2 24,478 1.3%
Inappropriate assumption 1 2 3 10,690 0.6%
Total 28 29 54 1,891,262 100.0%
Gas Savings Adjustments 2018,
n=35
2019,
n=39
Total,
n=74
Absolute Adjusted
Savings, therms
% of Savings Adjusted (Category
Adjusted Savings/Total Adjusted
Savings)
Incorrect analysis methodology 5 0 5 472,760 85.3%
Calculation or engineering error 0 3 3 28,699 5.2%
Different operating hours 4 2 6 25,085 4.5%
Incorrect equipment specifications
or quantities 1 2 3 12,814 2.3%
Different equipment setpoints 0 1 1 7,793 1.4%
Inappropriate assumption 0 1 1 4,932 0.9%
Inappropriate baseline 2 0 2 2,053 0.4%
Total 12 9 21 554,136 100.0% a n reflects the number of unique of project IDs evaluated for each year and fuel type. Only one adjustment category was assigned per project;
if a project could fit in multiple categories, the project was assigned to the category with the largest impact on the realization rate.

32
Figure 7. Production Efficiency Electric Savings Cumulative Impact Evaluation Adjustments
Figure 8. Production Efficiency Gas Savings Cumulative Impact Evaluation Adjustments

33
Custom Capital Projects Custom capital projects represented the most complex projects (and those reporting the largest energy
savings). These included a range of measures, from regenerative thermal oxidizers to industrial
refrigeration system upgrades. Cadmus evaluated 59 custom capital projects, of which 55 were primary
projects and four were convenience projects. For each custom project, we performed a virtual site visit
or interview to verify correct installations of incentivized equipment and to confirm quantities and
operating characteristics. In many cases, we also obtained EMS trend data on critical operational
parameters or used existing power meter or trend data. This allowed us to determine if the initial
analysis approach proved reasonable, and, if necessary, to apply a revised calculation approach. For
projects with provided analysis workbooks, Cadmus adjusted calculations to update operating
parameters confirmed through site visits and interviews with facility operations staff. For each custom
capital project, we also developed evaluation reports highlighting findings, assumptions, and analysis
methodology.
Custom capital projects included a variety of subcategories based on the following measure types:
• Air abatement • Motors
• Compressed air • Primary process
• Fan • Secondary process
• Heat recovery • Pumping
• HVAC • Refrigeration
• Irrigation • Wastewater
Findings
Table 17 lists the custom capital realization rates by year and combined.
Table 17. Custom Capital Realization Rates Summary for 2018, 2019 and Combined
Fuel Type
2018 2019 Combined Years
Realization Rate Relative
Precision Realization Rate
Relative
Precision Realization Rate
Relative
Precision
Electricity 101% 3.3% 99% 1.2% 100% 1.6%
Natural Gas 83% 10.5% 95% 2.3% 87% 6.0%
*Relative precision is calculated at the 90% confidence level.
Realization Rate Adjustments Summary Findings
The realization rates for the custom capital projects ranged from 30.8% to 128.8%. The custom capital
track achieved a combined 2018 and 2019 electric realization rate of 100% and gas realization rate of
87%. Most projects evaluated received a 100% realization rate, although Cadmus adjusted savings for 25
custom capital projects. Most adjustments were minor and out of the control of Energy Trust and the
PDC. These include updated hours of use and changes in setpoints that occurred after the projects were
implemented. There were a few projects that had a larger impact on realization rates, and these
generally included changes to the calculation methodology. Specifically, on the gas side, there was one
34
large project (PE12747) that received a low realization rate due to a change in calculation methodology
and updated utility data, which was the main driver for the lower realization rate for the 2018 gas
program. For this project, the PDC developed a calculation model for drying kiln baseline consumption
based on the participant’s expectation that production would significantly increase in the following
years. The verification period consumption relied on a linear regression of board feet of production to
monthly gas consumption. During the evaluation period, Cadmus found that production had actually
stayed relatively consistent rather than increasing. As such, we determined it would be appropriate to
develop linear regressions for both baseline and retrofit conditions, while taking into account the impact
of one kiln that the participant had retrofit in previous years. Cadmus’ baseline regression indicated the
PDC’s calculation model overstated baseline consumption, resulting in a reduction in natural gas savings.
This following list highlights more specific adjustments to projects and provides some examples:
• In some cases, operating hours were estimated incorrectly, or they were adjusted since the
project was completed due to changes in production. Cadmus confirmed with the sites that
these were not temporary changes and were unrelated to COVID-19. Operating hour changes
affected both gas and electric savings across several measure types. Project examples: PE10348,
PE12342, PE12469, PE13224, PE14077, and PE14074.
• Some projects used incorrect setpoints in calculating savings or setpoints that were changed
since the project was complete. Cadmus used trend data, existing sensors and gauges readings,
review of the control panels, and discussions with site contacts to update setpoints. This
affected both gas and electric savings across several measure types. Examples of adjustments
included temperature setpoint changes, flow rate changes, and process changes resulting in
setpoint adjustments. Project examples: PE10567, PE12678, PE13947, PE14126, PE13678, and
PE14188.
• Some projects used the incorrect or inappropriate calculation methodologies to calculate
savings. This included issues with regression models, normalization of baseline and post
installed periods, data filtering and analysis, and using a theoretical model versus using utility
data. Project examples: PE12747, PE13277, PE15140, PE15403, and PE15660.
• Some projects used incorrect equipment specifications resulting in differences in savings. One
project used the incorrect boiler input size, and a second project used the incorrect chiller
efficiency values. Projects examples: PE14754 and PE8634.
• For some projects, the incorrect assumptions were used, which resulted in adjustments to
savings. These included an adjustment to an assumption on baseline chiller efficiencies and an
adjustment to the fan affinity exponent to be more representative of the project. Project
examples: PE13954 and PE15731.
• For some projects Cadmus identified an engineering or calculation error. This was generally a
result of spreadsheet errors. This included one project in which hours of operations were
incorrectly calculated and a second project in which boiler output was incorrectly calculated.
These projects both resulted in adjustments to savings. Projects examples: PE15278 and
PE15917.
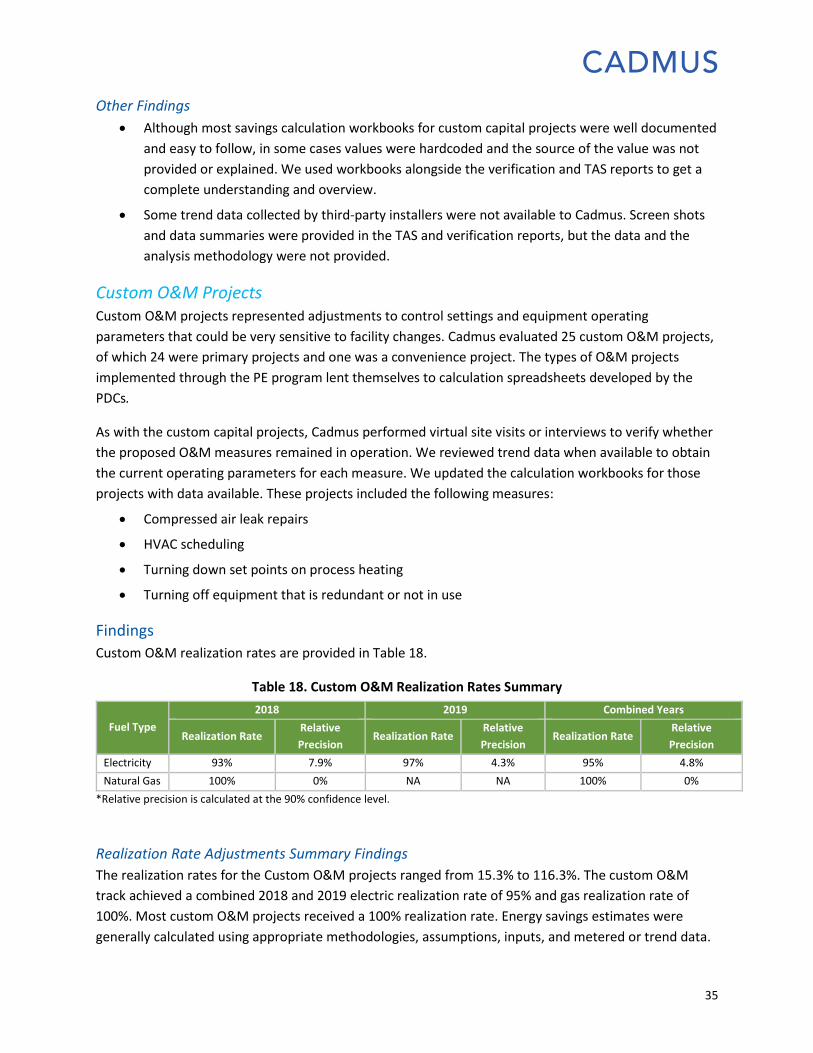
35
Other Findings
• Although most savings calculation workbooks for custom capital projects were well documented
and easy to follow, in some cases values were hardcoded and the source of the value was not
provided or explained. We used workbooks alongside the verification and TAS reports to get a
complete understanding and overview.
• Some trend data collected by third-party installers were not available to Cadmus. Screen shots
and data summaries were provided in the TAS and verification reports, but the data and the
analysis methodology were not provided.
Custom O&M Projects Custom O&M projects represented adjustments to control settings and equipment operating
parameters that could be very sensitive to facility changes. Cadmus evaluated 25 custom O&M projects,
of which 24 were primary projects and one was a convenience project. The types of O&M projects
implemented through the PE program lent themselves to calculation spreadsheets developed by the
PDCs.
As with the custom capital projects, Cadmus performed virtual site visits or interviews to verify whether
the proposed O&M measures remained in operation. We reviewed trend data when available to obtain
the current operating parameters for each measure. We updated the calculation workbooks for those
projects with data available. These projects included the following measures:
• Compressed air leak repairs
• HVAC scheduling
• Turning down set points on process heating
• Turning off equipment that is redundant or not in use
Findings
Custom O&M realization rates are provided in Table 18.
Table 18. Custom O&M Realization Rates Summary
Fuel Type
2018 2019 Combined Years
Realization Rate Relative
Precision Realization Rate
Relative
Precision Realization Rate
Relative
Precision
Electricity 93% 7.9% 97% 4.3% 95% 4.8%
Natural Gas 100% 0% NA NA 100% 0%
*Relative precision is calculated at the 90% confidence level.
Realization Rate Adjustments Summary Findings
The realization rates for the Custom O&M projects ranged from 15.3% to 116.3%. The custom O&M
track achieved a combined 2018 and 2019 electric realization rate of 95% and gas realization rate of
100%. Most custom O&M projects received a 100% realization rate. Energy savings estimates were
generally calculated using appropriate methodologies, assumptions, inputs, and metered or trend data.

36
Cadmus adjusted nine custom O&M projects. The follow list highlights more specific adjustments to
projects and provides some examples:
• In some cases, operating hours were estimated incorrectly, or they were adjusted since the
project was completed due to changes in production. Cadmus confirmed with the sites that
these were not temporary and unrelated to COVID-19. Operating hour changes affected both
gas and electric savings across several measure types. Project examples: PE15351 and PE16388.
• Some projects used incorrect setpoints in calculating savings or setpoints that were changed
since the project was complete. This included one project that used the incorrect compressor
pressure setpoint to calculate energy savings. A second project used elevated air demand
savings to calculate savings; however, in reviewing nonproduction period data, Cadmus
determined that leak savings should be reduced. Project examples: PE12532 and PE15660.
• Some projects used the incorrect or inappropriate calculation methodologies to calculate
savings. This included issues with regression analysis, incorrect normalization of baseline and
post-installed periods, incorrect data filtering and analysis. For three air leak projects, the PDC
used varying methodologies to estimate savings. For one project, the PDC reduced savings by
10% during periods when air flow dropped below nonproduction cubic feet per minute (cfm)
levels. For another, savings determined using the ultrasonic leak detector were reduced for the
entire meter period to match the nonproduction metered period. For a third project, no
adjustments to air leaks were made even through savings dropped below metered
nonproduction cfm regularly. These were all adjusted to consider air flow during non-production
periods in the analysis. Project examples: PE13277, PE13674, PE15415, and PE16012.
• For one project (PE13532), the site was determined to be closed and converted to a data center.
All original HVAC equipment was auctioned off. This resulted in a significant reduction in
savings.
Other Findings:
• The custom O&M projects generally received high realization rates when the operating
conditions defined in the project were maintained by the facility. We found the project savings
decreased when the facility did not have proper training or when the operating conditions were
too aggressive to be applied in all production or weather conditions.
• In general, the projects that did not maintain the setpoints prescribed were most frequently in
facilities where there were production changes, or where setpoints caused changes that did not
successfully improve operations and were reverted back to the original setpoints.
• Many of the custom O&M projects involved equipment that was directly metered or where
trend data was available to determine energy consumption before and after the setpoint change
or maintenance fixes. The metered data helped ensure energy savings estimates were
reasonable and that sufficient data were collected to calculate resulting savings.
• Although most savings calculation workbooks for custom O&M projects were well documented
and easy to follow, in some cases values were hard coded and the source of the value was not
provided or explained.
37
• In some cases, compressed air leak loses were overestimated using only the ultrasonic leak
detector results. These leak findings were not adjusted considering actual air demand from the
compressed air metered data and resulting in a higher estimated leak loss through the leak
detector versus actual non-production flow.
Streamlined Industrial Projects (Green Motor Rewind, Lighting, Prescriptive, and
Small Industrial) The streamlined industrial projects generally include projects that are well established and use
prescriptive or standardized calculation methodologies and spreadsheets developed over the years from
best practices and MADs. These generally included smaller electric and gas projects that were easier to
verify and required fewer inputs. For these projects, Cadmus conducted a mix of virtual site visits,
interviews, and desk reviews. We verified that the appropriate calculation methodology was used, the
appropriate inputs and assumptions were applied, and that the project was installed and operational.
The tracks for the streamlined industrial projects are outlined below.
Green Motor Rewind
Green Rewind projects received incentives for disassembly and refurbishment of electric induction
motors, including rewinding and testing the stators to restore or maintain a motor’s original efficiency.
Cadmus evaluated 11 green motor rewind projects.
Lighting
Lighting projects included both new construction spaces with a space-by-space code baseline and watt
reduction retrofits or fixture replacements in existing spaces. Cadmus evaluated 14 lighting projects.
Prescriptive
Prescriptive projects cover equipment replacements and equipment installations. Cadmus evaluated 35
prescriptive projects that included the following:
• Irrigation system seals, gaskets, and nozzles
• Pipe insulation for hot water and steam lines
• Roof insulation
• High-efficiency boilers
Small Industrial
The small industrial projects covered equipment replacements and equipment installations. Cadmus
evaluated 32 small industrial projects that included the following:
• Air compressor replacements
• Refrigeration system equipment and controls
• Irrigation pump variable frequency drives
• Fast-acting doors in refrigerated warehouses
• Heating systems for greenhouses
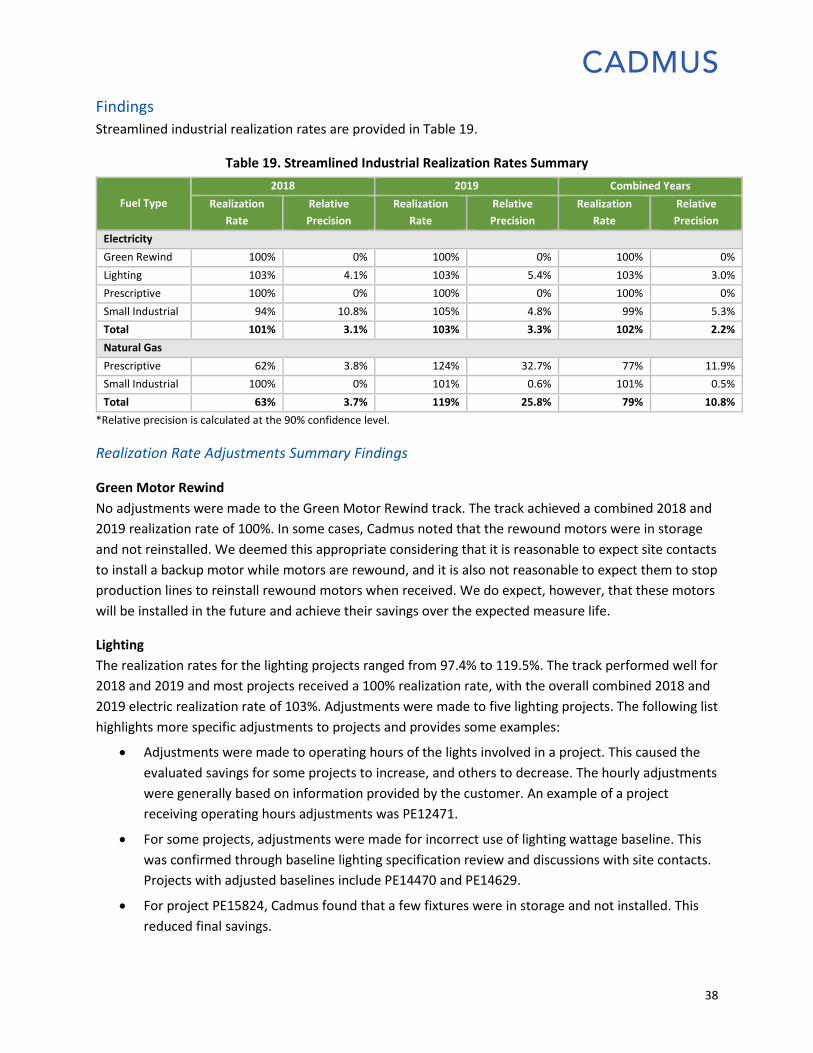
38
Findings
Streamlined industrial realization rates are provided in Table 19.
Table 19. Streamlined Industrial Realization Rates Summary
Fuel Type
2018 2019 Combined Years
Realization
Rate
Relative
Precision
Realization
Rate
Relative
Precision
Realization
Rate
Relative
Precision
Electricity
Green Rewind 100% 0% 100% 0% 100% 0%
Lighting 103% 4.1% 103% 5.4% 103% 3.0%
Prescriptive 100% 0% 100% 0% 100% 0%
Small Industrial 94% 10.8% 105% 4.8% 99% 5.3%
Total 101% 3.1% 103% 3.3% 102% 2.2%
Natural Gas
Prescriptive 62% 3.8% 124% 32.7% 77% 11.9%
Small Industrial 100% 0% 101% 0.6% 101% 0.5%
Total 63% 3.7% 119% 25.8% 79% 10.8%
*Relative precision is calculated at the 90% confidence level.
Realization Rate Adjustments Summary Findings
Green Motor Rewind
No adjustments were made to the Green Motor Rewind track. The track achieved a combined 2018 and
2019 realization rate of 100%. In some cases, Cadmus noted that the rewound motors were in storage
and not reinstalled. We deemed this appropriate considering that it is reasonable to expect site contacts
to install a backup motor while motors are rewound, and it is also not reasonable to expect them to stop
production lines to reinstall rewound motors when received. We do expect, however, that these motors
will be installed in the future and achieve their savings over the expected measure life.
Lighting
The realization rates for the lighting projects ranged from 97.4% to 119.5%. The track performed well for
2018 and 2019 and most projects received a 100% realization rate, with the overall combined 2018 and
2019 electric realization rate of 103%. Adjustments were made to five lighting projects. The following list
highlights more specific adjustments to projects and provides some examples:
• Adjustments were made to operating hours of the lights involved in a project. This caused the
evaluated savings for some projects to increase, and others to decrease. The hourly adjustments
were generally based on information provided by the customer. An example of a project
receiving operating hours adjustments was PE12471.
• For some projects, adjustments were made for incorrect use of lighting wattage baseline. This
was confirmed through baseline lighting specification review and discussions with site contacts.
Projects with adjusted baselines include PE14470 and PE14629.
• For project PE15824, Cadmus found that a few fixtures were in storage and not installed. This
reduced final savings.

39
• One project (PE16622) did not account for HVAC interactive effects. This was a cannabis facility
that should have accounted for cooling savings due to reduced heat dissipation from LED lights.
Prescriptive
The realization rates for the prescriptive projects ranged from 8.5% to 294.9%. Most projects received a
100% realization rate. In general, these projects were supported by appropriate data, specification
sheets, and calculation methodologies. Adjustments were made to six prescriptive projects. The
following list highlights more specific adjustments to projects and provides examples:
• For four steam trap projects, savings were estimated using a MAD that was later found to use an
incorrect savings calculation methodology. Cadmus used the appropriate savings calculation
methodology (described in the updated 2019 MAD) which resulted in a reduction in savings.
Realization rates ranged from 8.5% to 34.6%. Projects include: PE14526, PE14670, PE15250, and
PE15364.
• For project PE16145, Cadmus identified a calculation error resulting in a significant increase in
savings. This involved calculating the total square footage of installed cover rolls. Total square
footage of the cover rolls was recalculated, which resulted in a threefold increase.
• For project PE14238, the incorrect equipment specifications were used to determine infrared
heating capacity. Cadmus confirmed infrared heating through invoices and specification sheets,
which resulted in lower heating input and lower savings.
Small Industrial
The realization rates for the small industrial projects ranged from 36.6% to 128.6%. The track performed
well in 2018 and 2019, and most projects received a 100% realization rate. The overall combined 2018
and 2019 electric realization rate of 99% and gas realization rate of 101%, as shown in Table 18.
Adjustments were made to seven small industrial projects. The following list highlights more specific
adjustments to projects and provides examples:
• In some cases, actual operating hours were estimated incorrectly, or they were adjusted since
the project was completed due to changes in production. Cadmus confirmed with the sites that
these were not temporary and unrelated to COVID-19. Operating hour changes affected both
gas and electric savings across several measure types. Project examples: PE14088 and PE15560.
• Some projects used incorrect setpoints to calculate savings or setpoints that had been changed
since the project was completed. This included two projects that used the incorrect compressor
pressure setpoint to calculate energy savings. For a third project, incorrect flow rates were used
to calculate savings; however, based on discussions with site contact, the flow rates needed to
be adjusted to be more reflective of actual production. Project examples: PE11808, PE15457,
and PE16290.
• Project PE14103 received a higher realization rate because of a calculation error when summing
savings resulting from installing fast acting doors.
• Project PE16272 received slightly higher savings resulting from an increase in confirmed boiler
efficiency confirmed through specification sheets and a virtual site visit with the site contact.
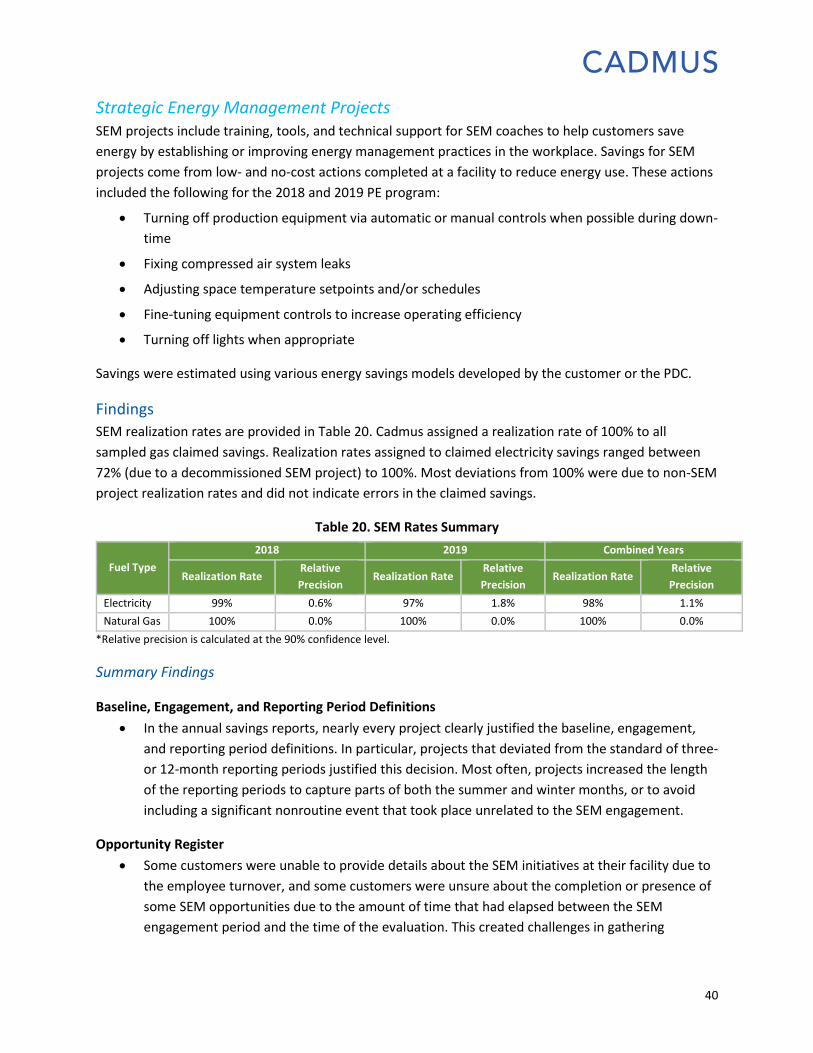
40
Strategic Energy Management Projects SEM projects include training, tools, and technical support for SEM coaches to help customers save
energy by establishing or improving energy management practices in the workplace. Savings for SEM
projects come from low- and no-cost actions completed at a facility to reduce energy use. These actions
included the following for the 2018 and 2019 PE program:
• Turning off production equipment via automatic or manual controls when possible during down-
time
• Fixing compressed air system leaks
• Adjusting space temperature setpoints and/or schedules
• Fine-tuning equipment controls to increase operating efficiency
• Turning off lights when appropriate
Savings were estimated using various energy savings models developed by the customer or the PDC.
Findings
SEM realization rates are provided in Table 20. Cadmus assigned a realization rate of 100% to all
sampled gas claimed savings. Realization rates assigned to claimed electricity savings ranged between
72% (due to a decommissioned SEM project) to 100%. Most deviations from 100% were due to non-SEM
project realization rates and did not indicate errors in the claimed savings.
Table 20. SEM Rates Summary
Fuel Type
2018 2019 Combined Years
Realization Rate Relative
Precision Realization Rate
Relative
Precision Realization Rate
Relative
Precision
Electricity 99% 0.6% 97% 1.8% 98% 1.1%
Natural Gas 100% 0.0% 100% 0.0% 100% 0.0%
*Relative precision is calculated at the 90% confidence level.
Summary Findings
Baseline, Engagement, and Reporting Period Definitions
• In the annual savings reports, nearly every project clearly justified the baseline, engagement,
and reporting period definitions. In particular, projects that deviated from the standard of three-
or 12-month reporting periods justified this decision. Most often, projects increased the length
of the reporting periods to capture parts of both the summer and winter months, or to avoid
including a significant nonroutine event that took place unrelated to the SEM engagement.
Opportunity Register
• Some customers were unable to provide details about the SEM initiatives at their facility due to
the employee turnover, and some customers were unsure about the completion or presence of
some SEM opportunities due to the amount of time that had elapsed between the SEM
engagement period and the time of the evaluation. This created challenges in gathering
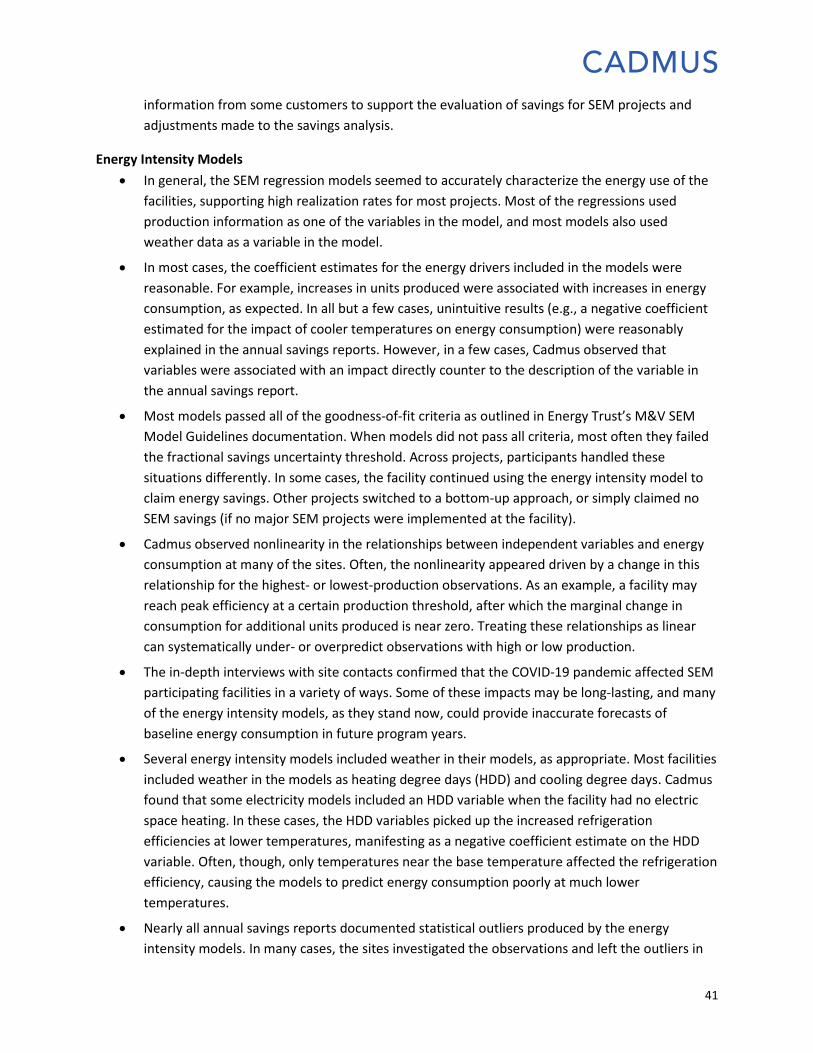
41
information from some customers to support the evaluation of savings for SEM projects and
adjustments made to the savings analysis.
Energy Intensity Models
• In general, the SEM regression models seemed to accurately characterize the energy use of the
facilities, supporting high realization rates for most projects. Most of the regressions used
production information as one of the variables in the model, and most models also used
weather data as a variable in the model.
• In most cases, the coefficient estimates for the energy drivers included in the models were
reasonable. For example, increases in units produced were associated with increases in energy
consumption, as expected. In all but a few cases, unintuitive results (e.g., a negative coefficient
estimated for the impact of cooler temperatures on energy consumption) were reasonably
explained in the annual savings reports. However, in a few cases, Cadmus observed that
variables were associated with an impact directly counter to the description of the variable in
the annual savings report.
• Most models passed all of the goodness-of-fit criteria as outlined in Energy Trust’s M&V SEM
Model Guidelines documentation. When models did not pass all criteria, most often they failed
the fractional savings uncertainty threshold. Across projects, participants handled these
situations differently. In some cases, the facility continued using the energy intensity model to
claim energy savings. Other projects switched to a bottom-up approach, or simply claimed no
SEM savings (if no major SEM projects were implemented at the facility).
• Cadmus observed nonlinearity in the relationships between independent variables and energy
consumption at many of the sites. Often, the nonlinearity appeared driven by a change in this
relationship for the highest- or lowest-production observations. As an example, a facility may
reach peak efficiency at a certain production threshold, after which the marginal change in
consumption for additional units produced is near zero. Treating these relationships as linear
can systematically under- or overpredict observations with high or low production.
• The in-depth interviews with site contacts confirmed that the COVID-19 pandemic affected SEM
participating facilities in a variety of ways. Some of these impacts may be long-lasting, and many
of the energy intensity models, as they stand now, could provide inaccurate forecasts of
baseline energy consumption in future program years.
• Several energy intensity models included weather in their models, as appropriate. Most facilities
included weather in the models as heating degree days (HDD) and cooling degree days. Cadmus
found that some electricity models included an HDD variable when the facility had no electric
space heating. In these cases, the HDD variables picked up the increased refrigeration
efficiencies at lower temperatures, manifesting as a negative coefficient estimate on the HDD
variable. Often, though, only temperatures near the base temperature affected the refrigeration
efficiency, causing the models to predict energy consumption poorly at much lower
temperatures.
• Nearly all annual savings reports documented statistical outliers produced by the energy
intensity models. In many cases, the sites investigated the observations and left the outliers in

42
the analysis when it found no justification for removal. When observations were removed, they
were often few in number and well documented in the annual savings report.
Capital Projects That Received Energy Trust Incentives
• Cadmus found that nearly every project clearly described the approach to adjusting
consumption for capital projects that received incentives through Energy Trust’s other PE tracks.
In fact, Cadmus only adjusted three projects that had used incorrect annual capital project
savings, two of which were substantial enough to result in a non-100% realization rate for these
sites.
• As described, Cadmus applied the track-level 2018-2019 PE impact evaluation realization rates
to the non-SEM projects. These minor adjustments primarily affected 16 of the sampled sites
and did not indicate any errors in the claimed savings.
Savings Estimation Methods
• No projects made errors when scaling the reporting period savings rate to a full 12 months of
engagement.
• Several projects reported annual savings estimates based on just a few months of reporting
period energy use data.4 However, small variations in reporting period energy use can
potentially have a significant impact on the reported savings, even when energy use at the site is
not expected to be seasonally driven. Cadmus did not investigate how such assumptions may
have impacted overall savings estimates.
• Projects with bottom-up savings had a near 100% realization rate. This may be because we were
unable to collect new data from sources other than facility contacts. Bottom-up calculations
were typically straightforward approaches for energy savings. Anecdotally, when evaluating
bottom-up savings calculations, we found that facility staff who were familiar with SEM were
not typically familiar with bottom-up calculation inputs.
4 The program’s minimum reporting period requirement is three months, and it is common to require a longer
reporting period for models where seasonality is a factor.

43
Conclusions and Recommendations Cadmus conducted an impact evaluation of the 2018 and 2019 PE program by analyzing energy savings
for 216 projects implemented at 73 sites. At those sites we also evaluated electricity savings for 19
additional projects and gas savings for five additional projects as convenience measures. The measures
belonged to six different program tracks and represented a variety of subcategories.
Cadmus performed verification through virtual site visits, interviews, and desk reviews for each project
in the sample. We evaluated energy savings based on verified equipment counts, operating parameters,
metering data, EMS trend data, and assumptions derived from engineering experience and secondary
sources. For each measure, these data informed prescriptive algorithms and calculation spreadsheets.
The PDCs generally applied appropriate methodologies and assumptions. Overall, Cadmus’ evaluated
savings differed from reported energy savings across the following main categories:
• Different operating hours
• Different equipment setpoints at the facility
• Incorrect equipment specifications or quantities
• Incorrect analysis methodology
• Measure removal
• Inappropriate assumption
• Calculation or engineering error
• (SEM) Non-SEM project realization rate adjustment
• (SEM) Decommissioned SEM project
• (SEM) Incorrect non-SEM project adjustment
These combined factors led to a 101% electric and 84% gas combined 2018 and 2019 realization rate.
Overall, the 2018 and 2019 PDCs performed a reasonable level of review and quality control to achieve
high average project savings realization rates. PDCs often proved extremely knowledgeable about
facilities with which they worked and were generally receptive to supporting evaluation efforts. Cadmus
worked directly with PDCs on a few occasions to contact facilities and acquire analysis files and data. We
found most PDCs quickly provided any documentation they could access, could identify appropriate
facility contacts, and went out of their way to assist with recruitment efforts.
We also found that Energy Trust implementation staff maintained a thorough understanding of project
details and participant sensibilities. Cadmus developed a large number of M&V plans for Energy Trust
staff to review. Even though PDCs were more directly involved with project review and approval, senior
PE program staff had strong knowledge of project and analysis details and provided significant feedback
to improve M&V efforts. This was especially important and helpful considering the shift the virtual site
visits, and in many cases, Cadmus had to rely on staff for data requests and additional information on

44
projects. Energy Trust staff was very responsive and supportive of all evaluation activity contributing to
the success of the 2018-2019 program evaluation.
Based on its evaluation, Cadmus recommends the following opportunities for program improvements.
Recommendations are divided into their respective tracks. If a recommendation applies to multiple
tracks, we include it in the other recommendations section.
Custom Capital
• For compressed air savings analysis, we recommend the program use the day type analysis
methodology. This methodology looks at energy savings for each day type accounting for
differences in air demand across weekdays and weekends. This is particularly useful when
developing 8,760 load shapes and is beneficial when calculating air leak and air dryer savings.
We recommend avoiding averaging data across entire metering/trend data periods as this
eliminates some of the important and intricate changes over a metered period that should be
considered in the savings analysis. The day type methodology is referenced in the Uniform
Methods Protocol (UMP) Compressed Air Evaluation protocol5 and also used by the Department
of Energy’s Air Master Tool to estimate savings6.
Custom O&M
• For compressed air leak savings projects, we recommend using the system leak-down test as
highlighted in the UMP Compressed Air Protocol to estimate the combined loss (CFM) of
compressed air leaks. This approached can be used in the pre and post case to estimate the
effect of leak fixes in the system. In cases were the system leak-down test is impractical, flow
should be estimated by measuring compressor power and correlating to flow using CAGI sheets
or standard flow tables. This compressor power be measured during non-production periods
and all non-leak users of air should be discounted from the data to determine actual leak
volume. Lastly, the most accurate approach is to measure actual flow rate in the pre and post
non-production periods and discount for any non-leak air users. Installing flow meters can
sometimes be invasive and prove impractical and hence the two prior methods are more
common approaches. Ultrasonic leak detectors are good for identifying leaks and estimating
savings at a high level; however, the three approaches detailed above provide a more accurate
way of estimating leak loss.
• We recommend the program standardize the approach used to determine air-leak savings. Our
analysis found that there were a few leak projects that claimed more savings than available air
flow during nonproduction periods. This generally meant that the ultrasonic leak detector was
overestimating savings. Contractors used different methodologies to adjust leak rates and to
5 Benton, Nathanael; Patrick Burns, and Joel Zahlan. (2021). Chapter 22: Compressed Air Evaluation Protocol. The Uniform
Methods Project: Methods for Determining Energy Efficiency Savings for Specific Measures. Golden, CO; National
Renewable Energy Laboratory. NREL/SR-7A40-77820. http://www.nrel.gov/docs/fy21osti/77820.pdf.
6 https://www.energy.gov/eere/amo/articles/airmaster.

45
calculate savings for each of these projects, which resulted in different savings estimates. If pre-
and post-metered data are not available, standardize the approach to using findings from the
ultrasonic leak detector and adjust accordingly to reflect compressor flow during nonproduction
periods.
Streamlined Industrial
• We recommend the program use light loggers more frequently to determine lighting hours of
use and occupancy sensor savings for projects with significant electricity savings (i.e., greater
than 500,000 kWh) and those projects that also have occupancy sensors. This will provide more
accurate energy savings estimates.
• We recommend the program apply a uniform approach to calculating HVAC interactive effects
across all lighting projects. Upgrades to LED lights generally result in an increase in electricity
savings through cooling savings and an increase in gas or electric consumption due to additional
heating requirements. The program should apply a standardized approach to calculate
interactive effects across all lighting projects to ensure these effects are accounted for
appropriately. Lighting-related HVAC interactive effects are also covered in the Uniform
Methods Protocol (UMP) Commercial and Industrial Lighting Evaluation Protocol7
Strategic Energy Management
• The in-depth interviews with site contacts confirmed that the COVID-19 pandemic affected
facilities participating in SEM in a variety of ways. Some of these impacts may be long-lasting,
and many of the energy intensity models, as they stand now, could provide inaccurate forecasts
of baseline energy consumption in future program years. We recommend reviewing the effects
of COVID-19 at each facility to determine if projects require re-baselining and new energy
intensity models once normal operations resume post-pandemic.
• The Energy Trust SEM M&V Guidelines recommend sites use a 90-day or 12-month reporting
period for claiming annual program savings. Energy Trust should consider formally testing how
changes to the reporting period definition (months covered and length of the period) impacts
the annual savings claimed for a variety of facility types. Savings rates may remain consistent
across all 12 months for certain production sectors, but a formal investigation would provide
guidance on which facilities may suffer from greater inaccuracies under this assumption.
• When higher-frequency energy consumption data, such as daily data, are available for building
the energy intensity models, we recommend interacting production variables with indicators at
known change points to reduce modeling error and improve observed nonlinearity between
energy drivers and energy consumption. Change points should be driven by knowledge of the
facility to avoid overfitting.
7 Gowans, Dakers. (2013). Chapter 2: Commercial and Industrial Lighting Evaluation Protocol. The Uniform Methods Project:
Methods for Determining Energy Efficiency Savings for Specific Measures. Golden, CO; National Renewable Energy
Laboratory. NREL/SR-7A30-53827. https://www.energy.gov/sites/prod/files/2013/11/f5/53827-2.pdf.

46
• When appropriate, we recommend using heating and cooling degree-days in energy models
rather than average temperature and higher-order polynomials. Energy consumption tends to
correlate better to heating and cooling degree-days, especially when a high percentage of
facility energy use is for space and process heating and cooling.
• When SEM facilities diverge from IPMVP Option C for claiming energy savings due to their SEM
engagement, Energy Trust should consider treating these projects like separate custom track
projects requiring a distinct impact evaluation approach and interview or site visit with a
different site contact – specifically, one most familiar with the major projects implemented.
• To assist with future qualitative assessments of SEM savings, we recommend requiring sites to
include the expected energy savings generated from major SEM projects as part of the
opportunity register to increase the accuracy of realization rate adjustments based on these
activities.
Other Recommendations
This section covers recommendations that apply to the overall program and not to a specific track.
These are recommendations focus on overarching opportunities to improve the program.
Virtual Site Visits
Cadmus found that virtual site visits had both benefits and drawbacks. Many customers stated that
virtual site visits were convenient and took less time than in-person visits. Cadmus found that many
customers reviewed the data collection checklist and this led to a shorter visit. However, there were
occasional internet connectivity issues and it was difficult to verify some equipment from a distance,
such as plants that installed thousands of LEDs.
Benefits of virtual site visits included the following:
• Convenient for customers
• No travel time for Cadmus staff
• Shorter visit, especially if site contact was knowledgeable about the installed measure and
reviewed the data collection checklist in advance
There were also a handful of drawbacks, such as these:
• Internet connectivity issues, especially in certain areas of plants such as boiler rooms
• Frequent rescheduling of visits when customers did not show up to the meeting
• Possible decrease in evaluation rigor due to not working with the equipment directly
Cadmus recommends Energy Trust maintain the use of virtual site visits as an evaluation tool for
verifying savings moving forward, especially for straight-forward measures that do not require
additional metering or spot measurements. Cadmus developed a memo for Energy Trust titled, Virtual
Site Visit Memorandum, which details considerations for virtual site selection and recommendations for
measures that should be considered. A copy of this memo is included in Appendix D. Virtual Site Visit
Memorandum.

47
Metering Periods
We recommend the program use a minimum metering period of two weeks. Two weeks is typically
enough to capture a full production cycle, but this is also dependent on the type of equipment,
production schedule, seasonality, weather, and other factors. For example, HVAC systems may require
longer intervals or multiple metering periods to characterize operation in the shoulder months. PDCs
should take these dependencies into consideration whenever metering.
Operations
• For Energy Trust projects with multiple program tracks, we recommend the program assign one
PE number for each program track. For example, PE14040 had two measures, one in the Custom
Capital track and another in the Custom O&M track. Cadmus sampled at the project and track
level, and in this case, sampled the measure associated with the Custom O&M track. Cadmus
evaluated the savings of the measure in the Custom Capital track as part of the convenience
sample. Assigning one PE number for each program track will help distinguish between the
savings associated with the two tracks, aiding with sampling at the track level and confidence
and precision calculations.
• We recommend the program clearly specify projects that are located on the same site by
assigning unique site IDs for each site. In the 2018-2019 program data, projects located at the
same address did not always have the same site ID. In some cases, this resulted in contacting
sites on different occasions for the impact evaluation. Assigning a clear and unique ID per site
will allow Energy Trust to filter for all projects at a specific site and reduce the amount of
outreach to sites with multiple projects.
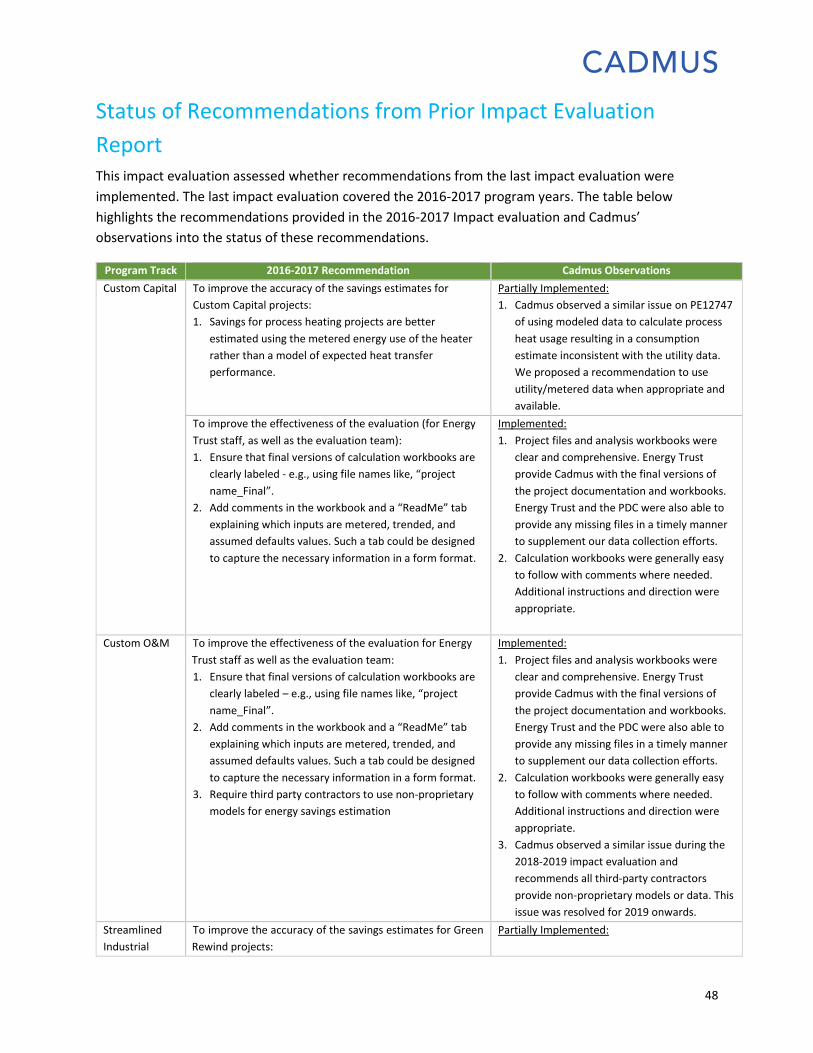
48
Status of Recommendations from Prior Impact Evaluation
Report This impact evaluation assessed whether recommendations from the last impact evaluation were
implemented. The last impact evaluation covered the 2016-2017 program years. The table below
highlights the recommendations provided in the 2016-2017 Impact evaluation and Cadmus’
observations into the status of these recommendations.
Program Track 2016-2017 Recommendation Cadmus Observations
Custom Capital To improve the accuracy of the savings estimates for
Custom Capital projects:
1. Savings for process heating projects are better
estimated using the metered energy use of the heater
rather than a model of expected heat transfer
performance.
Partially Implemented:
1. Cadmus observed a similar issue on PE12747
of using modeled data to calculate process
heat usage resulting in a consumption
estimate inconsistent with the utility data.
We proposed a recommendation to use
utility/metered data when appropriate and
available.
To improve the effectiveness of the evaluation (for Energy
Trust staff, as well as the evaluation team):
1. Ensure that final versions of calculation workbooks are
clearly labeled - e.g., using file names like, “project
name_Final”.
2. Add comments in the workbook and a “ReadMe” tab
explaining which inputs are metered, trended, and
assumed defaults values. Such a tab could be designed
to capture the necessary information in a form format.
Implemented:
1. Project files and analysis workbooks were
clear and comprehensive. Energy Trust
provide Cadmus with the final versions of
the project documentation and workbooks.
Energy Trust and the PDC were also able to
provide any missing files in a timely manner
to supplement our data collection efforts.
2. Calculation workbooks were generally easy
to follow with comments where needed.
Additional instructions and direction were
appropriate.
Custom O&M To improve the effectiveness of the evaluation for Energy
Trust staff as well as the evaluation team:
1. Ensure that final versions of calculation workbooks are
clearly labeled – e.g., using file names like, “project
name_Final”.
2. Add comments in the workbook and a “ReadMe” tab
explaining which inputs are metered, trended, and
assumed defaults values. Such a tab could be designed
to capture the necessary information in a form format.
3. Require third party contractors to use non-proprietary
models for energy savings estimation
Implemented:
1. Project files and analysis workbooks were
clear and comprehensive. Energy Trust
provide Cadmus with the final versions of
the project documentation and workbooks.
Energy Trust and the PDC were also able to
provide any missing files in a timely manner
to supplement our data collection efforts.
2. Calculation workbooks were generally easy
to follow with comments where needed.
Additional instructions and direction were
appropriate.
3. Cadmus observed a similar issue during the
2018-2019 impact evaluation and
recommends all third-party contractors
provide non-proprietary models or data. This
issue was resolved for 2019 onwards.
Streamlined
Industrial
To improve the accuracy of the savings estimates for Green
Rewind projects:
Partially Implemented:

49
Program Track 2016-2017 Recommendation Cadmus Observations
Green Rewind
Projects
1. Ensure that motors approved for incentives are
reinstalled and operational rather than placed into
storage.
2. Ensure that the program application and database
reflect the applicable industry.
1. Cadmus noted that the rewound motors
were in storage and not reinstalled. We
deemed this appropriate considering we
expect site contacts to install a backup
motor while motors are rewound and it is
not reasonable to expect them to stop
production lines to reinstall rewound motors
when received. We do expect, however, that
these motors will be installed in the future
and achieve their savings over the expected
measure life.
2. Cadmus did not observe discrepancies in the
program applications.
Streamlined
Industrial
Lighting
Projects
To improve the accuracy of the savings estimates for
Lighting projects:
1. Ensure re-lamping projects are using the correct
baseline by updating the program lighting tool
workbook to reflect the current baseline each year (for
example, do not use incandescent baselines).
2. Ensure projects correctly state the wattage of
replacement TLED lamps with ballasts.
3. Ensure new construction projects correctly define the
space types included to accurately estimate the savings.
Implemented:
1. Reviewed lighting projects for the most part
used the appropriate baselines.
2. Reviewed lighting projects for the most part
used the appropriate wattages.
3. For the most part lighting workbooks had
defined interior/exterior classification and
location area/room.
To improve the effectiveness of the evaluation for Energy
Trust staff as well as the evaluation team:
1. For the program lighting tool workbook, add a column
to indicate the identification number of the measure for
each fixture.
2. Ensure reasons for adjustments to energy savings
workbooks are clearly identified in project
documentation (for example, changing user-defined
values to standard values).
3. Consider streamlining the new construction lighting
workbook, organizing and identifying the project
assumptions according to the inputs into the model.
Partially Implemented:
1. Workbook does not indicate the
identification number of the measure of
each fixture.
2. Lighting workbooks and project
documentation had sufficient feedback on
adjustments.
3. Not applicable.
Streamlined
Industrial
Prescriptive
Projects
To improve the accuracy of the savings estimates for
Prescriptive projects:
1. Savings for irrigation system seal and gasket
replacements should be adjusted to account for
irrigation pumps that are not powered via the grid. It is
recommended that this be done by applying adjustment
factors to the prescriptive savings, with the adjustment
factors being the percent of time that grid power is
used for irrigation pumping.
2. Add size classifications to the prescriptive savings for
hot water and steam piping insulation. Possible size
classifications could be 2” diameter or less, 2-6”
Not Implemented:
1. Cadmus did not observe an update to the
MAD that would include adjustment factors.
2. Therms savings based on pressure only: low
pressure (<15 psig) and high pressure (15-
200 psig). No mention of size classification.
3. Cadmus did not observe any issues with
boiler sizing.

50
Program Track 2016-2017 Recommendation Cadmus Observations
diameter, 6-10” diameter, 10-16” diameter, and greater
than 16” diameter. Note that comprehensive data on
pipe diameters was not collected through this
evaluation.
3. Ensure that all boilers meet minimum operating
requirements.
Streamlined
Industrial Small
Industrial
Projects
To improve the accuracy of the savings estimates for Small
Industrial projects:
1. Ensure that detailed information is collected from
customers about the operation of their equipment via
interviews/questionnaires or metered data, so that the
operating characteristics used in the ex ante savings
calculations are representative of the actual operation
of the equipment.
2. In situations where baselines are not wholly dictated by
code (such as refrigeration system controls) and there is
not a functioning existing system that can be used to
establish a baseline, additional checks should be made
to ensure the baseline system details align with what is
considered industry standard practice, to ensure the
baseline is reasonable and appropriate.
3. Savings for large projects should be checked against the
typical energy use of the facility to ensure the claimed
savings make sense.
Implemented:
1. Cadmus reviewed project files and
determined that in most cases Energy Trust
and the PDCs collected sufficient information
to verify key inputs in the energy savings
calculations. Where there were gaps, Energy
Trust and the PDCs were able to provide
additional feedback to supplement
information in the project files.
2. We did not run into systematic issues with
baseline equipment in the 2018-2019
evaluation. For the most part baselines were
appropriate.
3. Not applicable.
SEM To improve the accuracy of the savings estimates for SEM
projects:
1. When appropriate, use heating and cooling degree-days
in energy models rather than average temperature.
Energy use tends to correlate better to heating and
cooling degree-days, especially when a high percentage
of facility energy use is for space and/or process heating
and cooling.
2. For projects that use weather as a variable or facilities
that have seasonality of production, it is recommended
that ASHRAE Guideline 14, Section 5.2.4 be used as
guidance for the post-retrofit measurement period:
ASHRAE Guideline 14, 5.2.4 Setting the Duration of the
Post-Retrofit Measurement Period. Variables used in
computing savings shall be measured over a period of
time that is long enough to:
a. Encompass all operating modes of the retrofitted
system(s),
b. Span the full range of independent variables normally
expected for the post retrofit period, and
c. Provide the intended level of certainty in the reported
savings.
One year of data post-retrofit is the ideal to more
accurately capture seasonal and weather-based
variations in energy usage. However, it is recognized
Partially Implemented:
1. Cadmus found that many of the energy
intensity models included heating and
cooling degree-days rather than average
temperature, though in the site-specific
evaluation reports, we still noted cases
where average temperature was used
instead.
2. Sites with seasonally driven processes
tended to extend their reporting period to
four, six, or 12 months, as recommended.
Cadmus notes that using 12 months of post-
retrofit data is ideal when possible.
3. Two to three years passed between the
2018-2019 SEM participation and evaluation.
Some sites experienced staff turnover and
role changes which hindered Cadmus’ ability
to discuss the year under evaluation with the
appropriate site contact.
4. The variables included in the energy
intensity models were generally appropriate
for the type of facility, though modifications
exist that could better capture the different
efficiencies achieved at levels of production
at several facilities.

51
Program Track 2016-2017 Recommendation Cadmus Observations
that this guideline can be cumbersome. Therefore, we
recommend a minimum time period of 6 months
provided ASHRAE items above are covered for these
types of projects. For projects that are not affected by
weather or seasonality, the current minimum of 3
months is sufficient.
3. Reduce the time between the completion of SEM
initiatives and when they are evaluated. This will result
in more timely feedback, will allow evaluators to collect
information from customers when details of the SEM
initiatives and engagement are relatively fresh in their
minds, and will minimize the risk of not being able to
collect sufficient data to support the evaluation due to
employee turnover or facility operational changes.
4. Carefully consider variables used in the regression
models for establishing the best fit based on the type of
project.
5. Consider adding an estimate of savings or description of
other benefits for each action item in the opportunity
register to help SEM participants prioritize actions to
complete.
5. Estimates of SEM project impacts were not
included in the annual savings reports. The
opportunity registers included relative
impacts, such as ‘high’ or ‘low’ impact.
Appendix A. Customer Introduction Letter A-1
Appendix A. Customer Introduction Letter May 2020
Dear Customer,
I am writing to ask for your help with a study of projects that received support through Energy Trust’s
Production Efficiency program in 2018 and 2019. As part of our commitment to continuous
improvement, Energy Trust regularly evaluates our programs to ensure that they are meeting our
expectations for energy savings, generation, and cost-effectiveness. The study’s results will be used to
inform Energy Trust on how much energy our programs save. The study’s results will not be used to
recalculate incentive payments, and will not divulge information that identifies a site. Your participation
in this study will enable Energy Trust to improve our programs and the offerings available to businesses
like yours.
Energy Trust has contracted with Cadmus, an independent research consulting firm, to confirm the
energy efficiency measures installed in 2018 and 2019, including the measure(s) installed at your facility.
An engineer from Cadmus will be contacting you within the next few weeks to complete a short phone
interview about your project. The engineer may also request to conduct a virtual site visit to confirm the
energy efficiency measures installed at your facility.
What to Expect if Selected for a Virtual Site Visit
Typically, we conduct on-site inspection and monitoring of the energy efficiency measures installed at
your facility. However, due to COVID-19, Cadmus will be conducting virtual site visits. With your
permission, an engineer from Cadmus will:
• Video-call the appropriate project contact at your site
• View the equipment related to the program incentive
• Ask the contact a few questions
• Request additional photos or data
A Cadmus engineer will provide you with the objectives of the video call and key points to be verified.
The engineer will also confirm the software you prefer for the video call and any additional support
documents. During the call, the Cadmus engineer will discuss and visually verify the key points of the
project. This call may be recorded for reference and review by the engineer. Please be assured that any
information or data gathered during our virtual visit will be treated as strictly confidential.
If you have any questions, please contact Joel Zahlan of Cadmus at 703.247.6140 or by email at
[email protected]. We look forward to working with you on this important study. Thank
you in advance for your cooperation
Sincerely,
Erika Kociolek, Evaluation Sr. Project Manager
503.445.0578

Appendix B. Customer Interview Guides B-1
Appendix B. Customer Interview Guides The interview guides will be shared as a standalone document.

Appendix C. Energy Trust Industrial Impact Evaluation Policies C-1
Appendix C. Energy Trust Industrial Impact Evaluation Policies
Production Changes
• If evaluators find that production levels have changed significantly (more than ±10%) relative to
the assumptions feeding into the ex ante savings, Energy Trust expects evaluators to capture the
current production levels, and ask about the facility’s expectations regarding production levels
in the next six months.
▪ If production levels have changed less than ±10%, then the assumptions feeding into the
ex ante savings should be used.
▪ If production levels have changed more than ±10% . . .
- . . . and current production levels are expected to remain constant in the future, current
production levels should be used to calculate ex post savings.
- . . . and expected production levels in the next six months align with the assumptions
feeding into the ex ante savings (regardless of current production levels), then the
assumptions feeding into the ex ante savings should be used.
- . . . and expected production levels in the next six months are expected to change
relative to current production levels (and they differ from the assumptions feeding into
the ex ante savings), then an average of current production levels and expected
production levels in the next six months should be used to calculate ex post savings.
▪ If evaluators are not able to capture current production levels, ask about the facility’s
expectations regarding production levels in the next six months, or obtain any other
relevant information about the status of the facility or project, then the assumptions
feeding into the ex ante savings should be used.
• If evaluators find that production lines have changed, evaluators should assess if the baseline used for the ex ante savings is appropriate, and assess how the changes affect the baseline.
o Energy Trust and evaluators will discuss if a new baseline should be developed to calculate ex post savings.
Measure Removal in Operational Facilities
• If evaluators find that a measure has been removed, Energy Trust expects evaluators to
determine when the measure was removed, and prorate the savings relative to the measure
lifetime.
▪ For example, if an O&M measure with ex ante savings of 15,000 kWh was in place for only
the first year, then the ex post savings would be one-third of the ex ante savings (5,000
kWh).
▪ For example, if a capital measure (a motor) with ex ante savings of 15,000 kWh was in place
for only the first year, then the ex post savings would be 1/15 of the ex ante savings (1,000
kWh).

Appendix C. Energy Trust Industrial Impact Evaluation Policies C-2
SEM
• Evaluators will review the final reports and energy models for errors and reasonableness, assessing the following: ▪ Check for errors in modeling methods
- Failure to account for capital measures
- Incorrect accounting of capital measure savings
- Incorrect accounting of other factors affecting facility energy use
- Unexplained data excluded from regression model
▪ Check for trends in baseline model residuals based on data in final reports and energy
models
- Residuals equal the difference between actual metered energy and predicted energy
use for the baseline regression model; trends in residuals against fitted values or over
time indicates that the model systematically underpredicts or overpredicts energy
consumption and savings and suggests that important energy drivers have been omitted
from the model
▪ Check baseline and reporting periods
- Baseline and reporting periods should be distinct
- Baseline and reporting periods different than the standard of 12 months and 3 months,
respectively, should be explained and justified
▪ Verify capital projects and SEM activities as part of site visits and/or interviews
- Verify the status of the capital projects documented in the final reports and opportunity
registers. If they were implemented, determine if they are still in place, and if not, why
not
- Verify the status of the most impactful SEM activities documented in the final reports
and opportunity registers. If were implemented, determine if they are still in place, and
if not, why not
- Gather information about additional activities and/or capital measures implemented
since the SEM engagement, including when they were implemented
• Using the information gathered from the file review and the site visits and/or interview,
evaluators will assign realization rates to reflect whether ex ante savings were likely
underestimated, estimated accurately, or overestimated, as follows:
▪ 90% to indicate that the claimed energy savings seemed unreliable or were likely
overestimated
▪ 100% to indicate that the claimed energy savings appears reasonable
▪ 110% to indicate that the claimed energy savings were likely underestimated
Appendix C. Energy Trust Industrial Impact Evaluation Policies C-3
• If evaluators determine that more rigorous quantitative evaluation of the energy models for
specific projects are warranted, Energy Trust and evaluators will discuss how to proceed. In
general, Energy Trust expects that more rigorous quantitative evaluation of the energy models
would only be used if there were significant changes at the site, or if evaluators were not able to
contact customers to verify capital projects and SEM activities.
Facility Closures
• In 2011, Energy Trust completed a study of measures installed in industrial facilities between
2002 and 2009.
• Prior to 2011, Energy Trust utilized a measure lifetime of 10 years for the majority of capital
industrial measures to address the issues of plant closures and process line changes over time.
• The study found that the vast majority of measures (98%) were still in place, and concluded that
the measure lifetime of ten years was very conservative.
• In response, Energy Trust began using a measure lifetime of 15 years.
• Evaluators may determine that a facility is permanently closed or temporarily inactive based on
information provided by the site contact, by Energy Trust and/or the PDCs, by publicly available
information, and/or by information collected in the course of data collection – e.g., voicemail
messages or e-mail bounce backs.
• A facility closure is defined as a facility that is permanently closed or temporarily inactive at the
time of the evaluation
• For permanently closed facilities, Energy Trust believes that facility closures are accounted for
in the measure lifetime for capital measures used by Energy Trust, and expects evaluators to
calculate ex post savings for capital measures installed in closed facilities similarly to how they
would normally – the key is that the facility closure does not, as a matter of course, mean that
the capital measure receives a realization rate of zero. Unlike the case of measure removal, for
permanently closed facilities, the savings will not be prorated relative to the measure lifetime.
• For temporarily inactive facilities (to be determined based on information provided by the site
contact, by Energy trust and/or the PDCs, by publicly available information, and/or by
information collected in the course of data collection – e.g., voicemail messages or e-mail
bounce backs):
▪ If the facility has projects not sampled for certainty strata, evaluators may drop the projects
and replace them with back-up projects.
▪ If the facility has projects sampled for certainty strata, evaluators will need to perform desk
reviews. If evaluators do not feel comfortable performing desk reviews to assign realization
rates, Energy Trust and evaluators will discuss how to proceed.
• A facility that has curtailed shifts or furloughed employees temporarily is not permanently
closed. It may be considered temporarily inactive, depending on the specific circumstances of
the facility. Either way, evaluators should reference the Production Changes section, above.

Appendix C. Energy Trust Industrial Impact Evaluation Policies C-4
• Since Energy Trust does not regularly undertake studies to assess measure persistence, impact
evaluations are an important source of information, and insights gained from impact evaluations
may be used to adjust measure lifetimes for the program at large, for certain measures, and/or
certain types of customers.
Customer Non-Participation in Impact Evaluations
• In general, Energy Trust expects most customers to participate in impact evaluations.
• In prior years, only a handful of customers (1) refuse to participate or (2) do not participate
because evaluators are not able to contact customers due to, for example, a facility closure
(addressed above), or lack of response to repeated attempts to make contact.
▪ For projects not sampled for certainty strata, evaluators may drop the projects and replace
them with back-up projects.
▪ For projects sampled for certainty strata, evaluators will need to perform desk reviews. If
evaluators do not feel comfortable performing desk reviews to assign realization rates,
Energy Trust and evaluators will discuss how to proceed.
A Note About Broad Social and Economic Changes
• Over the past 15 years, Energy Trust has seen several events, including the 2008 recession and
COVID-19 pandemic, which have resulted in relatively rapid changes to facility operations and
significant uncertainty about the future.
• These events, and the resulting changes to facility operations, complicate impact evaluation,
due to uncertainty about the duration of these events and the durability of the resulting
changes to facility operations.
• In all cases, Energy Trust and evaluators will discuss how to proceed
▪ If Energy Trust and evaluators are both in agreement, evaluators will not use production,
billing, or operational data in the evaluation – the event will essentially be considered a
blackout period.
Evaluators should consult with Energy Trust staff if they are uncertain how to apply the above policies to
a given project, or if there are situations that are not addressed above

Appendix D. Virtual Site Memorandum D-1
Appendix D. Virtual Site Visit Memorandum To: Erika Kociolek; Energy Trust of Oregon
From: Cadmus EM&V team
Subject: Virtual site visits
Date: July 30, 2020
The COVID-19 pandemic has resulted in significant and rapid changes to facility operations and caused
uncertainty about future operations. This has complicated impact evaluations and especially affected
on-site project verifications. Energy Trust of Oregon has provided guidance for impact evaluation
activity, including updating its industrial impact policies and providing alternative approaches to project
verification. Specifically, this guidance provides virtual site visits as an option for savings verification
across the portfolio. This memo reviews the considerations that influence the successful
implementation of this methodology and identifies some considerations and limitations.
A virtual site visit involves web-based audio and video to facilitate face-to-face interaction with a
project-specific site contact. This allows the evaluation team to verify projects and observe performance
parameters remotely in real time. The evaluator may use a combination of the following to verify
savings:
• Virtual site-visit observations (for example, a video recording, interview with the site contact, or
photos taken during the virtual tour)
• Additional submitted project documentation, such as invoices, specification sheets, calculation
models, and site-provided meter or trend data.
When physical access to a customer site is not feasible, a virtual site visit is a useful tool to gather the
site-specific conditions and data needed to determine measure savings.
Careful selection of sites, projects, and technology for virtual verification is of vital importance. Table 1
shows the criteria for determining potentially eligible sites. These selection criteria may evolve as we
implement the virtual site visit methodology and gather additional information.
Table 1. Virtual Site Selection
Consideration Selection Criteria
1 Safety
• The sites and measures selected must be deemed safe for verification by a site contact. This method relies on site contact accessing equipment for verification. Sometimes the equipment may be located in spaces that are not easy to access or may involve operating equipment that requires professional training.
• For example, it’s preferable to select sites that do not require the site contact to climb ladders or access electrical panels for a virtual site visit.
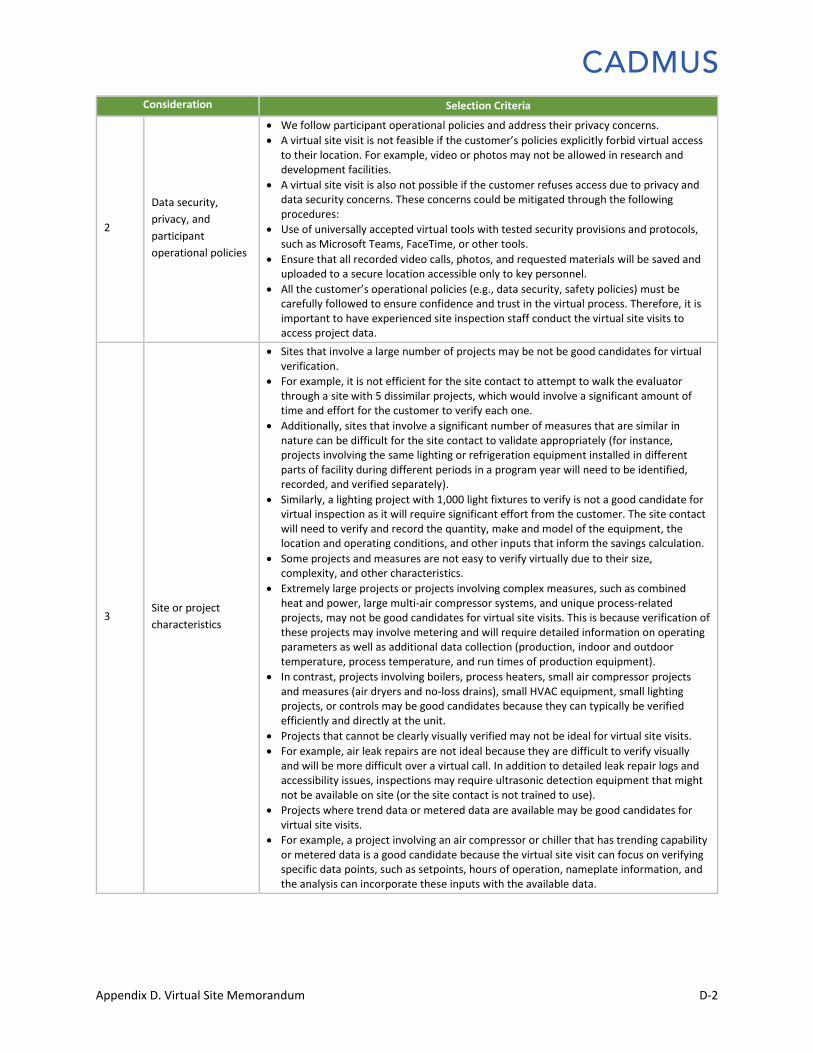
Appendix D. Virtual Site Memorandum D-2
Consideration Selection Criteria
2
Data security,
privacy, and
participant
operational policies
• We follow participant operational policies and address their privacy concerns.
• A virtual site visit is not feasible if the customer’s policies explicitly forbid virtual access to their location. For example, video or photos may not be allowed in research and development facilities.
• A virtual site visit is also not possible if the customer refuses access due to privacy and data security concerns. These concerns could be mitigated through the following procedures:
• Use of universally accepted virtual tools with tested security provisions and protocols, such as Microsoft Teams, FaceTime, or other tools.
• Ensure that all recorded video calls, photos, and requested materials will be saved and uploaded to a secure location accessible only to key personnel.
• All the customer’s operational policies (e.g., data security, safety policies) must be carefully followed to ensure confidence and trust in the virtual process. Therefore, it is important to have experienced site inspection staff conduct the virtual site visits to access project data.
3 Site or project
characteristics
• Sites that involve a large number of projects may be not be good candidates for virtual verification.
• For example, it is not efficient for the site contact to attempt to walk the evaluator through a site with 5 dissimilar projects, which would involve a significant amount of time and effort for the customer to verify each one.
• Additionally, sites that involve a significant number of measures that are similar in nature can be difficult for the site contact to validate appropriately (for instance, projects involving the same lighting or refrigeration equipment installed in different parts of facility during different periods in a program year will need to be identified, recorded, and verified separately).
• Similarly, a lighting project with 1,000 light fixtures to verify is not a good candidate for virtual inspection as it will require significant effort from the customer. The site contact will need to verify and record the quantity, make and model of the equipment, the location and operating conditions, and other inputs that inform the savings calculation.
• Some projects and measures are not easy to verify virtually due to their size, complexity, and other characteristics.
• Extremely large projects or projects involving complex measures, such as combined heat and power, large multi-air compressor systems, and unique process-related projects, may not be good candidates for virtual site visits. This is because verification of these projects may involve metering and will require detailed information on operating parameters as well as additional data collection (production, indoor and outdoor temperature, process temperature, and run times of production equipment).
• In contrast, projects involving boilers, process heaters, small air compressor projects and measures (air dryers and no-loss drains), small HVAC equipment, small lighting projects, or controls may be good candidates because they can typically be verified efficiently and directly at the unit.
• Projects that cannot be clearly visually verified may not be ideal for virtual site visits.
• For example, air leak repairs are not ideal because they are difficult to verify visually and will be more difficult over a virtual call. In addition to detailed leak repair logs and accessibility issues, inspections may require ultrasonic detection equipment that might not be available on site (or the site contact is not trained to use).
• Projects where trend data or metered data are available may be good candidates for virtual site visits.
• For example, a project involving an air compressor or chiller that has trending capability or metered data is a good candidate because the virtual site visit can focus on verifying specific data points, such as setpoints, hours of operation, nameplate information, and the analysis can incorporate these inputs with the available data.
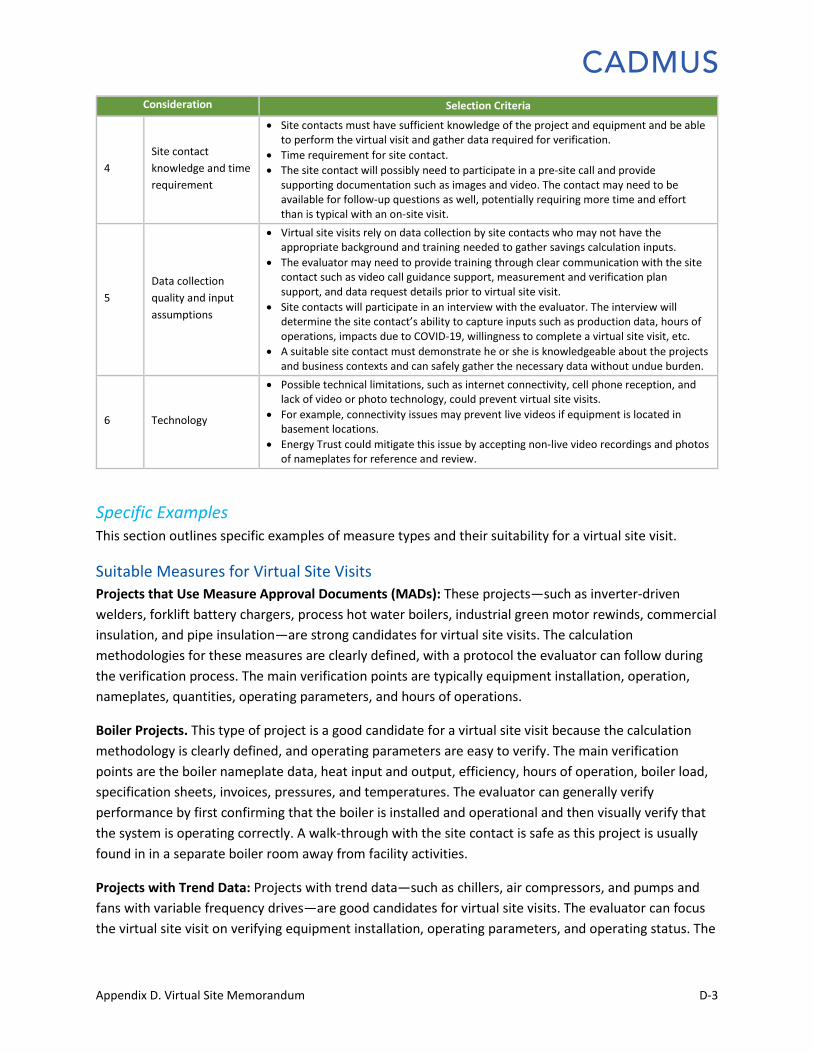
Appendix D. Virtual Site Memorandum D-3
Consideration Selection Criteria
4
Site contact
knowledge and time
requirement
• Site contacts must have sufficient knowledge of the project and equipment and be able to perform the virtual visit and gather data required for verification.
• Time requirement for site contact.
• The site contact will possibly need to participate in a pre-site call and provide supporting documentation such as images and video. The contact may need to be available for follow-up questions as well, potentially requiring more time and effort than is typical with an on-site visit.
5
Data collection
quality and input
assumptions
• Virtual site visits rely on data collection by site contacts who may not have the appropriate background and training needed to gather savings calculation inputs.
• The evaluator may need to provide training through clear communication with the site contact such as video call guidance support, measurement and verification plan support, and data request details prior to virtual site visit.
• Site contacts will participate in an interview with the evaluator. The interview will determine the site contact’s ability to capture inputs such as production data, hours of operations, impacts due to COVID-19, willingness to complete a virtual site visit, etc.
• A suitable site contact must demonstrate he or she is knowledgeable about the projects and business contexts and can safely gather the necessary data without undue burden.
6 Technology
• Possible technical limitations, such as internet connectivity, cell phone reception, and lack of video or photo technology, could prevent virtual site visits.
• For example, connectivity issues may prevent live videos if equipment is located in basement locations.
• Energy Trust could mitigate this issue by accepting non-live video recordings and photos of nameplates for reference and review.
Specific Examples This section outlines specific examples of measure types and their suitability for a virtual site visit.
Suitable Measures for Virtual Site Visits
Projects that Use Measure Approval Documents (MADs): These projects—such as inverter-driven
welders, forklift battery chargers, process hot water boilers, industrial green motor rewinds, commercial
insulation, and pipe insulation—are strong candidates for virtual site visits. The calculation
methodologies for these measures are clearly defined, with a protocol the evaluator can follow during
the verification process. The main verification points are typically equipment installation, operation,
nameplates, quantities, operating parameters, and hours of operations.
Boiler Projects. This type of project is a good candidate for a virtual site visit because the calculation
methodology is clearly defined, and operating parameters are easy to verify. The main verification
points are the boiler nameplate data, heat input and output, efficiency, hours of operation, boiler load,
specification sheets, invoices, pressures, and temperatures. The evaluator can generally verify
performance by first confirming that the boiler is installed and operational and then visually verify that
the system is operating correctly. A walk-through with the site contact is safe as this project is usually
found in in a separate boiler room away from facility activities.
Projects with Trend Data: Projects with trend data—such as chillers, air compressors, and pumps and
fans with variable frequency drives—are good candidates for virtual site visits. The evaluator can focus
the virtual site visit on verifying equipment installation, operating parameters, and operating status. The

Appendix D. Virtual Site Memorandum D-4
evaluator can also discus production-related questions and request trend data during the virtual visit to
verify savings.
Challenging Measures for Virtual Site Visits
Large Lighting Projects: Large lighting projects with large fixture quantities, typically more than 100
fixtures, are not good candidates for virtual verification as these require significant effort from the site
contact to walk through the facility, verify counts, and verify wattages. These projects could also pose a
safety risk to the site contact as they typically require the use of a ladder to confirm lamp nameplate
data.
Large and Complex Custom Projects (with electric metering): In general, any custom projects that
require metered data not already available—such as large combined heat and power projects, air
compressors, and unique process improvement measures—are not an ideal candidates for virtual site
visits. Metering a project requires specific training and could pose a safety risk if the correct safety
measures, typically involving a licensed electrician, are not followed. Large and complex projects also
add an additional layer of difficulty as there may be additional data streams—such as indoor and
outdoor temperature, production levels, process temperatures, pressure, and flow data–that need to be
captured for verification.

Appendix E. Confidential – Non-SEM Final Site Reports E-1
Appendix E. Confidential – Non-SEM Final Site Reports The confidential Final Site Reports will be shared as a standalone document.

Appendix F. Confidential – SEM Final Site Reports F-1
Appendix F. Confidential – SEM Final Site Reports The confidential Final Site Reports will be shared as a standalone document.