impact assessment study of computerized services...
TRANSCRIPT
. . - .
INFORMATION AND TECHNOLOGY TO ENABLE YOUR BUSINESS
I T @ W B S T A F F W O R K I N G P A P E R S
Impact Assessment Study of Computerized Services Delivery Projects from India and Chile
Primary author:
Subhash Bhatnagar Professor, Indian Institute of Management, Ahmedabad
Contributors to report:
Jiro Tominaga Senior lnformation Officer, ISG E-Government Practice
Shirin Madon lnformation Systems & Innovations Group, Dept. of Management, London School of Economics
Deepak Bhatia Manager, ISG E-Government Practice
Pub
lic D
iscl
osur
e A
utho
rized
Pub
lic D
iscl
osur
e A
utho
rized
Pub
lic D
iscl
osur
e A
utho
rized
Pub
lic D
iscl
osur
e A
utho
rized

The findings, interpretations, and conclusions expressed in this book are entirely those of the authors and should not be attributed in any manner to the World Bank, to its affiliated organizations, or to members of its Board of Executive Directors or the countries they represent. The World Bank does not guarantee the accuracy of the data included in this publication and accepts no responsibility for any consequence of their use. The boundaries, colors, denominations, and other information shown on any map in this volume do not imply on the part of the World Bank Group any judgment on the legal status of any territory or tho nnrlnrrnmnnt n r =rrnnt=nrn nf cl orh hnnonrl=r;nr
IMPACT ASSESSMENT STUDY
OF
COMPUTERIZED SERVICE DELIVERY PRO JEClTS
FROM INDIA AND CHILE
June 2007

Study Coordinator:
Task Managers:
Study Team:
Indian Institute of Management, Ahmedabad (LIMA)
London School of Economics
Partners:
Subhash Bhatnagar, Adjunct Professor, Indian Institute of Management, Ahmedabad (IIMA)
Deepak Bhatia, Manager, e-Government Practice, Information Solutions Group (ISGEG) Jiro Tominaga, Senior Information Officer, ISGEG
T. P. Rama Rao, Professor Nupur Singh, In-charge, Center for Electronic Governance Ranjan Vaidya, Research Associate, Center for Electronic Governance Mousumi Mandal, Research Assistant, Center for Electronic Governance
Shirrn Madon, Senior Lecturer, Information Systems and Innovation Group, Department of Management Matthew Smith, Doctoral Student, Information Systems and Innovation Group, Department of Management
The World Bank: ISGEG IIM A Ministry of Communications and Information Technology, Government of India
ABBREVIATIONS AND ACRONYMS
AMC AP
B2C CARD
C-DAC
DFID eGEP EU
G2C ICT
r n A IT KAVERI
LSE
MIS OECD PRM
RTC SII
UN UNCTAD
LTNDP UNPAN
Ahmedabad Municipal Corporation Andhra Pradesh
Business to citizen Computer Aided Administration of Registration Department
Centre for Development of Advanced Computing
Department for International Development
eGovernment Economics Project European Union Government to citizen Information and Communications Technologies
Indian Institute of Management, Ahmedabad
Information Technology Karnataka Valuation and e-Registration
London School of Economics and Political Science Management Information Systems
Organization for Economic Co-operation and Development Performance Reference Model Records of Rights, Tenancy and Crop Inspection Register
Servicio de Impuestos Internos
United Nations United Nations Conference on Trade and Development
United Nations Development Programme United Nations Online Network in Public Administration and Finance

This research is the product of a collaborative effort on the part of the faculty of the Indian Institute of Management, Ahmedabad (IIMA) and the London School of Economics, as well as the staff of the Information Solutions Group of the World Bank. It benefited greatly from a series of consultations with internal and external experts. A number of versions of the concept note for the study were circulated to solicit input and comments. The authors would like to extend special thanks to: Bruno Laporte; David Wheeler; Pierre Guislain; Philippe Dongier, Christine Qiang, Randeep Sudan, and Isabel Neto; Mark Dutz; Markus Goldstein and Sumeet Bhatiti; Soren Gigler; Gregory Kisunko; Michael Kubzansky; Jens Kristensen; and Edwin Lau (OECD e-Government Project) for their valuable suggestions.
This study would not have been possible without the support of the management of Information Solutions Group, in particular, Rakesh Asthma, senior manager with ISGEC. Deepak Bhatia, in addition to task management, played a key role in harnessing support for the study from different units in the Bank.
The entire project team from IIMA, London School of Economics, and World Bank contributed to the conceptualization of the study and development of the assessment framework that has been proposed in the report. The team based at IIMA designed the survey instruments and sampling methodology, and carried out the impact assessment for five projects in India. The survey of clients in India was done by TNS India, one of the large market research agencies in the country. The survey in Chile was conducted by Matthew Smith under the guidance of Shirin Madon.
This report is primarily authored by Subhash Bhatnagar. Nupur Singh and Ranjan Vaidya provided the data analysis support and generated all the tables presented in the report. Shirin Madon did a separate paper on literature search, parts of which have been used in the section that discusses efforts to assess public sector projects. Jiro Tominaga and Deepak Bhatia worked closely with Subhash Bhatnagar from the initial concept stage and made significant contributions in developing the structure and content of the report.
The research team would like to acknowledge the help provided in data collection from the agencies and users by all the staff of the implementing agencies of the projects that were assessed. In particular, the team is grateful to the following persons: Mr. Rajeev Chawla, Secretary (e-Governance), Department of Personnel and Administrative Reforms, Government of Karnataka (GOK); Mr. Gurumurthy, Deputy Tahsildar, Bhoomi Monitoring Cell, GOK; Mr. S. M. Bhavikatti, Assistant Inspector General of Registration (Computer), GOK; Mr. V. N. Thippanagouda, District Registrar and Deputy Commissioner of Stamps, Bangalore (Urban); Mr. P. Raghuveer, Additional Secretary, Government of Andhra Pradesh (GOAP); Mr. A. Raveendranath, Assistant Inspector General (CARD), Department of Registration and Stamps, GOAP; Dr. N. Sailaja, Special Officer, Department of IT and Communications, GOAP; Mr. Bireshwar Das, Deputy Director (Technical), eSeva; Mr. Anil Mukim, Commissioner, Ahmedabad Municipal

Corporation (AMC); Capt. Dilip Kumar Mahajan, Deputy Municipal Commissioner (Finance and e-Governance), AMC; and Mr. A. P. Patel, EDP Officer, Computer Department, AMC.
The team would also like to thank: Alejandra Barraza and Mathias Klingenberg, both working with the Directorate of Public Procurement Contracting; Fernando Barraza and Victor Hugo Lopez at Servicio de Impuestos Internos (SII); Viktor Aguila, Mabel Verdi, and Juan Enrique Hinostroza from the Universidad de la Frontera in Temuco; and Carolina Seward.

In extended consultations, a number of versions of the concept note for the study were shared with relevant World Bank staff members since November 2005. The concept note was also reviewed at the Concept Review Meeting held on January 23,2006.
Originally, the study was to cover five projects in India, two in Chile and five projects from other countries where assistance from the World Bank field staff might be sought. Potential projects were identified on the basis of publicly available evaluation data and documents. A number of World Bank staffers were contacted to explore if additional data (client surveys) could be collected. However, the effort required appeared at that point to be more than what could be handled. The study team, therefore, decided to limit the scope of this study to seven projects in India and Chile, leaving more comprehensive scope for future studies.
The field work was conducted from April 2006 to June 2006. In May 2006, interim results from the study were discussed with Bank staff that had provided input on the concept note in meetings held in Washington, D.C. On May 14, 2006, the interim findings were presented in a public forum organized by Information Solutions Group.
Although with limited scope, this study contains analyses of diverse computerization projects implemented by public sector organizations to improve service delivery in two developing countries. The study demonstrates that it is possible to estimate direct and indirect benefits to clients with reasonable accuracy using the proposed framework. Our analyses are based on in-depth surveys of clients (citizens and businesses that use the systems) and other stakeholders involved in these projects. While there is room for further refinement, the study makes a modest contribution in understanding the potential and limitation of the power of information and communications technologies (ICT) in improving delivery of services by public sector organizations. The results were both encouraging and sobering. The potential of ICT to help reduce cost of accessing services by clients, improve convenience, further accountability, and promote good governance in a broad sense is difficult to ignore. However, for those of us in the field of development assistance, the study also guides us to look beyond the hype of "e-government." Lack of effective project design, inadequate infrastructure, and a lack of willingness to reengineer processes can result in wasted opportunities, with the computerized systems showing hardly any improvements over the manual systems that are replaced. Familiar principles of project design and project management continue to be important for generating results.
The authors would like to extend sincere gratitude to all those who supported the completion of this study. It is our hope that this study becomes a starting point for many new studies to come.
STUDY TEAM ............................................................................................................................................... I1
................................................................................................... ABBREVIATIONS AND ACRONYMS I11
ACKNOWLEDGMENTS ........................................................................................................................... IV
PREFACE ............................................................................................................................................... VI
EXECUTIVE SUMMARY ........................................................................................................................... 1
INTRODUCTION AND CONTEXT ............................................................................................................ 5
................................................ CHAPTER 1: ASSESSMENT OF PUBLIC SECTOR ICT PROJECTS 8
CHAPTER 2: MEASUREMENT FRAMEWORK AND DATA ANALYSIS ....................................... 12
.................................................................................. MEASUREME~T F'RAMEWORK AND IV~ETHODOLOGY 12 ANALYSIS OF SURVEY DATA .................................................................................................................. 16
................................................................................................................. 1 . Pro$le of respondents 16 ................................................................................................ 2 . Dimensions of impacts on clients 16
.................................................................................... 3 . Analysis of data collected from agencies 17
CHAPTER 3: ASSESSMENT RESULTS FOR INDIAN AND CHILEAN PROJECTS ..................... 18
..................................................... A COMPARATIVE ANALYSIS OF PROJECTS FROM CLIENT PERSPECTIVE 18 1 . Cost to users .............................................................................................................................. 18
.............................................................................................. 2 . User perception of service quality 20 .......................................................................... 3 . User perception of governance and corruption 22
4 . Comparison of fve Indian projects on overall client impact ...................................................... 24 .................................. 5 . Variability of client impact across different delivery centers of a project 28
IMPACT ON AGENCIES ................................................................................................................................ 29 IMPACT ON SOCIETY .............................................................................................................................. 34
CHAPTER 4: ASSESSMENT OF MEASUREMENT FRAMEWORK ................................................ 36
............................................................................................... CONCLUSIONS AND FUTURE ACTION 38
..................................................................................................................... SUMMARY OF KEY FINDINGS 38 L m r r ~ n o ~ s OF THE STUDY AND AREAS FOR FURTHER RESEARCH .......................................................... 40
ANNEX I PRELIMINARY MEASUREMENT FRAMEWORK ...................................................... 42
ANNEX I1 LIST OF ICT PROJECTS COMPLIED FOR WHICH EVALUATION DOCUMENTS WERE ANALYZED .......................................................................................................... 48
ANNEX I11 SURVEY AMONG TARGETED CLIENTS. AHMEDABAD MUNICIPAL CORPORATION .......................................................................................................................................... 55
ANNEX IV PROFILE OF RESPONDENTS .......................................................................................... 61
ANNEX V IMPACT ON CLLENTS OF PROJECTS IN INDIA ........................................................ 62
ANNEX VI FACT SHEETS ON PROJECTS STUDIED ...................................................................... 63
........ ANNEX VII RATING OF CLIENT IMPACT (AFTER ELIMINATION OF SCALE BIAS) 102
ANNEX VIII LOCATIONWISE ASSESSMENT ON DIFFERENT DIMENSIONS ......................... 103
ANNEX IX A METHODOLOGY FOR POSTEVALUATION ......................................... ........... 105
vii
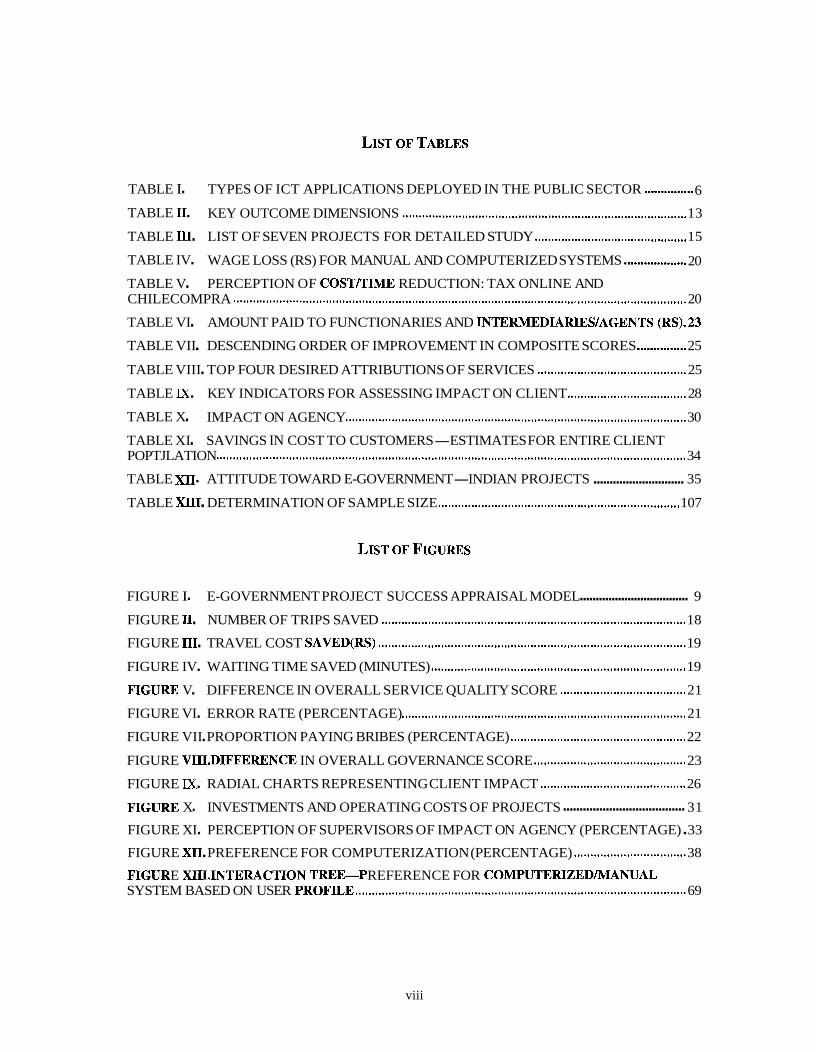
. ............... TABLE I TYPES OF ICT APPLICATIONS DEPLOYED IN THE PUBLIC SECTOR 6
TABLE I1 . KEY OUTCOME DIMENSIONS ...................................................................................... 13
TABLE III . LIST OF SEVEN PROJECTS FOR DETAILED STUDY .............................................. 15
. ................... TABLE IV WAGE LOSS (RS) FOR MANUAL AND COMPUTERIZED SYSTEMS 20
TABLE V . PERCEPTION OF COSTITIME REDUCTION: TAX ONLINE AND CHILECOMPRA ......................................................................................................................................... 20
TABLE VI . AMOUNT PAID TO FUNCTIONARIES AND INTERMEDIARIESIAGENTS (RS).23
. ............... TABLE VII DESCENDING ORDER OF IMPROVEMENT IN COMPOSITE SCORES 25
. TABLE VIII TOP FOUR DESIRED ATTRIBUTIONS OF SERVICES ............................................. 25
TABLE M . KEY INDICATORS FOR ASSESSING IMPACT ON CLIENT .................................... 28
TABLE X . IMPACT ON AGENCY ...................................................................................................... 30
TABLE XI . SAVINGS IN COST TO CUSTOMERS-ESTIMATES FOR ENTIRE CLIENT POPTJLATION .............................................................................................................................................. 34
............................ . TABLE XI1 ATTITUDE TOWARD E-GOVERNMENT-INDIAN PROJECTS 35
TABLE XD[I . DETERMINATION OF SAMPLE SIZE ........................................................................ 107
.................................. . FIGURE I E-GOVERNMENT PROJECT SUCCESS APPRAISAL MODEL 9
FIGURE I1 . NUMBER OF TRIPS SAVED ............................................................................................ 18
FIGURE 111 . TRAVEL COST SAVED(RS) ............................................................................................ 19
FIGURE IV . WAITING TIME SAVED (MINUTES) ........................................................................... 19
FIGURE V . DIFFERENCE IN OVERALL SERVICE QUALITY SCORE ...................................... 21
FIGURE VI . ERROR RATE (PERCENTAGE) ...................................................................................... 21
FIGURE VII . PROPORTION PAYING BRIBES (PERCENTAGE) ..................................................... 22
FIGURE VIII.DIFFERENCE IN OVERALL GOVERNANCE SCORE ........................................ 23
FIGURE M . RADIAL CHARTS REPRESENTING CLIENT IMPACT ............................................ 26
..................................... . FIGURE X INVESTMENTS AND OPERATING COSTS OF PROJECTS 31
FIGURE XI . PERCEPTION OF SUPERVISORS OF IMPACT ON AGENCY (PERCENTAGE) . 33
FIGURE XI1 . PREFERENCE FOR COMPUTERIZATION (PERCENTAGE) .................................. 38
F1GU.R E XIII.INTERACTION TREE-* REFERENCE FOR COMPUTERIZEDMANUAL SYSTEM BASED ON USER PROFILE .................................................................................................... 69
viii
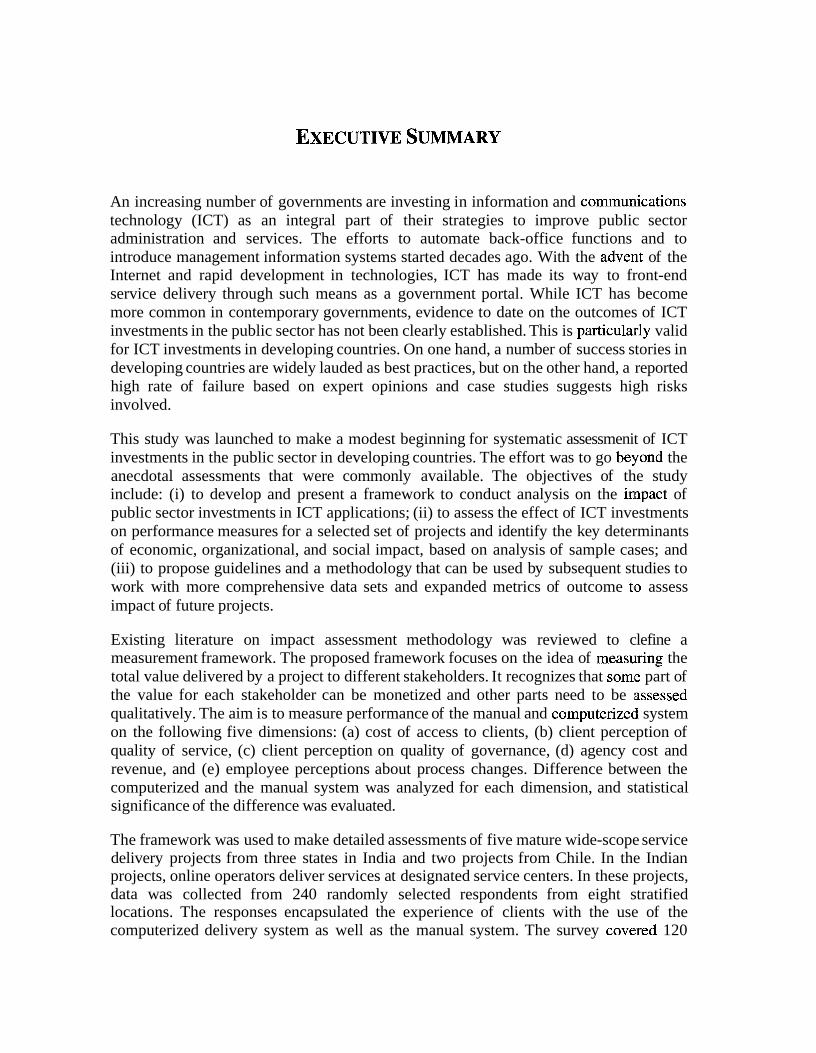
An increasing number of governments are investing in information and communications technology (ICT) as an integral part of their strategies to improve public sector administration and services. The efforts to automate back-office functions and to introduce management information systems started decades ago. With the advent of the Internet and rapid development in technologies, ICT has made its way to front-end service delivery through such means as a government portal. While ICT has become more common in contemporary governments, evidence to date on the outcomes of ICT investments in the public sector has not been clearly established. This is particularly valid for ICT investments in developing countries. On one hand, a number of success stories in developing countries are widely lauded as best practices, but on the other hand, a reported high rate of failure based on expert opinions and case studies suggests high risks involved.
This study was launched to make a modest beginning for systematic assessmenit of ICT investments in the public sector in developing countries. The effort was to go beyond the anecdotal assessments that were commonly available. The objectives of the study include: (i) to develop and present a framework to conduct analysis on the innpact of public sector investments in ICT applications; (ii) to assess the effect of ICT investments on performance measures for a selected set of projects and identify the key determinants of economic, organizational, and social impact, based on analysis of sample cases; and (iii) to propose guidelines and a methodology that can be used by subsequent studies to work with more comprehensive data sets and expanded metrics of outcome to assess impact of future projects.
Existing literature on impact assessment methodology was reviewed to clefine a measurement framework. The proposed framework focuses on the idea of measuring the total value delivered by a project to different stakeholders. It recognizes that somle part of the value for each stakeholder can be monetized and other parts need to be ;assessed qualitatively. The aim is to measure performance of the manual and computerizetl system on the following five dimensions: (a) cost of access to clients, (b) client perception of quality of service, (c) client perception on quality of governance, (d) agency cost and revenue, and (e) employee perceptions about process changes. Difference between the computerized and the manual system was analyzed for each dimension, and statistical significance of the difference was evaluated.
The framework was used to make detailed assessments of five mature wide-scope service delivery projects from three states in India and two projects from Chile. In the Indian projects, online operators deliver services at designated service centers. In these projects, data was collected from 240 randomly selected respondents from eight stratified locations. The responses encapsulated the experience of clients with the use of the computerized delivery system as well as the manual system. The survey covered 120

questions grouped under five dimensions on which impact was being assessed.
In the two Chilean projects, services are accessed through a portal. In each of these, projects data was collected through an Internet survey of more than 600 users of the computerized system, and through focus group discussions with employees of the implementing agencies and citizens. Data was also collected from agencies and employees through structured formats and surveys.
Key findings from the study are primarily based on the detailed impact assessment of five Indian projects where data collection was comprehensive. Results from the two Chilean projects confirm many of the findings from the Indian projects, even though the nature of application and country context were quite different. Although the sample size was relatively small, the estimates of many different types of impacts were found to be significant at 99 percent levels. The study points to the following key features of the evaluated projects.
Survey respondents who have used both the manual and computerized systems in the five projects in India indicated an overwhelming preference for computerized service delivery. Their preference was supported by specific areas where concrete benefits have accrued to them. In most cases, the cost of accessing service for sample users was reduced because the number of trips required to be made to the concerned offices were reduced significantly and waiting time came down by nearly 50 percent. The quality of service delivery and of governance was also perceived to have improved with computerization.
There is considerable variability in the overall composite scores across five projects. A composite score that could be compared across projects was computed from a rating of each project on a list of 16 to 18 common attributes of an e-government application. Respondents were also asked to select the three most important attributes. Applying user-assigned importance to different attributes, a weighted composite score was calculated for each project for the computerized as well as the manual system. The difference in the composite score between the two systems indicated the degree of perceived impact. The differences in scores for manual and computerized systems range from 0.15 to 1.6 on a five-point scale, while a difference of 1.6 points indicates a significant difference, and 0.15 represents virtually no improvement. In general, these ratings corroborate well with data on cost savings to customers, perception of quality of governance, and quality of service collected through an independent set of questions. The distinct preference for computerized systems by the clients seems to suggest that even small gains for the users can trigger a significant positive change in perception about the overall quality of service delivery systems.
Although the outcome is mixed in reducing corruption, ICT seems to have the potential for significant reduction in corruption in service delivery, as indicated by one project. Less than one percent of surveyed users of one of the three projects where significant corruption was reported in the manual system responded that they paid bribes to officials after the services were computerized.
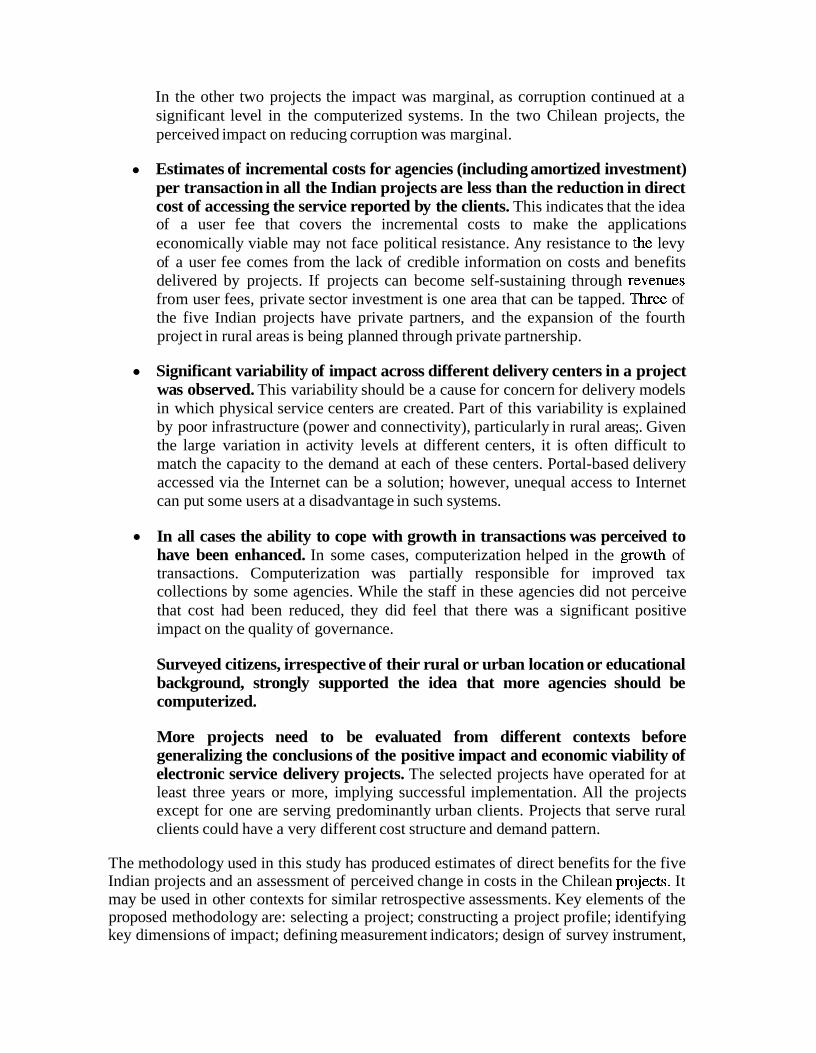
In the other two projects the impact was marginal, as corruption continued at a significant level in the computerized systems. In the two Chilean projects, the perceived impact on reducing corruption was marginal.
Estimates of incremental costs for agencies (including amortized investment) per transaction in all the Indian projects are less than the reduction in direct cost of accessing the service reported by the clients. This indicates that the idea of a user fee that covers the incremental costs to make the applications economically viable may not face political resistance. Any resistance to ithe levy of a user fee comes from the lack of credible information on costs and benefits delivered by projects. If projects can become self-sustaining through rlevenues from user fees, private sector investment is one area that can be tapped. Three of the five Indian projects have private partners, and the expansion of the fourth project in rural areas is being planned through private partnership.
Significant variability of impact across different delivery centers in a project was observed. This variability should be a cause for concern for delivery models in which physical service centers are created. Part of this variability is explained by poor infrastructure (power and connectivity), particularly in rural areas;. Given the large variation in activity levels at different centers, it is often difficult to match the capacity to the demand at each of these centers. Portal-based delivery accessed via the Internet can be a solution; however, unequal access to Internet can put some users at a disadvantage in such systems.
In all cases the ability to cope with growth in transactions was perceived to have been enhanced. In some cases, computerization helped in the griowth of transactions. Computerization was partially responsible for improved tax collections by some agencies. While the staff in these agencies did not perceive that cost had been reduced, they did feel that there was a significant positive impact on the quality of governance.
Surveyed citizens, irrespective of their rural or urban location or educational background, strongly supported the idea that more agencies should be computerized.
More projects need to be evaluated from different contexts before generalizing the conclusions of the positive impact and economic viability of electronic service delivery projects. The selected projects have operated for at least three years or more, implying successful implementation. All the projects except for one are serving predominantly urban clients. Projects that serve rural clients could have a very different cost structure and demand pattern.
The methodology used in this study has produced estimates of direct benefits for the five Indian projects and an assessment of perceived change in costs in the Chilean projects. It may be used in other contexts for similar retrospective assessments. Key elements of the proposed methodology are: selecting a project; constructing a project profile; identifying key dimensions of impact; defining measurement indicators; design of survey instrument,

including design of questions, sampling plan, and a data validation scheme; and data analysis.
The results of the retrospective evaluation of the seven projects carried out in this study highlight the relevance of such an exercise for government officials preparing a plan for an ICT project and development institutions such as the World Bank. The results provide a cue for investigating the reasons why a certain project may not be delivering on a potential area of service improvement. They also provide a preliminary benchmark for comparing other ongoing projects and those that will be implemented in the future. The approach enables an assessment of project viability in terms of cost and benefits-both in directly measurable and qualitative terms. The relevance of the proposed approach for practical use is demonstrated by the fact that the Government of India has adopted this framework for carrying out an impact assessment of a large number of projects implemented at the national, state, and local levels in India.

INTRODUCTION AND CONTEXT
It has become the norm rather than an exception to utilize hformatilon and communications technologies (ICT) in a broad range of public sector operations in contemporary governments. The term ICT encompasses diverse technologies such as computing, networking, hardware, software, telecommunications infrastructure (landline, mobile, and broadband fiber networks), and broadcasting devices. The Internet symbolizes this definition of ICT, as it utilizes many of these technology components. Investments in ICT are made to create the underlying infrastructure and also to build applications that utilize the computing power and connectivity. The rapid technological development in recent times was accompanied by a significant decline in the prices of hardware, software, and related auxiliary services. Deregulation and liberalization of the telecommunications sector resulted in diversification of information transmission modes, making the delivery of online services much easier and, most importantly, cheaper. In recent years an increasing number of projects have been launched under the label of "e- government," and several governments have identified this as a key policy priority.
E-government projects deploy ICT applications in the public sector for different purposes. This portfolio of applications has been described as a continuum in terms of "stages of growth" from e-administration to e-services to e-participation (Ranerup 1999; Heeks 2001). Many governments started using ICT to improve efficiency and overall performance through automation of back-office functions and introduc~tion of management information systems (MIS). Following the trend in the private sector, governments then expanded the scope of ICT projects to areas requiring direct int~eraction with citizens. Informational Web sites provided the entry point for citizen services. As the technologies matured, the level of interactivity and integration increased. Currently, attempts are being made to use ICT to induce wider public participation in policy-.making processes. Through such means as electronic voting and virtual discussion forums, the intersections between ICT and governments are no longer limited to the traditional public administration arena. ICT is beginning to demonstrate its effect in the fundamental process of policy making, government-citizen relationships, and, ultimately, how democracy functions. Table I below illustrates the typical areas where ICT is being deployed.
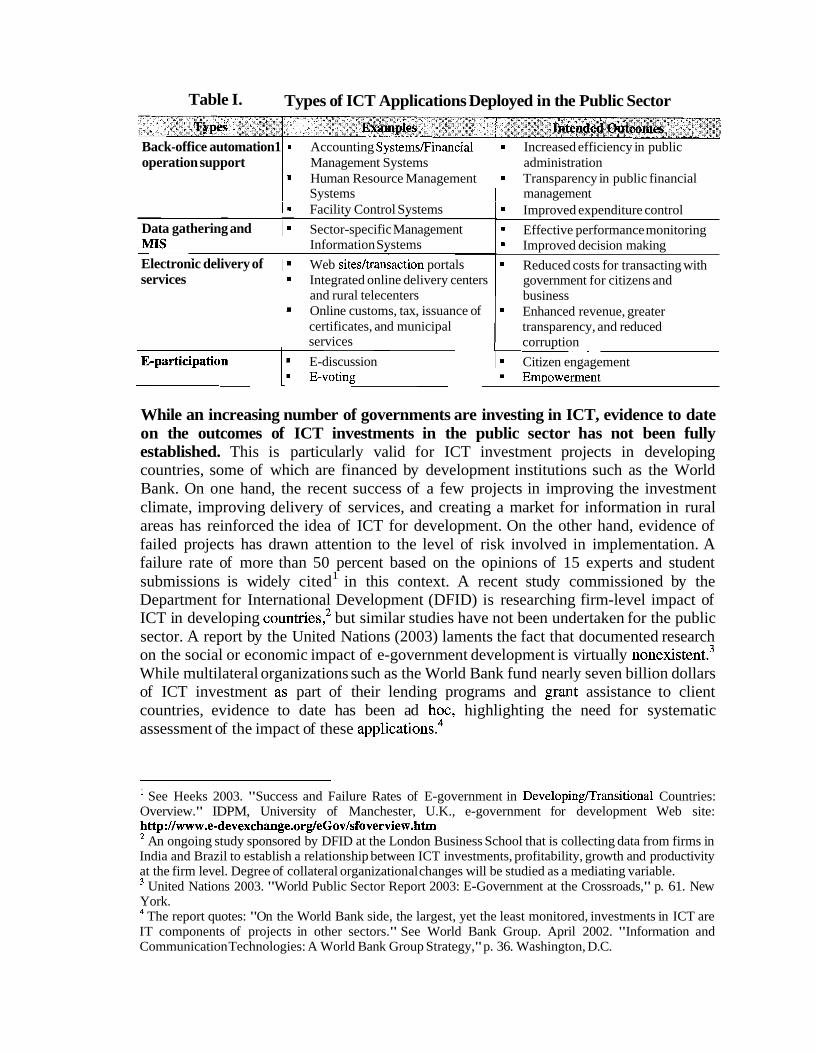
Table I. Types of ICT Applications Deployed in the Public Sector
Back-office automation1 / Accounting SystemsFinancial I Increased efficiency in public Types
operation support I Management Systems I administration
Examples I Intended Outcomes
I Human Resource Management I Transparency in public financial
I
I Systems ( management I Facility Control Systems
Data gathering and
Electronic delivery of services 1 .
Sector-specific Management Information Systems
Web sitesltransaction portals Integrated online delivery centers and rural telecenters Online customs, tax, issuance of certificates, and municipal services
E-discussion
Improved expenditure control
Effective performance monitoring Improved decision making
Reduced costs for transacting with government for citizens and business Enhanced revenue, greater transparency, and reduced corruption
Citizen engagement
While an increasing number of governments are investing in ICT, evidence to date on the outcomes of ICT investments in the public sector has not been fully established. This is particularly valid for ICT investment projects in developing countries, some of which are financed by development institutions such as the World Bank. On one hand, the recent success of a few projects in improving the investment climate, improving delivery of services, and creating a market for information in rural areas has reinforced the idea of ICT for development. On the other hand, evidence of failed projects has drawn attention to the level of risk involved in implementation. A failure rate of more than 50 percent based on the opinions of 15 experts and student submissions is widely cited1 in this context. A recent study commissioned by the Department for International Development (DFID) is researching firm-level impact of ICT in developing c~untr ies ,~ but similar studies have not been undertaken for the public sector. A report by the United Nations (2003) laments the fact that documented research on the social or economic impact of e-government development is virtually n~nexistent.~ While multilateral organizations such as the World Bank fund nearly seven billion dollars of ICT investment as part of their lending programs and grant assistance to client countries, evidence to date has been ad hoc, highlighting the need for systematic assessment of the impact of these applications.4
' See Heeks 2003. "Success and Failure Rates of E-government in Developing/Transitional Countries: Overview." IDPM, University of Manchester, U.K., e-government for development Web site: http:llwww.e-devexchange.orgleGov1sfoverview.htm
An ongoing study sponsored by DFID at the London Business School that is collecting data from firms in India and Brazil to establish a relationship between ICT investments, profitability, growth and productivity at the firm level. Degree of collateral organizational changes will be studied as a mediating variable.
United Nations 2003. "World Public Sector Report 2003: E-Government at the Crossroads," p. 61. New York.
The report quotes: "On the World Bank side, the largest, yet the least monitored, investments in ICT are IT components of projects in other sectors." See World Bank Group. April 2002. "Information and Communication Technologies: A World Bank Group Strategy," p. 36. Washington, D.C.

This study aimed to ascertain the extent to which the intended outcomes from ICT applications in the public service delivery have been achieved. It is an attempt to make a modest beginning to go beyond the anecdotal evidence currently available on the impact of ICT investments in the public sector in developing countries. More specifically, it aims to:
Develop and present an analytical framework to conduct analysis on the innpact of public sector investments in ICT applications. Assess the effect of ICT investments on performance measures for a selected set of projects and identify the key determinants of economic, organizational, and social impact, based on analysis of sample cases. Propose guidelines and a methodology that can be used by subsequent studies to work with more comprehensive data sets and expanded metrics of outcome to assess impact of future projects.
To this end, it assessed the extent to which a number of sample projects have resulted in direct and indrect value for: (i) clients (citizens and businesses), (ii) the agencies that implement systems, and (iii) the broader society. Based on the findings, this report presents a systematic framework and methodology to analyze the impact of future public sector investments in ICT applications.
The study focuses on the use of ICT in the delivery of public services. The j.ntended outcomes from the four broad types of applications indicated in Table I are important components of governance reform leading to the attainment of key social and economic development goals. The focus on the service delivery aspect was chosen because ithis area directly affects the nature of interactions between governments and citizens. It is, therefore, the area where the change in the quality of governance is most visible to citizens and businesses.
This report is organized under six major headings. The Introduction discusses the scope and objectives of the study. In Chapter 1, the review of literature on existing frameworks and methodologies for impact assessment of e-government projects is presented. Chapter 2 describes the evaluation framework and methodology as applied to the assessment of seven projects from India and Chile. The types of analyses that were carried out on the survey data collected from users and agency staff for the projiects are also presented. Results from the analysis are presented in Chapter 3. Chapter 4L briefly discusses the assessment framework used in this report. Finally, Conclusions ant1 Future Actions summarizes the key findings and discusses the usefulness of the study for developing countries.

CHAPTER 1: ASSESSMENT OF PUBLIC SECTOR ICT PROJECTS
Many ICT projects have been launched in different countries that were initially dubbed "success stories," but which eventually failed to make any significant impact. For example, a recent EU report (2003) based on a study of over 100 projects found that success with realizing concrete and measurable economic benefits as a result of e-government initiatives remains minimal. In the context of developing countries, many projects launched have not led to any significant improvement in the delivery of government services (Benjamin 200 1, Heeks 2002, Kanungo 2003).
While a significant amount of academic and policy studies have been conducted, these have so far proved inadequate in providing policy makers with a systematic framework for evaluation. One group of studies provides macro-level estimations of e- government activity using appraisal indices focusing on supply-side, quantifiable measures such as Web presence of government, network coverage, institutional and regulatory support, and human capital provision.5 Such factor-based assessments of e- readiness do not have immediately obvious and tractable policy implications. They tend to focus almost exclusively on measurement of physical access to certain types of ICT without incorporating issues such as affordability, appropriateness, ICT capacity and training, and the regulatory and macroeconomic en~ironment.~ The second group of studies, which have occurred in a largely anecdotal, piecemeal fashion, provide project- level evaluations with little prospect for synthesis from past approaches. A small number of studies have focused on the impact of projects in terms of how they affect both citizens and government agencies, but findings have seldom been linked to broader national, regional, or global trends; for example, in terms of changes in the approach to development and governance policy (Madon and Kiran 2002, Grant 2005, Heeks 2003).
Recent research in information systems, on the other hand, focuses on understanding underlying processes of change as a necessary input toward impact assessment. Of importance here is the evolving historical and institutional background within which an ICT project is implemented. Such organizational background has shown to influence the process by which resources allocated for an ICT project leads to a successful or unsuccessful system (Avgerou and Madon 2004).
The focal unit of analysis in the growing body of literature on enterprise information systems is the project in which the information systems success model presented by Delone and McLean (1992) is widely cited. The model is based on an analysis of 180 papers and proposes six major variables of impact which are interlinked with each other-systems quality, information quality, information systems use, user satisfaction,
Examples of such frameworks are (1) UNPAN (2004) E-Government Readiness Report, www.unpan.org and (2) Brown University (2004) Global E-Government Report, available on www.insidepolitics.orpr/e~ovtO5int.pdf
www.bridges.org (2005, May). "E-ready for What? E-readiness in Developing Countries: Current Status and Prospects Toward the Millennium Development Goals." http://www.infodev.orpr/fiIes/2O49 file InfoDev E Rdnss Rpt revllMay05.pdf
individual impact, and organizational impact. Impact on the individual was later broken down into economic benefit and social benefit (Seddon and Kiew 1996).
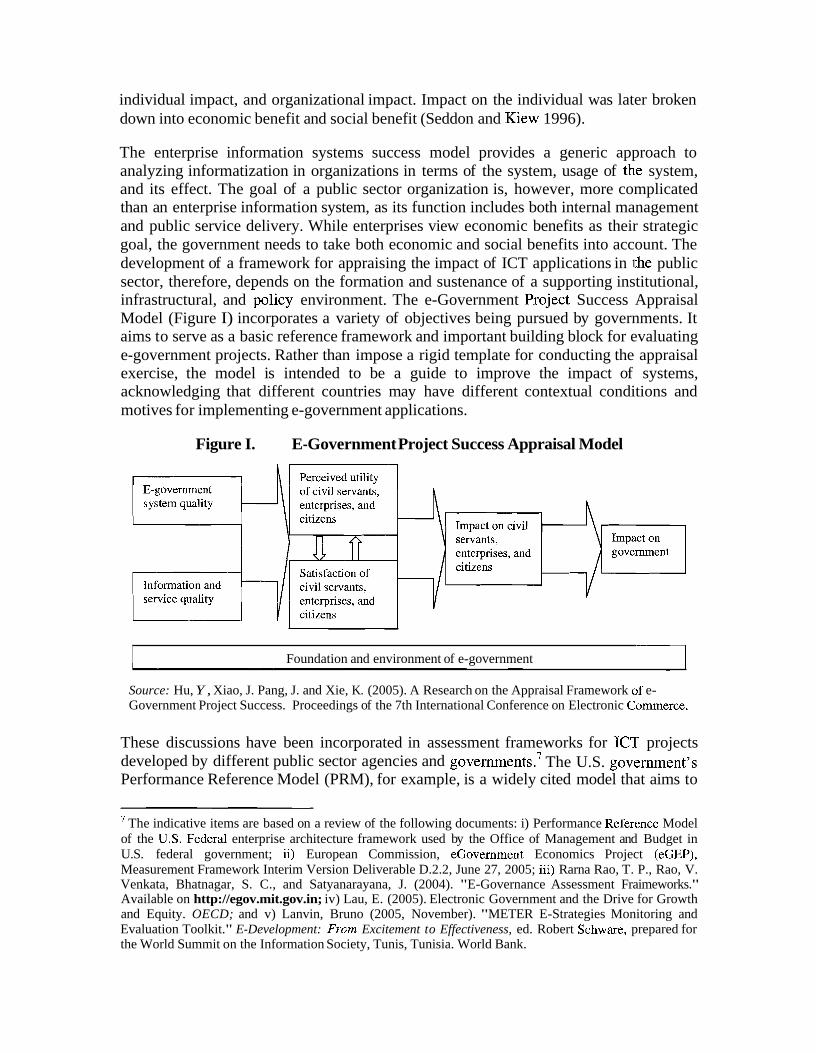
The enterprise information systems success model provides a generic approach to analyzing informatization in organizations in terms of the system, usage of th.e system, and its effect. The goal of a public sector organization is, however, more complicated than an enterprise information system, as its function includes both internal management and public service delivery. While enterprises view economic benefits as their strategic goal, the government needs to take both economic and social benefits into account. The development of a framework for appraising the impact of ICT applications in Ithe public sector, therefore, depends on the formation and sustenance of a supporting institutional, infrastructural, and policy environment. The e-Government project Success Appraisal Model (Figure I) incorporates a variety of objectives being pursued by governments. It aims to serve as a basic reference framework and important building block for evaluating e-government projects. Rather than impose a rigid template for conducting the appraisal exercise, the model is intended to be a guide to improve the impact of systems, acknowledging that different countries may have different contextual conditions and
- -
motives for implementing e-government applications.
Figure I. E-Government Project Success Appraisal Model
Foundation and environment of e-government I Source: Hu, Y , Xiao, J. Pang, J. and Xie, K. (2005). A Research on the Appraisal Framework of e- Government Project Success. Proceedings of the 7th International Conference on Electronic C~xnmerce.
These discussions have been incorporated in assessment frameworks for IC?' projects developed by different public sector agencies and The U.S. govt:mment7s Performance Reference Model (PRM), for example, is a widely cited model that aims to
' The indicative items are based on a review of the following documents: i) Performance Reference Model of the U.S. Federal enterprise architecture framework used by the Office of Management and Budget in U.S. federal government; ii) European Commission, eGovernment Economics Project (eGEP), Measurement Framework Interim Version Deliverable D.2.2, June 27, 2005; iii) Rarna Rao, T. P., Rao, V. Venkata, Bhatnagar, S. C., and Satyanarayana, J. (2004). "E-Governance Assessment Fraimeworks." Available on http://egov.mit.gov.in; iv) Lau, E. (2005). Electronic Government and the Drive for Growth and Equity. OECD; and v) Lanvin, Bruno (2005, November). "METER E-Strategies Monitoring and Evaluation Toolkit." E-Development: From Excitement to Effectiveness, ed. Robert Schware, prepared for the World Summit on the Information Society, Tunis, Tunisia. World Bank.

measure value creation in the public sector. The PRM is a tool to evaluate the impact of IT investment across federal government agencies and serves as the overall driver for a set of interrelated reference models developed under the U.S. Federal Enterprise Architecture Program. The model is used to facilitate cross-agency identification and analysis of duplicative investment, gaps, and opportunities for collaboration and integration across agencies, drawing on the best of existing approaches to performance measurement in the public and private sectors and harnessing various tools and methodologies frequently used in the private ~ e c t o r . ~ The framework builds from value chain and program logic models to reflect how value is created as inputs (such as technology) are used to create outputs (through processes and activities), which in turn impact outcomes (such as mission, business, and customer results). Guiding the entire PRM framework are strategic outcomes representing broad policy priorities that drive the direction of government.
The national e-government frameworks developed by the Australian (Commonwealth of Australia 2004) and German (Federal Ministry of the Interior 2006) governments focus broadly on the same dimensions as the PRM but with an emphasis on overall agency impact. These methodologies offer two levels of impact assessment: first, in terms of how the project provides a business case justification of expenditure and policy and whether it meets the targets set for it, and second, in terms of how the project meets the goals of the agency concerned and, in turn, how this helps in meeting wider government strategies.
As many e-government initiatives worldwide are struggling to demonstrate the expected benefits, there is a growing demand to understand the 'processes' that deliver a return on investment and generate value (EU 2003). Common best practice factors for value creation in e-government projects have been well-documented in several reports by governments and consultant firms (Accenture 2002, Gartner 2002, EU 2003). An example is the study conducted jointly by the Danish Ministry of Finance and Accenture that identifies two primary dimensions of value: (i) value to investors in terms of tangible financial benefits, cost savings, cost avoidance, and increased revenue; and (ii) value to users in terms of improved services, reduced cost and time savings to citizens, and reduced administrative burden to businesses. Investment in government employees and technological infrastructure are identified as key enablers for creating value through e-government. The focus has been on using business case methodologies from the private sector to demonstrate the economic value of e-government projects.
The calculation of time and money spent in finding and using public information are the most direct and measurable benefit of e-government applications to users, as shown in recent Organization for Economic Co-operation and Development (OECD) and European Union (EU) studies (Lau 2005, eGEP 2005). These reports identify improved revenue collection, lower costs caused by efficient processing of transactions, and a reduction of administrative burdens caused by simplification or elimination of procedures as some direct impacts that can be measured. Financial savings to users in terms of time and money spent in finding and using public information are the most direct and measurable
Some of the main techniques included in the PRh4 are strategic planning and analysis, business cases, value chain, applied information economics, and the balanced scorecard.
10
benefits of e-government applications for clients. A significant amount of work has also been done on studying users' perceptions of quality in terms of attributes such as accessibility, attitude of staff, cost of service, provision of information, .procedural fairness, and convenience.
While the benefits of process improvements in the public sector are acknovvledged in many studies, the links to increased productivity of government services are not straightforward. The expected links are not easily inferred through the expc:riences of ICT implementation in the business sector. The distinction between measuring productivity increases in the manufacturing and services sectors has been articulated in a recent McKinsey report in which the authors document how service businesses around the world are trying to boost their productivity (Harmon et al. 2006). Unlike consumer goods, which are relatively similar and therefore comparable, the report describes how there is often great divergence in the way services are recorded and monitored among groups even in the same organization. Service companies, therefore, need to develop internal benchmarks to find their own overall best practices and to see where and how they can be achieved. These internal benchmarks may differ from company to company highlighting the importance of context in impact assessment studies. The same would apply for measuring improvement in government services.
Calculation of net economic benefit of an IT project has proven to be challenging, as outcomes are multidimensional and composed of both quantitative and qualitative indicators. Further attention is required to be given to the linkages among issues of quality of service, governance, wider impacts on society, and ICT investment. Newer frameworks are evolving around a notion that an exclusive focus on financial costs and benefits for the government ignores many important noneconomic benefikg One such benefit relates to improvements in various aspects of governance activity. Another noneconomic benefit relates to the addressing of wider policy priorities, which, in the context of developing countries, could constitute the priorities as articulated in the United Nations Development Programme (UNDP) Millennium Development Goals.
This study builds on these recent studies on the assessment of ICT projects in the public sector. These studies indicate the value of ICT to be its contribut:ing to the achievement of organizational priorities. They also call for an assessment framework applicable for different ICT projects, so that systematic evaluation of the role of ICT can be undertaken. Following these discussions, this study focuses on understanding and documenting how inputs lead to outcomes in particular projects, given their contextual conditions. The assessment framework focuses on the idea of measuring the total value delivered by a project to different stakeholders and takes a balanced approach between case-study and quantitative analysis. It recognizes that some part of the value for each stakeholder can be monetized and other parts needs to be assessed qualitatively.. The next section provides a description of the measurement framework and the assessment methodology of this research.
Lau, Edwin (2005). Electronic Government and the Drive for Growth and Equity. OECD.
11

CHAPTER 2: MEASUREMENT FRAMEWORK AND DATA ANALYSIS
MEASUREMENT FRAMEWORK AND METHODOLOGY
Most of the assessment models proposed in the literature have not been used in the context of a developing country and many have not yet been applied in practice even in developed countries. Nor do they account for a variety of delivery models used in developing countries such as common service centers and franchised outlets that can retail e-services offered by the government. Practical issues of paucity of data have not been taken into account, particularly in case of a developing country where baseline surveys are not done and monitoring and evaluation systems are weak. Recognizing that adequate data for quantitative assessment is not available for most of the projects, collection of such data using a standard measurement framework for a sufficiently large number of projects is the first task that needs to be undertaken. Since impact assessment is the key objective, establishing counterfactuals is an important element of the proposed measurement framework.
A number of empirical studies suggest that ICT has had an impact in improving the performance of private sector organizations, particularly in developed countries. However, regarding ICT investments by the public sector in developing countries, many researchers have noted that past evaluation studies have not used a common framework or methodology and that rates of success or failure have been declared based on purposive samples.'0 Since ICT is introduced mostly in the context of governance reform to improve efficiency, effectiveness, and transparency of governments, a crucial first stage is to ascertain to what extent these intended outcomes from ICT applications in the public sector have been achieved.
A common measurement framework evolved on the basis of existing frameworks has been used in this study. An e-service delivery project impacts three groups of stakeholders: (i) clients receiving the service; (ii) agency (including several partners) that delivers the service; and (iii) the larger society consisting of citizens, businesses, government as a whole, and civil society. The impact can be assessed in terms of a variety of outcomes experienced by each type of stakeholder. Table I1 lists key dimensions of outcomes for each type of stakeholder. The complete assessment framework is provided in Annex I.
10 Peters, Rob M., Janssen, Marijn, and van Engers, Tom M. (2004, August). "Measuring E-Government Impact: Existing Practices and Shortcomings." Proceedings of the 7" International Conference on Electronic Commerce.
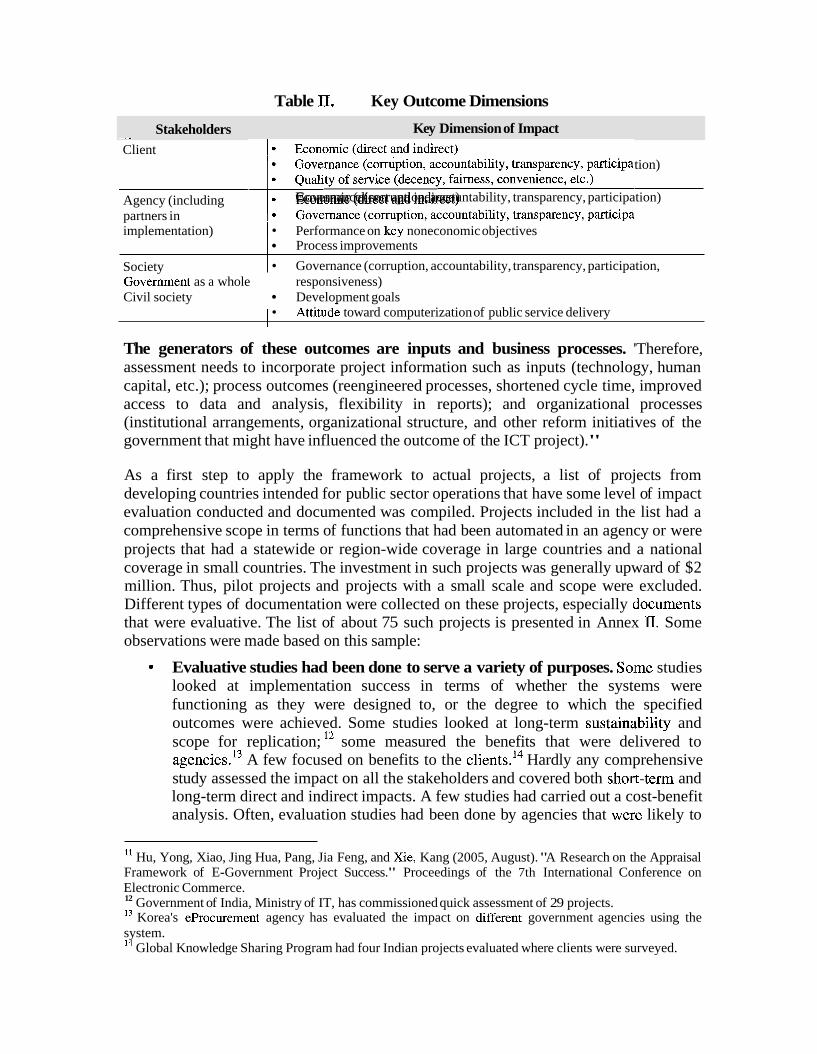
Table 11. Key Outcome Dimensions
Client -
Agency (including partners in
Stakeholders Economic (direct and indirect) Governance (corruption, accountability, transparency, participation) Quality of service (decency, fairness, convenience, etc.) I Economic Governance (direct (corruption, and indirect) accountability, transparency, participation)
Key Dimension of Impact
implementation) I Performance on key noneconomic objectives
~ o v e i m e n t as a whole responsiveness) Civil society Development goals
Society
I ~t t i tude toward computerization of public service delivery
Process improvements
Governance (corruption, accountability, transparency, participation,
The generators of these outcomes are inputs and business processes. 'Therefore, assessment needs to incorporate project information such as inputs (technology, human capital, etc.); process outcomes (reengineered processes, shortened cycle time, improved access to data and analysis, flexibility in reports); and organizational processes (institutional arrangements, organizational structure, and other reform initiatives of the government that might have influenced the outcome of the ICT project)."
As a first step to apply the framework to actual projects, a list of projects from developing countries intended for public sector operations that have some level of impact evaluation conducted and documented was compiled. Projects included in the list had a comprehensive scope in terms of functions that had been automated in an agency or were projects that had a statewide or region-wide coverage in large countries and a national coverage in small countries. The investment in such projects was generally upward of $2 million. Thus, pilot projects and projects with a small scale and scope were excluded. Different types of documentation were collected on these projects, especially tlocuments that were evaluative. The list of about 75 such projects is presented in Annex 11. Some observations were made based on this sample:
Evaluative studies had been done to serve a variety of purposes. Some studies looked at implementation success in terms of whether the systems were functioning as they were designed to, or the degree to which the specified outcomes were achieved. Some studies looked at long-term sustainability and scope for replication; l2 some measured the benefits that were delivered to agencies.13 A few focused on benefits to the clients.I4 Hardly any comprehensive study assessed the impact on all the stakeholders and covered both shont-term and long-term direct and indirect impacts. A few studies had carried out a cost-benefit analysis. Often, evaluation studies had been done by agencies that wer~e likely to
l 1 Hu, Yong, Xiao, Jing Hua, Pang, Jia Feng, and Xie, Kang (2005, August). "A Research on the Appraisal Framework of E-Government Project Success." Proceedings of the 7th International Conference on Electronic Commerce. 12 Government of India, Ministry of IT, has commissioned quick assessment of 29 projects. l3 Korea's eprocurement agency has evaluated the impact on dfferent government agencies using the system. l4 Global Knowledge Sharing Program had four Indian projects evaluated where clients were surveyed.

have an interest in showing a positive outcome. A variety of approaches had been used for evaluation. These included surveys, expert opinion, ethnographic studies, and internal assessments produced by - lending agencies. Different studies of the same project showed very different outcomes, thus indicating a lack of credibility of results.15 Part of the reason for different outcomes was the use of very small samples and a lack of rigor in sampling and collecting data from clients of the systems. The results could therefore not be easily generalized over the entire population of clients. The studies evaluated the functioning of the computerized system but were not able to assess the difference made by ICT use, as the need for counterfactuals (evaluation of systems as they worked before computerization) was ignored. Often, the impact of ICT use was not separated from other interventions that were made simultaneously with the computerization effort. Since different studies did not use a standard methodology, it was difficult to compare the outcome of one project with that of others.
From the compiled list of 75 projects, a sample of seven mature, wide-scope and -scale projects were selected for further study (Table 111). The list includes Bhoomi, Karnataka valuation and e-registration (KAVERI), Computer-aided administration of Registration Department (CARD), eSeva, and Civic centers of Ahmedabad Municipal Corporation (AMC) projects from India; and Tax Online and ChileCompra projects from Chile. They were chosen also to represent the countries in different stages of overall IT readiness and evolution.
l5 For example, the Bhoomi project of issuing copies of land titles has been evaluated by the Public Affairs Council, reporting significant positive outcomes, including reduction in bribes. Recent studies by a team from the Massachusetts Institute of Technology and the Indian Institute of Information Technology Bangalore found that corruption had not declined and major benefits were derived by land sharks.

Table III. List of Seven Projects for Detailed Study
r (RTC)'~ and filing of a
administration of
eSeva
, state, and local governments and public utilities and are now used
Corporation (AMC) I property tax, issue of birth and death certificates, and issue of shop licenses.
Chile Tax Online Online tax filing was implemented by the Servicio de Impuestos Internos (SII),
which launched its portal in 1998. Attained maturity by May 2002 when 55 percent of Chilean citizens were filing their tax declarations online. By 2004, half
I of all tax returns were prepared automatically and 20 percent partially. In 2006,
I platform in 2003. Provides for online publication of procurement notices and e- ChileCompra
I mail alert services for registered businesses. Over 90 percent of private- and
97.4 percent of all declarations were conducted online.
Portal was launched in 2000, but came into full form as an e-procurement
I ~ublic-sector organizations have availed themselves of the Drocurement svstem.
For each project, the measurement framework was converted into a set of data collection instruments, including: i) a profile of the project identifying services, clients, and other stakeholders; ii) agency-level data on activity levels, investments, and operating costs; iii) a client survey questionnaire covering direct cost of access, quality of seirvice and governance; overall satisfaction, and perception of ICT projects based on exposure to different ICT applications; and iv) an employee survey for perceived impact on work, efficiency, and effectiveness. Measurement instruments were translated into local languages. A sample client questionnaire for AMC civic centers is shown in Annex III.
The survey conducted in India tried to assess both the manual system and the computerized system that replaced it on all the indicators to the extent possible. An analysis of the differences between the old and the new system was done to provide a measure of impact. A sampling scheme for survey of clients through structured
l6 Besides its other uses, this document is required for availing crop loans from banks.

CHAPTER 3: ASSESSMENT RESULTS FOR INDIAN AND CHILEAN PROJECTS
This section presents a comparative analysis of the Indian and Chilean projects from the perspective of the clients. Impacts for the key dimensions of cost, quality, governance, and overall satisfaction are analyzed. A profile of each project, detailed analysis of impact on clients and agency, and perception of employees is presented as a case study in Annex VI.
A COMPARATIVE ANALYSIS OF PROJECTS FROM CLIENT PERSPECTIVE
1. Cost to users
The use of ICT in public service delivery in India has reduced the number of trips surveyed users have to make to complete a transaction (Figure 11). The survey shows that in all five projects, there were savings in the number of trips citizens made to service facilities where public services are delivered (see Annex V for more detail). l8
Figure 11. Number of Trips Saved Greater formalization of processes after process reform, quicker retrieval of data from computerized databases, and automation of tasks such as writing and copying documents, as compared with manual methods, has reduced the total processing time of a service request in all applications.19 This has resulted in increased predictability in service delivery and reduced the number of trips.
Along with reduction in the number of trips, the travel costs per transaction have generally declined (Figure 111). The only exception is the Bhoomi project in which travel costs for obtaining RTC
l8 A paired t-test was applied to assess whether the differences between the means of the number of trips for the computerized and manual systems were significantly different. For details of the test statistic, refer to Annex V and project fact sheets in Annex VI. l9 In the case of AMC, the time elapsed has been reduced from 9.8 days to 5.3 days for certain types of transactions, while in CARD, the total time required for registrations has come down from 4.69 to 1.82 days. For details, refer to project fact sheets in Annex VI.

have increased by Rs 79.96 per transaction and for mutations by Rs 81.38. This is primarily caused by the change in the location of service offices. Under the manual system the RTC was issued in a village, but with computerization users need to travel longer to the higher-level government office (taluka headquarters) to receive the same service (more detail in Annex V). The opportunity cost for users, which is represented by wage loss because of travel, is, therefore, larger.
Figure 111. Travel Cost Saved(Rs) , The increase in travel costs for
Bhoom'- Bhoond- KAVERI CARD eSeva AMC RTC Mutation
expertise to support elaborate ICT applications. To planning to expand access in rural areas by allowing I database for issue of RTCs.
Waiting time at the service centers was reduced in all the projects. 20 Among those projects in which the reduction in waiting time were statistically significant 21 , the savings ranged from 16.16 minutes (AMC) to 96.24 minutes (CARD), amounting to a nearly 50 percent reduction from the waiting time in the manual system (Figure IV). Reduction in waiting time would have direct impact on
users of the Bhoomi project demonstrates one of the key challenges of service delivery using ICT. The change in the point of service delivery frlom the village office to the taluka headquarters was necessitated to ensure the availability of robust information infrastructure and technical support to operate the system. Many parts; of developing countries, partilcularly those outside major cities, may lack infrastructure and technical
address this problem, Bhoomi is ~rivately owned kiosks to access its
Figure IV. Waiting Time Saved (minut
e
s)
Bhoom- Bhoomi- KAVWl CARD eSeva A M : RTC Mutation
20 A paired t-test was applied to assess whether the differences between the means of the waiting time saved for the computerized and manual systems were significantly different. Refer to Annex V and fact sheets in Annex VI for details of the test statistic. 2 1 Only Bhoomi RTC was not statistically significant. See Annex V for more detail.

user costs through drop in foregone wages, as indicated in Table IV.
Table IV. Wage Loss (Rs) for Manual and Computerized Systems
N=sample size; S.E=standard error
While the difference between manual and computerized systems on all the cost indicators are statistically significant (in most cases at a confidence level of 99 percent), the accuracy of the estimate of the difference in direct costs can be improved by using larger samples.
In the two Chilean projects actual changes in cost of access were not measured directly. Instead, the impact on costs and time reduction was measured as a perception on a five- point scale. While citizen and business users of the Tax Online system reported a -
significant perceptional reduction in the cost and time, in ChileCompra the perceived improvements were relatively marginal with a higher proportion of respondents perceiving no change.
Table V. Perception of Costrrime Reduction: Tax Online and ChileCompra
Costs required to search for business 3.28 1
Change in the economic cost to process 4.02 opportunities (0.07) taxes (0.07) Costs required to participate in 3.23
hid din^ (0.07) I - . .. - . . . I \ - . - ' I
Time Reduction Time required to search for business
Any change in the total amount of work 3.40
4.47 opportunities time and effort required to process
(0.07) (0.05) Time required to participate in taxes? 3.44
bidding (0.08) Note: Standard error in ( ).
2. User perception of service quality
Users rated the quality of services delivered using computerized systems as better than that by manual systems. For all five projects, users rated the computerized
22 services higher in overall quality (Figure V). The differences were statistically
22 A paired t-test was applied to assess whether the differences between the overall service quality scores for the computerized and manual systems were significantly different. For details of the test statistic, refer to Annex V and project fact sheets in Annex VI.

significant. The rate of error, which is an important measure of quality, was also1 lower for all the projects, except the issue of RTCs (Figure VI). Bhoomi also shows very significant improvement in service quality, among the highest in the five Indian projects assessed in the study.
Figure V. Difference in Overall Service Quality Score (five-point scale)
Bhoom- Bhoomi- KAVERl CARD eSeva AMC RTC Mutation
Figure VI. Error Rate (percentage)
RTC Mtation
Overall improvement in service quality was reported by users in the two projects in Chile as well. Both projects received favorable assessment for their user-friendliness and convenience of services. The average ratings on the quality of service of the tax online system were high, with many items being rated around 4.5 in five-point scale. On an average, users of the tax online system can complete tax filing in 30 minutes. Abolut one- third of business users and 3.6 percent of citizen users, however, had to make an appeal to SII regarding a tax decision. The system was also rated poorly on responsiveiness to feedback. For suppliers using the ChileCompra portal, the interviews revealed a marked increase in efficiency and effectiveness. While earlier a supplier had to constantly refer to newspapers for knowledge of purchase intent declared by the government, the ChileCompra portal provides such information at a single place. In terms of complaint

handling, about half of public sector users surveyed had to appeal to a ChileCompra decision and around one-third of user organizations had noticed errors in ChileCompra documentation. Focus group discussions and interviews revealed that many providers were disgruntled with procurement decisions made through ChileCompra. Thus, transparency of information appears to have led to increased complaints from suppliers.
3. User perception of governance and corruption
The proportion of surveyed users paying bribes has generally declined. The decline is higher in some projects than in others (Figure VII). For example, in the Bhoomi project, while about 30 percent of users were paying bribes in the manual system, less than one percent are continuing with the practice in the computerized system.
("/I 35.0
30.0
25.0
20.0
15.0
10.0
5.0
0.0 Bhoom- Bhoomi- KAVERI CARD eSeva AMC
RTC Mutation
a Manual H Cunputerized
Figure VII. Proportion Paying Bribes (Percentage) The proportion of transactions in which a bribe was paid in KAVERI continues to be high at 21.61 percent in the computerized system. A detailed study of one of the centers indicated that any type of system breakdown leads to corruption. The breakdown can be on account of an overload of demand in comparison to the capacity of the system to process registrations. Agents play a key role in
promoting corruption. Private operators also exhibit rent-seeking behavior if given an opportunity. Systematizing queues by appointments helps prevent breakdown.
An interesting phenomenon is that the amount of bribe users pay is generally higher in computerized systems in all the projects (Table VI). General inflation in the price levels is perhaps part of the reason for this. It may also suggest that the complexity of the types of favor requested through bribes have increased. The estimates of bribe amounts are less accurate than other results, as the sample of respondents paying bribes was small (50-75), resulting in high standard error of the estimates.
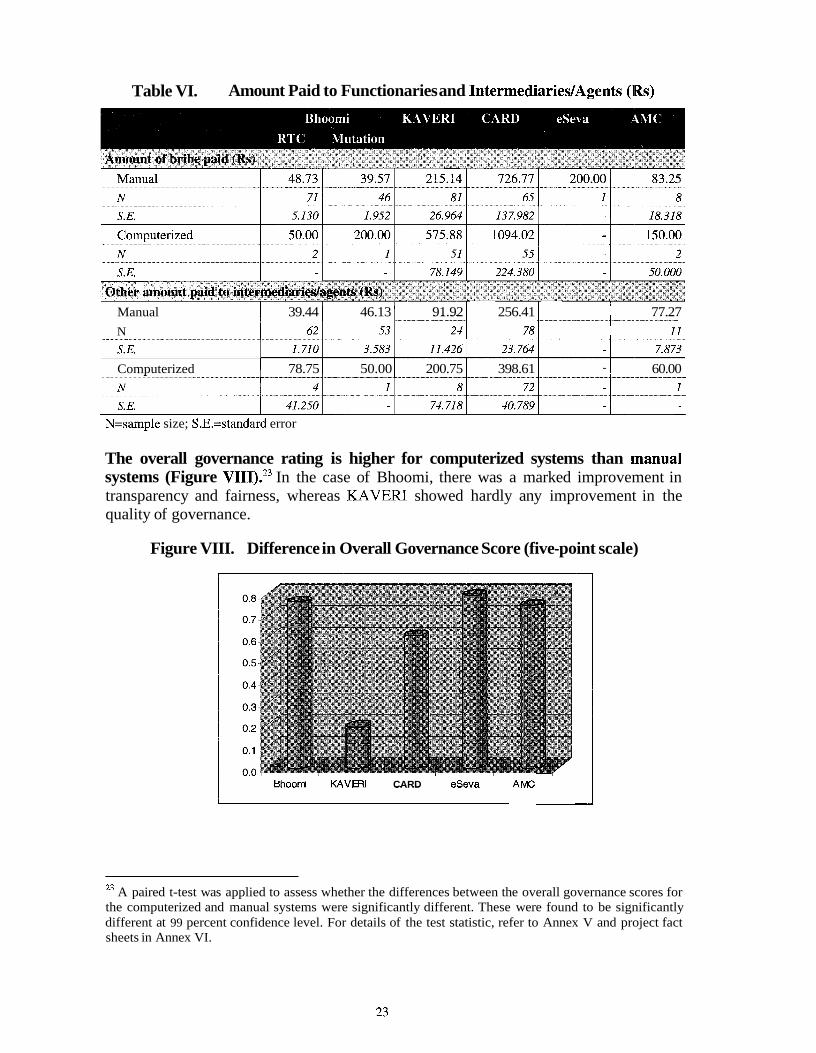
Table VI. Amount Paid to Functionaries and IntermediariesIAgents (IRs)
I
Other amount paid to intermediaries/agents (Rs) Manual 39.44 46.13 91.92 256.41 77.27 N 11
Computerized 1 78.75 1 50.00 1 200.75 1 398.61 1 - 1 60.00
N=sample size; S.E.=standard error
The overall governance rating is higher for computerized systems than ~nanual systems (Figure VIII).23 In the case of Bhoomi, there was a marked improvement in transparency and fairness, whereas KAVERI showed hardly any improvement in the quality of governance.
Figure VIII. Difference in Overall Governance Score (five-point scale)
Bhooni KAVEU CARD eSeva
23 A paired t-test was applied to assess whether the differences between the overall governance scores for the computerized and manual systems were significantly different. These were found to be significantly different at 99 percent confidence level. For details of the test statistic, refer to Annex V and project fact sheets in Annex VI.

The results for the projects in Chile appear to complement these findings in the projects in India. There was a general consensus among respondents that ChileCompra has resulted in the public sector being held more accountable for its spending. Focus groups and interviews revealed that it is possible for a supplier to verify and challenge why the government had rejected a bid in ChileCompra; however, ChileCompra was rated quite poorly on all the governance indicators by the vendors, whereas the public sector agencies rated it as moderately positive. Public sector users responded that ChileCompra had somewhat reduced corruption while there was no such endorsement from private sector users. The survey recorded strong agreement from public sector players that the rules and procedures of ChileCompra were clearly stated, while only 26 percent of the respondents agreed with this from the private sector. Public sector players strongly agreed that ChileCompra tends to add transparency to public sector operations, while weaker endorsement was shown from the private sector. The Tax Online system appears to have improved the perception of fairness among businesses, as revealed through focus group interviews. All businesses that have a permit to trade issued from the municipality are now automatically included in the system if their annual earning is above a certain threshold. Earlier, many such enterprises were outside the system. This measure is perceived as fairer by the business community. There was no strong endorsement, however, that the Tax Online had either increased transparency, eliminated corrupt practices, promoted confidential and secure data, or that the SII takes into consideration the opinion of citizens while developing norms and rules.
4. Comparison of five Indian projects on overall client impact
Table VII compares the composite scores on a five-point scale based on 18 common attributes encompassing the three dimensions discussed earlier. The score also factors in the importance of the attribute for each project. Respondents were asked to select three attributes considered important by them from a set of 18 attributes of a service delivery system. A weightage was assigned to each attribute on the basis of the proportion of respondents who selected the attribute. Weighted scores were computed for each attribute as the product of the weight and the difference between the average scores for the attribute on the manual and computerized systems. The sum of these differences denotes the improvement in composite scores after computerization.
The results indicate that Bhoorni shows the maximum improvement, as its manual version had the lowest score. eSeva also shows a very significant improvement, as the computerized counters are rated close to very good in the composite score. KAVERI and CARD indicate only marginal improvement over the manual system. Ranking of projects using this data, particularly the composite rating, can represent the degree of success of the project from the point of view of clients. Bhoomi and eSeva can be rated as very successful projects, AMC as moderately successful, and KAVERI and CARD as projects where there is considerable scope for improvement.

Table VII. Descending Order of Improvement in Composite Scoresz4
-- Nlanual Computerized Difference
AMC I 3.367 4.118 0.75 1
Bhoomi
eSeva
KAVERI I 3.345 3.897 0.552
2.857 4.461 1.604
3.388 4.658 1.270
Three kinds of attributes have been selected more often than others, as shown in Table VIII. They include strong preference for attributes on i) transactional efficiency, ii) improved governance, and iii) quality as measured by error rate and convenience. An important conclusion is that these attributes are different for different projects. If such an exercise was to be done before designing an application it would provide useful insights into benefits that need to be targeted and the kind of process reform required. It is rarely done in practice either before or after the project implementation.
CARD
Table VIII. Top Four Desired Attributions of Services
3.775 3.929 0.153
Project BHOOMI
Dwired Attribdtiun b~Seruiccs Error-free I No delay in I Less waiting time I Fewer visits
KAVERI
CARD
Figure IX presents radial charts for manual and computerized delivery for each project on the key dimensions included in the assessment framework. The overall score for manual and computerized delivery is presented as a circle in the same chart. Since different types of indicators have been measured differently (some using a five-point perception rating and others as actual measurements), a methodology of predetermined "goalposts" was used to normalize them. It reflects the feasible upper and lower limits to the rnleasures, adopted by the United Nations Development Programme (UNDP) in computing the Human Development ~ n d e x . ~ ~ Performance on each dimension is expressed as a value between 0 and 1 by applying the formula:
Dimension index = (actual value - minimum value) /(maximum value - minimum value)
transaction Less corruption
Less time and effort reauired
24 Differences between the composite scores for the computerized and manual systems were found to be significantly different at 99 percent confidence level. For details of the test statistic (paired sample t-test), refer to project fact sheets in Annex VI. 25 Human Development Report 2006, United Nations.
Less waiting time
Less corruption
Convenient time schedule Greater transparency
eSeva
AMC
transaction Greater transparency
Less waiting time
Fair treatment
Good complaint handling system
Less time and effort required Less time and effort required
Error-free transaction Less corruption
Less waiting time
Fair treatment


AMC
rbsence of
Quality of Governanc uality of Service
Score on Indicators for Manual System - - - . Overall Score for Manual System Score on Indicators for Computerized System __ Overall Score for Computerized System

These radial charts allow for a quick visual assessment of the rating of each project based on five key dimensions of client impact in its manual and computerized versions. The larger the area of the pentagon is, the higher the rating of the project is. It is easy to surmise that eSeva has been highly rated. Bhoomi appears to have shown the maximum improvement over the manual system. KAVERI has the smallest pentagon; that is, it is rated the lowest and has registered marginal improvement through computerization. Similarly, the composite ratings represented by the concentric circles show very marginal improvement in KAVERI and significant improvement in Bhoomi and eSeva. The charts also establish that the overall rating derived from individual components and composite scores are consistent.
The six key parameters that have been used to generate the radial charts are presented in Table IX. Scores obtained by different projects on these indicators after elimination of scale bias are represented in Annex VII
Table M. Key Indicators for Assessing Impact on Client
5. Variability of client impact across different delivery centers of a project
, , ' I d a * '
Cost
~ f f i c i e n c ~ 26
Quality of Service
Quality of Governance
Absence of Corruption
Overall Score
There are visible variations in the survey results in different locations of service facilities. Earlier analysis of client impact was based on the total number of respondents, typically surveyed in seven to eight different locations. Data was analyzed to understand if there were differences by location of service facility on a few key dimensions across all projects. The mean for each location is tested against the total sample mean for statistically significant differences (Annex VIII). On improvements in composite scores, which is an overall evaluation, there is significant variation in KAVERI, AMC, and Bhoomi. The variation in CARD is small, as the improvement itself is marginal. In eSeva the overall improvement is significant but the variation between locations is small. It is interesting to note that eSeva is the only application where the capacity of the service center is designed to match the activity levels.
Variation is largest among Bhoomi service centers. In particular, one service center (Location 4) facility scored the worst in terms of composite score. Respondents evaluated
Farmefer Number of Trips
Waiting Time (minutes)
Quality of Service (five-point scale)
Quality of Governance (five-point scale)
Proportion Paying Bribes (%)
Composite Score (five-point scale)
26 Since it is difficult to predict the worst scenario in the case of number of trips that would be required to avail a service, the highest average number of trips (in the manual system of registration in Karnataka) has been considered for the purpose of scale equalization. Similarly, for the Eficiency indicator, the maximum and minimum of actual averages of the time spent at the service center during each visit have been used as the lower and upper goalposts respectively.
,M*m Ydwb 0
14.466
5
5
0
5
> < . . < > I
M W m b Value 3 . 3 7 0 ~ ~
184.786
1
1
100
1

a 0.575-point deterioration in overall performance with the computerized system. The increase in travel costs because of the change in the location of service facilities from villages to taluka headquarters probably contributed to this result. Users of Location 4 experienced the largest increase in travel costs after computerization. Quite unexpectedly, the number of trips per transaction was also substantially higher in this service center. Users waited longer at the computerized service facility than under the manual system. Moreover, the mutation service provided in this location is the only case among surveyed facilities of the Bhoomi project in which the proportion of users paying bribes increased. There was a breakdown in the service delivery process in this particular facility. While the precise reasons for deterioration and the frequency of similar incidences in the entire Bhoomi project require further studies, the situation in Location 4 highlights the comprehensiveness of efforts required to improve service quality. Computerized system installation by itself does not ensure positive transformation of services.
Direct economic impact on agencies was expected in terms of operating costs, collection of tax revenue, and collection of transaction fee. There are inherent problems, however, in assessing impact on costs. For different agencies, comlputerized delivery of services touches different portions of the overall activity portfolio. For example, AMC is an organization that delivers large-scale physical service!; such as cleaning of roads and public areas, public lighting, and maintenance of urban infrastructure. Computerized delivery of services impacts less than one percent of all employees. Often, the prevalent costing systems do not permit identification of operating costs for only the computerization project. For agencies such as offices of the subregistrar the impact is more widespread, as the core service is computerized.
As mentioned in Section 3 of Chapter 2, it was difficult to collect cost data from the manual operations. By and large, the major cost component was labor. The case studies reveal that human resources were not reduced in any project after computeri:zation. In some projects, workload was reduced and, therefore, additional time could be dLevoted to other tasks. There could be cost implications in the future, as the transactions are growing at a much faster rate as compared with labor, as was seen in the case of KAVERI. The human resource and other costs incurred by the government have remained within a narrow range for the manual and computerized systems. After computerization, the total cost as a percentage of revenue from fees has declined from 6.48 to 4.23 percemt in two years.
Given these limitations, data on impact on agencies collected is summarized in Table X. Data shows that there has been a significant increase in revenues from transaction fees and tax revenue (wherever applicable) in recent years.
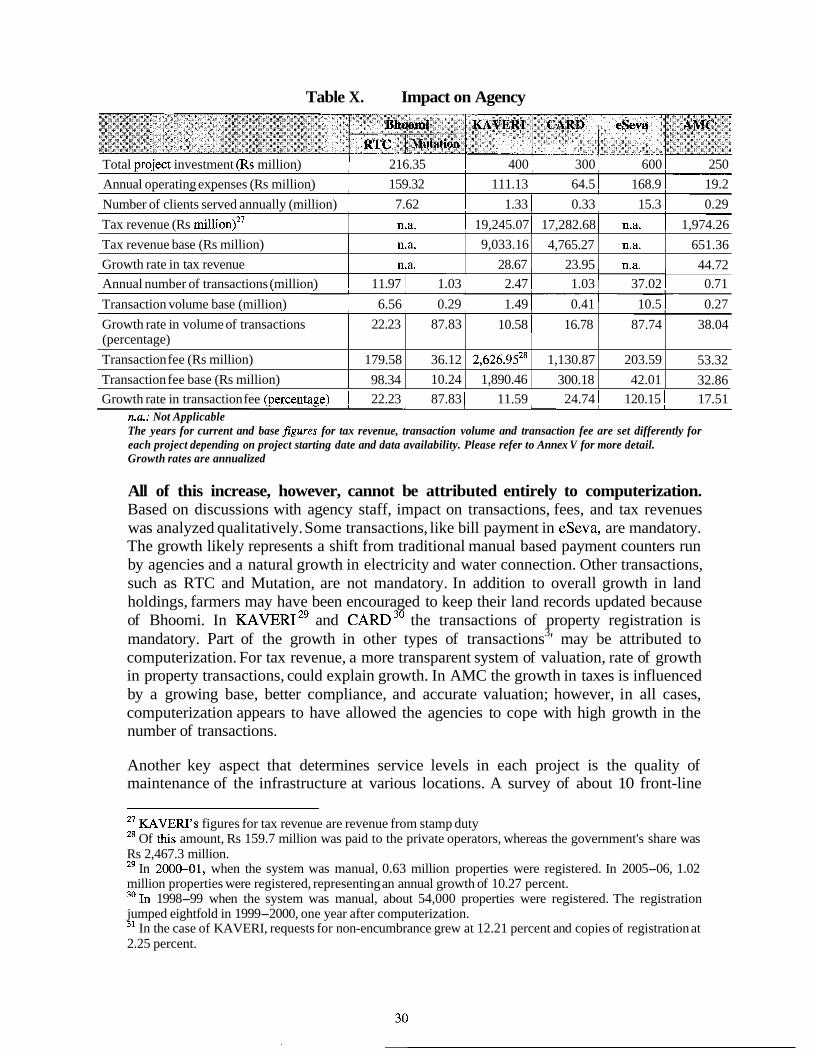
Table X. Impact on Agency
Total vroiect investment (Rs million) I 216.35 I 400 1 300 1 600 1 250
Bhoomi RTC Mutation
Annual operating expenses (Rs million) I 159.32 I 111.13 i 64.5 1 168.9 1 19.2
Number of clients served annually (million) I 7.62 I 1.33 1 0.33 1 15.3 1 0.29
KAVEKI CARD eSeva
Tax revenue (Rs million)27
Annual number of transactions (million) I 1 1.97 1 1.03 1 2.47 1 1.03 1 37.02 1 0.7 1
AMC
n.a. 1 19,245.07 1 17,282.68 1 n.a. 1 1,974.26
Tax revenue base (Rs million)
Growth rate in tax revenue
Transaction volume base (million) 1 6.56 1 0.29 1 1.49 1 0.41 1 10.5 1 0.27
n.a.
n.a.
Growth rate in transaction fee (percentage) 1 22.23 1 87.83 11.59 24.74 1 120.15 1 17.51
Growth rate in volume of transactions (percentage)
Transaction fee (Rs million)
Transaction fee base (Rs million)
n.a.: Not Applicable The years for current and base jigures for tax revenue, transaction volume and transaction fee are set differently for each project depending on project starting date and data availability. Please refer to Annex V for more detail. Growth rates are annualized
9,033.16
28.67
All of this increase, however, cannot be attributed entirely to computerization. Based on discussions with agency staff, impact on transactions, fees, and tax revenues was analyzed qualitatively. Some transactions, like bill payment in eSeva, are mandatory. The growth likely represents a shift from traditional manual based payment counters run by agencies and a natural growth in electricity and water connection. Other transactions, such as RTC and Mutation, are not mandatory. In addition to overall growth in land holdings, farmers may have been encouraged to keep their land records updated because of Bhoomi. In KAVER129 and CARD3' the transactions of property registration is mandatory. Part of the growth in other types of transactions3' may be attributed to computerization. For tax revenue, a more transparent system of valuation, rate of growth in property transactions, could explain growth. In AMC the growth in taxes is influenced by a growing base, better compliance, and accurate valuation; however, in all cases, computerization appears to have allowed the agencies to cope with high growth in the number of transactions.
22.23
179.58
98.34
Another key aspect that determines service levels in each project is the quality of maintenance of the infrastructure at various locations. A survey of about 10 front-line
4,765.27
23.95
" KAVER17s figures for tax revenue are revenue from stamp duty Of this amount, Rs 159.7 million was paid to the private operators, whereas the government's share was
Rs 2,467.3 million. 29 In 200041, when the system was manual, 0.63 million properties were registered. In 2005-06, 1.02 million properties were registered, representing an annual growth of 10.27 percent. 'O 1n 1998-99 when the system was manual, about 54,000 properties were registered. The registration jumped eightfold in 1999-2000, one year after computerization.
In the case of KAVERI, requests for non-encumbrance grew at 12.21 percent and copies of registration at 2.25 percent.
87.83
36.12
10.24
n.a.
n.a.
651.36
44.72
10.58 16.78 87.74
203.59
42.01
2,626.9528
1,890.46
38.04
53.32
32.86
1,130.87
300.18

operators in each project indicated that at least some centers had problems with power supply, connectivity, and slow response. A significant proportion (20 to 50 percent) of operators indicated that problems in these three areas are encountered sometimes (as opposed to never, rarely, often, and always). Hardware and software, in comparison, were seen to be more robust.
In terms of agency impact for Chilean cases, the SII (Tax Online system, Chile) indicated a significant increase in the efficiency of internal work processes. Implementation of ChileCompra has resulted in increased competition from suppliers. The total number of opportunities for businesses published on the portal expanded by 75 percent in 2lD05 from the previous year. For example, micro, small, and medium enterprises transacted 47 percent of all transactions in 2005, which was 8 percent higher than in 2004. Government departments found the system was easy to use and reported significant gains in efficiency in the purchase of products and services.
Economic viability of projects is an important element for implementing agencies. Figure X presents the investments and operating costs per unit transaction for all the five projects from the perspective of the implementing agencies, which show that some projects are more cost efficient than others.
Figure X. Investments and Operating Costs of Projects
I The bulk of the funding for Bhoomi has come firom the Government of India, which has been providing incentive to states to computerize land records through a grant scheme. Bhoomi earns a contribution of Rs 55 million32 a year to pay for the investments, and its payback period is four years alt current user fee levels. The private operators of KAVERI earn a
32 Refer to Table X, which presents data on impact on agencies. 33 Operating expense of the private operators for 2005 was Rs 137.46 million. For details, refer to project fact sheets in Annex VI.
Bhoond KAVERl CARD eSeva AMC
hvestmnt per Curmlative Transactions for Four Years (RS)
Yearly Operating Expense per Transaction (13s)
contribution of Rs 22.24 million 33 a year to pay for the investments made by them, which implies that the payback
period at current levels of user fee is over eight to nine years. CARD earns a contribution of Rs 1,065 million a year to pay for the investments, and payback can be achieved in less than a year at current user fee levels. AMC earns a contribution of Rs 34.1 million a year to pay for the investments, indicating that the payback will be seven to eight years at current user fee levels.

The economic viability of eSeva will have to be assessed separately for Phase I (Hyderabad) and Phase I1 (expansion to 220 municipal towns), as the viability depends on the number of transactions processed per month per center. Phase I1 activity is still growing. For the first phase covering the city of Hyderabad, 70 million transactions of all types have been processed cumulatively so far, generating a revenue of nearly Rs 250 million for the partners. The partners' investment in Hyderabad is approximately Rs 80 million, and their annual operating expenses are in the range of Rs 30 million for peak transaction volumes. Based on these estimates, private partners have recovered their investments and operating expenses five years from the inception of the project. In addition, the private partners own the application software that can be used in other geographical areas.34
In all cases, it should be noted that there are direct monetary benefits that accrue to individual clients. Since many of the services are considered as a public good, such benefits to individuals and in the aggregate to the society should be factored into more robust cost-benefit analysis. If cost saving per transaction to the clients is added to the agency benefits, the economic viability of all projects shows considerable improvement.
Perception of supervisors was surveyed to measure the level of buy-in from those in charge of implementation of computerized projects. Figure XI presents the data collected on perceptions of impact on costs, governance, and work, on a five-point scale, from 85 supervisors in the five projects in India. Most supervisors considered that except for the labor and stationery costs, other costs like establishment and communication costs have increased. About one-third of the respondents felt that staff costs have decreased, while a quarter felt that it has increased. The remaining (about 42 percent) described the staff costs as having remained unchanged.
There was a strong perception of improvement in all dimensions of governance among supervisors. About two-thirds of all respondents indicated significant positive impact on transparency, corruption, and the level of discretion to deny services. Nearly half of the respondents indicated a significant positive impact on accountability, the presence of intermediaries, and the effectiveness of the complaint-handling mechanism. There has been a positive impact on the quality of information handling. More than two- thirds of the respondents described an improvement in the accuracy of data, traceability of transactions, and effectiveness of disaster-recovery measures. Supervisors believed that their effectiveness in monitoring subordinates, decision making, and policy formulation had been enhanced.
Most supervisors reported that the extent of reengineering and integration of services was only moderate during the computerization process, yet the impact on achievement of overall organizational goals is perceived as being significantly positive. Somewhat similar data was collected from the tax agency in Chile. Both employees and supervisors rated the new work environment as significantly positive, with ratings of most items above four on the five-point scale.
34 Government is a joint owner with a small share of the intellectual property.
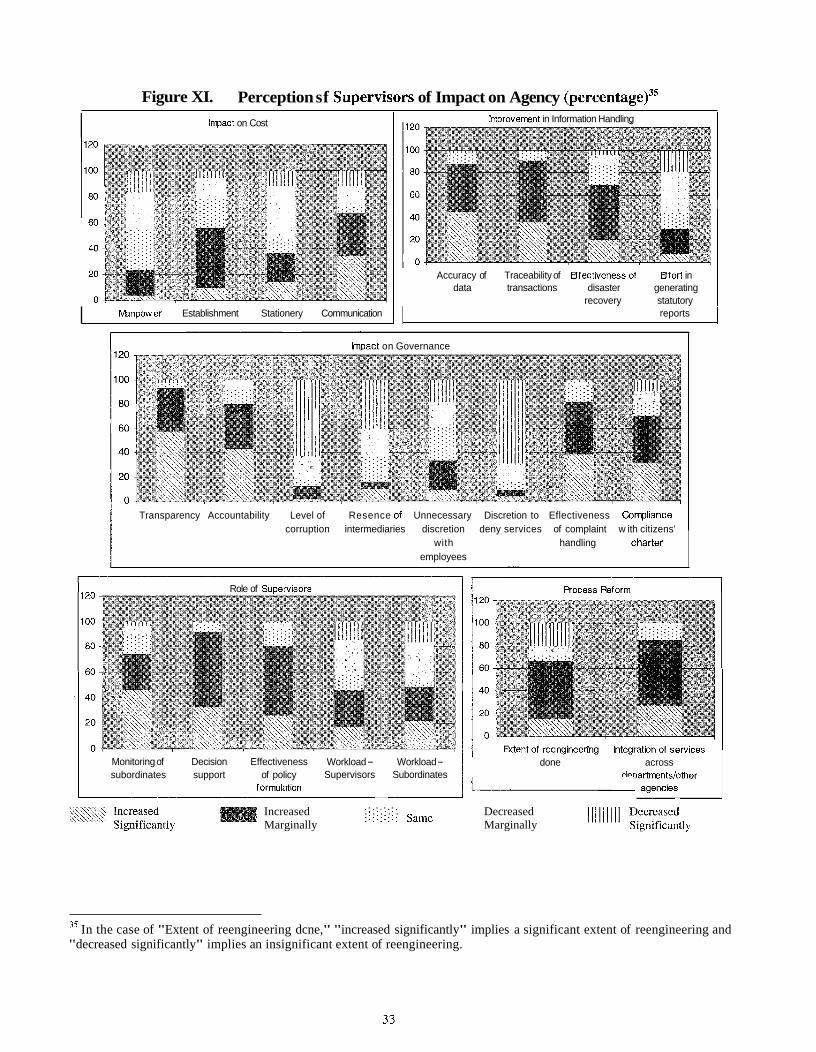
Figure XI. Perception sf Snpervisors of Impact on Agency (percentage)35
I Impact on Cost I I lm~rovement in Information Handling I
Accuracy of Traceability of Effectiveness ol Effort in 1 data transactions disaster generating recovery statutory
Mnpower Establishment Stationery Communication 1 1 reports I 1 Impact on Governance I
Transparency Accountability Level of Resence o i Unnecessary Discretion to Eflectiveness Co~rrpliance corruption intermediaries discretion deny services of complaint w ith citizens'
with handling c:harter employees
I Role of Su~ervisors I 1 Rncess Refnrm I
Monitoring of Decision Effectiveness Workload - Workload - done across subordinates support of policy Supervisors Subordinates departmentslother
formulat~on i ;;q>x.', ." . . . .
Increased , . . . . ,,$<. =!creased , . . . . . . . . ::::::::: Same Decreased
Slgnlficantly Marginally Marginally
35 In the case of "Extent of reengineering dcne," "increased significantly" implies a significant extent of reengineering and "decreased significantly" implies an insignificant extent of reengineering.

Based on the average cost savings reported by the respondents in the sample, total monetizable benefits that accrue to citizens in different projects were projected (Table XI). We noted that the standard error for these estimates was very low.
The total annual savings (except in Bhoomi) for the entire user population of a project work out to be significantly large (between Rs 15 and 270 million) in comparison to the investments made in the project. For Bhoomi, the reduction in bribes paid by the users was significant. Added to this, the imputed value of wage loss (which may be a relatively less accurate estimate) make the projects appear worthwhile investments from a social cost-benefit perspective.
Table XI. Savings in Cost to Customers-Estimates for Entire Client Population
These estimates need to be refined further. More accurate estimates of the total cost savings for the user population can be developed by using the averages and standard error for the savings calculated for each location. Data on the proportion of total users being served by the eight locations is, however, difficult to obtain.
In the last section of the client questionnaire, respondents were asked to respond to questions measuring three different types of broader societal impact of computerized service delivery: impact on knowledge society, impact on inclusion, and impact on governance. Through another set of questions an attempt was made to understand the client attitude toward investments in e-delivery projects in other agencies and the relative preference for government investments in developmental schemes versus computerization schemes. The responses on a five-point scale indicating agreement with the statements that were read to them were to be based on the client's experience with any electronic delivery systems that they may have used or known about. Such responses were received from a total of 1,200 respondents in India, this being the total of the respondents for individual projects. The average scores and standard error for the Indian responses are presented in Table XII. Perceived impact on moving toward a knowledge society and governance was rated as good (around four on the five-point scale). On

inclusion (impacting rural versus urban; rich versus poor) the rating was lower, somewhere between satisfactory and good. There was strong endorsement for greater investments in computerizing public service delivery; however, when asked to choose between investments in e-government versus investments in core developmental projects, the support for e-government was lukewarm.
Table XII. Attitude Toward e-Government-Indian Projects
E-government makes an impact on the knowledge of society
E-~overnment makes an im~ac t on the literacv level of societv
Enhances citizens' convenience in availing government services
Reduces corruption in delivery of public services
Increases accountability and transparency of government
E-government has helped to improve the image of government
More Investment in e-Governance Government should make more investment in e-government
More government departments and public agencies should be computerized
Com~uterization of government de~artments is a waste of resources " I . .-- --
Investments in Development Schemes Versus e-Government -- Money spent in e-government should be used for other government activities 1 2.960 1 0.034
E-government services put the poor at disadvantage
E-government services benefit only the rich and influential
E-government services benefit only urban people
Rural citizens benefit greatly from e-government services
Rural and urban poverty levels have changed

This study evaluated a sample of online public service delivery projects in India and Chile based mainly on surveys. The framework to assess each project was developed along a common set of principles. Key elements of the assessment framework include the following:
Assessments were undertaken for different stakeholders, including users, the implementing agency, and the wider society. Common sets of indicators for key dimensions of impact were used to assess sample projects. Key dimensions include economics, governance, quality of service, and process improvement. Interviews and focus groups were used in conjunction with surveys to obtain deeper understanding of the process of how values are created.
While all the sample projects were assessed based on a common set of attributes, including perceptions of clients, agencies, and a wider segment of the population, different tools for data collection were utilized. Surveys in India relied heavily on direct interviews with questionnaires. An Internet survey was used in a limited way primarily to collect information from supervisors who have adequate access to the Internet. Surveys in Chile relied on online means complemented by interviews and focus group consultations.
The surveys provided a wide range of information on perceptional assessment of online service delivery. The results for individual projects were compiled in a standard format that enabled comparison with other projects. By segmenting the respondent groups into users and agency officials, the study was able to highlight the contrast in perception about the projects while presenting the multifaceted nature of project impact. More importantly, the survey results present preliminary benchmark levels for future online service projects to measure their performance. While further refinement in the measurement indicators is still needed, the fundamental framework used in this study is a good starting point for more elaborate versions.
The two different approaches adopted for projects in India and Chile were selected based on the characteristics of the sample projects. Because of inadequate information infrastructure, a low penetration level of personal computers and the Internet, and lack of IT literacy among citizens, services in the Indian projects are delivered through assisted counters in common service centers and government offices. To reach users, the study had to rely on direct interviews using a structured survey instrument. In Chile, on the other hand, service delivery assumes direct connection to the Internet to complete the transactions. Therefore, it was considered that the Internet survey tools can provide a cost-effective way to capture a wide segment of the user population.
Direct interviews of an adequate sample of users proved to be a powerful way to gather detailed information from the users about the actual economic impact and perception on

quality. The time and costs associated with this approach, however, may not make it amenable for frequent use. The Internet survey, in comparison, was an effective tool to collect information in a short period of time, though it was difficult to control the characteristics of respondents. Limited interviews and focus group methods had to be used to make up for this weakness.
Overall, this study was able to provide a comprehensive set of data to assess the impact in a sample of ICT projects. The dimensions of and indicators for impact on users and implementing agencies were applicable to a diverse set of projects and needed marginal adaptation for specific projects. The results could be compared across projelcts and provided useful insights into the success achieved by individual projects. It was possible to identify areas where every project has delivered a positive impact and areas where the impact has been varied and marginal across projects.
The assessment of the impact on the wider society, however, is limited to illustrating public sentiment toward ICT projects. Opinions of nonusers, which constitute an important component of the larger society, were not solicited in the study because of resource constraints. While it may be important information in gauging the level o:F public support for ICT projects, this framework is not a completely satisfactory tool to (directly link the ICT and developmental impact.
While the framework and indicators to be measured for each dimension can be applied across all types of service delivery projects, the selection of survey methodology can vary based on the characteristics of the projects, available resources for evaluation, ;and the desired level of control of the quality collected data. Annex IX summarizes the key elements to incorporate in designing a good assessment study in i) project selection, ii) questionnaire design, and iii) the establishment of data validity.
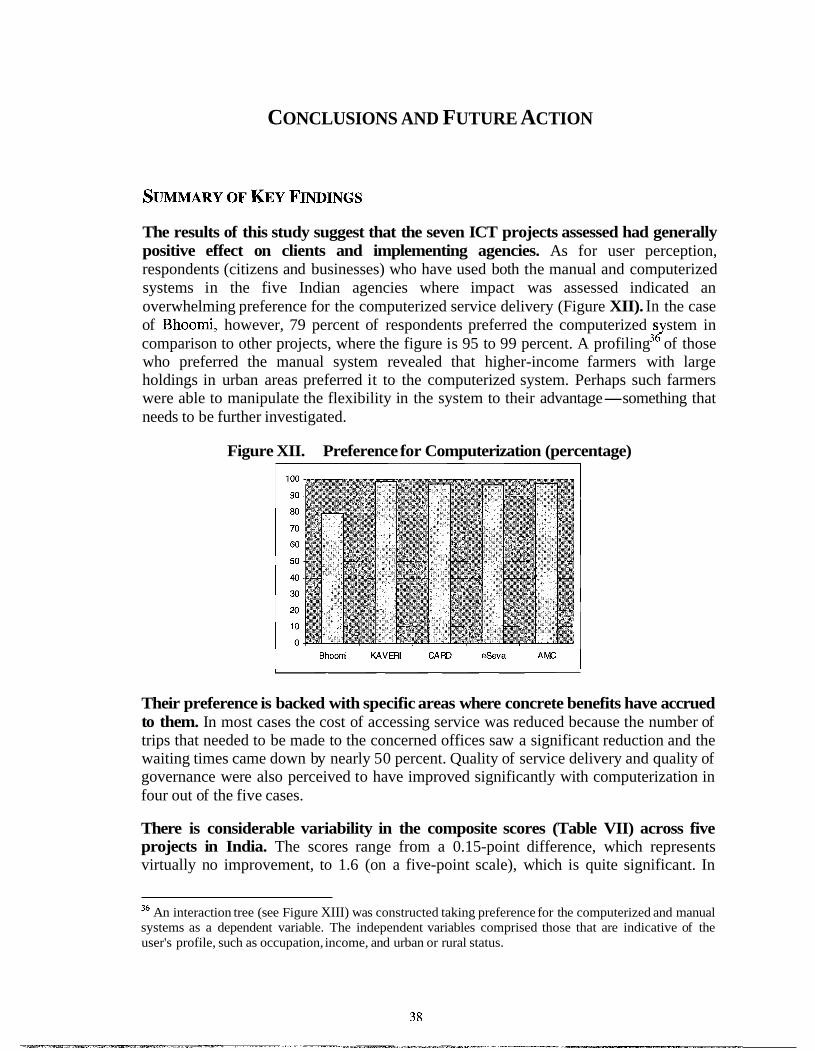
CONCLUSIONS AND FUTURE ACTION
The results of this study suggest that the seven ICT projects assessed had generally positive effect on clients and implementing agencies. As for user perception, respondents (citizens and businesses) who have used both the manual and computerized systems in the five Indian agencies where impact was assessed indicated an overwhelming preference for the computerized service delivery (Figure XII). In the case of Bhoomi, however, 79 percent of respondents preferred the computerized s stem in 32 comparison to other projects, where the figure is 95 to 99 percent. A profiling of those who preferred the manual system revealed that higher-income farmers with large holdings in urban areas preferred it to the computerized system. Perhaps such farmers were able to manipulate the flexibility in the system to their advantage-something that needs to be further investigated.
Figure XII. Preference for Computerization (percentage)
Bhooni KAVWI C A W eSwa I Their preference is backed with specific areas where concrete benefits have accrued to them. In most cases the cost of accessing service was reduced because the number of trips that needed to be made to the concerned offices saw a significant reduction and the waiting times came down by nearly 50 percent. Quality of service delivery and quality of governance were also perceived to have improved significantly with computerization in four out of the five cases.
There is considerable variability in the composite scores (Table VII) across five projects in India. The scores range from a 0.15-point difference, which represents virtually no improvement, to 1.6 (on a five-point scale), which is quite significant. In
36 An interaction tree (see Figure XIII) was constructed taking preference for the computerized and manual systems as a dependent variable. The independent variables comprised those that are indicative of the user's profile, such as occupation, income, and urban or rural status.

general, these ratings corroborate well with data on cost savings to customers, perception on quality of governance, and quality of service collected through an independe:nt set of questions. The distinct preference for computerized systems by the clients sleems to suggest that even small gains for the users can trigger a major positive ch.ange in perception about the overall quality of service delivery systems.
Although the outcome is mixed in reducing corruption, ICT seems to have the potential for significant reduction in corruption in service delivery, as indicated by one project. Less than one percent of surveyed users of one of the three projects where significant corruption was reported in the manual system responded that they paid bribes to officials after the services were computerized. In the other two projects the impact was marginal, as corruption continues at a significant level in the computerized systems. In the two Chilean projects the perceived impact on corruption also was marginal.
Estimated incremental operating costs for agencies (including amortized investment) per transaction in all the Indian projects seem to be less tlhan the reduction in the direct cost of accessing the service reported by the clien~ts. This indicates that the idea of a user fee that covers the incremental costs to make the applications economically viable may not face political resistance. Any resistance for the levy of a user fee comes from the lack of credible information on costs and benefits delivered by projects. The fact that many projects can become self-sustaining through revenues from user fees indicates that private sector investment can be tapped. Three of the five Indian projects have private partners, and the expansion of the fourth piroject in rural areas is planned through private partnership. A similar analysis could not be done for the Chilean projects, as cost data was difficult to collect.
A significant negative aspect is the observed variability of impacts across dlifferent delivery centers in a project. This variability should be a cause for concern for delivery models in which physical service centers are created. Part of this variability is explained by poor infrastructure (power and connectivity), particularly in rural areas. Given the large variation in activity levels at different centers, it is often difficult to match the capacity to the demand at each of these centers. Portal-based delivery accessed. via the Internet can be a solution. Unequal access to Internet, however, can put some users at a disadvantage in such systems.
In terms of the impact on agencies, in all projects the ability to cope with growth in transactions appeared to have been enhanced. In some cases, computeriztition has likely helped in the growth of transactions. Computerization was partially responisible for improved tax collections by some agencies. The staff in these agencies did not ]perceive that cost had been reduced. They felt, however, that there was a significant positive impact on the quality of governance.
Surveyed citizens (irrespective of their rural or urban location or educational background) strongly supported the idea that more agencies need to be computerized, but not necessarily through government investments.

LIMITATIONS OF THE STUDY AND AREAS FOR FURTHER RESEARCH
The study was exploratory in nature undertaken with limited resources. More countries could have been covered; independent market research agencies could have been used for collecting structured data in Chile; and a greater variety of applications could have been assessed for generalizing the conclusions. The study used a sample size that was considered relatively small (and barely adequate) at the stage of planning the field work. While the difference between manual and computerized systems on all the performance indicators are found to be statistically significant (in most cases at a confidence level of 99 percent), the accuracy of the actual estimate of the difference in direct costs could be improved by the use of larger samples. A larger sample size in subsequent studies would also permit analysis of disaggregated data at the level of each service location or for different types of clients.
The conclusions on the impact on agencies need further validation with more time-series data on different types of costs and revenue streams related to the service being investigated.
The overall positive assessment of projects should be seen in the context of the seven projects that were selected for assessment. These were mature projects, with a wide reach and scope of activity. These projects have been operational for at least three years, implying successful implementation. Nearly all the projects serve urban clients. Projects that serve rural clients could have a very different cost structure and demand pattern. Rural projects will also face a greater challenge in the maintenance of infrastructure. For all the Indian projects, improvements were measured in comparison with the manual systems that were replaced. When countries move from computerized systems in departments to a 24x7 delivery through portals, the degree of perceived improvement could be very different.
For understanding the costs and benefit of ICT investments at a macro level, more projects need to be evaluated in different contexts, and failed projects (that could not be successfully implemented) would have to be included in the analysis. It would therefore be premature to generalize the overall conclusions of a positive impact and the economic viability of electronic service delivery projects from this study.
The primary objective of this study was to measure the impact of computerization in selected service delivery projects. Further studies need to be undertaken to explain the variation in impact on various dimensions, differences across projects, and differences across locations for a project. Studies could also be undertaken to understand the effectiveness of different delivery models and implementation modalities, such as the use of public-private partnerships. More data (quantitative as well as qualitative) will need to be collected from the agencies to undertake such studies.
The establishment of an acceptable counterfactual was a challenge for the study team. All the projects had discontinued manual delivery of service and had mandated the use of the computerized systems for the citizens. For the assessment of manual systems, respondents needed to rely on memory. In the case of systems that have been operational
for a large number of years, such recall can introduce an error. There had been no benchmarking of the service delivery in a manual system prior to implementing a new computerized system-something that needs to be done for new projects that are taken up in the future. Other forms of counterfactuals, such as a user group from an adjoining state, could be used to avoid the problem of recall. Use of a different context, however, could result in other types of biases.
The study assessed the direct economic impact in terms of the cost of accessing the service. ]It does not measure the impact on the inherent value of efficient delivery of the service for the client. For example, a copy of a land title is required for obtaining a farm loan, getting bail in a court case, insuring crops, and for checking the veracity of the record. A farmer would attach different values to efficient delivery of land title depending on the purpose for which it was required. Subsequent studies should also at:tempt to estimate the impact on indirect economic value.
Given these limitations, the assessment outlined in the study can be used for:
1. Establishing baseline of the manual service delivery systems before computerization,
2. Monitoring of new ICT projects, and 3. Evaluating completed computerized service delivery projects.
The methodology defines possible indicators for different types of outcomes and provides guidelines for selecting them. It can be used to examine the business case for public sector ICT projects in developing countries by providing better understanding of the costs of such projects and highlighting areas of potential benefits.
Baseline surveys of the manual system can be used to set targets for various components of service level for the proposed system. These targets can define a citizens' charter for the online delivery of services. Client surveys for assessing the manual system will also provide an understanding of the structure of client costs for accessing a service. The targeted improvements in service delivery can be used to perform a cost-benefit analysis of the proposed system.
Targeted improvements in various indicators will also be an input for determining the nature of the process reengineering that would be required and the technical design that would enable the degree of proposed improvement. The design specifications; in turn would determine the proposed investments and likely operating costs. Figures on benefits and costs can be compared prior to implementing a project. An estimate of the potential savings in cost to clients will help determine the level of user fee, particiularly if somewhat accurate estimates of investments and operating costs can be made.
The results of the retrospective evaluation of the seven projects carried out in this report indicate the relevance of such an exercise. The results provide a benchmark against which other projects can be measured. They also provide cues for investigating why a certain project is not delivering on a potential area of service improvement.
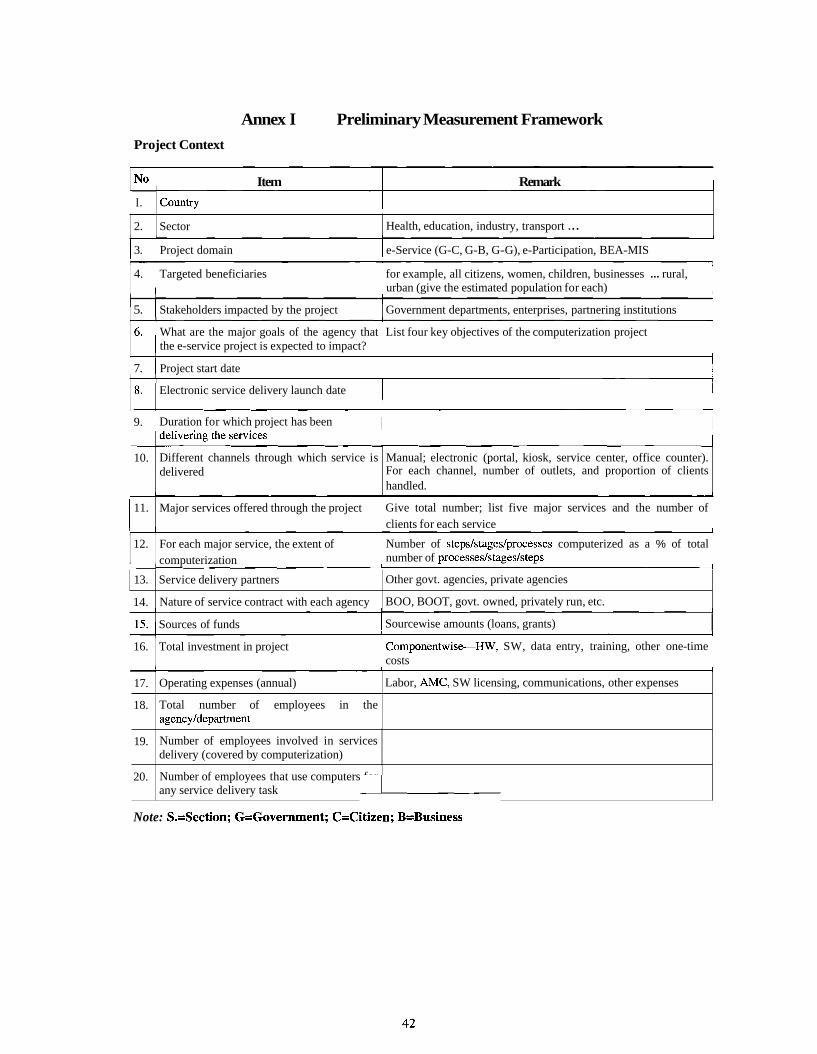
Annex I Preliminary Measurement Framework
Project Context
I N o I Item I Remark 1
1 3. Project domain 1 e-Service (G-C, G-B, G-G), e-Participation, BEA-MIS 1
I.
2.
4. Targeted beneficiaries I I for example, all citizens, women, children, businesses ... rural, urban (give the estimated population for each) I
country - -
( 5. 1 Stakeholders impacted by the project ( Government departments, enterprises, partnering institutions I
Sector
16. I What are the major goals of the agency that List four key objectives of the computerization project the e-service project is expected to impact?
Health, education, industry, transport . . .
1 7. 1 Project start date I 1 - - - - - -
Electronic service delivery launch date
11. Major services offered through the project Give total number; list five major services and the number of I I clients for each service
9. Duration for which project has been
12. For each major service, the extent of I I computerization
10.
Number of steps/stages/processes computerized as a % of total number of processes/stageslsteps
Different channels through which service is delivered
- -
15 Sources of funds
Manual; electronic (portal, kiosk, service center, office counter). For each channel, number of outlets, and proportion of clients handled.
13.
1 14.
I Sourcewise amounts (loans, grants) I 16. Total investment in project I I
Service delivery partners
Nature of service contract with each agency
Componentwise--HW, SW, data entry, training, other one-time costs
Other govt. agencies, private agencies
BOO, BOOT, govt. owned, privately run, etc.
Note: S.=Section; G=Government; C=Citizen; B=Business
17.
18.
19.
20.
Operating expenses (annual)
Total number of employees in the agencyldepartrnent
Number of employees involved in services delivery (covered by computerization)
Number of employees that use computers for
Labor, AMC, SW licensing, communications, other expenses
any service delivery task L

Impact on Clients:
All measurements are based on a sample of clients for each major service availed by the client. Measurements would be done for electronic delivery of services as well as for the earlier mode of delivery of the same service. In cases where alternate (nonelectronic modes) are currently being used by the same set of users in similar contexts elsewhere, measurement would be recorded for such usage.
Average travel time for each tnp J
Question
Number of trips made
Average travel cost of
1 bribes
Indicator
Direct cost to user: travel costs, travel time, elapsed time for service delivery, cost of repeated visits
1.
Extent of reduction of cost of paying government functionarieslagents? YesINo
Key Dimension of Impact
Economic: Direct & Indirect
Average waiting time in
Estimate of wage loss, if any
Was there a payment of bribe to
Total amount paid in bribes 'to
Amount of payments made to agents to facilitate the service
Rate of errors and time for recovery Any errors in the documents that required correction? YesINo
Number of trips required for correction to be done
I Travel cost for the trips I Waiting time in offices for getting correction done
Estimate of wage loss, if any, in getting correction done
Payment of user feelprocessing charges
Extent of reduction in datafdocuments to be submitted
I Total processing fee paid for the task )
Number of documents to be submitted
Cost of preparation of documents in terms of hoursldays 1 Effort in preparing documen~ts: measure on a scale
Governance: Corruption, Accountability, Transparency, Participation
Levels of corruption 1 Measured on a scale I
compliance to committed service time frame
Need for engaging intermediaries
Adherence to a citizen's charter:
Accountability of government functionaries
YesINo
Perception measured on a scale
Degree to which government functionaries can be held accountable: measure on a scale

Key Dimension of Impact Indicator
2uality and quantity of information Shared by agencies
Question 1 Are the rules and procedures clearly stated without ambiguity and mistakes: measure on a scale
Transparency of data: measure on a scale I Transparency of decisions: measure on a scale
Does the agency take responsibility for the accuracy of information shared? Yes/No
2uality and quantity of information :xchange between client and agencies
Has any suggestion or feedback been provided? Yes/No
ibility to influence policy and uleslprocedures through feedback
Measured on a scale 1
2uality of Service: Decency, Tairness, Convenience, etc.
2uality of problem resolution and :xception handling
Was any problem taken for resolution? Yes/No
Satisfaction with the resolution process: measure on a scale
Jser independence of time and place, !4x7 availability
Convenience of location of access point for service: measure on a scale
Is the service available seven days a week? Yes/No
Satisfaction with service timings: measure on a scale
2uality of facilities at access points
jimplicity of user actions required for )btaining the service
Measured on a scale
Measured on a scale
jingle-window access to several :emices
Convenience through a single window measured on a scale
herall convenience in obtaining :ervice
;riendliness in interaction with :ovemment staff
Zxtent of protection of privacy
Measured on a scale
Measured on a scale 1
Any instance of privacy being violated? YesINo 1 Perception of protection of privacy and confidentiality of data: measure on a scale
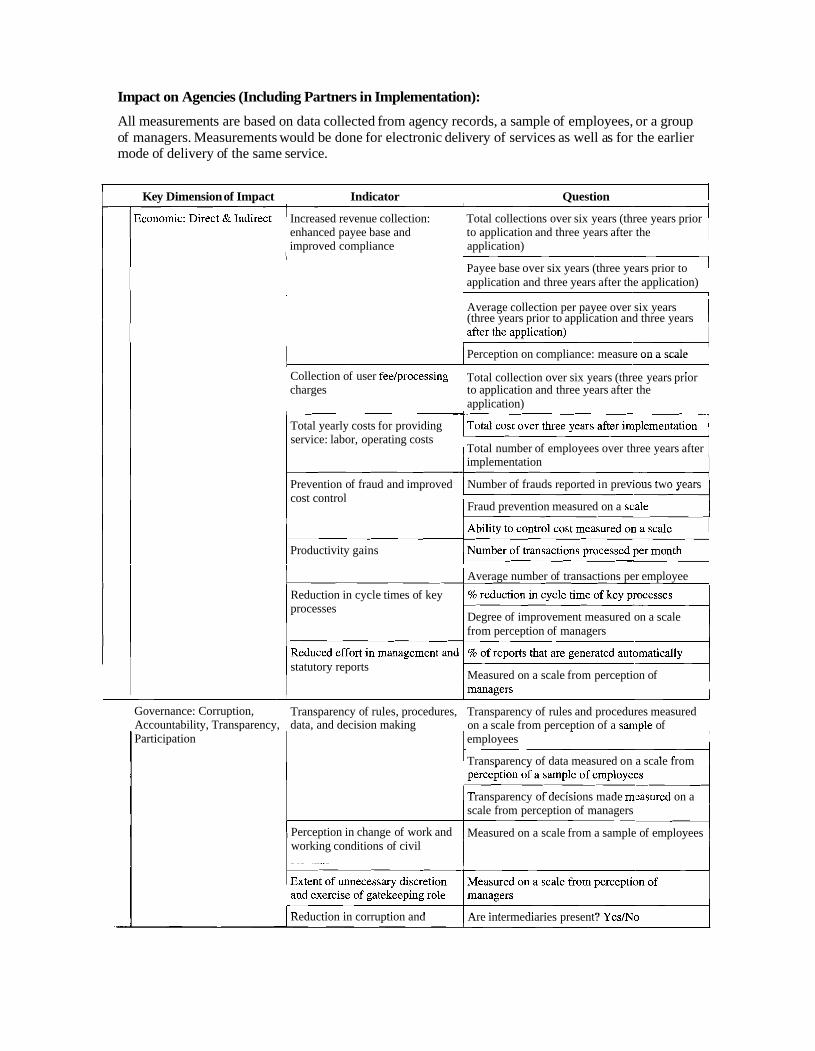
Impact on Agencies (Including Partners in Implementation):
All measurements are based on data collected from agency records, a sample of employees, or a group of managers. Measurements would be done for electronic delivery of services as well as for the earlier mode of delivery of the same service.
I Key Dimension of Impact I Indicator I Question 1 Increased revenue collection: Total collections over six years (three years prior enhanced payee base and to application and three years after the improved compliance application)
Payee base over six years (three years prior to I application and three years after the application) 1
1 1 Average collection per payee over six years 1 (three years prior to application and three years
Perception on compliance: measure on a scale
Collection of user feelprocessing Total collection over six years (three years prior 1 1 charges to application and three years after the application)
Total yearly costs for providing service: labor, operating costs
Total number of employees over three years after implementation
Prevention of fraud and improved Number of frauds reported in previous two years cost control 1 Fraud prevention measured on a
I
Productivity gains
1 I Average number of transactions per employee 1 Reduction in cycle times of key processes
Degree of improvement measured on a scale from perception of managers
statutory reports Measured on a scale from perception of
Governance: Corruption, Transparency of rules, procedures, Transparency of rules and procedures measured Accountability, Transparency, data, and decision making on a scale from perception of a sample of Participation employees
Transparency of data measured on a scale from
Transparency of decisions made mteasured on a scale from perception of managers
Perception in change of work and Measured on a scale from a sample of employees working conditions of civil
Reduction in corruption and Are intermediaries present? Yes/No

Question Key Dimension of Impact I Indicator
presence of intermediaries Reduction in corruption measured on a scale from perception of managers
Strengthening feedback mechanisms
Measured on a scale from perception of managers
Degree of employee involvement in project design, development,
Voneconomic Objectives organization goals in Section I
Measured on a scale from a sample of employees
Extent to which computerization has helped in furthering the goals: measured on a scale
1 Enhanced coverage of underserved 1 population
Coverage as % of target population over six years (three years prior to application and three years after the application)
Ability to define and comply with a citizen's charter
Measured on a scale from perception of managers
Enhanced basket of services Number of new services added in the previous two years
Improved performance monitoring and decision support
Improvements in complaint handling and problem resolution F-
Measured on a scale from perception of managers
Number of complaints over six years (three years prior to application and three years after the application)
Proportion of complaints addressed in stipulated time
Is user satisfaction on complaint handling measured? Yes/No
Satisfaction with complaint handling measured on a scale from perception of managers
Improved policy formulation and implementation
Measured on a scale from perception of managers
+ocess Improvements 1 Integration of services across 1 agencies and single window
Measured on a scale from perception of managers
delivery
Process simplification and -
Measured on a scale from a sample of employees reduction in data handling
1 Improved record maintenance: Measured on a scale from perception of managers
Lapses in security recorded in last two years
accuracy, consistency, security, and disaster recovery
Measured on a scale from perception of managers
Data transaction traceability and audit trails
Understanding of one's work measured on a scale from a sample of employees
Role clarity and degree of employee buy-in (change management)
Comfort level with the new system measured on a scale from a sample of employees

Impact on Society:
Some of the questions should be framed as degree of improvements resulting from the implementation of a specific project.
Economic: Direct & Indirect
I Indicator I Remarks 1 Enhanced revenuebenefits to Measured on a scale from a sample government of citizens (users and nonusers)
Increased employment/wages in the Measured on a scale frorn a sample economy of citizens (users and nonusers)
Stimulus to growth of trade Assessed from a focus group of business people i
Stimulus to growth of small and Assessed from a focus group of medium enterprises small and medium enterprise people
Reduction in cost of doing business Assessed from a focus group of business people I
Improved image of a responsive and Measured on a scale frorn a sample efficient government held by society of citizens (users and nonusers)
2. Governance: Corruption, Accountability, Transparency, Participation, Responsiveness
different stakeholders of citizens (users and nonusers)
Improved image of an accountable and transparent government held by
1 society
Measured on a scale frorn a sample of citizens (users and nonusers)
Contribution to reduction of rural and urban poverty
Understand the process (chain of causality) by which such an impact can be created or was created
Progress toward a knowledge 1 society Understand the process (chain of causality) by which such an impact can be created or was created
Influence on the Millennium Development Goals
Understand the process (chain of causality) by which such an impact can be created or was created

List of ICT Projects Complied for Which Evaluation Documents Were Analyzed
Country Project Description Organization that Has Undertaken the Study
Cameroon, Automated Transaction Processing System for Trade at Douala Autonomous Port
Ghana, Transaction Processing and Management Information System for the Social Security and National Insurance Trust
Ghana, Uganda, Zimbabwe, Personnel Management System
Mauritius, Contributions Network Project (CNP)
Namibia, Integrated Financial Management System
Nigeria, Financial Records Systems
Nigeria, Management Information Systems (MIS) for the University Sector
e-Government for Development
e-Government for Development
International Records Management Trust
GPSR net, The World Bank Group
PROS1 Magazine
International Records Management Trust
International Records Management Trust
e-Government for Development
Africa
1.
2.
3.
4.
5.
6.
7.
Type of Publication
Cameroon
Ghana
Ghana, Uganda, Zimbabwe
Mauritius
Namibia
Nigeria
Nigeria
Data Source/Role
Medium Case
Caselet
Detailed Case + Evaluation
Medium Case
Caselet
Detailed Case + Evaluation
Detailed Case
Medium Case
Direct role
Primary
Literature review; interviews with the key players involved in designing, developing, and using personnel information systems; and a technical evaluation of the relationship between system capabilities and user requirements
Contributions Network Project final report-Ministry of Finance (1999), meeting notes of CNP committees, and feedback from MNS and gove- ~nment agencies (VAT, Income Tax, Revenue Authority)
Documents, interviews
Documents, interviews
Visits rnade to the offices of the Accountant General, the Ministry of Finance, the Auditor General, and the National Archives; interviews conducted with officials of these departments
Direct role
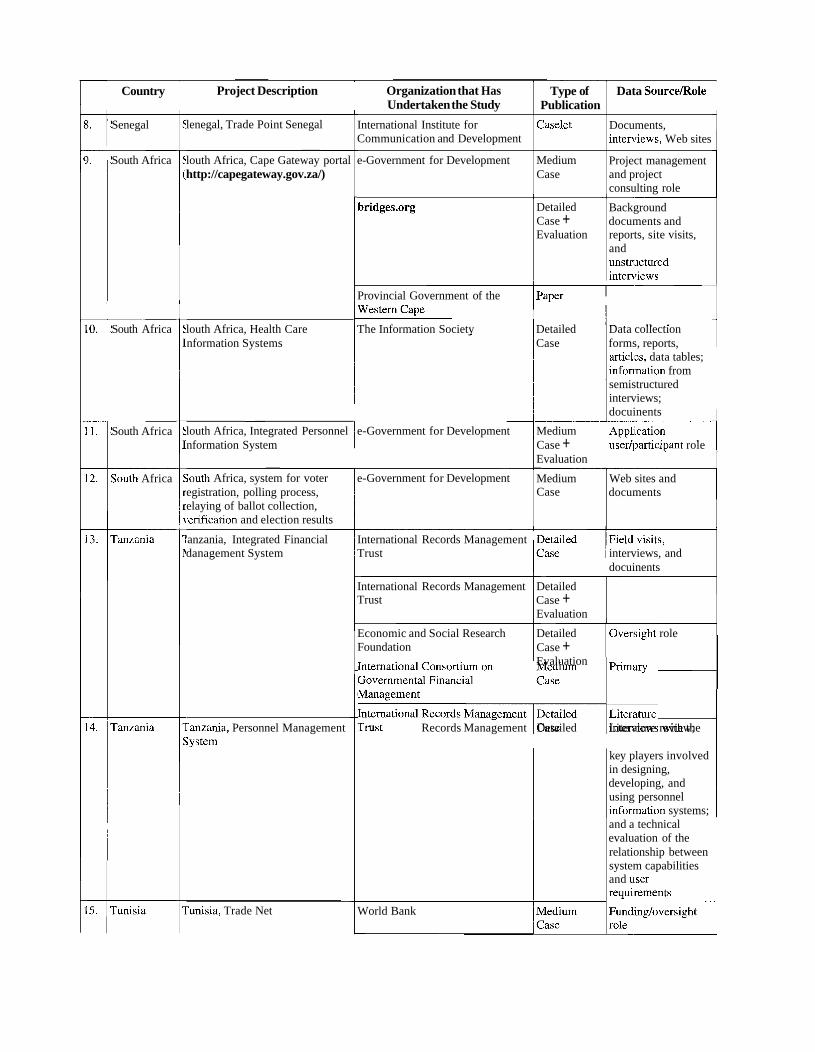
Country Project Description
Senegal
Organization that Has Undertaken the Study
International Institute for Communication and Development
e-Government for Development
lenegal, Trade Point Senegal
South Africa
Type of Publication
Caselet
Medium Case
louth Africa, Cape Gateway portal http://capegateway.gov.za/)
Data Source/Role
Documents, interviews, Web sites
Project management and project consulting role
Provincial Government of the
The Information Society Detailed
Detailed Case + Evaluation
Data collection forms, reports, articlles, data tables; information from semistructured interviews; docuinents
user/participant role
Background documents and reports, site visits, and unstr~actured interviews
South Africa louth Africa, Health Care nformation Systems Case
South Africa louth Africa, Integrated Personnel nformation System
e-Government for Development Medium Case + Evaluation
South Africa ;outh Africa, system for voter egistration, polling process, elaying of ballot collection, rerification and election results
ranzania
e-Government for Development
'anzania, Integrated Financial danagement System
International Records Management Trust interviews, and
docuinents
Medium Case
International Records Management Trust
Web sites and documents
Detailed Case + Evaluation
Economic and Social Research Foundation
International Consortium on Medium Primilry Governmental Financial Management
International h V i e w s Records Management Detailed Literature review; with the
Detailed Case + Evaluation
:anzania, Personnel Management ;ystem
Overisight role
ranzania
key players involved in designing, developing, and using personnel infor~mation systems; and a technical evaluation of the relationship between system capabilities and user
'unisia, Trade Net World Bank
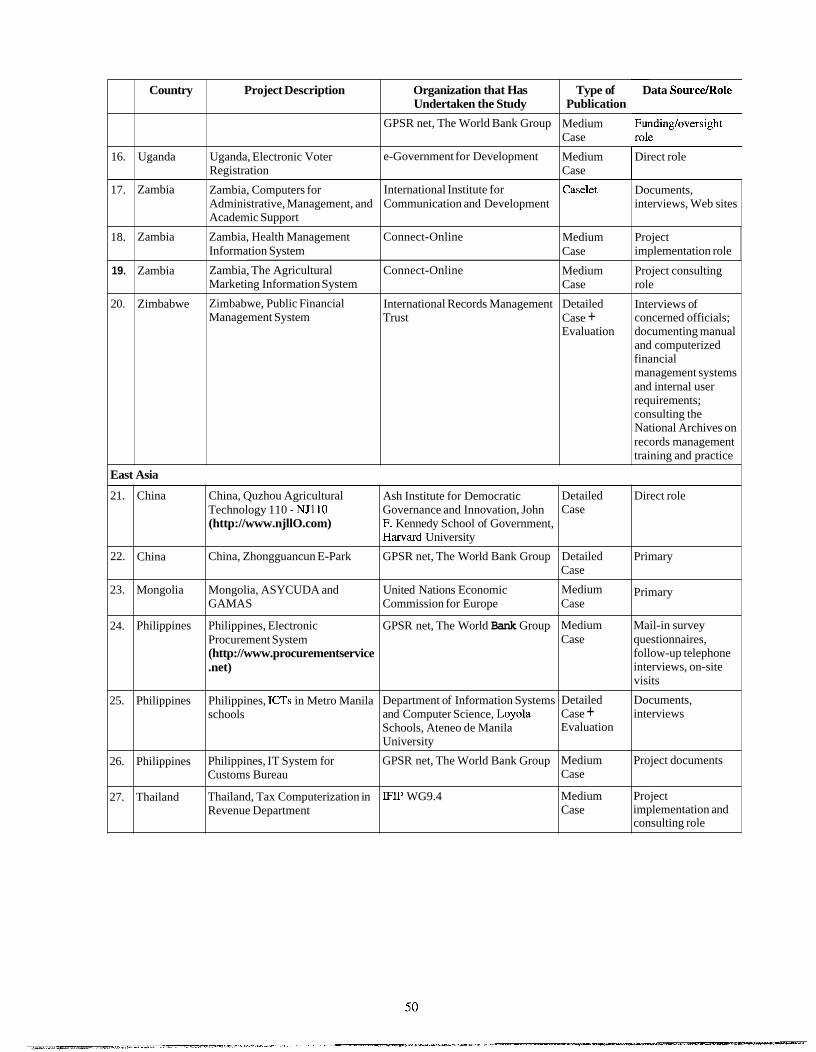
16.
17.
18.
19.
20.
East
Country
Uganda
Zambia
Zambia
Zambia
Zimbabwe
Asia
Project Description
Uganda, Electronic Voter Registration
pppp
Zambia, Computers for Administrative, Management, and Academic Support
Zambia, Health Management Information System
Zambia, The Agricultural Marketing Information System
Zimbabwe, Public Financial Management System
21.
22.
23.
24.
25.
26.
27.
China
China
Mongolia
Philippines
Philippines
Philippines
Thailand
China, Quzhou Agricultural Technology 110 - NJ110 (http://www.njllO.com)
China, Zhongguancun E-Park
Mongolia, ASYCUDA and GAMAS
Philippines, Electronic Procurement System (http://www.procurementservice .net)
Philippines, ICTs in Metro Manila schools
Philippines, IT System for Customs Bureau
Thailand, Tax Computerization in Revenue Department
Organization that Has Undertaken the Study
GPSR net, The World Bank Group
e-Government for Development
International Institute for Communication and Development
Connect-Online
Connect-Online
International Records Management Trust
Ash Institute for Democratic Governance and Innovation, John F. Kennedy School of Government, Harvard University
GPSR net, The World Bank Group
United Nations Economic Commission for Europe
GPSR net, The World Bank Group
Department of Information Systems and Computer Science, Loyola Schools, Ateneo de Manila University
GPSR net, The World Bank Group
IFIP WG9.4
Type of Data Source/Role Publication
Medium Fundingloversight Case
Medium Direct role Case
Caselet
Medium Case
Medium Case
Detailed Case + Evaluation
Detailed Case
Detailed Case
Medium Case
Medium Case
Detailed Case + Evaluation
Medium Case
Medium Case
Documents, interviews, Web sites
Project implementation role
Project consulting role
Interviews of concerned officials; documenting manual and computerized financial management systems and internal user requirements; consulting the National Archives on records management training and practice
Direct role
Primary
Primary
Mail-in survey questionnaires, follow-up telephone interviews, on-site visits
Documents, interviews
Project documents
Project implementation and consulting role
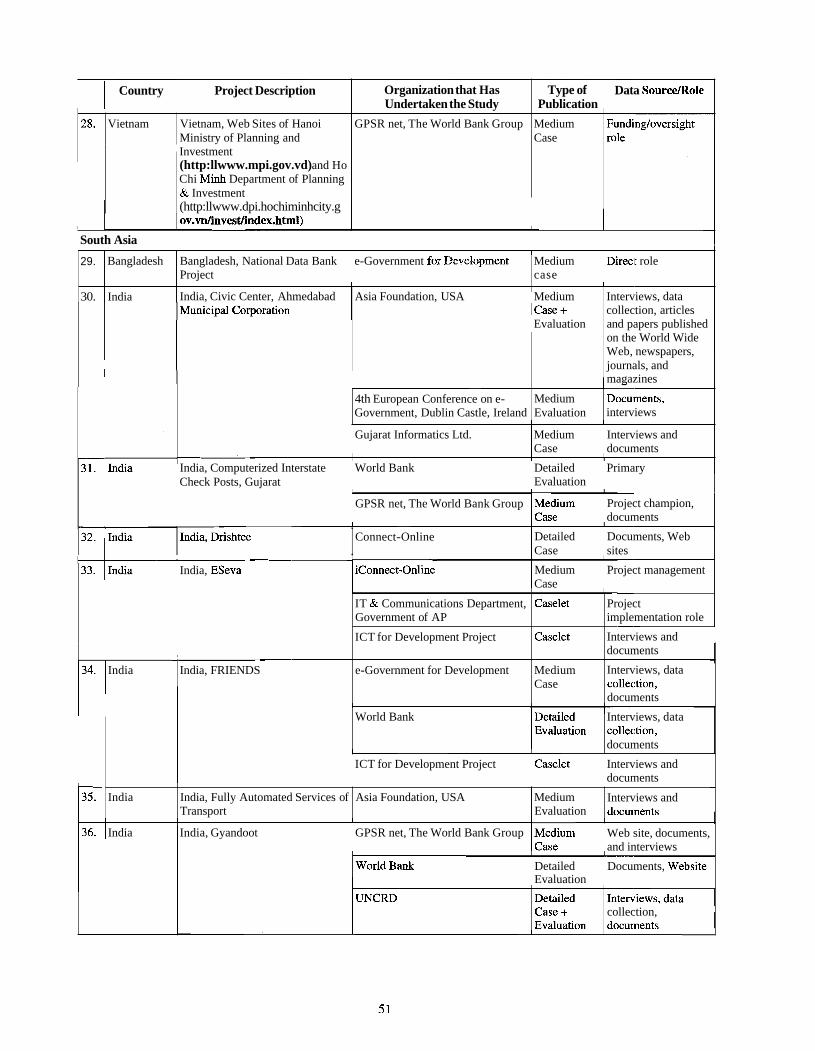
1 1 Country 1 Project Description 1 Data Source/Role Organization that Has Undertaken the Study
GPSR net, The World Bank Group
Type of Publication
Medium Case
Vietnam
' Investment (http:llwww.mpi.gov.vd) and Ho Chi Minh Department of Planning & Investment (http:llwww.dpi.hochiminhcity.g
Vietnam, Web Sites of Hanoi Ministry of Planning and
1 South Asia I e-Government for hvetopment Medium Direct role I case
29.
30.
Gujarat Informatics Ltd. Medium Interviews and 1 Case documents
Bangladesh
India Asia Foundation, USA Medium Interviews, data collection, articles
Evaluation and papers published on the World Wide Web, newspapers, journals, and magazines
India, Computerized Interstate World Bank Check Posts, Gujarat
Bangladesh, National Data Bank Project
India, Civic Center, Ahmedabad
4th European Conference on e- Government, Dublin Castle, Ireland
Detailed Primary Evaluation
GPSR net, The World Bank Group Project champion, documents
Medium Evaluation
India, Drishtee 7- -
Docuiments, interviews
I Connect-Online Detailed Documents, Web I Case sites
Medium Project management I Case India, ESeva
India India, FRIENDS
World Bank Interviews, data
documents
IT & Communications Department, Government of AP
ICT for Development Project
e-Government for Development
ICT for Development Project Caselet Interviews and documents
Caselet
Caselet
Medium Case
1 India
Project implementation role
Interviews and documents
Interviews, data collec:tion, documents
India
India, Gyandoot GPSR net, The World Bank Group Web site, documents, and interviews
India, Fully Automated Services of Transport
Detailed Documents, Website Evaluation
collection,
Asia Foundation, USA Medium Evaluation
Interviews and docu~nents
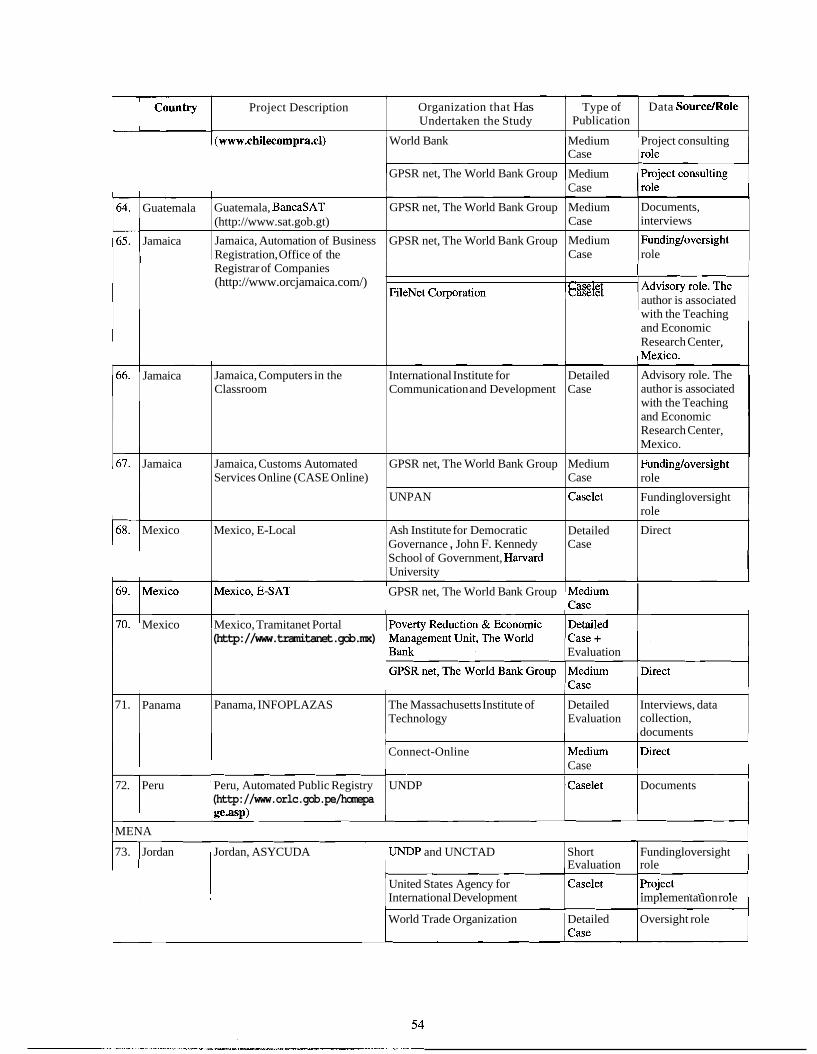
Project Description
Guatemala
Jamaica
(www.chilecompra.cl) World Bank Medium Project consulting Case
GPSR net, The World Bank Group Medium Case
Organization that Has Undertaken the Study
Registrar of Companies (http://www.orcjamaica.com/)
1 GPSR net, The World Bank Group I
Guatemala, BancaSAT (http://www.sat.gob.gt)
Jamaica, Automation of Business Registration, Office of the
Jamaica
Jamaica
Mexico
Mexico Mexico, Tramitanet Portal (http://www.tramitanet.gob.mx)
Evaluation
Type of Publication
-Corporation
Data SourcelRole
GPSR net, The World Bank Group
GPSR net, The World Bank Group
Caselet author is associated with the Teaching and Economic Research Center,
Jamaica, Computers in the Classroom
Jamaica, Customs Automated Services Online (CASE Online)
Mexico, E-Local
71.
Medium Case
Medium Case
International Institute for Communication and Development
GPSR net, The World Bank Group
UNPAN
Ash Institute for Democratic Governance , John F. Kennedy School of Government, Harvard University
Documents, interviews
Fundindoversight role
documents - Connect-Online
Case
72. Peru Peru, Automated Public Registry UNDP Caselet Documents (http://www.orlc.gob.pe/homepa ge.asp)
MENA
73. Jordan Jordan, ASYCUDA UNDP and UNCTAD Short Fundingloversight Evaluation role
United States Agency for International Development implementation role
World Trade Organization Detailed Oversight role
Panama
Detailed Case
Medium Case
Caselet
Detailed Case
Advisory role. The author is associated with the Teaching and Economic Research Center, Mexico.
Fundindoversight role
Fundingloversight role
Direct
Panama, INFOPLAZAS The Massachusetts Institute of Technology
Detailed Evaluation
Interviews, data collection,

Annex In Survey Among Targeted Clients. Ahmedabad Municipal Corporation
/S.NO. U I U I CIVIC CENTER U I / NAME OF RESPONDENT
HEAD ................................................................................................. 1 ............................................................................................. SPOUSE 2
FAMILY MEMBER .......................................................................... 3
I
.......................................................................................... ............................................................................................
SERVANT 4 OTHERS 5
ADDRESS
1 D A m OF VISIT ( D D m ) D D 1 NAME OF INTERVIEWER
STATUS OF RESPONDENT
1 SIGNATURE OF INTERVIEWER 1
I 1 . 1 What is your age in completed years? I I
Housewife ......................................................................................... 13 Agricultural labourer ...................................................................... 14 Cultivator ....................................................................................... 15 Others (SPECKFY) ............................................................................ 16
Please record the gender of the respondent
What is the level of education that you have completed?
What is your main occupation? SINGLE CODE
.................................................................................................... Male 1 ................................................................................................ Female 2
............................................................................................... Illiterate 1 ....................................................... Literate without formal schooling 2
Upto 4th standard ................................................................................ 3 5th to 9th standard .............................................................................. 4
.......................................................................................... SSCIHSC 5 Some college but not graduate ........................................................... 6 GraduatePost Graduate (General) ...................................................... 7
............................................... GraduatelPost Graduate (Professional) 8
............................................................................... Unskilled worker 1 Skilled worker .................................................................................... 2 Petty trader ......................................................................................... 3 Shop owner ......................................................................................... 4 Businessman/Industrialist with no employees .................................... 5 Businessman/Industrialist with 1-9 employees ................................... 6 Businessman/Industrialist with 10+ employees .................................. 7 Self employedlprofessional ................................................................. 8 ClericaUSalesman ............................................................................... 9 Supervisory level .............................................................................. 10 Officer/Executive . Junior ................................................................ 11
. I Have you heard of the Civic Center?
1 Officer/Executive . MiddleISenior ............................................... 12
What is your monthly household income from all sources? IN RUPEES
YES ..................................................................................................... 1 NO ................................................................................. 2 -END
<500 .................................................................................................... 1 500-999 ............................................................................................... 2 1000-2999 ........................................................................................... 3 3000-4999 ........................................................................................... 4 5000-6999 ........................................................................................... 5 700-9999 ........................................................................................... 6 >=lo, 000 ............................................................................................. 7
How long have you been aware of the Civic Center? SPECIFY PERIOD IN MONTHS
3 . Please specify the source of awareness about the use of Civic Newspaper .......................................................................................... 1 Center . Television ........................................................................................... 2 1

......................................... .......................................... citizen's charter? Rarely Rarely 2 Sometimes .................................. Sometimes ................................... 3 Very often. .................................. Very often. ................................... 4
Please estimate the degree to which Government Never .......................................... ........................................... functionaries can be held accountable for their actions Rarely ......................................... Rarely .......................................... 2
Sometimes .................................. Sometimes ................................... 3 Very often ................................... Very often .................................... 4 Always ........................................ Always ......................................... 5
- - - -
Is the data easily available and accessible to you?
............................. Are the rules and procedures stated clearly without ambiguity Not at all clear ............................ Not at all clear 1 and mistakes? Somewhat unclear ...................... Somewhat unclear ....................... 2
Neutral ........................................ Somewhat clear .......................... Verv clear ...................................
Please rate your understanding and awareness of decisions taken by officials
Neutral ......................................... 3 Somewhat clear ........................... 4 Verv clear ................................... .5
- - - - - -
Never .......................................... Rarely ......................................... Sometimes .................................. Very often ................................... Always .....................................
- - - -
Never ........................................... 1 Rarely ........................................ 2 Sometimes .................................. .3 Very often .................................... 4 Always ......................................... 5
9. Do you think the agency takes responsibility for the accuracy of information shared?
10. Has any suggestion or feedback ever been provided by you to officials? !
Not at all understandable ............ Not understandable .....................
........................................ Neutral Understandable ...........................
Yes Yes No .............................................. No ................................................
Not at all understandable ............. 1 ...................... Not understandable 2
......................................... Neutral 3 ............................ Understandable 4
Vew understandable ................... 1 Verv understandable ................... 5
-- 11. If yes, have you received any response to your queries from
the officials?
12. Do you feel that you have the ability to influence policies, Never .......................................... Never ........................................... 1 rules and procedures through feedback? Rarely ......................................... Rarely .......................................... 2
Sometimes .................................. Sometimes ................................... 3 Very often ................................... Very often .................................... 4 Always ........................................ Always ......................................... 5
Yes .............................................. No ...............................................
Yes ............................................... 1 No ................................................ 2
Q701. Please indicate the extent to which you agree or disagree with the following on the basis of your use experience with both the systems. Strongly Disagree- 1; Disagree-2; Neither agree nor disagree-3; Agree-4; Strongly Agree-5
1.
3.
5.
7.
9.
11.
13.
15.
17.
19.
21.
Civic S. No.
2.
4.
6.
8.
10.
12.
14.
16.
18.
-- - - -
Convenient access to service
Convenient location of centerloffice
Convenient working hours
Courteous, helpful and knowledgeable staff
Speedylefficient handling of queries
Accurate and consistent information provided by staff
Fair treatment
Predictable outcome
Good complaint handling mechanism --- Good service area facilities
Efficient queuing system
Ward Ward Office
Civic Center Center , Office
S. No.
Simple design and layout of forms
Clear language used in forms and other written communication
Less time and effort required to avail service
Less cost incurred for availing service
Error free transactions
Less corruption
No need for agents
Greater transparency
Officers can be held accountable
------
--
I
20.
22.
Clear and simple processes and procedures
Confidentiality is protected --

24 . Overall. do you prefer the Civic Center or the Ward Office? Civic Center .............................................................................. 1 I I Ward Office ....................................................................... 2
m m m 1 23 .
Please indicate the extent to which you agree or disagree with the following statements:
The Knowledge Society
Among the above 22 factors. please list the three factors that you consider as the most important . RECORD THE S.NO FROM I TO 22
25 . To what extent do you agree (after seeing the Civic Center in operation) that Information Technology I computerization can be used to give better citizen service?
1 . Strongly disagree ..................................................................... 1 Disagree ..................................................................................... 2 Neither agree not disagree ...................................................... 3 Agree ......................................................................................... 4 Strongly agree ........................................................................... 5
Strongly disagree .................................................................... 1 Disagree ..................................................................................... 2 Neither agree not disagree ........................................................ 3 Agree ......................................................................................... 4
........................................................................... Strongly agree 5
Strongly disagree ...................................................................... 1 disagree .............................................................................. 2 Neither agree nor disagree ........................................................ 3 Agree ........................................................................................ 4 Strongly agree ........................................................................... 5
E-governance makes a positive impact on the knowledge of the society .
2 .
/ Im~rovement in Governance I
E-governance makes a positive impact on the literacy level of the society .
-
E-governance enhances citizens' convenenience in availing government services .
Strongly disagree ....................................................................... 1 Disagree ..................................................................................... 2 Neither agree not disagree ...................................................... 3 Agree ......................................................................................... 4 Strongly agree .......................................................................... 5
EGovernance reduces corruption in delivery of public services .
EGovernance increases accountability and transparency of the government .
Strongly disagree ....................................................................... 1 Disagree ................................................................................. 2 Neither agree not disagree ........................................................ 3 Agree ......................................................................................... 4 Strongly agree ....................................................................... 5
Strongly disagree ....................................................................... 1 Disagree ..................................................................................... 2 Neither agree not disagree ......................................................... 3 Agree ......................................................................................... 4
........................................................................... Strongly agree 5
EGovernance has helped to improve the management of the public sector .
....................................................................... Strongly disagree 1 Disagree ..................................................................................... 2 Neither agree not disagree ................................................... 3
......................................................................................... Agree 4 Strongly agree ...................................................................... 5
7 .
8 .
Implementation of e-governance applications has helped to improve the image of the government .
Government should make more investments on e- governance .
Strongly disagree ................................................................. 1 Disagree ..................................................................................... 2 Neither agree not disagree ......................................................... 3
More Investment in e-Governance
1 Agree ........................................................................................ 4
Strongly disagree ............................................................................... 1 Disagree .............................................................................................. 2 Neither agree not disagree ................................................................. 3 Agree .................................................................................................. 4 Strongly agree .................................................................................... 5
Computerization of public service delivery has led to an impersonalisation of services .
Strongly agree ....................................................................... 5
Strongly agree ........................................................................... 1 Agree ......................................................................................... 2 Neither agree not disagree .................................................... 3 Disagree ............................................................................... 4 Strongly disagree ....................................................................... 5

10 .
Investments in Development Schemes versus in e-Government
11 .
More government departmentslpublic agencies should be computerized .
Strongly disagree ................................................................................ 1 Disagree .............................................................................................. 2 Neither agree not disagree .................................................................. 3
Computerisation of Government Departments is a waste of resources for a country like India .
12 .
Strongly agree ..................................................................................... 1 Agree .................................................................................................. 2 Neither agree not disagree .................................................................. 3 Disagree .............................................................................................. 4 Strongly disagree ................................................................................ 5
Agree .................................................................................................. 4 ..................................................................................... 1 Strongly agree 5
Strongly agree ..................................................................................... 1 Agree .................................................................................................. 2 Neither agree not disagree .................................................................. 3 Disagree .............................................................................................. 4
................................................................................ Strongly disagree 5
13 .
Money spent in e-governance should be used for other government activities .
Building of schools. dispensaries and roads is more beneficial than investing in e-governance projects .
15 . Computerisation of Government services benefits only the Strongly agree ..................................................................................... 1 rich and influential . Agree .................................................................................................. 2
Neither agree not disagree .................................................................. 3 Disagree .............................................................................................. 4 Strongly disagree ................................................................................ 5
16 . Computerisation of Government services benefits only the Strongly agree ..................................................................................... 1 urban people . Agree .................................................................................................. 2
Neither agree not disagree .................................................................. 3 Disagree .............................................................................................. 4
................................................................................ Strongly disagree 5
Strongly agree ..................................................................................... 1 Agree ................................................................................................. 2 Neither agree not disagree .................................................................. 3
.............................................................................................. Disagree 4 Strongly disagree ................................................................................ 5
. .
Digital Inclusion
14 .
ADDITIONAL INFORMATION: PLEASE ASK THE RESPONDENT IF HEISHE WOULD LIKE TO MAKE ADDITIONAL COMMENTS ON THE CIVIC CENTER. MANUAL SYSTEM OR COMPUTERISATION IN GENERAL . RECORD VERBATIM .
17 .
18 .
Computerisation of Government services puts the poor at a disadvantage .
..................................................................................... Strongly agree 1 Agree .................................................................................................. 2 Neither agree not disagree .................................................................. 3 Disagree .............................................................................................. 4
Rural citizens benefit greatly from computerization of Government services .
Due to e-Governance, rural and urban poverty levels have changed for the better
1 Strongly disagree ................................................................................ 5
Strongly disagree ................................................................................ 1 Disagree .............................................................................................. 2 Neither agree not disagree .................................................................. 3 Agree .................................................................................................. 4
..................................................................................... Strongly agree 5
Strongly disagree ........................................................................... 1 Disagree .............................................................................................. 2 Neither agree not disagree .................................................................. 3 Agree .................................................................................................. 4
..................................................................................... Strongly agree 5

Annex IV Profile of Respondents
Profile of Res~ondents for Client Survev-India
Illiterate
Schooled
Graduate
Number of Respondents
-- Profession
242
Average Income
Workers
Business
White Collar
Supervisor
Urban / Rural
237
90.91
4.13
1.65
3.31
Urban
Rural 67.51 29.74 100W 0.00 1 Profile of Res~ondents for Client Survev-Chile
232
Number of Respondents I 265 1 326 1 654
Nature of Clients 1 Citizens I Business 1 Business / Public Sector
253
I I I I
Education
239
Primary level
Secondary level
Technical level
University level
Postgraduate level
Urban
Rural
Workers
Businesses
White Collar
Not in emulovment . . I I I
Size of businesses Large Business
Medium-Sized Business
Small Business
Micro Business Family Enterprise
10%
9% 21%
19%
41%
5% 13%
32%
27%
23 %

Annex V Impact on Clients of Projects in India
Significance I *** I *** I *** I *** I *** 1 *** I - 7 9 9 5 8 1 - 8 1 . 3 8 1 . 3 3 . 6 3 2 9.342 . -
Travel cost saved (Rs.)
Waiting time saved 7 4.230 1- 7- 9 6 . ~ 4 T 1 8 . 4 f ~ 6 . 1 6 ~ - I
9.433 9.149
~ o t significant I *** I
Significance I *** I *** I *** 1 *** I *** I ***
Difference in overall governance score (five-point scale) -7- 7- 0 T 0 . 6 0 8 I- 0 . 7 T 0.748
S. E.
Signzjicance
Note: *** indicates significance at 99 percent confidence level
0.067
*** 0.045
* *yc

Annex VI Fact Sheets on Projects Studied
This annex contains fact sheets on each of the five projects from India for which a detailed study has been done. Each fact sheet provides details of the following:
I. Sector
11. Targeted beneficiaries
111. Project implementation start date
IV. Electronic service delivery launch date
V. Duration for which project has been delivering services
VI. Total investment in project by the agency and partnering institutions, if any
VII. Sources of funds
VIII. Annual operating expenses
IX. Economic viability of the project
X. Major services offered through the project
XI. Different channels through which service is delivered
XII. Service usage pattern of clients
XIII. Overall assessment of the application by the client
XIV. Impact on client
XV. Impact on agency
XVI. Frequency of system breakdown and duration for recovery

Bhoomi, Karnataka, India I. Sector
Rural Land Record Delivery
11. Targeted beneficiaries
6.7 million farmers of the state spread across 27 districts (203 subdistricts) of the state.37
111. Project implementation start date
February 6 , 2 0 0 1 ~ ~
ZV. Electronic service delivery launch date
The first RTC information kiosk center started on February 6, 2001, in the Maddur taluka of Mandya By the end of March 2002, the computerization of land records was completed for 177 talukas.
Presently, there are 203 Bhoomi centers (one in each taluka) operating in the state.
V. Duration for which project has been delivering services
More than four years
VZ. Total investment in project
The total investment in the project is estimated at Rs. 216.348 million. The breakup of the investment in the project as of March 3 1,2006 is given below:
VZZ. Sources offunds
The entire initial investments for the project had been provided by the Ministry of Rural Development, Government of India, under the scheme of Computerization of Land Records. The scheme has been implemented with the support of the National Informatics Centre, which has developed the software for Bhoomi project. The ministry has provided funds for Bhoomi in various installments for various purposes, namely for data entry, back-end computerization, training, computer purchase, and upgrading infrastructure. As per information provided by Bhoomi Monitoring Cell, till March 1, 2006, the central government has provided Rs 270 million for the Bhoomi Project. Additional components in the scheme that were not funded by the Government of India have been funded by the Karnataka state government, which has provided Rs 64.4 million. Apart from this, the Ministry of Communication and Information Technology, Government of India, has provided a pool of Rs 50 million to set up a state data center at Bangalore. This data center, however, is not exclusively for Bhoomi and can also be used by other agencies of the Government of ~ a r n a t a k a . ~ ~
37 Lobo, A., and S. Balakrishnan,(2002) "Draft Report Card on Service of Bhoomi Kiosks." Public Affairs Centre, Bangalore, India. 38 Ahuja, A., and A. P. Singh (2006). "Evaluation of Computerization of Land Records in Karnataka." Economic and Political Weekly, January 7, 69-71. 39 3i Infotech Limited Summary Assessment Report of e-Governance Project: Bhoomi, Karnataka.

VIII. Annual operating expenses
The estimated yearly operating expenses for Bhoomi for the year 2005 is Rs 159.32 million. The: breakup of the operating expenses for Bhoomi for the year 2005 is given in the following table:
Number of VAs in each Center
Number of Bhoomi Centers
- -
Consultancy Fee
FM Charges
Basic Salary of VA (Rs 3,000- 15,450) I 5,450.00 I
Cost (Rs million)
20.31
DA ((349% of Basic)
HRA (@ 13% of Basic)
Electricity BilVDiesel
Hiring Charges
4.43
0.15
Total Monthly Salary
Annual Salary of each VA
Antiglare Glass Purchase
Bhoomi Phone Bill
Repairs, Servicing of Printers I 0.01
0.02
0.20
I RTC Forms I 0.0 L I Accessories Purchased
TADA to Consultant
Stationem
I Total Annual Salarv o f VAs I Rs 86.03 million I
Kiosk Cleanliness
VSAT Pavment
0.06
38.19
ZX. Economic viability of the project The ratio of investment by the agency to the cumulative number of transactions for four years works out to Rs 5.613, and the annual operating expense per transaction is Rs 12.252.
Total
X. Major services offered through the project
The major services offered through the Bhoomi project are as follows:
Issuance of RTC on payment of specified service charges,
73.29
Acceptance of requests for mutations,
Mutation of land records,
Issuance of khata and Tax information to the villagers on payment of specified service charges, and
Display of land records information to the farmers through touch-screen kiosks.
Support and maintenance of hardware, and networking, is provided by the MIS HCL Systems,. At each district, a district consultant has been appointed on a contractual basis to provide maintenance support during hardware breakdowns.
XI. DifSerent channels through which service is delivered The Bhoomi application is comprised of two delivery channels to provide services to the citizens. The services offered to the citizens through each of the delivery channels are presented below:
Bhoomi computer centertkiosk: Bhoomi computer centers are located at each taluk office where mutation and updating are done online. It includes fingerprint authentication and scanning of important documents to ensure robust and secure systems. Each Bhoomi center at taluk offices also se:rves as a kiosk from where the farmers can collect the copy of their records (RTC, Khata extracts, and tax information).
Touch-screen kiosks: At touch-screen kiosks, farmers can see their land-related information without anybody's intervention or help. At present, there are about 22 touch-screen kiosks situated at taluka offices.
The entire software, including the user interface, is in the vernacular language (Kannada). All the taluka
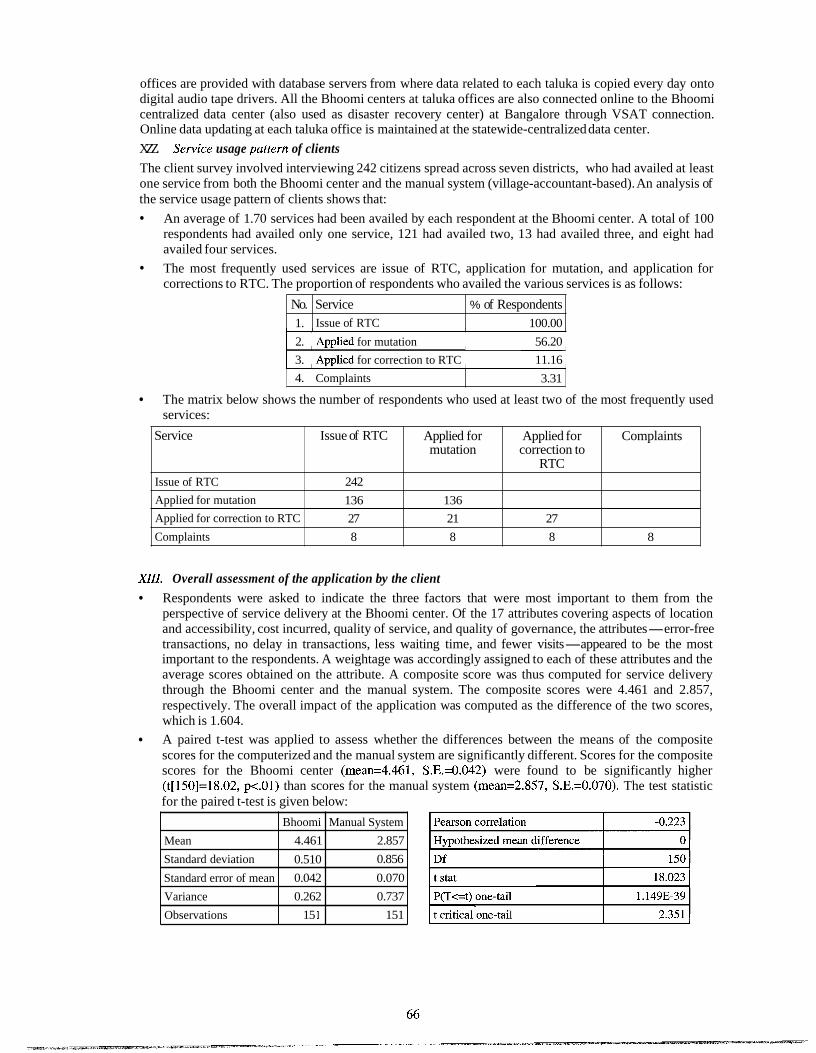
offices are provided with database servers from where data related to each taluka is copied every day onto digital audio tape drivers. All the Bhoomi centers at taluka offices are also connected online to the Bhoomi centralized data center (also used as disaster recovery center) at Bangalore through VSAT connection. Online data updating at each taluka office is maintained at the statewide-centralized data center.
XZZ. Service usage pattern of clients
The client survey involved interviewing 242 citizens spread across seven districts, who had availed at least one service from both the Bhoomi center and the manual system (village-accountant-based). An analysis of the service usage pattern of clients shows that:
An average of 1.70 services had been availed by each respondent at the Bhoomi center. A total of 100 respondents had availed only one service, 121 had availed two, 13 had availed three, and eight had availed four services.
1 2. 1 A ~ d i e d for mutation I 56.20 1
The most frequently used services are issue of RTC, application for mutation, and application for corrections to RTC. The proportion of respondents who availed the various services is as follows:
1 3. 1 A ~ ~ l i e d for correction to RTC I 11.16 1
No. 1.
Service Issue of RTC
4. 1 Complaints
XIII. Overall assessment of the application by the client
Respondents were asked to indicate the three factors that were most important to them from the perspective of service delivery at the Bhoomi center. Of the 17 attributes covering aspects of location and accessibility, cost incurred, quality of service, and quality of governance, the attributes-error-free transactions, no delay in transactions, less waiting time, and fewer visits-appeared to be the most important to the respondents. A weightage was accordingly assigned to each of these attributes and the average scores obtained on the attribute. A composite score was thus computed for service delivery through the Bhoomi center and the manual system. The composite scores were 4.461 and 2.857, respectively. The overall impact of the application was computed as the difference of the two scores, which is 1.604.
A paired t-test was applied to assess whether the differences between the means of the composite scores for the computerized and the manual system are significantly different. Scores for the composite scores for the Bhoomi center (mean=4.461, S.E.=0.042) were found to be significantly higher (t[150]=18.02, p<.01) than scores for the manual system (mean=2.857, S.E.=0.070). The test statistic for the paired t-test is given below:
% of Respondents 100.00
3.31
Service
Issue of RTC
Applied for mutation
Applied for correction to RTC
Complaints
The matrix below shows the number of respondents who used at least two of the most frequently used services:
Issue of RTC
242
136
27
8
Mean
Standard deviation
Standard error of mean
Variance
Observations
Applied for mutation
136
21
8
Bhoomi
4.461
0.510
0.042
0.262
15 1
Manual System
2.857
0.856
0.070
0.737
151
Applied for correction to
RTC
27
8
Complaints
8

XIV. Impact on client
The respondents were also asked to provide their choice for the kind of system they preferred; that is, Bhoomi (computerized) or the manual system. The choices of the respondents indicated that 79.34 percent of the respondents preferred the Bhoomi system as compared to the manual system. It was also observed that the respondents belonging to the category of urban cultivator seemed to prefer the manual system. Nearly 61 percent of the respondents belonging to this category preferred the manual system. An interaction tree was constructed taking preference for the system (computerized or manual) as a d.ependent variable. The independent variables comprised of the variables that indicated user profile (occupation, income, and urban or rural status).
The differences on factors pertaining to the cost of availing service, governance, service quality, and error rate between the Bhoomi center and the manual system are:
I I R T C IKSZ I Service Quality I 1 D i r r in overall score (five- 1 1:Hl: 1 1:14: 1 point scale)
I Significance I *** I *** I I Error rate (%) I I 1 I Manual 13.311 1.521
Computerized 1 8.26 1 0.74 1
XV. Impact on agency
1 Mutation I n.a. I 0.29 1 0.89 1 1.03 1
Increased transaction volume and revenue collection
2002 1 2003 1 2004 1 Number of Transactions (million)
1 Total I 6.56 1 8.62 1 10.36 1 13.00 /
RTC
I Revenue from Fees (Rs. Million) 1
6.56 1 8.32 1 9.48 1
RTC 98.34 1 124.86 1 142.16 1 1 7 9 . d
Mutation
Total
0.00
98.34
10.24
135.10
3 1.04
173.20

XVI. Frequency of system breakdown and duration for recovery
A survey of 24 operators of the Bhoomi application from nine locations was conducted to gather data pertaining to frequency of breakdown of Bhoomi and of the supporting infrastructure, and the time required for recovery from such system failures. The results of this survey are given in the following table:
Frequency of breakdown
All the time I 0.00 1 0.00 1 0.00 1 0.00 1 0.00
Power Supply Breakdown
(% respondents)
1 Never 1 0.00 1 33.33 1 41.67 1 58.33 1 95.83 1
Connectivity Breakdown
(% respondents)
Sometimes
Rarely
Less than a month I
Slow Response (%
respondents)
66.67
12.50
Tirne required to rectify
Few days 1 12.50 1 0.00 1 0.00 1 40.00 1 0.00 1
More than a month
Computer HW Failure
(% respondents)
37.50
25.00
Software Failure
(% respondents)
0.00
Few hours
Few minutes
25.00
25.00
0.00
62.50
25.00
4.17
16.67
0.00
4.17
0.00
56.25
43.75
0.00
64.29
35.71
0.00
60.00
0.00
100.00
0.00

Figure XIII. Interaction Tree-Preference for Computerized/Manual System Based on User Profile
Q701 .Proffered Bhoomi center or Village N C
I 1 BHOOMl I I B VlLLqGEA C I L _ - - _ _ - - - I
I Q204.0ccupation
Adj. P-value=0.000, Chi-square=32.774,
I Node 1
Total 12.1 29
I
I Node 2 1 Node 3
Cateqo H ' B H ~ O @ \ :':<1&-61.8 .& l VILLAGE A C 38.4 33
Total 36.0 86 i 1 Total 51.9 124 1
Q209.Monthly ~ o k e h o l d Income Adj. P-value=O.O82, Chi-square=6.702,
df=3
'i' Node 4
category - % n
l VILLAGEAC 12.0 3
Total 10.5 25
I U
UrbanIRural Adj. P-value=O.O26, Chi-square=4.978,
df=l
r%i BHOOMI I VILLAGE A C 61 .t
Total 7 5 18

Karnataka Valuation and E-Registration (KAVERI), India I. Sector Stamp Duty and Registration
II. Targeted beneficiaries
Citizens residing in the state of Karnataka spanning an area of 191,791 square kilometers. The total population across the 27 districts of the state is 52,850,562 and comprises 26,898,918 males and 25,95 1,644 fern ale^.^'
ZII. Project implementation start date
December 2003
N. Electronic service delivery launch date The first KAVERI center was launched in the Rajajinagar subregistrar office (SRO) in the Bangalore district41 in 2003. The project was launched in all the other districts by December 2003.~'
V. Duration for which project has been delivering services
Three years
VI. Total investment in project
The software development and maintainence is being done by C-DAC, Pune. The cost of development of the software is Rs 10.1 million. ECIL and CMS are the service providers for the 203 KAVERI centers (SROs). The investment of the service providers (ECIL and CMS) over a period of five years is estimated at Rs 400 million in the hardware, data entry, and furniture for the KAVERI system.43 Thus, the total estimated investment on KAVERI is Rs 410 million. The breakup of the investments done by the private operators on the hardware and the implementation of the utility are presented below:
40 htt~://www.indiastat.com, accessed on September 26,2006. 41 "KAVERI Ready for Mid-August Launch" (July 9, 2003). The Hindu. Accessed September 26, 2006, from http://www.hinduonnetcom/2003/07/09/stories/ 42 "ECIL develops e-governance project for Karnataka" (December 17, 2003). Businessline. Accessed on September 26,2006, from http://www.blonnet.com/2003/12/17/stories/20O3121702131700.htm 43 Scoring yet another first with online property registration (December 27, 2004). Financial Express. Accessed September 26, 2006, from http://www.financialexpress.com/fe~fulI~story.php?content~id=77977

- - I Cost (Rs)
HARD WARE 1 Database server 1 3,427,000 1 1 Work stations 1 24,353,800 1 1 Printers and scanners 1 13.068,OOO 1
1 Miscellaneous 1 96,000,000 1
. -- - - - -
Networking devices, including switches, etc.
Genets
1,841,400
6,658,000
1 Total cost o f implementation (B) 1 26,148,569 1
Total Hardware cost (A)
1 Total Cost (A+B) ( 179,231,7691
153,083,200
VZZ. Sources offunds
IMPLEMENTING AGENCY Site preparation (civil works, cabling, electrical, furniture) 22,648,569
Miscellaneous 3,500,000
KAVERI operates on a build-operate-transfer (BOT) basis. The software for the utility has been provided by the department (developed by C-DAC) at a total cost of 23 million. The responsibility of the service provider is to provide, install, and commission all the hardware and peripherals required to meet the desired service standards; provide furniture as per standard design and layout; provide consumables as per requirement; keep the setup at all locations functional; and install all requisite software at various locations necessary. In addition, the agency also provides support labor at the front end that handle data entry; scans the original registered document; creates archives on CDs at regular predetermined intervals; and other related activities such as capturing thumbprints with a thumbprint scanner, digital signature, photographs of parties with digital (computer-attached) cameras, etc. The service providers are allowed to charge Rs 30 per page as a scanning fee from the public, and must remit Rs 5 to the government.
VZZZ. Annual operating expenses
Details of annual office expenses and salaries and allowances of officers and staff of all SR.Os are as given below (departmental operating expenses):
1 2000- I 2001- 1 2 0 0 2 1 2003- 1 2 0 0 4 - r n
I Total ofice expenses (Rs Million) 1 5.261 7.031 5.871 14.641 9.681 16.021
Rents and expenses on building (Rs million)
Electricty & water (Rs million)
Phone & postage (Rs million)
Stationery (Rs million)
Other expenditure (Rs million)
3.22
1.08
0.01
0.19
0.77
Gross salary of officers & staff (including allowance) (Rs
(including transfer grants) (Rs million)
Total of salaiy & allowances (Rs million)
Total expenditure (Rs million)
3.19
1.16
0.25
0.62
1.81
73.32
0.13
* Table below presents the operating expenses of the private operators for the year 2005:
73.44
78.71
3.24
1.12
0.35
0.24
0.93
0.91
82.38
89.42
9.92
1.61
0.62
0.56
1.93
S l . 4 8 8 2 . 3 8
0.16
82.54
88.40
~ -
4.3.5
2.310
0.42
92.19
0.20
92.39
107.02
- -
10.56
2.65
0.19
93.95 1 9;::; 1 0.12
0.5
2.04 2.27

through the KAVERI center rather than through the manual SRO.
Travel cost saved (Rs) 1 116.684 S.E. 1 18.103
The differences on factors pertaining to cost of availing service, governance, service quality, and error rate between the KAVERI center and the manual SRO are tabulated below:
Cost Number of trips saved 1.200
Waiting time saved (minutes) S.E.
S i g n i f i c a n c e
62.915 7.003 ***
Governance Difference in overall score (five-point scale)
S.E. Significance
Proportion paying bribes (%)
document (days) - Manual 1 11.32
0.190 0.045 ***
Manual Computerized
Mean time elapsed from date of application to receipt of
34.32 21.61
XV. Impact on agency
Coinputenzed
Increased transaction volume and revenue collection for the government and the private operator:
5.23 Preference for computerization (%) 1 98.31
Search applications 0.72 1 0.79 ( 0.82 1 0.99 1.22 1.291
Number of transactions (million)
Certified applications 1 0.14) 0.141 0.15 1 0.16 1 0.13 1 0.16
Documents registered
----
Reduction in cost per transaction:
1 2000-01 1 2001-02 1 2002-03 1 2003-04 1 2004-05 1 2005-06 1
0.77 0.63
Stamp duty collected (Rs. million) 16,144.37 17,433.81 19,033.16 1 12,015.76 1 14,904.29 1 19,245.07
Revenue from Fees (Rs. Million)
Registration of documents - Copying/comparing/filing
Scanning
SA fee
CA fee
Other fee
Total fee
Government's earning from fee (Rs. million) Private onerator's earning from fee (Rs. million1
0.78
Total expenditure (Rs. million)
Total fee (Rs. million) Total expenditure/otaee (%)
0.97 1 1.16 1 1.02
1,244.43
48.93
0.65
97.40
15.58
0.00
1,406.98
1,406.44
0.54
78.71
1406.98
5.59
1,363.75
52.88
0.55 -.
65.39
14.58
0.00
1,497.14
1,496.68
0.46
89.42
1497.14
5.97
1,941.68
6.45
229.34
112.26
84.84
6.64
2,381.22
2,218.89
162.32
2,259.22
6.85
219.90
120.67
20.31
0.00
2,626.95
2,467.25
159.70
1,733.94
68.11
0.38
72.55
15.48
0.00
1,890.46
1,890.14
0.32
88.40
1890.46
4.68
1,404.54
60.71
68.11
92.69
20.80
5.39
1,652.24
1,600.49
51.75
107.02
1652.24
6.48
103.74
2381.22
4.36
111.13
2626.95
4.23

XVI. Frequency of system breakdown and duration for recovery
A survey of 22 operators at KAVERI centers across 7 districts was conducted to gather data pertaining to the frequency of breakdown of the application and of the supporting infrastructure, and the time required for recovery from such system failures. The results of this survey are given in the following table:
l often I 4.55 1 0.00 1 0.00 1 0.00 I 0.00 I
Power Supply Breakdown
(% respondents)
1 Never I 4.55 1 63.64 1 77.27 1 86.36 1 81.82
Frequency of Breakdown
All the time 1 0.00 1 0.00 1 0.00 1 0.001 &I Connectivity Breakdown
(% respondents)
-
Sometimes
( Rarely
Slow Response (%
respondents)
59.09
31.82
Time Required to Rectify
i Few davs I 0.00 1 0.00 1 0.00 1 66.67 1 50.00 1
Less than a month
Computer HW Failure
(% respondents)
22.73
13.64
More than a
Software Failure
ri:spondents)
1 month 0.00
0.00
Few hours
Few minutes
22.73
0.00
0.00 0.00
-
13.64
0.00
0.00
14.29
85.71
0.00
25.00
75.00
40.00
60.00
50.00
0.00

Computer-Aided Administration of Registration Department (CARD), Andhra Pradesh, India
I. Sector
Property Registration
ZZ. Targeted beneJiciaries
Rural and urban property owners across the 23 districts of the state of Andhra Pradesh. CARD can be considered more relevant to the rural fanning community, since 60 percent of the documents registered, Encumbrance Certificates (ECs), and certified copies issued relate to agricultural properties.45
111. Project implementation start date The project was originally conceived in August 1996.
N. Electronic service delivery launch date
The pilot sites were inaugurated on August 8, 1997, and September 9, 1997. The CARD project was extended to 212 SROs in November 1998, and is currently functioning at 387 SROs in the state.46
V. Duration for which project has been delivering services Eight years
VZ. Total investment in project The total project cost (including hardware, software, training, site preparation, data entry, air conditioners, furniture, stationery and storage media, CARD software training, and other miscellaneous expenses) is Rs 300 million. The pilot project for computerizing two SROs cost about Rs 2.37 million. Approximately Rs 15.5 million was sanctioned in September 1997 for extending the project to 212 other sites. A training program for different categories of officers (75 data processing officers, 1,200 data entry operators) was carried out by a private sector company at a cost of US$262,000.
VZZ. Sources offunds
The cost of the CARD project was borne entirely by the Government of Andhra Pradesh.
VZZZ. Annual operating expenses The annual expenditure of the department for maintenance of CARD for the period 2000 to 2005 is given below:
ZX. Economic viability of project
The ratio of investment by the department to the cumulative number of transactions for four years works out to Rs 95.942, whereas the annual operating expense per transaction is Rs 62.469.
Expenditure on maintenance of CARD (Rs million)
45 Satyanarayana, J. (2000). "Computer-aided registration of deeds and stamp duties." In Information and Communication Technology in Rural Development, ed. Subhash Bhatnagar and Robert Schware, 48-65. World Bank Institute, http://unpanl.un.org/ 46 IT and Communications Department, Government of AP (2004). Profiles of IT Projects.
2000-01
9.93
2001-02 7.00
2005-06 64.50
2002-03 3.64
2003-04
55.02 2004-05
71.02

X. Major services offered through the project
CARD stores master and transactional data pertaining to value of all the land within the SRO's jurisdiction, survey numbers of agricultural properties, house numbers of residential and commercial properties, list of villages falling w i t h the jurisdiction of the SRO, registration, stamp sales, ECs, and images of registered documents. The major services provided through the application are:
Registration of documents pertaining to sale; mortgage; gift; partition; release; exchange; lease; rectification, ratification, and cancellation of deed of both movable and immovable properties; and collection of registration fee.
Issue of ECs-An EC is a document listing the transactions that occurred in relation to a property over a period of 13 years preceding the date of application for the certificate. It is required Iby financial institutions before granting a loan on the mortgage of a property and also by prospective plurchasers of property to ascertain the nature of charges on the property.
Issue of certified copies of registered documents-Documents that are registered are scanned and the images are stored on CDs for the purpose of preservation and archiving. These electronic documents can be retrieved, printed, and certified by the subregistrar whenever required.
Issue of market-value check slips to help citizens ascertain the market value rates (per acrefsquare yard) of agricultural, residential, and commercial properties and to estimate the applicable stamp duty.
Issue of document writer 1icensesDocument writers are individuals (professional document writers, advocates, and solicitors) who prepare the maps and location sketches to describe the property, fill in various forms, and assist citizens in procuring certificates from the department.
Sale of stamp paper, maintenance of accounts and indexes-The CARD database maintains an inventory of the different denominations of stamps, the sale of stamps, and accounts relating to all monetary transactions that take place at the SRO.
XI. Different channels through which service is delivered About 80 percent of all transactions carried out at the subregistrar offices is done through CARD. The Registration & Stamps Department has also hosted a Web site to provide citizens online access to data pertaining to the market value of property across 387 SROs, and a document-writing service for generating documents pertaining to registration in the required formats.
X I . Service usage pattern of clients The client survey involved interviewing 232 citizens who had availed any service (primarily registration of property) through any of the selected eight SROs after the implementation of CARD as well as through the manual system in the past. An analysis of the service usage pattern of clients shows that:
An average of 3.13 services had been availed by each respondent at the computerised SRO. A total of 60 respondents had availed only one service, 11 had availed two, 45 had availed three, 80 had availed four, 29 had availed five, and seven had availed six or more services.
The most frequently used services are registration of property purchase, getting a copy of a registered deed, ascertaining the stamp duty payable, and obtaining a nonencumbrance certificate. The proportion of respondents who availed the various services is:

The matrix given below shows the number of respondents who used at least two of the most frequently used services:
XZZZ. Overall assessment of the application by the client Respondents were asked to indicate the three factors that were most important to them from the perspective of service delivery at the SRO. Of the 18 attributes covering aspects of location and accessibility, cost incurred, quality of service, and quality of governance, the attributes-less time and effort required, less waiting time, less corruption, equal opportunity to all-appeared to be the most important to the respondents. A weightage was accordingly assigned to each of these attributes and the average scores obtained on the attribute. A composite score was thus computed for service delivery through the computerized and manual SROs. The composite scores were 3.929 and 3.775, respectively. The overall impact of the application was computed as the difference of the two scores, which is 0.153.
Service
Registration of property purchase
Getting a copy of a registered deed
Ascertaining the stamp duty payable
Obtaining a Nonencumbrance certificate
A paired t-test was applied to assess whether the differences between the means of the composite scores for the computerized SRO and the manual SRO are significantly different. Scores for the composite scores for the computerized SRO (mean=3.929, S.E.=0.025) were found to be significantly higher (t[231]=5.724, pe.01) than scores for the manual SRO (mean=3.775, S.E.=0.032). The test statistic for the paired t-test is given below:
Getting a Copy of a Registered Deed
143
101
103
Registration of Property Purchase
230
143
121
113
Ascertaining the Stamp Duty
Payable
123
88
Mean
Standard deviation
Standard error
Variance
Number of observations
XZV. Impact on client The results of the client survey indicate that 96.98 percent of the respondents preferred service delivery through the computerized SRO to the manual SRO.
The differences on factors pertaining to cost of availing service, quality of service, and quality of governance between the computerized and manual SROs are:
Obtaining a Nonencumbrance
Certificate
114
Pearson correlation
Hypothesized mean difference
D f
t stat
P(T<=t) one-tail
t critical one-tail
0.593
0
23 1
5.724
1.604E-08
2.343
Computerized SRO 3.929
0.383
0.025
0.148
232
Manual SRO
3.775
0.493
0.032
0.244
232
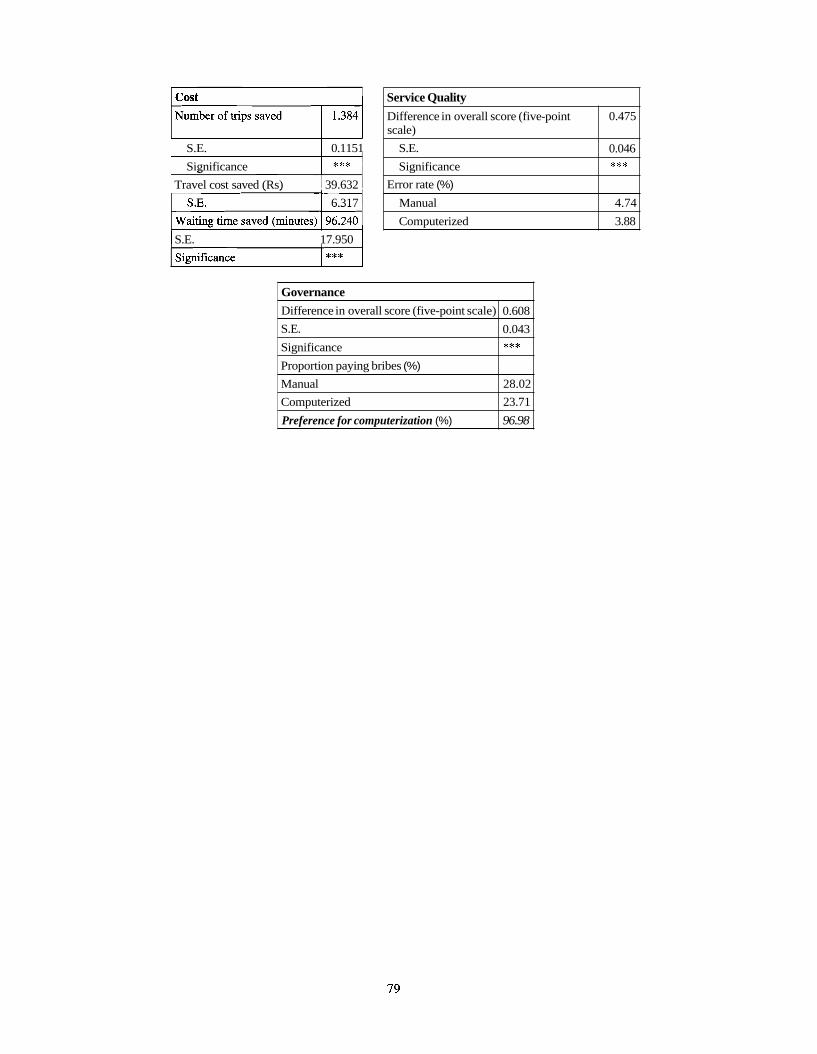
1 S.E. 1 0.1151
Significance
Travel cost saved (Rs) 39.632
6.317
1 S.E. 17.950 1
Service Quality
Difference in overall score (five-point scale)
S.E.
Significance
Error rate (%)
Manual
Computerized
Governance
0.475
0.046 ***
4.74
3.88
Difference in overall score (five-point scale)
S.E.
Significance
Proportion paying bribes (%)
Manual
Computerized
Preference for computerization (%)
0.608
0.043 ***
28.02
23.71
96.98

:uog3a1103 anuaaal pue auIn1oa uog~esueq pasaa.13~1 k2uaOv uo pvdzq .AX

Reduction in cost of collection of stamp duty and registration fees4"
1 Nature of irregularity
2004-05
1 Nu:= of I Amount (Rs million)
Percentage of expenditure to collection I
Misclassification of documents
Expenditure on collection of revenue (Rs million)
Year
Cases of irregularity and amount involved47
12,469.745
I Adoption of incorrect rate of stamp duty
Revenue collection (Rs million)
1 Undervaluation of properties 1 22 1 4.0 1
455.5
1 Incorrect exemption of duties I 32 1 0.14 1
3.65
I Short levv of s t m dutv and registration fees 1 107 1 0.50 1 I Loss of revenue because of incorrect adiustment of st am^ dutv I 12 1 1.35 1 Deficit stamp duty and registration fees on lease of tolls/build, operate, and transfer schemes 1
1 Other irregularities 1 24 1 0.13 1 1 Total 1 294 1 27.13 1
Adherence to citizen charter
Service
Issue of market value check slip
Sale of stamp paper 20 to 30 minutes I 30 minutes I 10 minutes
Time frame for service delivery as per the
citizen charter 10 minutes
I Registration of document I 1 hour 1 1 to 7 davs I 1 hour 1 I Issue of Encumbrance Certificate I 20 minutes I 1 to 5 davs I 10 mi~nutes 1
Time taken in manual system
1 hour
Time taken1 in CARD
10 mi~nutes
XVI. Frequency of system breakdown and duration for recovely
A survey of 36 operators of the CARD application from eight SROs was conducted to gather data pertaining to frequency of breakdown of CARD and of the supporting infrastructure, and the time required for recovery from such system failures. The results of this survey are given in the following table:
47 Audit Report 2004-2005 (Revenue), http://cag.nic.in/htmYcagreports/andhralrepP2OO5/
1 to 3 days 10 Znutes 1 Issue of certified copies of document
Andhra
30 minutes
Pradesh.

Less than a month
Few days
Few hours
Few minutes
0.00
2.78
44.44
52.78
0.00
0.00
44.00
56.00
0.00
0.00
3 1.82
68.18
0.00
0.00
12.50
87.50
0.00
0.00
16.67
83.33

ESeva, Andhra Pradesh, India I. Sector Citizen Services (Government-to-Consumer and Business-to-Consumer)
II. Targeted beneficiaries
Urban citizens residing in major towns of the 23 districts of the state of Andhra Pradesh. Nearly 3.1 million transactions are conducted every month across the 230 eSeva centers in 116 municipalities of the sltate.
III. Project implementation start date
ESeva was built on the success of the TWINS pilot project, which was launched in the twin cities of Hyderabad and Secunderabad in December 1999.
N. Electronic sewice delivery launch date
August 2001
V. Duration for which project has been delivering services
Five years
VI. Total investment in project
Replication to TWINS I 1
The total investment in the first two phases of eSeva was about Rs 600 million. The cost compo:nents for each eSeva center included civil construction, preparation of the site, a data center with one to three servers and routers, and about five counters provided with computers and printers. Nearly half this amount was on building and interiors, which was borne by the government. The remaining amount was bornle by the private sector partners. A breakdown of some of the capital costs incurred is as given below:
Rate (Rs million)
1 Re~lication to Districts -
I
Number I Total ~7 million)
Central Data Center (CDC)-building, interiors, and hardware eSeva Center-building and interiors Hardware development Software develo~ment~'customization
I Central District Data Center (DCD) I 4 1 21 1 84 1 1 eSeva Center 1 1 I 230 1 230 1
5 1.5
1.5
2
1 Hardware 1 0.5 ( 230 1 115 1
1
43
43
VII. Sources of funds
Funding was provided by the Government of Andhra Pradesh, the private sector partners, and various donor agencies.
2
1 Software customization
VIII. Annual operating expenses The annual operating expenses of the eSeva centers and the data centers is about Rs 168.9 milllion. A breakdown of the annual operating and maintenance costs for the data centers and the eSeva centers is given below:
5 1 51
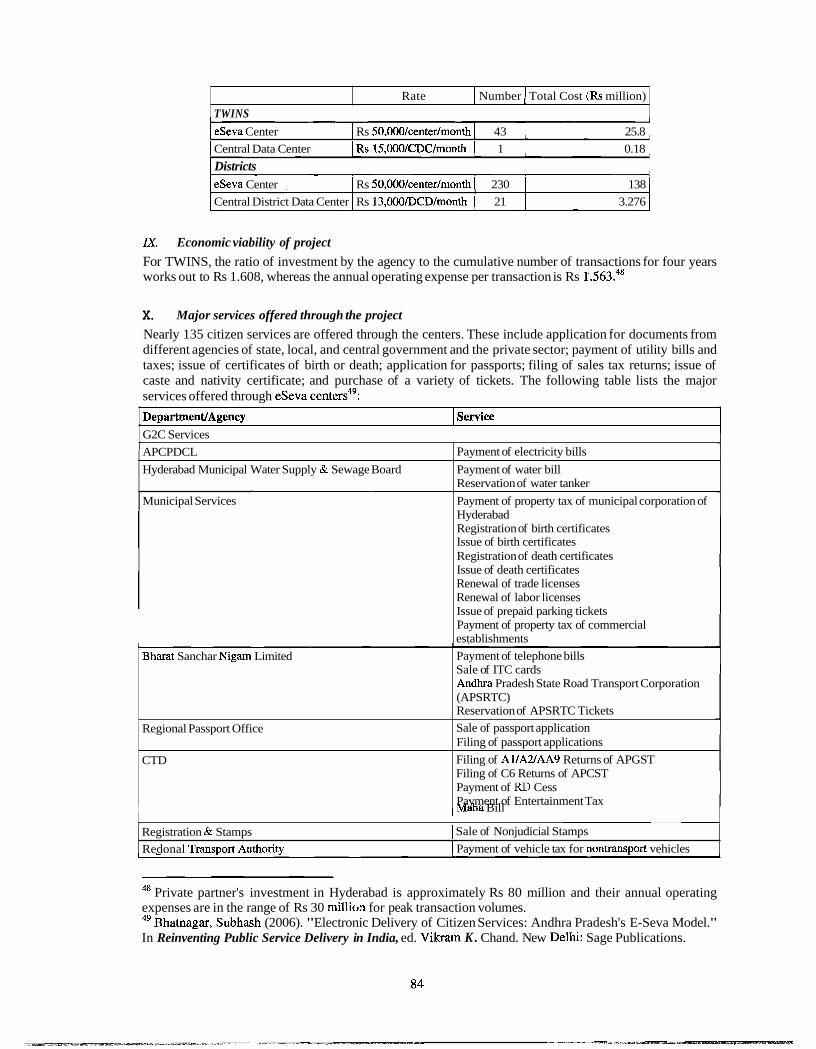
I Rate I Number 1 Total Cost (Rs million)
TWINS
1 Geva Center I Rs 50.000/center/month 1 43 1 25.8 1 1 Central Data Center IRs15.000/CDC/month I 1 1 0.18 1 1 Districts 1 I eSeva Center I Rs 50,00O/center/month 1 230 1 138 1 I Central District Data Center I Rs 13,000/DCD/month ( 21 1 3.276 1
ZX. Economic viability of project
For TWINS, the ratio of investment by the agency to the cumulative number of transactions for four years works out to Rs 1.608, whereas the annual operating expense per transaction is Rs 1.563.~'
X. Major services offered through the project
Municipal Services
Nearly 135 citizen services are offered through the centers. These include application for documents from different agencies of state, local, and central government and the private sector; payment of utility bills and taxes; issue of certificates of birth or death; application for passports; filing of sales tax returns; issue of caste and nativity certificate; and purchase of a variety of tickets. The following table lists the major services offered through eSeva centers49:
DepartmentJAgency 1 service
G2C Services
Reservation of water tanker
Payment of property tax of municipal corporation of Hyderabad Registration of birth certificates Issue of birth certificates Registration of death certificates Issue of death certificates Renewal of trade licenses Renewal of labor licenses Issue of prepaid parking tickets Payment of property tax of commercial establishments
APCPDCL
Hyderabad Municipal Water Supply & Sewage Board
Payment of electricity bills
Payment of water bill
I I aha Bill I
Bharat Sanchar Nigam Limited
Regional Passport Office
CTD
Registration & Stamps I Sale of Nonjudicial Stamps
Redonal Trans~ort Authoritv I Pavment of vehicle tax for nontrans~ort vehicles
Payment of telephone bills Sale of ITC cards Andhra Pradesh State Road Transport Corporation (APSRTC) Reservation of APSRTC Tickets
Sale of passport application Filing of passport applications
Filing of Al/A2/AA9 Returns of APGST Filing of C6 Returns of APCST Payment of RD Cess Payment of Entertainment Tax
48 Private partner's investment in Hyderabad is approximately Rs 80 million and their annual operating expenses are in the range of Rs 30 million for peak transaction volumes. 49 Bhatnagar, Subhash (2006). "Electronic Delivery of Citizen Services: Andhra Pradesh's E-Seva Model." In Reinventing Public Service Delivery in India, ed. Vikrarn K . Chand. New Delhi: Sage Publications.
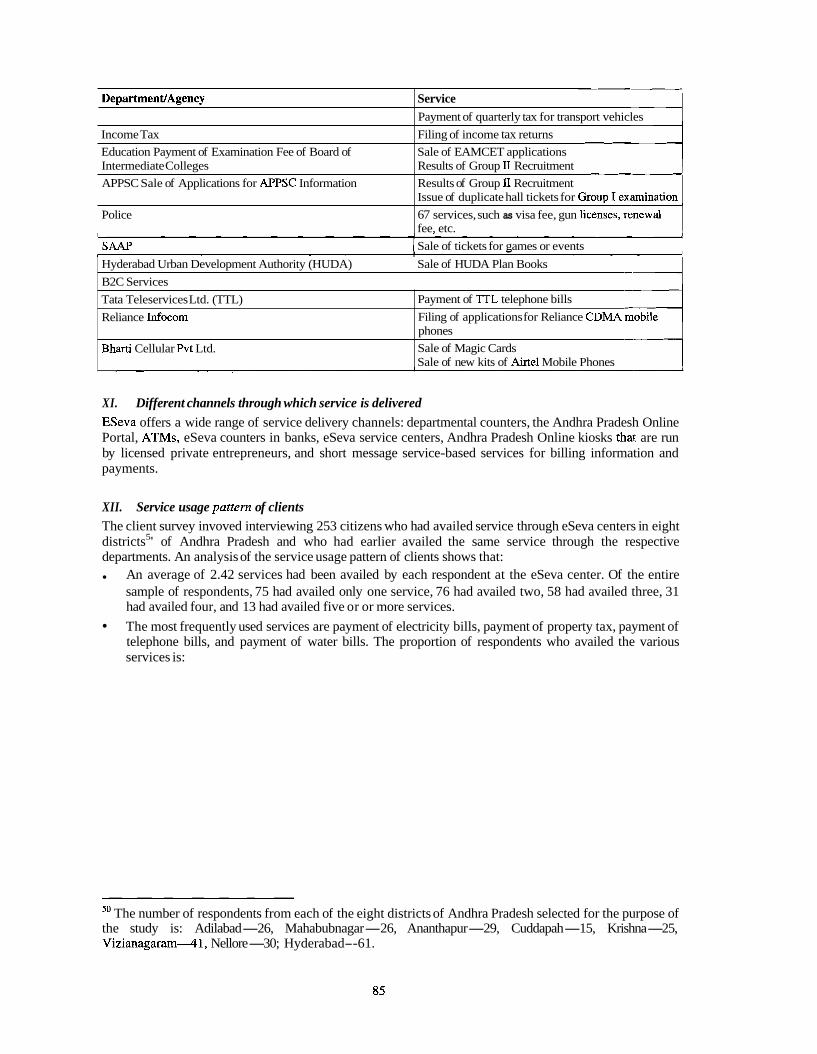
I I Sale of tickets for games or events I
DepartmentJAgency
Income Tax
Education Payment of Examination Fee of Board of Intermediate Colleges
APPSC Sale of Applications for APPSC Information
Police
Service Payment of quarterly tax for transport vehicles
Filing of income tax returns
Sale of EAMCET applications Results of Group 11 Recruitment
Results of Group I1 Recruitment Issue of duplicate hall tickets for
67 services, such as visa fee, gun fee, etc.
XI. Different channels through which service is delivered ESeva offers a wide range of service delivery channels: departmental counters, the Andhra Pradesh Online Portal, ATMs, eSeva counters in banks, eSeva service centers, Andhra Pradesh Online kiosks that are run by licensed private entrepreneurs, and short message service-based services for billing information and payments.
Hyderabad Urban Development Authority (HUDA) I Sale of HUDA Plan Books
B2C Services
XII. Service usage pattern of clients The client survey invoved interviewing 253 citizens who had availed service through eSeva centers in eight districts5' of Andhra Pradesh and who had earlier availed the same service through the respective departments. An analysis of the service usage pattern of clients shows that:
An average of 2.42 services had been availed by each respondent at the eSeva center. Of the entire sample of respondents, 75 had availed only one service, 76 had availed two, 58 had availed three, 31 had availed four, and 13 had availed five or or more services.
The most frequently used services are payment of electricity bills, payment of property tax, payment of telephone bills, and payment of water bills. The proportion of respondents who availed the various services is:
Tata Teleservices Ltd. (TTL)
Reliance Infocom
Bharti Cellular Pvt Ltd.
50 The number of respondents from each of the eight districts of Andhra Pradesh selected for the purpose of the study is: Adilabad-26, Mahabubnagar-26, Ananthapur-29, Cuddapah-15, Krishna-25, Vizianagaram--41, Nellore-30; Hyderabad--61.
Payment of 'ITL telephone bills
Filing of applications for Reliance CDMA phones
Sale of Magic Cards Sale of new kits of Airtel Mobile Phones

1 3. / Payment of BSNL bill I 34.39 1
No. 1.
2.
i 4. 1 Pavment of water bills I 33.20 / 1 5. 1 APSRTC ticket bookine 1 6.72 1
Service Payment of electricity bills Payment of property tax of Municipal Corporation of Hyderabad (MCH)
1 6. 1 Reeional Trans~ort Authoritv I 5.14 1
% of Respondents 100.00
39.53
' 7. Issue of b%h certificate -
- 8. Payment for results of examinations -- 9. Registration of birth certificate 10. Renewal of trade licenses
1 11. Registration of death certificate 1 1.19 1 1 12. 1 Payment for education I 1.19 1 1 13. 1 Issue of death certificate 1 0.79 1 1 14. 1 Renewal of labor licenses I 0.79 1 1 15. 1 Pavment of ~ro~er tv tax of commercial establishments I 0.79 1
1 20. / Sale of passport application I 0.40 1
1 16.
17.
18.
19.
The matrix given below shows the number of respondents who used at least two of the most frequently used services:
Registration and stamp Filing of income tax
Filling of passport application Issue of prepaid parking tickets
0.79
0.79
0.79
0.40
Semce
Payment of electricity bill
1 Pavment of water bill 1 84 1 40 I 41 I 84 1
Payment of property tax of MCH Payment of telephone (BSNL) bill
XIII. Overall assessment of the application by the client
Payment of electricity bill
253
Respondents were asked to indicate the three factors that were most important to them from the perspective of service delivery at the eSeva center. Of the 18 attributes covering aspects of location and accessibility, cost incurred, quality of service, and quality of governance, the attributes-less time and effort required, less waiting time, convenient time schedule, and equal opportunity to all-appeared to be the most important to the respondents. The composite scores for service delivery through the eSeva center and respective departments were 4.658 and 3.388, respectively. The overall impact of the application was computed as the difference of the two scores, which is 1.270.
100
87
A paired t-test was applied to assess whether the differences between the means of the composite scores for the eSeva center and the department are significantly different. Scores for the composite scores for the eSeva center (mean=4.658, S.E.=0.025) were found to be significantly higher (t[252]=25.669, p<.01) than scores for the department (mean=3.388, S.E.=0.041). The test statistic for the paired t-test is given below:
Payment of property tax of MCH
100
49
Payment of telephone (BSNL) bill
87
Payment of water bill

XIV. Impact on client
The results of the client survey indicate that 96.84 percent of the respondents preferred service delivery through the eSeva center rather than through the department.
Mean
Standard deviation
Standard error
Variance
Number of observations
1 Governance I
Pearson correlation
Hypothesized mean difference
df
T stat
P(T<=t) one-tail
T critical one-tail
The differences on factors pertaining to cost of availing service, governance, service quality, and error rate between the eSeva center and the departments are:
/ Difference in overall score (five-~oint scale) 1 0.794 1
ESeva Center
4.658
0.394
0.025
0.156
253
-0.087
1.421E-72
I S.E. I 0.041 1
Department
3.388
0.646,
0.041
0.419
253
Service Quality Difference in overall score (five-point scale) 0.947
S.E. 0.044
Cost
1 Sinnificance I *** (
Number of trips saved
S.E.
Proportion paying bribes (%)
Manual
Computerized
Preference for computerization (%) 96.84
0.285
0.089'
XV. Impact on agency
Significance
Error rate (%)
Manual
Significance
Increased transaction volume and revenue collection
Travel cost saved (Rs)
S.E.
9.342
2.228
Waiting S.E. time saved (minutes) 18.498 1.642 --j Computerized 1.98
XVI. Frequency of system breakdown and duration for recovery
A survey of 37 operators at eSeva centers across eight districts5' was conducted to gather data pertaining to
Significance
Year Number of Transactions
TWINS
Total Revenue from Fees (Rs million)
51 The number of operators included in the survey from eSeva centers in each of the districts is: Adilabad- 4, Mahabubnagar-4, Ananthapur--4, Cuddapah-4, Krishna-5, Vizianagaram-5, Ne:llore-5, Hyderabadd.
***
2001
289,087
289,087
1.16
2002
4,487,646
4,487,646
17.95
2003
10,062,604
10,501,908
42.01
2004
16,005,822
29,748,061
118.99
2005
19,200,000
37,016,595
203.59

1 All the time I 5.41 1 2.70 1 2.70 1 0.00 1 2.78 i
frequency of breakdown of the application and of the supporting infrastructure, and the time required for recovery from s ~ c h system failures. The results of this survey are given in the following table:
I I I I I I
1 often 0.00 1 8.11 1 5.41 1 5.56 2.78 1
I
1 Sometimes 1 27.03 1 2.70 1 8.11 1 8.33 1 2.78 1
1 Never 1 5.41 1 21.62 1 18.92 1 16.67 1 33.33 1
P S e r Supply Breakdown
(% respondents)
1 Few days I 2.86 1 0.00 1 0.00 1 0.00 1 0.00 1
Freauencv o f Breakdown
Connectivity Breakdown
(% respondents)
Less than a month
I Few hours 1 34.29 1 30.00 1 26.67 1 16.67 1 16.67 !
Slow Response (%
respondents)
0.00
Few minutes
Computer HW Failure
(% respondents)
0.00
Software Failure
(% respondents)
62.86
0.00
66.67 1 73.33
3.33
80.00 1 79.17 1
0.00

Civic Centers of Ahmedabad Municipal Corporation (AMC), Gujarat, India I. Sector
Civic Service Delivery
II. Targeted beneficiaries
Citizens residing in the 43 wards of Ahmedabad Municipal Corporation (AMC) spanning an area of 190.84 square kilometers. The total population across the five zones of the AMC is 3,515,361 and comprises 1,863,886 males and 1,651,475 females. Suburbs of 150 square kilometers with a population of about 1 million people also live on the support of AMC's civic services.52
III. Project implementation start date
January 2002
N. Electronic service delivery launch date
The first civic center was inaugurated on September 18, 2002. At present, there are 16 civic ceinters, with four more proposed in the east zone of AMC.
V. Duration for which project has been delivering services:
More than four years
Year of Service Delivery Launch
2002-03
2004-05
VI. Total investment in project
The total project cost (including computer hardware, communication equipment, and software development, but excluding civil works) was Rs 250 million.53 The hardware and networking costs for the system was Rs 25 million, while the software cost was Rs 6 million.54 The cost of establishii~g a civic center works out to Rs 2 to 2.5 million. This includes the cost of one server, eight to 10 computer nodes, and other infrastructure.
Name of Civic Center
Law Garden, Memco, Mani Nagar, Rakhial, Usmanpura, Sardar
Relief Road, Nava Vadaj, Sardar Nagar, Vasna, Bage Firdosh, Muthia. Saras~ur. Isan~ur
VII. Sources offunds
The entire initial investment for the project had been provided by the Government of Gujarat, which had made a provision of Rs 50 million for e-governance during the year 2002-03. Gujarat 1nform;atics Ltd., which is the nodal agency for IT development in the state, initiated the project and provided a grant of Rs 10 million for the software. The annual budget of the AMC provides for any additional funhng that is required.55
52 Source: Web site of Ahmedabad Municipal Corporation. http://www.egovamc.com 53 Tripathy, R. K., and Mahajan, Dilip (2004)Cily Civic Centres and E-Governance, Ahmedabad, India. Available on http://www.solgm.co.nz 54 Centre for Electronic Governance, IIMA (2004) Evaluations of e-Governance Projects. Available at http://www.iimahd.ernet.in/egov/ 55 Panneervel, P., (2005) "Urban e-Governance." In E-Governance: A Change Management Tool, 131-160. Jaipur, Inha: Rawat Publications.
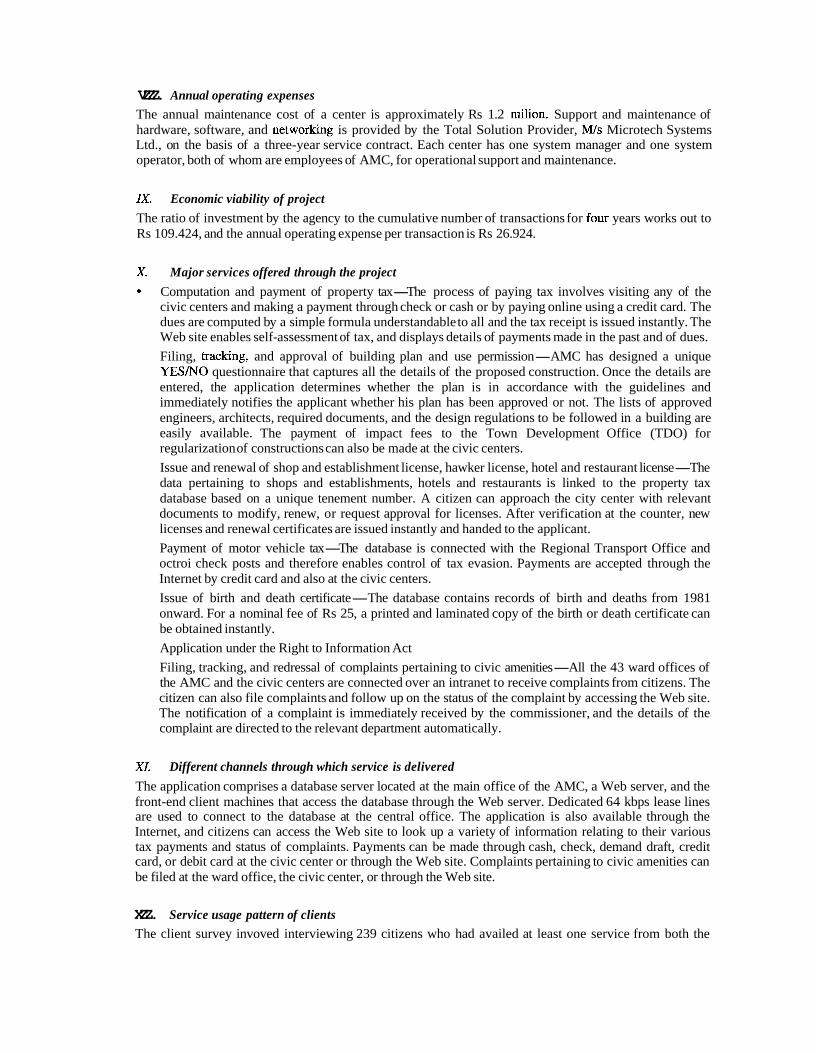
VZZZ. Annual operating expenses
The annual maintenance cost of a center is approximately Rs 1.2 milion. Support and maintenance of hardware, software, and networking is provided by the Total Solution Provider, M/s Microtech Systems Ltd., on the basis of a three-year service contract. Each center has one system manager and one system operator, both of whom are employees of AMC, for operational support and maintenance.
ZX. Economic viability of project
The ratio of investment by the agency to the cumulative number of transactions for four years works out to Rs 109.424, and the annual operating expense per transaction is Rs 26.924.
Major services offered through the project
Computation and payment of property tax-The process of paying tax involves visiting any of the civic centers and making a payment through check or cash or by paying online using a credit card. The dues are computed by a simple formula understandable to all and the tax receipt is issued instantly. The Web site enables self-assessment of tax, and displays details of payments made in the past and of dues.
Filing, tracking, and approval of building plan and use permission-AMC has designed a unique YESNO questionnaire that captures all the details of the proposed construction. Once the details are entered, the application determines whether the plan is in accordance with the guidelines and immediately notifies the applicant whether his plan has been approved or not. The lists of approved engineers, architects, required documents, and the design regulations to be followed in a building are easily available. The payment of impact fees to the Town Development Office (TDO) for regularization of constructions can also be made at the civic centers.
Issue and renewal of shop and establishment license, hawker license, hotel and restaurant license-The data pertaining to shops and establishments, hotels and restaurants is linked to the property tax database based on a unique tenement number. A citizen can approach the city center with relevant documents to modify, renew, or request approval for licenses. After verification at the counter, new licenses and renewal certificates are issued instantly and handed to the applicant.
Payment of motor vehicle tax-The database is connected with the Regional Transport Office and octroi check posts and therefore enables control of tax evasion. Payments are accepted through the Internet by credit card and also at the civic centers.
Issue of birth and death certificate-The database contains records of birth and deaths from 1981 onward. For a nominal fee of Rs 25, a printed and laminated copy of the birth or death certificate can be obtained instantly.
Application under the Right to Information Act
Filing, tracking, and redressal of complaints pertaining to civic amenities-All the 43 ward offices of the AMC and the civic centers are connected over an intranet to receive complaints from citizens. The citizen can also file complaints and follow up on the status of the complaint by accessing the Web site. The notification of a complaint is immediately received by the commissioner, and the details of the complaint are directed to the relevant department automatically.
XI. Different channels through which service is delivered
The application comprises a database server located at the main office of the AMC, a Web server, and the front-end client machines that access the database through the Web server. Dedicated 64 kbps lease lines are used to connect to the database at the central office. The application is also available through the Internet, and citizens can access the Web site to look up a variety of information relating to their various tax payments and status of complaints. Payments can be made through cash, check, demand draft, credit card, or debit card at the civic center or through the Web site. Complaints pertaining to civic amenities can be filed at the ward office, the civic center, or through the Web site.
XZZ. Service usage pattern of clients
The client survey invoved interviewing 239 citizens who had availed at least one service from both the

civic center (any of the eight civic centers56 selected for the purpose of the study) and the ward office. An analysis of the service usage pattern of clients shows that:
An average of 2.50 services had been availed by each respondent at the civic center. A. total of 47 respondents had availed only one service, 54 had availed two, 112 had availed three, 23 had availed four, and three had availed five services.
The most frequently used services are computation and payment of property tax, issue of birth and death certificates, registration of birth, and issue and renewal of licenses for shops and establishments. The proportion of respondents who availed the various services is:
1 Resoondents %Of 1
1 4. 1 Issue and renewal of licenses for shops and establishments I 29.71
1.
2.
3.
1 6. 1 Registration of death I 14.64 1
Computation and payment of property tax
Issue of birth and death cert
ifi
cates
Registration of birth
-
83.26,
40.17
38.91
7.
The matrix given below shows the number of respondents who used at least two of the most frequently used services:
- -
9.
10.
11.
12.
Service
Filing and issue of building plan and use permission
Computation and payment of property
tax
10.04
8. 1 Rieht to information - - -
Payment of vehicle tax
Payment of TDO fees
Issue and renewal of hotel and restaurant license
Issue and renewal of hawker's license
Issue of birth and Registration Issue and renewal of death certificates 1 of birth 1 licenses for shops and
establishments
7.95
5.02
2.93
1.26
0.42
1 Registration of birth I 74 I 43 1 93 1 I
Computation and payment of property tax
Issue of birth and death certificates
Issue and renewal of licenses for shops and establishments
XIII. Overall assessment of the application by the client
Respondents were asked to indicate the three factors that were most important to thern from the perspective of service delivery at the civic center. Of the 17 attributes covering aspects of location and accessibility, cost incurred, quality of service, and quality of governance, the attributes-less time and effort required, less corruption, greater transparency, less cost to the citizen, and a good complaint- handling system-appeared to be the most important to the respondents. The composite scores for service delivery through the civic center and the ward office were 4.1 18 and 3.367, respectively. The overall impact of the application was computed as the difference of the two scores, which is 0.751.
A paired t-test was applied to assess whether the differences between the means of the composite scores for the civic center and the ward office are significantly different. Scores for the composite
199
79
56 Civic centers selected for the purpose of this study were located at Girdhar Nagar, Law Garden, Rakhial, Mani Nagar, Isanpur, Nava Vadaj, Saraspur, and Sardar Baug. The number of respondents from each of these locations was about 30.
91
96

X N . Impact on client The results of the client survey indicate that 97.49 percent of the respondents preferred service delivery through the civic center rather than through the ward office.
The differences on factors pertaining to cost of availing service, governance, and service quality between the ward office and the civic center are:
scores of the civic center (mean=4.118, S.E.=0.058) were found to be significantly higher (t[238]= 12.961, p<.01) than scores for the ward office (mean=3.367, S.E.=0.039). The test statistic for the paired t-test is given below:
Mean
Standard deviation
Standard error
Variance
Number of observations
Service Quality Difference in overall score (five-point scale)
S.E. Significance
Error rate (%) Manual Computerized
Pearson correlation
Hypothesized mean difference
df
t stat
P(T<=t) one-tail
t critical one-tail
0.700 0.049 ***
1.67 1.26
0.348
0
23 8
12.961
1.002E-29
2.342
Civic Center
4.118
0.900
0.058
0.814
239
Ward Office
3.367
0.608
0.039
0.371
239

XV. Impact on agency
Increased revenue collection 1 Sep 02 to Mar / Apr 03 toMar I Apr 0;; Mar 1 Apr 05 to Mar 1 03 04 06
I Number of Transactions 1 Property tax 1 174,354 1 459,161 1 486,564 1 537,830)
[Building plan approvals7 497 1 1,687 1 17,1061 31 1
I TDO fees I I 3.225 1 9,311 1 3.610 1 I Licenses for sho~s and establishments I 8.599 1 17.703 1 23.062 / 25.210 1
I Registration of death58 1 I 221 1 4 1
HoteYrestaurant license
Hawker's license
Vehicle tax
Issue of birth and death certificates
Registration of birth58
I Application under Right to Information I I 1 I 215 1
13,443
Act
Complaint redressal
Total
I Licenses for s h o ~ s and establishments I 0.6048 1 1.5467 1 1.5443 1 1.7126 1
12,752
1,317
318
Building plan approval
Revenue from fees (Rs million)
74,201
27 1,094
32.2547 1 87.1495 / 682.0608 1 0.2062
110
956
2,319
42,447
9
Hotellrestaurant license
Hawker's license
Issue of birth and death certificates
Registration of birth
Application under Right to Information Act
4 124,912
621,296
TDO fees
Registration of death
97,306
679,194
36.4079 1 233.8533 1 49.0365 I
0.0575
0.0136
0.0204 1
0.1973
0.3251
1.5841
0.0002
Total
57 Was online until May 2005 but was discontinued at all civic centers, besides the one at Law Garden because of problems with the software module. 58 The applications used to be received at the civic centers and forwarded to the AMC office at Danapith for processing. This used to take longer than the earlier procedure, because of which the service was discontinued at the centers. Citizens now have to approach the Danapith office directly for registering births and deaths.
32.8596 1 125.1956 1 919.56541 53 . 3166 1 , - - - - - - - - - - - -
Revenue from taxes (Rs million)
Property tax
Vehicle tax
Total
642.42
8.94
651.36
1,356.88
9.46
1,366.34
1,744.85
1.46
1,746.31
1,973.78
1.974.26

Improvement in complaint handling
Year ' Number of complaints received I Number of complaints addressed I Number of complaints pending I I
1 1 Ward I Civic I Total I Ward I Civic 1 Total Ward Civic 1~0tal l
Reduction in litigations pertaining to property tax5'
2002- 03
I Year 1 199940 12000-01 1 2001-02 2003-04 1 2004-05 1 1 Cases 1 42,378 1 38,500 1 Nil ( 4 1 5 ~
Reduction in number of tax objections5'
Offices 42,767
Ability to comply with the citizen's charter.
Centers 31,647
Year Objections
74,414
2001-02 895
2000-01 55,098
Service
Property tax
Building plan approval
Licenses for shops and establishments
1 Vehicle tax I 1 Hours, multi~le visits I Under 10 minutes 1
Issue of birth and death Urgent-24 hrs Several dayslmultiple visits certificates Routine-15
days 1 Complaint redressal
Offices 42,559
200243 238
As pacitizen Charter
30 days
Two days, in most cases
2003-04 158
Cost savings caused by quicker reconciliation: The manual reconciliation of revenue collection used to be a tedious and time-consuming task and led AMC to lose about Rs 100 million per annum. The automated system enables easy access to information to assess real-time demand and collection, thus reducing tax evasion and increasing collection.
Centers 3 1,642
Before
Hours, multiple visits
Average of six months
Several days, multiple visits
No way of knowing status or ' Status known immediately; most
Cost savings because of speedier payments to contractors: Having an online payment facility through the payment gateway of local banks (that is, ICICI Bank) has saved the leakage of at least Rs 400 million per annum. It has brought down the tender quotes for projects by 10 percent because of speedier payments from AMC's account to the contractor's account in the same bank. The daily validation of checks and payments has reduced huge losses incurred by the corporation through a lack of validation.
accountable person
Cost savings on utility bills59: Payments are issued on the 15th of each month through separate e-files for utilities such as electricity, telephone, operation and maintenance agencies, security agencies, etc. The user department certifies the record for adjustment before the next month. Because of this, rebates of 2 percent per month offered by the electricity company and of 10 percent per telephone can be availed. An energy audit can be done through internal data checking, and a check can be kept on the increase in telephone usage.
After
Under 10 minutes
Instantly, if the application is in order
Under 10 minutes
complaints are attended to within 24 hours
59 Ahmedabad Municipal Corporation (2005) E-Governance: An Initiative for Easy Governance.
94
' Offices
I
Centers 5 74,201 213 208

XVI. Frequency of system breakdown and duration for recovery
All the time 1 0.00 1 3.33 1 0.00 1 0.00 1 0.00 1 0.00 1
A survey of 30 computer operators posted at seven civic centers6' was conducted to gather data pertaining to the frequency of breakdown of the application being used at the civic center and of the supporting infrastructure, and the time required for recovery from such system failures. The results of this survey are given in the following table:
Power Supply Breakdown
(70 respondents)
Never I 0.00 1 0.00 1 16.67 1 20.00 1 30.00 1 76.92 1
Often
Sometimes
Rarely
-
Time Required to Rectify
Frequency o f Breakdown
Connectivity Breakdown
(% respondents)
0.00
10.00
90.00
60 The number of operators included in the survey from each of the seven civic centers is: Law Garden4 , Rakhial-4, Mani N a g a r 4 , Isanpur-3, Nava V a d a j 4 , Saraspur-3, Sardar Baug-5.
Slow Response
(% respondents)
Few hours
Few minutes
16.67
46.67
33.33
Computer HW Failure
(% respondents)
36.67
56.67
3.33
13.33
66.67
Software Failure
(% respondents)
60.00
30.00
Breakdown of the Electronic
Paymeint Facility (% respondents)
0.00
6.67
73.33
36.00
64.00
0.00
10.00
60.00 23.08
25.00
20.83
47.62
33.33
33.33
66.67 i

Chile Tax Online System
I. Sector Tax administration
II. Targeted beneficiaries Chilean taxpaying citizens and business organizations
III. Project implementation start date.
The'Chile Tax Online System (Servicio de Impuestos Internos [SIl:]) was launched in 1998 with an objective to improve the agency's efficiency, promote professional and personal development among staff, reduce tax evasion, improve service, ensure equity in the application of tax laws, and develop greater technological capacity within the agency and at a wider societal level.
IV. Electronic service delivery launch date
1998
V. Duration for which project has been delivering services
Seven years
VI. Major services oflered through the project Preparation and submission of tax returns
Verification of tax-related (payable) information
Refund or payment of tax
VZZ. Diflerent channels through which service is delivered Portal-Chile Tax Online System (SII)
VZII. Service usage pattern of clients The client survey involved a survey of 322 clients comprised of business users and citizens. An analysis of the service usage pattern of the clients shows that:
An average of 4.36 services were availed by the respondents. A total of 20 respondents had availed one service, 47 respondents had availed two services, 33 respondents had availed three services, and 22 had availed four services.
The most frequently used services include declaration of monthly taxes, electronic ticket of honoraria, payment of monthly taxes, and registry of contributors. The table below presents the breakdown of the most frequently availed services:
1 Service Availed I percent 1 1 Declaration of rnonthlv irn~osed tax 1 21.18 1 1 1 Electronic ticket of honoraria 1 13.035 1 Monthly taxes
Registry of contributors
11.914
10.081

* The matrix below presents the number of respondents who used at least two of the most frequently availed services:
! Monthly taxes 1 113 1 60 1 117 1 I
Service
Declaration of monthly imposed tax
Electronic ticket of honoraria
ZX. Impact on client
The respondents were asked to provide their perceptions on cost and time reduction in availing the service, governance, service quality, and corruption. The table below presents the mean vabue of their responses (score of "1" corresponds to low/negative and "5" corresponds to highlpositive).
Cost Reduction
Change in the economic cost to process taxes
Time reduction
S.E. conuption
Service quality S.E.
Ease of Web site navigation 3.960 Citizens' feedback for framing the rules and norms
S.E. 0.067 S.E.
Usage convenience of Web site 4.674 Government image has improved after ! implementation
S .E. 0.049 S.E.
Is the help desk customer-friendly?
S.E.
Overall score on service quality
S.E.
Declaration of Monthly Imposed Tax
208
119
Registry of contributors
X. Impact on agency * The impact on agency was assessed on the basis of the ratings provided by managers and functionaries.
287 respondents comprising 226 employees and 61 managers were interviewed. The table below presents the mean ratings for each category of respondents (score of "1" corresponds to lovdnegative and "5" coresponds to highlpositive).
96 ( 58 / 62 1 2
Electronic Ticket of Honoraria
128
Monthly Taxes
Registry of
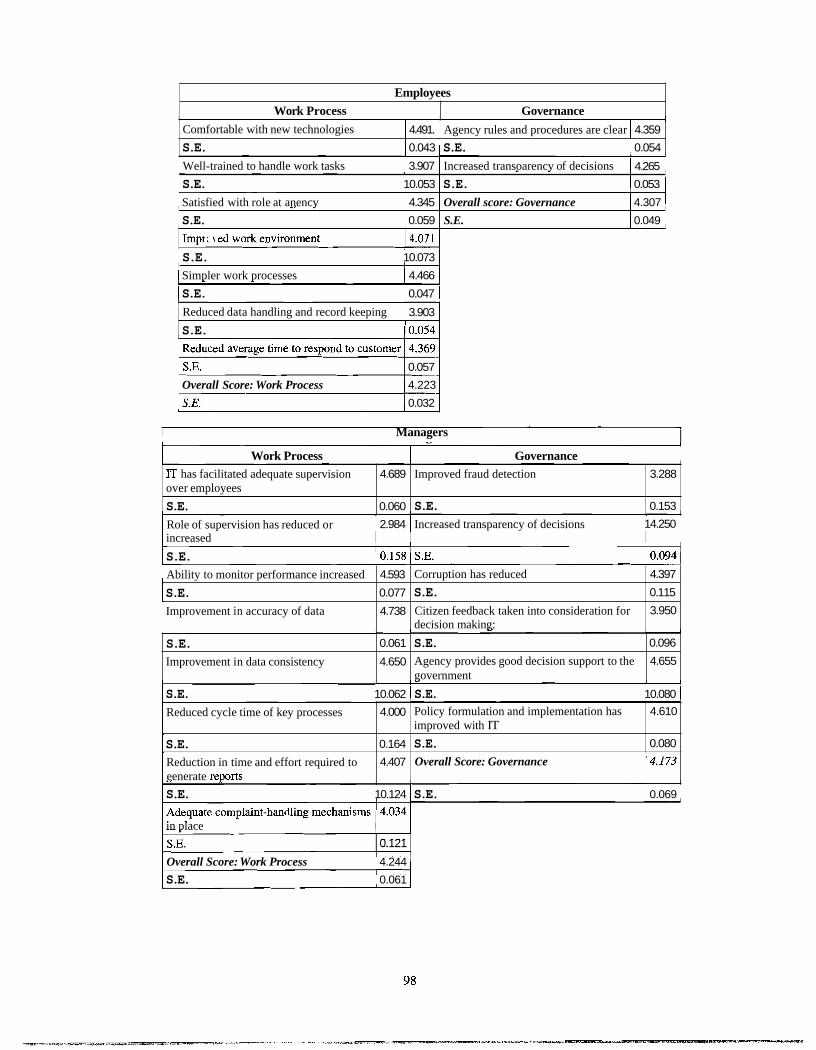
Comfortable with new technologies 1 4.491. 1 Agency rules and procedures are clear 1 4.359
S.E. 1 0.043 1 S.E. 1 0.054
Employees
1 Well-trained to handle work tasks 1 3.907 1 Increased transoarencv of decisions 1 4.265 1
Work Process
1 S.E. 10.053 1 S.E. 1 0.053 1
Governance
1 Satisfied with role at anencv 1 4.345 1 Overall score: Governance 1 4.307 1 1 S.E. 1 0.059 1 S.E. 1 0.049 1 Improved work environment 4.07 1
1 S.E. 10.073 1 1 Simpler work processes 1 4.466 1 1 S.E. 1 0.047 1 Reduced data handling and record keeping 1 3.903
S.E. (0.054
0.057
Overall Score: Work Process 4.223
0.032
I Managers I 1 Work Process I Governance 1
I Role of supervision has reduced or 1 2.984 1 Increased transparency of decisions 14.250 1
lT has facilitated adequate supervision over employees
S.E.
I increased I I I I
4.689
0.060
S.E.
I S.E. 10.062 1 S.E. 10.080 1
Improved fraud detection
S.E.
Ability to monitor performance increased
S.E. Improvement in accuracy of data
S.E. Improvement in data consistency
3.288
0.153 1
S.E. 10.124 1 S.E. 1 0.069 1
4.593
0.077
4.738
0.061
4.650
Reduced cycle time of key processes
S.E. Reduction in time and effort required to eenerate re~orts
in place
0.121
Overall Score: Work Process 4.244
S.E. 0.061
Corruption has reduced
S.E.
Citizen feedback taken into consideration for decision making:
S.E. Agency provides good decision support to the government
4.000
0.164
4.407
4.397
0.115
3.950
0.096
4.655
Policy formulation and implementation has improved with IT
S.E.
4.610
0.080
Overall Score: Governance
ChileCompra E-Procurement System
I. Sector Government procurement
ZZ. Targeted beneficiaries
Government agencies and suppliers to government
111. Project implementation start date In 2000, the ChileCompra portal was used as a blackboard to present information about purchases carried out by the government. By 2003, the portal was being fully used as an e-procurement platform.
N. Electronic service delivery launch date
2003
V. Duration for which project has been delivering services
Four years
vz. . . Major services offered through the project
Procurement
Electronic catalogue of suppliers
Publication of requests of goods and services by public procurement officers
Information and tools on procedures of procurement
Issuance of tender
Tender bid and registration of potential suppliers
Reclamations
VZZ. Different channels through which service is delivered ChileCompra portal is accessible from telecenters, cybercafks, place of work, etc.
VZZZ. Service usage pattern of clients
Private Users The private user client survey involved a survey of 326 respondents. An analysis of the service usage pattern of the private users indicate that:
An average of 3.63 services were availed by the respondents. A total of 37 respondents had availed one service, 61 respondents had availed two services, 40 respondents had availed three services, and 37 respondents had availed four services.
The most frequently used services include participation in tendering, purchase order, and usage of the Table of Aid. The table below presents the breakdown of the most frequently availed services:
I Most Frequently Availed Services I Percent 1
Purchase order 16.175
The matrix below presents the number of respondents who used at least two of the most frequently availed services:

Public Users
Services Participation in tendering
Purchase order
Table of Aid
The public user client survey involved a survey of 654 respondents. An analysis of the service usage pattern of the public users indicates that:
An average of 5.20 services were availed by the respondents. A total of 51 respondents had availed one service, 46 respondents had availed two services, 60 respondents had availed three services, and 72 respondents had availed four services.
Participation in Tendering
225
133
113
The most frequently used services include usage of the plaform of public purchases, reference to guides and manuals, usage of the electronic catalogue of Marco Agreements, usage of the Table of Aid, and consultations and reclamations. The table below presents the breakdown of the most frequently availed services:
Purchase Order
148
84
The matrix below presents the number of respondents who used at least two of the most frequently availed services:
Table of Aid
127
Most Frequently Availed Services Platform of public purchases
Aid-guides, manual, and advice
Electronic catalogue of Marco Agreements
Table of Aid
Information center
Consultations and reclamations
Percent 17.027
14.221
14.092
13.834
11.416
10.094
IX. Impact on client
Private Users
Platform of public purchases
Aid-guides, manual,and advice
Electronic catalogue of Marco Agreements
Table of Aid
Information center
Consultations and reclamations
The respondents were asked to provide their perception on cost and time reduction in availing the service, governance, service quality and corruption. The table below presents the mean value of their responses (a score of "1" corresponds to lowlnegative and "5" corresponds to highlpositive).
Platform of public
purchases
528
399
391
392
322
290
Aid-guides, manual, and
advice
441
353
362
318
278
Electronic catalogue of Marco
Agreements
437
344
282
255
Table of Aid
429
308
286
Info. center
354
242
Consultations and reclamations
313

I Change in Costs 1 1 1 Governance I 1 Costs required to search for business 3.28 opportunities 1 S. E. 0.07,
1 Image of government
The decision-making on purchases is transparent
S.E.
I Costs required to participate in bidding (3.23 1
The rules and procedures of ChileCompra are clearly defined
Time required to search for business 3.40 opportunities
S. E. 0.07
I S.E.
ChileCompra eliminates corruption
Overall score on governance 3.06
/ Time required to participate in bidding / 3.44 1
1 S.E. 1 0.07 /
Service quality
1 Web site convenient to use 1 3.82 !
Easy-to-navigate Web site
1 S.E. 1 0.07 1
3.79
- - - - -
Overall score on service quality 13.79
Public Users
Respondents of the public sector organizations were asked to provide their perception on governance, service quality, and corruption. The table below presents the mean value of their responses (a score of "1" corresponds to lowlnegative and "5" corresponds to highlpositive).
1 Service Quality 1 1 I Easv-to-navigate Web site 1 3.86 1 I S.E. 1 0.04 1 1 Web site convenient to use (4.22 i 1 S.E. 1 0.04 1 1 Overall score on service aualitv 14.03 1 I S.E. I 0.04-1
Governance
The rules and procedures of ChileCompra are clearly defined 4.02
S.E. 0.04
The decision-making on purchases is transparent
S.E. 0.04,
ChileCompra improved or made worse your image of the government 1 3.89
S.E. 1 0.04
/ Overall score on governance 1 3.85 i 1 S.E. 1 0.03 1
1 S.E. / 0.05 1


1.5 1 0.610 1 0.033 1 Not Sirr. 1 0.767 1 0.120 1 *** 1 14.056 1 3.943 1 82.250 / 7.111 1 *** I 0.00 1 98.33 1
13 1 0.308 1 0.052) *** 1 1.517 1 0.399 1 Not Sig. 1 25.071 / 9.187 1 131.034 1 28.931 1 *** I -0.43 1 93.33 1
0.643
16 1 -0.100 1 0.060 1 *** 1 1.346 1 0.200 1 Not Sig. 1 25.435 1 5.029 1 98.280 1 21.461 1 Not Sig. I 1.72 1 100.00 1
0.074
0.5520.045
13 ( 1.028 1 0.075 1 *** 1 0.138 1 0.082 1 * I 0.00 1 100.00 1 0.143 1 1.204 1 19.138 1 4.101 1 Not Sig. 1
CARD
-
8
Overall
I 6 1 1.422 1 0.109 1 *** / 0.429 1 0.137 1 Not Sig. I 6.667 1 5.050 1 11.429 1 1.522 / *** I 0.00 1 100.00 1
** ***
1 Overall 1 1.270 1 0.049 1 *** 1 0.285 1 0.089 1 *** I 9.342 1 2.228 / 18.498 1 1.642 1 *** I 0.40 1 96.840 1
0731
0.153
--
1 AMC
0.586
1.200
3.529
38.454
1
2
eSeva
8 1 0.807 1 0.058 1 Not Sin. 1 0.759 1 0.146 1 Not Sig. 1 23.556 1 5.988 1 14.500 1 1.800 1 Not Sip. I 0.42 1 100.00 1
1.267
3.097
0.084
0.027
1 Overall 1 0.751 1 0.058 1 *** 1 0.654 1 0.145 1 *** 1 21.853 1 5.256 1 16.164 1 1.579 1 *** I 2.51 1 97.49 1
0.117
0.119
19.204
117.984
0.159
0.505
1.488
1.157
Not Sig. ***
144.621
125.710
*** ***
0.134
0.075
**c
***
29.744
21.295
*** ***
***
1.367
1.384
0.154
9.250
116.684
0.00
0.43
0.072
0.096
100.00
96.67
0.297
0.115 -
1.778
0.23 1
Not Sig.
Not Sig. * *
3.668
18.103
0.192
Not Sig. ***
58.793
62.915
- 96.15
100.00
1.432
0.23 1
42.450
39.632
11.343
7.003
31.846 1 4.229
17.846 1 4.097
9.219
6.317
Not Sig. ***
*** Not Sig.
121.800
96.240
0.00
0.00
5.08
12.71
100.00
98.31
18.410
7.950
*** ***
0.86
4.3 1
96.67
96.980

Annex IX A Methodology for Postevaluation
1. Project selection
Selection of projects would depend on the purpose of assessment. For a retrospective evaluation of investment decisions or decisions about replicating projects in other geographies, mature projects should be selected. Maturity is reflected in the number of years for which the project has been operational; the extent to which the designed scope (services that have been computerized and the number of steps that have been automated for each service) is wide and has been achieved; and the extent to which electronic delivery of services covers the targeted population. Projects that are still evolving on any of the above dimensions will not be considered mature.
Projects can be implemented with different scale and scope:
1. Countrywide by national-level agencies such as Income Tax, Excise and Customs, and Department of Company affairs.
2. Statewide by agencies such as Transport Department, Commercial Tax Department, and Registration Department, and
3. At the local level by a district or municipality.
Services could be offered to different client segments such as citizens, busintxses, or intermediaries (chartered accountants, cargo-handling agents). The scope of the service could be wide or limited, such as in filing an online application or may cover the complete process of delivering a service, as in processing a bill of entry, e-payment of duty, and clearance of goods.
An assessment exercise can be useful if the project is stable (that is, one phase of implementation is complete and operational for a continuous period) and has been used for a minimum period of one to two years to generate sufficient user experience that can be captured and analyzed.
Get the concurrence of the agency to conduct the study. Explain the purpose of the assessment and broad methodology that will be used to key officers of the agency, including the head. Even though the study may be funded from independent sourc:es, data would need to be collected from the agency. If the agency does not cooperate it will be difficult to assess the agency-level impact.
2. Constructing a project profile
Data would need to be collected on the project background, basic information on the type of clients (users), types of services delivered, mode of delivery, scale of operation, years of operation at current scale, and coverage.
Study the delivery of services and collect data on a number of different types of transactions handled. Identify the key services (based on volume or contributioin to fee revenue or taxes) based on inputs from agencies. Identify different stakeholders that could be impacted.. In addition, other stakeholders could exist.

3. Design of data collection instrument
There are three basic ways of collecting data from clients: in face-to-face interviews conducted by trained investigators, surveys conducted over the Internet, and focus groups conducted by trained researchers. Choose the modes of data collection depending on access to funds and research assistance. Use professional market research agencies with trained investigators for face-to-face interviews. Its cost will depend on the time it will take to survey a client, the number of locations at which clients have to be surveyed, and the number of respondents to be surveyed. The costs could vary between Rs 150 to 500 per respondent depending on the nature of the location of respondents and the size and complexity of the instrument.
Use the framework to develop a questionnaire for the clients. Customize survey instrument to each project and the specific services being studied. It is meaningful to measure costs in the context of a specific service. Adapt the questionnaire in the local language using colloquial terms. A sample questionnaire is presented in Annex 111. Following are some useful tips for questionnaire design:
Design the analytical reports prior to the survey. Often, key variables can be missed if the nature of analysis in not thought through prior to the study. Precode as many items in the questionnaire as possible. Use consistent coding for scales-representing high versus low or positive versus negative perceptions. Use differently worded questions to measure some key items and perceptions. Wording of questions should be appropriate to the skill level of interviewer and the educational level of respondent. There are many ways to elicit responses on perceptions measured on a scale. Scales can be read out or symbols associated with each point on the scale can be displayed for semiliterate users.
4. Selection and training of investigators
Select a team of investigators. Investigators need to have a higher qualification and more experience than is usually required for a social sector survey. Investigators would need to understand the basic steps through which e-delivery of service takes place and also understand terms that are used in measuring governance. It is necessary for the investigators to observe the process of service delivery by visiting a delivery center. The team would usually undergo a training program. The study team should participate in the training of investigators. Unless investigators have clarity on what is being measured through each question, the quality of data would be poor. Many examples would have to be provided to explain the meaning of terms such as travel cost, transparency, accountability, etc.
Pretest the questionnaire with actual users. Feedback from pretesting of the questionnaire should be discussed between the study team and investigators. The feedback may include the length of the questionnaire, interpretation of each question, and the degree of difficulty in collecting sensitive data. Assessing the quality of investigators is a good idea. Training and feedback sessions can be used to weed out investigators.

5. Determining the sample size
Develop a sampling frame for data collection through a structured survey for clients, employees, and supervisors. A stratified sample for subregions of the total coverage is useful in maintaining precision of estimates. In case of service centers, activity levels (number of users) can influence many parameters of assessment of service quality significantly. Normally, geographical spread of the catchment area, population of the users, and profile of the users would influence cost of access by users. For client surveys, select locations from which sample would be drawn. Stratify the number of service centers according to the above dimensions and select an adequately large number. Determine sample size so that results can be extrapolated to the entire population with a given level of accuracy and degree of confidence. Table XIII provides rough sample sizes for different levels of accuracy and confidence. Generally, a sample of 1,000 clients may be sufficient for assessing the impact of a statewide project. Select respondents that have used the key services in both the manual and electronic delivery modes randomly from each location.
Table XIII. Determination of Sample Size
6. Conduct of the survey
Survey teams have to be supervised tightly-no more than two to three teams per supervisor. The quality of supervision by the market research agency is crucial. Generally, the supervision is much worse than specified in the contract. Physical supervision by study team of the survey process is a good idea, even if it is done selectively. Ask the market research agency to document the results of their field supervision. One of the key supervisory check items is the legibility of data recording by investigators. A prespecified proportion of filled instruments have to be verified by the supervisors. This requires that the complete address of the respondent be recorded so that the supervisor can return to randomly selected respondents.
7. Data entry and establishing data validity
Data entry can be done in a format that can be directly input into a statistical analysis package. Specify the format after taking a decision on the data analysis package. SPSS
provides an adequate range of analytical procedures for analysis of survey data. Following are some useful tips for ensuring data quality:
Conduct random check for data entry problems by comparing data from questionnaires with printout of data files. Check extreme values in data files for each item and unacceptable values for coded items. Cross-check the data recorded for extreme values in the questionnaire. Check for abnormally high values of standard deviation. Even though a code is provided for missing values, there can be confusion in missing values and a legitimate value of zero. Look for logical connections between variables such as travel mode and travel time and bribe paid and corruption. Poor data quality can often be traced to specific investigators or locations. Complete data validity checks before embarking on analysis.
8. Challenges that were faced in data collection and analysis
For the assessment of a manual system, respondents need to rely on memory. In the case of systems that have been operational for a large number of years, such recall can introduce an error. There has been no benchmarking of the service delivery in a manual system prior to implementing a new computerized system-something that needs to be done for new projects that are taken up in the future. The fact that there are no established reporting standards for public agencies to put out even basic operating data in the public domain makes it difficult to collect operational data. Also, public agencies are wary of evaluation and therefore it is difficult to gather data. Different benchmarks can be used for evaluation-improvement over manual system, absolute rating of a computerized system (can be a moving target), or potential impact that could have been delivered. The effort required for assessment of a project tends to be underestimated. There are many issues in measuring what we purport to measure: design of questions, training, pretesting, field checks, and data triangulation.
BIBLIOGRAPHY
Accenture 2002. eGoverrzment-Realizing the Vision. Third Annual eGovernment Benchmarking Report
ADB 2003. "To Serve and to Preserve: Improving Public Administration in a Competitive World." Accessed March 27,2006, from http://www.adb.org/documents/manuals/serve~andqreserve/Chapterl9.pdf
Agerfalk, P., J. Sjostrom, S. Cronholm, and G. Goldkuhl2002 (July). "Setting the Scene for .Actability Evaluation-Understanding Information Systems in Context." In proceedings of the 9th Corzfererzce orz Information Technology Evaluation, eds. Ann Brown and Dan Remenyi. Universite Paris-Dauphine, France.
Aichholzer, G. 2004. "Scenarios of e-Government in 2010 and Implications for Strategy Design." Electronic Journal of e-Government 2(1): 1-10.
Alkire, S. 2002. Valuing Freedoms: Serz's Capability Approach and Poverty Reduction. Oxford, U.K.: Oxford University Press.
Avgerou, C., C. Ciborra, A. Cordella, J. Kallinikos, and M. Smith 2005. The Role of Information and Commurzicatiorz Techrzology in Building Trust in Goverrzance: Towar& Effectiveness and Results. Washington, DC: Inter-American Development Bank.
Avgerou, C., and S. Madon 2004. "Framing IS Studies: Understanding the Social Context of IS Innovation." In The Social Study of Irzformation and Communication Technology: Inrzovatiors Actors, and Contexts, ed. C. Avgerou, C. Ciborra, and F. Land. Oxford, U.K.: Oxford University Press.
Benjamin, P. 2001. "Community Development and Democratisation Through Information Technology: Building the New South Africa." In Reinventing Government in the Irzformatiorz Age, ed. R. B. Heeks, 194-210. London: Routledge.
Chopra, K. and S. Duraiappah. 2001 (June). "Operationalising Capabilities and Freedom in a Segmented Society: The Role of Institutions." In proceedings of the conference Examining Sen's Capability Approach, Von Huge1 Institute, University of Cambridge.
Commonwealth of Australia 2004 (May). Demand arzd Value Assessmerzt Methodology for Better Goverrzmerzt Services. Information Management Office, Australian Government. http://www.agimo.gov.au/government/darnvam
Delone, W. H., and E. R. McLean 1992. "Information Systems Success: The Quest for the Dependent Variables." Irzformation Systems Research, 3:60-95.
eGEP 2005. eGovernment Economics Project. Prepared for the eGovernment Unit, DG Information Society and Media, European Commission.
EU 2003. Value Creation in eGoverrzmerzt Projects: An Exploratory Analysis Corzducted for the Danish Presidency of the eGovernment Work Group of the Directors General. Danish Ministry of Finance and Accenture.
Federal Ministry of the Interior 2006. Bund Onlirze 2005: Firzal Report-Current Status ana! Outlook, Federal Republic of Germany. htt~://www.kbst.bund.de/Anla~e306905/En~lish- Version-Recommendations-on-Economic-Effi792-k8.~df
Gartner 2002. Is IT Worth It-Presenting the Public Sector Business Case.
Grant, G. 2005. "Realizing the Promise of Electronic Government." Journal of Global Iqformation Management 13(1): i-iv.
Harmon, E., S. C. Hensel, and T. E. Lukes 2006. " ~ e a s u r i n ~ Performance in Services." The McKinsey Quarterly 1 : 1 4 . Available at:

Heeks, R. 2001. "Understanding e-Governance for Development." IDPM Working Paper Series, no. 1 1. Accessed March 27,2006, from University of Manchester Web site: http://www.man.ac.ukhdpm/idpm~dp.htm#ig
Heeks, R. 2002. "Information Systems and Developing Countries: Failure, Success, and Local Improvisations." The Information Society, 18(2): 101-1 12.
Heeks, R. 2003. Most e-Government-for-Development Projects Fail: How Can Risks be Reduced? Accessed March 27, 2006, from http:/hdpm.man.ac.uWpublications/wphgovhndex.shtml
Hill, C., and L. Lynn 2005. "Is Hierarchical Governance in Decline? Evidence from Empirical Research." Journal of Public Administration Research and Theory, 15(2): 173-195.
Hu, Y., J. Xiao, J. Pang, and K. Xie 2005. "A Research on the Appraisal Framework of e-Government Project Success." Proceedings of the 7th Interrzational Conference on Electronic Commerce.
Hyden, G., J. Court, and K. Mease 2004. Making Sense of Governance: Empirical Evidence from 16 Developing Countries. London: Lynne Reinnner Publishers.
Jessop, B. 1998. "The Rise of Governance and the Risks of Failure: The Case of Economic Development." Intenzational Social Science Journal 155: 2945.
Kanungo, S. 2003. "Information Village: Bridging the Digital Divide in Rural India." In The Digital Challenge: Information Technology in the Development Context, ed. S. Krishna and S. Madon, 103-124. Hampshire, U.K.: Ashgate Publishing.
Kettl, D. F. 2002. The Transformation of Governance: Public Administration for the Twenty-First Century. Baltimore, Md.: Johns Hopkins University Press.
Kjaer, A. M 2004. Governance. Cambridge, U.K.: Polity Press.
Kooiman, J., ed. 1993. Modern Governance: New Govenzment-Society Interactiorzs. London: Sage.
Kooiman, J. 2003. Governing as Governance. London: Sage
Kumar, R. and M. L. Best 2006. "Impact and Sustainability of e-Government Services in Developing Countries: Lessons Learned from Tamil Nadu, India." The Information Society 22: 1-12.
Lanvin, B. 2005 (November). "METER e-Strategies Monitoring and Evaluation Toolkit." In E- Development: From Excitement to Eflectiveness, ed. Robert Schware. Prepared for the World Summit on the Information Society, Tunis. World Bank.
Lau, E. 2005. "Electronic Government and the Drive for Growth and Equity." OECD.
Liu, T. T., and T. L. Cooper 1997. "Values in Flux: Administrative Ethics and the Hong Kong Public Servant." Administration and Society 29: 301-24.
Madon, S., and G. R. Kiran 2002. Irformation Technology for Citizen-Government Intedace: A Study of FRIENDS Project in Kerala. Accessed March 27, 2006, from the World Bank Global Knowledge Sharing Program (GKSP) Web site: wwwl.worldbank.org/publicsector/bnpp/egovupdate.htm
Madon, S. 2003. "IT Diffusion for Public Service Delivery: Looking for Plausible Theoretical Approaches." In Information Systems and the Economics of Innovation, ed. C. Avgerou and R. La Rovere. Cheltenham, U.K.: Edward Elgar Publishing.
Madon, S. 2005. "Governance Lessons from the Experience of Telecentres in Kerala." Europearz Journal of Information Systems 14(4): 40 1417.
OECD 2003. "The e-Government Imperative." OECD E-Government Studies. Accessed March 27, 2006, from http://www.oecd.org/publications/e-booW420307lE.PDF
Olowu, B. 2001. "Pride and Performance in African Public Services: Analysis of Institutional Breakdown and Rebuilding Efforts in Nigeria and Uganda." International Review of Administrative Sciences, 67(1): 117-134.
Peters, B. G. and J. Pierre 1998. "Governance Without Government: Rethinkin,g Public Administration." Journal of Public Administration Research and Theory 8(2): 223-44.
Peters, R. M., M. Janssen, and T. van Engers 2004. "Measuring e-Government Impact Existing Practices and Shortcomings." In Proceedings of ICEC 2004, Sixth International Conference on Electronic Commerce, ed. Marjin Janssen, Henk Sol, and Rene Wagenaar.
Rama Rao, T. P., V. Rao, Venkata, S. C. Bhatnagar, and J. Satyanarayana 2004. E-Governance Assessment Frameworks. Accessed March 27, 2006, from http://egov.mit.gov.in
Ranerup, A. 1999. "Internet-Enabled Applications for Local Government Democratisa1:ion." In Reinventing Government in the Information Age, ed. R. Heeks. London: Routleclge.
Remenyi, D. 2002 (July). "The Value Scorecard-Beyond the Business Case." In proceedings of the 9th Conference on Information Technology Evaluation, ed. Ann Brown and Dan Remenyi. Universite Paris-Dauphine, France.
Rhodes, R. 1997. Understanding Governance: Policy Networks, Governance and Accountability. Buckingham, U.K.: Open University Press.
Rose, N. 1999. Powers of Freedom: Reforming Political Thought. Cambridge: Cambridge University Press.
Seddon, P. B., and M. Y. Kiew 1996. "A Partial Test and Development of Delone and McLean's Model of IS Success." Australian Journal of lnformation Systems 1: 90-105.
Seifert, J. W., and G. M. Bonham 2003. The Transformative Potential of e-Government in Transitional Democracies. Accessed March 27, 2006, from http://www.maxwell.syr.edulmaxpages/faculty/gmbonha~ramformative.~Potentia 1-ofE-government.pdf
Sen, A. 1999. Development as Freedom. Oxford, U.K.: Oxford University Press.
Smithson, S., and R. Hirschheim 1998. "Analysing IS Evaluation: Another Look at an Old :Problem." European Journal of lnformation Systems, 7.
Stoker, G. 1998. "Governance as Theory: Five Propositions." International Social Science Journal 50(155): 17-28.
Suzuki, P. T. 1995. "Public Sector Ethics in Comparative Perspective." Annals of the American Academy of Political and Social Science 537: 173-83.
UNDP-APDID 2003. E-Government. Accessed March 27, 2006 from http://www.eprimers.org/primers/e-Government.pdf


~dward A. S t rudwi cke 86540 1 MC C3-301