impact assessment on a new approach for the
TRANSCRIPT

To:
EUROPEAN COMMISSION
DIRECTORATE GENERAL ENERGY AND TRANSPORT
IMPACT ASSESSMENT ON A NEW APPROACH FOR THE CLEANER AND
MORE ENERGY EFFICIENT VEHICLES DIRECTIVE PROPOSAL
Final Report
September 2007
pwc Advisory

Impact Assessment on a new approach for the cleaner and more energy efficient vehicles directive proposal
2/45 pwc Advisory
EUROPEAN COMMISSION - DIRECTORATE GENERAL ENERGY AND TRANSPORT
IMPACT ASSESSMENT ON A NEW APPROACH FOR THE CLEAN VEHICLES DIRECTIVE PROPOSAL
Table of Contents
1 DEFINITION OF PROBLEMS AND BACKGROUND ......................................................................... 6 1.1 ENVIRONMENT AND TRANSPORT: MAIN ISSUES.......................................................................................... 6
1.1.1 Dependence on oil........................................................................................................................... 6 1.1.2 Climate change................................................................................................................................ 6 1.1.3 Health and pollutant emissions from vehicles................................................................................. 7
1.2 RESEARCH AND TECHNOLOGICAL DEVELOPMENT PROGRAMMES IN TRANSPORT AND ENERGY.................. 7 1.3 A DIRECTIVE ON CLEAN VEHICLES............................................................................................................. 8
1.3.1 Previous Commission proposal ....................................................................................................... 8 1.3.2 Proposal for a directive on cleaner and more energy efficient vehicles: a new approach ............. 10
1.4 JUSTIFICATION FOR INTERVENTION AT COMMUNITY LEVEL..................................................................... 10 2 POLICY OBJECTIVES ........................................................................................................................... 12
2.1 KEY ELEMENTS OF THE PROPOSED POLICY............................................................................................... 12 2.1.1 Overview on European strategy .................................................................................................... 12 2.1.2 From main initiatives to main objectives ...................................................................................... 14
3 DEFINITION OF DIFFERENT POLICY OPTIONS ALTERNATIVES........................................... 15 3.1 IDENTIFICATION OF POLICY OPTIONS ....................................................................................................... 15
3.1.1 Step 1: Identify policy options to meet the objectives................................................................... 15 3.1.2 Step 2: Screening by measuring effectiveness, efficiency and consistency .................................. 16 3.1.3 Step 3: Drawing a shortlist of options ........................................................................................... 23
4 IMPACT ANALYSIS................................................................................................................................ 25 4.1 POLICY OPTIONS TO BE ASSESSED............................................................................................................ 25 4.2 METHODOLOGY....................................................................................................................................... 25
4.2.1 Analysis coverage ......................................................................................................................... 25 4.2.2 General assumptions ..................................................................................................................... 26 4.2.3 Methodology for scenarios comparison ........................................................................................ 27 4.2.4 Available data................................................................................................................................ 29 4.2.5 Procurement estimate .................................................................................................................... 29
4.3 ENERGY AND ENVIRONMENTAL IMPACTS ESTIMATE................................................................................ 31 4.4 COST-BENEFITS ANALYSIS...................................................................................................................... 35
4.4.1 Cost/Benefits assumptions ............................................................................................................ 36 4.4.2 Cost/Benefits Results .................................................................................................................... 36
5 MONITORING PROCESS AND ADMINISTRATIVE COSTS.......................................................... 42
6 RESULTS AND CONCLUSIONS ........................................................................................................... 44
ANNEXES
ANNEX-1 STAKEHOLDER CONSULTATION
ANNEX-2 ANNUAL PROCUREMENT BY SCENARIO
ANNEX-3 VEHICLE PERFORMANCE COMPARISON
ANNEX-4 ENERGY CONSUPTION AND NOXIUS EMISSION BY YEAR BY SCENARIO
ANNEX-5 ENVIRONMENTAL AND ECONOMICAL COST COMPUTATION
ANNEX-6 CBA FOR SINGLE VEHICLES CLASSES (TABLES)

Impact Assessment on a new approach for the cleaner and more energy efficient vehicles directive proposal
3/45 pwc Advisory
ANNEX.7 GUIDELINES FOR IMPLEMENTIG THE METHODOLOGYOF LIFETIME EXTERNAL COST INTERNALISED TO
THE PROCUREMENT OF VEHICLES OPERATING PUBLIC TRANSPORT SERVICES
Acronym Definition
ACEA Association of European Automobile Manufacturers
B&C Bus and Coaches
BAU Business as Usual
BETA Benefits Table database
CAFÉ Clean Air for Europe programme
CBA Cost-Benefit Analysis
CNG Compressed Natural Gas
CO Carbon monoxide
CO2 Carbon dioxide (greenhouse gas)
CONCAWE European organisation for oil company environment, health and safety
DG-TREN Directorate General Energy and Transport
DSS Decision Support System
EAP Environment Action Plan
EC European Commission
ECMT European Conference of Ministers of Transport
ECTRI European Conference of Transport Research Centres
EESO Earliest Euro Standard – Optional
EESM Earliest Euro Standard – Mandatory
EEV Enhanced Environmentally Friendly Vehicle standard
EMTA European Metropolitan Transport Authorities
EU European Union
EU-25 Current Member States
EXTERNE Externalities of Energy project
FC Fuel Consumption
FTE Full Time Equivalent
GHG Greenhouse Gases
GJ Giga Joule
HDV Heavy Duty Vehicle
ILECM Internalising Lifetime External Costs – Mandatory
ILECO Internalising Lifetime External Costs – Optional
ITS Intelligent Transport System
JEG Joint Expert Group
Kt Kilo tonnes
LDV Light Duty Vehicle
LPG Liquid Propane Gas
MS Member State
NO2 Nitrogen dioxide

Impact Assessment on a new approach for the cleaner and more energy efficient vehicles directive proposal
4/45 pwc Advisory
Acronym Definition
NOx Nitrogen oxides (NO2 and NO)
NPV Net Present Value
PC Passenger Car
PwC PricewaterhouseCoopers Advisory
PM Particulate Matter
PT Public Transport
SCR Selective Catalytic Reduction
SO2 Sulphur dioxide
SUTP Sustainable Urban Transport Plan
SUV Sport Utility Vehicle
T&E Transport and the Environment
TEN Trans European Network
TJ Tera Joule
UITP International Public Transport Union
WHO World Health Organisation
WTW Well to Wheel

Impact Assessment on a new approach for the cleaner and more energy efficient vehicles directive proposal
5/45 pwc Advisory
PREFACE PricewaterhouseCoopers Advisory (PwC) presents a study regarding an Impact Assessment on a new
approach for the cleaner and more energy efficient vehicles directive proposal.
This study was prepared by PwC for the European Commission of the European Communities,
Directorate General for Transport and Energy. PwC does not accept or assume any liability or duty of
care for any other purpose or to any other party. PwC shall not be liable in respect of any loss, damage
or expense of whatsoever nature which may be caused by any use of this study.
The views expressed herein are those of the authors and do not represent any official view of the
Commission.
PwC does not accept or assume any liability or duty of care regarding the accuracy of the sources of
information cited in the study, respectively mentioned hereinafter:
COM(2007) 19 final “Results of the review of the Community strategy to reduce CO2
emissions from passenger cars and light-commercial vehicles”
COM (2005)261 “Proposal for a council directive on passenger car related taxes”
COM (2006) 314 final of the 22.06.2006
COM (2007) 551 final of the 25.9.2007
COM (2005) 718 of the 11.1.2006
http://ec.europa.eu/news/energy/070110_1_en.htm
http://europa.eu/rapid/pressReleasesAction.do?reference=IP/07/996&format=HTML&aged=0
&language=EN&guiLanguage=en
http://ec.europa.eu/environment/air/index.htm
“Extension of Accounting Framework and Policy Applications” - Final Report on Work
Package 6, 15 July 2005
study "The Environmental and Social Costs of Mobility in Italy - Fifth report" Ferrovie dello
Stato, Amici della Terra, January 2006
Netcen-AEA Technology (authors: Paul Watkiss and Mike Holland), “Estimates of the
Marginal External Costs of Air Pollution in Europe” (2002)
"Damages per tonne emission of PM, NH3, SO2, NOx and VOCs from each EU25 Member
State (excluding Cyprus) and surrounding seas", AEA Technology Environment, March 2005.
PricewaterhouseCoopers Advisory s.r.l. Contact: Francesco Gargani Tel: +3906570831 Email: [email protected]

Impact Assessment on a new approach for the cleaner and more energy efficient vehicles directive proposal
6/45 pwc Advisory
1 DEFINITION OF PROBLEMS AND BACKGROUND
1.1 Environment and transport: main issues The European Commission has emphasized the main environmental challenges related to transport that are:
An excessive dependence on oil;
The problem of climate change caused by carbon dioxide (CO2) emissions;
Health effects from air pollution caused by pollutant emissions from vehicles.
1.1.1 Dependence on oil
Within the framework of an increasing energy demand existing in the transport sector, the Commission has taken action aimed at reducing the use of oil in transport, and in particular in the road transport sector, using a two-pronged approach: first, by improving energy efficiency, and second, by promoting alternative fuels.
Regarding the first aspect, the Commission has entered into optional agreements with the automotive industry to reduce energy consumption of new cars, the objective being a reduction in average fuel consumption of new cars of 25% between 1995 and 2008/9.
In relation to the second aspect, namely the promotion of alternative fuels, the Commission has proposed an indicative target of 20% market share for alternative fuels by 2020. All these aspects have resulted in an important progress, increasing significantly the market share of biofuels, nevertheless this remaining below the level required by the directive.
1.1.2 Climate change
Cars are an important part of the everyday lives of a large number of Europeans, and the automotive industry is a significant source of employment and growth in many regions of the EU. However, car usage has significant impacts on climate change, with about 12% of the overall EU emissions of carbon dioxide (CO2), the main greenhouse gas, coming from the fuel consumed by passenger cars. Even though there have been significant improvements in vehicle technology – in particular in fuel efficiency, which also means lower CO2 emissions - this has not been enough to neutralise the effect of increased traffic and car size. While the EU as a whole has reduced its emissions of greenhouse gases (GHG) by just under 5% over the 1990-2004 period, the CO2 emissions from road transport have increased by 26%1.
Regarding the actions launched to meet the challenge of reducing CO2 emissions by cars, the Commission has created a strategy, proposed in a Communication adopted in 1995, based on three main measures:
1. voluntary agreement with the automotive industry to reduce CO2 emissions;
2. a taxation system for cars based on CO2 emissions;
3. improvement of information to the consumer: average CO2 emissions should be displayed in the sale room.
1 COM(2007) 19 final “Results of the review of the Community Strategy to reduce CO2 emissions from passenger cars and light-commercial vehicles”.

Impact Assessment on a new approach for the cleaner and more energy efficient vehicles directive proposal
7/45 pwc Advisory
These measures resulted in a reduction of 13% of the average of the CO2 emissions of new cars, falling from 185g per km in 1995, to 161g per km in 2004. However, additional actions will be necessary in the future to achieve the Community target of 120 g CO2/km by 2012.
The Commission has presented on 5th July 2005 a proposal for a Directive2 requiring the taxation of passengers cars based on CO2 emission.
In January 2007, the Commission proposed that:
the EU pursues in the context of international negotiations the objective of a 30% reduction in GHG emissions by developed countries by 2020 (compared to 1990 levels);
the EU should already now take on a firm independent commitment to achieve at least a 20% reduction of GHG emissions by 2020 (compared to 1990 levels).
With the Communication of 7 February 20073, the Commission proposed a comprehensive new strategy to reduce CO2 emissions from new cars and vans sold in the European Union. The new strategy, together with a revision of EU fuel quality standards, further underline the Commission's determination to ensure the EU meets its greenhouse gas emission targets under the Kyoto Protocol and beyond, thus enabling the EU:
to reach its long-established objective of limiting average CO2 emissions to 120 grams per km by 2012 (a reduction of around 25% from current levels);
fuel savings for drivers by improving fuel efficiency;
To encourage the car industry to compete on the basis of fuel efficiency instead of size and power;
To invite manufacturers to sign an EU code of good practice on car marketing and advertising.
1.1.3 Health and pollutant emissions from vehicles
Furthermore, regarding the actions taken with the objective of reducing the pollutant emissions of vehicles, the new Euro standards have gradually reduced pollutant emissions. The limit value for particulate emissions, for example, was reduced by a factor of 18 for heavy duty vehicles between Euro I in 1993 and Euro IV in 2006. For cars, emission limits will be reduced by a factor of 28 between Euro 1 in 1993 and the Euro 5 standard proposed by the Commission in 2005 for application from 2010. A reduction of nitrous oxide and particulate emissions of 30 to 40% has been achieved since the adoption of the first Euro standard.
1.2 Research and technological development programmes in transport and energy
Research and technological development programmes in transport and energy, funded by the Framework Programmes of the European Union, have had a strong focus on clean and energy efficient technologies. Major demonstration projects have been supported by Community funds to accelerate the development of alternative fuels and the technologies necessary for their use in vehicles. Biofuel production and their use in captive fleets have been supported in several projects in the framework of "Biofuels Cities". The BEST project supports biofuels with a strategic introduction of more than 10.000 vehicles and more than 140 fuelling stations in 10 towns and regions. The Biogasmax project supports production, distribution, and use of biogas as transport fuel. Hydrogen and fuel cells have been supported with 300 M€ from the Sixth Framework Programme (2002-2006) of the European Union. Particularly successful was the CUTE project, which has put into operation buses running on 2 COM(2005)261 “Proposal for a council directive on passenger car related taxes” 3 Cf. Footnote 1

Impact Assessment on a new approach for the cleaner and more energy efficient vehicles directive proposal
8/45 pwc Advisory
hydrogen, has established a solid basis for the development of the market of this clean and innovative technology. In October 2006 half a dozen of cities signed a "Memorandum of understanding" for the purchase of several hundred hydrogen buses.
A European Technology Platform on hydrogen and fuel cells has been initiated by the European Commission in 2004 to accelerate the development of hydrogen as a fuel. This Technology Platform has drawn up, in 2005, strategies for research and deployment of hydrogen and fuel cell technologies over the next 15-25 years were drawn up and presented an implementation plan to align research and development work over the next 10 years.
The search for integrated solutions for clean urban transport has also been supported within the framework of the CIVITAS initiative. The European Commission has invested around 100 M€ in 36 cities throughout Europe. It will continue supporting this type of initiative in the future.
1.3 A directive on clean vehicles
1.3.1 Previous Commission proposal
This Impact Study has been based on a critical assessment of the previous Commission proposal for a directive on the promotion of clean vehicles by public procurement and the main points of discussion, objections, and suggestions in Council and European Parliament.
On 21 December 2005, the Commission adopted a first proposal for a Directive on the promotion of Clean Road Transport Vehicles. This proposal has been preceded by two studies:
the COWI assessment study “Impact Assessment of an Initiative on the Promotion of Energy Efficient and Low Emission Road Transport Vehicles”, monetising the cost for pollutant emissions in the procurement process, (concluded in March 2005);
the PwC impact assessment of a proposal for a Directive on the promotion of energy efficient and low emission road transport vehicles, assessing the cost-benefit results of mandating a certain quota of clean vehicles, defined by technologies, in the procurement for public transport services.
Main goal of the proposed Directive was to pursue the following objectives:
reducing pollutant emissions and energy consumption by road transport vehicles;
broadening of the market for "clean and energy efficient" vehicles;
a more substantial reduction of pollutant emissions and energy consumption as a result of the broader market take-up.
The proposal for the Directive has been discussed for long, several objections have been raised and amendments have been proposed. The reasons of the Committee on the Environment, Public Health and Food Safety (rapporteur: Dan Jørgensen) that have brought to the rejection are the following:
The directive should be viewed in a broader context, particularly in the light of the forthcoming EURO VI standards, which are aimed at vehicles over 3.5 tons and light duty vehicles. The introduction of stricter standards applicable to all new vehicles is absolutely essential for a long-term improvement in the environment and health and, as such, the ultimate objective of our work.
The Commission proposal has been put forward too late, and would therefore not, in its current form, have the needed beneficial impact on environment and human health. As a consequence, amendments to the directive on key emission standards have been proposed to bring it in line with the updated prospects of technical development and needed environmental improvements. This would mean introducing a revised enhanced environmentally friendly vehicles (EEV) standard, but the committee responsible was not able to find a majority.
Impact Assessment on a new approach for the cleaner and more energy efficient vehicles directive proposal
9/45 pwc Advisory
As regards the impact on health and the environment, the most important values in the EEV standard are the values applicable to nitrogen oxides (NOx) and particulates. The EURO V standard, already adopted and applicable to heavy duty vehicles over 3.5 tons, which enters into force in 2008/2009, is extremely close to the EEV standard in the Commission's proposal on precisely these points. Even taking an optimistic view of the process of considering and adopting the proposal, the environmental gain will be limited.
The main argument against raising the level of ambition in this directive is the financial cost associated with a greater proportion of clean vehicles. The future EURO VI standards, which will apply to all new vehicles, will result high for both public and private purchasers. In keeping with the original proposal's intention to have public investment play a decisive role as a driving force on the market, the rapporteur has proposed to increase the proportion of public procurement of clean vehicles to 35% and to extend the directive to cover light-duty vehicles as well. A higher level of ambition and a genuine commitment to industry is considered crucial to secure the necessary investment, achieve economies of scale and thereby bring the long-term costs down.
Both Community and national sources of finance should be brought into play so that the further cost of investment does not affect the quality of public transport. Member States' funding allocations are needed to take account of increases in expenditure at certain regional or local political and administrative levels in order to comply with the directive. It would, however, be contrary to the subsidiarity principle to prescribe exact funding models, in the same way that the proposal does not prescribe models for meeting the main requirements of the directive in view of the diverse forms of organisation at national level.
In the existing definition of Enhanced Environmentally friendly Vehicles (EEV) no provision is made with respect to energy efficiency. However, one of the objectives of this Directive is to reduce overall energy consumption by road transport vehicles. Therefore, a possible amending of the EEV definition should also try to incorporate energy efficiency standards in the definition.
No direct measure against CO2 is proposed in the Directive for the air quality in urban areas, a problem that clean transport can help to improve.
The Fuel Quality Directive establishes specifications for petrol and diesel, for environmental and health reasons, e.g. limits on the content of ethanol, ether and other oxygenates in petrol. It also limits the vapour pressure of petrol. Standard EN590 sets further limits for technical reasons, and states that diesel must contain no more than 5% biodiesel by volume. These quantitative limits put constraints on the increased use of biofuels and should be reviewed.
Even if the Directive is technology neutral, it is important for Member States to focus on the promotion of alternative fuels and technologies. Market creation by strengthening demand needs to be accompanied by measures to encourage research, technological innovation and market introduction. This requires public funding, both at EU and at national level.
For the car industry, with its long term investment and activities planning, better predictability on future regulations is of the greatest importance. The industry needs time in order to make well-planned and cost-effective investments in development and in manufacturing. That was also one of the main recommendations of the CARS21 High Level Group. Therefore, the Commission needs as soon as possible to assess the need for further action.
The proposal for a directive on the promotion of clean road transport vehicles has been rejected and put on hold by the Committee on June 2006. The rapporteur has asked the Commission to focus its effort on bringing forward a EURO VI proposal containing environmentally ambitious and technology
Impact Assessment on a new approach for the cleaner and more energy efficient vehicles directive proposal
10/45 pwc Advisory
driving emission standards binding for all heavy road transport vehicles, which has been supported by a large majority of the committee responsible.
1.3.2 Proposal for a directive on cleaner and more energy efficient vehicles: a new approach
Vice-President Barrot, in an intervention to the Environment Committee of European Parliament on 21 November 2006, therefore suggested taking a new approach, as presented below.
A possible new approach could be based on the two lines of an accelerated introduction of new Euro standards and “sustainable economics”, consisting of the internalisation of external costs for pollution, energy, and CO2 emissions to support high performance technologies. This would provide contributions to the energy strategy, energy efficiency, and the European Climate Change Programme, and respond to the long-standing requests for internalisation of external costs in transport policy.
The main elements of the new approach could be:
All providers of public transport services, public and private operators, should, in their vehicle procurement process, give preference to the latest Euro standard adopted by Council and Parliament before general application, whenever vehicles are available on the market.
All providers of public transport services, public and private operators, should include environmental cost in the procurement award criteria for all vehicles. The cost of a vehicle, as an award criterion, should be calculated as the sum of purchasing price plus vehicle life-time costs for energy and a monetised value for CO2 and pollutant emissions (nitrogen oxides, particulate matter) 4 linked to the operation of the vehicles to be procured all award criteria being weighed equally5.
Lifetime cost is defined as the sum of all the yearly costs related to the operations of vehicle.
This approach can include all vehicles, it remains valid irrespective of changes in pollutant emission standards, and does not impose higher costs but rather prevents costs through life-time integration (e.g. by driving technological innovation towards lower pollution and lower energy consumption at affordable vehicle prices, etc.).
The internalisation approach is complementary to the Euro emission standard legislation, as it monetises any remaining pollutant emission and does not require any standard setting.
1.4 Justification for intervention at community level There are technologies which have the potential to improve conventional vehicles with petrol and diesel propulsion. On the other hand, there are new technologies based on alternative fuel and innovative propulsion (such as hybrid) which still have a very small market. The potential for alternative fuel is recognised at the EU policy level: the 2001 transport White Paper suggests a target of 20% use in road transport by 2020 and the Green Paper on a European strategy for secure, competitive and sustainable energy adopted in March 2006, suggests additional measures aiming to strengthen the development of the biofuel market in order to achieve the objectives quantified for 2010. Moreover, the Commission defines the energy policy package and the biofuel strategy by establishing a target of 10% market share by 2020. In fact, the Commission considers that the potential
4 Other criteria are neglected in this study; in particular, the noise impact is not considered because it has a local effect, which can not be assessed in a global study. 5 Indeed, different weights for different criteria are introduced through unit external costs, which translate in monetary values the relative importance that the society gives to them.

Impact Assessment on a new approach for the cleaner and more energy efficient vehicles directive proposal
11/45 pwc Advisory
exists for a considerably larger market share than the 5,75% envisaged for 2010. This position was presented in the biomass action plan in 2005 and in the Communication on a biofuel strategy in early 2006.
Policy at the EU level has a role to play in supporting the progress of the automotive industry towards more energy-efficient and cleaner vehicles as well as in creating a market for them. Among several policy options existing, some are enforced by EU regulation, such as standards and labelling of cars.
The principle of subsidiarity implies that there are two merits for EU involvement: an absolute merit as far as the objectives of the proposed action cannot be sufficiently achieved by member states alone, respectively a relative merit as far as the objectives of the proposed action are better achieved by action at EU level.
Promotion of green public procurement at EU level has both merits. This policy would provide assurance for a market of more energy-efficient and cleaner vehicles and thus provide motivation to vehicle manufacturers. This is because of the economics of vehicle production: in fact, a critical mass needs to be reached to make production profitable and local or national incentives would not be sufficient to encourage more investments of the manufacturers in those vehicles.
A by-product of this action at EU level is the support of the competitive position of the EU automotive industry. The Commission's 2004 competitiveness report warns about the delay in developing green technologies already mastered by Japanese car manufacturers. One major challenge lies in the advantage that Japanese car manufacturers have gained in developing environmentally friendly technologies, "most prominently the development of new technology/fuel combinations, including fuel cells".
Establishing a wider market for cleaner vehicles is also important to help cities meet the obligations arising from EU regulation on air quality.
In 1996 the Framework Directive 96/62 on ambient air quality assessment and management set the timetable for the development of daughter Directives on a range of pollutants. The Directive 1999/30 was the first daughter Directive. It sets ambient air limit values for sulphur dioxide (SO2), nitrogen dioxide (NO2) and oxide of nitrogen (NOx), particulate matter (PM10) and lead (Pb). The second daughter Directive (2000/69) establishes limit values for concentrations of benzene and carbon monoxide. The third daughter Directive (2002/3) sets target values for ozone to be attained by 2010. Directive 1999/30 has entered into force in January 2005.
In this context, a special attention must be paid to particulate matters,: a type of air pollution that is generated by a variety of human activities (40% from transport), can travel long distances in the atmosphere and causes a wide range of diseases and a significant reduction of life expectancy in most of the population of Europe. The report of WHO “Health risks of particulate matter from long-range transboundary air pollution”(2006), summarizing the evidence on these effects and population exposure, shows that international action must accompany local and national efforts to cut pollution emissions and reduce their effects on human health. This has led to the imposition of restrictions to free circulation of vehicles. In conclusion, the European Institutions have all noted the need to address the issue of growing energy use in transport. On this basis, EU action is justified and essential since it is clear that optional measures will fail on their own to create the necessary incentive for manufacturers to offer clean and energy efficient vehicles. Action at Community level is therefore needed to create a sufficient basis for the investment required to develop more energy efficient and low emission vehicles.

Impact Assessment on a new approach for the cleaner and more energy efficient vehicles directive proposal
12/45 pwc Advisory
2 POLICY OBJECTIVES
2.1 Key elements of the proposed policy
2.1.1 Overview on European strategy
As described above, the overall strategy of Community transport policy aims at meeting the challenges of oil dependence and of climate change. With the intent to support this strategy, some concrete actions have already been proposed:
The mid-term review of the White Paper on transport: "Keep Europe moving – Sustainable mobility for our continent"6. This envisages in particular the deployment of intelligent transport systems, and modal transfer to rail and waterways transport. Innovation in all fields of transport is an absolute priority of the White Paper. The satellite navigation system GALILEO will give a range of options to improve the management of traffic and logistics. Particular attention, also in the applications of GALILEO, is given to the development of intelligent transport systems, such as Intelligent Cars for road transport. Furthermore an intelligent charging system should contribute to use more efficiently existing infrastructure, reduce congestion and limit pollution. A general framework for charging is foreseen to be presented in 2008 for an assessment of external costs, such as congestion, accidents, and pollution, for all modes of transport. All these actions should improve transport efficiency and thereby reduce the consumption of energy and emissions of pollutants and CO2 from transport.
The Commission plans legislative framework to ensure the EU meets its target for cutting CO2 emissions from cars on 7 February 2007 in which the Commission concluded that the voluntary commitments have not succeeded. Thus, the main measures it proposed in the revised strategy were a legislative framework to reduce CO2 emissions from new cars and vans and complementary measures in order both to introduce efficiency requirement for car components with the highest impact on fuel consumption, such as tyres and air conditioning systems, and to promote the purchase of fuel-efficient vehicles, notably through improved labelling and by encouraging Member States that levy car taxes to base them on cars' CO2 emissions.
The Green Paper on Urban Transport presented by the Commission on 25 September 20077, in which the EC will examine all possible common solutions based on approaches which have been tested successfully by the most ambitious European cities (urban road pricing zones, "green" zones, use of alternative fuels, improvement of the logistics for freight deliveries, public transport). The Commission intends to present a revised proposal along these lines before the end of 2007
Energy Efficiency Action Plan presented by the Commission on 19 October 2006 in which a number of concrete measures are proposed (limits of the rolling resistance tyres, tyre pressure control systems, education of drivers to promote eco-driving).
Communication from the Commission to the Council and the European Parliament on Thematic Strategy on the Urban Environment Brussels,8 underlines the need for further action in the field of urban transport, notably by examining the role of private vehicles in cities and the means to improve the quality of public transport. The Commission intends
6 Cf. COM(2006) 314 final of the 22.06.2006 7 Cf. COM(2007) 551 final of the 25.9.2007 8 Cf. COM(2005) 718 of the 11.1.2006

Impact Assessment on a new approach for the cleaner and more energy efficient vehicles directive proposal
13/45 pwc Advisory
to achieve a significant change in modal split, promote the use of cleaner vehicles and tackle congestion.
With the new Energy policy plan, the European commission wants to improve energy-supply security in Europe while combating climate change and making the industry more competitive. To this end, it has tabled proposals to pave the way for a common European energy policy. The proposals include a cut in CO2 emissions by at least 20% by 2020. The commission will propose increasing the use of renewable energy sources, i.a. by increasing the market share of biofuels to 10% by 2020, to limit global temperature changes to no more than 2°C above pre-industrial levels. It also wants to improve the EU's energy efficiency by 20%. This would make Europe the most energy-efficient region in the world9.
The European Commission held a public hearing on 11 July 2007 on the implementation of its new strategy to reduce carbon dioxide (CO2) emissions from new cars and vans sold in the European Union. The new strategy, proposed in February 2007, aims to reach the EU objective of 120 g/km average carbon dioxide (CO2) emissions from new cars by 2012 by means of an integrated approach. The public hearing seeks to gather views and ideas from all interested stakeholders on the possible options available for designing the various legislative components of the integrated approach. The European Commission is committed to addressing these rising emissions. In this context, on 7 February 2007, it published two communications on the future strategy to reduce CO2 emission from cars and on the future regulatory framework in the car sector. As outlined in these communications, the Commission has decided to pursue an integrated approach with a view to reaching the EU objective of 120 g/km average carbon dioxide (CO2) emissions from new cars by 201210.
The Sixth Environment Action Programme (EAP), "Environment 2010: Our future, Our choice", includes Environment and Health as one of the four main target areas where new effort is needed. Air pollution is one of the issues included under Environment and Health. Whilst overall air quality trends in the Community are encouraging, continued efforts and vigilance are still needed. The objective considered in the Sixth Environment Action Programme is to achieve levels of air quality that do not give rise to unacceptable impacts on, and risks to, human health and the environment The focus for the next ten years will be implementation of air quality standards and coherency of all air legislation and related policy initiatives. The Clean Air for Europe (CAFÉ) Programme/ implementation of the Thematic Strategy on Air Pollution, Ambient Air Quality, New Air Quality Proposal, Existing Air Quality Legislation, Implementation of existing AQ legislation, Meetings & Workshops - CIRCA website, EU Focus on Clean Air)11.
Energy star programme. On 10th July 2007, the European Parliament has adopted a new version of the regulation on the ENERGY STAR programme. It requires the Member States to apply demanding energy efficiency criteria in the public procurement of office equipment. This marks the first time that the Council, the European Parliament and the Commission agree that certain energy efficiency criteria become binding in public procurement. ENERGY STAR is part of the EU's strategy to better manage energy demand, contribute to security of energy supply and mitigate climate change.
9 http://ec.europa.eu/news/energy/070110_1_en.htm 10http://europa.eu/rapid/pressReleasesAction.do?reference=IP/07/996&format=HTML&aged=0&language=EN&guiLanguage=en 11 http://ec.europa.eu/environment/air/index.htm

Impact Assessment on a new approach for the cleaner and more energy efficient vehicles directive proposal
14/45 pwc Advisory
2.1.2 From main initiatives to main objectives
Policy objectives should converge with the main objectives of the initiatives cited above. In particular, the following areas (and the related documents) have to be taken into account:
Transport policy (i.e. review of the White Paper on a common transport policy of June 2006);
Energy policy (i.e. Energy policy package of 10 January 2007, Energy Efficiency Action Plan);
Policy regarding Automotive industry (i.e. CARS 21 and the Community strategy on CO2 emissions from cars;
Environment policy (i.e. Green Paper on urban transport).
Figure 1 shows the objectives of the main policies with the objectives of the proposed policy:
Figure 1 - Policy objectives
Transport policy objectives:Intelligent charging system should:
- contribute to use more efficiently existing infrastructure;
- reduce congestion, consumption of energy;- limit emissions of pollutants and CO2
Policy objectives for European Automotive industry:
- ensuring an open and competitive Single Market, including competition;
- knowledge: research, innovation, and skills- better regulation;
- ensuring synergies between competitiveness energy and environmental policies;
- ensuring full and fair participation in global markets;
- facilitating social and economic cohesion.
Environmental policy objectives:Objectives defined in:
- Internet open consultation;- Technical workshops.(See related paragraph)
Energy policy objectives:- Reducing greenhouse gas missions from
developed countries by 30% by 2020- Improving energy efficiency by 20% by 2020;
- Raising the share of renewable energy to 20% by 2020;
- Increasing the level of biofuels in transport fuel to 10% by 2020;
Energy Star Programme.
PolicyObjectives

Impact Assessment on a new approach for the cleaner and more energy efficient vehicles directive proposal
15/45 pwc Advisory
3 DEFINITION OF DIFFERENT POLICY OPTIONS ALTERNATIVES
3.1 Identification of policy options Once the set of objectives has been properly defined, the next phase of the impact analysis exercise is to establish which policy options and delivery mechanisms are most likely to achieve those objectives.
Some of them could be “basic approaches” (i.e. Community legal acts, legal acts of Member States, self-regulation and economic) and different choices can be combined in a package, and/or coordinated with Member State action.
Various alternatives exist regarding the individual elements/design parameters of a policy, including more or less ambitious versions to improve the fine tuning of the options, which would include the scope of legislation, implementation requirements and methods, etc.
This process consists of three activities:
Identify policy options
to meet the objectives
Screening by measuringeffectiveness,efficiency andconsistency
Draw up ashortlist
of potentiallyvalid options
Impact Assessment Guidelines – European Commission
3.1.1 Step 1: Identify policy options to meet the objectives
As first step, the workgroup has collected a list of alternative possible options that are likely to be capable of achieving the proposed objectives. The objective of the proposed directive is: “cleaner and more energy efficient vehicles in EU”.
The workgroup has analysed the following sources from the consultation in preparation of the Green Paper on Urban Transport, aiming at draining all the possible useful information and suggestions:
the meeting reports of the “Technical Workshop”held on 31/01/2007 "Urban transport and green propulsion";
the Joint Expert Group on Transport and Environment Meeting of 30 March 2007;
the Public consultation of Stakeholder by internet (Question 10).
As result of the analysis12 the workgroup has also identified some proposals coming from some stakeholders that have been discussed in more details in telephone meetings.
The screening and the analysis of the above documents are reported in 2 tables:
“Meetings” in which are described the elements for the identification of the policy/suggestions for each intervention of the above mentioned meetings;
“Internet consultation” in which are described the elements for the identification of the policy/suggestions for each consultation.
As result of the screening process the workgroup has analysed all the stakeholders’ contributions dividing these into the following two main categories:
A. Proposed actions: technical suggestion in order to reach the proposed objectives;
12 ANNEX 1 – Stakeholder consultation

Impact Assessment on a new approach for the cleaner and more energy efficient vehicles directive proposal
16/45 pwc Advisory
B. Policy instruments: possible tools and mechanisms which can be considered as alternative or complementary to the proposed policy options provided in the terms of reference and that can effectively contribute to the development and the monitoring of the actions.
The list of proposed actions and policy instruments are categorised and analysed in “step 2”.
3.1.2 Step 2: Screening by measuring effectiveness, efficiency and consistency
The aim of the screening process is to produce a shortlist of the most promising options that will be subject to a more in-depth analysis of impacts.
In order to consider and compare the policy options, the work group has carried out a qualitative assessment on the various contributions proposed during the stakeholder consultation process and the technical workshops, by considering the different elements that make up a policy option individually. The criteria by which proposed actions and policy instruments are screened are:
Effectiveness. The extent to which options can be expected to achieve the objectives of the proposal.
Efficiency: The extent to which objectives can be achieved for a given level of resources/at least cost (cost-effectiveness).
Consistency. The extent to which options are likely to limit trade-offs across the economic, social, and environmental domain.
The following table shows the stakeholders’ proposed actions and policy instruments grouped and analysed by type.
Table 1 – Screening
Proposed actions: Technology actions on vehicle components Single Action
Effectiveness Efficiency Consistency Remarks Delivery mechanism
- Gear shift indicators, consumption indicators
Already very often used: very limited innovation.
Cheap commercial products are widely available.
Best Practice / Policy instrument chosen
- Speed limiter Effective only on extra-urban trips
Not so much expensive and not so difficult to implement
Best Practice / Policy instrument chosen
- Automated Speed Control
It is already often provided on several vehicles
Commercial products are available.
Best Practice / Policy instrument chosen
- On-Board Device for tyre pressure check
It could be effective to avoid excessive consumptions due to incorrect maintenance
Cheap commercial products are now available.
No significant trade-off is expected across economic, social and environmental domain.
Prescriptions or indications regarding vehicle components could be complementary to other actions like a procurement process based to life-time external costs computation
Best Practice / Policy instrument chosen
- On-Board Device for emission and consumption monitoring
It could be very effective to ensure actual emissions and consumptions be consistent with Euro standard limits
Experimental devices are now available. Not much expensive (at the present, about 1,000euro). Further pilot experiments and homologation process would be required
No significant trade-off is expected across economic, social and environmental domain.
It is coherent with the life-time external costs computation; it could be suitably combined with certification protocols
Best Practice / Policy instrument chosen
Impact Assessment on a new approach for the cleaner and more energy efficient vehicles directive proposal
17/45 pwc Advisory
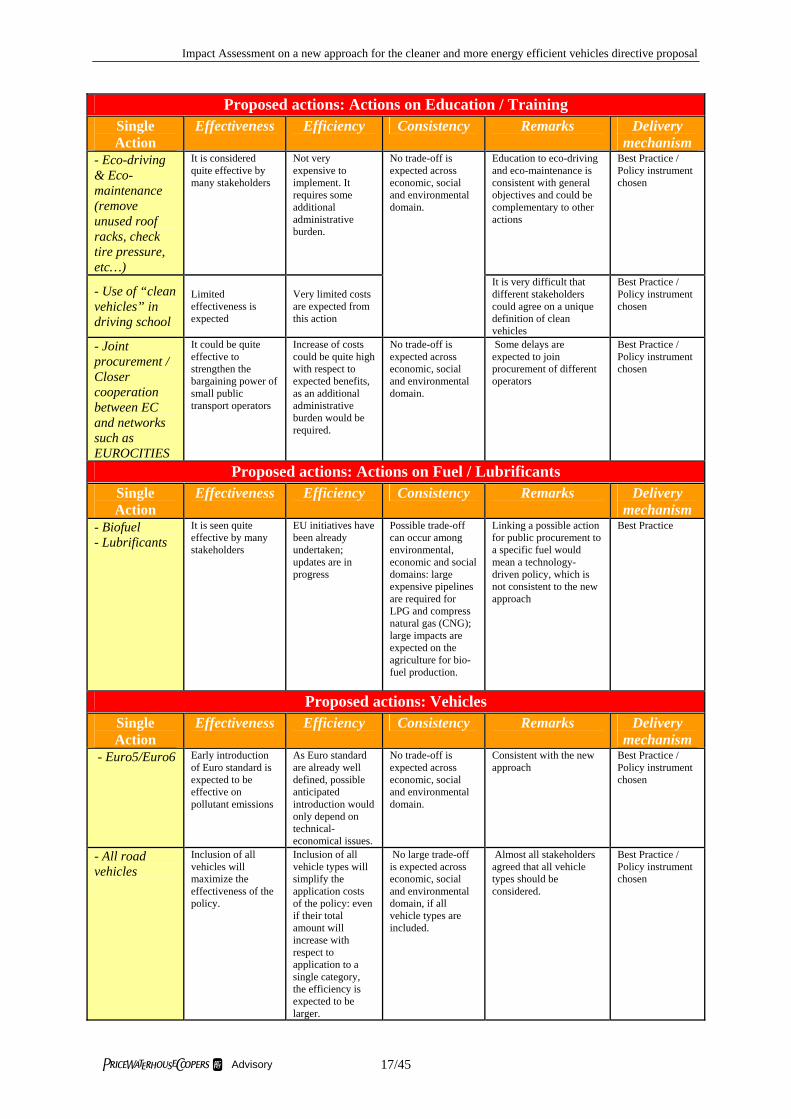
Proposed actions: Actions on Education / Training Single Action
Effectiveness Efficiency Consistency Remarks Delivery mechanism
- Eco-driving & Eco-maintenance (remove unused roof racks, check tire pressure, etc…)
It is considered quite effective by many stakeholders
Not very expensive to implement. It requires some additional administrative burden.
Education to eco-driving and eco-maintenance is consistent with general objectives and could be complementary to other actions
Best Practice / Policy instrument chosen
- Use of “clean vehicles” in driving school
Limited effectiveness is expected
Very limited costs are expected from this action
No trade-off is expected across economic, social and environmental domain.
It is very difficult that different stakeholders could agree on a unique definition of clean vehicles
Best Practice / Policy instrument chosen
- Joint procurement / Closer cooperation between EC and networks such as EUROCITIES
It could be quite effective to strengthen the bargaining power of small public transport operators
Increase of costs could be quite high with respect to expected benefits, as an additional administrative burden would be required.
No trade-off is expected across economic, social and environmental domain.
Some delays are expected to join procurement of different operators
Best Practice / Policy instrument chosen
Proposed actions: Actions on Fuel / Lubrificants Single Action
Effectiveness Efficiency Consistency Remarks Delivery mechanism
- Biofuel - Lubrificants
It is seen quite effective by many stakeholders
EU initiatives have been already undertaken; updates are in progress
Possible trade-off can occur among environmental, economic and social domains: large expensive pipelines are required for LPG and compress natural gas (CNG); large impacts are expected on the agriculture for bio-fuel production.
Linking a possible action for public procurement to a specific fuel would mean a technology-driven policy, which is not consistent to the new approach
Best Practice
Proposed actions: Vehicles Single Action
Effectiveness Efficiency Consistency Remarks Delivery mechanism
- Euro5/Euro6 Early introduction of Euro standard is expected to be effective on pollutant emissions
As Euro standard are already well defined, possible anticipated introduction would only depend on technical-economical issues.
No trade-off is expected across economic, social and environmental domain.
Consistent with the new approach
Best Practice / Policy instrument chosen
- All road vehicles
Inclusion of all vehicles will maximize the effectiveness of the policy.
Inclusion of all vehicle types will simplify the application costs of the policy: even if their total amount will increase with respect to application to a single category, the efficiency is expected to be larger.
No large trade-off is expected across economic, social and environmental domain, if all vehicle types are included.
Almost all stakeholders agreed that all vehicle types should be considered.
Best Practice / Policy instrument chosen

Impact Assessment on a new approach for the cleaner and more energy efficient vehicles directive proposal
18/45 pwc Advisory
- Prohibitions for sport utility vehicle (SUV), unsafe and highly pollutant vehicles
Effectiveness depends on the extent of application
Control could be very expensive. Many towns have already implemented automatically controlled limited traffic zones
No trade-off is expected across economic, social and environmental domain.
Difficult to implement. Road regulation concerns local Authorities Not connected with public procurement, which is the main object of the new approach
Best Practice
- Definition of "clean vehicles"/ Develop new EEV Standards
Effectiveness would highly depend on the definition
Low costs are expected
No trade-off is expected across economic, social and environmental domain.
As "cleanness" can be obtain in different ways, it is very difficult that different stakeholders could agree on a unique definition.
Best Practice / Policy instrument chosen
Policy instrument: Cost measurement Single
Instrument Effectiveness Efficiency Consistency Comments
Using External costs as a parameter in procurement
It would be a very effective instrument, as it is the most theoretically sound action.
Only additional administrative burden is expected. Little impact on manufacturing costs is expected in the short-term in order to meet marginal cost criteria instead of average costs
No trade-off is expected across economic, social and environmental domain.
It is well coherent with the general goal of reducing external costs. Sound methodology exists in transport planning. Application to vehicles requires both a methodological effort and data availability from manufacturers
This option has been considered "promising" and it is object of the in-depth analysis
Using Lifetime costs as a parameter in procurement
Very effective: life-time costs for fuel and damages are greater than procurement costs
Application requires both a methodological effort to define general guidelines and, if possible, a monitoring system to provide vehicle use certification
No trade-off is expected across economic, social and environmental domain.
It is consistent with external cost approach
This policy instrument is considered “promising” and suitably applied jointly with external costs computation; it is object of the in-depth analysis
Policy instrument: Other measurement Single Action
Effectiveness Efficiency Consistency Remarks Delivery mechanism
Credit System It is expected to be quite effective if combined with a continuous and certified monitoring system
It is expected to be quite expensive if linked to limited traffic zones or congestion charging
Trade-off are expected across social, economic and environmental domains, as it would have positive impact on the environment and potential negative impacts on some category users having low income and large mobility needs
It is consistent with external cost approach but it should be applied to private cars rather than public transport services
Public funding Effective Encourage the investment (and the research) in order to reach the objective will be too expensive
Trade-off across social, economic and environmental domains are possible, depending on the specific scheme of funding
It is consistent with external cost approach if funding is proportional to external costs reduction
Award Criteria
It will be effective if linked to limited traffic zone
It will be difficult to define the same criteria for the environmental impact for each country
No significant trade-off is expected across economic, social and environmental domain.
If the "award criteria" would include all the environmental impacts of the traffic (public and private), the instrument would be partially

Impact Assessment on a new approach for the cleaner and more energy efficient vehicles directive proposal
19/45 pwc Advisory
consistent
Award Criteria (city oriented)
Effective It will be difficult to define the same criteria for the environmental impact for each city
No significant trade-off is expected across economic, social and environmental domain.
If the "award criteria" would include all the environmental impacts of the traffic (public and private) of the city, the instrument would be partially consistent
Financial structures: - Incentives - Taxes
It will be difficult to identify a "Financial structure" that will be effective
It will be difficult to monitor and apply the same Incentives/Tax for all the MS
Trade-off across social, economic and environmental domains are possible, depending on the specific scheme of funding
Consistent with external cost approach
Guidelines Effectiveness of guidelines is expected to be quite limited and highly depending on the clarity and efficacy of the communication
Costs would be limited only to communication.
No trade-off is expected across economic, social and environmental domain.
This instrument could suitably joined with recommendations for actions on vehicle components and education/training. It would be useful also jointly with adoption of award criteria for procurement based on external cost approach
Mandatory action Mandatory
prescriptions are expected to be the most effective actions
Costs are widely dependent on the type of action
Trade-off across social, economic and environmental domains are widely dependent on the type of action
A general agreement by all Member States and all stakeholders is difficult to achieve
Policy instrument: Subject concerned Single Action
Effectiveness Efficiency Consistency Remarks Delivery mechanism
All providers of public transport services, public and private operators
Large effectiveness as for environmental conditions in urban areas.
It is expected to have a good cost-effectiveness, as a limited action on providers of public service could help widening the market of clean vehicles
No significant trade-off is expected across economic, social and environmental domain.
A policy option focused on public transport service operators have been already undertaken and will be more likely successful
This option has been considered "promising" and it is object of the in-depth analysis
All private and public companies
Larger effectiveness are expected than in the case of a policy option addressed only to public service providers
Cost-effectiveness will be very largely dependent on the specific action chosen
Possible trade-off across social, economic and environmental domains, depending on the cost of the action
Mandatory actions should be more difficult, while general agreements are possible
All private and public buyers
Of course, actions addressed to the whole market are expected to be the most effective
Cost-effectiveness will be very largely dependent on the specific action chosen
Possible trade-off across social, economic and environmental domains, depending on the cost of the action
Application to the whole market is expected to be quite difficult in the short term. Complementary action with Euro standard and car Euro labelling should individuated. Promising technology opportunities are expected from a wider application of intelligent transport system (ITS) technology to continuous monitoring, which could

Impact Assessment on a new approach for the cleaner and more energy efficient vehicles directive proposal
20/45 pwc Advisory
make it possible to apply congestion charging or credit systems depending in real-time to measured externalities.
Long list of policy options
A long list of suitable policy options is first individuated by combining one or more compatible actions with those policy instruments that are seen more appropriate for their application.
Option LL1
Issue of guidelines recommending the adoption of those devices or vehicle components (e.g.: automated speed control, tyre pressure checking device, speed limiter, On-Board Device for emission and consumption monitoring) as well as good practices for maintenance and driving behaviour that will be assessed as the most effective to reduce emissions and energy consumption.
Remark: The guidelines might be primarily addressed to providers of public transport service operators, public and private operators, but should be a useful information tool for private companies and consumers, too.
This option could be very effective to ensure actual emissions and consumptions to be consistent with Euro standard limits. A 3% of energy consumption reduction can be achieved with eco-driving courses.
Experimental devices are now available. Further pilot experiments and homologation process would be required.
It is coherent with the life-time external costs computation and it could be suitably combined with certification protocols.
Overall effectiveness of such guidelines is expected to be quite limited and highly depending on the clarity and efficacy of the communication.
However this option does not directly address the scope of the directive which is intended to promote cleaner and more energy efficient vehicles but to a better use of procured vehicles. Therefore this option cannot be considered as an alternative policy option.
Option LL2
Recommendation to all providers of public transport services, public and private operators, to give preference in their vehicle procurement to the latest Euro standard adopted by Council and Parliament before general application, whenever vehicles are available on the market.
Remark: Effectiveness of recommendation is expected to be much smaller than that of a mandatory action.
Early introduction of Euro standard is expected to be effective on pollutant emissions
As Euro standard are already well defined, possible anticipated introduction would only depend on technical-economical issues.
Easy to implement since definition and technical specification of Euro standards are already defined. Therefore implementation costs can be considered not relevant
No trade-off is expected across economic, social and environmental domain.
Consistent with the technology neutral approach.
On the basis of the above evaluation, this option is short listed for an in-depth analysis.

Impact Assessment on a new approach for the cleaner and more energy efficient vehicles directive proposal
21/45 pwc Advisory
Option LL3
Recommendation to all providers of public transport services, public and private operators, to include environmental life-time cost in the procurement award criteria for all vehicles.
The cost of a vehicle, as an award criterion, should be calculated as the sum of purchasing price plus vehicle life-time costs for energy, CO2, and pollutant emissions (nitrogen oxides, particulate matter).
Remark: Effectiveness of recommendation is expected to be much smaller than that of a mandatory action.
It would be a very effective instrument, as it is the most theoretically sound action.
Only additional administrative burden is expected.
Little impact on manufacturing costs is expected in the short-term in order to meet marginal cost criteria instead of average costs.
No trade-off is expected across economic, social and environmental domain.
It is well coherent with the general goal of reducing external costs. Sound methodology exists in transport planning. Application to vehicles requires both a methodological effort and data availability from manufacturers
This option has been considered "promising" and it is object of the in-depth analysis
Option LL4
Introducing fiscal incentives for operators of public transport services, public and private, and providing public funding for local authorities, in order to encourage the former to monitor and certify the total amount of their external costs, and the latter to experiment and introduce a mobility credit system based on monitored marginal costs due to emissions, energy consumption and increased congestion.
Remark: The mobility credit system is a complementary measure that could exploit the introduction of certified lifetime external costs produced by each vehicle. These should be first introduced for public transport service vehicles and then could be extended to the whole vehicle market. On Board Devices for emission monitoring should be experimented before general application of such a system could be introduced.
Application of Intelligent Transport System (ITS) technologies makes it possible a continuous real-time monitoring of both vehicle position and its environmental performance. This could make possible to apply congestion charging or credit systems depending on real-time measured externalities. The core of the system should be a continuous advanced mobility management system, which could optimize in real time the whole transport system state by managing dynamically road charges, user’s information, signal control strategies and transit operations, on the basis of environmental and congestion conditions monitored in real-time.
It is expected to be quite effective if combined with a continuous and certified monitoring system
It is expected to be quite expensive if linked to limited traffic zones or congestion charging
Trade-off are expected across social, economic and environmental domains, as it would have positive impact on the environment and potential negative impacts on some category users having low income and large mobility needs
It is consistent with external cost approach but it should be applied to private cars rather than public transport services.
On the basis of the above evaluation, this policy option could not be considered as an alternative option since it could only be applied to private vehicles rather than public transport service fleet since the obligation to guarantee public transport services.

Impact Assessment on a new approach for the cleaner and more energy efficient vehicles directive proposal
22/45 pwc Advisory
Option LL5
Introducing a suitable set of fiscal incentives for operators of public transport services, public and private, in order to equal the total yearly amount of costs to the external costs produced for each vehicle each year.
Remark: A set of fiscal incentives for public transport service operators is expected to be not as effective as for the whole market of private consumers, because public transport services are usually already funded. The main goal of funding public transport is to encourage more sustainable and more efficient transport modes than individual passenger car.
On the basis of the above evaluation, this option is disregarded from the shortlist.
Option LL6
To introduce for public and private operators of public transport services a mandatory procurement process of “clean vehicles”. This would imply a clear definition of clean vehicles that can be adopted by all MSs.
Remark: As of today, there is no such common definition in Europe. This definition will be very much dependent on the current available technology; therefore this approach would be technology oriented and as a result, not acceptable. This approach would also be subject to continuous adjustments because of the introduction of new technologies therefore very difficult to implement and to monitor. In fact, during the stakeholder consultation, many kind of definition have been provided. A new approach could be a different definition of “clean vehicles” oriented on performances.
Option LL7
Introducing a suitable set of fiscal incentives for public and private operators of public transport services that procure “clean vehicles”.
Remark: As "cleanness" can be obtained in different ways, It is very difficult that a unique definition of clean vehicle could be accepted by different stakeholders. As a matter of fact, very different incompatible definitions have been proposed so far by different subjects involved in the consultation process.
This option is the combination of LL5 as fiscal incentives and LL6 as for clean vehicles. Arguments for disregarding this option are given in LL5 and LL6.
Option LL8
Obligation for all providers of public transport services, public and private operators, to organise eco-driving courses for drivers and obligation to provide a proof about the lifetime external costs produced by each vehicle. See comments.
Remark:
This option does not directly address the scope of the directive which is intended to promote cleaner and more energy efficient vehicles but to a better use of procured vehicles.
In the context of public procurement, it is not possible to privilege one form of proof over another (see, e. g. Directive 2004/18/EC, Art. 23(6) ). "Obligation to provide a certificate about the lifetime external costs produced by each vehicle" should therefore be changed to "obligation to provide proof about the lifetime external costs produced by each vehicle." If needed, it could be added "provide proof (through a certificate or any other appropriate means of proof) …"
Therefore this option cannot be considered as an alternative policy option.
Option LL9
Obligation for all providers of public transport services, public and private operators, to give preference in their vehicle procurement to the latest Euro standard adopted by Council and Parliament before general application, whenever vehicles are available on the market.
Impact Assessment on a new approach for the cleaner and more energy efficient vehicles directive proposal
23/45 pwc Advisory
Remark: This policy could be highly effective. On the other hand, it is difficult that all Member States would agree on a mandatory action.
Option LL10
Obligation for all providers of public transport services, public and private operators, to include environmental life-time cost in the procurement award criteria for all vehicles.
The cost of a vehicle, as an award criterion, should be calculated as the sum of purchasing price plus vehicle life-time costs for energy and a monetised value for CO2 and pollutant emissions (nitrogen oxides, particulate matter) linked to the operation of the vehicles to be procured.
Remark: This policy is expected to be highly effective, because internalising external costs is the most theoretically sound action. Anyway, it is difficult that all Member States would agree on a mandatory action.
3.1.3 Step 3: Drawing a shortlist of options
The following short list of options will be considered in this Study, accordingly to the considerations reported above.
Option SL1
Recommendation to all providers of public transport services, public and private operators, to give preference in their vehicle procurement to the latest Euro standard adopted by Council and Parliament before general application, whenever vehicles are available on the market.
Remarks on the methodology for Impact Assessment: In-depth quantitative assessment of this policy is possible, although its reliability will be heavily affected by the compliance rate of different subjects concerned. A sensitivity analysis could be carried out starting from results of a similar mandatory action on anticipated Euro standard (see Option SL3).
Option SL2
Recommendation to all providers of public transport services, public and private operators, to include environmental life-time cost in the procurement award criteria for all vehicles.
The cost of a vehicle, as an award criterion, should be calculated as the sum of purchasing price plus vehicle life-time costs for energy and a monetised value for CO2 and pollutant emissions (nitrogen oxides, particulate matter) linked to the operation of the vehicles to be procured.
Remarks on the methodology for Impact Assessment: In-depth quantitative assessment of this policy is possible, although its reliability will be heavily affected by the compliance rate of different subjects involved. A sensitivity analysis could be carried out starting from results of a similar mandatory action on inclusion of environmental life-time costs in the procurement award criteria (see Option SL4).
Option SL3
Obligation for all providers of public transport services, public and private operators, to give preference in their vehicle procurement to the latest Euro standard adopted by Council and Parliament before general application, whenever vehicles are available on the market.
Remarks on the methodology for Impact Assessment: In-depth quantitative assessment of this policy can be carried out.
Option SL4
Obligation for all providers of public transport services, public and private operators, to include environmental life-time cost in the procurement award criteria for all vehicles.

Impact Assessment on a new approach for the cleaner and more energy efficient vehicles directive proposal
24/45 pwc Advisory
The cost of a vehicle, as an award criterion, should be calculated as the sum of purchasing price plus vehicle life-time costs for energy and a monetised value for CO2 and pollutant emissions (nitrogen oxides, particulate matter) linked to the operation of the vehicles to be procured.
Remarks on the methodology for Impact Assessment: In-depth quantitative assessment of this policy is possible, although its reliability will be heavily affected by the compliance rate of different subjects involved. A sensitivity analysis could be carried out starting from results of a similar mandatory action on anticipated Euro standard (see Option 9).

Impact Assessment on a new approach for the cleaner and more energy efficient vehicles directive proposal
25/45 pwc Advisory
4 IMPACT ANALYSIS 4.1 Policy options to be assessed
Impact analysis aims at a quantitative estimation of the impacts produced in alternative scenarios for the public fleets’ procurement all over the EU-25 area.
Different scenarios are individuated depending on the kind of impact produced by the action/s undertaken.
Thus, we take into consideration 5 scenarios, representing respectively the implementation of the 4 policy options belonging to the short list and the ‘business as usual’ scenario, which is taken as reference scenario.
The scenarios/policy options are then identified as follows: a. Business as usual (BAU).
b. Recommendation to all providers of public transport services, public and private operators, to give preference in their vehicle procurement to the latest Euro standard adopted by Council and Parliament before general application, whenever vehicles are available on the market (EESO=Earliest Euro Standard - Optional).
c. Recommendation to all providers of public transport services, public and private operators, to include environmental life-time cost in the procurement award criteria for all vehicles to be procured (ILECO=Internalising Lifetime External Costs - Optional).
d. Obligation for all providers of public transport services, public and private operators, to give preference in their vehicle procurement to the latest Euro standard adopted by Council and Parliament before general application, whenever vehicles are available on the market (EESM=Earliest Euro Standard - Mandatory).
e. Obligation for all providers of public transport services, public and private operators, to include environmental life-time cost in the procurement award criteria for all vehicles to be procured (ILECM=Internalising Lifetime External Costs - Mandatory).
4.2 Methodology
4.2.1 Analysis coverage
The analysis covers all vehicle categories, i.e.:
Passenger Cars (PC)
Light Duty Vehicles (LDV)
Heavy Duty Vehicles (HDV)
Buses and Coaches (B&C)13
As for the pollution costs, the two more health damaging emissions are considered - NOx and particulate matter (PM) - at tail-pipe in real operational conditions; for the greenhouse effect, CO2 equivalent emissions during the whole Well-to-Wheel (WTW) fuel cycles are taking into account.
13 Distinction between HDV (that is, Trucks) and Buses and Coaches is useful because, even if they have the same standard emissions, their life cycles (urban rather than extra-urban) and their yearly mileage are quite different.

Impact Assessment on a new approach for the cleaner and more energy efficient vehicles directive proposal
26/45 pwc Advisory
In the ILEC scenarios the following fuel/technology options alternative to conventional ones, are considered as ripe enough for a commercial diffusion:
LPG
CNG
Biofuels
Electric vehicles
Hybrid vehicles
Remarks
It is worth mentioning that such a quantitative assessment is influenced by many relevant factors of uncertainty, concerning mainly:
The large uncertainty of emission and consumption factors, especially for alternative technologies and heavy duty vehicles, due to some unavoidable inconsistencies of data coming from different existing studies used for the purpose of this impact analysis;
The large difference between standard emissions and real-life emissions, which largely depends on driving behaviour and vehicle operating characteristics, as well as between different models of the same vehicle class, which can not be captured by average values; on the other hand, there are no comprehensive statistics on standard deviations, so that a disaggregate analysis would be impossible;
The compliance of public and private operators of public transport services with a given policy;
The estimation of the present and future composition of the public and private fleet of vehicles operating public transport services, which is not contained in separate registers and has been estimated in previous studies;
The evolution of the technology and the market of vehicles and energy production.
4.2.2 General assumptions
General assumptions are necessary to define the context of the analysis. They concern the time interval of the analysis, the current and future fleet composition in each scenario, compliance rate of public bodies with the new policy.
Policies are in force from 2007 to 2017 but analysis horizon extends to 2027 in order to take into account residual environmental benefits of vehicles purchased at the end of the policy period.
Size of vehicle fleet owned by public bodies and private companies operating public transport services under concession in 25EU is taken from previous PwC (2005) IA study.
As a first hypothesis, public bodies and privates operating public transport services are considered fully complying with mandatory policies. Sensitivity analysis is then carried out to estimate the effect of partial compliance.
As for as optional policies, we assume as a first hypothesis a compliance rate of 50%, which is anyway object of a sensitivity analysis.
In the Internalising Lifetime External Costs (ILEC) procurement scenarios, it is assumed that public transport service operators, will procure, for each class the vehicle technology that minimises the total (internal and external) lifetime cost linked to the operation of the vehicles to be procured. In this procurement process, all vehicles features are assumed to be available for all vehicle categories therefore resulting not relevant for the decision making process. It follows

Impact Assessment on a new approach for the cleaner and more energy efficient vehicles directive proposal
27/45 pwc Advisory
from these assumptions that non-optimal technologies will need matching the performances of the best choice; otherwise, they will be non-competitive and will exit from the market. In any case, one can assume that in ILEC procurement scenarios, all procured vehicles should have the least unit total (internal and external) lifetime costs.
Although the policy options to assess are technology-neutral, our analysis compares the average performances of vehicles of each technology. Results are quite obvious as far as the EES scenario. As for ILEC scenario, the final overall result is not affected, as we assume that all procured vehicles should have the least unit internal and external lifetime cost.
Conventional vehicles noxious emissions end energy consumption are considered on operative conditions, adopting average values carried out through simulations with the latest Copert software; this procedure implicitly takes into account that different models of the same Euro standard are often characterized by quite different values of emissions and energy consumption. Data on energy consumption and CO2 emissions highlight that such a spread of even 4 times. However, a comparative analysis considering all possible models of vehicles on the market would be impossible, because very little information is available on pollutant emissions of different vehicle models other than their emissions limits.
Environmental characteristics of alternative technologies have been derived from conventional ones, applying reduction coefficients taken from scientific and experimental sources.
Analysis is applied to EU-25, so far excluding Romania and Bulgaria due to a lack of complete data for these two countries; however, it is likely assume that final results on net and percent benefits and costs of different policies options are not highly affected from this negligence due to two main reasons: a presumable low incidence of these two Countries on public fleet procurement and the comparative terms of results (scenarios comparison).
4.2.3 Methodology for scenarios comparison
The methodology requires simulating the choice mechanism into the procurement process and then determines the composition of the public transport fleet. It is worth mentioning that this can be done in both cases of mandatory or optional agreement. The latter case will only need estimating the compliance rate on the basis of previous experience.
The flow diagram depicted in the following Figure 5.1 illustrates the application of the methodology to the five basic scenarios/policy options: Business As Usual (BAU), Early introduction of Euro Standards limits for regulated pollutant in case of Optional (EESO) or Mandatory (EESM) options; changing in procurement criteria Internalising Lifetime External Costs in case of Optional (ILECO) or Mandatory (ILECM) options.
In each scenario, a quantitative analysis is carried out by applying a methodology based on the following steps:
1. reconstruction of fleet composition trend (vehicle type, age distribution, technology, i.e.: fuel used and Euro standard), depending on the procurement criterion consistent with the policy option;
2. estimate traffic activity (average mileage, average speed, location of trips);
3. estimate emission factors for each vehicle category and technology;
4. determine unit costs for energy consumption as well as pollutant and GHG emissions for each vehicle category and technology;
5. estimate purchase cost trend for each vehicle category and technology;
6. estimate lifetime operational costs for each vehicle category and technology;
7. comparison of lifetime internal and external costs for the whole fleet in the whole time interval of the analysis.

Impact Assessment on a new approach for the cleaner and more energy efficient vehicles directive proposal
28/45 pwc Advisory
Figure 2 - Overall methodology for scenarios comparison to compare the five basic scenarios/policy
options: Business As Usual (BAU), Early introduction of Euro Standards limits for regulated pollutant in case of Optional (EESO) or Mandatory (EESM) options; changing in procurement criteria Internalising
Lifetime External Costs in case of Optional (ILECO) or Mandatory (ILECM) options.
20XY BAU total emis/cons
Annual procurement
Internalising Lifetime External costs (ILEC)
Business as Usual (BAU) Fleet composition trends
Early eurostandard Introduction Criteria (EES)
20XY BAU proc.
20XY ILECM proc.
20XY EESM proc.
Emis/cons factors
20XY ILECM total emis/cons
20XY EESM total emis/cons
EESM vs BAU
ILECO vs BAU
Average annual mileages
20XY ILECO proc.
20XY EESO proc.
20XY ILECO total emis/cons
20XY EESO total emis/cons
ILECM vs BAU
EESO vs BAU
Purchase & mainten. costs
POLICIES
MODEL
INPUT
OUTPUT
INPUT
INPUT

Impact Assessment on a new approach for the cleaner and more energy efficient vehicles directive proposal
29/45 pwc Advisory
4.2.4 Available data
Lots of data sources have been analysed in order to define a possible methodology for the impact assessment.
Environmental and energy costs estimation implies data on various aspects:
EU-25 public bodies vehicle fleets and procurements;
Vehicles energy and environmental performances in different traffic conditions;
Environmental and energy unit costs.
Data on the EU-25 public fleet were available from the first 2005 PwC study on the Directive proposal; such data are related to three time horizons 2006, 2011 and 2016 and each EU-25 Country; public fleets are disaggregated into vehicle categories and technology, without distinguishing among Eurostandard categories. In addition to such data, the TREMOVE project database contains a microscopic desegregation; of 21 European Countries national fleets for time horizons since 1990 till 2020; TREMOVE vehicle micro-categories comply with CORINAIR methodology for emission/consumption factors calculation but does not consider neither conventional vehicles improvement subsequent to EURO IV standards, nor alternative technologies.
As for emission and consumption factors of conventional technologies (gasoline, diesel, LPG), the most updated source is the COPERT IV software database, containing the coefficients for pollutant emissions calculation in certain operational conditions for 194 vehicle micro-categories, including the heavy vehicle categories analysed in the ARTEMIS project and the latest Euro IV standard models.
Regarding emission/consumption factors of alternative technologies, it does not exist a unique data source, therefore a wide research on experimental data has been carried out since the previous 2005 PwC study.
The recently updated Well-toWheels study on future automotive fuels and powertrains by JRC has been consulted as for the WTW unit CO2 emissions and energy consumption for different conventional and alternative fuels; in addition, the JRC study has given a reference Tank-to-Wheels energy consumption for medium-sized cars for all considered conventional and alternative technologies.
References for environmental costs are ExternE14, UNITE15, BeTa16 and CAFÉ17 EU studies and Eurostat statistics for energy costs.
4.2.5 Procurement estimate
In the previous 2005 PwC study an estimate of public bodies annual vehicles procurements had been already carried out. At EU-25 level the following global annual amounts by vehicle category resulted.
PC 110.000
LDVs 110.000
HDVs 35.000
Buses 17.000 14 Cf. “Extension of Accounting Framework and Policy Applications” - Final Report on Work Package 6, 15 July 2005. 15 Cf. references of the study in "The Environmental and Social Costs of Mobility in Italy - Fifth report" Ferrovie dello Stato, Amici della Terra, January 2006. 16 Cf. Netcen-AEA Technology (authors: Paul Watkiss and Mike Holland), “Estimates of the Marginal External Costs of Air Pollution in Europe” (2002). 17 Cf. "Damages per tonne emission of PM, NH3, SO2, NOx and VOCs from each EU25 Member State (excluding Cyprus) and surrounding seas", AEA Technology Environment, March 2005.

Impact Assessment on a new approach for the cleaner and more energy efficient vehicles directive proposal
30/45 pwc Advisory
Applying the same composition by technologies as the total public fleet, annual procurement had been shared as summarised in the following table.
Table 2 - Base case - Yearly procurement of public fleet
Base case – annual procurement Passenger cars
Light Duty Vehicles
Heavy Duty Vehicles Buses TOTAL
Conventional DIESEL 22.615 88.227 34.734 15.922 161.497
Conventional PETROL 85.714 20.189 216 733 106.854
Natural Gas – CNG 167 245 43 203 657
LPG 1.144 1.070 7 31 2.252
BIOFUEL - - - 46 46
ELECTRIC 287 269 - 36 591
HYBRID 73 - - 29 102
TOTAL 110.000 110.000 35.000 17.000 272.000
It has been assumed, as in the previous study, that the procurement amount is not variable during the time period of the analysis (2007 – 2017); of course, its composition varies according to the purchase criteria.
For the BAU scenario, we assumed that scrapped conventional vehicles are replaced with new ones complying with the current emissions Eurostandard. As for the alternative technologies already included in the public fleets, it is assumed that they are replaced with the same technology.
The following dates have been considered for the EURO V and EURO VI standards introduction.
Table 3 - Time horizons for next Eurostandards introduction hypothesis
EURO V EURO VI
Heavy Vehicles Oct. 2008 Oct. 2013
Passenger cars Sept. 2009 Sept. 2014
Light Duty Vehicles Sept. 2010 Sept. 2015
These dates have been shifted one year later, passing from homologation to commercialisation obligation. In practise, for the BAU scenario, it has been assumed that new vehicles correspond to EuroIV standards till October 2009, September 2010, September 2011 respectively for HDVs, PCs, LDVs; from these horizons to five year later purchases will comply with Euro V standards, and then with EuroIV.
In the Early introduction of Euro Standard - Mandatory option scenario (EESM) procurement composition has been estimated starting from the correspondent BAU ones, simply replacing, in the period between 2012 and 2017, EURO V with EURO VI and EURO VI with EURO VII; the basic assumption is that vehicles models accomplishing next Euro standards are available on the market from the very beginning of a certain Euro standard period.
In case of optional agreement (EESO scenario), it has been assumed that 50% of new conventional vehicles comply with the current Eurostandard and the remaining 50% with the next emissions

Impact Assessment on a new approach for the cleaner and more energy efficient vehicles directive proposal
31/45 pwc Advisory
limitations; a sensitive analysis has been then carried out in order to evaluate possible variation of compliance rate.
Vehicle procurement in ILECM scenarios is computed by assuming that all public and private operators providing public transport services choose, in their procurement process, those vehicles that minimise the lifetime internal and external costs.
Of course, we do not expect that public bodies will purchase only specified technologies (in fact, a complete shift from gasoline to LPG/CNG/electrical appears unlikely) but we consider that, when pushed from demand, automotive industry will adapt its new products to the best performances required from the market.
Indeed, the more likely effect is a shift in demand between different models of the same technology and this is consistent with the technology-neutral nature of the internalizing life-time external cost policy. Thus, the methodology of the study focuses on a shift of performances instead of a shift of technologies.
For the optional option (ILECO), similarly as for the EESO, it is assumed that the agreement compliance rate is 50%; consequently 50% of vehicle purchasing will correspond to the best market alternative in terms of overall costs during lifetime (included external costs) and the remaining 50% will follow BAU criteria; also in this case, a sensitivity analysis has been implemented in order to evaluate consequences of compliance rate variation.
Procurement compositions assumed for all possible policy options are summarised in Annex II while Annex III contains methodology and results of the technologies comparison carried out in order to determine the best vehicles overall performances to be considered in the ILCs scenarios.
Extra-purchase costs in different policy options for different scenarios are summarized in the table below.
Table 4 Purchase costs for the annual procurement by scenario
4.3 Energy and environmental impacts estimate Starting from the procurement composition and vehicles energy and environmental characteristics (see Tables 3 to 6 in Annex III), total emissions and consumption have been calculated for the years 2007, 2012, 2017, using the following average annual mileage for vehicle categories.
Table 5 - Annual mileages by vehicle category
Pass cars LDVs. HDVs Buses
16.000 21.000 100.000 80.000
2007 2012 2017
Scenarios Comparison
Purchase Cost
(ml euro)
Difference with BAU (ml euro)
Relative difference with BAU
Purchase Cost
(ml euro)
Difference with BAU (ml euro)
Relative difference with BAU
Purchase Cost
(ml euro)
Difference with BAU (ml euro)
Relative difference with BAU
BAU 11.643 0 0,0% 11.746 0 0,0% 11.816 0 0,0% EESO 11.694 52 0,4% 11.781 138 1,2% 11.850 208 1,8%
ILECO 12.347 704 6,0% 12.399 756 6,5% 12.433 791 6,8% EESM 11.746 103 0,9% 11.816 173 1,5% 11.885 243 2,1%
ILECM 13.051 1.408 12,1% 13.051 1.408 12,1% 13.051 1.408 12,1%

Impact Assessment on a new approach for the cleaner and more energy efficient vehicles directive proposal
32/45 pwc Advisory
These values take into account that our Cost/Benefit analysis consider a ten years life time for all vehicle categories. We estimated total annual NOx/PM/WTW CO2 emissions and TTW energy consumption for all procurement scenarios (see table below); the following symbols are used for measure unites: kt=kilo tonnes; TJ=tera Joule=1012J.
Table 6 - Noxious emissions and energy consumption for the annual procurement by scenario – 2007
absolute values
NOx PM WTW CO2 Energy consumption 2007
T t Kt TJ BAU 37.913 437 6.676 76.628
EESO 30.945 407 6.676 76.628
ILECO 24.406 274 6.040 68.292
EESM 23.977 376 6.676 76.628
ILECM 10.899 110 5.405 59.956
Table 7 - Noxious emissions and energy consumption for the annual procurement by scenario – absolute differences respect to Business as Usual in 2007
NOx PM WTW CO2 Energy consumption 2007
T t Kt TJ EESO -6.968 -30 0 0
ILECO -13.507 -164 -635 -8.336
EESM -13.935 -61 0 0
ILECM -27.014 -327 -1.271 -16.671
Table 8 - Noxious emissions and energy consumption for the annual procurement by scenario – percent differences respect to Business as Usual in 2007
NOx PM WTW CO2 Energy consumption 2007
% % % % EESO -18% -7% 0% 0%
ILECO -36% -37% -10% -11%
EESM -37% -14% 0% 0%
ILECM -71% -75% -19% -22%
Table 9 - Noxious emissions and energy consumption for the annual procurement by scenario – 2012 absolute values
NOx PM WTW CO2 Energy consumption 2012
T t Kt TJ BAU 23.977 376 6.675 76.628
EESO 19.614 372 6.675 76.628
ILECO 17.405 243 5.701 68.292
EESM 15.251 368 6.675 76.628
ILECM 10.832 110 4.727 59.956

Impact Assessment on a new approach for the cleaner and more energy efficient vehicles directive proposal
33/45 pwc Advisory
Table 10 - Noxious emissions and energy consumption for the annual procurement by scenario – absolute differences respect to Business as Usual in 2012
NOx PM WTW CO2 Energy consumption 2012
T t Kt TJ EESO -4.363 -4 0 0
ILECO -6.573 -133 -974 -8.336
EESM -8.726 -8 0 0
ILECM -13.145 -266 -1.947 -16.671
Table 11 - Noxious emissions and energy consumption for the annual procurement by scenario – percent differences respect to Business as Usual in 2012
NOx PM WTW CO2 Energy consumption 2012
% % % % EESO -18% -1% 0% 0%
ILECO -26% -23% -11% -11%
EESM -37% -2% 0% 0%
ILECM -51% -47% -21% -22%
Table 12 - Noxious emissions and energy consumption for the annual procurement by scenario – 2017 absolute values
NOx PM WTW CO2 Energy consumption 2017
T t Kt TJ BAU 15.251 368 6.675 76.628
EESO 12.510 368 6.675 76.628
ILECO 13.041 239 5.701 68.292
EESM 9.769 367 6.675 76.628
ILECM 10.832 110 4.727 59.956
Table 13 - Noxious emissions and energy consumption for the annual procurement by scenario –absolute differences respect to Business as Usual scenario in 2017
NOx PM WTW CO2 Energy consumption 2017
T t Kt TJ EESO -2.741 -1 0 0
ILECO -2.209 -129 -974 -8.336
EESM -5.482 -1 0 0
ILECM -4.419 -258 -1.947 -16.671

Impact Assessment on a new approach for the cleaner and more energy efficient vehicles directive proposal
34/45 pwc Advisory
Table 14 - Noxious emissions and energy consumption for the annual procurement by scenario – percent differences respect to Business as Usual in 2017
NOx PM WTW CO2 Energy consumption 2017
% % % % EESO -18% 0% 0% 0%
ILECO -14% -35% -15% -11%
EESM -36% 0% 0% 0%
ILECM -29% -70% -29% -22%
It is worth noting that differences in pollutant emissions decrease along the analysis period due to the upgrading in conventional technologies in BAU scenario, in passing from EURO IV to EURO VI standards. On the contrary, energy consumption and CO2 emission differences are invariable with respect to the year, as we assumed the same consumption factors up to introduction of EURO VII. This implies that no differences arise in energy consumption and CO2 emission between BAU and the two EES scenarios.
Figures in Annex IV depict scenarios comparison, showing that all alternatives are significantly beneficial in terms of noxious emissions reduction.
The percent gain in CO2 emission (-29%) is notable in ILECM scenario but the direct contribution of the policy option to the reduction of global CO2 emission is quite modest, due to the small quota of public procured vehicles with respect to the whole vehicle fleet. As a matter of fact, the total saving of CO2 emissions in ILECM scenario is about 1,9 million tonnes per year. Even if the contribution of new vehicles were summed up to the existing fleet every year, the average contribution would result a quite negligible value with respect to the total amount of CO2 emissions due to transport activities, which is as about 1 billion tonnes/year (elaboration from TREMOVE 2.44 database).
The impact of pollutant emissions on the human health depends on the exposure of people and ecosystems and therefore it is more relevant in towns than in rural areas. The quota of emissions of NOx and PM in urban areas due to the overall traffic in EU is about 15% and 20%, respectively (elaboration from TREMOVE 2.44 database). The same quota could be adopted cautiously also for vehicles operating public transport services, although it is expected that they operate mainly in urban areas.
NOx, PM, WTW eq.CO2 emissions and TTW energy consumption (by source) represent the key elements for environmental and energy costs estimation by means of convenient unit costs.
Studies on the actual negative effect of traffic emissions have carried out reference values per unit of pollutant emitted. Of course, such values vary in relation with territorial context; nevertheless average values at EU-25 level have been estimated in particular by the BeTa, ExternE, UNITE and CAFÉ projects, whose results we adopted for our present analysis (see table below).
Table 15 - Unit external costs for emissions
NOx (Euro/g) PM (Euro/g) GHG (Euro/kg)
0,0044 0,0871 0,020
The unit external cost of NOx has been taken from CAFÉ, which is the most updated source. The suggested value as 0,0044€/g is consistent with earlier study BeTa, which indicated 0,42€/g (2000 prices).
The value for PM is estimated by BeTa. Indeed, the external cost of PM is highly dependent on the population exposed to emissions. Since CAFÉ provides only an average value for rural and urban areas, it not suitable for the scope of this study, which refers mainly to urban and metropolitan areas.

Impact Assessment on a new approach for the cleaner and more energy efficient vehicles directive proposal
35/45 pwc Advisory
However, BeTa provides a more detailed estimate of PM2.5 external cost for rural and urban areas, depending also on the town size. In order to obtain an average value, we applied TREMOVE model to estimate the share of distance travelled yearly in urban or metropolitan areas by buses, which can be taken as typical vehicle class to representative of procured vehicles by operators of public transport services. Values obtained are 25,3% in urban areas and 74,7% in metropolitan. By assuming a typical population of 100,000 for towns and 1,000,000 population for metropolitan areas, we obtain respective unit values for the external costs of PM as 0.033€/g and 0.2475€/g. The average value is then: 0,0872€c/g. Values are expressed in prices 2000, so that disregarding actualization should compensate neglecting the small rural share of PM emissions.
Unit external cost for CO2 emission are derived from UNITE project (2003), which consider a reduction cost central between two possible emission trade scenarios: world-wide (5 €/t) and EU-only (38 €/t); in the final report of ExternE project on externalities of energy (2005), it is considered an unit cost for GHG emission amounting to 19 €/t , very close to the UNITE estimate.
As for energy, we assumed the unit industrial costs showed in the following table. These values are referred to an average EU-25, according to Eurostat and other national and European sources; of course they are only reference values as energy costs highly vary in time and space.
Table 16 - Unit energy costs (Euro/GJ)
Gasoline Diesel LPG CNG FAME Ethanol Electricity
16.00 15.00 15.00 14.00 20.00 26.00 22.00
Using these cost factors, we evaluated environmental and energy costs for each policy option, at the temporal horizons of analysis. Results are depicted in Annex V.
Those values have then alimented the CBA procedure described in the following section.
4.4 Cost-Benefits Analysis Cost-Benefit Analysis (CBA) entails identifying and evaluating expected economic, environmental and social benefits and costs of proposed public initiatives. All these items are expressed in monetary terms. An option is considered justified where net benefits can be expected from the intervention.
The “business as usual” is taken as reference scenario. The BAU, also defined as no policy option, implies that only policies implemented so far are taken into account. Pollutant emissions are reduced accordingly to progressive evolution of Euro standards; reductions of green house gas and energy consumptions are almost due to optional agreement by industry and technological development. Procurement of vehicles by public bodies is assumed to continue following the same decisional criteria as today for the whole time horizon of analysis. Annual vehicle procurement at a given year is assumed invariable during the analysis horizon (see Annex 2).
In each scenario, a quantitative analysis of impacts is carried out on the basis of the methodology described in the previous section.
Economic impacts concern both internal and external costs. The former are related to expenses of public transport service operators to provide their service and they include purchase costs and operational costs. By assuming that all costs related to crew, depots and plants are independent of the policy option on vehicle procurement, and considering that energy costs are already accounted in the environmental impact, the only relevant issues of operational costs are due to vehicle maintenance. Anyway, analyses conducted on both literature data and market prices for vehicle maintenance revealed that many data and study results are contradictory, so that no significant difference between traditional and alternative technologies can be deduced. Consequently, maintenance costs are neglected in the analysis, while on the other hand being included in the guidelines for the

Impact Assessment on a new approach for the cleaner and more energy efficient vehicles directive proposal
36/45 pwc Advisory
implementation of the methodology for internalising external lifetime costs in the vehicle procurement process (see Annex 7).
External costs, in this context, account for all costs linked to the operation of the vehicles to be procured, costs that are not paid by the transport operator, but are relevant for the environment, social welfare and the economy in general.
4.4.1 Cost/Benefits assumptions
It is assumed that the policy option could enter into force in 2007 and affects the public procurement of vehicles till 2017. This is due to the difficulty to predict technology evolution after 2017, which will likely push this time the production of new vehicles to be compliant to more restrictive environmental standards.
The same commercial 10 years lifetime and the same residual values at the end of the lifetime are assumed for all categories of vehicles. This is a cautious assumption, mainly for heavy vehicles, as we disregarded possible environmental benefits occurring after the 10th year of vehicles lifetime.
As the average lifetime of vehicles is assumed for a period of 10 years, the study covers a time interval ranging from 2007 to 2027.
Current vehicle costs are referred to an average vehicle that is representative of each of the following vehicle classes: passenger cars, light duty vehicles (LDV), heavy duty vehicles (HDV), buses.
Estimates of the present average purchase costs for different vehicle categories are the ones used for technology comparison, shown in Annex-3 – Table 9
Technological research and development will have the effect to increase vehicle performances at a given price rate and, on the other hand, decrease the costs of newer technologies until new Eurostandards come into force.
All taxes and charges are disregarded.
Costs connected to energy are considered in the CBA in order to take into account possible differences among considered fuels; for each of them a unit cost of consumed energy has been evaluated - assuming the current production and distribution processes - and then applied to vehicle kilometric consumption.
Benefits consist in avoided external costs and can be calculated applying reference unit external costs at reduction in pollutant and Green House Gas (GHG) emissions.
A discount rate of 4% is assumed, accordingly to EU Guidelines for impact assessment.
Environmental costs include the costs of pollutants and GHG emissions, as well as energy production costs. Monetary values of pollution damages are taken from ExternE, UNITE, CAFÉ and BeTa studies.
4.4.2 Cost/Benefits Results All vehicle categories The Table below summarises the costs of pollutant emissions, green house gas emissions, energy consumption and vehicle procurement in the different scenarios for all vehicle classes. All values are expressed in monetary terms and are referred to the period 2007-2027, which covers the average lifetime of procured vehicles.

Impact Assessment on a new approach for the cleaner and more energy efficient vehicles directive proposal
37/45 pwc Advisory
As the analysis mainly focuses on the differences between policy and no policy options, all results are referred only to the procured vehicles. Table 17 - Scenarios Comparison– Economic impacts in the 2007-2027 period – total present costs
Scenarios Comparison
Economic Impacts in period 2007-2027
Pollutant emissions
GHG Emissions
Energy (excl. taxes) Purchase TOTAL COSTS
BAU ml euro 15.132 13.217 116.840 106.855 252.044 EESO ml euro 12.890 13.217 116.840 107.228 250.176
ILECO ml euro 10.444 11.972 106.172 112.681 241.270 EESM ml euro 10.649 13.217 116.840 107.601 248.307
ILECM ml euro 5.757 10.727 95.504 118.507 230.495
A comparison among scenarios is shown in the following Tables, which compare environmental and purchase costs of different procurement policy options versus base case scenario, in absolute values as well as in comparative values.
Tabella 18 - Scenarios Comparison– Economic impacts in the 2007-2027 period – net benefits
BENEFITS COSTS Scenarios Comparison
Economic Impacts in period 2007-2027
Pollutant emissions
GHG Emissions
Energy (excl. taxes) Purchase
NET BENEFITS
EESO ml euro 2.242 0 0 373 1.869 ILECO ml euro 4.687 1.245 10.668 5.826 10.775 EESM ml euro 4.483 0 0 746 3.737
ILECM ml euro 9.375 2.490 21.336 11.652 21.549
Table 19 - Scenarios Comparison– Economic impacts in the 2007-2027 period – percent benefits
BENEFITS COSTS Scenarios Comparison
Economic Impacts in period 2007-2027
Pollutant emissions
GHG Emissions
Energy (excl. taxes) Purchase
NET BENEFITS
EESO ml euro 15% 0% 0% 0% 1% ILECO ml euro 31% 9% 9% 5% 4% EESM ml euro 30% 0% 0% 1% 1%
ILECM ml euro 62% 19% 18% 11% 9%
The following considerations can be drawn from these results:
EESO scenario allows a significant benefit (15%) due to the reduction of pollutant emissions, no significant effect on CO2 emissions and requires a small percent increase of purchase cost (about 400 mln euro, less than 1%). Benefits exceed extra costs as about 1.869mln in the whole analysis period, so that the total costs are slightly smaller (less than -1%) than those of the BAU scenario and then a 1% net benefit is achieved.
ILECO scenario allows reducing all factors of external costs (specifically, pollutant emissions as -31%, CO2 as -9%) as well as energy consumptions (-9%), while the purchase costs increase as 5%. The overall benefit of ILECO policy is estimated as a 4% decrease of total costs.
ESM scenario reduces pollutant emissions costs as about -30%, while the purchase cost increases as +1%. In absolute monetary values, net benefits are about 3.800mln (that is about 1% of total costs in the reference scenario).

Impact Assessment on a new approach for the cleaner and more energy efficient vehicles directive proposal
38/45 pwc Advisory
ILECM scenario, as expected, produces the largest benefits (9% globally), provided that the vehicle procurement process is performed accordingly to the same criterion used for the Cost-Benefits Analysis; benefits are linked to both environmental costs reduction (-62% pollution costs, -19% GHG emission cost) and energy costs reduction (-18%) and are partially balanced by higher purchase costs (+11%) .
It is worth mentioning that such results are obtained in some cautionary hypotheses. In fact:
unit energy consumption of new Euro standard vehicles does not change respect to the previous Euro standard, although it is expected that policies addressed to reduce CO2 emissions induce vehicles manufacturers reducing energy consumption;
ILECO and ILECM scenarios are also expected inducing technological improvement of clean vehicles in order to comply with environmental award criteria introduced into the procurement process;
larger benefits of ILECO and ILECM scenarios could be expected from further increase of crude oil price.
The Figures below depict the time evolution of the annual environmental benefits and extra costs due to the various procurement options with respect to the no policy one. Extra costs decrease in the time because of technological development that is expected reducing costs of newer technologies (in particular hybrid vehicles) relatively to traditional ones. Benefits increase until 2017, but at a lower rate because of the progressive evolution of Euro standards, which will enforce traditional gasoline and diesel vehicles to reducing their pollutant emissions. In the time interval 2017-2027, we assumed the policy action will no longer affect public procurement of vehicles and then benefits are decreasing due to a decrease in the number of vehicles that comply with the policy.
CBA Analysis for EESM and EESO scenarios
-
50
100
150
200
250
300
350
400
2007
2008
2009
2010
2011
2012
2013
2014
2015
2016
2017
2018
2019
2020
2021
2022
2023
2024
2025
2026
2027
Years
Costs
[mln
€]
EESM Benefits EESM Extra purchaseEESO Benefits EESO Extra purchase
Figure 3 – Trends of Costs and Benefits of EESM and EESO procurement policy against Base Case

Impact Assessment on a new approach for the cleaner and more energy efficient vehicles directive proposal
39/45 pwc Advisory
CBA Analysis for ILECM and ILECO scenarios
-
500
1.000
1.500
2.000
2.500
3.000
3.500
2007
2008
2009
2010
2011
2012
2013
2014
2015
2016
2017
2018
2019
2020
2021
2022
2023
2024
2025
2026
2027
Years
Costs
[mln
€]
ILECM Benefits ILECM ExtrapurchaseILECO Benefits ILECO Extra purchase
Figure 4 Trends of Costs and Benefits of ILECM and ILECO procurement policy against Base Case
The picture highlights that all the policies can provide positive economic impacts also in the period 2007-2017 when it is assumed the policy affects the vehicle procurement process. This implies that the results of CBA are independent of the discount rate, therefore making meaningless the Internal Return Rate computation.
Single vehicle categories A detailed analysis of results obtained by applying separate Cost-Benefits Analyses to the implementation of the different policy options to single vehicle categories is reported in Annex VI.
The table below summarises the results in terms of total internal and external costs of each policy option for the different vehicle categories.
Table 20 - CBA results for each vehicle category – total present costs
TOTAL COST Scenarios Comparison
Economic Impacts in period 2007-2027
Passenger car LDV HDV BUS
BAU ml euro 27.777 29.550 118.088 76.629 EESO ml euro 27.829 29.438 116.882 76.026
ILECO ml euro 27.519 28.570 111.282 73.898 EESM ml euro 27.881 29.327 115.676 75.422
ILECM ml euro 27.260 27.591 104.476 71.167
Tabella 21 - CBA results for each vehicle category – net benefits
NET BENEFITS Scenarios Comparison
Economic Impacts in period 2007-2027
Passenger car LDV HDV BUS
EESO ml euro -52 111 1.206 603
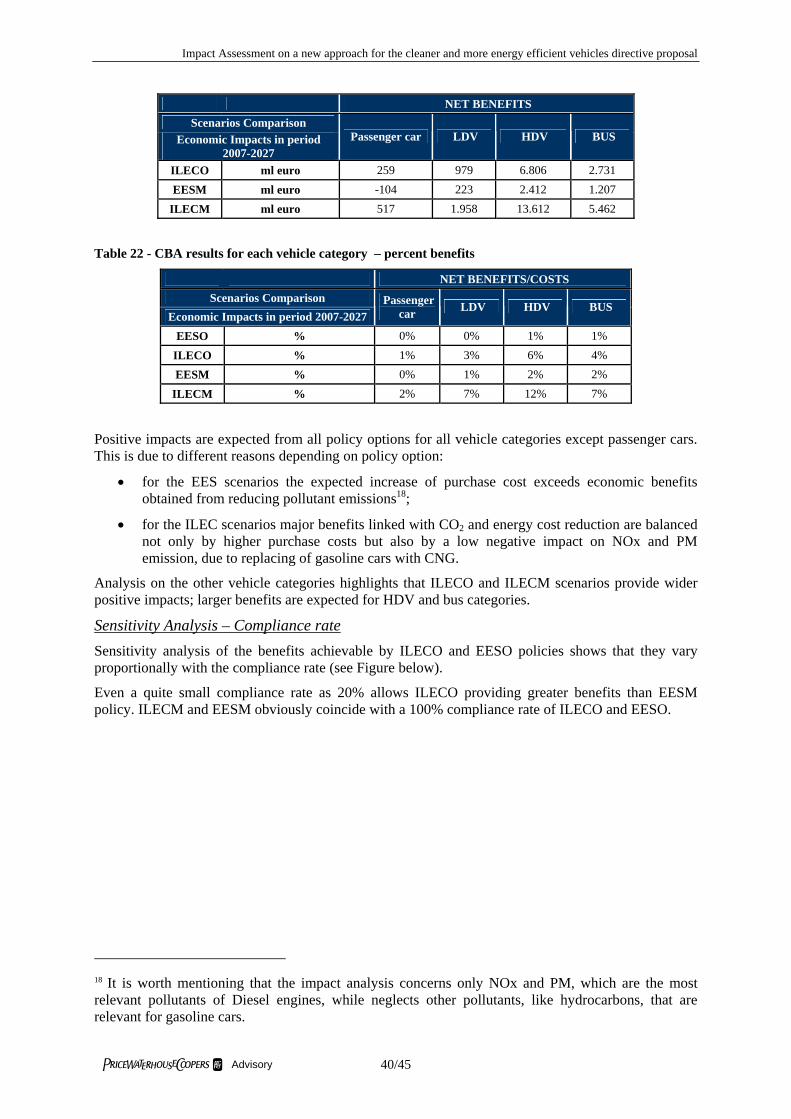
Impact Assessment on a new approach for the cleaner and more energy efficient vehicles directive proposal
40/45 pwc Advisory
NET BENEFITS Scenarios Comparison
Economic Impacts in period 2007-2027
Passenger car LDV HDV BUS
ILECO ml euro 259 979 6.806 2.731 EESM ml euro -104 223 2.412 1.207
ILECM ml euro 517 1.958 13.612 5.462
Table 22 - CBA results for each vehicle category – percent benefits
NET BENEFITS/COSTS Scenarios Comparison
Economic Impacts in period 2007-2027 Passenger
car LDV HDV BUS
EESO % 0% 0% 1% 1% ILECO % 1% 3% 6% 4% EESM % 0% 1% 2% 2%
ILECM % 2% 7% 12% 7%
Positive impacts are expected from all policy options for all vehicle categories except passenger cars. This is due to different reasons depending on policy option:
• for the EES scenarios the expected increase of purchase cost exceeds economic benefits obtained from reducing pollutant emissions18;
• for the ILEC scenarios major benefits linked with CO2 and energy cost reduction are balanced not only by higher purchase costs but also by a low negative impact on NOx and PM emission, due to replacing of gasoline cars with CNG.
Analysis on the other vehicle categories highlights that ILECO and ILECM scenarios provide wider positive impacts; larger benefits are expected for HDV and bus categories.
Sensitivity Analysis – Compliance rate Sensitivity analysis of the benefits achievable by ILECO and EESO policies shows that they vary proportionally with the compliance rate (see Figure below).
Even a quite small compliance rate as 20% allows ILECO providing greater benefits than EESM policy. ILECM and EESM obviously coincide with a 100% compliance rate of ILECO and EESO.
18 It is worth mentioning that the impact analysis concerns only NOx and PM, which are the most relevant pollutants of Diesel engines, while neglects other pollutants, like hydrocarbons, that are relevant for gasoline cars.

Impact Assessment on a new approach for the cleaner and more energy efficient vehicles directive proposal
41/45 pwc Advisory
Net benefits respect compliance rate
-
5
10
15
20
25
0% 10% 20% 30% 40% 50% 60% 70% 80% 90% 100%
Bene
fits [
billi
ons €
]
EESO ILECO
Figure 5 - Sensitivity analysis of Benefits with respect to compliance rate

Impact Assessment on a new approach for the cleaner and more energy efficient vehicles directive proposal
42/45 pwc Advisory
5 Monitoring process and administrative costs According to the Commission’s rules of evaluation (Communication on Evaluation SEC(2000)1051), all programs have to be evaluated on a regular basis, implementing a reporting system that will measure the extent of achievement of policy objective.
The main objective of the report system should be the measurement of the level of compliance of public procurement to the proposed policy option. Consequently, the only indicator to develop will be the ratio between the “compliant” public procurement and the total.
To achieve this objective, it is necessary to identify certain elements such as :
the level of accuracy of the controls;
the level of the activity control (European, national or local);
the frequency of reporting;
the number of full time equivalent employees (FTE) - involved.
In order to achieve the objectives above, the Workgroup has made the following suggestions.
Setting up an auto-certification system will enable to measure efficiently the level of compliance. An internet portal should be created to allow the officer responsible for the contracting entity to register and auto-certificate the compliance with the proposed policy for each public procurement issued.
Periodically an audit team, with multi-language skills, will verify the compliance of a number of public procurements against the procurement guidelines requesting evidence of compliance of the procurement process to the national/local public tendering entity. The coverage percentage (and the relative resources to perform the audit) will be defined by the audit team responsible. An example of estimation of monitoring costs is the following:
In EU-25 there are about 272.000 public procurements of vehicles per year. If we assume an audit coverage of 15%, the total cost for FTEs per year is calculated in the following table:
Table 4 – FTEs and total costs for annual audit
Total Public Procurement of vehicles in
Europe
(EU-25)
Average number of
vehicles per tender
Average number of
tenders
Audit Coverage
Total tenders to
audit
Average no. of man days
per single audit
Total number of FTE for annual
audit (220 working days
per year)
Total annual
FTEs cost
272.000 10 27.200 15% 4.080 3 56 € 1.813.745
If we consider a coverage of 15% for the first 5 years and then have a progressive reduction, also the costs will gradually decrease.
Given that the average labour cost for a FTE in public administration in EU27 was 32,6 Keuro per year in 2004 , the total cost to employ 56 extra FTEs will be 1,8 Ml euro. This calculation shows that the costs to set up such monitoring process, if compared with the benefits obtained, is not significant.
Besides this, a helpdesk (including also some resources from audit team) could be adopted to support the monitoring of the implementation of the ILEC procurement.

Impact Assessment on a new approach for the cleaner and more energy efficient vehicles directive proposal
43/45 pwc Advisory
It has to be noted that this type of audit has been designed specifically for the ILECM option in order to fully support its implementation and especially to effectively address the monitoring process. However, some lighter processes to monitoring the implementation of the ILEC options can be envisaged, these would only be focusing on the checking of the compliance of the public procurement to the new European guidelines. This would significantly reduce the number of FTEs and the associated costs of 70-80% of the audit cost.

Impact Assessment on a new approach for the cleaner and more energy efficient vehicles directive proposal
44/45 pwc Advisory
6 Results and conclusions A set of suitable policy options has been individuated in agreement with EU Commission on the basis of previous studies conducted by the EC, results of public consultation, opinions provided by stakeholders interviewed.
Five scenarios have been analysed and quantitative assessment and economic comparison has been carried out by applying the well-established Cost-Benefits Analysis method.
Results of the environmental impact analysis: - Significant reduction in pollutant emission, ranging from -36% NOx in EESM scenario to about –
29% NOx and -70% PM in ILECM scenario in 2017, after introduction of more advanced conventional convention technologies; this leads to improvements in health condition, mainly in urban areas, where public fleets mostly operate.
- A contribution to global warming reduction is expected from ILECO and ILECM policy options, which could reduce CO2 emissions as about 974 kt/year and 1.974 kt/year, respectively.
- An increase in differentiation of energy sources and a reduction in the consumption of non renewable energy resources is estimated in the ILEC scenarios.
Results of Cost-Benefits Analysis are hereinafter summarised:
As expected, ILEC provides the highest benefits since it has been defined in order to pursue a general economic objective that reflects both operators’ and society point of view.
In ILECM scenario extra expenditures up to 11% are expected in procurement process (about +12,000 millions euro in the period 2007-2027) but public transport operators benefit of energy cost reduction which amounts to about 21,000 millions euro (without considering less excises and taxes); benefits due to pollutant and GHG emissions amount as about 9,000 millions euro and about 2,500 millions euro, respectively.
Larger benefits of ILEC scenarios could be expected from further increase of crude oil price.
ILEC is expected inducing technological improvement of clean vehicles in order to comply with environmental awarding criteria introduced into the procurement process.
EES scenarios produce significant environmental benefits but introduce a comparable increase of purchase costs, so that negligible total benefits are expected in the EES scenarios. It is worth mentioning that these results are obtained in the cautionary hypothesis that unit energy consumption of new Euro standard vehicles does not change respect to the previous Euro standard, although it is expected that policies addressed to reduce CO2 emissions induce vehicles manufacturers in reducing energy consumption.
The analysis neglects some relevant environmental and macro-economic benefits of ILEC scenarios, due to increasing differentiation of energy sources and reducing consumption of non renewable energy resources.
Additional considerations on policy measures:
Intelligent Transportation Systems (ITS) can provide many opportunities to improve energy efficiency of transport and reduce its impact on the environment. ITS applications concern both vehicle technology and advanced management of the transportation system.
Specific devices or vehicle components (e.g.: automated speed control, tyre pressure checking device, speed limiter, On-Board Device for emission and consumption measurement) could be effective to reduce emissions and energy consumption, as they would allow monitoring real vehicle performances on the road continuously. It would be then possible to detect and if possible correct the effects of bad maintenance or incorrect driving behaviour. On-Board Devices could be then very useful as a support for education programs to eco-driving and eco-maintenance, as they would provide ex-post assessment.
Impact Assessment on a new approach for the cleaner and more energy efficient vehicles directive proposal
45/45 pwc Advisory
Promising technology opportunities are expected from a wider application of ITS technology to continuous monitoring of road transportation network. This could make it possible to apply congestion charging or credit systems depending in real-time on measured externalities.
All these measures could be included in actions addressed to the procurement of vehicles operating public transport services.
Anyway, more experiments and pilot studies are required to allow a quantitative estimation of these measures and compare their effectiveness with those of other advanced management systems that integrate traffic control and traveller information systems.
The Internalising Lifetime External Cost (ILEC) policy options (optional or mandatory) are based on a sound methodology and resulted the most environmentally and economically effective. However, due to the fairly complexity of the methodology to be used for the calculation of the awarding criteria, particularly some small operators of public transport services could face difficulties in adopting the ILEC procurement process. Thus, specific tools could be suitably developed to support public transport operators to apply the ILEC methodology. Suggestions for issuing Guidelines are provided in Annex 7. A website containing a database and a calculator of internal and external costs of vehicles could be designed and developed to facilitate a smother implementation of ILEC procurement process. As an example, a similar website has been developed in the Energystar Programme (i.e. http://www.eu-energystar.org/).

Annex 1 Stakeholder Consultation
September 2007

Impact Assessment on a new approach for the cleaner and more energy efficiency vehicles directive proposal Annex 1 – Stakeholder consultation
1 Introduction This annex aim to summarize the contents and the main point of views in the Public consultation on the "Green Paper on Urban Transport " launched in July 2005. The documents of stakeholder consultation is available online at the following address: http://ec.europa.eu/transport/clean/green_paper_urban_transport/public_consultation_en.htm.
2 Stakeholder consultation In order to collect the different views on the Green Paper and urban transport in general, the European Commission organised between January and June 2007 an internet consultation, a technical workshop ("Urban transport and green propulsion", 31/01/2007) and two stakeholder conferences: - the Joint Expert Group on Transport and Environment Meeting of 30 March 2007 - the Public consultation of Stakeholder by internet (Question 10)
2.1.1 Technical workshop All the interventions held during the Technical workshop have been analyzed in depth in order to identify the alternative policy options (Figure 1: Identification of policies – Technical workshop (1/3) to Figure 3: Identification of policies – Technical workshop (3/3))
1 pwc Advisory

Impact Assessment on a new approach for the cleaner and more energy efficiency vehicles directive proposal Annex 1 – Stakeholder consultation
Figure 1: Identification of policies – Technical workshop (1/3)
ID Meeting Subject Speaker Summary Elements for identification of proposed actions/policy
instruments
1
31/01/2007I Technical Workshop "Urban transport and green propulsion": minutes of meeting
Clean and energy efficient vehicle technologies
Mr. Kai Lucke, Director Public Affairs, ACEA
ACEA stresses that the available technology on clean and energy efficient vehicles should not be made mandatory, and that cost-effectiveness is one of the key elements to be taken into account.For ACEA, the environmental challenge is fleet renewal, not lower limits of new vehicles, as:- Average fleet age is 16 years in some new Member States;- Costly measures delay fleet renewal (issue of affordability)- Negative environmental effect if Euro 5 keeps Euro 0 cars on the road.As far as future diesel control technologies (NOx emissions) are concerned:- For De-NOx catalyst, major development efforts are required before technology can be considered ready for full-scale production. The main concern is durability.- For SCR (Selective Catalytic Reduction), practical issues still require solutions (e.g.packaging, periodic refilling, network, ...).Concerning air quality and CO2, a trade-off has to be taken into account, as follows:- Emissions reduction vs. CO2 reduction- Size of trade-off depends on many factors and varies between engines
Fiscal/technology- Cost-effectiveness (mandatory)- Incentive by tax- Monitoring for CO2 emission- Technical recommendations for policy options (checking tyre pressure, improving infrastructures, eco-driving…)
2
31/01/2007I Technical Workshop "Urban transport and green propulsion": minutes of meeting
Well-to-Wheels analysis of future automotive fuels and power trains in theEuropean context
Mr Vincent Mahieu, Transport and Air Quality Unit, Institute for Environment &Sustainability, JRC Ispra
The objectives of this Study are the following:- Establish, in a transparent and objective manner, a consensual well-to-wheels energyuse and GHG emissions assessment of a wide range of automotive fuels andpower trains relevant to Europe in 2010 and beyond;- Consider the viability of each fuel pathway and estimate the associated macroeconomiccosts;- Have the outcome accepted as a reference by all relevant stakeholders.
- Technology driven approach to promote the reuse of energy
3
31/01/2007I Technical Workshop "Urban transport and green propulsion": minutes of meeting
Presentation on Urban transport and greenpropulsion
Mr. Jos Dings, Director T&E
Public procurement as an instrument General views on public procurement:– Two objectives: Set the example and promote advanced technologies.– Coverage: all public concerns (air pollution, energy, safety, noise) and all relevant vehicle categories.– Binding and technology neutral prescriptions.– Flexibility: Based on ‘points score’ so that authorities can pick and choose themselves? Per Member State? Or still per company?– Develop new EEV (Enhanced Environmentally friendly Vehicles) standards for light and heavy duty vehicles. Life cycle cost approach:– Advantages: seems theoretically sound, is flexible– Disadvantages: Unclear - if interpretation is left free it will lead to nothing– Compromise approach?- Fix minimum goal at EU level: a ‘point system’ for public procurement of new vehicles, with a minimum tightening per year- Member States and authorities choose which technologies to pick to achieve their greening goals.
Two objectives for public procurement: Set the example and promote advanced technologies.
- Technology driven- Lifecycle cost approach (minimum EU level)- Technical recommendations for policy options (checking tyre pressure, improving infrastructures, speed limits etc…)- Develop new EEV standards- Fix a "point system" for public procurement of new vehicles, with a minimum tightening per year (quota)
Identification of Policies - Meetings/Internet consultation
2 pwc Advisory

Impact Assessment on a new approach for the cleaner and more energy efficiency vehicles directive proposal Annex 1 – Stakeholder consultation
Figure 2: Identification of policies – Technical workshop (2/3)
ID Meeting Subject Speaker Summary Elements for identification of proposed actions/policy
instruments
4
31/01/2007I Technical Workshop "Urban transport and green propulsion": minutes of meeting
Presentation on Standards for cleanvehicles and fuels
Mr. Ken Rose,Technical Co-ordinator Fuels Quality &Emissions, CONCAWE
The presentation shows that:- Road transport is the second largest contributor to Energy Sector GHG emissions and fastest growing sector (EU-15).- Trucks are expected to surpass passenger cars as the largest energy consumer in the EU transport energy sector by 2030- Road fuel demand is steadily shifting from gasoline to diesel- Gasoline demand for passenger cars is falling (1995-2020)- Diesel demand is growing, mainly for heavy duty vehicles (1995-2020)- Vehicle efficiency is improving but demand is also growing (1995-2020)- There is a continuous improvement in regulated emissions (CO, NOx, PM-diesel, VOC, benzene, SO2) from 1995 to 2010.- Vehicles and fuels should be evaluated as a single system: fuel changes have had the greatest impact when they enabled vehicle improvements.- Progress in EU fuels qualities from 1993 to 2009: Lead removal and sulphur reduction enabled advanced emissions technology; European Standards for fuels ensured broad and cost-effective implementation.- European Standards for Fuel Specifications: – Technically robust and developed with extensive stakeholder participation – Ensure that fuels can be readily exchanged between EU Member States without quality or performance concerns – Provide a robust standard for adopting in-country specifications (for example, DIN standards) – Specify the minimum fuel quality needed to ensure long-term vehicle and after treatment performance – Enable the design of new vehicle technologies needed to meet today’s emissions standards and anticipate tomorrow’s
- CO2 emissions have not dropped compared to regulated emissions (1995-2010).- Standards for Clean Vehicles and Fuels – “Single system” approach effective for enabling advanced vehicles and fuels: - Dramatic reductions have been achieved in road transport emissions through data-driven research and regulations - Air quality targets and European standards have facilitated this. – Today’s advanced vehicles and fuels will continue to dominate mainstream road transport for some time to come. – Emerging combustion, engine, and vehicle concepts offer significant potential to continuously reduce fuel consumpti – Fuel and powertrain options should be comparably evaluated for energy and CO2 credits, technical feasibility and co
– Alternative fuels should be energy and CO2 efficient on a WTW basis - “1st Generation” biofuels are contributing but availability is limited. - “2nd Generation” biofuel production needs much more research. - Hurdles remain for widespread applications of other alternative fuels.
- European Standards for Fuel Specifications- Standards for Clean Vehicles and Fuels- CO2 credits
Identification of Policies - Meetings/Internet consultation
3 pwc Advisory

Impact Assessment on a new approach for the cleaner and more energy efficiency vehicles directive proposal Annex 1 – Stakeholder consultation
Figure 3: Identification of policies – Technical workshop (3/3)
ID Meeting Subject Speaker Summary Elements for identification of proposed actions/policy
instruments
5
31/01/2007I Technical Workshop "Urban transport and green propulsion": minutes of meeting
Presentation on economic incentives
Mr. Patrick Coroller, Head of TransportTechnologies Department, ADEME
Concerning the evaluation of vehicles' performances, the ADEME emphasises the necessityto test all the vehicles, from 2-wheelers to trucks, in real conditions. The evaluation is thenecessary tool to orientate policies.The objectives of the incentives to the diffusion of clean and efficient vehicles are:- to modify the individual buying behaviours- to increase the development of clean public transport- to reduce the impact of goods transport in cities- to aim to exemplary states and local authorities.Different instruments are proposed to reach these objectives:- Awareness tools- Fiscal incentives for light duty vehicles- Taxes- Direct incentives provided by ADEME- Accompanying measures from the local authorities.The label indicating the energy consumption and the CO2 emissions for new cars is an efficient tool. It is suggested to harmonise its format in the EU as it currently differs in several Member States.
- Awareness tools- Fiscal incentives for light duty vehicles- Taxes- Direct incentives provided by ADEME- Accompanying measures from the local authorities.
6
31/01/2007I Technical Workshop "Urban transport and green propulsion": minutes of meeting
Green procurement Ms.Brigitte Ollier, Director UITP-Euro Team
The UITP-High Level Group on "Building a Sound Future for the Bus Business", with 60 participants from the bus manufacturing industry and operators, have defined recommendations for a bus tender structure, with the following objectives:- Model for tender harmonisation for a better balanced relationship between all actors in PT supply chain- Opening up of possibilities to decrease costs for operators as well as manufacturers.UITP recommendations for Organising Authorities are the following (Fuel choices for public transport – Nov. 2006):- Promote PT and modal shift- Incorporate environmental impacts in the tender evaluation process- Recognise the need for public funding and fiscal incentives to encourage clean energy use- Generate public awareness for the environmental benefits of clean fuels.
Tender- Model for tender harmonisation for a better balanced relationship between all actors in PT supply chainExternal Costs'- Recognise the need for public funding and fiscal incentives to encourage clean energy use- Generate public awareness for the environmental benefits of clean fuels
7
31/01/2007I Technical Workshop "Urban transport and green propulsion": minutes of meeting
Green procurement (experience)
Mr.Camille Durand, Vice-Président NantesMetropole
Mr. Camille Durand then presents the results achieved, the problems and questions that havearisen from the policy on clean vehicles of the city of Nantes.The results of the operation of natural gas buses are positive:- Pollutants emissions decreased- GHG emissions also decreased but to a lesser extent- Population is satisfied with the operation of natural gas buses.Some questions on natural gas buses remain open, regarding:- Reliability, cost, regulations- Possible lack of visibility of the projects.Mr. Camille Durand finally presents its recommendations for the promotion of clean vehicles procurement:- There is a need for harmonisation of the homologation of vehicles at the European level- Ways for better vehicle cost mastery should be investigated- Tender documents for bus procurement should be harmonised, buyers groups should be organised in order to achieve economies of scale.- Research programs and definition of norms should be done at European level.
- buyers groups should be organised in order to achieve economies of scale (public and private)
Identification of Policies - Meetings/Internet consultation
4 pwc Advisory

Impact Assessment on a new approach for the cleaner and more energy efficiency vehicles directive proposal Annex 1 – Stakeholder consultation
5 pwc Advisory
Some speakers have been selected and contacted in order to gain additional information about their suggestions. The results of this analysis are collected in the Annex 2.
2.1.2 Joint Expert Group on Transport and Environment Meeting of 30 March 2007 The main topics of the “Joint Expert Group on Transport and Environment Meeting” of 30 March 2007 have been the following:
- Green paper on urban transport; - Promotion of clean and efficient vehicles
All the interventions held have been used for the identification of policy options (Figure 4: Identification of policies - Joint Expert Group on Transport and Environment Meeting (1/2), Figure 5: Identification of policies - Joint Expert Group on Transport and Environment Meeting (2/2))
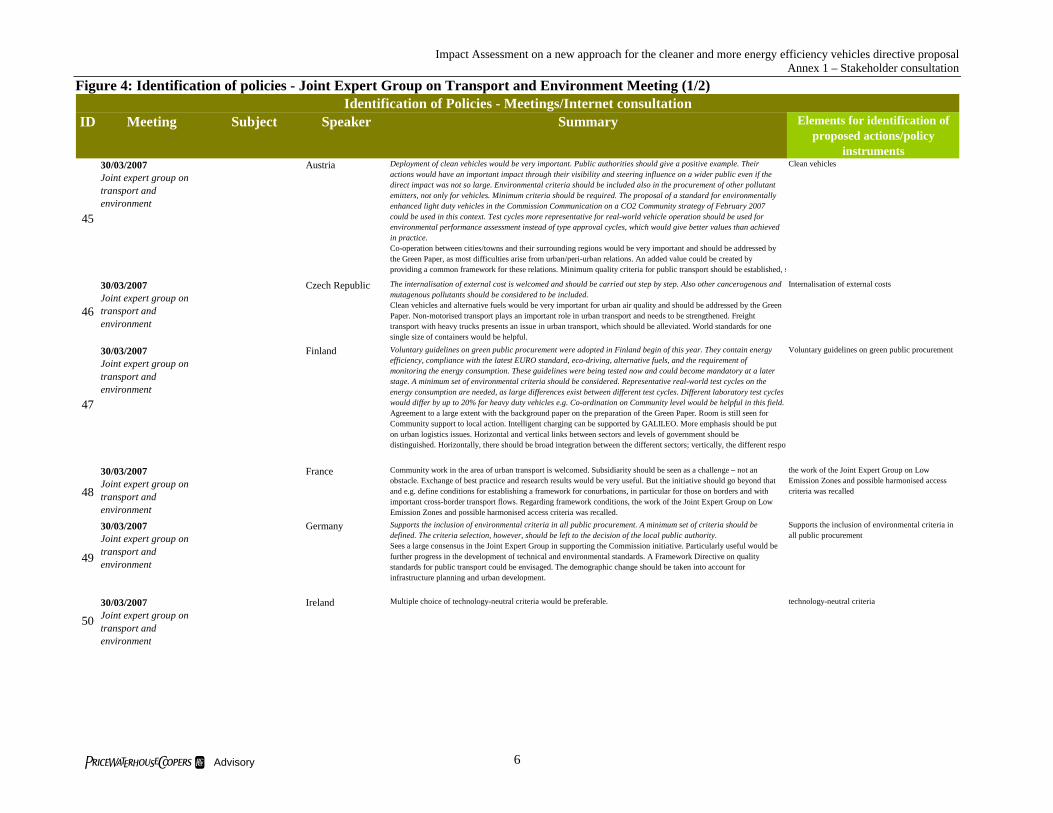
Impact Assessment on a new approach for the cleaner and more energy efficiency vehicles directive proposal Annex 1 – Stakeholder consultation
Figure 4: Identification of policies - Joint Expert Group on Transport and Environment Meeting (1/2)
ID Meeting Subject Speaker Summary Elements for identification of proposed actions/policy
instruments
45
30/03/2007Joint expert group on transport and environment
Austria Deployment of clean vehicles would be very important. Public authorities should give a positive example. Their actions would have an important impact through their visibility and steering influence on a wider public even if the direct impact was not so large. Environmental criteria should be included also in the procurement of other pollutant emitters, not only for vehicles. Minimum criteria should be required. The proposal of a standard for environmentally enhanced light duty vehicles in the Commission Communication on a CO2 Community strategy of February 2007 could be used in this context. Test cycles more representative for real-world vehicle operation should be used for environmental performance assessment instead of type approval cycles, which would give better values than achieved in practice.Co-operation between cities/towns and their surrounding regions would be very important and should be addressed by the Green Paper, as most difficulties arise from urban/peri-urban relations. An added value could be created by providing a common framework for these relations. Minimum quality criteria for public transport should be established, s
Clean vehicles
46
30/03/2007Joint expert group on transport and environment
Czech Republic The internalisation of external cost is welcomed and should be carried out step by step. Also other cancerogenous and mutagenous pollutants should be considered to be included.Clean vehicles and alternative fuels would be very important for urban air quality and should be addressed by the Green Paper. Non-motorised transport plays an important role in urban transport and needs to be strengthened. Freight transport with heavy trucks presents an issue in urban transport, which should be alleviated. World standards for one single size of containers would be helpful.
Internalisation of external costs
47
30/03/2007Joint expert group on transport and environment
Finland Voluntary guidelines on green public procurement were adopted in Finland begin of this year. They contain energy efficiency, compliance with the latest EURO standard, eco-driving, alternative fuels, and the requirement of monitoring the energy consumption. These guidelines were being tested now and could become mandatory at a later stage. A minimum set of environmental criteria should be considered. Representative real-world test cycles on the energy consumption are needed, as large differences exist between different test cycles. Different laboratory test cycles would differ by up to 20% for heavy duty vehicles e.g. Co-ordination on Community level would be helpful in this field.Agreement to a large extent with the background paper on the preparation of the Green Paper. Room is still seen for Community support to local action. Intelligent charging can be supported by GALILEO. More emphasis should be put on urban logistics issues. Horizontal and vertical links between sectors and levels of government should be distinguished. Horizontally, there should be broad integration between the different sectors; vertically, the different respon
Voluntary guidelines on green public procurement
48
30/03/2007Joint expert group on transport and environment
France Community work in the area of urban transport is welcomed. Subsidiarity should be seen as a challenge – not an obstacle. Exchange of best practice and research results would be very useful. But the initiative should go beyond that and e.g. define conditions for establishing a framework for conurbations, in particular for those on borders and with important cross-border transport flows. Regarding framework conditions, the work of the Joint Expert Group on Low Emission Zones and possible harmonised access criteria was recalled.
the work of the Joint Expert Group on Low Emission Zones and possible harmonised access criteria was recalled
49
30/03/2007Joint expert group on transport and environment
Germany Supports the inclusion of environmental criteria in all public procurement. A minimum set of criteria should be defined. The criteria selection, however, should be left to the decision of the local public authority.Sees a large consensus in the Joint Expert Group in supporting the Commission initiative. Particularly useful would be further progress in the development of technical and environmental standards. A Framework Directive on quality standards for public transport could be envisaged. The demographic change should be taken into account for infrastructure planning and urban development.
Supports the inclusion of environmental criteria in all public procurement
5030/03/2007Joint expert group on transport and environment
Ireland Multiple choice of technology-neutral criteria would be preferable. technology-neutral criteria
Identification of Policies - Meetings/Internet consultation
6 pwc Advisory

Impact Assessment on a new approach for the cleaner and more energy efficiency vehicles directive proposal Annex 1 – Stakeholder consultation
Figure 5: Identification of policies - Joint Expert Group on Transport and Environment Meeting (2/2)
ID Meeting Subject Speaker Summary Elements for identification of proposed actions/policy
instruments
5130/03/2007Joint expert group on transport and environment
Lithuania Exchange of best practice on transport planning and development would be most useful to cope with issues linked to the rapid growth of the number of cars. The Green Paper could provide a framework.
Exchange of best practice on transport planning and development would be most useful
5230/03/2007Joint expert group on transport and environment
Netherlands A more active EU policy on emission reduction at the source is encouraged. Harmonised signposting of environmental zones would be helpful.
Harmonised signposting of environmental zones would be helpful.
5330/03/2007Joint expert group on transport and environment
Poland Internalisation of external costs of transport would be important. External costs of transport would be particularly important in urban areas. Ways for their internalisation therefore should be identified. Special support should be given to public transport in urban areas.
Internalisation of external costs of transport would be important.
5430/03/2007Joint expert group on transport and environment
Romania The Commission initiative is welcome, as the importance of urban transport is rapidly growing in Romania. About 60% of the population leaves in urbanised areas; cities are rapidly expanding, and urban sprawl is increasing. Social exclusion is a problem.
No significant elements
55
30/03/2007Joint expert group on transport and environment
Spain Common harmonised criteria should be developed on an optional basis. But no mandatory requirements should be imposed.Welcomed the Commission intention to come forward with a Green Paper in the field of urban transport. Local authorities would highly appreciate such an initiative. The aim for Community action in this field would be ambitious, as many Member States have devolved their administration; Regions in Spain now have a high degree of autonomy. Subsidiarity therefore could be a main obstacle to common EU action in the area of urban transport. Consensus on common framework and direction of policy development, on the other hand, would be an important added value.
No mandatory requirements should be imposed.
56
30/03/2007Joint expert group on transport and environment
Sweden The initiative on the promotion of environmentally friendly vehicles should be revised. Instead of using the specific EEV standard defined for heavy duty vehicles only, a wider scope should be taken, including all vehicle categories, also non-road machinery. More flexibility should be given procure cleaner vehicles ahead of general obligations through the EURO standards. A definition of clean vehicles would be useful.The motivation for the Green Paper and the link to other Community policies, such as on climate change and air quality, should be explained. The added value of the Green paper could be in a long-term perspective on the development of urban areas, with a view of planning for low-transport areas. The development of a harmonised charging system would be very useful.
The initiative on the promotion of environmentally friendly vehicles should be revised.
57
30/03/2007Joint expert group on transport and environment
UK Supports the full life-time costing of external costs in the public procurement process, but would be reluctant on mandatory requirements. Requirements would vary according to different needs, and technologies also develop. The selection of criteria therefore should be left to the public authorities. A definition of clean vehicles would be useful.Several areas are considered where the EU might provide support on regional and local level. The EU could particularly help in the exchange of best practice. Inter-compatibility of intelligent transport systems is essential in fighting congestion. Better understanding and acceptance of "low emission zones" could help implementing more efficient measures to improve air quality, in particular in hot spots where social impacts might present difficulties. Standards for low-emission vehicles would be useful. User-friendliness and accessibility of public transport need to be given high priority. Ticketing and signing systems should be improved through sharing of best practice; harmonised standards may not be necessary. Important would be to see how to overcome subsidiarity obstacles.
Supports the full life-time costing of external costs in the public procurement process, but would be reluctant on mandatory requirements. The selection of criteria therefore should be left to the public authorities. A definition of clean vehicles would be useful.
Identification of Policies - Meetings/Internet consultation
7 pwc Advisory

Impact Assessment on a new approach for the cleaner and more energy efficiency vehicles directive proposal Annex 1 – Stakeholder consultation
8 pwc Advisory
2.1.3 Public consultation The purpose of this paragraph is to illustrate the main results of the public consultation held from 26 February to 30 April 2007 regarding the “Market development of clean and energy efficient vehicles”. In particular, the questions (both “Open” than “Yes-no”) are focused on the support to market development by appropriate award criteria in public procurement: cleaner and more efficient vehicles in urban areas could make an important contribution to improvements in air quality.
Two-thirds of the respondents ask for the EU to take action to help to tackle the transport problems in urban areas, with congestion and pollution being the two most important challenges. Nearly seven out of ten respondents indicate that public transport improvements should be a priority for EU policy. The consultation also confirmed the need for EU action to help to develop and to implement joint solutions of European interest.
Other priority areas for action at the European level include the facilitation of the exchange of best practice, the promotion of RTD activities, and initiatives to increase the market acceptance of new technologies, and innovative and intelligent transport solutions. Seven out of ten respondents expect the EU to help strengthen the markets for the European urban transport industry. Four out of five indicate that public transport vehicles should be clean and energy efficient.1
The respondents have been more then 900, both citizens (545) and organizations (369). 10.1 What actions should be taken, at EU level, in order to promote the market use of clean and energy efficient vehicles? (Open)
Respondents 489 Citizens 273 Organizations 216 Answers N %Internalize external costs 10 2,92%Awareness 23 6,73%Best practice 11 3,22%Quotas 1 0,29%Technology driven 167 48,83%
Clean Vehicles 102 29,82%Clean Fuel 33 9,65%
Promote standards 32 9,36%Financial structures 103 30,12%
Financial schemes 24 7,02%Public Funding (Incentives) 13 3,80%
Tax 66 19,30%Alternative transports 22 6,43%
Bicycles 15 4,39%Public transport services 7 2,05%
No action 5 1,46%Total Respondents 342 During the IA, these answers have been used for the identification of policies. (Figure 6: Identification of policies - Internet consultation). 1 Stakeholder Conference "Towards a European policy for urban transport" Brussels, 4 June 2007 – Background paper
Total respondents
Citizens Organizations
0% 20% 40% 60% 80% 100%
Internalize external costs3%
Awareness7%
Clean Vehicles
Clean Fuel10%
Promote standards9%
Financial schemes7%
Tax19%
Bicycles4%
No action1%
Public Funding(Incentives)
4%
Quotas0%
Public transport services 2%
Best practice3%
31%

Impact Assessment on a new approach for the cleaner and more energy efficiency vehicles directive proposal Annex 1 – Stakeholder consultation
9 pwc Advisory
Figure 6: Identification of policies - Internet consultation
ID Meeting Subject Respondent Summary / Most relevant and representative interventions from the internet consultation
Elements for identification of proposed actions/policy
instruments
58
Internet Consultation Citizen As noted above, this is an area where the EU can and should set targets. I am disappointed that the EU did not stick to its original target of 120g/km for cars by 2012 over the fleet average for EU car makers and instead raised this to 130g/km with fine but ineffective phrases about the other 10g/km coming from biofuels and so on. The EU should consider similar targets for larger vehicles and public transport vehicles. It is clear that such stringent targets can be met in spite of the industry's public concern. I am directly involved in the use of renewable fuels in the Civitas SMILE project, but am concerned about targets for biofuels. These can have the side-effect of stimulating very large greenhouse gas emissions from elsewhere in the world - for example from degraded wetlands in Indonesia. Even if the EU does not import much palm oil or palm oil sourced biodiesel, the EU's mandate for 10 per cent biofuel in road fuel by 2020 can stimulate biofuel production in unsustainable ways elsewhere. The EU's biofuels programme has been driven largely by interests who are involved in first generation biofuels. The EU strategy sees second generation fuels coming on stream in
Clean vehicles
59
Internet Consultation Organization We believe that flexibility and technology-neutral proposals are the key to successful initiatives at European level. Any proposal must follow these principles. The starting point for this could be an assessment by the Commission of the current make-up of public sector vehicle fleets so that cities and other public authorities can compare their performance. However, it must be emphasised that one of the main barriers to rapid progress in achieving a clean(er) vehicle fleet is funding. Extra funding must either come from taxation or from transport-related charges (fares, congestion charging or other charging schemes) on citizens. In taking forward future work, the Commission should consider how best to provide incentives for public authorities – particularly those currently with less environmentally friendly fleets - to purchase cleaner vehicles. PTEs have also benefited from the various EU-supported research and trial projects for new types of no or low emission public transport vehicles. We believe that this is a very useful role for the EU to play.
Public foundingTechnological neutral proposal
60Internet Consultation Organization - Promoting technological solutions - Creating awareness - Setting up partnerships to generate a sufficiently large market
for clean and energy efficient vehicles - Creating a level playing field in tax regulations - Improving tax regulations Promote standardsAwarenessClean Vehicles
61Internet Consultation Citizen Put all urban areas into EU ETS - good cities will be able to sell permits, bad ones will have to improve or buy permits.
Finally there will be justice and revenues - this also leave ALL decisions in the hands of local politicians. This will also lead to improved air quality and less ac
Permits
62
Internet Consultation Citizen The EU should adopt a Directive aiming to improve, with minimum standarts, the efficiency of public transport. People living in cities where public transports are efficient leave their cars home and move with tram and metro. Minimum requirements should be implemented by MSs in their big cities in oder to improve public transport and encourage people taking it. The frequency should be acceptable (citizens must not wait more than 15 minutes to take a tram), the ponctuality should be ensured, people are tired to miss their tram just because it passed before the expected hour indicated. This happens very often in Brussels. The security in the metro station should be stregthened and the comfort improved. Brussels stations are always windy, cold, dirty, unsecured in late hours and the carriage completly crowded. all these element dissuade people to take the metro very uncomfortable and encourage them to take the car rather. All that should be easily improved and might have a positive effect on the car traffic.
Promote public transport
63
Internet Consultation Citizen Incentives for best of breed genuine eco friendly technologies that have WHOLE life cycle environmental benefits. The popular hybrid is NOT that good when analysed over the whole life cycle. Genuine incentives are needed. Ultimately the C02 emissions relate almost entirely to fuel consumed, therefore the mileage travelled must be taken into account. Discounted road tax etc is no real world measure at all. The public are not THAT stupid.
Adeguate financial Schemes
Identification of Policies - Meetings/Internet consultation

Impact Assessment on a new approach for the cleaner and more energy efficiency vehicles directive proposal Annex 1 – Stakeholder consultation
10.2 Should preference for clean and energy efficient vehicles be mandated or left as an option for public authorities? (Mandatory - Optional)
Respondents 227 Citizens 131 Organizations 96
Mandatory 48 Optional 68 NA 111
Anwers 10.2
Mandatory Optional NA
0% 20% 40% 60% 80% 100%
10.3 Do you think procurement of vehicles for public transport services should give preference to clean and energy efficient vehicles? (Yes –No)
Respondents 797 Citizens 480 Organizations 217
Anwers 10.3
Yes No NA
0% 20% 40% 60% 80% 100%
Yes 658 No 61 No opinion 78
10.3 (yes) If yes, what should be done at EU level? (Open)
Respondents 213 Citizens 118 Organizations 95 10.4 Is public procurement, including joint procurement, of clean and energy efficient vehicles a possible approach to promote market development of such vehicles? (Yes-No)
Respondents 775 Citizens 463 Organizations 312
Anwers 10.4
Yes No NA
0% 20% 40% 60% 80% 100%
Yes 525 No 80 No opinion 170
10-4-yes If yes, what should be done at EU level? (open)
Respondents 122 Citizens 58 Organizations 64
10 pwc Advisory

Impact Assessment on a new approach for the cleaner and more energy efficiency vehicles directive proposal Annex 1 – Stakeholder consultation
10.5 Would the inclusion of life-time costs for pollutants, CO2 emissions and fuel consumption into the award criteria be an effective approach? (Yes – No)
Respondents 778 Citizens 472 Organizations 306
Yes 530 No 98 No opinion 150
Anwers 10.5
Yes No NA
0% 20% 40% 60% 80% 100%
10.6 Should preference be given to an early application of the latest Euro standards adopted in European legislation, before the date of general application? (Yes – No)
Respondents 759 Citizens 453 Organizations 306
Yes 386 No 143 No opinion 230
Anwers 10.6
Yes No NA
0% 20% 40% 60% 80% 100%
11 pwc Advisory

Annex 2 Annual procurement by scenario
September 2007

Impact Assessment on a new approach for the clean vehicles directive proposal Annex 2 – Annual procurement by scenario
1 Introduction This annex shows the results annual procurement by scenario. Table 1: Procurement - Passenger Cars
Technology Dimension 2007 2012 2017 Conventional gasoline - Euro IV 1,4 - 2,0 t 85.714 0 0
Conventional gasoline - Euro V 1,4 - 2,0 t 0 85.714 0
Conventional gasoline - Euro VI 1,4 - 2,0 t 0 0 85.714
Conventional gasoline - Euro VII 1,4 - 2,0 t 0 0 0
Conventional diesel - Euro IV <2,0 t 22.615 0 0
Conventional diesel - Euro V <2,0 t 0 22.615 0
Conventional diesel - Euro VI <2,0 t 0 0 22.615
Conventional diesel - Euro VII <2,0 t 0 0 0
CNG mean dimension 167 167 167
GPL mean dimension 1.144 1.144 1.144
Electric mean dimension 287 287 287
Hybrid mean dimension 73 73 73
Ethanol 100 mean dimension 0 0 0
Ethanol 10 mean dimension 0 0 0
Biofuel 100 mean dimension 0 0 0
Biofuel 20 mean dimension 0 0 0
Total 110.000 110.000 110.000
Table 2: Procurement - Light Duty Vehicles
Technology Dimension 2007 2012 2017 Conventional gasoline - Euro IV <3,5 t 20.189 0 0
Conventional gasoline - Euro V <3,5 t 0 20.189 0
Conventional gasoline - Euro VI <3,5 t 0 0 20.189
Conventional gasoline - Euro VII <3,5 t 0 0 0
Conventional diesel - Euro IV <3,5 t 88.227 0 0
Conventional diesel - Euro V <3,5 t 0 88.227 0
Conventional diesel - Euro VI <3,5 t 0 0 88.227
Conventional diesel - Euro VII <3,5 t 0 0 0
CNG mean dimension 245 245 245
GPL mean dimension 1.070 1.070 1.070
Electric mean dimension 269 269 269
Hybrid mean dimension 0 0 0
Ethanol 100 mean dimension 0 0 0
Ethanol 10 mean dimension 0 0 0
Biofuel 100 mean dimension 0 0 0
Biofuel 20 mean dimension 0 0 0
Total 110.000 110.000 110.000
1 pwc Advisory

Impact Assessment on a new approach for the clean vehicles directive proposal Annex 2 – Annual procurement by scenario
Table 3: Procurement - Heavy Duty Trucks Technology Dimension 2007 2012 2017
Conventional diesel - Euro IV 26 - 28 t 34.950 0 0
Conventional diesel - Euro V 26 - 28 t 0 34.950 0
Conventional diesel - Euro VI 26 - 28 t 0 0 34.950
Conventional diesel - Euro VII 26 - 28 t 0 0 0
CNG 16 - 32 t 43 43 43
GPL 16 - 32 t 7 7 7
Electric 16 - 32 t 0 0 0
Hybrid 16 - 32 t 0 0 0
Ethanol 100 16 - 32 t 0 0 0
Ethanol 10 16 - 32 t 0 0 0
Biofuel 100 16 - 32 t 0 0 0
Biofuel 20 16 - 32 t 0 0 0
Total 35.000 35.000 35.000
Table 4: Procurement - Buses
Technology Dimension 2007 2012 2017 Conventional diesel - Euro IV 15 - 18 t 16.655 0 0
Conventional diesel - Euro V 15 - 18 t 0 16.655 0
Conventional diesel - Euro VI 15 - 18 t 0 0 16.655
Conventional diesel - Euro VII 15 - 18 t 0 0 0
CNG 15 - 18 t 203 203 203
GPL 15 - 18 t 31 31 31
Electric 15 - 18 t 36 36 36
Hybrid 15 - 18 t 29 29 29
Ethanol 100 15 - 18 t 0 0 0
Ethanol 10 15 - 18 t 0 0 0
Biofuel 100 15 - 18 t 46 46 46
Biofuel 20 15 - 18 t 0 0 0
Total 17.000 17.000 17.000
2 pwc Advisory

Annex 3 Vehicles technologies performances comparison
September 2007

Impact Assessment on a new approach for the clean vehicles directive proposal Annex 3 – Vehicle performance comparison
Vehicle procurement in ILEC scenarios (both mandatory and optional policy options) are computed by assuming that public and private operators providing public transport services choose, in their procurement process, those vehicle types that minimise the lifetime internal and external costs, linked to the predicted operations of the vehicle. In ILECM scenario it is assumed that 100% of public procurement is made according the exposed criterion while in the ILECM scenario only 50% of vehicles purchases comply with that criterion.
In order to estimate the procurement public fleet composition in the ILEC procurement scenarios, a previous analysis is needed for establishing a classification among all possible options in vehicles purchasing; obviously, such a classification must consider exactly the same criteria proposed for the Cost-Benefit Analysis, i.e. a comparison not only in terms of internal costs (purchase and operational costs) but also in terms of external costs (pollution and GHG costs) linked to the operation of the vehicles to be procured.
The multicriterial comparison provides the choice that public transport service operators should pursue in vehicles replacement in the ILEC scenario since 2007 and guides us in the reconstruction of future public fleet composition in this scenario.
No technological choice is made a priori, but all possibilities are considered among the available technological options.
Technology comparison requires data on energy and environmental performances of all possible technologies; obviously, we cannot consider all real model options on the market, but we have to limit ourselves to considering reference values.
For conventional technologies, from pre-ECE to Euro IV standards, we consider emission/consumption factors resulting from COPERT IV software tools.
The COPERT IV software provides total emission factors (hot + cold + evaporative) for a number of pollutants (NOx and PM included) and CO2, as well as unit Fuel Consumption (FC), for specified traffic/driving conditions and ambient temperature.
In our simulation, we assumed the following reference values, referred to a public fleet and the whole EU-25 area. Table 1: Traffic distribution and average speeds hypothesis for conventional vehicles emission/consumption factors calculation Traffic distribution (%) Average Speed (km/h)
Urban Rural Highways Urban Rural Highways
PC 60 20 20 25 70 110
LDV 60 20 20 25 60 90
HDV 70 30 0 15 50 80
BUS 90 10 0 10 50 70
Coaches 50 40 10 15 60 90
Table 2: Monthly average range temperature all over EU-25 assumption
J F M A M G J A S O N D
Min (°C) -10 -10 -5 0 5 10 15 10 10 5 0 -5
Max (°C) 10 10 15 20 25 30 40 40 30 25 15 15
1 pwc Advisory

Impact Assessment on a new approach for the clean vehicles directive proposal Annex 3 – Vehicle performance comparison
With these hypotheses, we obtained the emission/consumption factors summarised in tables at the end of this annex.
It is useful to underline that those values are referred to standard operational conditions, although carried out by simulation. According to recent studies, COPERT simulations underestimate real emissions and consumption but, as the present analysis has been configured in comparative terms, possible light inaccuracy in inputs do not substantially modify our results.
The choice of the COPERT database for emission/consumption factors derives from three main considerations:
• wide range of data from a unique qualified source
• possibility to simulate operative conditions.
• availability of the source (open source software)
As for EURO V, EURO VI and EURO VII vehicles, not yet included in the COPERT IV database, we assumed that pollutant emissions maintain the same ratio as between EURO III and EURO IV; regarding Fuel Consumption (FC) and CO2 emissions, recent trends show that technological efforts to improve engines efficiency have been nullified by higher installed power and diffusion of devices energy consuming, first of all air conditioning equipments; on the other hand, EU Commission is strongly pushing for limitation in CO2 emissions in overcoming automotive production; considering these opposite “drivers”, we assumed that next vehicle models will be characterized with the same fuel consumption (and CO2 emissions) as EuroIV.
For the innovative technologies, we adopted the emission and consumption factors summarized in the tables below; they derive from previous PWC study and recent desk researches; in particular, data on TTW energy consumption derive from the WTW study of JRC results, which are referred to a medium-size car: in order to extend JRC results also to the other vehicles categories we assumed the following multiplicative factors for energy consumption and CO2 emissions:
LDV 1.5
HDV 6.8
BUSES 8.7
Such ratios are derived from a comparison among fuel consumption for conventional technologies resulting from COPERT simulations.
For all technologies, both conventional and alternative, we estimated WTW CO2 equivalent emissions and energy consumption using parameters given in the JRC study.
2 pwc Advisory

Impact Assessment on a new approach for the clean vehicles directive proposal Annex 3 – Vehicle performance comparison
Technology Dimension Nox [g/km]
PM [g/km]
WTW CO2 [g/km]
TTW FC [MJ/km]
TTW Electricity [MJ/km]
Conventional gasoline - Euro IV 1,4 - 2,0 t 0,052 0,001 193,490 2,240 0,000
Conventional gasoline - Euro V 1,4 - 2,0 t 0,039 0,001 193,490 2,240 0,000
Conventional gasoline - Euro VI 1,4 - 2,0 t 0,029 0,001 193,490 2,240 0,000
Conventional gasoline - Euro VII 1,4 - 2,0 t 0,022 0,001 193,490 2,240 0,000
Conventional diesel - Euro IV <2,0 t 0,399 0,019 159,792 1,830 0,000
Conventional diesel - Euro V <2,0 t 0,287 0,004 159,792 1,830 0,000
Conventional diesel - Euro VI <2,0 t 0,207 0,001 159,792 1,830 0,000
Conventional diesel - Euro VII <2,0 t 0,149 0,000 159,792 1,830 0,000
Hybrid mean dimension 0,120 0,002 139,655 1,168 0,292
GPL mean dimension 0,299 0,006 147,304 2,000 0,000
CNG stoich. 2007 mean dimension 0,016 0,000 120,920 1,880 0,000
CNG stoich. 2012 mean dimension 0,012 0,000 120,920 1,880 0,000
CNG stoich. 2017 mean dimension 0,009 0,000 120,920 1,880 0,000
Biofuel 20 mean dimension 0,411 0,016 140,028 1,770 0,000
Ethanol 15 mean dimension 0,399 0,011 158,733 1,900 0,000
Biofuel 100 mean dimension 0,447 0,011 87,491 1,880 0,000
Ethanol 100 mean dimension 0,399 0,009 108,810 1,900 0,000
Electric mean dimension 0,000 0,000 154,800 0,000 1,200
3 pwc Advisory

Impact Assessment on a new approach for the clean vehicles directive proposal Annex 3 – Vehicle performance comparison
Table 4: Light Duty Vehicles energy and consumption factors
Technology Dimension Nox [g/km]
PM [g/km]
WTW CO2 [g/km]
TTW FC [MJ/km]
TTW Electricity [MJ/km]
Conventional gasoline - Euro IV <3,5 t 0,047 0,001 297,912 3,449 0,000
Conventional gasoline - Euro V <3,5 t 0,035 0,001 297,912 3,449 0,000
Conventional gasoline - Euro VI <3,5 t 0,026 0,001 297,912 3,449 0,000
Conventional gasoline - Euro VII <3,5 t 0,020 0,001 297,912 3,449 0,000
Conventional diesel - Euro IV <3,5 t 0,848 0,033 235,684 2,699 0,000
Conventional diesel - Euro V <3,5 t 0,611 0,004 235,684 2,699 0,000
Conventional diesel - Euro VI <3,5 t 0,440 0,001 235,684 2,699 0,000
Conventional diesel - Euro VII <3,5 t 0,317 0,000 235,684 2,699 0,000
Hybrid mean dimension 0,255 0,003 205,923 1,722 0,431
GPL mean dimension 0,636 0,010 206,226 2,800 0,000
CNG stoich . 2007 mean dimension 0,014 0,000 178,164 2,770 0,000
CNG stoich. 2012 mean dimension 0,010 0,000 178,164 2,770 0,000
CNG stoich. 2017 mean dimension 0,008 0,000 178,164 2,770 0,000
Biodiesel 20 mean dimension 0,874 0,028 209,646 2,650 0,000
Ethanol 100 mean dimension 0,848 0,020 238,099 2,850 0,000
Biofuel 100 mean dimension 0,950 0,020 123,790 2,660 0,000
Ethanol 100 mean dimension 0,848 0,017 163,216 2,850 0,000
Electric mean dimension 0,000 0,000 232,200 0,000 1,800
4 pwc Advisory
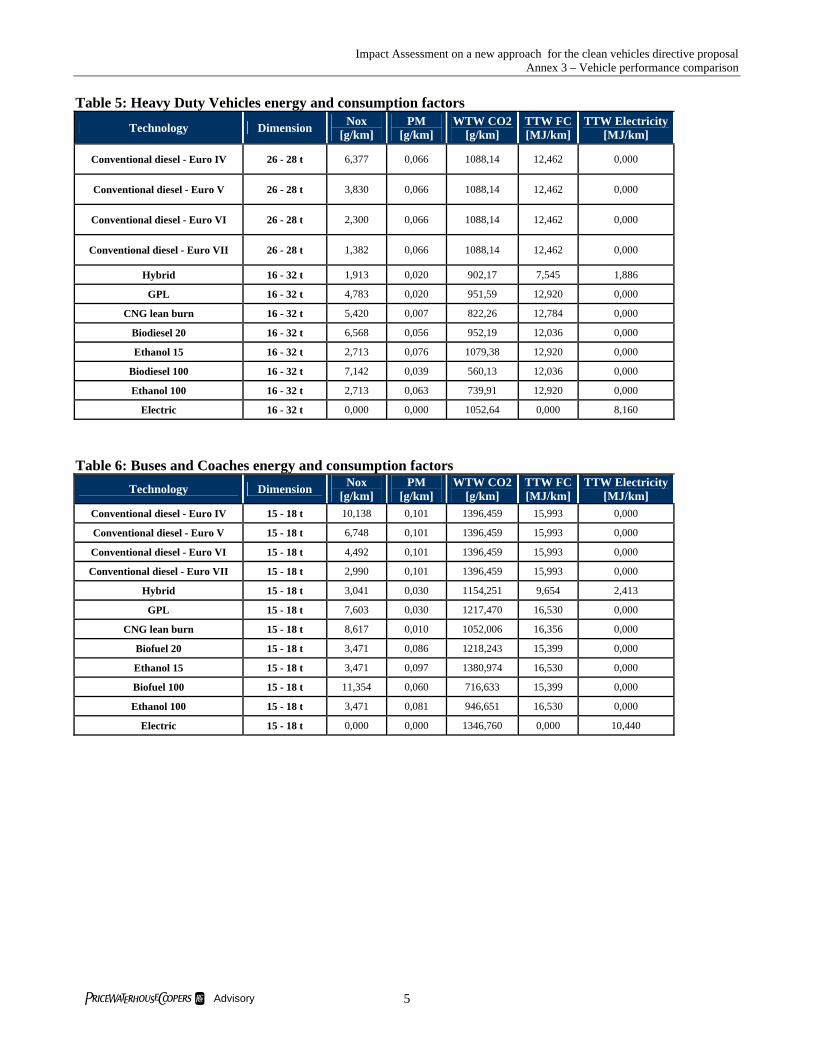
Impact Assessment on a new approach for the clean vehicles directive proposal Annex 3 – Vehicle performance comparison
Table 5: Heavy Duty Vehicles energy and consumption factors
Technology Dimension Nox [g/km]
PM [g/km]
WTW CO2 [g/km]
TTW FC [MJ/km]
TTW Electricity [MJ/km]
Conventional diesel - Euro IV 26 - 28 t 6,377 0,066 1088,14 12,462 0,000
Conventional diesel - Euro V 26 - 28 t 3,830 0,066 1088,14 12,462 0,000
Conventional diesel - Euro VI 26 - 28 t 2,300 0,066 1088,14 12,462 0,000
Conventional diesel - Euro VII 26 - 28 t 1,382 0,066 1088,14 12,462 0,000
Hybrid 16 - 32 t 1,913 0,020 902,17 7,545 1,886
GPL 16 - 32 t 4,783 0,020 951,59 12,920 0,000
CNG lean burn 16 - 32 t 5,420 0,007 822,26 12,784 0,000
Biodiesel 20 16 - 32 t 6,568 0,056 952,19 12,036 0,000
Ethanol 15 16 - 32 t 2,713 0,076 1079,38 12,920 0,000
Biodiesel 100 16 - 32 t 7,142 0,039 560,13 12,036 0,000
Ethanol 100 16 - 32 t 2,713 0,063 739,91 12,920 0,000
Electric 16 - 32 t 0,000 0,000 1052,64 0,000 8,160
Table 6: Buses and Coaches energy and consumption factors
Technology Dimension Nox [g/km]
PM [g/km]
WTW CO2 [g/km]
TTW FC [MJ/km]
TTW Electricity [MJ/km]
Conventional diesel - Euro IV 15 - 18 t 10,138 0,101 1396,459 15,993 0,000
Conventional diesel - Euro V 15 - 18 t 6,748 0,101 1396,459 15,993 0,000
Conventional diesel - Euro VI 15 - 18 t 4,492 0,101 1396,459 15,993 0,000
Conventional diesel - Euro VII 15 - 18 t 2,990 0,101 1396,459 15,993 0,000
Hybrid 15 - 18 t 3,041 0,030 1154,251 9,654 2,413
GPL 15 - 18 t 7,603 0,030 1217,470 16,530 0,000
CNG lean burn 15 - 18 t 8,617 0,010 1052,006 16,356 0,000
Biofuel 20 15 - 18 t 3,471 0,086 1218,243 15,399 0,000
Ethanol 15 15 - 18 t 3,471 0,097 1380,974 16,530 0,000
Biofuel 100 15 - 18 t 11,354 0,060 716,633 15,399 0,000
Ethanol 100 15 - 18 t 3,471 0,081 946,651 16,530 0,000
Electric 15 - 18 t 0,000 0,000 1346,760 0,000 10,440
5 pwc Advisory

Impact Assessment on a new approach for the clean vehicles directive proposal Annex 3 – Vehicle performance comparison
NOx , PM, WTW eq.CO2 emissions and TTW energy consumption (by source) represent the key elements for an environmental comparison among different vehicle technologies but, in order to obtain a unique comparison term, we must translate physical measures into monetary values.
This objective is possible thanks to the results of studies on environmental and health damages of vehicle emissions; in particular we adopted CAFÉ results for the quantification of NOx damages, BeTa for PM and UNITE for CO2 at EU25 level. Adopted unit external costs are the ones reported below.
. Table 7: Unit external costs for emissions
NOx (Euro/g) PM (Euro/g) GHG (Euro/kg)
0,0044 0,0871 0,020
As for energy, we assumed the unit industrial costs showed in the first row of the following table. These values are referred to an average EU-25, according various national and European sources; of course they are only reference values, as energy costs highly vary in time and space.
Table 8: Unit energy costs (Euro/GJ) Gasoline Diesel LPG CNG FAME Ethanol Electricity
16.00 15.00 15.00 14.00 20.00 26.00 22.00
Applying environmental and energy cost factors, we were able to compare different aspects of vehicle performances expressed with the same unit of measure (Euro/km). Analysing results, it appears that energy costs have a higher relevance than environmental ones, for some vehicle categories (PCs and LDV) much higher. This means that technology comparison is very sensitive to energy costs modifications, frequently occurring. In the present situation, electricity for engine hybridisation, CNG, LPG and biodiesel blends seem to be particularly interesting in terms of reduction, at the same time, of environmental impacts and energy costs in comparison with conventional fuels. Differences occur among different vehicle category so that CNG is the most convenient solution for PCs and LDVs while hybrid engine is the best solution for the heavy vehicle categories.
But how do purchase and maintenance costs influence the technology comparison? In fact, the choice of a vehicle is usually made considering first of all purchase cost, therefore we completed our analysis including this feature; as for the maintenance costs, we assumed that they are not sensibly variable with respect to technology.
We assumed the following values for vehicles purchase costs, derived from the previous PwC study.
6 pwc Advisory

Impact Assessment on a new approach for the clean vehicles directive proposal Annex 3 – Vehicle performance comparison
Table 9: Present purchase costs for different vehicle classes and technologies
Technology – Year 2007 Car LDV HDV Bus
Conventional gasoline 20,226 16,046 NA NA
Conventional diesel 22,046 17,489 108,160 216,320
CNG 22,653 17,971 118,976 237,952
GPL 22,451 17,811 118,976 237,952
Electric 25,485 20,217 183,872 367,744
Hybrid 24,371 20,112 124,384 248,768
Ethanol 100 22,855 18,131 118,976 237,952
Ethanol 10 21,298 16,886 108,701 217,402
Biofuel 100 22,855 18,131 118,976 237,952
Biofuel 20 21,298 16,886 108,701 217,402
Estimates of the expected extra-price of newer Euro standard vehicles with respect to vehicles complying the currently in force Euro standard (see Table 10) are taken from the results of consultations carried out within the Impact assessments for Euro 6 (Commission Staff Working Document, 20 September 2006) and Euro 5 emission limits for light duty vehicles (SEC (2005) 1745). Prices related to the other vehicle categories are then extrapolated by assuming direct proportionality to the purchase cost. In the time period ranging from the introduction of a new Euro standard to the introduction of the next one, it is assumed that this difference of cost reduces linearly and becomes nil on the year the next euro standard comes into force.
Table 10: Cost increase for Euro VI and Euro VII standard with respect to Euro IV standard
Euro VI Euro V Euro IV
3.7% 2.3% Ref.
Of course, the incidence of purchase cost varies according to the total mileage during vehicle lifetime; we assumed the following total lifetime mileage for the four vehicle categories: Table 11: Assumed lifetime mileages by vehicle categories (km)
Passenger Cars Light Duty Vehicles Heavy duty vehicles Buses
200.000 250.000 1.000.000 800.000
The ratio between purchase cost and total lifetime mileage gives the unit purchase cost to be added to the environmental and energy unit costs for the overall technologies comparison.
Even if purchase costs are higher for alternative technologies than conventional, the alternative ones remain more convenient in overall terms.
Of course, a CBA procedure, actualising costs occurring during vehicle lifetime, would give more precise results; nevertheless, gaps between alternative and conventional seems to be large enough to ensure that qualitative results would not change.
7 pwc Advisory
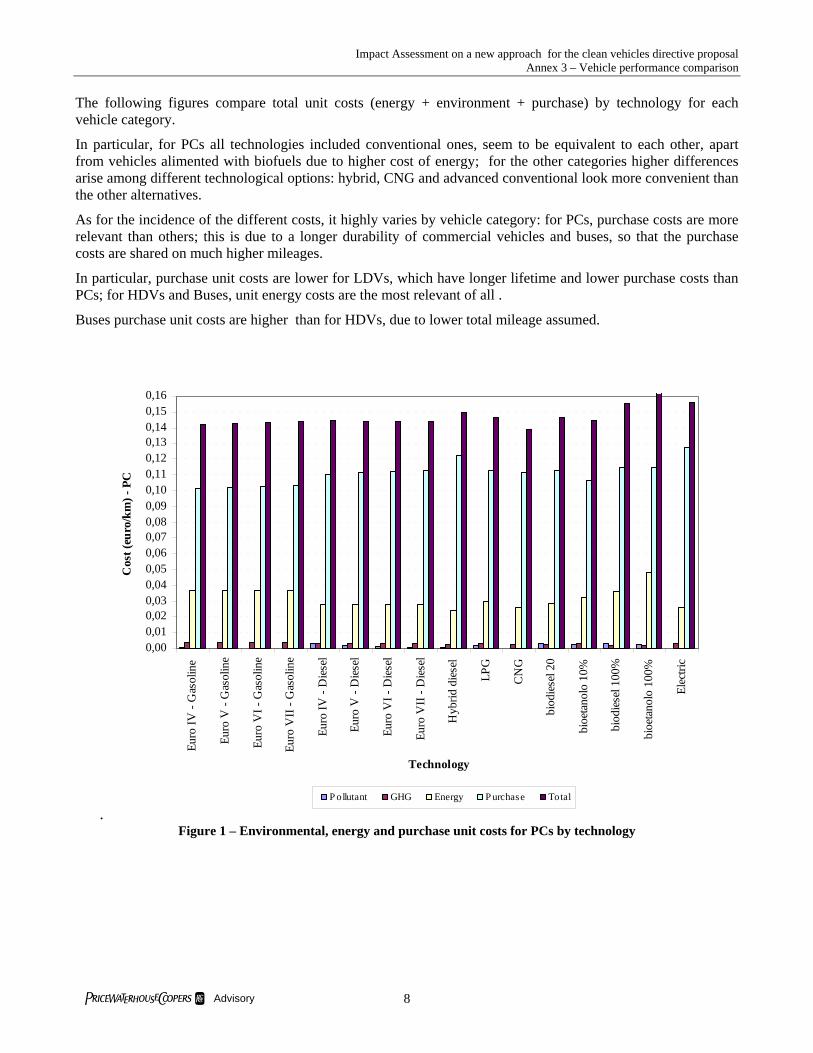
Impact Assessment on a new approach for the clean vehicles directive proposal Annex 3 – Vehicle performance comparison
The following figures compare total unit costs (energy + environment + purchase) by technology for each vehicle category.
In particular, for PCs all technologies included conventional ones, seem to be equivalent to each other, apart from vehicles alimented with biofuels due to higher cost of energy; for the other categories higher differences arise among different technological options: hybrid, CNG and advanced conventional look more convenient than the other alternatives.
As for the incidence of the different costs, it highly varies by vehicle category: for PCs, purchase costs are more relevant than others; this is due to a longer durability of commercial vehicles and buses, so that the purchase costs are shared on much higher mileages.
In particular, purchase unit costs are lower for LDVs, which have longer lifetime and lower purchase costs than PCs; for HDVs and Buses, unit energy costs are the most relevant of all .
Buses purchase unit costs are higher than for HDVs, due to lower total mileage assumed.
.
0,000,010,020,030,040,050,060,070,080,090,100,110,120,130,140,150,16
Euro
IV -
Gas
olin
e
Euro
V -
Gas
olin
e
Euro
VI -
Gas
olin
e
Euro
VII
- G
asol
ine
Euro
IV -
Die
sel
Euro
V -
Die
sel
Euro
VI -
Die
sel
Euro
VII
- D
iese
l
Hyb
rid d
iese
l
LPG
CN
G
biod
iese
l 20
bioe
tano
lo 1
0%
biod
iese
l 100
%
bioe
tano
lo 1
00%
Elec
tric
Technology
Cos
t (eu
ro/k
m) -
PC
P ollutant GHG Energy P urchase Total
Figure 1 – Environmental, energy and purchase unit costs for PCs by technology
8 pwc Advisory

Impact Assessment on a new approach for the clean vehicles directive proposal Annex 3 – Vehicle performance comparison
0,000,010,020,030,040,050,060,070,080,090,100,110,120,130,140,150,160,17
Euro
IV -
Gas
olin
e
Euro
V -
Gas
olin
e
Euro
VI -
Gas
olin
e
Euro
VII
- G
asol
ine
Euro
IV -
Die
sel
Euro
V -
Die
sel
Euro
VI -
Die
sel
Euro
VII
- D
iese
l
Hyb
rid d
iese
l
LPG
CN
G
biod
iese
l 20
bioe
tano
lo 2
1%
biod
iese
l 100
%
bioe
tano
lo 1
00%
Elec
tric
Technology
Cos
t (eu
ro/k
m) -
LD
V
P ollutant GHG Energy P urchase Total
Figure 2: Environmental, energy and purchase unit costs for LDVs by technology
9 pwc Advisory
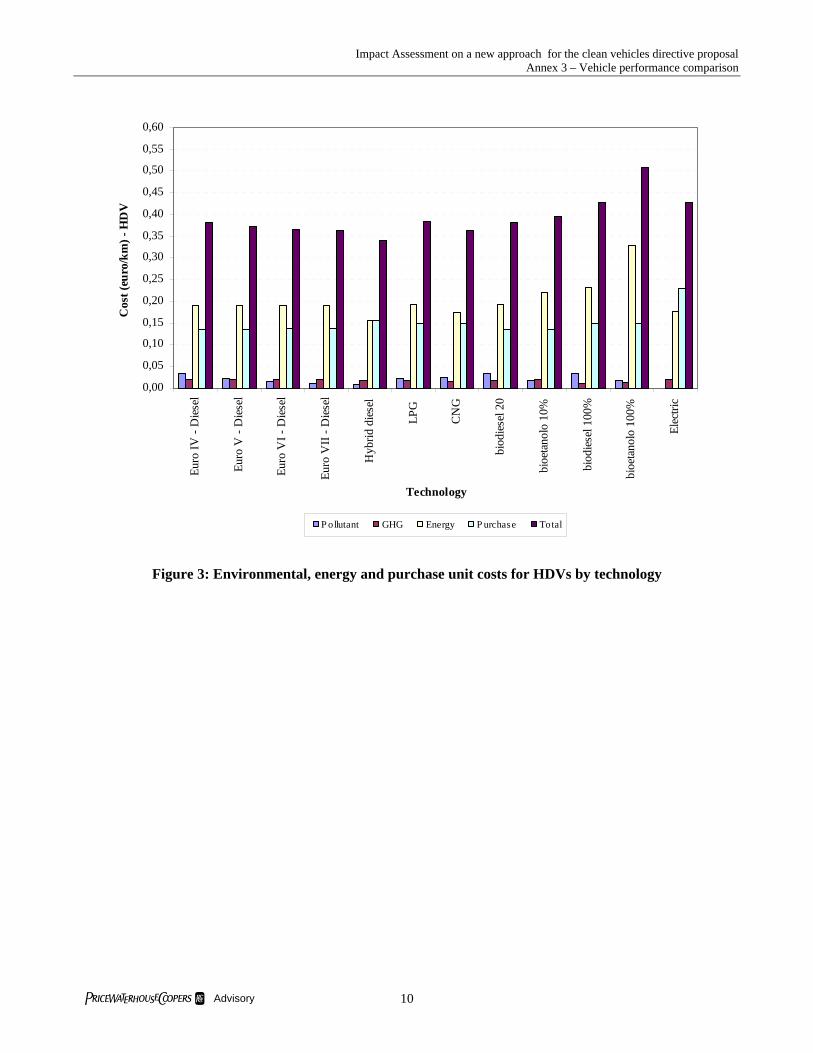
Impact Assessment on a new approach for the clean vehicles directive proposal Annex 3 – Vehicle performance comparison
0,00
0,05
0,10
0,15
0,20
0,25
0,30
0,35
0,40
0,45
0,50
0,55
0,60
Euro
IV -
Die
sel
Euro
V -
Die
sel
Euro
VI -
Die
sel
Euro
VII
- D
iese
l
Hyb
rid d
iese
l
LPG
CN
G
biod
iese
l 20
bioe
tano
lo 1
0%
biod
iese
l 100
%
bioe
tano
lo 1
00%
Elec
tric
Technology
Cos
t (eu
ro/k
m) -
HD
V
P ollutant GHG Energy P urchase Total
Figure 3: Environmental, energy and purchase unit costs for HDVs by technology
10 pwc Advisory

Impact Assessment on a new approach for the clean vehicles directive proposal Annex 3 – Vehicle performance comparison
0,00
0,10
0,20
0,30
0,40
0,50
0,60
0,70
0,80
0,90
1,00
1,10
Euro
IV -
Die
sel
Euro
V -
Die
sel
Euro
VI -
Die
sel
Euro
VII
- D
iese
l
Hyb
rid d
iese
l
LPG
CN
G
biod
iese
l 20
bioe
tano
lo 2
0%
biod
iese
l 100
%
bioe
tano
lo 1
00%
Elec
tric
Technology
Cos
t (eu
ro/k
m) -
Bus
es
P ollutant GHG Energy P urchase Total
Figure 4: Environmental, energy and purchase unit costs for Buses and Coaches by technology
Using the results of the technology comparison, possible procurement composition for the ILECM and ILECO scenario have been carried out, adopting the best technology by vehicle category (see Annex 2). In practice, the procurement in the ILECM scenario is supposed to be composed by :
• CNG vehicles for PCs and LDVs • Hybrid diesel vehicles for heavy vehicles
Of course we do not expect that public bodies will purchase only specified technologies (in fact, a complete shift from gasoline to LPG/CNG/electrical appears unlikely) but we consider that, when pushed by demand, automotive industry will adapt its new products to the best performances required by the market.
Indeed, the more likely effect is a shift in demand between different models of the same technology and this is consistent with the technology-neutral nature of the internalizing life-time external cost policy. Thus, the methodology of the study focuses on a shift of performances instead of a shift of technologies.
11 pwc Advisory

Annex 4 Energy consumption and noxious emissions by year
by scenario
September 2007

Impact Assessment on a new approach for the clean vehicles directive proposal Annex 4 – Energy consumption and noxious emission by year by scenario
0
5.000.000
10.000.000
15.000.000
20.000.000
25.000.000
BAU EES EES2 CBA CBA2
Scenarios
Nox kgPM kgWTW CO2 t
Figure 1 : Scenarios comparison 2007 - Noxious emissions
0
2.000.000
4.000.000
6.000.000
8.000.000
10.000.000
12.000.000
14.000.000
BAU EES EES2 CBA CBA2
Scenarios
Nox kgPM kgWTW CO2 t
Figure 2 : Scenarios comparison 2012 - Noxious emissions
1 pwc Advisory
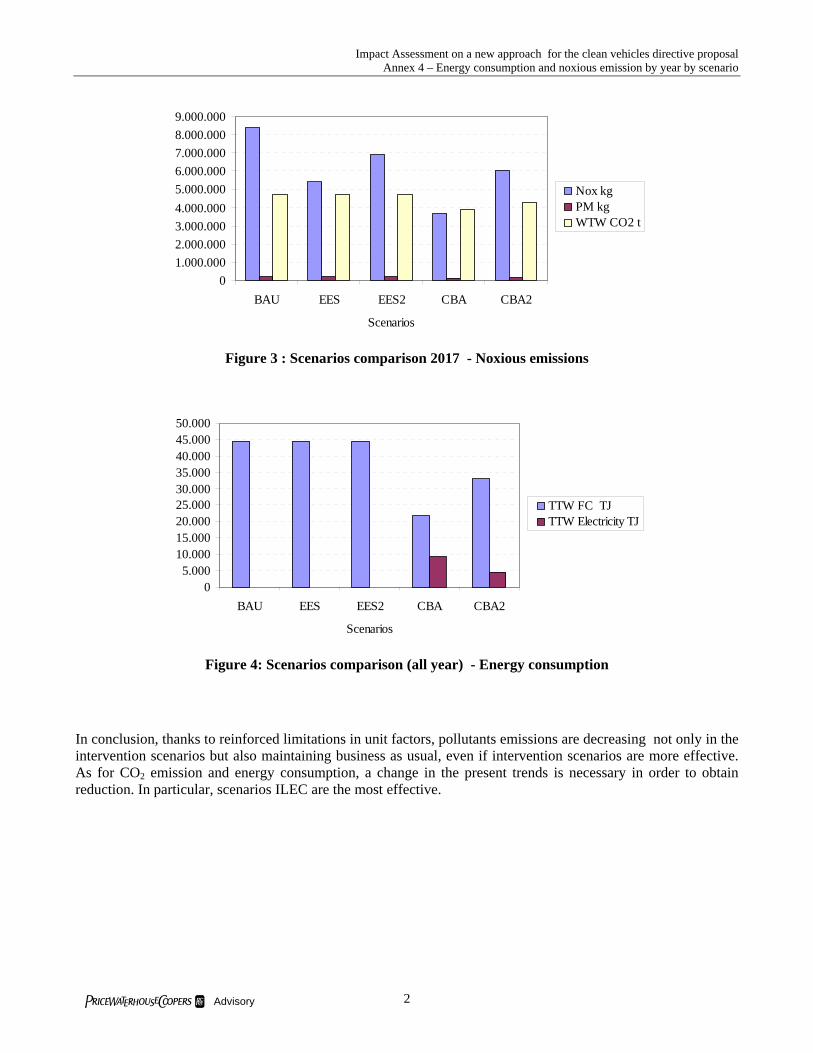
Impact Assessment on a new approach for the clean vehicles directive proposal Annex 4 – Energy consumption and noxious emission by year by scenario
01.000.0002.000.0003.000.0004.000.0005.000.0006.000.0007.000.0008.000.0009.000.000
BAU EES EES2 CBA CBA2
Scenarios
Nox kgPM kgWTW CO2 t
Figure 3 : Scenarios comparison 2017 - Noxious emissions
05.000
10.00015.00020.00025.00030.00035.00040.00045.00050.000
BAU EES EES2 CBA CBA2
Scenarios
TTW FC TJTTW Electricity TJ
Figure 4: Scenarios comparison (all year) - Energy consumption
In conclusion, thanks to reinforced limitations in unit factors, pollutants emissions are decreasing not only in the intervention scenarios but also maintaining business as usual, even if intervention scenarios are more effective. As for CO2 emission and energy consumption, a change in the present trends is necessary in order to obtain reduction. In particular, scenarios ILEC are the most effective.
2 pwc Advisory

Annex 5 Energy and Environmental costs by year by
scenario
September 2007

1 pwc Advisory
0
100
200
300
400
500
600
700
BAU EES CBA EES2 CBA2
Scenarios
Ml E
uro Pollutant
GHGEnergy
Figure 1: Scenarios comparison 2007 - Energy and environmental costs
0
100
200
300
400
500
600
700
BAU EES CBA EES2 CBA2
Scenarios
Ml E
uro Pollutant
GHGEnergy
Figure 2: Scenarios comparison 2012 - Energy and environmental costs
0
100
200
300
400
500
600
700
BAU EES CBA EES2 CBA2
Scenarios
Ml E
uro Pollutant
GHGEnergy
Figure 3: Scenarios comparison 2017 - Energy and environmental costs

Annex 6 CBA for single vehicles classes
(Tables)
September 2007

Impact Assessment on a new approach for the clean vehicles directive proposal Annex 6 – CBA for single vehicles classes
1 pwc Advisory
1 Introduction This annex shows the results of CBA concerning the single vehicles classes. Table 1: Passenger Cars Scenarios Comparison – Economic impacts in the period 2007-2027 - absolute values Scenarios Comparison Economic Impacts in period 2007-2027
Pollutant emissions
GHG Emissions
Energy (excl. taxes) Purchase
TOTAL COSTS
BAU ml euro 65 769 5.886 20.832 27.553 EESO ml euro 55 769 5.886 20.900 27.611 ILECO ml euro 64 591 3.076 21.768 25.498 EESM ml euro 46 769 5.886 20.968 27.669 ILECM ml euro 63 412 265 22.703 23.443
Table 2: Passenger cars Scenarios Comparison – Economic impacts in the period 2007-2027 – percentage values Scenarios Comparison Economic Impacts in period 2007-2027
Pollutant emissions
GHG Emissions
Energy (excl. taxes) Purchase
TOTAL COSTS
BAU % 0% 0% 0% 0% 0% EESO % -15% 0% 0% 0% 0% ILECO % -2% -23% -48% 4% -7% EESM % -29% 0% 0% 1% 0% ILECM % -4% -46% -95% 9% -15%
Table 3: LDV Scenarios Comparison – Economic impacts in the period 2007-2027 – absolute values Scenarios Comparison Economic Impacts in period 2007-2027
Pollutant emissions
GHG Emissions
Energy (excl. taxes) Purchase
TOTAL COSTS
BAU ml euro 459 1.317 9.630 17.400 28.806 EES ml euro 384 1.317 9.630 17.460 28.792 CBA ml euro 264 1.347 6.601 19.404 27.617 EESM ml euro 309 1.317 9.630 17.521 28.777 ILECM ml euro 70 1.379 3.585 21.426 26.460
Table 4: LDV Scenarios Comparison – Economic impacts in the period 2007-2027 – percentage values Scenarios Comparison Economic Impacts in period 2007-2027
Pollutant emissions
GHG Emissions
Energy (excl. taxes) Purchase
TOTAL COSTS
BAU % 0% 0% 0% 0% 0% EES % -16% 0% 0% 0% 0% CBA % -42% 2% -31% 12% -4% EESM % -33% 0% 0% 1% 0% ILECM % -85% 5% -63% 23% -8%
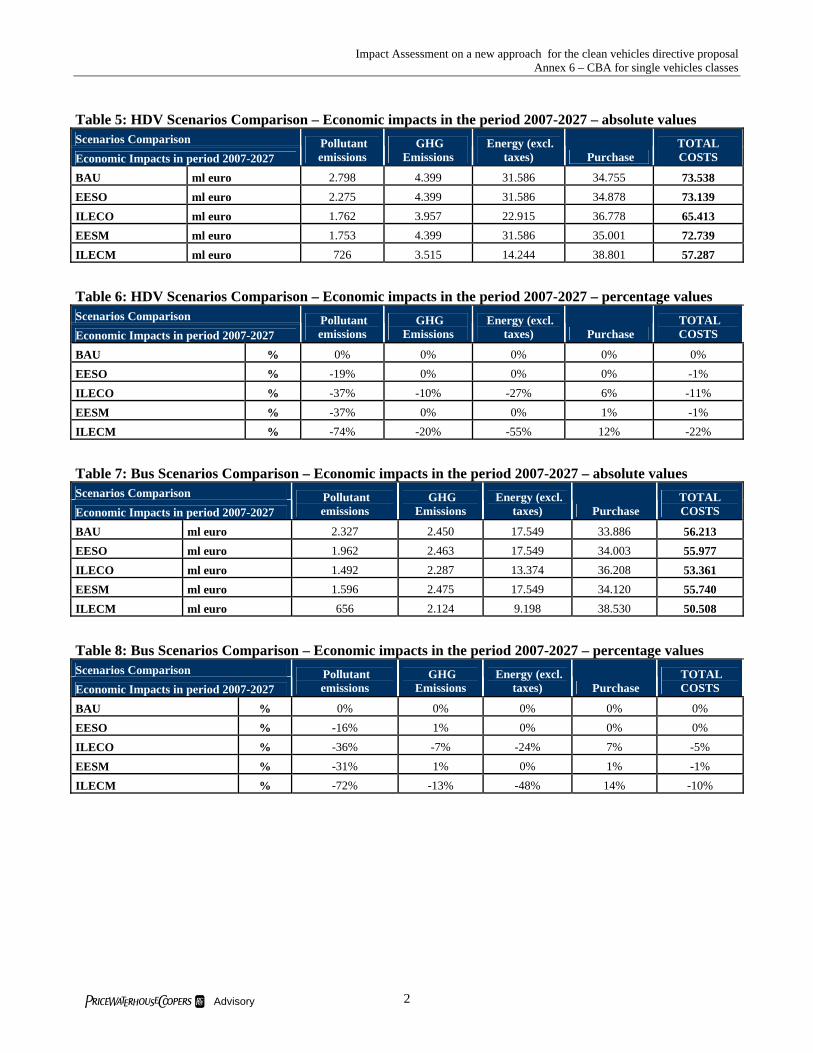
Impact Assessment on a new approach for the clean vehicles directive proposal Annex 6 – CBA for single vehicles classes
2 pwc Advisory
Table 5: HDV Scenarios Comparison – Economic impacts in the period 2007-2027 – absolute values Scenarios Comparison Economic Impacts in period 2007-2027
Pollutant emissions
GHG Emissions
Energy (excl. taxes) Purchase
TOTAL COSTS
BAU ml euro 2.798 4.399 31.586 34.755 73.538 EESO ml euro 2.275 4.399 31.586 34.878 73.139 ILECO ml euro 1.762 3.957 22.915 36.778 65.413 EESM ml euro 1.753 4.399 31.586 35.001 72.739 ILECM ml euro 726 3.515 14.244 38.801 57.287
Table 6: HDV Scenarios Comparison – Economic impacts in the period 2007-2027 – percentage values Scenarios Comparison Economic Impacts in period 2007-2027
Pollutant emissions
GHG Emissions
Energy (excl. taxes) Purchase
TOTAL COSTS
BAU % 0% 0% 0% 0% 0% EESO % -19% 0% 0% 0% -1% ILECO % -37% -10% -27% 6% -11% EESM % -37% 0% 0% 1% -1% ILECM % -74% -20% -55% 12% -22%
Table 7: Bus Scenarios Comparison – Economic impacts in the period 2007-2027 – absolute values Scenarios Comparison Economic Impacts in period 2007-2027
Pollutant emissions
GHG Emissions
Energy (excl. taxes) Purchase
TOTAL COSTS
BAU ml euro 2.327 2.450 17.549 33.886 56.213 EESO ml euro 1.962 2.463 17.549 34.003 55.977 ILECO ml euro 1.492 2.287 13.374 36.208 53.361 EESM ml euro 1.596 2.475 17.549 34.120 55.740 ILECM ml euro 656 2.124 9.198 38.530 50.508
Table 8: Bus Scenarios Comparison – Economic impacts in the period 2007-2027 – percentage values Scenarios Comparison Economic Impacts in period 2007-2027
Pollutant emissions
GHG Emissions
Energy (excl. taxes) Purchase
TOTAL COSTS
BAU % 0% 0% 0% 0% 0% EESO % -16% 1% 0% 0% 0% ILECO % -36% -7% -24% 7% -5% EESM % -31% 1% 0% 1% -1% ILECM % -72% -13% -48% 14% -10%

Annex 7 Guidelines for implementing the methodology of
lifetime external cost internalised to the procurement of vehicles operating in public
transport
September 2007
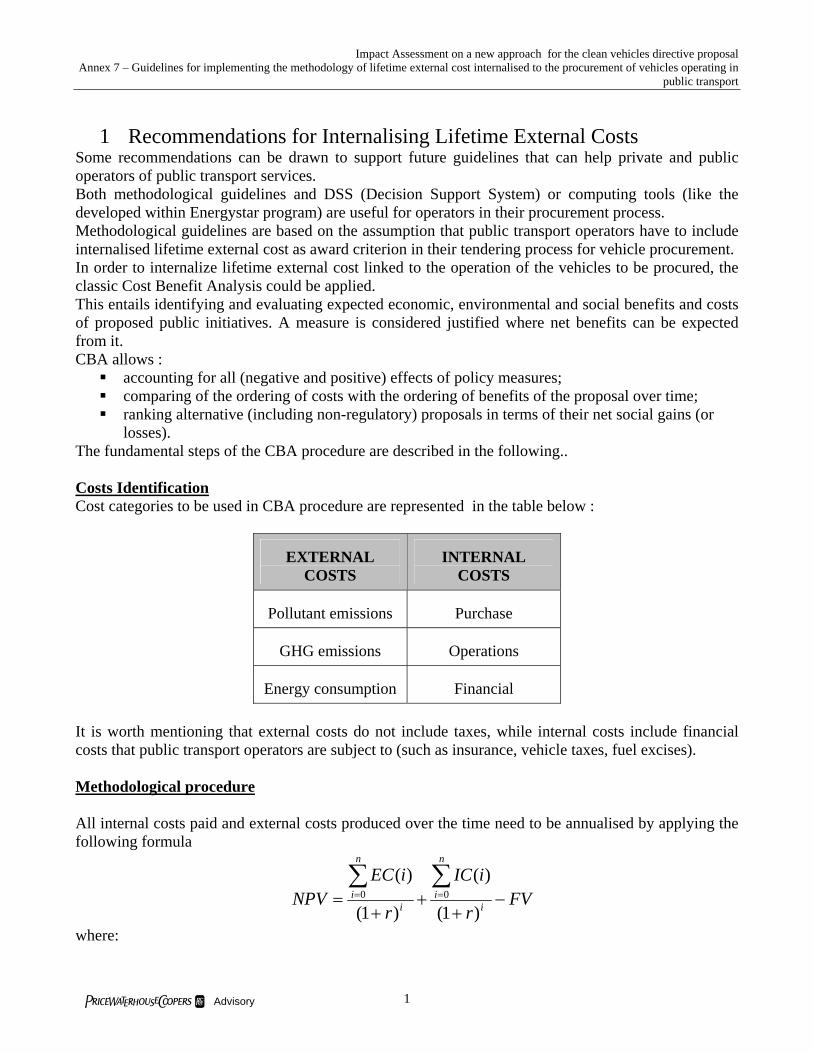
Impact Assessment on a new approach for the clean vehicles directive proposal Annex 7 – Guidelines for implementing the methodology of lifetime external cost internalised to the procurement of vehicles operating in
public transport
1 pwc Advisory
1 Recommendations for Internalising Lifetime External Costs Some recommendations can be drawn to support future guidelines that can help private and public operators of public transport services. Both methodological guidelines and DSS (Decision Support System) or computing tools (like the developed within Energystar program) are useful for operators in their procurement process. Methodological guidelines are based on the assumption that public transport operators have to include internalised lifetime external cost as award criterion in their tendering process for vehicle procurement. In order to internalize lifetime external cost linked to the operation of the vehicles to be procured, the classic Cost Benefit Analysis could be applied. This entails identifying and evaluating expected economic, environmental and social benefits and costs of proposed public initiatives. A measure is considered justified where net benefits can be expected from it. CBA allows :
accounting for all (negative and positive) effects of policy measures; comparing of the ordering of costs with the ordering of benefits of the proposal over time; ranking alternative (including non-regulatory) proposals in terms of their net social gains (or
losses). The fundamental steps of the CBA procedure are described in the following.. Costs Identification Cost categories to be used in CBA procedure are represented in the table below :
EXTERNAL COSTS
INTERNAL COSTS
Pollutant emissions Purchase
GHG emissions Operations
Energy consumption Financial It is worth mentioning that external costs do not include taxes, while internal costs include financial costs that public transport operators are subject to (such as insurance, vehicle taxes, fuel excises). Methodological procedure All internal costs paid and external costs produced over the time need to be annualised by applying the following formula
FVr
iIC
r
iECNPV i
n
ii
n
i −+
++
=∑∑==
)1(
)(
)1(
)(00
where:

Impact Assessment on a new approach for the clean vehicles directive proposal Annex 7 – Guidelines for implementing the methodology of lifetime external cost internalised to the procurement of vehicles operating in
public transport
2 pwc Advisory
NPV is the net present value of a generic alternative, that is the algebraic sum of external and internal costs.
FV is the final value, that is the value of the purchased good at the lifetime’s end. External and internal costs are calculated according to the following formulae:
iEEPMPMNONOcoco mqcqcqcqciECxx
⋅⋅+⋅+⋅+⋅= )()(22
iii fnPiIC ++=)( where symbols refer to the variables illustrated in the table 1. Data Necessary variables for calculation of external and internal cost values to carry out the Benefit Cost Analysis are listed in the table 1, which shows variables, related symbols, measure units, possible sources and some suggested reference values for general cost factors. Values of other variables should be inputted by the user (that is, the public or private operator of public transport services), if they concern his/her expectations regarding his/her experienced costs or the operations of the vehicle to procure; in other cases, they should be requested to the manufacturers that participate to the tender, if they concern technical characteristics of the vehicles. Table 1
Input Symbol Value Measure
unit
Source
2CO unit emissions cost 2coc 0,02 Euro/g CAFE’
2CO emission factor 2coq g/Km Input by producer
xNO unit emission cost xNOc 0,0044 Euro/g ExternE
xNO emission factor xNOq g/Km Input by producer
PM unit emission cost PMc 0,0553 Euro/g ExternE
PM emission factor PMq g/Km Input by producer
Unit diesel cost Dc Euro/MJ Input by user
Diesel consumption factor Dq g/Km Input by producer
Unit gasoline cost Gc Euro/MJ Input by user
Gasoline consumption factor Gq Input by producer
Unit LPG cost LPGc Euro/MJ Input by user
LPG consumption factor LPGq Input by producer
Unit CNG cost CNGc Euro/MJ Input by user
CNG consumption factor CNGq Input by producer

Impact Assessment on a new approach for the clean vehicles directive proposal Annex 7 – Guidelines for implementing the methodology of lifetime external cost internalised to the procurement of vehicles operating in
public transport
3 pwc Advisory
Input Symbol Value Measure
unit
Source
Unit FAME cost Fc Euro/MJ Input by user
FAME consumption factor Fq Input by producer
Unit Ethanol cost Ethc Euro/MJ Input by user
Ethanol consumption factor Ethq Input by producer
Unit Electricity cost ELc Euro/MJ Input by user
Electricity consumption factor ELq Input by producer
Mileage during year i im Km Input by user
Annual quota of the purchasing price of the vehicle
iP Euro Input by user
Maintenance cost during year i in Euro Input by producer
Yearly financial cost if Euro Input by user
Lifetime n Input by user
Discount rate r 4 % Guidelines for Benefit Cost Analysis by CEE.
It could be useful to underline that:
Values of pollutants and GHG emission costs are here provided as reference values by assuming the same source used for the Impact assessment study);
The financial costs must be inputted in IC(i) formula by the user; Energy cost is highly dependent on the type of energy, its usage and energy production; it is
assumed that users of CBA procedure will insert energy cost; The annual quota of the purchasing price of the vehicle has been introduced to include both
leasing and instalment payments; The discount rate (r) is a correction factor that allows the direct comparison of costs and
benefits occurring in different points in time, valuing immediate costs and benefits more highly than those that occur later. You should use a discount rate of 4%; this rate broadly corresponds to the average real yield on longer-term government debt in the EU over a period since the early 1980s.
Comparison of alternatives The procedure provides as output the Net Present Value (NPV) of each purchasing alternative, that is each vehicle type. NPV should be then taken as one of the attributes included into the general objective function, other than other desired features like: air conditioning, braking and accelerating characteristics etc... Finnish Guidelines prescribe that all energy efficiency and environmental friendliness criteria should have at least an aggregate weighting of 10% in the comparison.
Impact Assessment on a new approach for the clean vehicles directive proposal Annex 7 – Guidelines for implementing the methodology of lifetime external cost internalised to the procurement of vehicles operating in
public transport
4 pwc Advisory
The same prescription could be envisioned for the present value of External cost in this procedure. Alternatively, public transport operators could apply directly the Cost Benefit Analysis in the tendering process and choose the vehicle type having the highest Net Present Value.