impact assessment of air quality mitigation measures in paris - polis network …€¦ · impact...
TRANSCRIPT

Impact assessment of Air Quality
Mitigation measures
in Paris
Karine LEGER , Directrice Partenariats et communication | CIVITAS conference | 12/09/16

2
Summary
1. Airparif
2. State of the air quality in Paris region
3. Different kind of measures
and combined tools to be used
4. Local Permanent mitigation measures
5. Emergency measures
6. Perspectives

Airparif 1

► According to the French air Act (1996), air pollution is monitored :
• by independent regional organizations
• gathering the stakeholders in their administration board ¼ State
¼ local authorities including the municipality of Paris
¼ industries
¼ experts and NGOs (environmental
& consumer protection )
► Paris region (Ile-de-France):
• Independant expert : Airparif
• Set up in 1979
• Staff : ~60 personnes
• Agreed by the french Ministery in charge of Environment
Airparif
Monitoring, informing and advising

► different environnements
average (background) vs maximum (traffic) levels
hot spots (transports, industries, airports…)
different citizens’ exposures
► different polluants
Regulated for their effect on health and the environment
Emerging (ultrafines particles , pesticides, SLCst …)
Monitoring

Communication tools
Web, apps, mini-site
airparif.fr
Daily forecast
Social networks, RSS feeds
Publications

► on municipal luminous boards
► by the media
• regional TV (twice a day),
• Newspapers, radio
• PR
► apps : EU projects
► Linked websites
► social networks
► Hot air balloon
INFORMING : example of dissemination
13/03/2012

State of air quality
in Paris region2

Airuse – Life Conference| 19-04-2016 9
Paris region specificities
► A densely populated and urbanised area
Region:
12 million inhabitants, 12 000 km2
Paris agglomeration:
9.6 million inhabitants, 2 600 km2
4.5 million of cars and 600 000 LDV
128 million of km driven / day
800 km of highways
Municipality of Paris
2.2 million inhabitants, 105 km
► Quite similar to London
► Main sources of pollution : 1st traffic, 2nd heating
NO2 hourly concentration 01/07/15/ Airparif
map: Google Earth & Landsat

Location of PM10 emissions
Paris region, 2012
Main sources of air pollution
Regional emissions =
About 10% of national emissions
(VOCs and NOX)
Major impact of
Paris agglomeration
Linked :
with urbanization
& population density with transports
NOX emission (Per km²)
Northern part of France

Main contribution to polluants emission, but not the only one
more than 50 % of regional NOX emission
about 1/3 of Particles (PM10 & PM2.5) and GHGs emission
> 20% of VOCs emission
more than 1/3 coming from powered two wheels
Traffic contribution
HDV
LDV
Cars

► But still a problem for 5 pollutants
► Numerous inhabitants exposed
to air pollution levels > regulation
mainly in Paris agglomeration and along the busy streets (except for O3)
NO2: 1,6 million inhabitants
= 1 Parisian over 2
> 40µg/m3
PM10 : 300 000 inhabitants > 35 days above 50µg/m3
PM2,5 : 11,5 million inhabitants
= 95% of the region > 10µg/m3 from WHO
O3 : health protection threshold
exceeded in the whole region, every year> 120 µg/m3, 8h average
Despite large improvements it is still an issue
Paris
NO2
Legal issue with the EU commission

14
Different type of measures and
combined tools to be used3

Pollution episodes
• Several days /year
• Depending mostly
on weather conditions
• High attention:
public and media
Measure :
• Short term• Goal : decrease
the pic intensityIn order to limit its short
term impact on health
(sensitive people at first)
and the pollution
exported
2 local sets of mitigation measures
Daily Pollution
• Every day, all the year
through
• Mostly linked with
emissions
• Main impact on health
Measure
• Permanent
• Goal :
Permanent decrease in
air pollution, at least down to limit
values, in order to
improve health
and environment
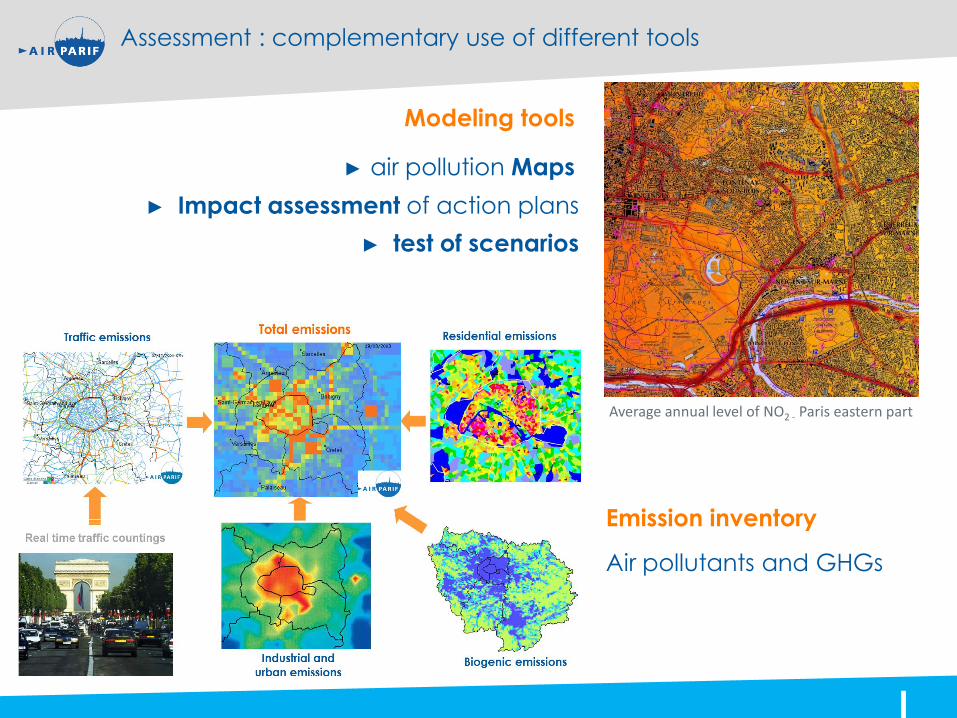
Average annual level of NO2 - Paris eastern part
Assessment : complementary use of different tools
► Impact assessment of action plans
► air pollution Maps
Modeling tools
► test of scenarios
Emission inventory
Air pollutants and GHGs
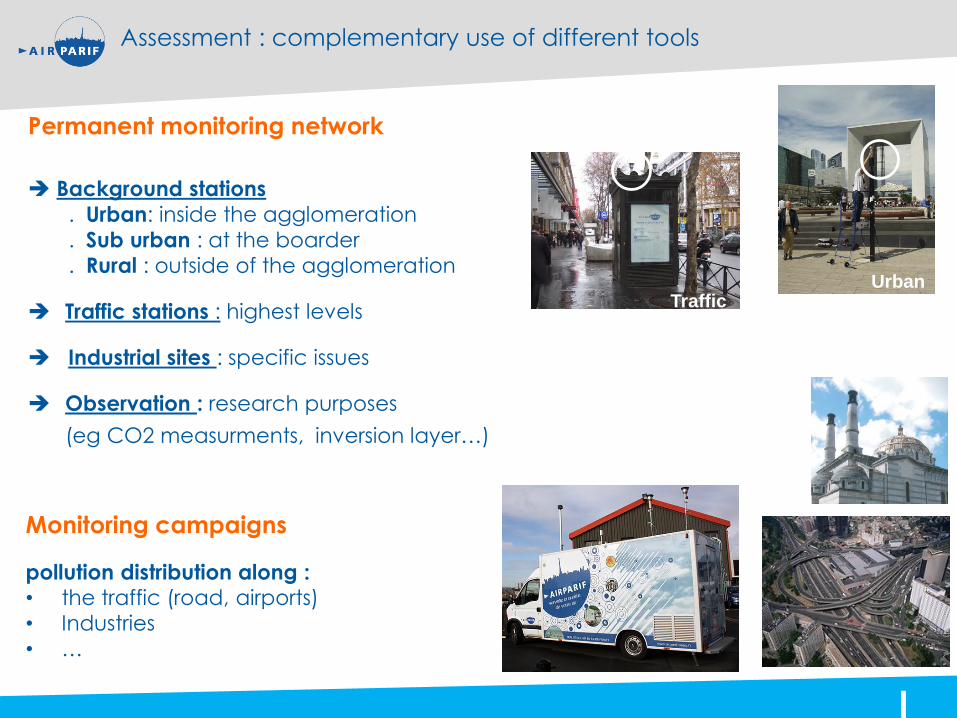
Assessment : complementary use of different tools
Observation
Permanent monitoring network
Background stations
. Urban: inside the agglomeration
. Sub urban : at the boarder
. Rural : outside of the agglomeration
Traffic stations : highest levels
Industrial sites : specific issues
Observation : research purposes
(eg CO2 measurments, inversion layer…)
Urban Traffic
Monitoring campaigns
pollution distribution along : • the traffic (road, airports)
• Industries
• …

18
Impact of local permanent
mitigation measures3

Montmartre - 17 juin 2004 Montmartre - 9 juin 2004
► Paris air pollution plan : Reduction of space dedicated to cars
and development of sustainable transportation modes ()
- Shared Electric cars and bicycles (velib’ & autolib)
with parking places allocated for them
- Restricted buses and bicycles lines
- Tram
- Areas of restricted speed limits (30km/h)
…
► EU measures :
eg new Euro norms
► Development of diesel fleet in France
Which impact of those different measures
between 2002 and 2012 ?(lastest and new measures under evaluation)
Permanent mitigation measure implemented in Paris
19
Paris without car”
(Champs Elysee's only open to
pedestrians and bicycles in 2015)

20
Impact on Traffic between 2002 to 2012
* Traffic data : municipality of Paris based on observations
► General traffic reduction between 2002-12* :
-21% in downtown Paris, -6% on the ring road
► Different trends depending on the type of vehicles and streets
• Less personal cars (-25%) and HDV
increased number of P2W (+25%)
• More public transports (buses)
• Main traffic reduction on major Parisian roads due to the tram and restricted bus lines a slight increase on secondary roads

Emissions from 2002 to 2012 Nitrogen
Oxydes NOx
Particles
PM10
Traffic and velocity reduction due to the
development of the road system
- 11 % - 9 %
Fleet renewal: Evolution of the Euro norms - 24 % - 45 %
Increase in diesel vehicles + 11 % + 13 %
Evolution of the vehicles fleet composition + 3 % + 6 %
Total evolution of the emissions from traffic
combustion (all factors combined)
-30 % - 35 %
Impact on air quality – Emissions
Atmospheric pollutants emissions
Between 2002 and 2012
23

Annual average concentrations – Particles
General improvement on PM concentrations
Remark : In 2002 and 2012, the meteorological conditions were close to those of « an averageyear » . Thus, the comparison is relevant.
24
Impact on air quality – PM concentrations

Annual average concentrations – NO2
Smaller Improvement for NO2 than for PM10• In average : annual standard limit of 40 µg.m-3 still exceeded for a large number of
parisians
• But decrease of the highest levels : globally lower in 2002 than in 2012.
25
Impact on air quality – NO2 concentrations

NO2 levels remain rather stable in traffic conditions
26
NOx reduction is compensated by an increase in NO2 emissions
Due to a larger number of catalysed particle traps (diesel vehicles)
Evolution of the average NO2 concentrations measured on 5 traffic stationsfrom 1996 to 2015

27
Impact assessment of emergency
measures: restricted traffic 3

Airuse – Life Conference| 19-04-2016 31
Impact of traffic restriction: March 17th, 2014
Even and uneven plate system
Traffic restriction much smaller than 50%:
-9 up to -18% in average, depending on the area
Area Morning rush hour
Evening rushhour
In averageFor the whole day
Paris -9% -21% -18%
Sub urban area -6% -15% -13%
Rural area -4% -10% -9%
Source : Airparif, HEAVEN model (based on traffic countings from Paris City Hall and DRIEA/DIRIF)

Ring roadSeine river
PARIS
Situation
Average decrease
In PM 10
Average decrease
in NO2
Background - 2 % - 7%
Traffic (ring road) - 6 % - 10%
At 7:00 pm
32
Impact on hourly concentrations of PM10
PM10: Some more important decreases during the evening traffic peak-> - 10 % on the ring road (and even - 20 % for certain part of it)

Situation
Average decrease in
PM 10
Average decrease in
NO2
Background - 2 % - 7%
Traffic (ring road) - 6 % - 10%
33
Impact on hourly concentrations of NO2
NO2: Some more important decreases during the evening traffic peak-> - 30 % on the ring road
Seine river
At 08:00 pm

34
12 / 03/ 2015 : production de carbone suie en Ile-de-France
et impact sur les concentrations des régions avoisinantes
(exemple : plus de 50% en région Centre)
Air pollution is both imported AND exported !
Black Carbon

Airuse – Life Conference| 19-04-2016 35
Perspectives 3

Paris
Different scales involved : Interaction of local / regional and transboundaries responsibilities
Eg: Origin of fine particles concentrations measured in Paris*
Source Approachment study, Airparif & LSCE, 2011
► The city of Paris is only one part of the whole agglomeration
And mitigation measures must be taken at a scale large enough

Need for an integrated measures for air and climate
37
Common locations
• in some parts of the
world (eg Asia)
• Urban areas = key
emitters > 50% of the population (2/3 by 2050) 70% of CO2 emissions
Same sources
With different
contributions :
Traffic, heating,
industries, agriculture
key role of large
cities : efficient
bottom up initiatives
•Local action =
local + global benefits
•Short term benefits :
health + economy
Room for cooperation
Beware of
antagonisms:
Change in energies (diesel, wood burning…)
Look for Synergies
• Energy saving
• Change in behavior
► Pollutants► Sources (emissions)
► Action plans
Impact of Climate
change on air
pollution
Increase in ozone levels
Common pollutants
for Climate and air :
Short lived compounds
(SLCs)

Practical example in Paris : impact on air and climate (Emissions) of measures taken to reduce air pollution between 2002 and 2012
► CO2 : global pollutant
but major impact of local measures
► PM & NOx: local pollutants
but major impact of national and EU policies
Air Climate
Source : étude Airparif- 2013
Need for an integrated measures for air and climate

local measures but international impact: an issue shared across the world by large cities

Which is the world’s most
polluted city???
Montmartre - 17 juin 2004 Montmartre - 9 juin 2004
Consequences : countries ranking and cities comparisons

Media, social, economical and political issue :
Requires expertise, independant evaluation and transparency
Room for a City based european reference network
Bottom up initiative to share expertise, best practices, for capacity building
and to provide referenced information
Air action plan and impact assessement
Citeair Initiative Initiative of Anne Hidalgo + WHO

airparif.fr
Contact : pierre-emmanuel.burg@airparif. fr | 01 44 59 47 64
L’Observatoire au service de la Santé
et de l’Action