immigration/immigrants week 3-5. immigration: international perspectives 214 million outside...
TRANSCRIPT

Immigration/Immigrants
Week 3-5


Immigration: International Perspectives
• 214 million outside homeland
• “push”/”pull’ reasons
• Globalization+Environment+Overpop+Politics
• Transmigration/circular migration/nonlinear• South to south migration• A world system not domestic focus• Not fixed field of location but complex dynamics of flows and
connections involving many actors, at diff levels, across diff domain

Canada = Immigration Society
• Canada = Immigration SocietyRegulate Entry• Who got in?• Who Gets In?• Who Should Get In?• Principled and Proactive
Immigrants = assets - nation building- national identity
Immigrants = permanent - citizenship
Programs for settlement - multiculturalism
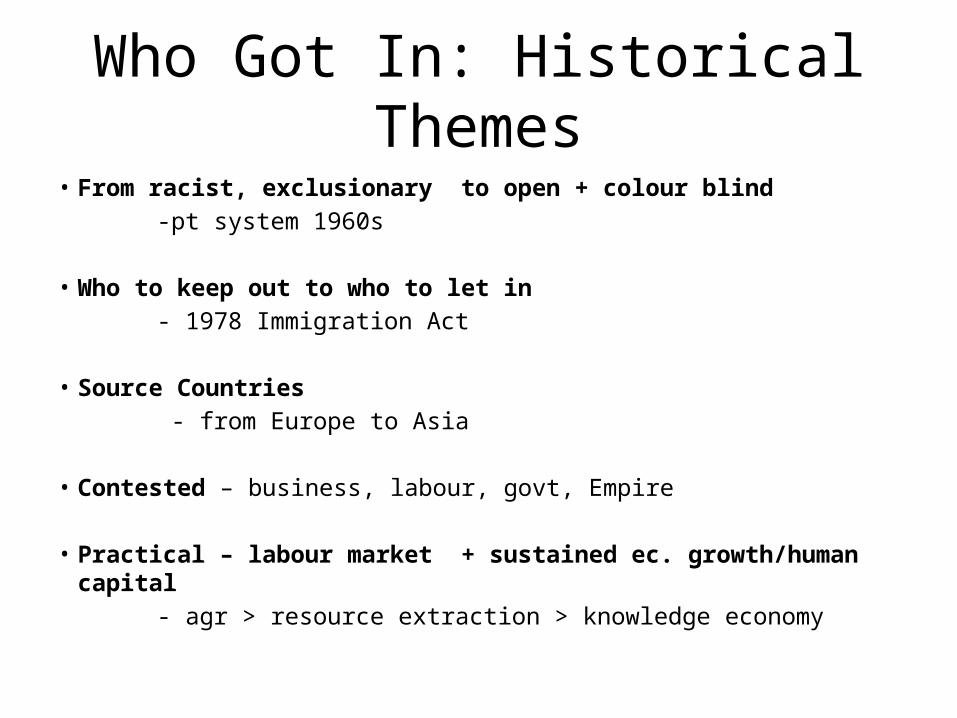
Who Got In: Historical Themes• From racist, exclusionary to open + colour blind -pt system 1960s
• Who to keep out to who to let in - 1978 Immigration Act
• Source Countries - from Europe to Asia • Contested – business, labour, govt, Empire
• Practical – labour market + sustained ec. growth/human capital - agr > resource extraction > knowledge economy


Who Gets In?
• Annual Flows - 250 000 average (281,000 in 2010) - why? Sustained economic growth or electoral politics
• Class of Entry - Family, Economic, Refugee
• Customizing Entry - Permanent citizens vs temporary workers - federal + provincial (PNP) - “29” - model migrants - Canadian Experience Class - international students - Temporary workers

Admission Class
Major Class Subclasses
Family Partners, spouses, children, parents, grandparents
Economic Class • Federal skilled workers• Business (invest, self employed,
entrepreneurs• Provincial/territorial nominees• Live in care givers• Canadian experience class
Refugee and protected persons class sponsored (govt + private)
landed in Canada/ claimants

Point systems for federal skilled workers
• Points for entry - 25 Education - 24 language - 21 work experience - 10 arranged employment - 10 age - 10 adaptability• PASS = 67• Quebec = different system

TABLE 9-2 Im m ig rants by A dm iss ion C lass and T ota ls , 2009
% of all im m igrants
Fam ily class 65 187 25.9%
Spouses and partners 43 887
Sons and daughters 3025
Parents/grandparents 17 175
O thers (including children) 1100
Econom ic (independent) class
153 458 60.9%
Federal skilled workers 40 729
Business im m igrants (investors, self-em ployed, entrepreneurs)
3423
Provincial/territorial nom inees 11 799
Live-in caregivers 6272
Canadian Experience Class 1774
Total of principal applicants (under the econom ic category)
(63 997 )
Total of spouses and dependents under the econom ic category
(89 461 )
Refugees and protected persons class
22 844 9.1%
Governm ent assisted 7425
Privately sponsored 5036
Landed in Canada 7202
Refugee dependants 3181
Other 10 635 4.1%
Hum anitarian/com passionate cases
10 223
Total 252 124 100%
Tem porary foreign w orkers and foreign students
Tem porary foreign workers 178 640 (boosting overall total of tem ps in Canada to 282 771)
International students 85 131 (boosting overall total of international students in Canada to 196 227)
Total 263 771

Annual immigration to the United States: 2002–2006
• All New Lawful Permanent Residents 1 000 000• Employer sponsored 163 000• Family sponsored 649 000• Other 210 000• • Temporary Workers and Dependants 321 000• Unauthorized/Undocumented 500 000(Pew Institute Hispanic
Centre estimate)• TOTAL 1 800 000 (approx per year)• • ● Canada vs USA ratios• ● Internal vs External• ● Family vs Economic• Refugee ratios


Refugee Crisis, Canada’s Refugee Determination System
• Global Patterns 34 million persons of concern 11 million refugees
• Canada’s intake = 30 000 – 40 000• Immigration and Refugee Board • Debates - 42% • Why Crisis?
- singh ruling 1985
- from persecution to protection to risk aversion - Global smuggling - philosophical diffs – whose interests - self select debate
• Modifying the Process – Safe Country regulations

Refugee Challenges
- who is a refugee - how do we find out - is the system working - is the system fair

Crisis or business as usual?
• 2001 3851 refugee claims from Hungary (Roma)• 2001 visa requirement imposed• 2002 34 refugees claims / 43 per cent accepted
• 2008 visa lifted• 2009 2433 refugee claims /1 % OK, the rest
abandonned or withdrawn*2010 2300 claims (tops list). Human traffickingRULE OR EXCEPTION? (Hamilton Spectator 12.1.12)

Contesting the Refugee Crisis
Expansive Restrictive
• Generous definition (protection)
• Refugee first (human rights)
• Optimists (assume the best)
• Cast net wide
• Strict UN definition (persecution)
• Canada first (national interests)
• Pessimists (assume the worst)
• Case by case

Assessing Immigration
• Who should get in? - What for? - How many? - What Kind? - Where from?• Benefits + Costs • Functionalists vs Conflict
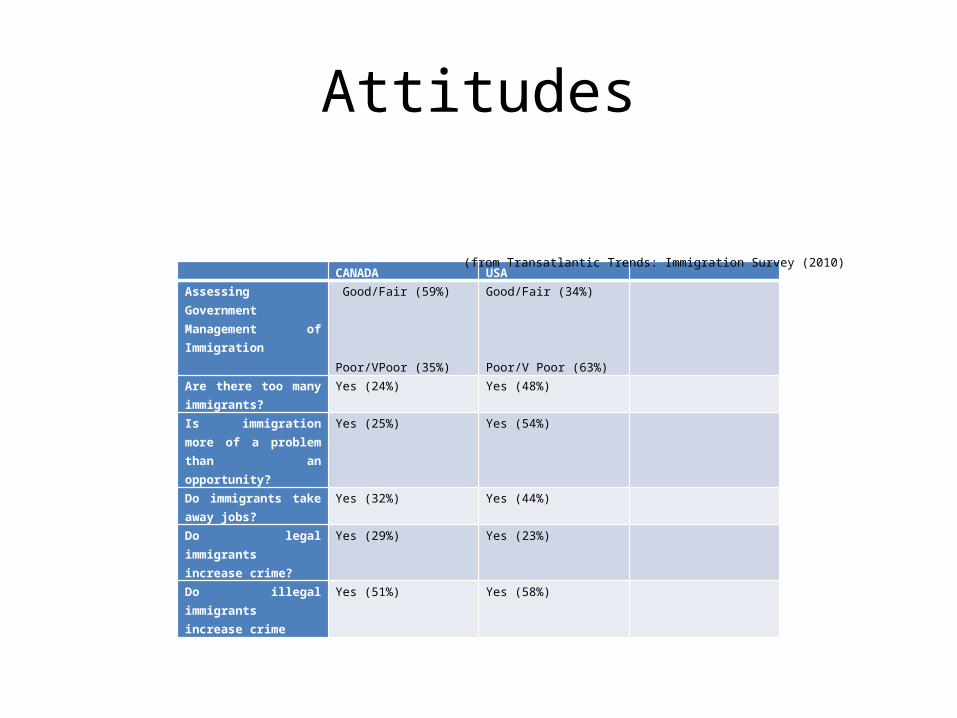
Attitudes
CANADA USA Assessing Government Management of Immigration
Good/Fair (59%)
Poor/VPoor (35%)
Good/Fair (34%)
Poor/V Poor (63%)
Are there too many immigrants?
Yes (24%) Yes (48%)
Is immigration more of a problem than an opportunity?
Yes (25%) Yes (54%)
Do immigrants take away jobs?
Yes (32%) Yes (44%)
Do legal immigrants increase crime?
Yes (29%) Yes (23%)
Do illegal immigrants increase crime
Yes (51%) Yes (58%)
(from Transatlantic Trends: Immigration Survey (2010)

Immigrant Experiences in Canada
• Immigration = process - From getting in to (premigration) - Settling down (settlement) - fitting in (adaptation) - moving up (integration)
• Immigrant Experiences - The good, the bad, and the ugly
• Rethinking Immigration - who needs whom?

Variety of immigrant experiences
inequalities Intergenerational Conflicts Gender Conflicts
IncomePovertyEmployment

Current Shifts in Immigration Program
• From one-size-fits-all to customized• Focus on young, educated, language-ready• From permanent to perm+temp• From single pt of entry to multiple pts• From gatekeeper to facilitate settlement
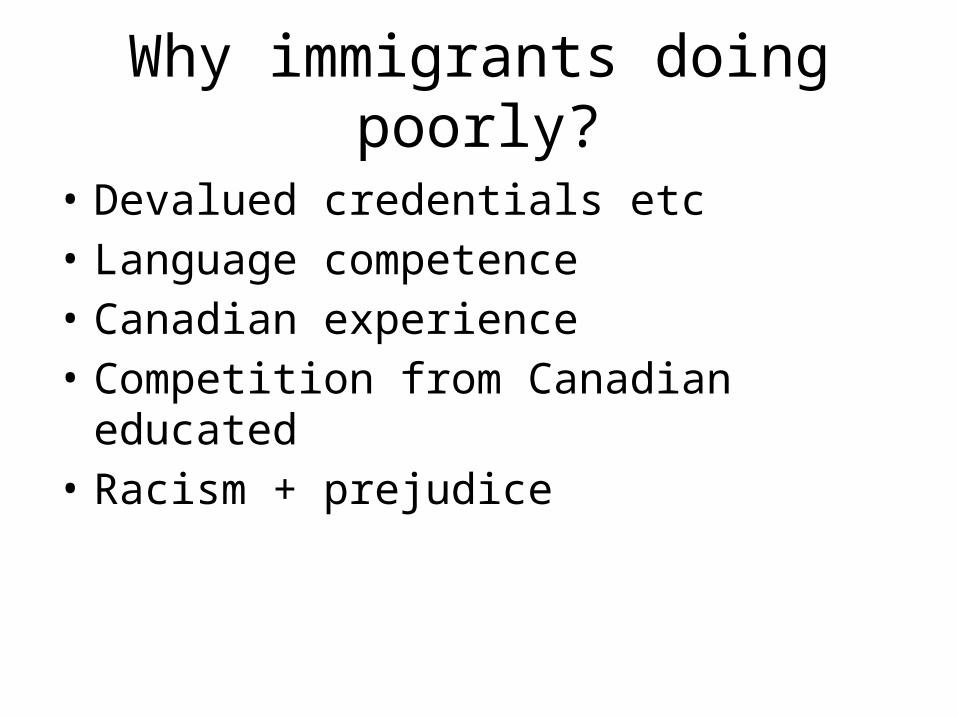
Why immigrants doing poorly?
• Devalued credentials etc• Language competence• Canadian experience• Competition from Canadian educated• Racism + prejudice

• Lack of Economic opportunity
• Isolation
• Lack of mainstream understanding
• Ghettoization
• Ignorance
• Access to services
• Physical Violence
(UN, 2008)

Every act of immigration is like suffering a brain stroke. One has to learn to walk again, to talk again, and to move around the world again, and probably most difficult of all, one has to learn to re establish a sense of community again.
Toronto Psychiatrist Vivian Lakoff, NP 27.5.03

Immigrant Inequality
• Existence - income, un/employment, poverty - also power and privilege• Causes - individual, institutional, societal • Perspectives - functionalist vs conflicts• Cures – Employment Equity
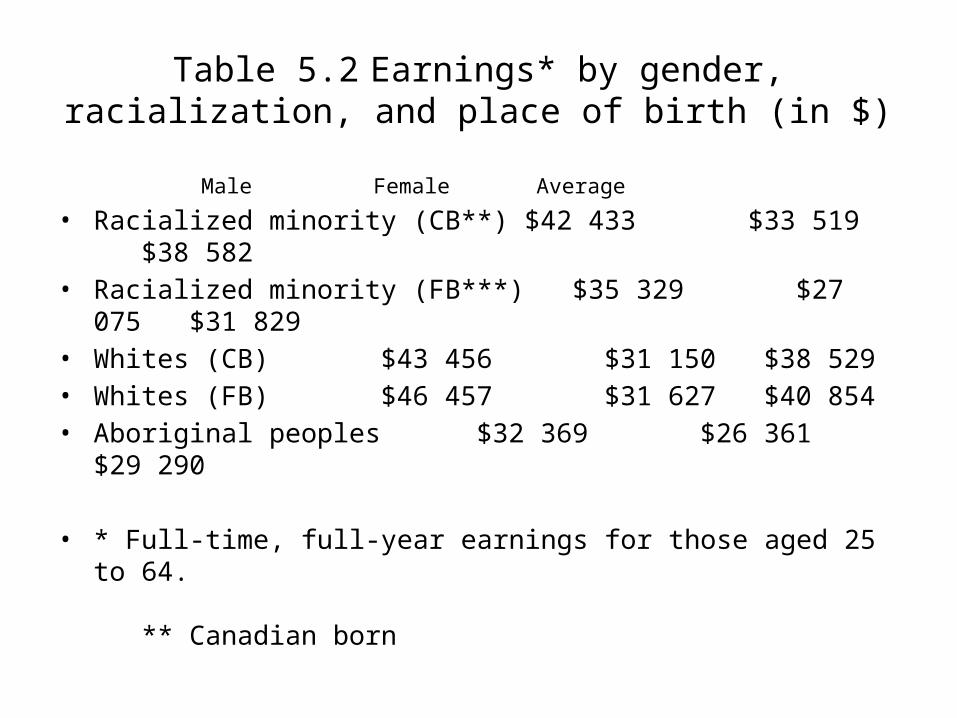
Table 5.2 Earnings* by gender, racialization, and place of birth (in $)
Male Female Average
• Racialized minority (CB**) $42 433 $33 519 $38 582• Racialized minority (FB***) $35 329 $27 075 $31 829• Whites (CB) $43 456 $31 150 $38 529• Whites (FB) $46 457 $31 627 $40 854• Aboriginal peoples $32 369 $26 361 $29 290
• * Full-time, full-year earnings for those aged 25 to 64. ** Canadian born *** Foreign born
• Source: Adapted from Kunz et al. 2001. Source: 1996 Census, Public Use Microdata File.
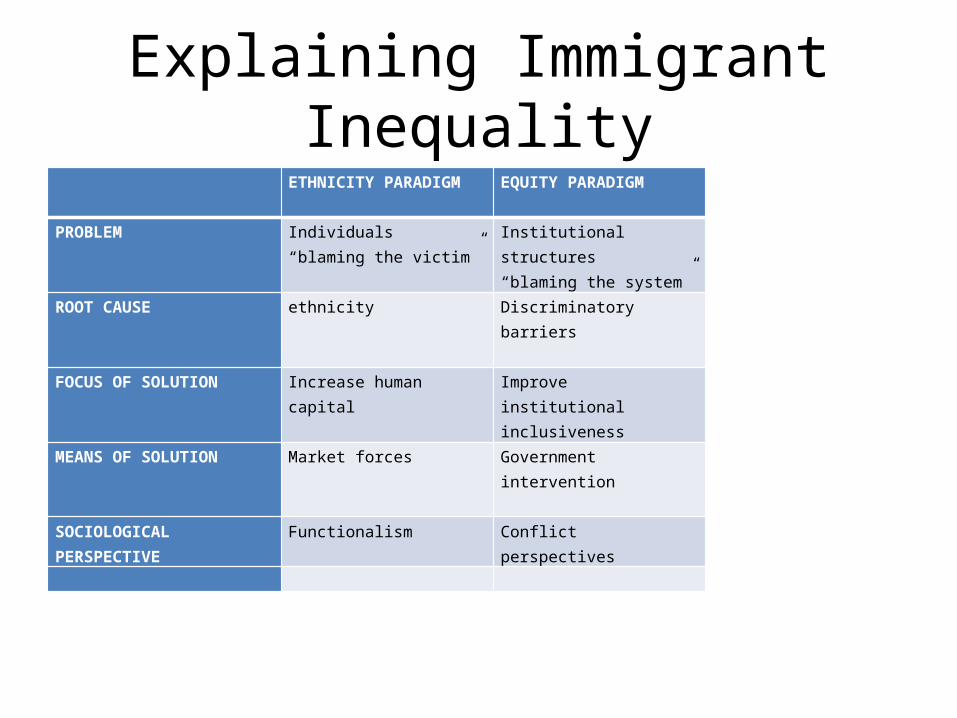
Explaining Immigrant Inequality ETHNICITY PARADIGM EQUITY PARADIGM
PROBLEM Individuals
“blaming the victim”Institutional structures“blaming the system”
ROOT CAUSE ethnicity Discriminatory barriers
FOCUS OF SOLUTION Increase human capital Improve institutional inclusiveness
MEANS OF SOLUTION Market forces Government intervention
SOCIOLOGICAL PERSPECTIVE Functionalism Conflict perspectives

Competing Equality Models
Equivalence-Based Equality Equity-Based EqualityFormal (abstract and mathematical equivalent) Substantive (context and
consequences)Everyone should be treated equally (the same) People should be treated as equals
(different)Pretend pluralism Taking differences seriously/into
accountSame treatment as a matter of course Customized treatment when situation arisesEqual opportunity Equitable outcomesDiscipline of the market Government intervention
