immigration and violent crime: evidence from the colombia
TRANSCRIPT
Immigration and Violent Crime: Evidence from the
Colombia-Venezuela Border∗
Bravo Working Paper # 2020-021
Brian Knight† Ana Tribin‡
Abstract: This paper investigates the link between violent crime and immigration using data from Colombian municipalities during the recent episode of immigration from Venezuela. The key finding is that, following the closing and then re-opening of the border in 2016, which precipitated a massive immigration wave, homicides in Colombia increased in areas close to the border with Venezuela. Using information on the nationality of the victim, we find that this increase was driven by homicides involving Venezuelan victims, with no evidence of a statistically significant increase in homicides in which Colombians were victimized. Thus, in contrast to xenophobic fears that migrants might victimize natives, it was migrants, rather than natives, who faced risks associated with immigration. Using arrests data, there is no corresponding increase in arrests for homicides in these areas. Taken together, these results suggest that the increase in homicides close to the border documented here are driven by crimes against migrants and have occurred without a corresponding increase in arrests, suggesting that some of these crimes have gone unsolved. Keywords: Crime, Migration, Venezuela JEL classification: J15, J18, K42
____________________________________________ ∗Andrea Garcia and Diana Ricculi provided helpful research assistance. The opinions contained in this document are the sole responsibility of the author and do not commit Banco de la República or its Board of Directors. †Brown University. Email: [email protected] ‡DEPE-Banco de la Republica de Colombia. Email: [email protected].

Immigration and Violent Crime: Evidence from the Colombia-Venezuela
Border∗
Brian Knight† Ana Tribin‡
Abstract
This paper investigates the link between violent crime and immigration using data from Colom-
bian municipalities during the recent episode of immigration from Venezuela. The key finding is that,
following the closing and then re-opening of the border in 2016, which precipitated a massive immi-
gration wave, homicides in Colombia increased in areas close to the border with Venezuela. Using
information on the nationality of the victim, we find that this increase was driven by homicides involv-
ing Venezuelan victims, with no evidence of a statistically significant increase in homicides in which
Colombians were victimized. Thus, in contrast to xenophobic fears that migrants might victimize na-
tives, it was migrants, rather than natives, who faced risks associated with immigration. Using arrests
data, there is no corresponding increase in arrests for homicides in these areas. Taken together, these
results suggest that the increase in homicides close to the border documented here are driven by crimes
against migrants and have occurred without a corresponding increase in arrests, suggesting that some
of these crimes have gone unsolved.
Keywords: Crime, Migration, Venezuela
JEL classification:J15, J18, K42
∗Andrea Garcia and Diana Ricculi provided helpful research assistance. The opinions contained in this document are thesole responsibility of the author and do not commit Banco de la República or its Board of Directors.†Brown University. Email: [email protected]‡DEPE-Banco de la Republica de Colombia. Email: [email protected].
1
1 Introduction
There is a long history of xenophobia, or fear of immigrants, around the world, and these negative
perceptions of immigrants can apply to many different issues. Campante, Depetris-Chauvin and Durante
(2020) document that the Ebola health scare in the U.S. during 2014 led to more conservative views
towards immigrants. According to a 2018 survey by Quinnipiac University, 71 percent of respondents
in the United States think that undocumented immigrants illegally crossing the border with Mexico is an
important problem, and 37 percent think that undocumented immigrants take jobs away from American
citizens.1 Donald Trump recently used anti-immigration rhetoric as a key campaign theme, helping to
propel him to win the 2016 Presidential Election (Lamont, Park and Ayala-Hurtado (2017)).
This paper investigates the link between immigration and violent crime based upon an analysis of
crime rates in municipalities in Colombia before and after the massive immigration wave from Venezuela
that occurred during the past decade. This wave has led to anti-immigrant perceptions and a backlash
among natives. Based upon a survey conducted in Cucuta, a city close to a key border crossing with
Venezuela, nearly two-thirds of respondents considered migrants as a threat to the city (FIP (2019)). Like-
wise, a national survey in Colombia found that 62 percent of respondents had an unfavorable perception of
Venezuelan migrants, with only 31 percent having a favorable perception. In the same survey, 54 percent
of respondents were in favor of closing the border, with only 40 percent supporting the relatively lax status
quo policy.2 Furthermore, an OxFam (2019) survey shows that 74 percent of Colombians believe that im-
migration increases crime and insecurity, a higher percentage than that of Ecuador (68 percent) and Peru
(70 percent). Large anti-government protests in the capital city of Bogota during late 2019 further fueled
anti-migrant perceptions, with wide circulation of unfounded rumors involving crimes committed by mi-
grants during the protests.3 Consistent with negative perceptions about international migrants, Rozo and
Vargas (2018) document that inflows of internal migrants into Colombian municipalities does not affect
voting behavior, while international migration reduces support for the incumbent party and increases votes
for the right-wing candidates. Exploring possible economic mechanisms behind this increase in support
for right-wing parties, the authors do not find any evidence of detrimental economic effects from migration
that could drive these anti-immigrant views.
In this paper, we systematically address these issues using data on crimes in Colombian municipali-
1https://poll.qu.edu/images/polling/us/us04112018_ugnt28.pdf2See https://www.semana.com/nacion/articulo/encuesta-invamer-aumenta-el-rechazo-a-los-venezolanos/6261773https://www.reuters.com/article/us-colombia-strike-venezuela/protests-in-colombia-spark-backlash-against-venezuelan-
migrants-idUSKBN1Y516U
2

ties. We address two specific research questions. First, has the recent immigration wave from Venezuela
led to an increase in violent crime in affected regions of Colombia? Second, if so, did this increase pri-
marily involve crimes against natives or crimes against migrants? While xenophobia around criminal
activity involves perceptions of more crimes committed by immigrants against natives, there is evidence
that immigrants themselves are at heightened risk for victimization.4 Moreover, the existing literature on
immigration and crime has lacked the nationality data necessary to understand which of these two views
is correct. That is, do increases in crimes in areas with more migrants primarily involve crimes committed
against natives or crimes committed against migrants?
To answer these research questions, we examine crime patterns in Colombia using both temporal
and geographic variation. Our temporal variation involves the closing (August 2015) and subsequent re-
opening (August 2016) of the border with Colombia by President Maduro of Venezuela, precipitating
a massive immigration wave that accelerated in 2017 and peaked in 2018. The geographic variation
involves comparing municipalities closer to and further from five key border crossings along the border
between Colombia and Venezuela. To answer the first research question, we use data on homicide rates
by municipality and month over the period 2010-2019. To answer the second research question, we also
incorporate information on the nationality of homicide victims. To better understand how and whether
these crimes were resolved by police, we supplement this analysis with data on arrests for homicides.
In terms of the first research question, we do find that there was an increase in homicides in munic-
ipalities close to the five key border crossings following the closing and subsequent re-opening of the
border in 2016, relative to the time period prior to the closing and relative to municipalities that lie further
from these border crossings. These results are robust to using an alternative temporal definition of the
migration wave, focusing on periods of hyperinflation in Venezuela, which helped to fuel the exodus to
Colombia. Likewise, the results are robust to using a measure based upon travel times, rather than travel
distances, and to using the distance to the two most important border crossings, rather than the distance to
all five border crossings. Exploring the timing of homicides more finely, we find that the increase in crime
close to the border was at its highest level during 2018, when both hyperinflation in and migration from
Venezuela were also at their peak. Exploring more finely the geographic patterns of homicides, we find
that the increase in homicides following the closing and subsequent re-opening of the border is driven by
municipalities very close to the frontier, those within 100 miles of one of the five key border crossings.
In terms of the second research question, we find that this increase in homicides in this frontier region,
4The United Nations Refugee Agency highlights that migrants from Venezuela are often victimized (seehttps://www.unhcr.org/5ab8e1a17.pdf accessed July 10, 2020).
3

following the closing and subsequent re-opening of the border, was driven by crimes against both Venezue-
lans and victims for whom the police did not record a nationality. We conjecture that this second category
primarily involves undocumented migrants from Venezuela. We find no statistically significant evidence
of an increase in homicides against native Colombians. Exploring more finely the timing of the increase
in homicides against Venezuelans in the border region, we find that this increase was again the strongest
during 2018, when both hyperinflation in and migration from Venezuela were at their peak. Exploring
more finely the geographic patterns surrounding the increase in homicides against Venezuelans following
the closing and subsequent re-opening of the border, we find that the results are driven almost exclusively
by municipalities very close to the frontier, those within 100 miles of one of the five key border crossings.
Turning to data on arrests, we find no statistically significant evidence of an increase in arrests in areas
close to the border following the closing and subsequent re-opening of the border. Taken together, these
results suggest that the increase in homicides close to the border documented here have occurred without
a corresponding increase in arrests, suggesting that some of these crimes have gone unsolved. Moreover,
counter to xenophobic perceptions associated with migrants committing crimes against natives, our results
appear to be driven by crimes against migrants.
The paper proceeds as follows. We next review the relevant literature and then provide a more detailed
overview of the setting. We then describe our empirical approach and data. Following a presentation of
our empirical results, the final section concludes.
2 Related Literature
A large existing literature addresses a similar research question: does immigration increase crime?
Broadly speaking, the literature has used two approaches to answering this research question. The first
approach uses changes in the legal treatment of already arrived immigrants in the destination country.
Pinotti (2017) and Mastrobuoni and Pinotti (2015) exploit exogenous variation in legalization treatment of
immigrants in Italy, finding that legalization tends to reduce both crime rates and recidivism rates. Hines
and Peri (2019) and Miles and Cox (2014) study the Secure Communities program in the United States,
finding that increased enforcement of immigration laws and associated deportations did not reduce crime
rates in these communities.
Our paper is more closely related to the second approach, which uses immigrant shocks, in both within-
country and cross-country analyses, to study the link between immigration and crime. Butcher and Piehl
4
(1998) link immigration patterns to crime rates in metro areas in the United States, finding no correlation
between the two factors after controlling for local demographics in these metro areas. Spenkuch (2014)
conducts a similar analysis but uses an instrumental variables approach, based upon ethnic differences
in settlement patterns, finding an effect of immigration for crimes motivated by financial crime and also
for those immigrants most likely to have poor labor market outcomes. In a study of crime rates in Italy,
Bianchi, Buonanno and Pinotti (2012) use a similar approach based upon settlement patterns within Italy
and changes in the number of migrants from origin countries to destination countries outside of Italy,
finding that increased immigration leads to a small but positive increase in robberies but no change in the
overall crime rate. Chalfin (2014) develops an instrument based upon rainfall shocks in Mexico, finding no
link between immigration and crime in the United States. Piopiunik and Ruhose (2017) study the collapse
of the former Soviet Union and the subsequent immigration of ethnic Germans to Germany. They exploit
the exogenous allocation of these migrants across regions of Germany, finding significant increases in
crime. Nunziata (2015) uses a split sample instrumental variables approach, finding that immigration does
not increase crime rates but does lead to an increase in the fear of crime, especially among natives with
unfavorable attitudes towards immigrants, consistent with a link between xenophobia and crime.
Relative to this literature, our paper makes three contributions. First, and most importantly, by exploit-
ing incident-level crime data that includes information on the nationality of the victim, we can distinguish
between crimes against immigrants and crimes against natives. As noted above, Nunziata (2015) docu-
ments that, despite no change in crime rates, natives perceive a link between immigration and crime in
Europe, and, as noted above, many native Colombians tend to have unfavorable perceptions of migrants
from Venezuela. Yet, countering this view, we find that the increase in violent crime in areas most af-
fected by immigration is driven by crimes against migrants rather than by crimes against natives. Our
second contribution involves the development of a new identification strategy, based upon the closing of
the border by Maduro in 2015, the subsequent re-opening in 2016, and the distance to five key crossings
on the border between Colombia and Venezuela. Third, while the literature has tended to focus on crime
in the United States and Europe, we study South America, which tends to have much higher rates of vio-
lent crime. Recent homicide rates in Colombia and Venezuela were 25 per 100,000 and 56 per 100,000,
respectively, versus rates of 5 per 100,000 in the United States and only 1 per 100,000 in both Germany
and Italy.5
There is one recent paper, Franco-Mora (2020), developed simultaneously with and independently of
5These statistics are based upon World Bank data, derived from https://data.worldbank.org/indicator/VC.IHR.PSRC.P5?locations=MX(accessed July 9, 2020).
5

this paper, that studies immigration from Venezuela and crime in Colombia. Using monthly data over the
time period January 2016 to June 2108, his paper attempts to distinguish between irregular and regular
migration, finding that irregular migration increases theft and that legal migration increases homicides.
These two papers are different on several dimensions. First, and most importantly, we distinguish between
crimes against natives and crimes against Venezuelans, documenting that the increase in violent crime is
driven by crimes against migrants. This finding is inconsistent with anti-immigrant views involving crimes
committed by migrants against the native population. Second, while we exploit distance to the border and
the closing and subsequent re-opening of the border by Maduro, Franco-Mora (2020) uses the presence
of migrants in municipalities during different points in time over this 30-month period. Third, we study a
longer time period, 2010-2019, allowing for a substantial time period prior to the migration wave.
This paper is also related to a literature on the labor market effects of the Venezuelan refugee cri-
sis in Colombia. Bonilla-Mejia et al. (2020) analyze the extent to which immigration is responsible for
increases in unemployment, finding that new migration mainly hurts the labor conditions of established
migrants. That is, their results show that an increase in the share of immigrants increases the probability
of unemployment for the immigrant population. On the other hand, migration does not affect the prob-
ability of unemployment of non-immigrants since employment losses are compensated by a reduction in
participation. In a parallel study, Santamaria (2020) uses a differences-in-differences strategy, exploiting
immigration flows and the timing of migration shocks to measure the impact of migrants on labor market
outcomes in Colombia. Using google search patterns to identify immigrant host communities in Colombia,
the author finds a negligible reduction in wages for both informal workers and less educated workers in the
formal sector. In the same vein, Caruso, Gomez-Canon and Valerie-Mueller (2019) find that an increase in
the supply of immigrant labor reduces informal sector wages in urban areas. These harmful consequences
are generated mostly by male workers and are more pronounced for those in low-skilled jobs. Summariz-
ing, these studies find a deterioration in labor market outcomes, especially for migrants, the less educated,
and informal workers. These changes in labor market outcomes could represent a contributing mechanism
towards changes in violent crime in affected areas.
There is also an extensive literature on crime in Colombia, driven by the fact that the country has
experienced an internal war for more than five decades. Prem et al. (2018) analyzes murders of social
leaders before and after the peace agreement. Idrobo, Mejía and Tribin (2014) find that the increase
of illegal gold mining by illegal armed groups caused a statistically significant increase in violence, as
measured by the homicide rate and the number of victims of massacres. Gaviria (2000) shows that criminal
6

groups, especially drug traffickers, transformed Colombia into a more-than-suitable place for criminal
activities of all sorts through congestion in law enforcement, the supply of weapons, and the creation of a
culture that favors easy money and the violent resolution of conflicts. Despite this, there is scarce literature
about the contribution of migration from Venezuela to crime patterns in Colombia.
3 Institutional Context
Venezuela has experienced an economic and political crisis during the past decade and especially so
during the time period following the death of President Hugo Chavez, which occurred in 2013. Chavez
was replaced by his Vice President, Nicolas Maduro, who then won two subsequent Presidential elec-
tions that were highly disputed by the opposition over claims of irregularities (Corrales (2020)). During
Maduro’s time as President, Venezuela has suffered an economic depression. A decline in oil prices dur-
ing 2016 contributed to a significant reduction in government revenues, leading to shortages, sustained
inflationary pressure, and ultimately episodes of hyperinflation (Hernandez and Monaldi (2016)). All told,
the economy is estimated to have shrunk by two-thirds between 2013 and 2019.6 Massive protests over
economic and political issues occurred in the country, with significant events occurring in both 2017 and
2019.
By the end of 2019, due to this political and economic crisis, more than 4 million Venezuelans had
left their country, out of an estimated population of 28 million in 2010, representing one of the largest
migration waves ever.7 Given its long and relatively open border, Colombia has been disproportionately
affected, with roughly 1.8 million Venezuelan migrants living in Colombia, a country with a population
of roughly 50 million, by the end of 2019.8 The Colombian government has managed this challenging
situation by providing timely border assistance, relaxing entry requirements, granting temporary permits,
and ensuring universal emergency care (OECD (2019)). Of the 1.8 million migrants, a minority (roughly
750,000) are considered to be in legal status with an Special Stay Permit (Permiso Especial de Permanencia
or PEP), with the majority (just over one million) in an irregular situation, having exceeded their allowed
residence time or entered without authorization.9
Based upon author calculations using the 2019 Great Integrated Household Survey (GEIH), migrants
6https://www.economist.com/the-americas/2020/03/19/a-tale-of-two-crises-in-colombia7https://www.unhcr.org/en-us/venezuela-emergency.html8https://www.migracioncolombia.gov.co/infografias/total-de-venezolanos-en-colombia-corte-a-31-de-diciembre-de-2019
(accessed July 8, 2020).9The PEP was introduced in 2017 in response to the influx of displaced Venezuelans. It is valid for 90 days at a time,
automatically renewable for up to two years, and is by the government of Colombia at no cost.
7

from Venezuela residing in Colombia tend to be younger than natives. While 17 percent of natives are
between ages 20 and 29, this age group represents 26 percent of migrants. 24 percent of migrants also have
children under the age of 9, compared to 17 percent among natives. At the other end of the age spectrum,
only 2 percent of migrants are over over 65 years old, relative to 9 percent of natives. While many migrants
were male during the early stages of the migration wave, males and females were equally represented in
the survey by 2019. Most migrants participate in the labor market but tend to have lower incomes than
natives and also experience high levels of informality (Tribin-Uribe et al. (2020 forthcoming)).
As mentioned above, our research design uses both temporal and geographic variation. Regarding
temporal variation, we exploit the closing of the border by Maduro in August 2015 and the subsequent
re-opening one year later. During August 2015, there was a conflict along the border in which three
Venezuelan soldier were injured by gunfire. This conflict led President Maduro to close the border with
Colombia, along with the deportation of some Colombians from Venezuela. One year later, during August
2016, the border was re-opened.10 As shown in Figure 1, the closing led to a substantial decline in border
crossings over this period when the border was closed, from August 2015 to July 2016, relative to the prior
years, from 2012 to mid-2015. Likewise, there was a a large jump in border crossings when the border
was re-opened in August 2016. Border crossing remained at elevated levels over the next year, before
spiking further in 2018, with roughly 100,000 crossings per month at the peak. These spikes coincide
with both political turmoil, as represented by protest activity, and economic turmoil, as represented by
hyperinflation in Venezuela, which, according to official government figures, reached its highest rate of
inflation of 130,060 percent during calendar year 2018.11
Regarding geographic variation, Colombia and Venezuela share a land border of nearly 1,400 miles,
and we focus our research on the location of five key border crossings, listed from north to south, and as
shown in Figure 3: Maicao, Puerto Santander, Cucuta, Arauca, and Puerto Carreno.12 As shown in Figure
2, based upon official border crossings data, Cucuta is the location with the most crossings, resulting
from the Cucuta border crossing being located on the Simon Bolívar International Bridge, which links
key highways originating in Caracas, the largest city in Venezuela, to key highways that ultimately lead to
Bogota, the largest city in Colombia.13 Maicao is the location with the second most crossings, resulting
from its close proximity to Maracaibo, the second largest city in Venezuela, and several large metro areas
10https://www.bbc.com/news/world-latin-america-37072433 (referenced June 30, 2020)11https://en.wikipedia.org/wiki/Hyperinflation_in_Venezuela#Inflation_rate (accessed June 30, 2020).12There are also an undetermined number of informal crossings, with migrants paying smugglers to cross illegally. See,
for example, https://www.npr.org/2019/04/04/709193469/chronicles-of-a-venezuelan-exodus-more-families-flee-the-crisis-on-foot-every-da.
13These data can be accessed from the website https://public.tableau.com/profile/migraci.n.colombia#!/.
8

in the north of Colombia. The next largest crossing is Puerto Santander, which is located just north of the
crossing at Cucuta. The other two crossings, Arauca and Puerto Carreno, are located further to the eastern
part of Colombia and in more rural areas. These two border crossings have a small number of migrants
during the time period analyzed here, 2012-2019.
To document a link between border crossings and immigration, we next examine the geographic spread
of migrants from Venezuela in Colombia using 2005 and 2018 Census data on the fraction of the popu-
lation in Colombian municipalities who were born in Venezuela.14 As shown in Figure 3, which plots
deciles of the percentage point change in the fraction born in Venezuela between 2005 and 2018, there are
overall increases in fraction of the population that was born in Venezuela, ranging across municipalities
from no increase or a small increase to an increase of 23 percentage points. More importantly for our
research design, the largest increases are clustered near the land border with Venezuela, with especially
large increases in areas close to the five key border crossings.
4 Approach and Data
As described above, our empirical approach relies on both temporal and geographic variation. Re-
garding the temporal variation, we exploit timing surrounding the closing and re-opening of the border in
August 2016. As documented above, this reopening led to a spike in the number of migrants crossing the
border. Regarding the spatial variation, we measure the distance between each municipality and the five
key border crossings. As documented above, the newly arrived migrants tended to settle in areas close to
the border and especially so in municipalities that are close to the five key border crossings.
To measure geographic exposure to migration, we first calculate both the travel distance and the travel
time between each municipality urban center and each of the five border crossings. This is implemented
using the Google Maps API. In particular, the latter returns information on travel distance and travel time
based on the recommended route between start and end points, as calculated by Google Maps. Given that
a departure time is not specified, choices of route and duration are based on the road network and average
travel time, independent of traffic conditions. We then collapse travel distance, and analogously for travel
time, to a single measure of exposure to Venezuelan migrants for each municipality by computing the
distance between each municipality and the closest border crossing. That is, we compute the minimum
14The Census official statistics, derived from the National Administrative Department of Statistics (DANE), estimate thetotal population in Colombian municipalities by nationality at two points in time: 2005, before the influx of migrants fromVenezuela, and 2018, which is close to the end of the peak of the migration wave.
9
distance to a border crossing for each municipality and likewise for travel times.
Throughout the empirical analysis, we estimate the following regression model:
hmt = αm +αt +βA f tert× ln(distance)m + εmt
where hmt represents the homicide rate in municipality m during month t, αm represents municipality fixed
effects, αt represents month-by-month fixed effects, A f tert indicates the time period following the re-
opening of the border in August 2016, ln(distance)m represents travel distance between the municipality
and the closest border crossing, and εmt represents unobserved factors. Our key parameter of interest, β ,
captures the change in the homicide rate as a function of distance to the border following the re-opening
of the border in August 2016, relative to the prior time period. Given that our measure of distance is
small close to the border and larger further from the border, we hypothesize a negative coefficient. That
is, following the re-opening of the border, we hypothesize that homicides should fall as distance from the
border increases.
To measure homicides, we use administrative records in our analysis. The National Police of Colombia
provide the data on reported crimes and arrests.15 The crime data are based on incidents and specify the
exact municipality, date, nationality of the victim, and type of reported crime. Similar measures are
available for arrests data, with nationality pertaining to that of the arrested individual rather than to that
of the victim. These data are available from 2010 to 2019, and we aggregate these to the municipality-
month level. We focus on homicides, a measure that does not suffer from self-reporting problems and is
not subject to two important changes in the methodology in crime reporting that occurred in the past few
years, during the crucial periods of immigration.16
Our measure of homicides rates requires not only a count of homicides but also an annual measure of
population. Towards this end, we use official population data from the National Administrative Depart-
ment of Statistics (DANE). DANE made population projections at the national and regional level over the
2005-2020 period. These projections were based on the adjusted results of the 2005 Census and the 1985
to 2005 census reconciliation.
In alternative specifications, we use measures of the consumer price levels and corresponding inflation
15Crime data were downloaded directly from the the national police web page (https://www.policia.gov.co/grupo-informaci%C3%B3n-criminalidad/estadistica-delictiva) and arrests data were provided through a right of petition.
16Starting in In 2017, the Nation Attorney General’s Office and the National Police integrated their information. Homicidecrime in both databases had 98 percent degree of coincidence. Around the same time, the national police introduced a mobilephone app for reporting certain crimes, leading to a surge in newly reported crimes. Importantly, the mobile app did not apply tohomicides, given their severity. For more information about these changes in methodology, see Rodriguez-Ortega et al. (2018).
10
rate from Venezuela in place of an indicator for the period after the re-opening of the border in August
2016. These data on prices and inflation are available at the monthly level starting in 2008 and are based
upon the National Consumer Price Index (INPC), as published by the Central Bank of Venezuela.17 As
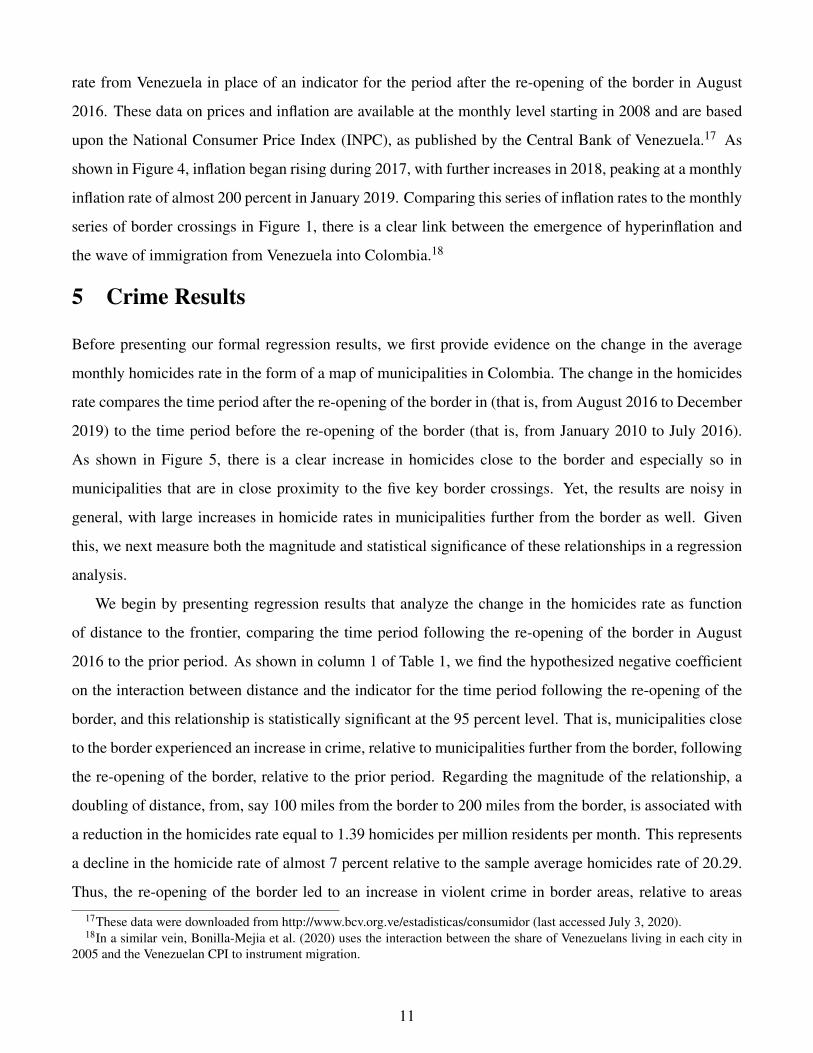
shown in Figure 4, inflation began rising during 2017, with further increases in 2018, peaking at a monthly
inflation rate of almost 200 percent in January 2019. Comparing this series of inflation rates to the monthly
series of border crossings in Figure 1, there is a clear link between the emergence of hyperinflation and
the wave of immigration from Venezuela into Colombia.18
5 Crime Results
Before presenting our formal regression results, we first provide evidence on the change in the average
monthly homicides rate in the form of a map of municipalities in Colombia. The change in the homicides
rate compares the time period after the re-opening of the border in (that is, from August 2016 to December
2019) to the time period before the re-opening of the border (that is, from January 2010 to July 2016).
As shown in Figure 5, there is a clear increase in homicides close to the border and especially so in
municipalities that are in close proximity to the five key border crossings. Yet, the results are noisy in
general, with large increases in homicide rates in municipalities further from the border as well. Given
this, we next measure both the magnitude and statistical significance of these relationships in a regression
analysis.
We begin by presenting regression results that analyze the change in the homicides rate as function
of distance to the frontier, comparing the time period following the re-opening of the border in August
2016 to the prior period. As shown in column 1 of Table 1, we find the hypothesized negative coefficient
on the interaction between distance and the indicator for the time period following the re-opening of the
border, and this relationship is statistically significant at the 95 percent level. That is, municipalities close
to the border experienced an increase in crime, relative to municipalities further from the border, following
the re-opening of the border, relative to the prior period. Regarding the magnitude of the relationship, a
doubling of distance, from, say 100 miles from the border to 200 miles from the border, is associated with
a reduction in the homicides rate equal to 1.39 homicides per million residents per month. This represents
a decline in the homicide rate of almost 7 percent relative to the sample average homicides rate of 20.29.
Thus, the re-opening of the border led to an increase in violent crime in border areas, relative to areas
17These data were downloaded from http://www.bcv.org.ve/estadisticas/consumidor (last accessed July 3, 2020).18In a similar vein, Bonilla-Mejia et al. (2020) uses the interaction between the share of Venezuelans living in each city in
2005 and the Venezuelan CPI to instrument migration.
11
further from the frontier, and this increase is both statistically and economic significant in magnitude.
In the remaining columns of Table 1, we decompose the change in the homicides rate according to
the nationality of the victim, with total population in the municipality remaining as the denominator. As
shown, while there is a negative coefficient for Colombian victims, it is small in magnitude, with a reduc-
tion of 0.5213 homicides per million, representing only 38 percent of the total reduction in the homicides
rate of -1.3865 in column 1. The effect for Venezuelan victims, by contrast, has the hypothesized negative
coefficient and is statistically significant at the 95 percent level. While the negative sign on the interaction
term for Venezuelan victims is unsurprising, given the large increase in the sheer number of Venezuelans
living close to the border, as documented previously in Figure 3, the magnitude of this effect is more
compelling, with a reduction of 0.6387 homicides per million, representing almost one-half of the total
reduction in the homicides rate of -1.3865 in column 1. There is no effect for victims from other countries
but a negative and statistically significant coefficient for victims for whom the police did not record a
nationality. While we lack formal evidence on this point, we conjecture that many of these victims with
missing nationality lacked identification cards and were undocumented immigrants from Venezuela. Thus,
counter to negative perceptions of migrants held by some natives, the increase in crime close to the border
was driven by homicides against migrants rather than homicides against natives.
While our baseline measure in Table 1 is based upon a simple indicator for the re-opening of the
border in August 2016, we next investigate the timing of these effects in more detail. In particular, we next
estimate the following regression model:
hmt = αm +αt +βy× ln(distance)m + εmt
where y indexes years. This regression equation is similar to our baseline regression equation, but, instead
of using information on the exact timing surrounding the closing of the border, we instead allow the
coefficient on distance to vary in a flexible manner, year by year, with the effect normalized to zero in
the first year of our data (2010). That is, we do not incorporate any information regarding the timing of
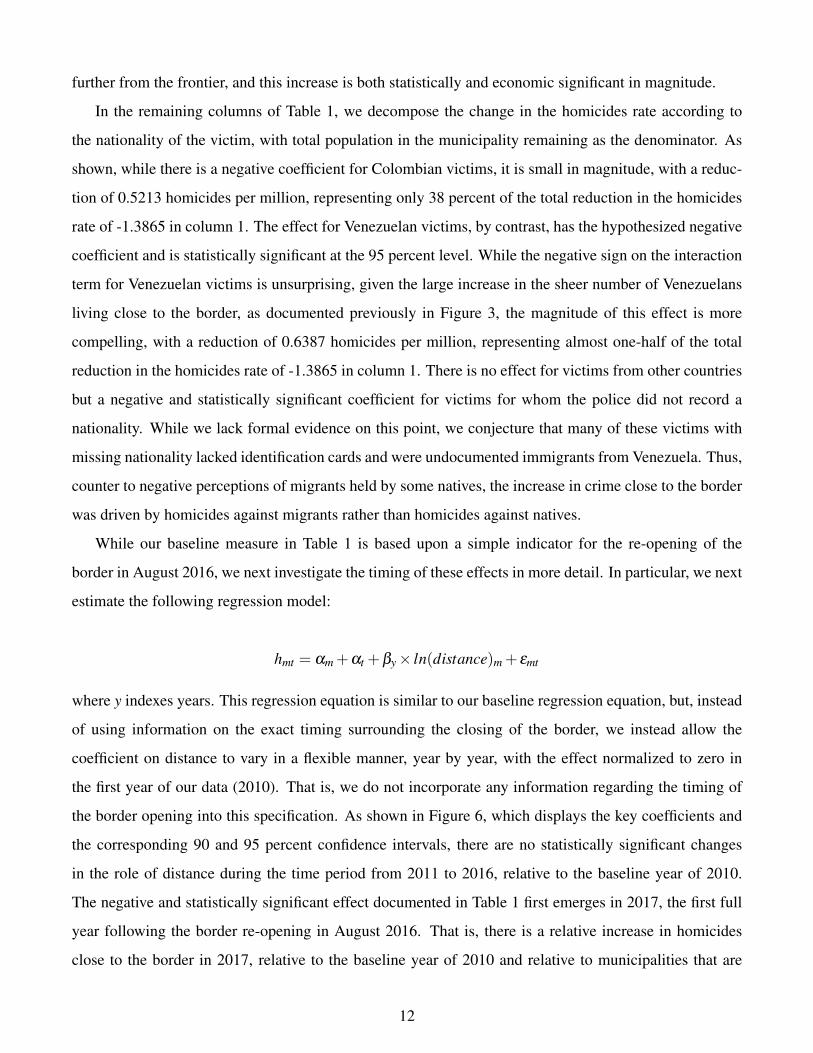
the border opening into this specification. As shown in Figure 6, which displays the key coefficients and
the corresponding 90 and 95 percent confidence intervals, there are no statistically significant changes
in the role of distance during the time period from 2011 to 2016, relative to the baseline year of 2010.
The negative and statistically significant effect documented in Table 1 first emerges in 2017, the first full
year following the border re-opening in August 2016. That is, there is a relative increase in homicides
close to the border in 2017, relative to the baseline year of 2010 and relative to municipalities that are
12
situated further from the frontier. Moreover, the documented negative relationship between distance and
the homicide rates is strongest in 2018, approximating the timing of the arrival of migrants documented
in Figure 1, which also peaked in 2018. In summary, the timing of the change in the homicides rate, as
documented in our baseline regression in Table 1, corresponds to the timing of the border opening and the
subsequent arrival of migrants from Venezuela.
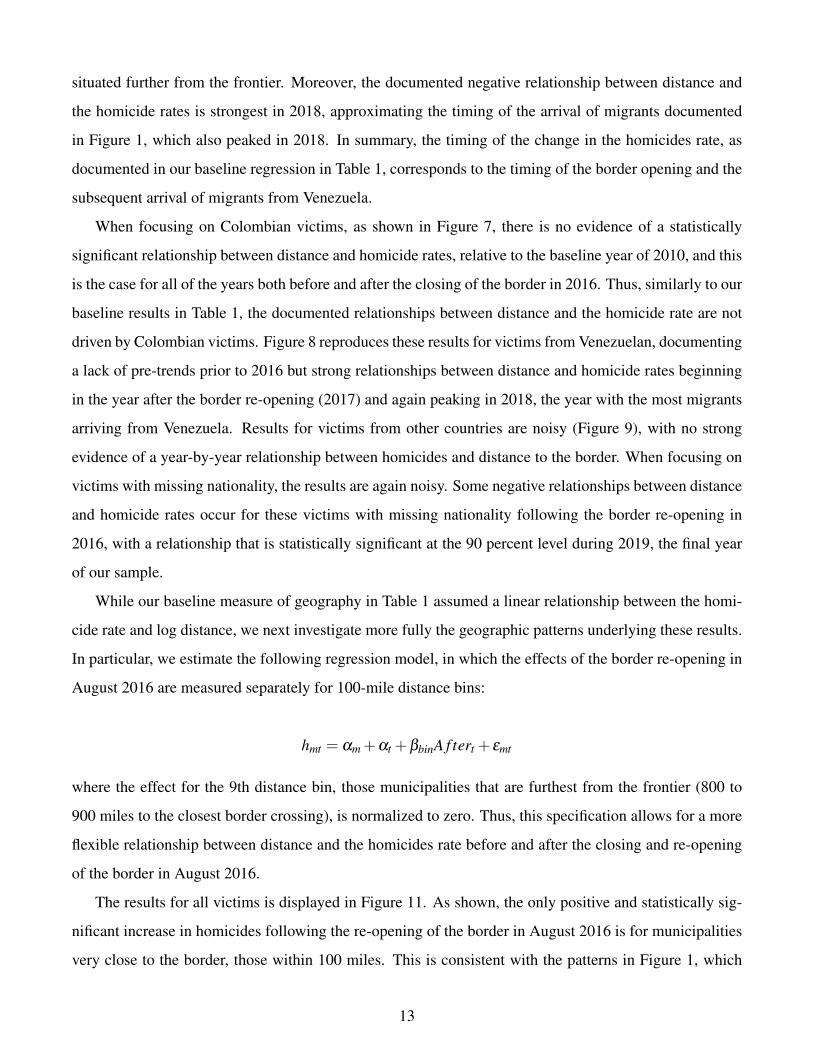
When focusing on Colombian victims, as shown in Figure 7, there is no evidence of a statistically
significant relationship between distance and homicide rates, relative to the baseline year of 2010, and this
is the case for all of the years both before and after the closing of the border in 2016. Thus, similarly to our
baseline results in Table 1, the documented relationships between distance and the homicide rate are not
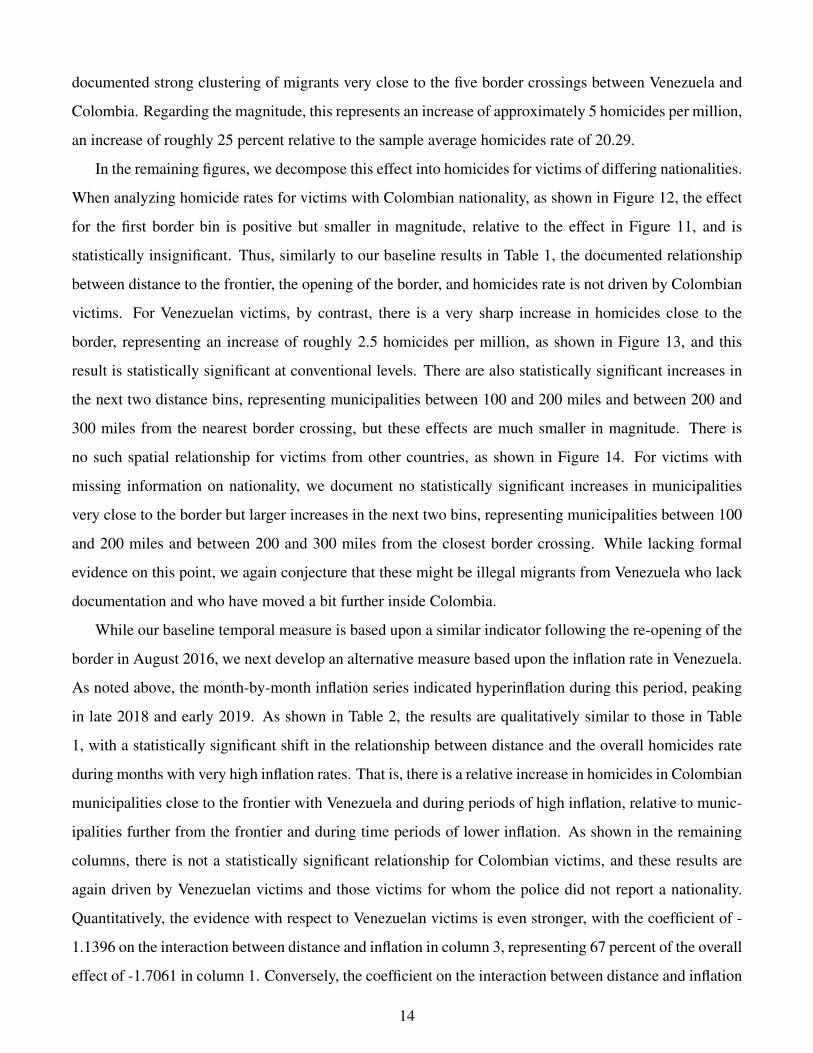
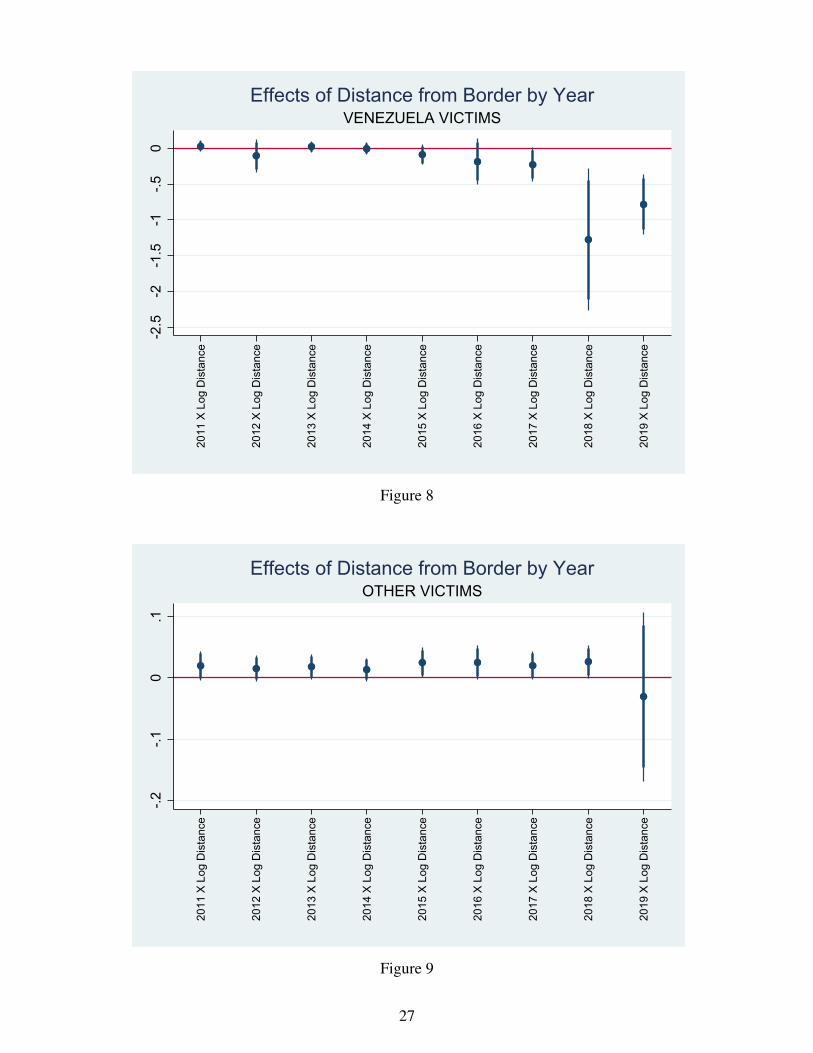
driven by Colombian victims. Figure 8 reproduces these results for victims from Venezuelan, documenting
a lack of pre-trends prior to 2016 but strong relationships between distance and homicide rates beginning
in the year after the border re-opening (2017) and again peaking in 2018, the year with the most migrants
arriving from Venezuela. Results for victims from other countries are noisy (Figure 9), with no strong
evidence of a year-by-year relationship between homicides and distance to the border. When focusing on
victims with missing nationality, the results are again noisy. Some negative relationships between distance
and homicide rates occur for these victims with missing nationality following the border re-opening in
2016, with a relationship that is statistically significant at the 90 percent level during 2019, the final year
of our sample.
While our baseline measure of geography in Table 1 assumed a linear relationship between the homi-
cide rate and log distance, we next investigate more fully the geographic patterns underlying these results.
In particular, we estimate the following regression model, in which the effects of the border re-opening in
August 2016 are measured separately for 100-mile distance bins:
hmt = αm +αt +βbinA f tert + εmt
where the effect for the 9th distance bin, those municipalities that are furthest from the frontier (800 to
900 miles to the closest border crossing), is normalized to zero. Thus, this specification allows for a more
flexible relationship between distance and the homicides rate before and after the closing and re-opening
of the border in August 2016.
The results for all victims is displayed in Figure 11. As shown, the only positive and statistically sig-
nificant increase in homicides following the re-opening of the border in August 2016 is for municipalities
very close to the border, those within 100 miles. This is consistent with the patterns in Figure 1, which
13
documented strong clustering of migrants very close to the five border crossings between Venezuela and
Colombia. Regarding the magnitude, this represents an increase of approximately 5 homicides per million,
an increase of roughly 25 percent relative to the sample average homicides rate of 20.29.
In the remaining figures, we decompose this effect into homicides for victims of differing nationalities.
When analyzing homicide rates for victims with Colombian nationality, as shown in Figure 12, the effect
for the first border bin is positive but smaller in magnitude, relative to the effect in Figure 11, and is
statistically insignificant. Thus, similarly to our baseline results in Table 1, the documented relationship
between distance to the frontier, the opening of the border, and homicides rate is not driven by Colombian
victims. For Venezuelan victims, by contrast, there is a very sharp increase in homicides close to the
border, representing an increase of roughly 2.5 homicides per million, as shown in Figure 13, and this
result is statistically significant at conventional levels. There are also statistically significant increases in
the next two distance bins, representing municipalities between 100 and 200 miles and between 200 and
300 miles from the nearest border crossing, but these effects are much smaller in magnitude. There is
no such spatial relationship for victims from other countries, as shown in Figure 14. For victims with
missing information on nationality, we document no statistically significant increases in municipalities
very close to the border but larger increases in the next two bins, representing municipalities between 100
and 200 miles and between 200 and 300 miles from the closest border crossing. While lacking formal
evidence on this point, we again conjecture that these might be illegal migrants from Venezuela who lack
documentation and who have moved a bit further inside Colombia.
While our baseline temporal measure is based upon a similar indicator following the re-opening of the
border in August 2016, we next develop an alternative measure based upon the inflation rate in Venezuela.
As noted above, the month-by-month inflation series indicated hyperinflation during this period, peaking
in late 2018 and early 2019. As shown in Table 2, the results are qualitatively similar to those in Table
1, with a statistically significant shift in the relationship between distance and the overall homicides rate
during months with very high inflation rates. That is, there is a relative increase in homicides in Colombian
municipalities close to the frontier with Venezuela and during periods of high inflation, relative to munic-
ipalities further from the frontier and during time periods of lower inflation. As shown in the remaining
columns, there is not a statistically significant relationship for Colombian victims, and these results are
again driven by Venezuelan victims and those victims for whom the police did not report a nationality.
Quantitatively, the evidence with respect to Venezuelan victims is even stronger, with the coefficient of -
1.1396 on the interaction between distance and inflation in column 3, representing 67 percent of the overall
effect of -1.7061 in column 1. Conversely, the coefficient on the interaction between distance and inflation
14

for Colombian victims equals -0.1968, as shown in column 2, representing only 12 percent of the overall
effect in column 1.
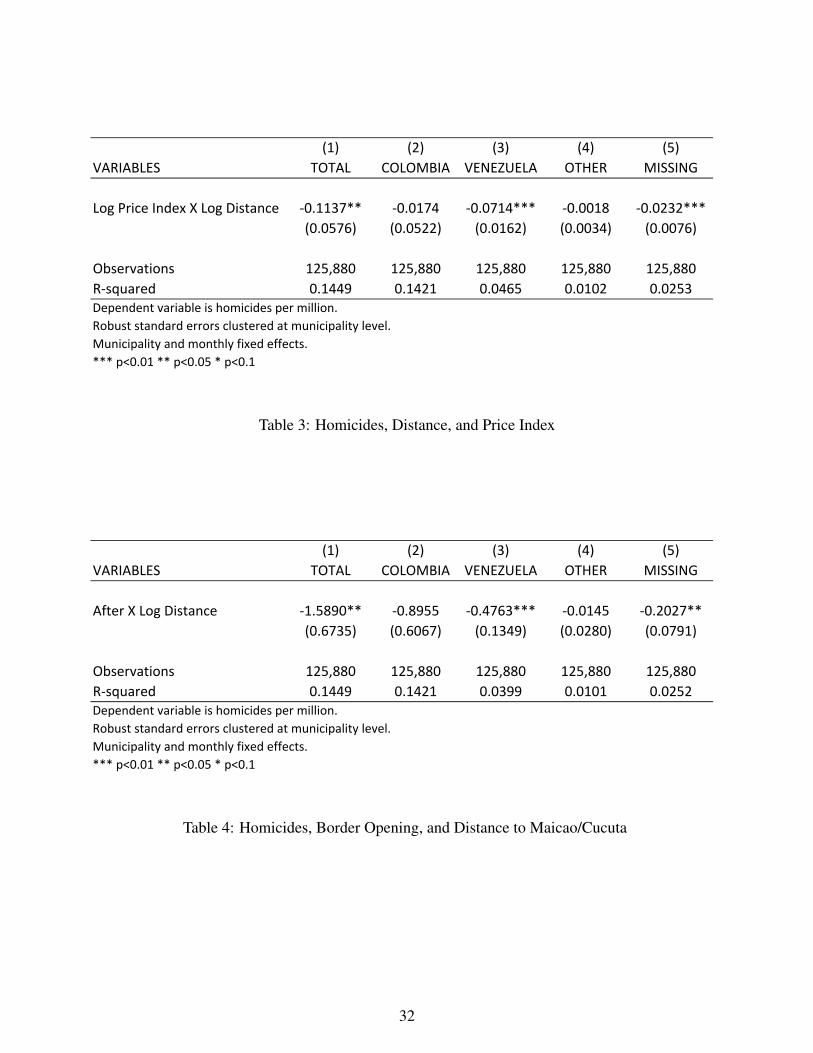
Table 3 presents similar results to those in Table 2 but uses the log of the price level rather than
the inflation rate. This measure might better account for the fact that migrants who tend to arrive from
Venezuela during periods of high inflation might remain in Colombia even after the inflation rates have
fallen back to lower levels, as happened during the middle and end of 2019, as previously shown in Figure
4. As shown in Table 3, the results are similar to those in Tables 1 and 2, with a statistically significant
relationship between the homicide rate and the interaction between distance and the price level, and this
relationship is again driven by homicides involving Venezuelan victims and those with missing nationality
information. There is again no statistically significant evidence of a relationship between homicide rates
for Colombians and the interaction between the price level and distance, and thus the increase in crime
during period with high price levels is driven by homicides against Venezuelans and those with missing
nationality.
We next present results from two robustness checks on our baseline measure of distance to the nearest
of the five border crossings, as described above. The first robustness check accounts for the fact, as
previously documented in Figure 2, that the number of crossings in the official data are driven in large
part by two key border crossings that link important highways in Colombia and Venezuela: Maicao and
Cucuta. As shown in Table 4, our results are similar when defining distance to the border as the minimum
distance to Maicao and Cucuta, with slightly stronger magnitudes in column 1 of Table 4, when compared
to the results in column 1 of Table 1. Regarding the nationality of victims, the results based upon these two
border crossings are again only statistically significant for victims from Venezuela and those victims with
missing information on nationality, with no evidence of a statistically significant increase for homicides
of native Colombians. Thus, our results are robust to this alternative measure and are even a bit stronger,
suggesting that our baseline results are driven by these two most significant border crossings.
Our second robustness check is based upon a measure of travel times, rather than travel distance. This
measure, as noted above, does not account for traffic but does account for speed limits. In particular,
we measure travel time from each municipality to each of the five border crossings and then take the
minimum such time for each municipality across these five crossings. As shown in Table 5, the results are
broadly similar to those in our baseline results in Table 1. The key coefficient in column 1 is a bit smaller in
magnitude but remains statistically significant at the 90 percent level. Regarding the nationality of victims,
the results based upon travel times are again only statistically significant for victims from Venezuela and
those victims with missing information on nationality, and the result is statistically insignificant when
15
considering homicides against native Colombians. Thus, our results are robust to this alternative measure
of the exposure of municipalities to the frontier with Venezuela.
To better understand how these homicide cases are adjudicated by authorities, we next analyze data
on the geographic and temporal pattern of arrests for homicides. These data do not include information
on the nationality of the victim but do include information on the nationality of the individual arrested for
the crime, and there are not missing nationalities in this case. While we cannot directly link these arrests
incidents data to the crime incidents data, we do aggregate them in a similar manner, at the level of the
municipality-month. As shown in Table 6, we find no statistically significant change in the relationship
between distance and arrest rates following the re-opening of the border in August 2016. As shown in
column 3, we do find some evidence of an increase in arrests of Venezuelans close to the border, as should
be expected given the very large increase in their presence close to the border. But there is no increase
in arrests of Colombians or those from other countries, as shown in columns 2 and 4. Taken together,
the results on homicides in Table 1 and the results on arrests for homicides in Table 6 suggest that these
homicides close to the border have occurred without a corresponding increase in arrests, suggesting that
some of these crimes go unsolved.
6 Conclusion
In this paper, we have brought new data and a new setting to a classic question regarding the relationship
between immigration and crime. Our first research question involved the relationship between migra-
tion and crime, and the key finding here is that homicide rates increased in areas close to the border
with Venezuela following the closing and then re-opening of the border in 2016. Thus, immigration of
Venezuelans is associated with an increase in crime rates in the receiving municipalities. Our second re-
search question involves addressing whether this increase in homicide rates is driven by homicides against
immigrants or homicides against native Colombians, as might be expected by those with xenophobic view-
points regarding crime. Using information on the nationality of the victim, we find that the increase in
the homicide rate was driven by homicides involving Venezuelan victims, with no evidence of a statis-
tically significant increase in homicides involving native Colombians. This is consistent with migrants
being victimized and is inconsistent with xenophobic perceptions associated with migrants committing
crimes against natives. Given all of this, it is important, from an academic perspective, to account for the
nationality of victims when analyzing the link between crime and immigration. Using arrests data, we
find no corresponding increase in arrests for homicides in these areas. In summary, our results document
16
an increase in homicides in municipalities close to the border, an effect driven by homicides of migrant
Venezuelans rather than homicides of native Colombians.
17
References
Bianchi, Milo, Paolo Buonanno and Paolo Pinotti. 2012. “Do immigrants cause crime?”
Journal of the European Economic Association 10(6):1318–1347.
Bonilla-Mejia, Leonardo, Leonardo F. Morales, Didier Hermida-Giraldo and Luz Florez.
2020. The Labor Market of Immigrants and Non-Immigrants Evidence from the
Venezuelan Refugee Crisis . Borradores de Economia. 1119 Cetral Bank of Colombia
Cetral Bank of Colombia: .
Butcher, Kristin F and Anne Morrison Piehl. 1998. “Cross-city evidence on the relationship
between immigration and crime.” Journal of Policy Analysis and Management: The
Journal of the Association for Public Policy Analysis and Management 17(3):457–493.
Campante, Filipe R, Emilio Depetris-Chauvin and Ruben Durante. 2020. The Virus of Fear:
The Political Impact of Ebola in the US. Technical report National Bureau of Economic
Research.
Caruso, German, Christian Gomez-Canon and Valerie-Mueller. 2019. “Spillover effects of
the Venezuelan crisis: migration impacts in Colombia.” Oxford Economic Papers .
Chalfin, Aaron. 2014. “What is the contribution of Mexican immigration to US crime rates?
Evidence from rainfall shocks in Mexico.” American Law and Economics Review
16(1):220–268.
Corrales, Javier. 2020. “Democratic backsliding through electoral irregularities: The case of
Venezuela.” European Review of Latin American and Caribbean Studies 109:41–65.
FIP. 2019. Seguridad ciudadana y migración venezolana: Análisis exploratorio. Technical
report Fundación Ideas para la Paz Bogotá, Colombia: .
18

Franco-Mora, Juan Sebastián. 2020. ¿Los sospechosos de siempre? Efectos de la migración
irregular en la criminalidad. Documentos CEDE 2020-8 Universidad de los Andes Bogotá,
Colombia: .
Gaviria, Alejandro. 2000. “Increasing returns and the evolution of violent crime: the case of
Colombia.” Journal of development economics 61(1):1–25.
Hernandez, Igor and Francisco Monaldi. 2016. Weathering Collapse: An Assessment of the
Financial and Operational Situation of the Venezuelan Oil Industry. Technical report
Center for International Development at Harvard University USA: .
Hines, Annie Laurie and Giovanni Peri. 2019. “Immigrants’ deportations, local crime and
police effectiveness.” IZA Discussion Paper .
Idrobo, Nicolás, Daniel Mejía and Ana María Tribin. 2014. “Illegal gold mining and
violence in Colombia.” Peace Economics, Peace Science and Public Policy 20(1):83–111.
Lamont, Michele, Bo Yun Park and Elena Ayala-Hurtado. 2017. “Trump’s Electoral
Speeches and His Appeal to the American White Working Class.” British Journal of
Sociology 68:S153–S180.
Mastrobuoni, Giovanni and Paolo Pinotti. 2015. “Legal status and the criminal activity of
immigrants.” American Economic Journal: Applied Economics 7(2):175–206.
Miles, Thomas J and Adam B Cox. 2014. “Does immigration enforcement reduce crime?
evidence from secure communities.” The Journal of Law and Economics 57(4):937–973.
Nunziata, Luca. 2015. “Immigration and crime: Evidence from victimization data.” Journal
of Population Economics 28(3):697–736.
OECD. 2019. OECD Policy Note on the Venezuelan migration shock in Colombia and its
fiscal implications. Policy note OECD France: .
19

OxFam. 2019. YES, BUT NOT HERE. Perceptions of xenophobia and discrimination
towards Venezuelan migrants in Colombia, Ecuador and Peru. Technical report OxFam
International.
Pinotti, Paolo. 2017. “Clicking on heaven’s door: The effect of immigrant legalization on
crime.” American Economic Review 107(1):138–68.
Piopiunik, Marc and Jens Ruhose. 2017. “Immigration, regional conditions, and crime:
Evidence from an allocation policy in Germany.” European Economic Review 92:258–282.
Prem, Mounu, Andrrs Rivera, Dario Romero and Juan F. Vargas. 2018. “Killing Social
Leaders for Territorial Control: The Unintended Consequences of Peace.” SSRN
Electronic Journal .
Rodriguez-Ortega, Jair David, Daniel Mejia-Londono, Lorena del Pilar Caro-Zambrano,
Romero-Hernandez Mauricio and Franney Campos-Mendez. 2018. “Implications of the
integration process of the administrative records of criminality between the SPOA (Oral
Accusatory Criminal System) of the Attorney General’s Office (FGN) and the SIEDCO
(Statistical, Delinquency, Offenses and Operations Information System) of the National
Police of Colombia (PONAL), and the implementation of the ¡ ADenunciar! app on crime
figures.” Revista Criminalidad 60:9 – 27.
Rozo, Sandra and Juan F. Vargas. 2018. Brothers or Invaders? How Crisis-driven Migrants
Shape Voting Behavior. Working paper LACEA. Documentos de Trabajo LACEA 016836.
Santamaria, Julieth. 2020. Venezuelan Exodus": The Effect Of Mass Migration On Labor
Market Outcomes PhD thesis University of Minnesota Minneapolis MN: .
Spenkuch, Jörg L. 2014. “Understanding the impact of immigration on crime.” American
law and economics review 16(1):177–219.
Tribin-Uribe, Ana M., Andrea Otero, Didier Hermida, Jorge Ramos, Jose Pulido, Leonardo
Bonilla, Leonardo Morales, Ligia Melo, Luz A. Florez, Francisco Lasso, Jorge Tamayo,
Juan C. Castro, Carlos Medina, Juan J. Ospina-Tejeiro, Franz Hamann-Salcedo, Oscar
20

Avila-Montealegre, Juan C. Castro-Fernandez, Anderson Grajales-Olarte, Juan C.
Mendez-Vizcaino, Mario Ramos-Veloza, Alexander Guarin-Lopez, Gaurav Khanna,
Anant Nyshadam and Santiago Velasquez. 2020 forthcoming. ESPE sobre Efectos de la
Migracion desde Venezuela. Revista ESPE - Ensayos sobre Politica Economica. Banco de
la Republica de Colombia. Bogota, Colombia: .
21

050
,000
1000
00To
tal b
orde
r cro
ssin
gs
2012 2013 2014 2015 2016 2017 2018 2019
1 2 3 4 5 6 7 8 9 10 11 12 1 2 3 4 5 6 7 8 9 10 11 12 1 2 3 4 5 6 7 8 9 10 11 12 1 2 3 4 5 6 7 8 9 10 11 12 1 2 3 4 5 6 7 8 9 10 11 12 1 2 3 4 5 6 7 8 9 10 11 12 1 2 3 4 5 6 7 8 9 10 11 12 1 2 3 4 5 6 7 8 9 10 11 12
Official Crossings from Venezuela by Month
Figure 1
020
0000
4000
0060
0000
8000
00To
tal b
orde
r cro
ssin
gs
Arauca Cucuta Maicao Puerto Carreno Puerto Santander
2012
2013
2014
2015
2016
2017
2018
2019
2012
2013
2014
2015
2016
2017
2018
2019
2012
2013
2014
2015
2016
2017
2018
2019
2012
2013
2014
2015
2016
2017
2018
2019
2012
2013
2014
2015
2016
2017
2018
2019
Official Crossings from Venezuela by Year and Entry Point
Figure 2
22

Figure 3: Change in Percent Venezuelan: 2005-2018
23

0.5
11.
52
Infla
tion
Rat
e
2010 2011 2012 2013 2014 2015 2016 2017 2018 2019
1 2 3 4 5 6 7 8 9 10 11 12 1 2 3 4 5 6 7 8 9 10 11 12 1 2 3 4 5 6 7 8 9 10 11 12 1 2 3 4 5 6 7 8 9 10 11 12 1 2 3 4 5 6 7 8 9 10 11 12 1 2 3 4 5 6 7 8 9 10 11 12 1 2 3 4 5 6 7 8 9 10 11 12 1 2 3 4 5 6 7 8 9 10 11 12 1 2 3 4 5 6 7 8 9 10 11 12 1 2 3 4 5 6 7 8 9 10 11 12
Inflation Series from Central Bank of Venezuela
Figure 4
24

Figure 5: Change in Homicides Rate after Border Opening
25

-4-2
02
4
2011
X L
og D
ista
nce
2012
X L
og D
ista
nce
2013
X L
og D
ista
nce
2014
X L
og D
ista
nce
2015
X L
og D
ista
nce
2016
X L
og D
ista
nce
2017
X L
og D
ista
nce
2018
X L
og D
ista
nce
2019
X L
og D
ista
nce
TOTALEffects of Distance from Border by Year
Figure 6
-4-2
02
4
2011
X L
og D
ista
nce
2012
X L
og D
ista
nce
2013
X L
og D
ista
nce
2014
X L
og D
ista
nce
2015
X L
og D
ista
nce
2016
X L
og D
ista
nce
2017
X L
og D
ista
nce
2018
X L
og D
ista
nce
2019
X L
og D
ista
nce
COLOMBIA VICTIMSEffects of Distance from Border by Year
Figure 7
26
-2.5
-2-1
.5-1
-.50
2011
X L
og D
ista
nce
2012
X L
og D
ista
nce
2013
X L
og D
ista
nce
2014
X L
og D
ista
nce
2015
X L
og D
ista
nce
2016
X L
og D
ista
nce
2017
X L
og D
ista
nce
2018
X L
og D
ista
nce
2019
X L
og D
ista
nce
VENEZUELA VICTIMSEffects of Distance from Border by Year
Figure 8
-.2-.1
0.1
2011
X L
og D
ista
nce
2012
X L
og D
ista
nce
2013
X L
og D
ista
nce
2014
X L
og D
ista
nce
2015
X L
og D
ista
nce
2016
X L
og D
ista
nce
2017
X L
og D
ista
nce
2018
X L
og D
ista
nce
2019
X L
og D
ista
nce
OTHER VICTIMSEffects of Distance from Border by Year
Figure 9
27

-.50
.5
2011
X L
og D
ista
nce
2012
X L
og D
ista
nce
2013
X L
og D
ista
nce
2014
X L
og D
ista
nce
2015
X L
og D
ista
nce
2016
X L
og D
ista
nce
2017
X L
og D
ista
nce
2018
X L
og D
ista
nce
2019
X L
og D
ista
nce
MISSING VICTIMSEffects of Distance from Border by Year
Figure 10
-10
-50
510
Afte
r X D
ista
nce
Bin
1
Afte
r X D
ista
nce
Bin
2
Afte
r X D
ista
nce
Bin
3
Afte
r X D
ista
nce
Bin
4
Afte
r X D
ista
nce
Bin
5
Afte
r X D
ista
nce
Bin
6
Afte
r X D
ista
nce
Bin
7
Afte
r X D
ista
nce
Bin
8
TOTALBorder Opening Effects by 100 Mile Distance Bins
Figure 11
28

-10
-50
510
Afte
r X D
ista
nce
Bin
1
Afte
r X D
ista
nce
Bin
2
Afte
r X D
ista
nce
Bin
3
Afte
r X D
ista
nce
Bin
4
Afte
r X D
ista
nce
Bin
5
Afte
r X D
ista
nce
Bin
6
Afte
r X D
ista
nce
Bin
7
Afte
r X D
ista
nce
Bin
8
COLOMBIA VICTIMSBorder Opening Effects by 100 Mile Distance Bins
Figure 12
01
23
4
Afte
r X D
ista
nce
Bin
1
Afte
r X D
ista
nce
Bin
2
Afte
r X D
ista
nce
Bin
3
Afte
r X D
ista
nce
Bin
4
Afte
r X D
ista
nce
Bin
5
Afte
r X D
ista
nce
Bin
6
Afte
r X D
ista
nce
Bin
7
Afte
r X D
ista
nce
Bin
8
VENEZUELA VICTIMSBorder Opening Effects by 100 Mile Distance Bins
Figure 13
29

-.2-.1
0.1
.2.3
Afte
r X D
ista
nce
Bin
1
Afte
r X D
ista
nce
Bin
2
Afte
r X D
ista
nce
Bin
3
Afte
r X D
ista
nce
Bin
4
Afte
r X D
ista
nce
Bin
5
Afte
r X D
ista
nce
Bin
6
Afte
r X D
ista
nce
Bin
7
Afte
r X D
ista
nce
Bin
8
OTHER VICTIMSBorder Opening Effects by 100 Mile Distance Bins
Figure 14
-.50
.51
Afte
r X D
ista
nce
Bin
1
Afte
r X D
ista
nce
Bin
2
Afte
r X D
ista
nce
Bin
3
Afte
r X D
ista
nce
Bin
4
Afte
r X D
ista
nce
Bin
5
Afte
r X D
ista
nce
Bin
6
Afte
r X D
ista
nce
Bin
7
Afte
r X D
ista
nce
Bin
8
MISSING VICTIMSBorder Opening Effects by 100 Mile Distance Bins
Figure 15
30

(1) (2) (3) (4) (5)VARIABLES TOTAL COLOMBIA VENEZUELA OTHER MISSING
After X Log Distance ‐1.3865** ‐0.5213 ‐0.6387*** ‐0.0108 ‐0.2157**(0.6279) (0.5937) (0.1613) (0.0216) (0.0975)
Observations 125,880 125,880 125,880 125,880 125,880R‐squared 0.1449 0.1421 0.0436 0.0101 0.0253Dependent variable is homicides per million.Robust standard errors clustered at municipality level.Municipality and monthly fixed effects.*** p<0.01 ** p<0.05 * p<0.1
Table 1: Homicides, Border Opening, and Distance
(1) (2) (3) (4) (5)VARIABLES TOTAL COLOMBIA VENEZUELA OTHER MISSING
Inflation Rate X Log Distance ‐1.7061** ‐0.1968 ‐1.1396*** 0.0151 ‐0.3848***(0.7368) (0.6441) (0.3696) (0.0104) (0.1209)
Observations 125,880 125,880 125,880 125,880 125,880R‐squared 0.1449 0.1421 0.0467 0.0101 0.0253Dependent variable is homicides per million.Robust standard errors clustered at municipality level.Municipality and monthly fixed effects.*** p<0.01 ** p<0.05 * p<0.1
Table 2: Homicides, Inflation, and Distance
31
(1) (2) (3) (4) (5)VARIABLES TOTAL COLOMBIA VENEZUELA OTHER MISSING
Log Price Index X Log Distance ‐0.1137** ‐0.0174 ‐0.0714*** ‐0.0018 ‐0.0232***(0.0576) (0.0522) (0.0162) (0.0034) (0.0076)
Observations 125,880 125,880 125,880 125,880 125,880R‐squared 0.1449 0.1421 0.0465 0.0102 0.0253Dependent variable is homicides per million.Robust standard errors clustered at municipality level.Municipality and monthly fixed effects.*** p<0.01 ** p<0.05 * p<0.1
Table 3: Homicides, Distance, and Price Index
(1) (2) (3) (4) (5)VARIABLES TOTAL COLOMBIA VENEZUELA OTHER MISSING
After X Log Distance ‐1.5890** ‐0.8955 ‐0.4763*** ‐0.0145 ‐0.2027**(0.6735) (0.6067) (0.1349) (0.0280) (0.0791)
Observations 125,880 125,880 125,880 125,880 125,880R‐squared 0.1449 0.1421 0.0399 0.0101 0.0252Dependent variable is homicides per million.Robust standard errors clustered at municipality level.Municipality and monthly fixed effects.*** p<0.01 ** p<0.05 * p<0.1
Table 4: Homicides, Border Opening, and Distance to Maicao/Cucuta
32

(1) (2) (3) (4) (5)VARIABLES TOTAL COLOMBIA VENEZUELA OTHER MISSING
After X Log Travel Time ‐1.1309* ‐0.2374 ‐0.6666*** ‐0.0098 ‐0.2171**(0.6004) (0.5824) (0.1615) (0.0219) (0.1041)
Observations 125,880 125,880 125,880 125,880 125,880R‐squared 0.1449 0.1421 0.0437 0.0101 0.0253Dependent variable is homicides per million.Robust standard errors clustered at municipality level.Municipality and monthly fixed effects.*** p<0.01 ** p<0.05 * p<0.1
Table 5: Homicides, Travel Time, and Price Index
(1) (2) (3) (4)VARIABLES TOTAL COLOMBIA VENEZUELA OTHER
After X Log Distance ‐0.1262 0.0453 ‐0.1727** 0.0012(0.4726) (0.4192) (0.0805) (0.0017)
Observations 125,880 125,880 125,880 125,880R‐squared 0.0426 0.0426 0.0174 0.0092Dependent variable is homicides per million.Robust standard errors clustered at municipality level.Municipality and monthly fixed effects.*** p<0.01 ** p<0.05 * p<0.1
Table 6: Homicides Arrests, Distance, and Inflation
33