immigrant visas issued and adjustments of status … · region total for asia 6,049 7,719 8,838...
TRANSCRIPT

Foreign State 1st
2A
Exempt
2A
Subject 2A Total 2B 3rd 4th Family Pref. Total
Africa
Algeria 4 18 10 28 2 6 10 50
Angola 13 4 3 7 2 1 0 23
Benin 0 1 6 7 0 0 0 7
Botswana 0 1 0 1 0 0 0 1
Burkina Faso 1 10 3 13 0 0 0 14
Burundi 0 2 1 3 0 0 0 3
Cameroon 7 39 113 152 3 3 11 176
Cape Verde 195 127 131 258 199 18 76 746
Central African Republic 0 2 1 3 0 0 0 3
Chad 0 13 0 13 0 0 0 13
Comoros 0 0 0 0 0 0 0 0
Congo, Rep. of the 1 0 7 7 0 0 0 8
Congo, Dem. Rep. of the 11 64 30 94 0 1 4 110
Cote d'Ivoire 18 23 42 65 8 0 11 102
Djibouti 2 0 0 0 0 0 0 2
Egypt 50 15 303 318 25 89 298 780
Equatorial Guinea 0 0 0 0 0 0 0 0
Eritrea 12 38 41 79 0 0 8 99
Ethiopia 66 25 959 984 59 19 46 1,174
Gabon 0 1 3 4 0 0 0 4
Gambia, The 4 10 26 36 0 0 14 54
Ghana 228 258 211 469 29 43 105 874
Guinea 2 37 77 114 1 0 5 122
Guinea-Bissau 0 0 1 1 0 0 0 1
Kenya 40 74 79 153 3 17 60 273
Lesotho 0 0 0 0 0 0 0 0
Liberia 120 113 128 241 8 10 13 392
Libya 2 5 6 11 0 5 6 24
Madagascar 0 0 0 0 0 1 0 1
Malawi 0 1 1 2 0 0 2 4
Mali 2 11 31 42 0 0 0 44
Mauritania 1 7 27 34 1 0 0 36
Mauritius 0 0 0 0 0 0 0 0
Morocco 11 111 97 208 8 10 72 309
Mozambique 0 1 0 1 0 0 5 6
Namibia 0 0 0 0 0 0 0 0
Niger 1 2 8 10 1 0 0 12
Nigeria 367 79 567 646 52 122 611 1,798
Rwanda 1 4 3 7 0 0 0 8
Sao Tome and Principe 1 0 0 0 0 0 1 2
Senegal 13 42 82 124 5 1 3 146
Seychelles 0 0 0 0 0 0 0 0
Family Preferences
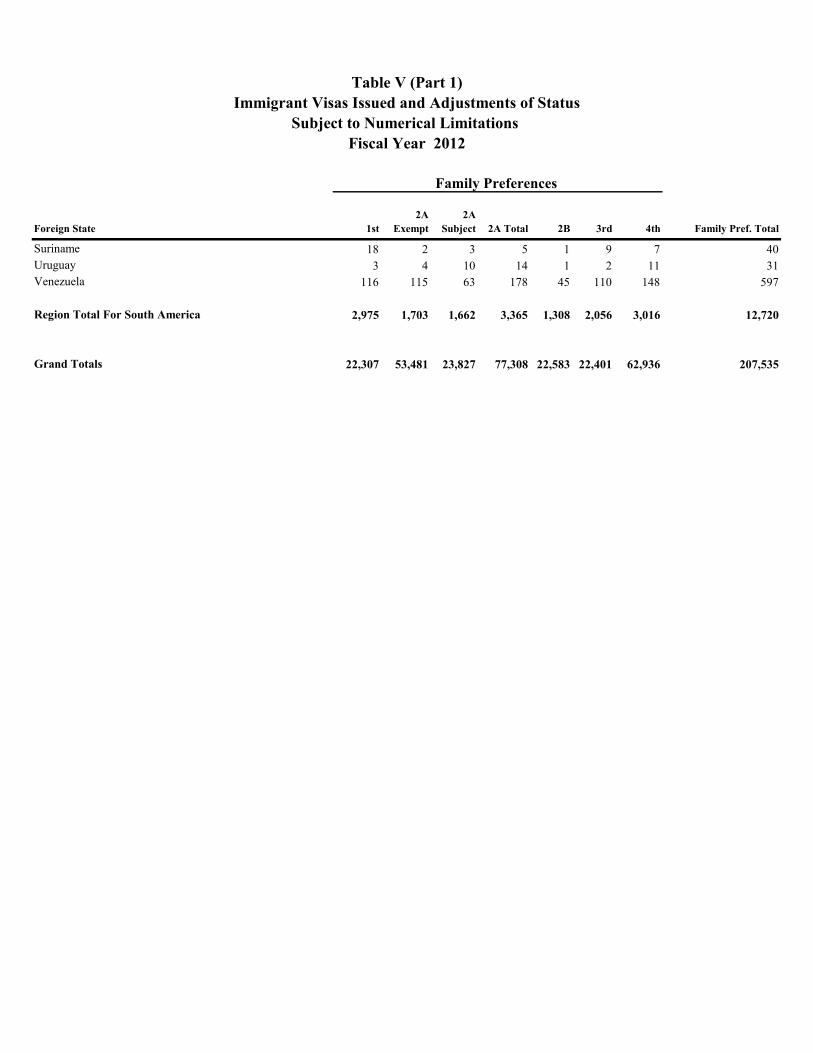
Table V (Part 1)
Immigrant Visas Issued and Adjustments of Status
Subject to Numerical Limitations
Fiscal Year 2012

Foreign State 1st
2A
Exempt
2A
Subject 2A Total 2B 3rd 4th Family Pref. Total
Family Preferences
Table V (Part 1)
Immigrant Visas Issued and Adjustments of Status
Subject to Numerical Limitations
Fiscal Year 2012
Sierra Leone 45 12 66 78 12 24 27 186
Somalia 5 23 76 99 0 4 1 109
South Africa 16 7 3 10 0 15 28 69
South Sudan 0 0 0 0 0 0 0 0
Sudan 5 6 55 61 1 6 6 79
Swaziland 2 0 0 0 0 0 1 3
Tanzania 0 14 4 18 1 7 20 46
Togo 6 79 24 103 0 0 6 115
Tunisia 3 2 5 7 0 0 1 11
Uganda 7 27 28 55 5 3 9 79
Zambia 4 0 10 10 0 1 7 22
Zimbabwe 4 11 5 16 0 0 12 32
Region Total For Africa 1,270 1,319 3,273 4,592 425 406 1,479 8,172
Asia
Afghanistan 13 19 88 107 1 36 49 206
Bahrain 1 1 0 1 1 0 8 11
Bangladesh 98 891 669 1,560 74 238 5,974 7,944
Bhutan 0 0 0 0 0 0 0 0
Brunei 0 1 0 1 0 0 0 1
Burma 31 18 33 51 9 49 307 447
Cambodia 61 96 53 149 6 43 85 344
China - mainland born 985 1,629 1,357 2,986 611 1,634 11,623 17,839
- Taiwan born 96 34 15 49 33 127 925 1,230
- PRC nationals adjusting under CSPA 0 0 0 0 0 0 0 0
Hong Kong S.A.R 75 32 20 52 47 111 661 946
India 273 636 805 1,441 124 1,699 8,612 12,149
Indonesia 22 21 30 51 6 28 175 282
Iran 307 75 221 296 107 514 1,470 2,694
Iraq 32 42 16 58 6 76 122 294
Israel 26 20 8 28 1 79 41 175
Japan 7 26 28 54 5 16 17 99
Jordan 64 233 98 331 47 396 544 1,382
Korea, North 1 0 1 1 0 0 4 6
Korea, South 186 67 90 157 51 350 639 1,383
Kuwait 14 25 11 36 19 40 88 197
Laos 15 11 5 16 0 13 34 78
Lebanon 86 76 42 118 36 196 404 840
Malaysia 15 15 5 20 5 15 119 174
Maldives 0 0 0 0 0 0 0 0
Mongolia 0 0 11 11 0 0 0 11
Nepal 5 74 129 203 5 5 47 265
Oman 3 0 0 0 0 1 2 6

Foreign State 1st
2A
Exempt
2A
Subject 2A Total 2B 3rd 4th Family Pref. Total
Family Preferences
Table V (Part 1)
Immigrant Visas Issued and Adjustments of Status
Subject to Numerical Limitations
Fiscal Year 2012
Pakistan 145 199 1,065 1,264 87 664 2,721 4,881
Philippines 1,616 1,898 2,696 4,594 4,603 1,473 4,441 16,727
Qatar 2 2 0 2 0 0 1 5
Saudi Arabia 13 30 25 55 5 13 47 133
Singapore 0 1 2 3 3 7 24 37
Sri Lanka 15 21 17 38 1 27 93 174
Syria 48 53 36 89 29 239 547 952
Thailand 63 69 22 91 5 43 121 323
Timor-Leste 0 0 0 0 0 0 0 0
United Arab Emirates 9 21 12 33 0 49 77 168
Vietnam 1,682 1,187 1,008 2,195 274 4,789 6,619 15,559
Yemen 40 196 220 416 6 296 31 789
Region Total For Asia 6,049 7,719 8,838 16,557 6,207 13,266 46,672 88,751
Europe
Albania 31 65 46 111 3 56 67 268
Andorra 0 0 0 0 0 0 0 0
Armenia 17 5 46 51 3 41 14 126
Austria 2 3 0 3 0 0 0 5
Azerbaijan 14 1 4 5 2 20 30 71
Belarus 10 16 13 29 3 18 15 75
Belgium 2 1 2 3 0 3 11 19
Bosnia and Herzegovina 8 1 8 9 0 5 2 24
Bulgaria 34 9 11 20 5 18 9 86
Croatia 4 0 0 0 1 0 2 7
Cyprus 1 0 3 3 0 0 4 8
Czech Republic 8 2 5 7 4 1 2 22
Denmark 0 1 0 1 2 4 0 7
Faroe Islands 0 0 0 0 0 0 0 0
Greenland 0 0 0 0 0 0 0 0
TOTAL 0 1 0 1 2 4 0 7
Estonia 2 1 1 2 0 0 0 4
Finland 0 2 0 2 0 3 3 8
France 15 22 18 40 9 29 35 128
French Guiana 0 0 0 0 0 0 0 0
French Polynesia 0 0 0 0 0 1 0 1
French Southern and Antarctic Lands 0 0 0 0 0 0 0 0
Guadeloupe 0 0 0 0 0 0 0 0
Martinique 0 0 0 0 0 0 0 0
Mayotte 0 0 0 0 0 0 0 0
New Caledonia 0 0 0 0 0 0 0 0
Reunion 0 0 0 0 0 0 0 0
Saint Barthelemy 0 0 0 0 0 0 1 1

Foreign State 1st
2A
Exempt
2A
Subject 2A Total 2B 3rd 4th Family Pref. Total
Family Preferences
Table V (Part 1)
Immigrant Visas Issued and Adjustments of Status
Subject to Numerical Limitations
Fiscal Year 2012
Saint Martin 1 1 0 1 0 0 1 3
St. Pierre and Miquelon 0 0 0 0 0 0 0 0
Wallis and Futuna 0 0 0 0 0 0 0 0
TOTAL 16 23 18 41 9 30 37 133
Georgia 4 3 31 34 0 3 0 41
Germany 31 21 10 31 2 45 48 157
Great Britain and Northern Ireland 86 72 30 102 20 113 167 488
Anguilla 1 0 0 0 0 0 3 4
Bermuda 5 1 1 2 0 0 0 7
British Indian Ocean Territory 0 0 0 0 0 0 0 0
British Virgin Islands 3 2 0 2 1 1 3 10
Cayman Islands 5 0 2 2 0 2 1 10
Falkland Islands 0 0 0 0 0 0 0 0
Gibraltar 0 0 0 0 0 0 0 0
Montserrat 0 0 0 0 0 0 0 0
Pitcairn 0 0 0 0 0 0 0 0
St. Helena 0 0 0 0 0 0 0 0
South Georgia and the South Sandwich Islands 0 0 0 0 0 0 0 0
Turks and Caicos Islands 0 0 1 1 1 0 0 2
TOTAL 100 75 34 109 22 116 174 521
Greece 4 2 0 2 1 6 11 24
Hungary 16 4 4 8 1 12 5 42
Iceland 0 0 1 1 0 0 0 1
Ireland 5 9 1 10 1 6 9 31
Italy 12 15 12 27 6 17 42 104
Kazakhstan 5 8 9 17 1 7 4 34
Kosovo 4 19 27 46 5 6 13 74
Kyrgyzstan 3 4 5 9 0 1 0 13
Latvia 3 3 7 10 0 8 1 22
Liechtenstein 0 0 0 0 0 0 0 0
Lithuania 10 8 5 13 0 11 10 44
Luxembourg 0 0 0 0 0 0 0 0
Macedonia 9 19 25 44 4 13 100 170
Malta 0 0 1 1 0 0 1 2
Moldova 9 13 7 20 1 9 16 55
Monaco 0 0 0 0 0 0 0 0
Montenegro 7 6 1 7 2 6 11 33
Netherlands 2 4 0 4 1 0 4 11
Aruba 1 1 0 1 0 3 1 6
Curacao 0 0 0 0 0 3 3 6
Netherlands Antilles 0 0 0 0 0 0 0 0
Sint Maarten 5 3 0 3 2 0 0 10
TOTAL 8 8 0 8 3 6 8 33
Norway 0 2 0 2 0 2 3 7
Svalbard 0 0 0 0 0 0 0 0

Foreign State 1st
2A
Exempt
2A
Subject 2A Total 2B 3rd 4th Family Pref. Total
Family Preferences
Table V (Part 1)
Immigrant Visas Issued and Adjustments of Status
Subject to Numerical Limitations
Fiscal Year 2012
TOTAL 0 2 0 2 0 2 3 7
Poland 129 85 42 127 35 312 429 1,032
Portugal 8 12 5 17 11 5 22 63
Macau 3 5 3 8 7 2 37 57
TOTAL 11 17 8 25 18 7 59 120
Romania 39 34 18 52 3 83 75 252
Russia 104 65 70 135 5 68 60 372
San Marino 0 0 0 0 0 0 0 0
Serbia 8 7 2 9 3 10 23 53
Slovakia 3 0 5 5 1 12 10 31
Slovenia 0 1 0 1 0 0 0 1
Spain 16 16 4 20 10 10 21 77
Western Sahara 0 0 0 0 0 0 0 0
TOTAL 16 16 4 20 10 10 21 77
Sweden 3 6 2 8 2 4 6 23
Switzerland 2 4 0 4 1 4 3 14
Tajikistan 2 1 2 3 0 12 1 18
Turkey 17 14 30 44 1 7 67 136
Turkmenistan 1 1 4 5 0 0 1 7
Ukraine 84 111 78 189 10 84 92 459
Uzbekistan 10 37 78 115 1 42 15 183
Vatican City 0 0 0 0 0 0 0 0
Region Total For Europe 808 748 680 1,428 171 1,128 1,514 5,049
North America
Antigua and Barbuda 45 13 8 21 9 8 29 112
Bahamas, The 16 11 7 18 6 10 8 58
Barbados 43 10 2 12 7 15 9 86
Belize 94 9 4 13 9 70 51 237
Canada 92 89 38 127 13 157 194 583
Costa Rica 21 30 6 36 4 17 15 93
Cuba 47 272 1,036 1,308 10 46 17 1,428
Dominica 59 18 17 35 19 35 21 169
Dominican Republic 2,343 4,087 4,096 8,183 7,582 586 1,339 20,033
El Salvador 881 618 1,813 2,431 1,278 492 737 5,819
Grenada 55 16 5 21 7 30 31 144
Guatemala 392 1,096 429 1,525 434 242 322 2,915
Haiti 1,444 2,977 558 3,535 2,035 518 1,024 8,556
Honduras 420 473 206 679 292 275 266 1,932
Jamaica 2,717 335 958 1,293 449 820 771 6,050
Mexico 1,733 31,589 0 31,589 2,076 1,802 4,775 41,975
Nicaragua 214 179 102 281 121 47 38 701
Panama 73 23 11 34 22 26 68 223

Foreign State 1st
2A
Exempt
2A
Subject 2A Total 2B 3rd 4th Family Pref. Total
Family Preferences
Table V (Part 1)
Immigrant Visas Issued and Adjustments of Status
Subject to Numerical Limitations
Fiscal Year 2012
Saint Kitts and Nevis 72 14 3 17 10 25 14 138
Saint Lucia 74 15 16 31 15 20 36 176
Saint Vincent and the Grenadines 34 10 6 16 3 10 32 95
Trinidad and Tobago 301 77 45 122 60 193 269 945
Region Total For North America 11,170 41,961 9,366 51,327 14,461 5,444 10,066 92,468
Oceania
Australia 3 7 0 7 0 2 23 35
Christmas Island 0 0 0 0 0 0 0 0
Cocos (Keeling) Islands 0 0 0 0 0 0 0 0
Norfolk Island 0 0 0 0 0 0 0 0
TOTAL 3 7 0 7 0 2 23 35
Fiji 25 13 6 19 6 81 144 275
Kiribati 0 0 0 0 0 0 0 0
Marshall Islands 0 0 0 0 0 0 0 0
Micronesia, Federated States of 0 0 0 0 0 0 0 0
Nauru 0 0 0 0 0 0 0 0
New Zealand 1 1 2 3 0 5 3 12
Cook Islands 0 0 0 0 0 0 0 0
Niue 0 0 0 0 0 0 0 0
Tokelau 0 0 0 0 0 0 0 0
TOTAL 1 1 2 3 0 5 3 12
Palau 0 1 0 1 0 0 0 1
Papua New Guinea 0 1 0 1 0 0 0 1
Samoa 1 2 0 2 1 2 6 12
Solomon Islands 0 0 0 0 0 0 0 0
Tonga 5 5 0 5 4 11 13 38
Tuvalu 0 0 0 0 0 0 0 0
Vanuatu 0 1 0 1 0 0 0 1
Region Total For Oceania 35 31 8 39 11 101 189 375
South America
Argentina 34 36 11 47 6 53 48 188
Bolivia 40 33 28 61 11 38 80 230
Brazil 89 68 49 117 10 28 97 341
Chile 24 12 11 23 6 17 33 103
Colombia 637 302 478 780 363 442 920 3,142
Ecuador 343 457 416 873 376 380 595 2,567
Guyana 1,156 242 248 490 119 719 529 3,013
Paraguay 8 3 1 4 3 0 5 20
Peru 507 429 344 773 367 258 543 2,448
Foreign State 1st
2A
Exempt
2A
Subject 2A Total 2B 3rd 4th Family Pref. Total
Family Preferences
Table V (Part 1)
Immigrant Visas Issued and Adjustments of Status
Subject to Numerical Limitations
Fiscal Year 2012
Suriname 18 2 3 5 1 9 7 40
Uruguay 3 4 10 14 1 2 11 31
Venezuela 116 115 63 178 45 110 148 597
Region Total For South America 2,975 1,703 1,662 3,365 1,308 2,056 3,016 12,720
Grand Totals 22,307 53,481 23,827 77,308 22,583 22,401 62,936 207,535

Foreign State 1st 2nd 3rd
3rd Other
Workers 3rd Total 4th
4th Certain
Religious
Workers 4th Total
Africa
Algeria 15 15 8 0 8 12 0 12
Angola 1 3 1 0 1 0 0 0
Benin 1 3 0 0 0 3 0 3
Botswana 2 7 10 0 10 0 0 0
Burkina Faso 4 4 0 0 0 3 0 3
Burundi 0 4 0 0 0 1 1 2
Cameroon 9 47 22 1 23 11 4 15
Cape Verde 0 2 1 2 3 6 0 6
Central African Republic 0 0 0 0 0 0 0 0
Chad 0 1 0 0 0 0 0 0
Comoros 0 0 0 0 0 0 0 0
Congo, Rep. of the 2 0 2 0 2 1 0 1
Congo, Dem. Rep. of the 9 1 9 1 10 9 0 9
Cote d'Ivoire 3 14 13 0 13 34 0 34
Djibouti 0 0 0 0 0 0 0 0
Egypt 90 216 154 6 160 110 10 120
Equatorial Guinea 0 0 1 0 1 0 0 0
Eritrea 5 3 7 0 7 27 1 28
Ethiopia 25 50 26 1 27 57 8 65
Gabon 2 0 1 0 1 1 0 1
Gambia, The 0 3 8 0 8 22 0 22
Ghana 30 102 89 4 93 58 15 73
Guinea 2 4 1 0 1 29 0 29
Guinea-Bissau 0 0 0 0 0 1 0 1
Kenya 43 161 156 4 160 56 20 76
Lesotho 0 0 0 0 0 0 0 0
Liberia 4 2 13 0 13 20 4 24
Libya 10 28 5 0 5 1 0 1
Madagascar 1 6 5 1 6 12 1 13
Malawi 4 6 10 0 10 13 0 13
Mali 0 2 2 2 4 24 0 24
Mauritania 1 5 0 0 0 2 0 2
Mauritius 5 18 2 1 3 1 0 1
Morocco 24 36 26 8 34 28 5 33
Mozambique 3 8 2 0 2 0 1 1
Namibia 0 2 2 0 2 0 1 1
Niger 4 8 0 0 0 2 0 2
Nigeria 78 302 204 6 210 136 40 176
Rwanda 2 4 1 0 1 5 0 5
Sao Tome and Principe 0 0 0 0 0 0 0 0
Senegal 11 16 17 0 17 21 0 21
Seychelles 1 0 0 0 0 0 0 0
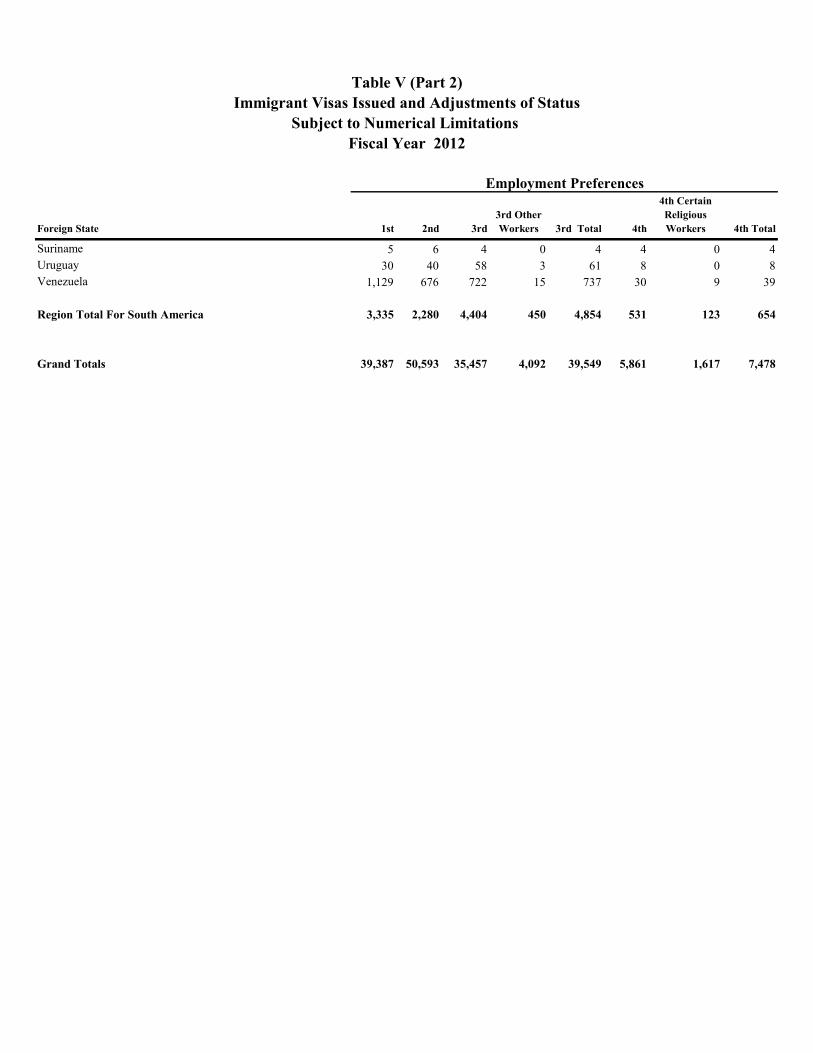
Employment Preferences
Immigrant Visas Issued and Adjustments of Status
Table V (Part 2)
Subject to Numerical Limitations
Fiscal Year 2012

Foreign State 1st 2nd 3rd
3rd Other
Workers 3rd Total 4th
4th Certain
Religious
Workers 4th Total
Employment Preferences
Immigrant Visas Issued and Adjustments of Status
Table V (Part 2)
Subject to Numerical Limitations
Fiscal Year 2012
Sierra Leone 1 5 16 1 17 15 0 15
Somalia 3 9 2 0 2 3 0 3
South Africa 458 140 401 9 410 32 21 53
South Sudan 0 0 0 0 0 0 0 0
Sudan 10 4 6 0 6 4 0 4
Swaziland 1 0 2 0 2 1 0 1
Tanzania 12 36 41 1 42 20 10 30
Togo 0 9 0 2 2 4 1 5
Tunisia 14 14 7 0 7 6 0 6
Uganda 17 23 15 0 15 20 0 20
Zambia 12 47 38 0 38 3 2 5
Zimbabwe 31 48 49 0 49 18 2 20
Region Total For Africa 950 1,418 1,375 50 1,425 832 147 979
Asia
Afghanistan 7 9 2 0 2 12 0 12
Bahrain 3 18 11 0 11 3 0 3
Bangladesh 42 216 243 14 257 52 0 52
Bhutan 0 2 2 0 2 0 1 1
Brunei 5 3 5 0 5 0 0 0
Burma 3 26 18 10 28 33 2 35
Cambodia 7 9 6 1 7 19 5 24
China - mainland born 6,183 5,858 2,426 401 2,827 91 26 117
- Taiwan born 221 1,022 489 1 490 32 20 52
- PRC nationals adjusting under CSPA 0 0 1 0 1 0 0 0
Hong Kong S.A.R 87 181 211 8 219 18 3 21
India 9,506 19,726 2,758 46 2,804 472 128 600
Indonesia 42 168 251 4 255 28 11 39
Iran 180 390 260 28 288 10 2 12
Iraq 11 20 54 0 54 7 3 10
Israel 620 339 315 18 333 34 178 212
Japan 670 640 679 13 692 30 34 64
Jordan 28 92 64 0 64 33 0 33
Korea, North 11 20 7 0 7 2 1 3
Korea, South 1,540 4,129 3,684 1,291 4,975 467 275 742
Kuwait 17 112 59 3 62 4 1 5
Laos 4 2 0 2 2 18 3 21
Lebanon 40 171 151 1 152 14 8 22
Malaysia 132 213 273 0 273 8 4 12
Maldives 0 0 1 0 1 0 0 0
Mongolia 6 59 40 2 42 3 1 4
Nepal 79 553 229 28 257 29 8 37
Oman 10 23 2 0 2 0 0 0

Foreign State 1st 2nd 3rd
3rd Other
Workers 3rd Total 4th
4th Certain
Religious
Workers 4th Total
Employment Preferences
Immigrant Visas Issued and Adjustments of Status
Table V (Part 2)
Subject to Numerical Limitations
Fiscal Year 2012
Pakistan 147 927 1,040 50 1,090 56 2 58
Philippines 266 2,408 5,875 604 6,479 245 105 350
Qatar 5 10 13 0 13 0 0 0
Saudi Arabia 30 82 78 1 79 6 0 6
Singapore 122 145 109 0 109 4 5 9
Sri Lanka 48 200 197 9 206 46 5 51
Syria 12 98 96 0 96 42 3 45
Thailand 44 131 165 3 168 47 9 56
Timor-Leste 1 0 0 0 0 0 0 0
United Arab Emirates 28 148 60 2 62 3 1 4
Vietnam 38 89 66 2 68 82 39 121
Yemen 0 8 8 0 8 20 1 21
Region Total For Asia 20,195 38,247 19,948 2,542 22,490 1,970 884 2,854
Europe
Albania 0 28 35 1 36 5 1 6
Andorra 1 0 0 0 0 0 0 0
Armenia 28 61 48 0 48 2 2 4
Austria 75 36 18 1 19 7 2 9
Azerbaijan 2 31 9 0 9 2 1 3
Belarus 32 79 21 1 22 3 2 5
Belgium 148 55 32 1 33 6 3 9
Bosnia and Herzegovina 8 9 23 0 23 11 0 11
Bulgaria 42 145 119 3 122 3 0 3
Croatia 24 30 6 0 6 2 0 2
Cyprus 12 9 5 0 5 0 0 0
Czech Republic 40 51 48 5 53 2 0 2
Denmark 149 54 15 1 16 4 2 6
Faroe Islands 0 0 0 0 0 0 0 0
Greenland 0 0 0 0 0 0 0 0
TOTAL 149 54 15 1 16 4 2 6
Estonia 7 5 14 1 15 0 0 0
Finland 94 30 14 0 14 3 0 3
France 973 425 173 0 173 38 18 56
French Guiana 0 0 0 0 0 0 0 0
French Polynesia 0 0 0 0 0 1 0 1
French Southern and Antarctic Lands 0 0 0 0 0 0 0 0
Guadeloupe 0 0 0 0 0 0 0 0
Martinique 0 0 0 0 0 0 0 0
Mayotte 0 0 1 0 1 0 0 0
New Caledonia 0 0 0 0 0 1 0 1
Reunion 0 0 0 0 0 0 0 0
Saint Barthelemy 0 0 0 0 0 1 0 1

Foreign State 1st 2nd 3rd
3rd Other
Workers 3rd Total 4th
4th Certain
Religious
Workers 4th Total
Employment Preferences
Immigrant Visas Issued and Adjustments of Status
Table V (Part 2)
Subject to Numerical Limitations
Fiscal Year 2012
Saint Martin 1 0 1 0 1 1 0 1
St. Pierre and Miquelon 0 0 0 0 0 0 0 0
Wallis and Futuna 0 0 0 0 0 0 0 0
TOTAL 974 425 175 0 175 42 18 60
Georgia 19 42 13 0 13 7 0 7
Germany 934 508 234 7 241 28 23 51
Great Britain and Northern Ireland 3,427 849 818 5 823 67 36 103
Anguilla 0 1 0 0 0 0 0 0
Bermuda 11 5 3 0 3 0 0 0
British Indian Ocean Territory 0 0 0 0 0 0 0 0
British Virgin Islands 0 0 0 0 0 0 0 0
Cayman Islands 3 0 0 0 0 0 0 0
Falkland Islands 0 0 0 0 0 0 0 0
Gibraltar 1 0 0 0 0 0 0 0
Montserrat 0 3 2 0 2 0 0 0
Pitcairn 0 0 0 0 0 0 0 0
St. Helena 0 0 0 0 0 0 0 0
South Georgia and the South Sandwich Islands 0 0 0 0 0 0 0 0
Turks and Caicos Islands 0 0 0 0 0 2 0 2
TOTAL 3,442 858 823 5 828 69 36 105
Greece 71 87 18 3 21 10 4 14
Hungary 65 64 47 2 49 3 7 10
Iceland 30 20 2 0 2 0 0 0
Ireland 324 71 85 2 87 4 3 7
Italy 445 234 123 1 124 8 27 35
Kazakhstan 27 39 16 3 19 3 0 3
Kosovo 3 1 0 0 0 3 0 3
Kyrgyzstan 5 16 7 1 8 2 1 3
Latvia 6 16 15 1 16 0 0 0
Liechtenstein 0 0 1 0 1 0 0 0
Lithuania 16 25 49 1 50 2 0 2
Luxembourg 1 4 0 0 0 0 1 1
Macedonia 7 8 23 0 23 11 2 13
Malta 3 4 2 0 2 1 0 1
Moldova 10 36 22 0 22 5 3 8
Monaco 0 2 0 0 0 0 0 0
Montenegro 2 1 3 0 3 1 0 1
Netherlands 332 84 46 1 47 10 6 16
Aruba 13 4 2 0 2 2 0 2
Curacao 2 6 3 0 3 0 0 0
Netherlands Antilles 0 0 0 0 0 0 0 0
Sint Maarten 0 0 0 0 0 0 0 0
TOTAL 347 94 51 1 52 12 6 18
Norway 37 25 10 0 10 0 3 3
Svalbard 0 0 0 0 0 0 0 0

Foreign State 1st 2nd 3rd
3rd Other
Workers 3rd Total 4th
4th Certain
Religious
Workers 4th Total
Employment Preferences
Immigrant Visas Issued and Adjustments of Status
Table V (Part 2)
Subject to Numerical Limitations
Fiscal Year 2012
TOTAL 37 25 10 0 10 0 3 3
Poland 126 211 593 102 695 39 27 66
Portugal 74 31 50 10 60 3 7 10
Macau 2 3 9 0 9 1 0 1
TOTAL 76 34 59 10 69 4 7 11
Romania 110 231 236 14 250 15 14 29
Russia 371 597 213 8 221 44 9 53
San Marino 0 0 0 0 0 0 0 0
Serbia 49 84 41 2 43 5 0 5
Slovakia 31 25 69 5 74 1 1 2
Slovenia 8 10 5 0 5 0 0 0
Spain 391 156 72 2 74 6 9 15
Western Sahara 0 0 0 0 0 0 0 0
TOTAL 391 156 72 2 74 6 9 15
Sweden 249 64 42 0 42 2 3 5
Switzerland 154 68 28 2 30 6 6 12
Tajikistan 3 3 5 0 5 5 0 5
Turkey 178 600 266 18 284 25 3 28
Turkmenistan 3 5 0 0 0 2 0 2
Ukraine 153 272 163 18 181 18 9 27
Uzbekistan 27 32 31 4 35 7 5 12
Vatican City 0 0 0 0 0 0 0 0
Region Total For Europe 9,359 5,595 3,949 226 4,175 440 240 680
North America
Antigua and Barbuda 1 3 7 0 7 1 4 5
Bahamas, The 6 13 11 2 13 5 0 5
Barbados 4 11 30 1 31 2 1 3
Belize 1 7 12 0 12 14 0 14
Canada 2,428 1,595 1,235 10 1,245 92 48 140
Costa Rica 44 37 75 6 81 7 4 11
Cuba 12 1 0 0 0 0 0 0
Dominica 2 6 16 0 16 2 0 2
Dominican Republic 69 62 88 4 92 108 18 126
El Salvador 26 24 218 52 270 265 4 269
Grenada 0 3 7 7 14 1 0 1
Guatemala 54 39 194 37 231 325 11 336
Haiti 6 4 18 1 19 94 5 99
Honduras 27 25 120 17 137 228 3 231
Jamaica 34 99 306 33 339 78 11 89
Mexico 2,054 823 3,125 623 3,748 791 90 881
Nicaragua 6 5 11 2 13 11 2 13
Panama 12 19 33 6 39 8 0 8

Foreign State 1st 2nd 3rd
3rd Other
Workers 3rd Total 4th
4th Certain
Religious
Workers 4th Total
Employment Preferences
Immigrant Visas Issued and Adjustments of Status
Table V (Part 2)
Subject to Numerical Limitations
Fiscal Year 2012
Saint Kitts and Nevis 1 2 1 0 1 1 1 2
Saint Lucia 3 6 16 2 18 1 2 3
Saint Vincent and the Grenadines 5 7 2 0 2 2 0 2
Trinidad and Tobago 70 67 141 14 155 16 6 22
Region Total For North America 4,865 2,858 5,666 817 6,483 2,052 210 2,262
Oceania
Australia 562 135 73 2 75 12 7 19
Christmas Island 0 0 0 0 0 0 0 0
Cocos (Keeling) Islands 0 0 0 0 0 0 0 0
Norfolk Island 0 0 0 0 0 0 0 0
TOTAL 562 135 73 2 75 12 7 19
Fiji 2 3 6 2 8 9 0 9
Kiribati 0 0 0 0 0 0 0 0
Marshall Islands 0 0 0 0 0 1 0 1
Micronesia, Federated States of 0 5 0 0 0 0 0 0
Nauru 0 1 0 0 0 0 0 0
New Zealand 116 49 35 3 38 11 6 17
Cook Islands 0 0 0 0 0 0 0 0
Niue 0 0 0 0 0 0 0 0
Tokelau 0 0 0 0 0 0 0 0
TOTAL 116 49 35 3 38 11 6 17
Palau 0 0 0 0 0 0 0 0
Papua New Guinea 3 0 1 0 1 0 0 0
Samoa 0 0 0 0 0 1 0 1
Solomon Islands 0 2 0 0 0 0 0 0
Tonga 0 0 0 0 0 2 0 2
Tuvalu 0 0 0 0 0 0 0 0
Vanuatu 0 0 0 0 0 0 0 0
0
Region Total For Oceania 683 195 115 7 122 36 13 49
South America
Argentina 449 279 417 10 427 27 27 54
Bolivia 25 37 156 36 192 31 7 38
Brazil 933 462 928 117 1,045 135 31 166
Chile 97 94 92 4 96 25 8 33
Colombia 456 414 885 67 952 124 21 145
Ecuador 64 71 568 76 644 84 2 86
Guyana 13 13 79 8 87 10 1 11
Paraguay 15 13 22 1 23 3 7 10
Peru 119 175 473 113 586 50 10 60
Foreign State 1st 2nd 3rd
3rd Other
Workers 3rd Total 4th
4th Certain
Religious
Workers 4th Total
Employment Preferences
Immigrant Visas Issued and Adjustments of Status
Table V (Part 2)
Subject to Numerical Limitations
Fiscal Year 2012
Suriname 5 6 4 0 4 4 0 4
Uruguay 30 40 58 3 61 8 0 8
Venezuela 1,129 676 722 15 737 30 9 39
Region Total For South America 3,335 2,280 4,404 450 4,854 531 123 654
Grand Totals 39,387 50,593 35,457 4,092 39,549 5,861 1,617 7,478

Foreign State
5th
Employ.
Creation
5th Target
Employ.
Areas
5th
Regional
Pilot
Program
5th
Regional
Target
Areas 5th Total
Employ.
Preference
Total Grand Total
Africa
Algeria 0 1 0 0 1 51 101
Angola 0 0 0 0 0 5 28
Benin 0 0 0 0 0 7 14
Botswana 0 0 0 0 0 19 20
Burkina Faso 0 0 0 0 0 11 25
Burundi 0 0 0 2 2 8 11
Cameroon 0 0 0 0 0 94 270
Cape Verde 0 0 0 0 0 11 757
Central African Republic 0 0 0 0 0 0 3
Chad 0 0 0 0 0 1 14
Comoros 0 0 0 0 0 0 0
Congo, Rep. of the 0 0 0 0 0 5 13
Congo, Dem. Rep. of the 0 0 0 5 5 34 144
Cote d'Ivoire 0 0 0 0 0 64 166
Djibouti 0 0 0 0 0 0 2
Egypt 3 5 0 29 37 623 1,403
Equatorial Guinea 0 0 0 0 0 1 1
Eritrea 0 0 0 0 0 43 142
Ethiopia 0 0 0 0 0 167 1,341
Gabon 0 0 0 0 0 4 8
Gambia, The 0 0 0 0 0 33 87
Ghana 0 0 0 0 0 298 1,172
Guinea 0 0 0 0 0 36 158
Guinea-Bissau 0 0 0 0 0 1 2
Kenya 0 0 0 1 1 441 714
Lesotho 0 0 0 0 0 0 0
Liberia 0 0 0 0 0 43 435
Libya 0 0 0 0 0 44 68
Madagascar 0 0 0 0 0 26 27
Malawi 0 0 0 0 0 33 37
Mali 0 0 0 0 0 30 74
Mauritania 0 0 0 0 0 8 44
Mauritius 0 0 0 0 0 27 27
Morocco 0 0 0 0 0 127 436
Mozambique 0 0 0 0 0 14 20
Namibia 0 0 0 0 0 5 5
Niger 0 0 0 0 0 14 26
Nigeria 0 0 0 24 24 790 2,588
Rwanda 0 0 0 0 0 12 20
Sao Tome and Principe 0 0 0 0 0 0 2
Senegal 0 0 0 0 0 65 211
Seychelles 0 0 0 0 0 1 1
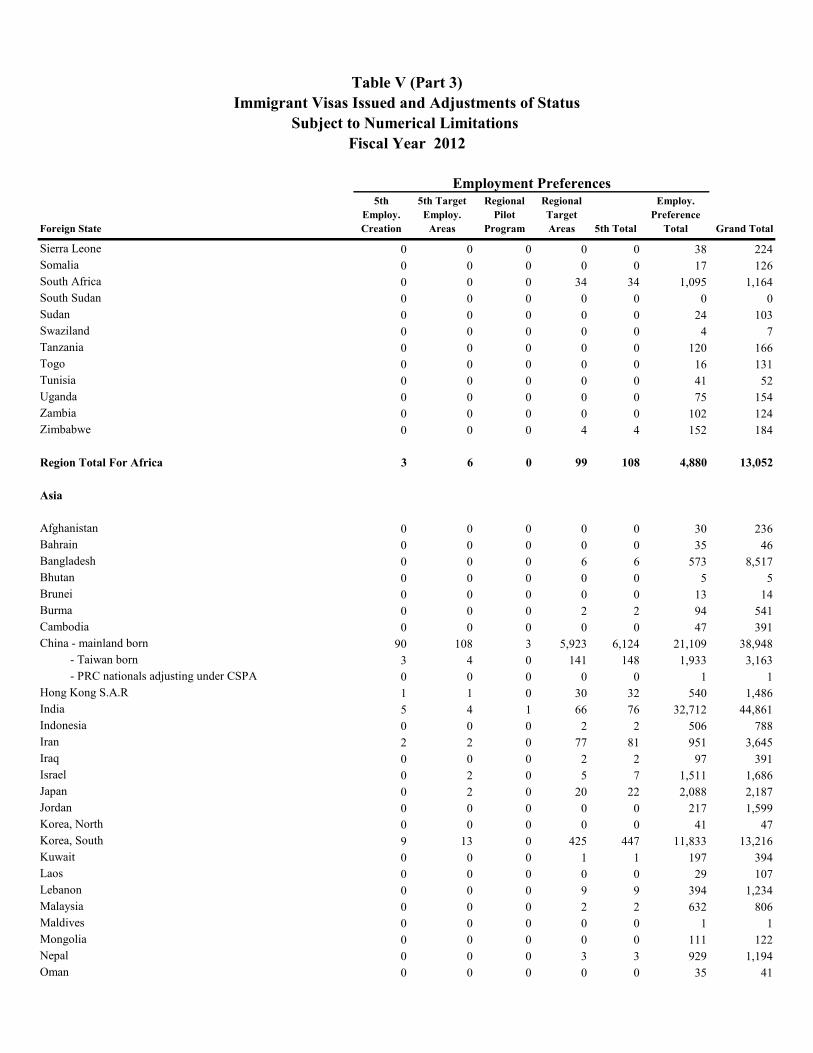
Employment Preferences
Immigrant Visas Issued and Adjustments of Status
Table V (Part 3)
Subject to Numerical Limitations
Fiscal Year 2012
Foreign State
5th
Employ.
Creation
5th Target
Employ.
Areas
5th
Regional
Pilot
Program
5th
Regional
Target
Areas 5th Total
Employ.
Preference
Total Grand Total
Employment Preferences
Immigrant Visas Issued and Adjustments of Status
Table V (Part 3)
Subject to Numerical Limitations
Fiscal Year 2012
Sierra Leone 0 0 0 0 0 38 224
Somalia 0 0 0 0 0 17 126
South Africa 0 0 0 34 34 1,095 1,164
South Sudan 0 0 0 0 0 0 0
Sudan 0 0 0 0 0 24 103
Swaziland 0 0 0 0 0 4 7
Tanzania 0 0 0 0 0 120 166
Togo 0 0 0 0 0 16 131
Tunisia 0 0 0 0 0 41 52
Uganda 0 0 0 0 0 75 154
Zambia 0 0 0 0 0 102 124
Zimbabwe 0 0 0 4 4 152 184
Region Total For Africa 3 6 0 99 108 4,880 13,052
Asia
Afghanistan 0 0 0 0 0 30 236
Bahrain 0 0 0 0 0 35 46
Bangladesh 0 0 0 6 6 573 8,517
Bhutan 0 0 0 0 0 5 5
Brunei 0 0 0 0 0 13 14
Burma 0 0 0 2 2 94 541
Cambodia 0 0 0 0 0 47 391
China - mainland born 90 108 3 5,923 6,124 21,109 38,948
- Taiwan born 3 4 0 141 148 1,933 3,163
- PRC nationals adjusting under CSPA 0 0 0 0 0 1 1
Hong Kong S.A.R 1 1 0 30 32 540 1,486
India 5 4 1 66 76 32,712 44,861
Indonesia 0 0 0 2 2 506 788
Iran 2 2 0 77 81 951 3,645
Iraq 0 0 0 2 2 97 391
Israel 0 2 0 5 7 1,511 1,686
Japan 0 2 0 20 22 2,088 2,187
Jordan 0 0 0 0 0 217 1,599
Korea, North 0 0 0 0 0 41 47
Korea, South 9 13 0 425 447 11,833 13,216
Kuwait 0 0 0 1 1 197 394
Laos 0 0 0 0 0 29 107
Lebanon 0 0 0 9 9 394 1,234
Malaysia 0 0 0 2 2 632 806
Maldives 0 0 0 0 0 1 1
Mongolia 0 0 0 0 0 111 122
Nepal 0 0 0 3 3 929 1,194
Oman 0 0 0 0 0 35 41

Foreign State
5th
Employ.
Creation
5th Target
Employ.
Areas
5th
Regional
Pilot
Program
5th
Regional
Target
Areas 5th Total
Employ.
Preference
Total Grand Total
Employment Preferences
Immigrant Visas Issued and Adjustments of Status
Table V (Part 3)
Subject to Numerical Limitations
Fiscal Year 2012
Pakistan 1 0 0 6 7 2,229 7,110
Philippines 0 0 0 1 1 9,504 26,231
Qatar 0 0 0 0 0 28 33
Saudi Arabia 0 0 0 1 1 198 331
Singapore 1 0 0 3 4 389 426
Sri Lanka 0 0 0 0 0 505 679
Syria 0 0 0 0 0 251 1,203
Thailand 0 0 0 1 1 400 723
Timor-Leste 0 0 0 0 0 1 1
United Arab Emirates 1 0 0 6 7 249 417
Vietnam 1 0 0 34 35 351 15,910
Yemen 0 0 0 0 0 37 826
Region Total For Asia 114 136 4 6,766 7,020 90,806 179,557
Europe
Albania 0 0 0 0 0 70 338
Andorra 0 0 0 0 0 1 1
Armenia 0 0 0 0 0 141 267
Austria 0 0 0 0 0 139 144
Azerbaijan 0 0 0 0 0 45 116
Belarus 0 0 0 0 0 138 213
Belgium 0 0 0 4 4 249 268
Bosnia and Herzegovina 0 0 0 0 0 51 75
Bulgaria 3 0 0 0 3 315 401
Croatia 0 0 0 0 0 62 69
Cyprus 0 0 0 0 0 26 34
Czech Republic 0 0 0 2 2 148 170
Denmark 0 0 0 0 0 225 232
Faroe Islands 0 0 0 0 0 0 0
Greenland 0 0 0 0 0 0 0
TOTAL 0 0 0 0 0 225 232
Estonia 0 0 0 0 0 27 31
Finland 0 0 0 3 3 144 152
France 6 0 0 3 9 1,636 1,764
French Guiana 0 0 0 0 0 0 0
French Polynesia 0 0 0 0 0 1 2
French Southern and Antarctic Lands 0 0 0 0 0 0 0
Guadeloupe 0 0 0 0 0 0 0
Martinique 0 0 0 0 0 0 0
Mayotte 0 0 0 0 0 1 1
New Caledonia 0 0 0 0 0 1 1
Reunion 0 0 0 0 0 0 0
Saint Barthelemy 0 0 0 0 0 1 2

Foreign State
5th
Employ.
Creation
5th Target
Employ.
Areas
5th
Regional
Pilot
Program
5th
Regional
Target
Areas 5th Total
Employ.
Preference
Total Grand Total
Employment Preferences
Immigrant Visas Issued and Adjustments of Status
Table V (Part 3)
Subject to Numerical Limitations
Fiscal Year 2012
Saint Martin 0 0 0 0 0 3 6
St. Pierre and Miquelon 0 0 0 0 0 0 0
Wallis and Futuna 0 0 0 0 0 0 0
TOTAL 6 0 0 3 9 1,643 1,776
Georgia 0 0 0 0 0 81 122
Germany 0 0 0 18 18 1,752 1,909
Great Britain and Northern Ireland 7 4 0 56 67 5,269 5,757
Anguilla 0 0 0 0 0 1 5
Bermuda 0 0 0 0 0 19 26
British Indian Ocean Territory 0 0 0 0 0 0 0
British Virgin Islands 0 0 0 0 0 0 10
Cayman Islands 0 0 0 0 0 3 13
Falkland Islands 0 0 0 0 0 0 0
Gibraltar 0 0 0 0 0 1 1
Montserrat 0 0 0 0 0 5 5
Pitcairn 0 0 0 0 0 0 0
St. Helena 0 0 0 0 0 0 0
South Georgia and the South Sandwich Islands 0 0 0 0 0 0 0
Turks and Caicos Islands 0 0 0 0 0 2 4
TOTAL 7 4 0 56 67 5,300 5,821
Greece 1 0 0 1 2 195 219
Hungary 0 0 0 0 0 188 230
Iceland 0 0 0 0 0 52 53
Ireland 0 0 0 7 7 496 527
Italy 1 0 0 2 3 841 945
Kazakhstan 0 0 0 8 8 96 130
Kosovo 0 0 0 0 0 7 81
Kyrgyzstan 0 0 0 0 0 32 45
Latvia 0 0 0 0 0 38 60
Liechtenstein 0 0 0 0 0 1 1
Lithuania 0 0 0 0 0 93 137
Luxembourg 0 0 0 0 0 6 6
Macedonia 0 0 0 0 0 51 221
Malta 0 0 0 0 0 10 12
Moldova 0 0 0 0 0 76 131
Monaco 0 0 0 0 0 2 2
Montenegro 0 0 0 0 0 7 40
Netherlands 0 5 0 7 12 491 502
Aruba 0 0 0 0 0 21 27
Curacao 0 0 0 0 0 11 17
Netherlands Antilles 0 0 0 0 0 0 0
Sint Maarten 0 0 0 0 0 0 10
TOTAL 0 5 0 7 12 523 556
Norway 0 0 0 1 1 76 83
Svalbard 0 0 0 0 0 0 0
Foreign State
5th
Employ.
Creation
5th Target
Employ.
Areas
5th
Regional
Pilot
Program
5th
Regional
Target
Areas 5th Total
Employ.
Preference
Total Grand Total
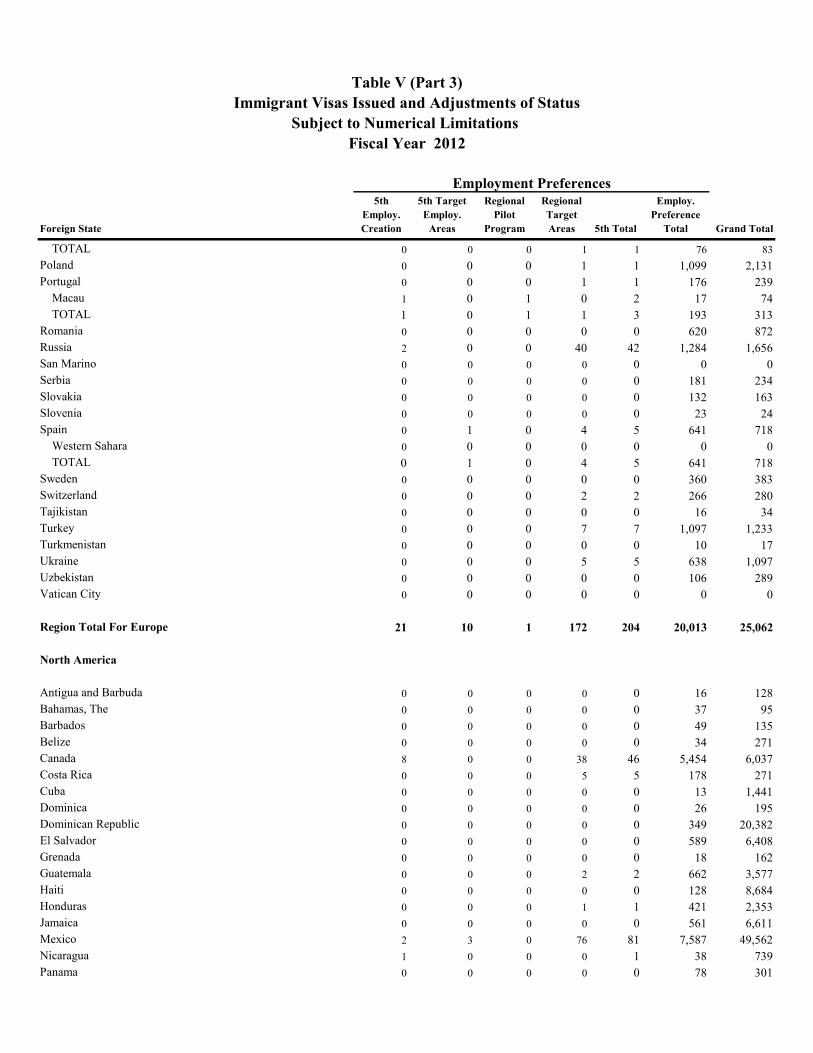
Employment Preferences
Immigrant Visas Issued and Adjustments of Status
Table V (Part 3)
Subject to Numerical Limitations
Fiscal Year 2012
TOTAL 0 0 0 1 1 76 83
Poland 0 0 0 1 1 1,099 2,131
Portugal 0 0 0 1 1 176 239
Macau 1 0 1 0 2 17 74
TOTAL 1 0 1 1 3 193 313
Romania 0 0 0 0 0 620 872
Russia 2 0 0 40 42 1,284 1,656
San Marino 0 0 0 0 0 0 0
Serbia 0 0 0 0 0 181 234
Slovakia 0 0 0 0 0 132 163
Slovenia 0 0 0 0 0 23 24
Spain 0 1 0 4 5 641 718
Western Sahara 0 0 0 0 0 0 0
TOTAL 0 1 0 4 5 641 718
Sweden 0 0 0 0 0 360 383
Switzerland 0 0 0 2 2 266 280
Tajikistan 0 0 0 0 0 16 34
Turkey 0 0 0 7 7 1,097 1,233
Turkmenistan 0 0 0 0 0 10 17
Ukraine 0 0 0 5 5 638 1,097
Uzbekistan 0 0 0 0 0 106 289
Vatican City 0 0 0 0 0 0 0
Region Total For Europe 21 10 1 172 204 20,013 25,062
North America
Antigua and Barbuda 0 0 0 0 0 16 128
Bahamas, The 0 0 0 0 0 37 95
Barbados 0 0 0 0 0 49 135
Belize 0 0 0 0 0 34 271
Canada 8 0 0 38 46 5,454 6,037
Costa Rica 0 0 0 5 5 178 271
Cuba 0 0 0 0 0 13 1,441
Dominica 0 0 0 0 0 26 195
Dominican Republic 0 0 0 0 0 349 20,382
El Salvador 0 0 0 0 0 589 6,408
Grenada 0 0 0 0 0 18 162
Guatemala 0 0 0 2 2 662 3,577
Haiti 0 0 0 0 0 128 8,684
Honduras 0 0 0 1 1 421 2,353
Jamaica 0 0 0 0 0 561 6,611
Mexico 2 3 0 76 81 7,587 49,562
Nicaragua 1 0 0 0 1 38 739
Panama 0 0 0 0 0 78 301

Foreign State
5th
Employ.
Creation
5th Target
Employ.
Areas
5th
Regional
Pilot
Program
5th
Regional
Target
Areas 5th Total
Employ.
Preference
Total Grand Total
Employment Preferences
Immigrant Visas Issued and Adjustments of Status
Table V (Part 3)
Subject to Numerical Limitations
Fiscal Year 2012
Saint Kitts and Nevis 0 0 0 0 0 6 144
Saint Lucia 0 0 0 0 0 30 206
Saint Vincent and the Grenadines 0 0 0 0 0 16 111
Trinidad and Tobago 0 0 0 6 6 320 1,265
Region Total For North America 11 3 0 128 142 16,610 109,078
Oceania
Australia 0 0 0 1 1 792 827
Christmas Island 0 0 0 0 0 0 0
Cocos (Keeling) Islands 0 0 0 0 0 0 0
Norfolk Island 0 0 0 0 0 0 0
TOTAL 0 0 0 1 1 792 827
Fiji 0 0 0 0 0 22 297
Kiribati 0 0 0 0 0 0 0
Marshall Islands 0 0 0 0 0 1 1
Micronesia, Federated States of 0 0 0 0 0 5 5
Nauru 0 0 0 0 0 1 1
New Zealand 4 0 0 1 5 225 237
Cook Islands 0 0 0 0 0 0 0
Niue 0 0 0 0 0 0 0
Tokelau 0 0 0 0 0 0 0
TOTAL 4 0 0 1 5 225 237
Palau 0 0 0 0 0 0 1
Papua New Guinea 0 0 0 0 0 4 5
Samoa 0 0 0 0 0 1 13
Solomon Islands 0 0 0 0 0 2 2
Tonga 0 0 0 0 0 2 40
Tuvalu 0 0 0 0 0 0 0
Vanuatu 0 0 0 0 0 0 1
Region Total For Oceania 4 0 0 2 6 1,055 1,430
South America
Argentina 0 0 0 1 1 1,210 1,398
Bolivia 0 0 0 1 1 293 523
Brazil 6 0 0 18 24 2,630 2,971
Chile 0 0 0 5 5 325 428
Colombia 0 0 0 13 13 1,980 5,122
Ecuador 0 0 0 2 2 867 3,434
Guyana 0 1 0 1 2 126 3,139
Paraguay 0 0 0 0 0 61 81
Peru 0 0 0 0 0 940 3,388
Foreign State
5th
Employ.
Creation
5th Target
Employ.
Areas
5th
Regional
Pilot
Program
5th
Regional
Target
Areas 5th Total
Employ.
Preference
Total Grand Total
Employment Preferences
Immigrant Visas Issued and Adjustments of Status
Table V (Part 3)
Subject to Numerical Limitations
Fiscal Year 2012
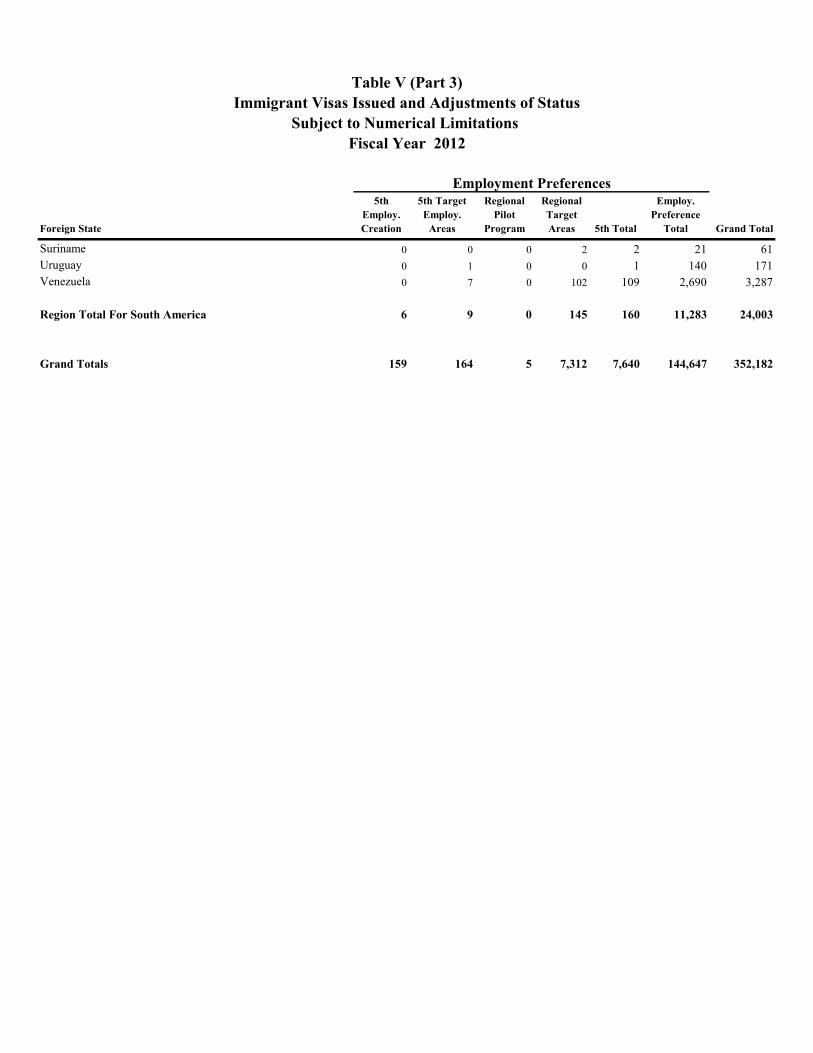
Suriname 0 0 0 2 2 21 61
Uruguay 0 1 0 0 1 140 171
Venezuela 0 7 0 102 109 2,690 3,287
Region Total For South America 6 9 0 145 160 11,283 24,003
Grand Totals 159 164 5 7,312 7,640 144,647 352,182