immigrant health paradox
TRANSCRIPT
www.Healthycity.orgFacebook.com/HealthyCityCA@[email protected]
www.AdvancementProjectCA.orgFacebook.com/[email protected]
Taisha BonillaTraining & Communications
Coordinator [email protected]
Wednesday, September 10th11:00am – 12:00pm
Jose CuchillaHealthy City Data [email protected]
Investigating the Immigrant Health Paradox in California

Healthy City is a program of
Championing the struggle for greater equity and opportunity for all, Advancement Project California fosters upward mobility in communities most impacted by economic and racial injustice.We build alliances and trust, use data-driven policy solutions, create innovative tools and work alongside communities.
We ignite social transformation!
Integrity * Innovation * Capacity-Building * Collaboration * Audacity * Equity *
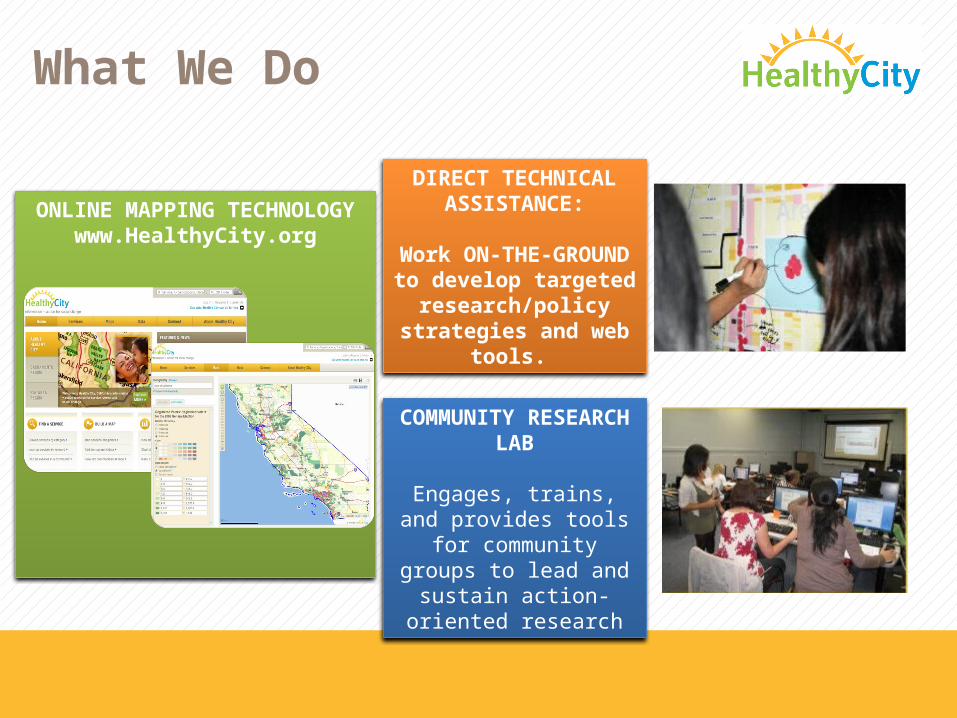
What We Do
DIRECT TECHNICAL ASSISTANCE:
Work ON-THE-GROUND to develop
targeted research/policy
strategies and web tools.
COMMUNITY RESEARCH LAB
Engages, trains, and provides tools for
community groups to lead and sustain action-oriented
research
ONLINE MAPPING TECHNOLOGY
www.HealthyCity.org

Fuel social change and empower communities!
HealthyCity.orgWebsite
Service Provider
Case Manager
Policy Advocate
Funder
Community Organizer
Researcher
Who Uses HealthyCity.org?
Grant Writer
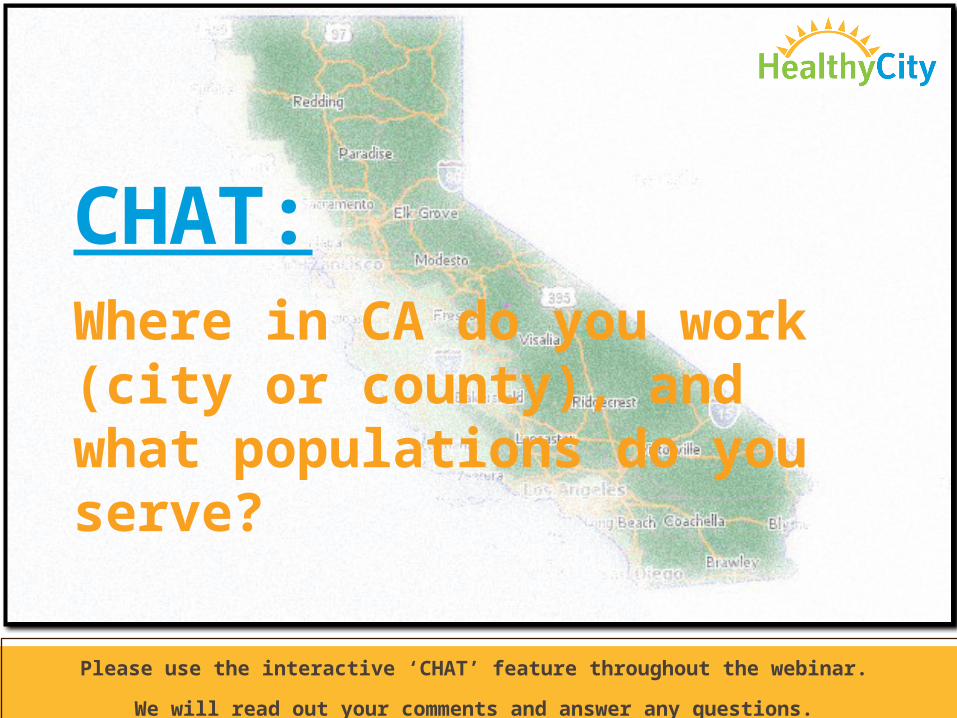
CHAT:Where in CA do you work (city or county), and what populations do you serve?
Please use the interactive ‘CHAT’ feature throughout the webinar.
We will read out your comments and answer any questions.

• Learn about the Immigrant Health Paradox
• Examine diabetes hospitalization rates among US and Foreign-Born Hispanics/Latin@s
• Using the Social Determinants of Health framework, we will explore potential contributing factors
• Live demonstration of how to access and map related data on other communities of interest on HealthyCity.org
Webinar Agenda:

Exploring the Association between Acculturation and Diabetes among
US/foreign-born Hispanics
-Jose Cuchilla, Healthy City Data Analyst-
Jose Cuchilla1
Micere Keels, PhD2
1 California State Polytechnic University of Pomona
2 The University of Chicago, Department of Comparative Human Development

http://www.baltimorehia.org/social-determinants-of-health.html
Social Determinants of Health“The economic and social conditions that influence individuals and group differences in health status.” – The World Health Organization

The Immigrant Health Paradox
Lower mortality (Jasso et al., 2002; Muennig and Fahs, 2002) Lower rates of obesity (Gordon-Larsen, 2003) Better mental health (Dey and Lucas, 2006) Lower rates of heart and circulatory disease (Singh and Siahpush,
2001)
Despite lower levels of education and income, immigrants are generally healthier than the US-born population
However, as their length of residence increases, so does the prevalence of poor health behaviors and chronic conditions (Kaplan, 2004)
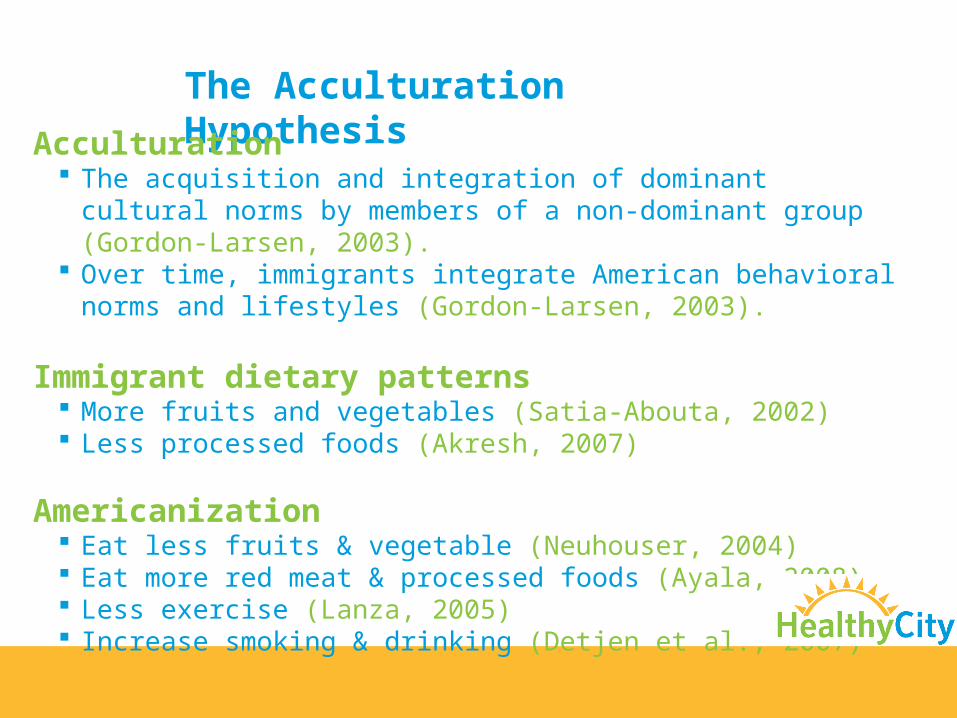
The Acculturation Hypothesis
Acculturation The acquisition and integration of dominant cultural norms by
members of a non-dominant group (Gordon-Larsen, 2003). Over time, immigrants integrate American behavioral norms and
lifestyles (Gordon-Larsen, 2003).
Immigrant dietary patterns More fruits and vegetables (Satia-Abouta, 2002) Less processed foods (Akresh, 2007)
Americanization Eat less fruits & vegetable (Neuhouser, 2004) Eat more red meat & processed foods (Ayala, 2008) Less exercise (Lanza, 2005) Increase smoking & drinking (Detjen et al., 2007)
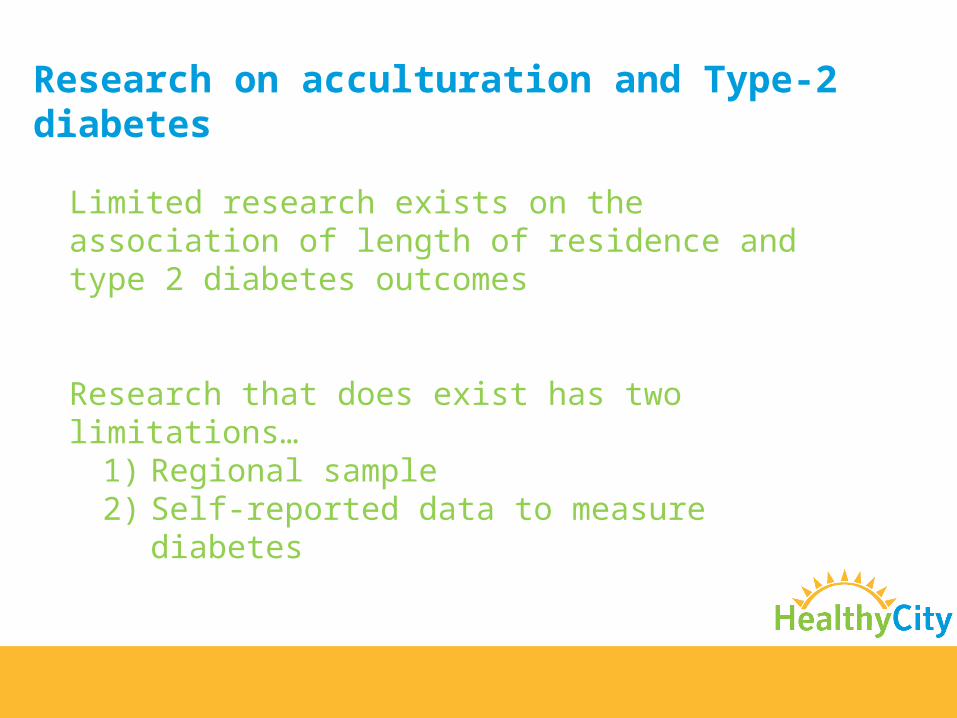
Research on acculturation and Type-2 diabetes
Limited research exists on the association of length of residence and type 2 diabetes outcomes
Research that does exist has two limitations…1) Regional sample2) Self-reported data to measure diabetes

A quantitative analysis of diabetes prevalence in Hispanics
2001- 2010 NHANES (CDC) Nationally representative sample US/foreign-born Mexican Americans ages 20-65 Tested for diabetes (n= 2417)
Fasting blood glucose test Nativity (US-born/foreign-born) Acculturation (Length of time [years] in the US)
STATA T-test Logistic Regression
Model 1: Basic DifferencesModel 2: Control
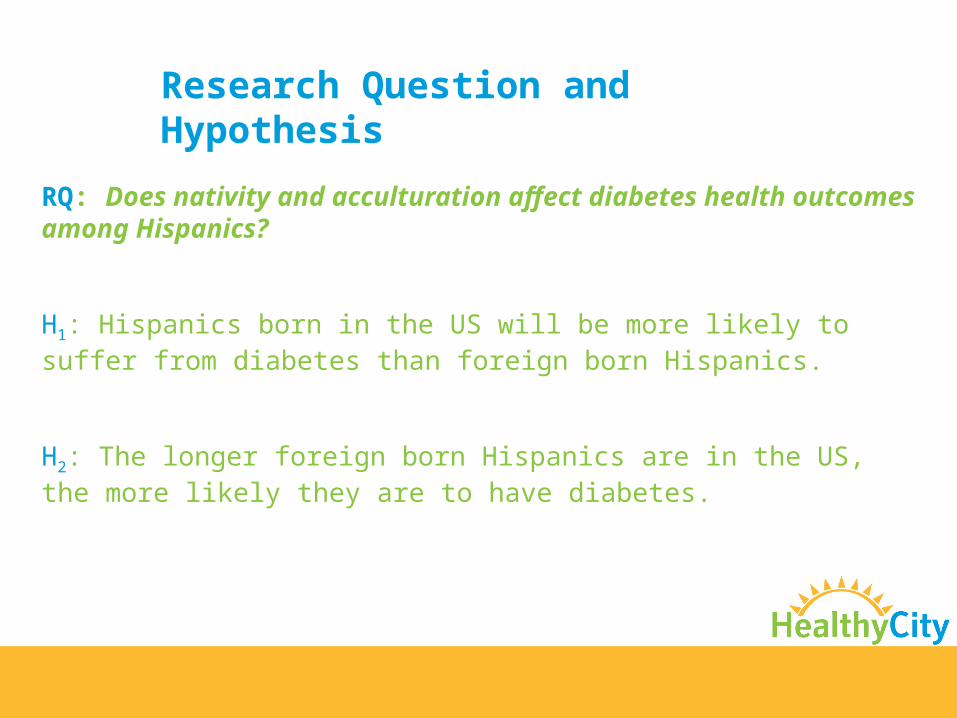
Research Question and Hypothesis
RQ: Does nativity and acculturation affect diabetes health outcomes among Hispanics?
H1: Hispanics born in the US will be more likely to suffer from diabetes than foreign born Hispanics.
H2: The longer foreign born Hispanics are in the US, the more likely they are to have diabetes.
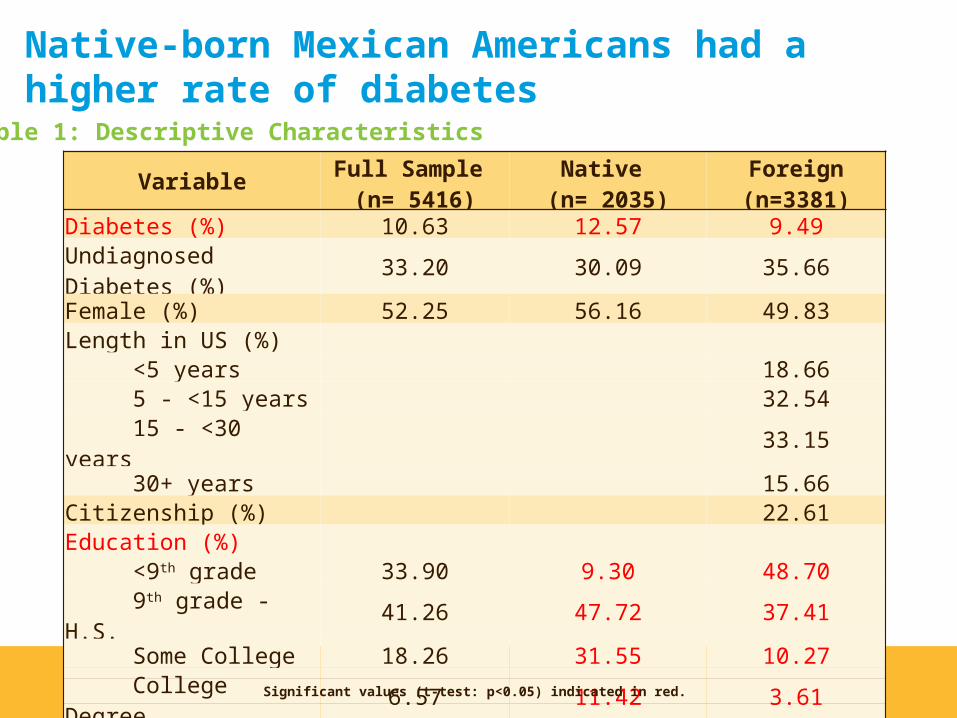
Native-born Mexican Americans had a higher rate of diabetesTable 1: Descriptive Characteristics
VariableFull Sample
(n= 5416)Native
(n= 2035)Foreign(n=3381)
Diabetes (%) 10.63 12.57 9.49Undiagnosed Diabetes (%) 33.20 30.09 35.66Female (%) 52.25 56.16 49.83Length in US (%) <5 years 18.66 5 - <15 years 32.54 15 - <30 years 33.15 30+ years 15.66Citizenship (%) 22.61Education (%) <9th grade 33.90 9.30 48.70 9th grade - H.S. 41.26 47.72 37.41 Some College 18.26 31.55 10.27 College Degree 6.57 11.42 3.61Married (%) 60.75 53.79 64.82No Insurance (%) 47.62 27.25 59.85
Significant values (t-test: p<0.05) indicated in red.

Foreign-born Mexican Americans were less likely to have diabetes
Table 2: Logistic regression results for nativity
Diabetes Model 1* Model 2**
Variable Odds Ratio (Std. Err.)
P-value Odds Ratio (Std. Err.)
P-value
All Mexican Americans
Native born reference category
Foreign born 0.73 0.018 0.50 <0.001
(0.10) (0.09)
*Model 1: Includes only nativity or length in US. **Model 2: Adds controls for education, poverty, marital status, smoker, insurance, age, and gender.

Foreign-born Mexican Americans who have been in the US longer were more likely to have diabetesTable 2: Logistic regression results for length of time among foreign-born Hispanics
Diabetes Model 1* Model 2**
VariableOdds Ratio (Std. Err.) P-value
Odds Ratio (Std. Err.) P-value
Foreign Born Mexican Americans
< 5 years in US reference category
5 - <15 years in US 1.78 0.109 1.87 0.113
(0.63) (0.74)
15-<30 years in US 2.64 0.005 3.11 0.003
(0.90) (1.21)
30+ years in US 5.06 <0.001 6.67 <0.001
(1.78) (2.82)*Model 1: Includes only nativity or length in US. **Model 2: Adds controls for education, poverty, marital status, smoker, insurance, age, and gender.
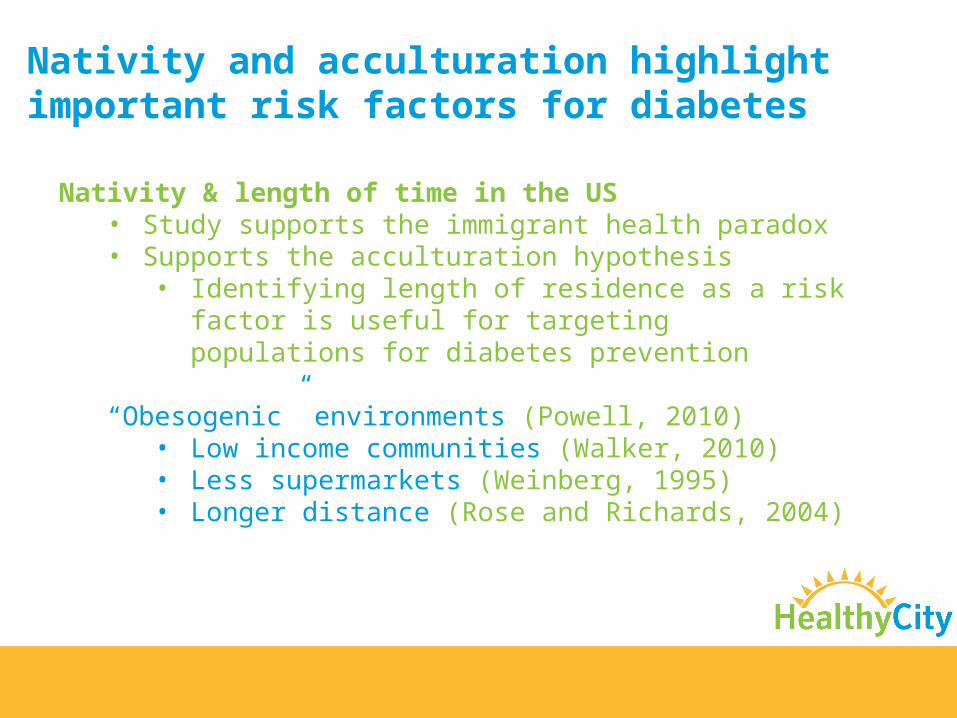
Nativity and acculturation highlight important risk factors for diabetes
Nativity & length of time in the US • Study supports the immigrant health paradox• Supports the acculturation hypothesis
• Identifying length of residence as a risk factor is useful for targeting populations for diabetes prevention
“Obesogenic” environments (Powell, 2010)• Low income communities (Walker, 2010)• Less supermarkets (Weinberg, 1995)• Longer distance (Rose and Richards, 2004)

Questions?

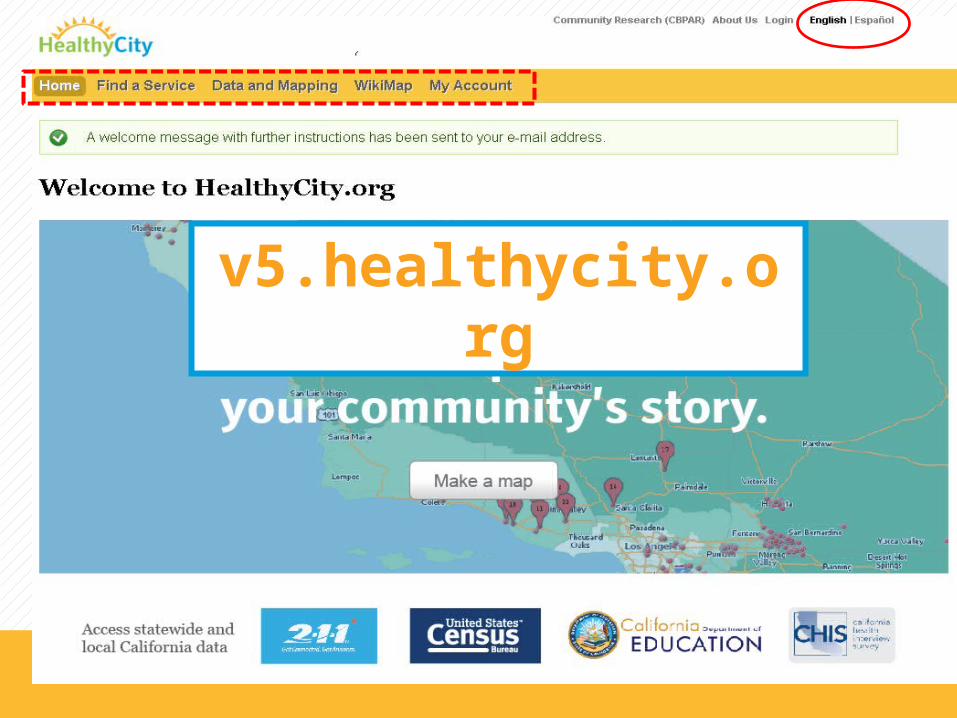
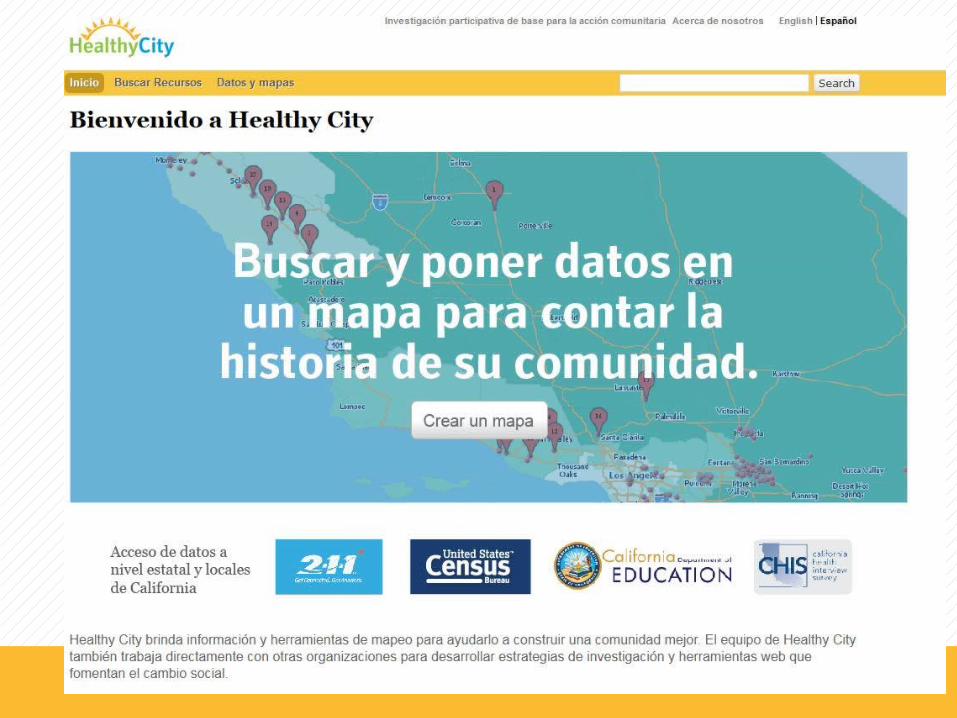
v5.healthycity.org

Services Listings
Interactive Mapping
Data Ranking
View Community Data/Stories
What is available on HealthyCity.org…
Map Your Data/Media
With HealthyCity.org’s Data and Mapping Tools, you can …
Create more effective community engagement
Assess need and strength at the community level for outreach and planning
Identify new target areas
Network with other organizations and identify community partners

1
2
Enter a word in “Keyword Search”
to pinpoint data for your map
Click on a category
to find servicesScroll down
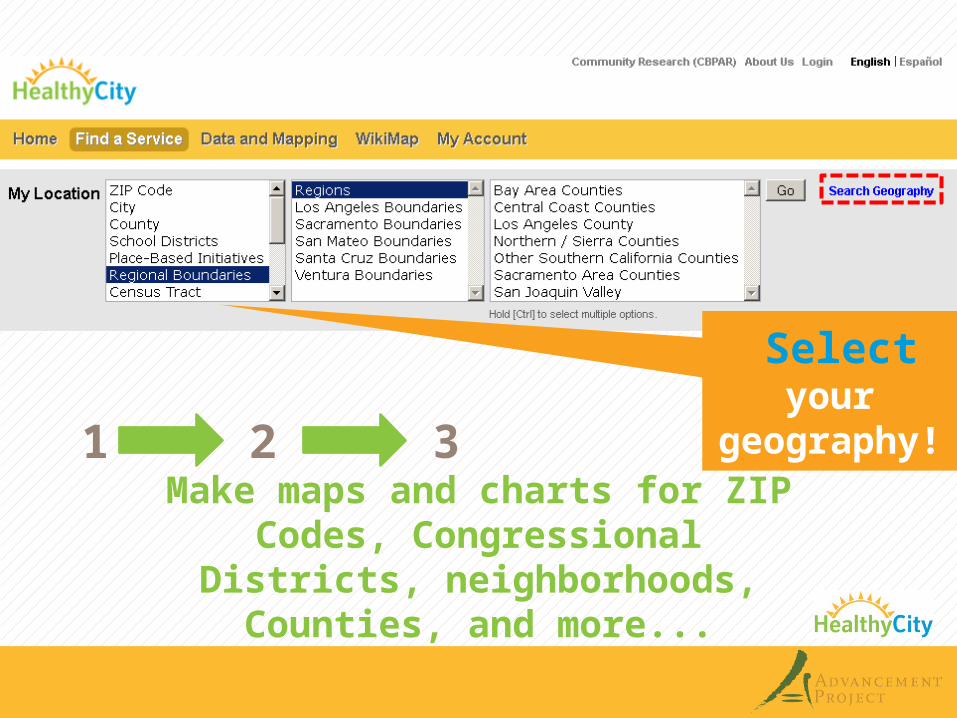
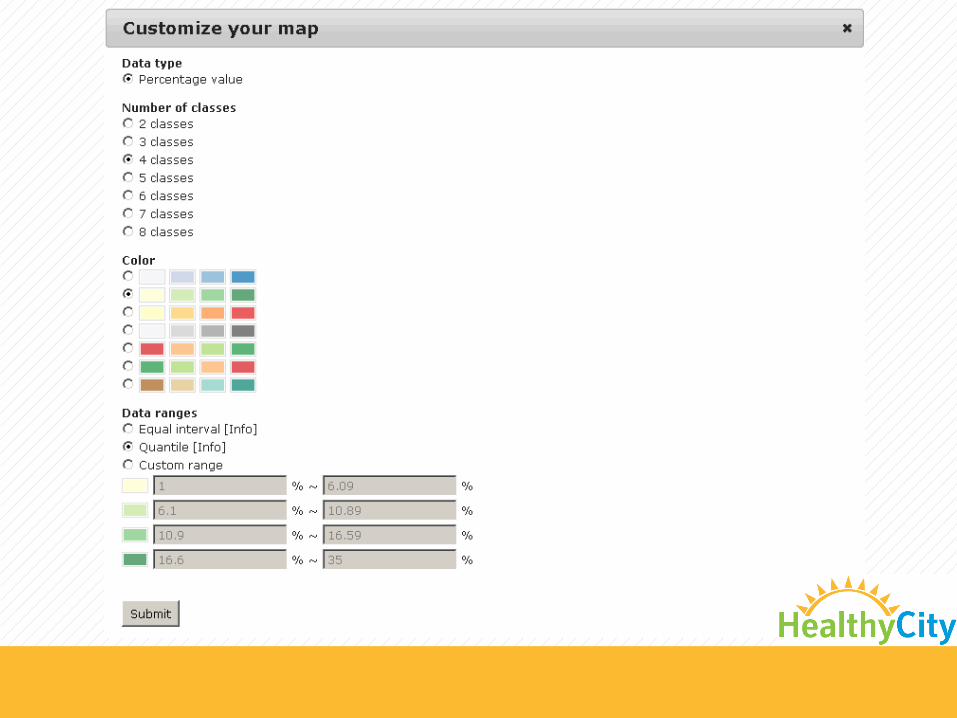
Make maps and charts for ZIP Codes, Congressional
Districts, neighborhoods, Counties, and more...
1 2 3
Select your
geography!
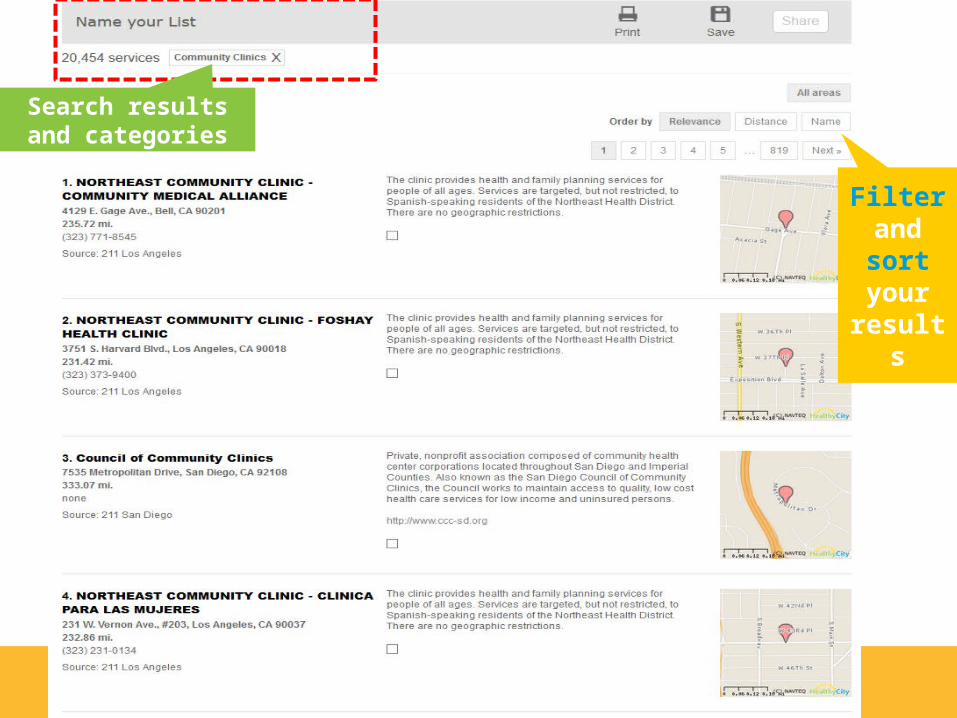
Search results and categories
Filter and sort your
results
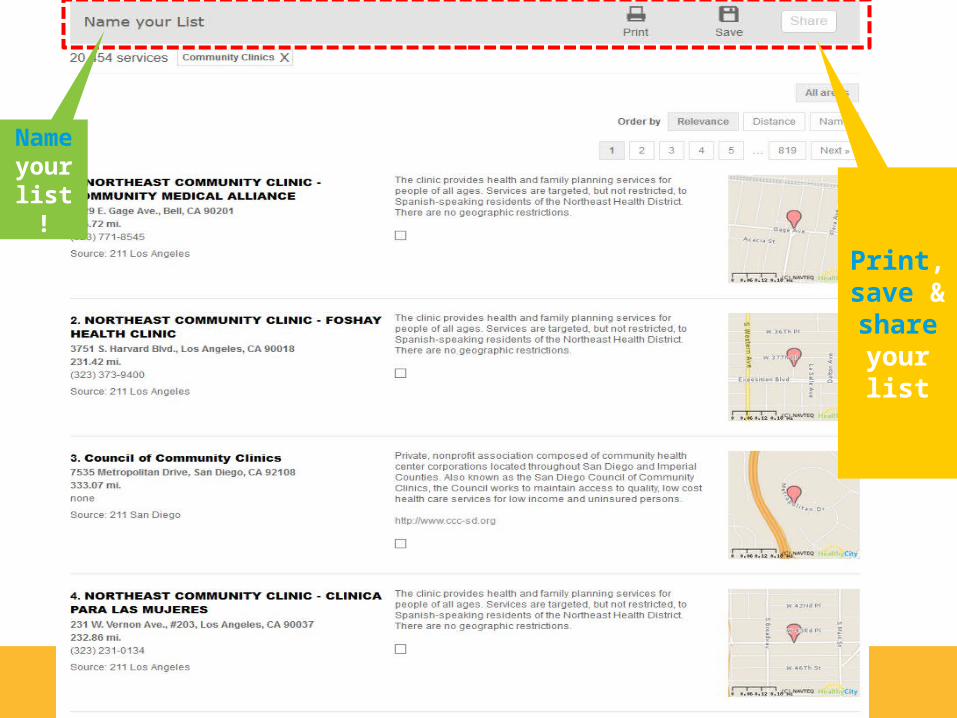
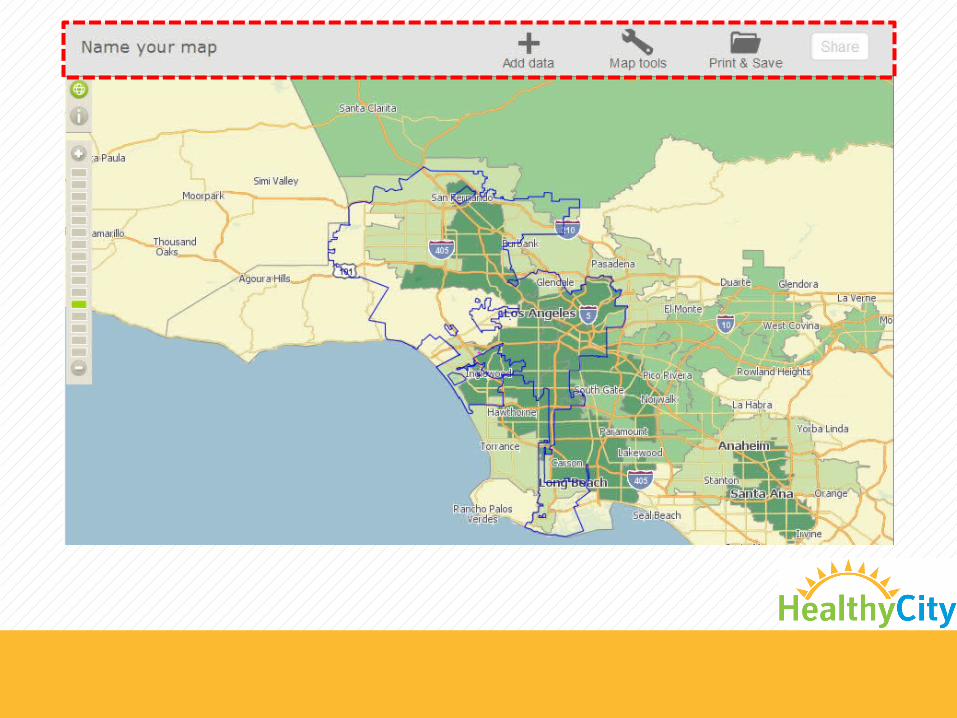
Name
your list!
Print, save
& share your list
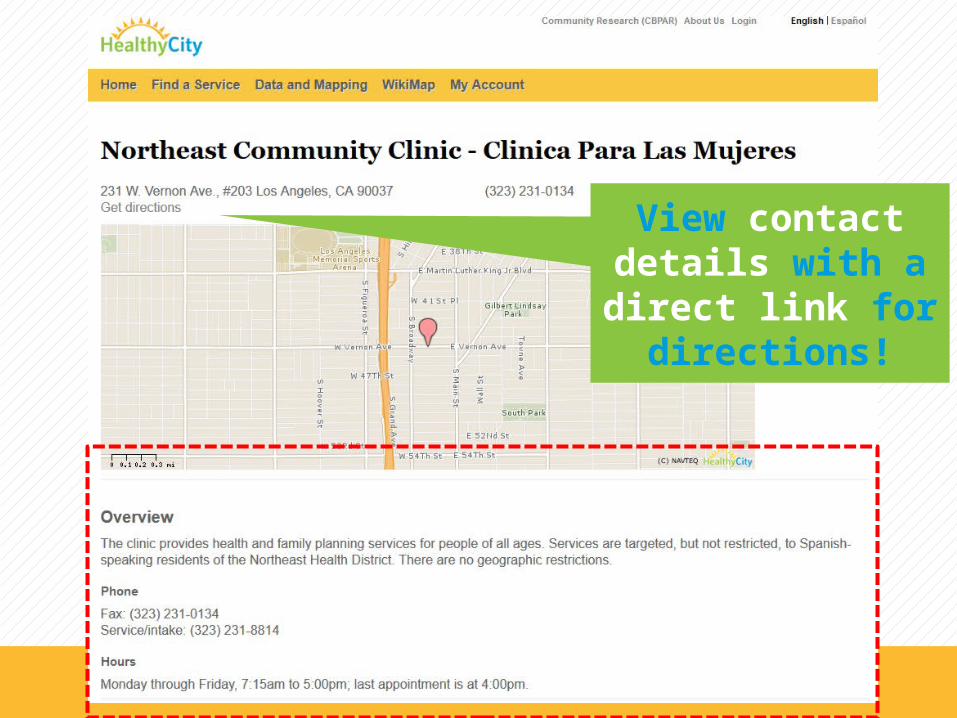
View contact details with a direct link for
directions!

Browse through listings to look
at service details
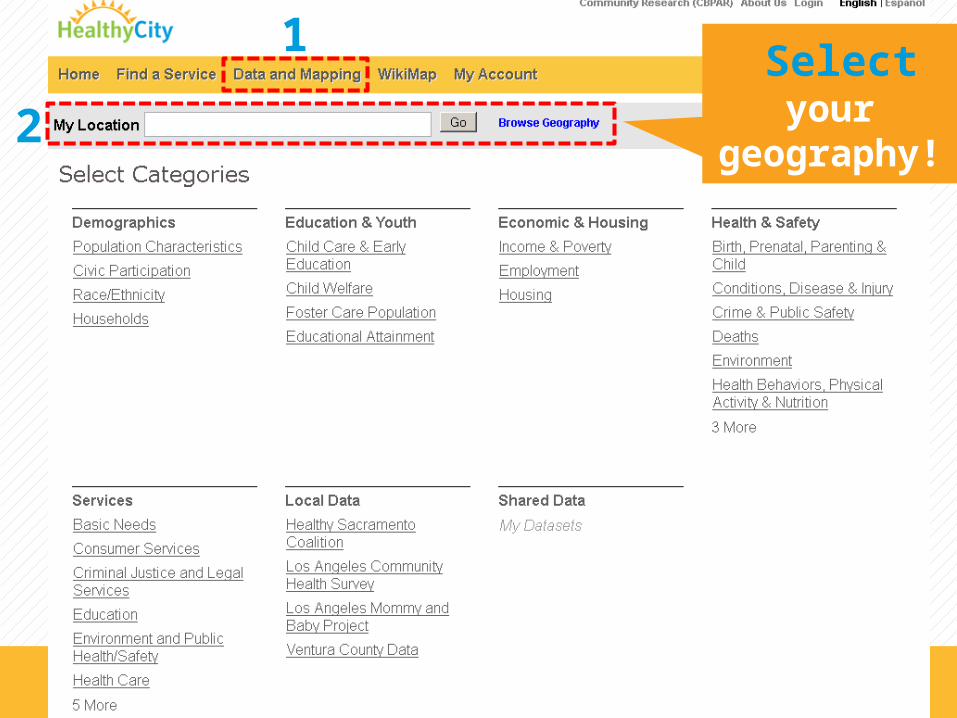
1 Select your
geography!
2

Make maps and charts for ZIP Codes, Congressional
Districts, neighborhoods, Counties, and more...
1 2 3
Select your
geography!

Upload your own data using an
Excel file!
To upload data from a
spreadsheet: Make sure you are logged into your account!

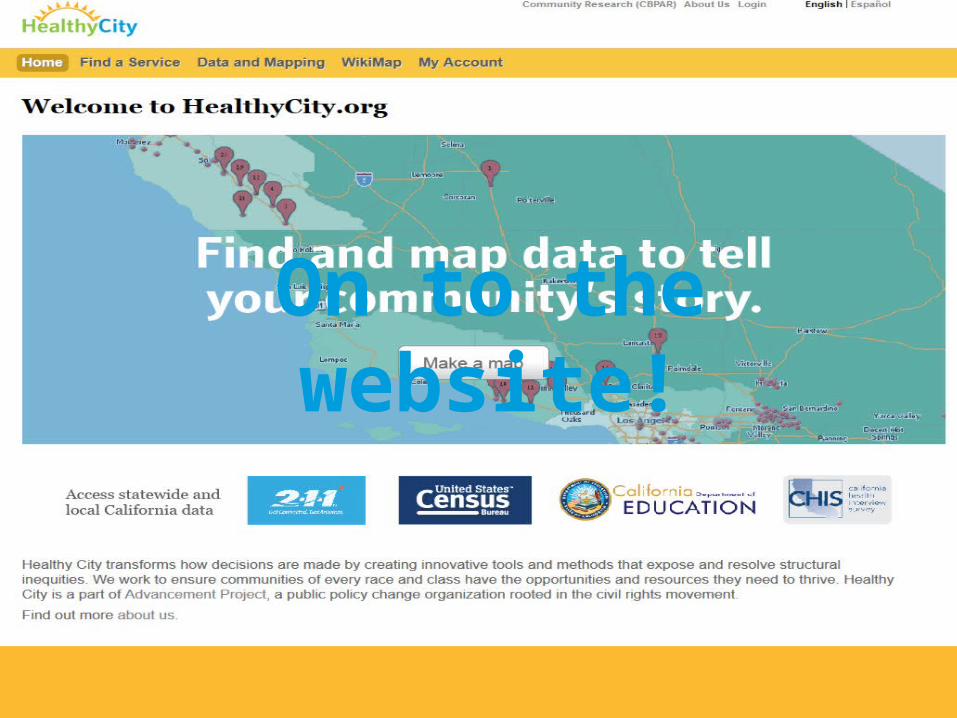
On to the website!

Questions?

www.Healthycity.orgFacebook.com/HealthyCityCA@[email protected]
www.AdvancementProjectCA.orgFacebook.com/[email protected]
Thank You!
Your feedback is very important to us!
We will be following up with you in 24 hours with an email and a
survey!