immediate loading long or short implants marco esposito
DESCRIPTION
in augmented bone? MARCO ESPOSITO When loading immediately, early or conventionally? conventionally? CLINICAL QUESTION CLINICAL QUESTION Is possible to achieve predictable i i success rates loading the implants immediately or early? immediately or early? it G i A hill W thi t Esposito, Grusovin, Achille, Worthington, Coulthard Coulthard Interventions for replacing missing teeth: Interventions for replacing missing teeth: different times for loading dental implants g p E 2008; 1: 259-276TRANSCRIPT

When loading immediately, early or conventionally?conventionally?
Short implants or longer implantsi t d b ?
A CO S OS Oin augmented bone?MARCO ESPOSITO

CLINICAL QUESTIONCLINICAL QUESTIONIs possible to achieve predictable
i isuccess rates loading the implants immediately or early?immediately or early?

E it G i A hill W thi tEsposito, Grusovin, Achille, Worthington, CoulthardCoulthard
Interventions for replacing missing teeth:Interventions for replacing missing teeth: different times for loading dental implantsg p
The Cochrane Library 2008, issue 4
Last literature search: June 2008
2008; 1: 259-276
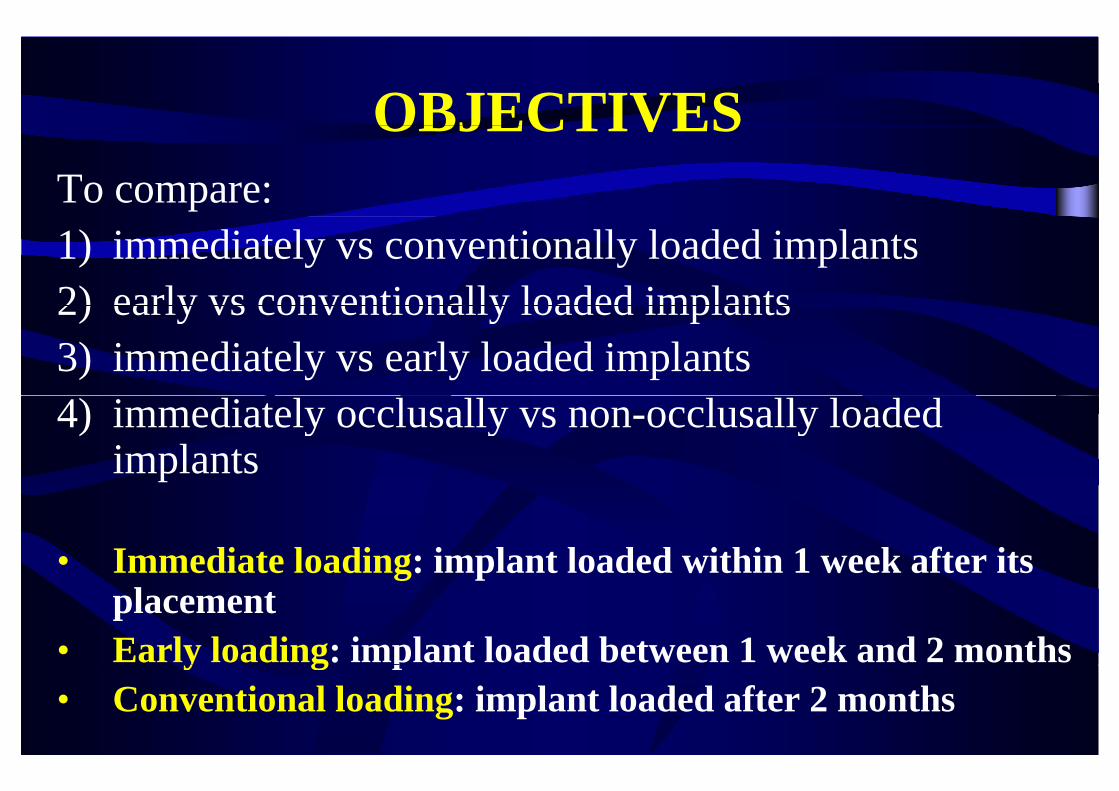
OBJECTIVESOBJECTIVESTo compare: 1) immediately vs conventionally loaded implants2) early vs conventionally loaded implants2) early vs conventionally loaded implants3) immediately vs early loaded implants4) immediately occlusally vs non-occlusally loaded
implants
• Immediate loading: implant loaded within 1 week after its g pplacement
• Early loading: implant loaded between 1 week and 2 monthsy g p• Conventional loading: implant loaded after 2 months

INCLUSION CRITERIAINCLUSION CRITERIA
T f t di ll RCT ith f ll f• Types of studies: all RCTs with a follow up of at least 4 months after loadingg
• Types of interventions: trials comparing the• Types of interventions: trials comparing the same dental implants loaded at different times
Occlusally and non-occlusally loaded implants were considered

OUTCOME MEASURESOUTCOME MEASURES
• Prosthesis failure
• Implant failure: mobility and removal of stable implants dictated by progressive marginal boneimplants dictated by progressive marginal bone loss
• Radiographic marginal bone level changes on g p g gintraoral radiographs taken with a parallel techniq etechnique
DESCRIPTION OF STUDIESDESCRIPTION OF STUDIES
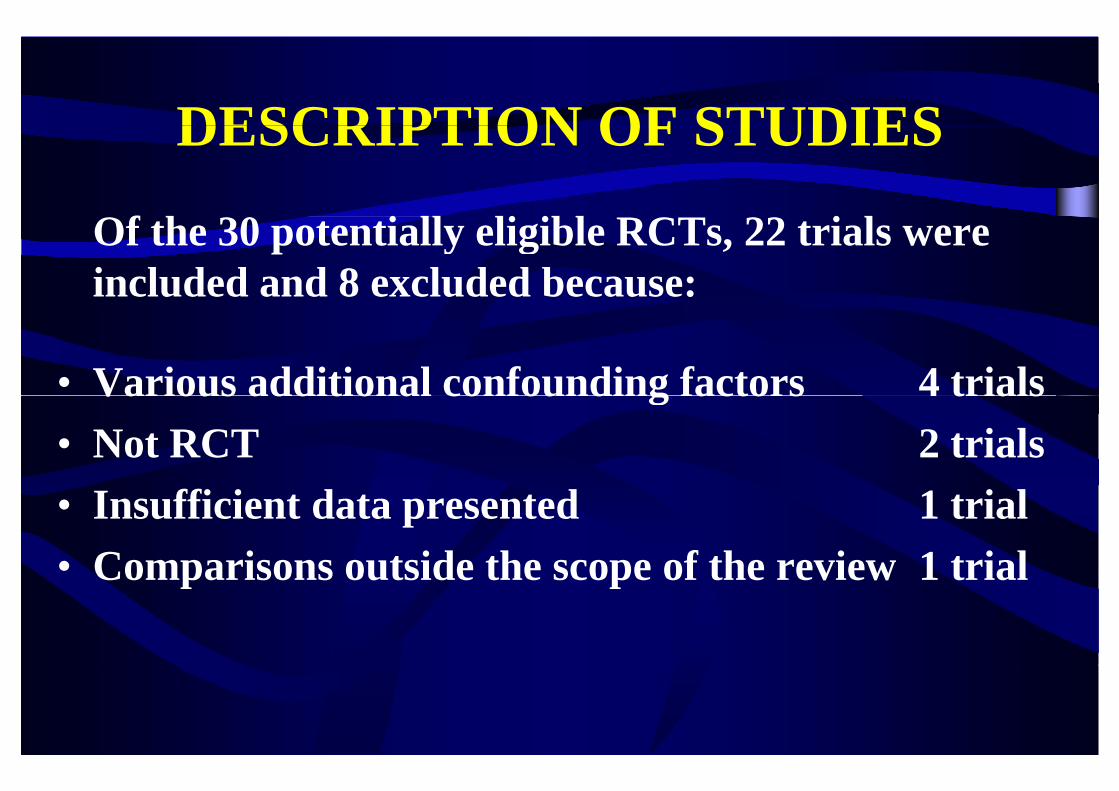
Of the 30 potentially eligible RCTs, 22 trials were included and 8 excluded because:
• Various additional confounding factors 4 trialsVarious additional confounding factors 4 trials• Not RCT 2 trials• Insufficient data presented 1 trial• Comparisons outside the scope of the review 1 trialComparisons outside the scope of the review 1 trial

DESCRIPTION OF STUDIESRCTs conducted in Italy 11RCT d d i N Z l d 3RCTs conducted in New Zealand 3RCTs conducted in Turkey 2yRCTs conducted in Sweden 1RCTs conducted in Germany 1RCTs conducted in Germany 1RCTs conducted in USA 1RCTs conducted in Egypt 1RCTs conducted in several countries 1RCTs conducted in several countries 1
Total number of treated patients 1024RCTs supported by the manufacturer 13

Immediate vs conventional loading (12 trials)g ( )1) Chiapasco 2001 edentulous mandibles2) Romeo 2002 edentulous mandibles2) Romeo 2002 edentulous mandibles3) Cannizzaro 2003 partial edentulism4) Hall 2006 single implants in anterior maxillas4) Hall 2006 single implants in anterior maxillas5) Oh 2006 single implants in anterior maxillas6) Romanos 2006 mandibular distal partial edentulism) p7) Assad 2007 edentulous mandibles8) Turkyilmaz 2007 edentulous mandibles9) Crespi 2008 single post-extractive implants in aesthetic maxilla10) Donati 2008 single implants in anterior jaws including premolars11) Gungu 2008 single mandibular first molars12) Schincaglia 2008 single implants in mandibular molar sites

Early vs conventional loading (3 trials)Early vs conventional loading (3 trials)
1) Payne 2002 edentulous mandibles2) Tawse-Smith 2002 edentulous mandibles2) Tawse-Smith 2002 edentulous mandibles3) Fischer 2004 edentulous maxillas

Immediate vs early loading (6 trials)Immediate vs early loading (6 trials)
1) T t i 2007 ti l d t li (N O)1) Testori 2007 partial edentulism (N-O)2) Cannizzaro 2008a edentulous mandibles)3) Cannizzaro 2008b edentulous maxillas4) C i 2008 i l 7 l i l t4) Cannizzaro 2008c single 7 mm long implants5) Merli 2008 partial edentulism (N-O)) p ( )6) Zollner 2008 posterior jaws (N-O)
N-O = Non-occludingN O Non occluding

Occlusal vs non-occlusal loading (1 trial)Occlusal vs non-occlusal loading (1 trial)
1) Lindeboom 2006single implants and anterior (including premolars) maxillassingle implants and anterior (including premolars) maxillas

METHODOLOGICAL QUALITYALLOCATION CONCEALMENT:• Adequate 9 trials• Inadequate 5 trials• Unclear 8 trials
BLINDING:• Yes 12 trials• Yes 12 trials• Partly (radiographs) 4 trials• No 4 trials• No 4 trials• Unclear 2 trials
WITHDRAWALS: Clear explanation 21 trials (Zollner unclear)
RISK OF BIAS: low for 6 trials high for 16 trialsRISK OF BIAS: low for 6 trials high for 16 trials

Immediate vs conventional loading prosthetic failures
Study or SubgroupCannizzaro 2003Donati 2008
log[risk ratio]-1.11 43
SE1.61 5
Total1484
Total1453
Weight13.5%15 4%
IV, Random, 95% CI0.33 [0.01, 7.66]
4 18 [0 22 79 04]
Immediate loading Conventional loading risk ratio risk ratioIV, Random, 95% CI
Donati 2008Güncü 2008Hall 2006Oh 2006Schincaglia 2008
1.430.76730.9951.9551.099
1.51.0931.6451.481.6
8413131215
5313121215
15.4%29.0%12.8%15.8%13.5%
4.18 [0.22, 79.04]2.15 [0.25, 18.35]2.70 [0.11, 67.98]
7.06 [0.39, 128.48]3.00 [0.13, 69.06]
Total (95% CI)Heterogeneity: Tau² = 0.00; Chi² = 2.23, df = 5 (P = 0.82); I² = 0%Test for overall effect: Z = 1.49 (P = 0.14)
151 119 100.0% 2.41 [0.76, 7.63]
0.001 0.1 1 10 1000Favours immediate Favours conventional

Immediate vs conventional loadingImmediate vs conventional loading implant failuresp
risk ratio risk ratioStudy or SubgroupCannizzaro 2003Chiapasco 2001Donati 2008
log[risk ratio]-1.1
01.43
SE1.6
1.3421.5
Weight10.2%14.5%11.6%
IV, Random, 95% CI0.33 [0.01, 7.66]
1.00 [0.07, 13.88]4.18 [0.22, 79.04]
risk ratio risk ratioIV, Random, 95% CI
Güncü 2008Hall 2006Oh 2006Romeo 2002Schincaglia 2008
0.76730.9951.955
-0.10861 099
1.0931.6451.481.61 6
21.8%9.6%
11.9%10.2%10 2%
[ ]2.15 [0.25, 18.35]2.70 [0.11, 67.98]
7.06 [0.39, 128.48]0.90 [0.04, 20.64]3 00 [0 13 69 06]Schincaglia 2008
Total (95% CI)Heterogeneity: Tau² = 0.00; Chi² = 2.84, df = 7 (P = 0.90); I² = 0%Test for overall effect: Z = 1.27 (P = 0.20)
1.099 1.6 10.2%
100.0%
3.00 [0.13, 69.06]
1.92 [0.70, 5.22]
0.001 0.1 1 10 1000Favours immediate Favours conventionalFavours immediate Favours conventional

I di t ti l l diImmediate vs conventional loading di hi i i l t i l b l l hradiographic peri-implant marginal bone level changes
Study or SubgroupCannizzaro 2003C i 2008
Mean Difference0.020 14
SE0.0470 164
Total1420
Total1320
Weight37.4%13 3%
IV, Random, 95% CI0.02 [-0.07, 0.11]0 14 [ 0 46 0 18]
Immediate loading Conventional loading Mean Difference Mean DifferenceIV, Random, 95% CI
Crespi 2008Güncü 2008Hall 2006Schincaglia 2008Turkyilmaz 2007
-0.14-0.23-0.14-0.43
0
0.1640.14840.568
0.17770.114
2011121410
2011121510
13.3%15.2%1.5%
11.8%20.8%
-0.14 [-0.46, 0.18]-0.23 [-0.52, 0.06]-0.14 [-1.25, 0.97]
-0.43 [-0.78, -0.08]0.00 [-0.22, 0.22]
Total (95% CI)Heterogeneity: Tau² = 0.01; Chi² = 8.57, df = 5 (P = 0.13); I² = 42%Test for overall effect: Z = 1.39 (P = 0.16)
81 81 100.0% -0.10 [-0.24, 0.04]
-2 -1 0 1 2Favours immediate Favours conventional
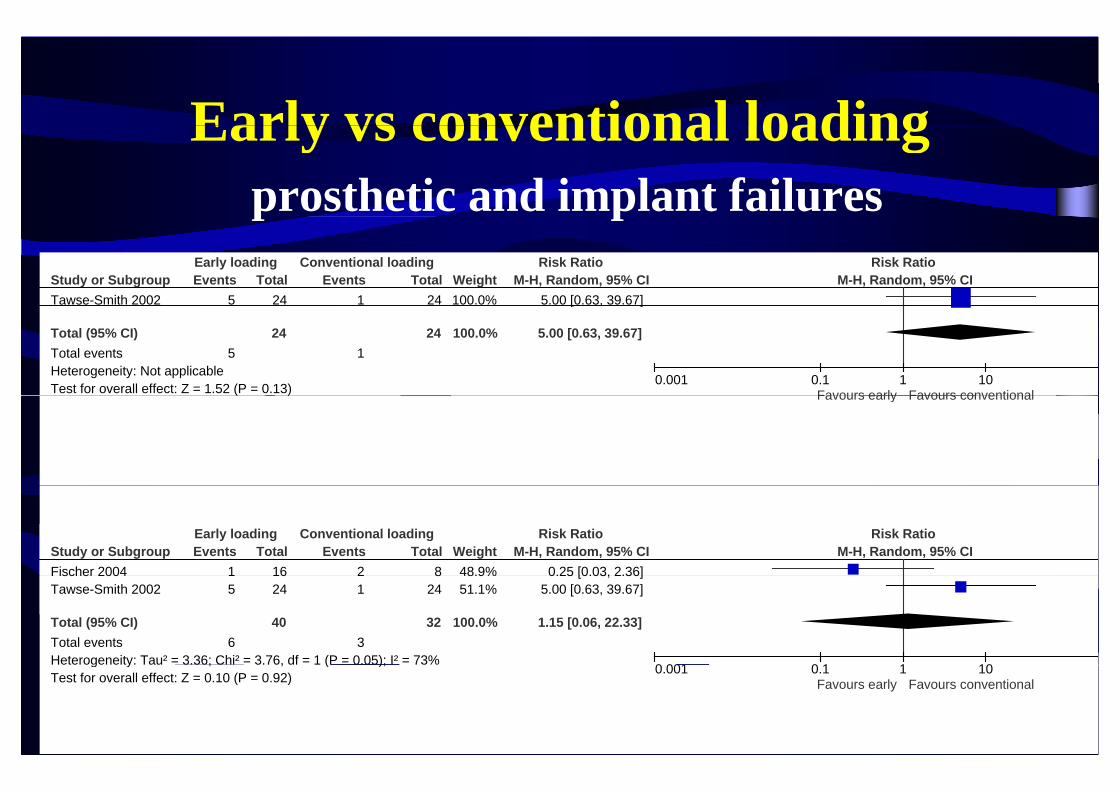
Early vs conventional loadingEarly vs conventional loadingprosthetic and implant failuresp p
Study or SubgroupTawse-Smith 2002
Events5
Total24
Events1
Total24
Weight100.0%
M-H, Random, 95% CI5.00 [0.63, 39.67]
Early loading Conventional loading Risk Ratio Risk RatioM-H, Random, 95% CI
Total (95% CI)Total eventsHeterogeneity: Not applicableTest for overall effect: Z = 1.52 (P = 0.13)
524
124 100.0%
[ , ]
5.00 [0.63, 39.67]
0.001 0.1 1 10Favours early Favours conventional( ) Favours early Favours conventional
Study or SubgroupFischer 2004
Events1
Total16
Events2
Total8
Weight48.9%
M-H, Random, 95% CI0.25 [0.03, 2.36]
Early loading Conventional loading Risk Ratio Risk RatioM-H, Random, 95% CI
Fischer 2004Tawse-Smith 2002
Total (95% CI)Total eventsHeterogeneity: Tau² = 3.36; Chi² = 3.76, df = 1 (P = 0.05); I² = 73%
15
6
1624
40
21
3
824
32
48.9%51.1%
100.0%
0.25 [0.03, 2.36]5.00 [0.63, 39.67]
1.15 [0.06, 22.33]
0 001 0 1 1 10g y ; , ( );
Test for overall effect: Z = 0.10 (P = 0.92)0.001 0.1 1 10
Favours early Favours conventional

Early vs conventional loadingradiographic peri-implant marginal bone level changes

Immediate vs early loadingprosthetic failuresprosthetic failures
Study or Subgroup log[Risk Ratio] SE Total Total Weight IV, Random, 95% CIImmediate Early Risk Ratio Risk Ratio
IV, Random, 95% CICannizzaro 2008aCannizzaro 2008dTestori 2007Zöllner 2008
-1.6090
1.172-0.478
1.51.451.610.63
303025
138
303027
128
11.6%12.4%10.1%65.9%
0.20 [0.01, 3.78]1.00 [0.06, 17.15]3.23 [0.14, 75.76]0.62 [0.18, 2.13]
Total (95% CI)Heterogeneity: Tau² = 0.00; Chi² = 1.69, df = 3 (P = 0.64); I² = 0%Test for overall effect: Z = 0.75 (P = 0.45)
223 215 100.0% 0.68 [0.25, 1.86]
0.001 0.1 1 10Favours immediate Favours early

i iImmediate vs early loadingi l t f ilimplant failures
Study or SubgroupCannizzaro 2008aCannizzaro 2008b
log[Risk Ratio]-1.609-0 693
SE1.51 2
Total3015
Total3015
Weight9.8%
15 4%
IV, Random, 95% CI0.20 [0.01, 3.78]0 50 [0 05 5 25]
Immediate Early Risk Ratio Risk RatioIV, Random, 95% CI
Cannizzaro 2008bCannizzaro 2008dTestori 2007Zöllner 2008
Total (95% CI)
-0.6930
1.172-0.478
1.21.451.610.63
153025
138
238
153027
128
230
15.4%10.5%
8.5%55.7%
100 0%
0.50 [0.05, 5.25]1.00 [0.06, 17.15]3.23 [0.14, 75.76]
0.62 [0.18, 2.13]
0 65 [0 26 1 63]Total (95% CI)Heterogeneity: Tau² = 0.00; Chi² = 1.75, df = 4 (P = 0.78); I² = 0%Test for overall effect: Z = 0.92 (P = 0.36)
238 230 100.0% 0.65 [0.26, 1.63]
0.001 0.1 1 10Favours immediate Favours early

i iImmediate vs early loadingdi hi i i l t i l b l l hradiographic peri-implant marginal bone level changes
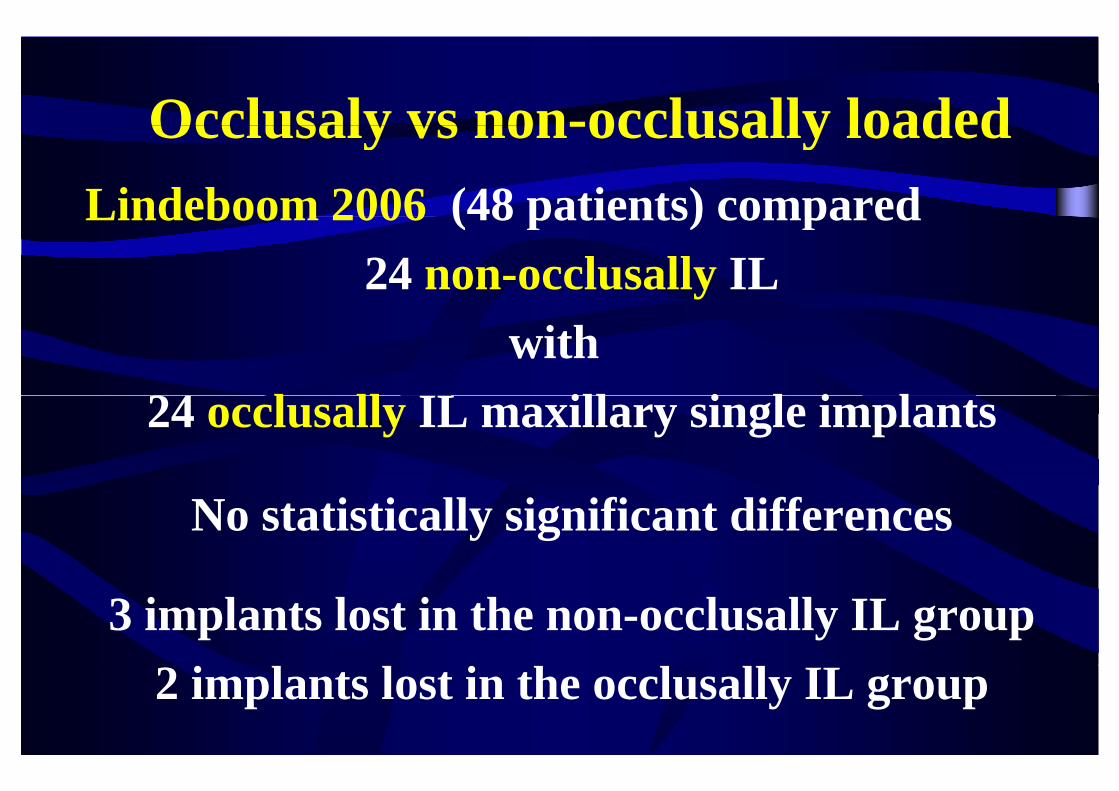
Occlusaly vs non-occlusally loadedOcclusaly vs non-occlusally loadedLindeboom 2006 (48 patients) comparedLindeboom 2006 (48 patients) compared
24 non-occlusally IL with
24 l ll IL ill i l i l24 occlusally IL maxillary single implants
No statistically significant differences
3 implants lost in the non-occlusally IL group2 implants lost in the occlusally IL group

RESULTS
No statistically significant differences
- Slight tendency to have less failures for conventionally loaded implantsconventionally loaded implants
- Slight tendency to have less failures for immediatelySlight tendency to have less failures for immediately than early loaded implants

Ottoni 2005 (CCT split mouth)Ottoni 2005 (CCT split-mouth)Failures of single implants:Failures of single implants:10 out of 23 (44%) immediately non-occlusally loadedy y1 out of 23 (4%) conventionally loaded
For immediate loading a strong correlation g gbetween failures and insertion torque
20 9 f i f 10 iTorque = 20 Ncm: 9 failures out of 10 implantsTorque > 32 Ncm: 1 failure out of 10 implantsTorque > 32 Ncm: 1 failure out of 10 implants

CONCLUSIONSCONCLUSIONS- It is possible to successfully load implants immediately p y p yor early in selected patients, though not all clinicians were able to achieve optimal resultswere able to achieve optimal results
- High insertion torque values (above 30 Ncm) seem toHigh insertion torque values (above 30 Ncm) seem to be a prerequisite for implant success
- If it is decided to load the implants early, it might be better to do it immediately (within 1 week)better to do it immediately (within 1 week)
Examples of clinical trials on immediate versus early loading

Immediate vs early loadingImmediate vs early loadingTestori JOMI 2007 – Galli COIR 2008 – Capelli 2010
Aims: to compare non-occlusal immediate vs early (2 months) l di i ti l d t li ( lti t RCT)loading in partial edentulism (multicenter RCT)Outcome measures:- Failure of the prosthesis - Failure of the implantFailure of the implant- Any complications
R di hi i l b l l h (bli d t)2010; 3: 209-219
- Radiographic marginal bone level changes (blind assessment)- Peri-implant soft tissues level changes (blind assessment)

Materials and methodsMaterials and methods• Osseotite tapered FNT implants (Biomet 3i)Osseotite tapered FNT implants (Biomet 3i)
• To be immediately loaded:• To be immediately loaded: – single implants insertion torque > 30 Ncm – splinted implants insertion torque > 20 Ncm
2 th ft i l t l t f ll l di• 2 months after implant placement full occluding provisional restorations were provided
• Follow-up 5 years

Immediate non-occlusal loadingg

ResultsImmediate (n=25) Early (n=27)
lFemales 12 17Mean age at implant insertion (range) 51.6 (27-74) 51.3 (34-73)S k 9 4Smokers 9 4Total number of inserted implants 52 52Implants inserted in mandibles 38 21Implants inserted in mandibles 38 21Implants inserted in anterior areas (canine to canine) 3 3Implants inserted in fresh extraction sockets 6 9 (1 grafted)Implants inserted in fresh extraction sockets 6 9 (1 grafted)Number of patients receiving 1 implant 7 10Number of patients receiving 2 implants 10 9p g pNumber of patients receiving 3 implants 7 8
Number of patients receiving 4 implants 1 0p g p

ResultsResultsTactile bone density Immediate (n=52) Early (n=52)
dHard 1 2Medium 43 40Soft 8 10
Insertion torque Immediate (n=52) Early (n=52)20 N 3 420 Ncm 3 430 Ncm 6 1440 Ncm 18 2050 Ncm 22 1450 Ncm 22 1460 Ncm 3 0

ResultsResults1 drop-out (EL) moved after 1 year
1 single implant failed (IM) 2 months after placement
1 complication (EL): iatrogenic peri-implantitis
No statistically differences between the 2 proceduresNo statistically differences between the 2 procedures

Iatrogenic peri-implantitis (EL)Iatrogenic peri implantitis (EL) detected 33 months after loading
Bio-Oss + BioGide At suture removal After 2 year (5th year after loading)y ( y g)

Radiographic resultsRadiographic resultsBaseline 2 months* 14 months* 60 months*
N Mean (SD) N Mean (SD) N Mean (SD)Immediate 25 0.03 (0.09) 25 0.56 (0.50) 24 1.14 (0.58)
N Mean (SD)
24 1.18 (0.56)loading
( ) ( ) ( )
E l l di 27 0 07 (0 16) 27 0 67 (0 47) 27 1 18 (0 54)
( )
26 1 28 (0 50)Early loading 27 0.07 (0.16) 27 0.67 (0.47) 27 1.18 (0.54) 26 1.28 (0.50)
*All changes from baseline statistically different (p<0.001)(p )
No significant differences between groups
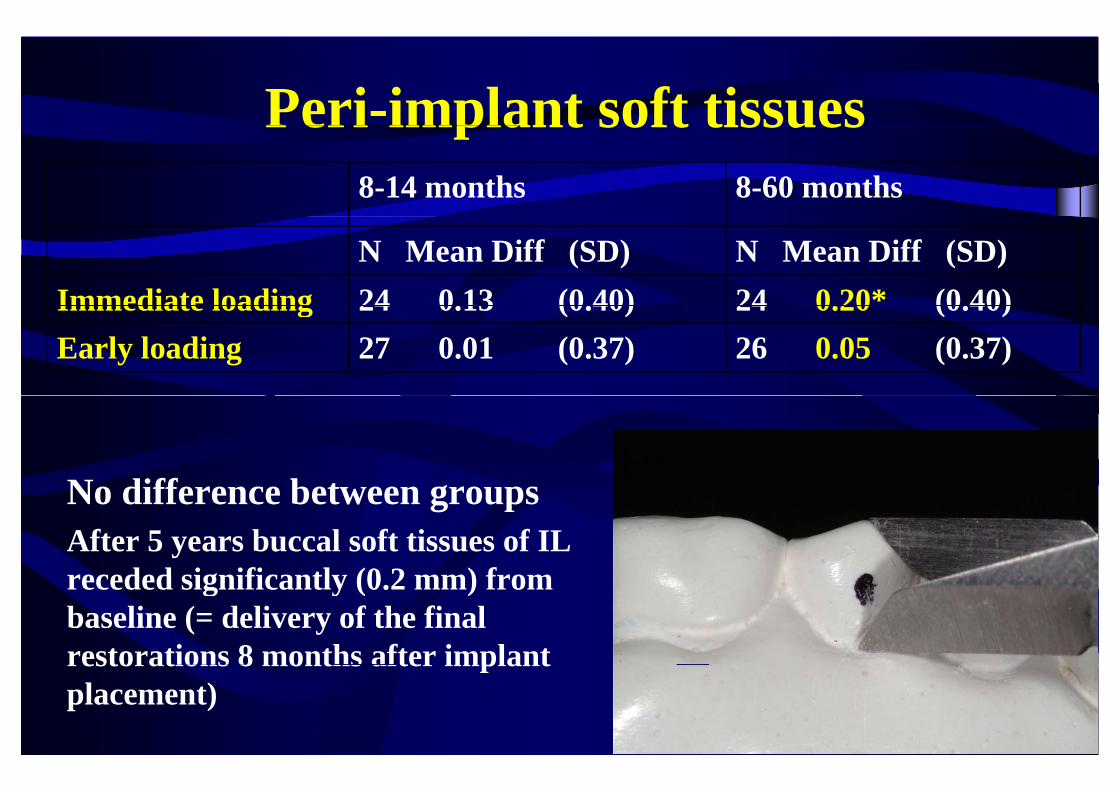
Peri-implant soft tissuesPeri implant soft tissues8-14 months 8-60 months
N Mean Diff (SD) N Mean Diff (SD)Immediate loading 24 0.13 (0.40) 24 0.20* (0.40)Immediate loading 24 0.13 (0.40) 24 0.20 (0.40)Early loading 27 0.01 (0.37) 26 0.05 (0.37)
N diff b tNo difference between groupsAfter 5 years buccal soft tissues of IL receded significantly (0 2 mm) fromreceded significantly (0.2 mm) from baseline (= delivery of the final restorations 8 months after implantrestorations 8 months after implant placement)

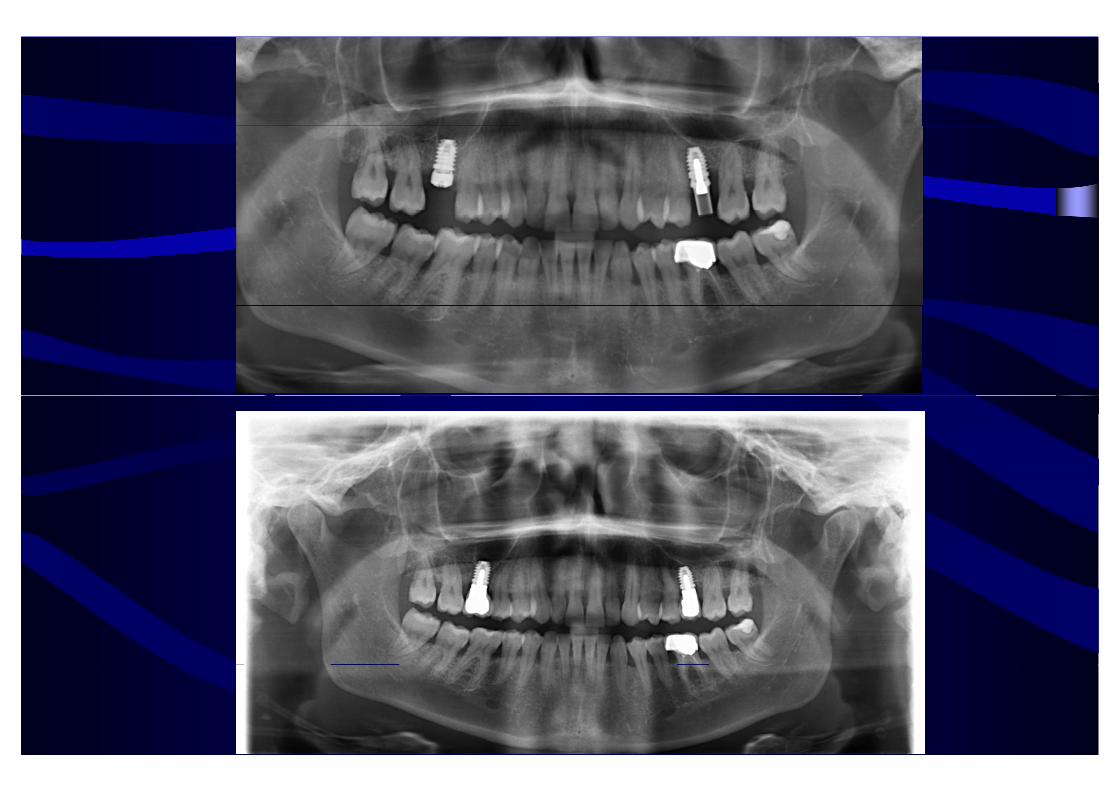
Immediate vs early loading of 7 mm long implantsCannizzaro 2008: 1: 127-139
Aims: to compare immediate vs early loaded (6 weeks) 7 mm longAims: to compare immediate vs early loaded (6 weeks) 7 mm long single implants placed flapless (split-mouth RCT)
Outcome measures:F il f th /i l t (bli d t)- Failure of the crown/implant (blind assessment)
- Any complications- Radiographic marginal bone level changes (blind assessment)- Patient preferencePatient preference

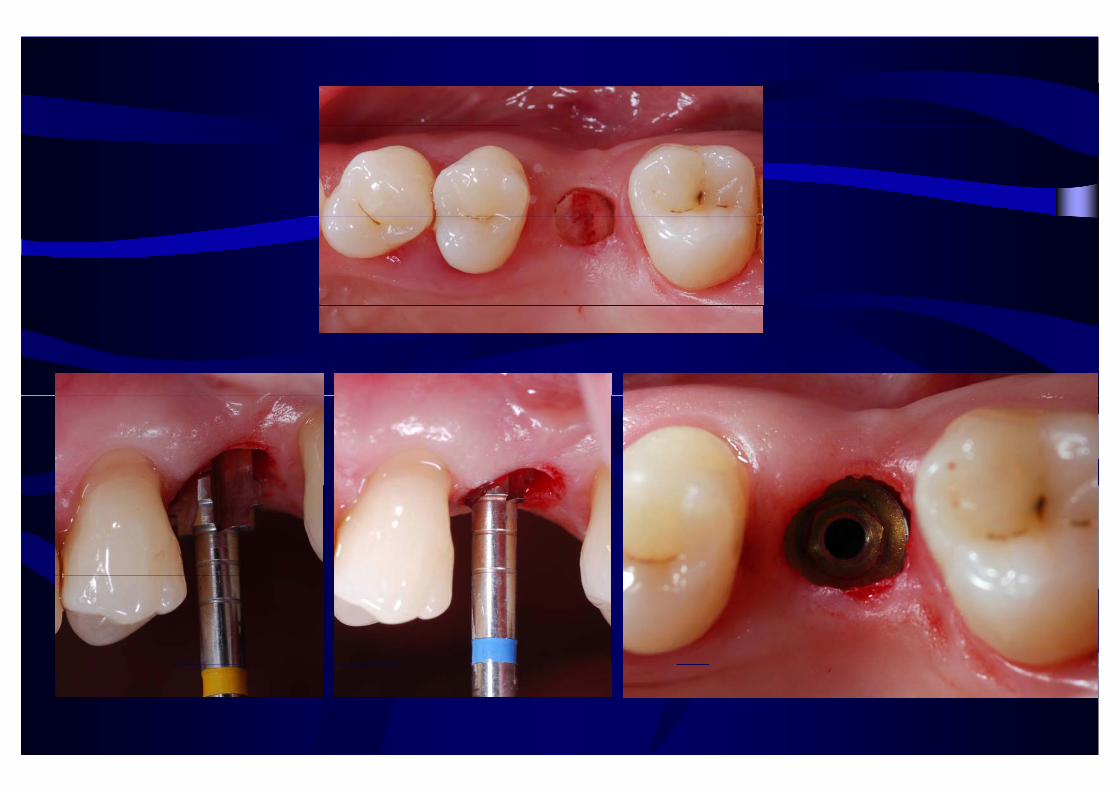
Materials and methods
• Biomet 3i 7 mm Nanotite• Biomet 3i 7 mm Nanotiteparallel walled implantswith external connection
• Sites prepared with conical drills
• To be immediately loaded: insertion torque > 40 Ncm
• Follow-up: 9 months

Drill sequence to place a 5 mm diameter implantDrill sequence to place a 5 mm diameter implant
HARDBONE
high
MEDIUM QUALITY BONE
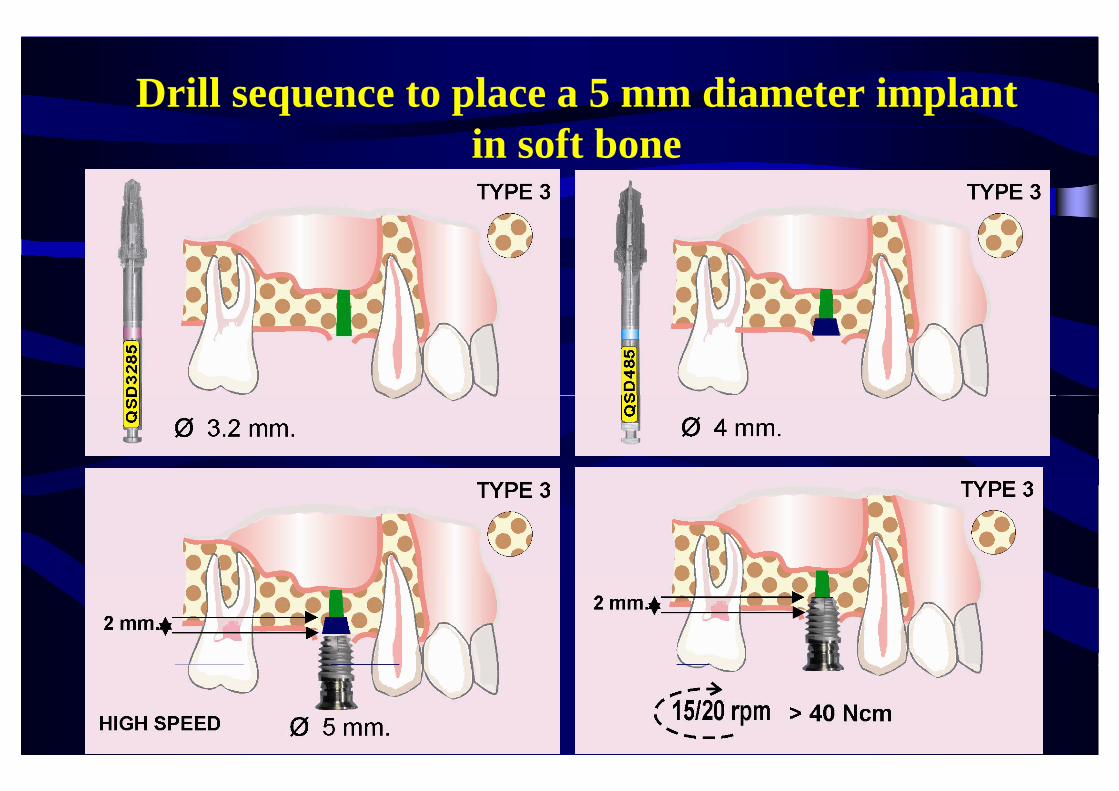
Drill sequence to place a 5 mm diameter implantin soft bone

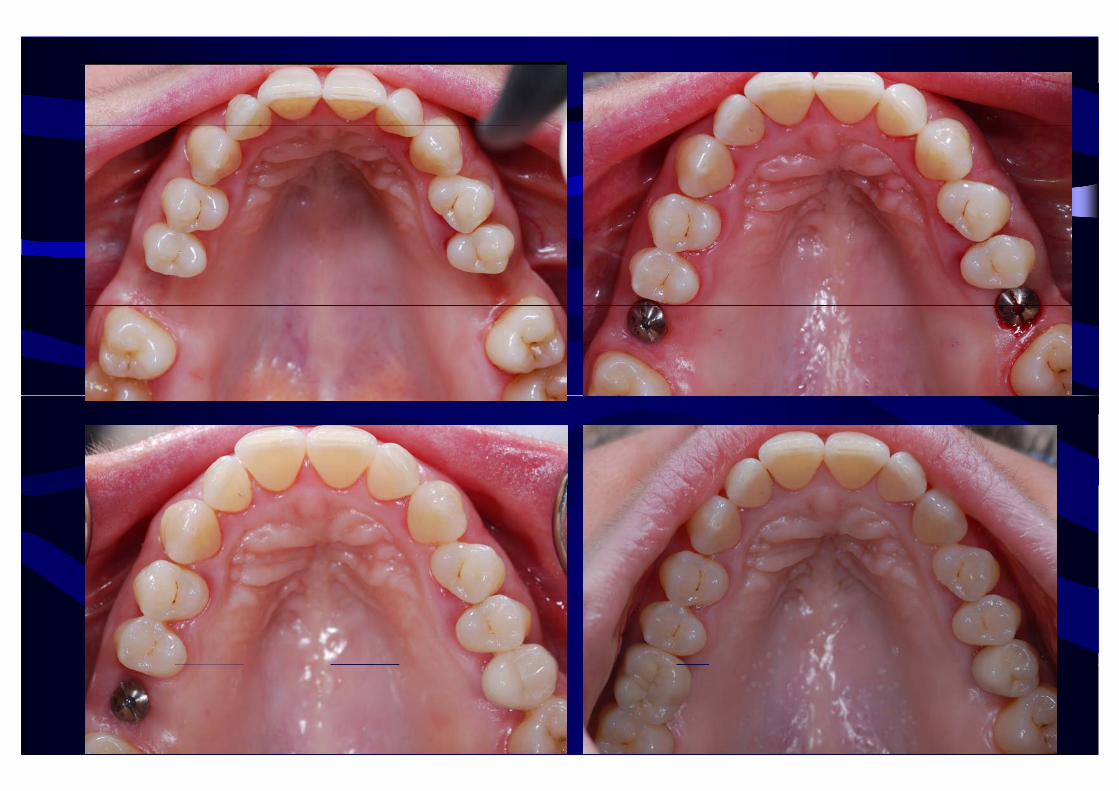


Immediate EarlyTotal number of inserted implants 29 31pNumber of implants inserted in maxilla 17 (56.7%) 16 (53.3%)Implants inserted in fresh extraction sockets 9 (30%) 9 (30%)Number of elevated flaps 8 (26.7%) 5 (16.7%)Number of implants placed originally with less than 40 Ncm 7 (23.3%) 4 (13.3%)
Sites receiving 4 mm diameter implants 8 (26.7%) 12 (40%)Sites receiving 5 mm diameter implants 13 (43.3%) 12 (40%)Sites receiving 6 mm diameter implants 9 (30%) 6 (20%)Implants in incisor sites 2 (6.7%) 1 (3.3%)I l i i i 2 (6 7%) 2 (6 7%)Implants in canine sites 2 (6.7%) 2 (6.7%)Implants in premolar sites 11 (36.7%) 14 (46.7%)Implants in molar sites 15 (50%) 13 (43 3%)Implants in molar sites 15 (50%) 13 (43.3%)Number of implants placed in hard bone quality 9 (30%) 9 (30%)Number of implants placed in medium bone quality 16 (53 3%) 18 (60%)Number of implants placed in medium bone quality 16 (53.3%) 18 (60%)Number of implants placed in soft bone quality 5 (16.7%) 3 (10%)

ResultsResults13 flaps had to be elevated13 flaps had to be elevated
11 i l t did t h l d i ti t11 implants did not reach planned insertion torque: 8 immediately replaced by larger ones2 loaded anyway1, randomised to IL, was early loaded instead1, randomised to IL, was early loaded instead
No drop-outNo drop out
One implant failed in each groupOne implant failed in each group

N i i ll diff b h 2 dNo statistically differences between the 2 proceduresComplication type Immediate (n = 30) Early (n = 30)Complication type Immediate (n 30) Early (n 30)
Peri-implant soft tissue complication 1 0
Peri-implantitis 1 2
Repeated crown dis-cementation (new crown) 1 0
Fracture of the ceramic of definitive crown* 1 0
Patient unsatisfied with esthetic (new crown) 1 0( )
Improper contact points* (crown adjustment) 0 2
T t l b f li ti 5 4Total number of complications 5 4
*One patient experienced 1 complication at both implants O e pat e t e pe e ced co p cat o at bot p a tsAll complications were successfully treated
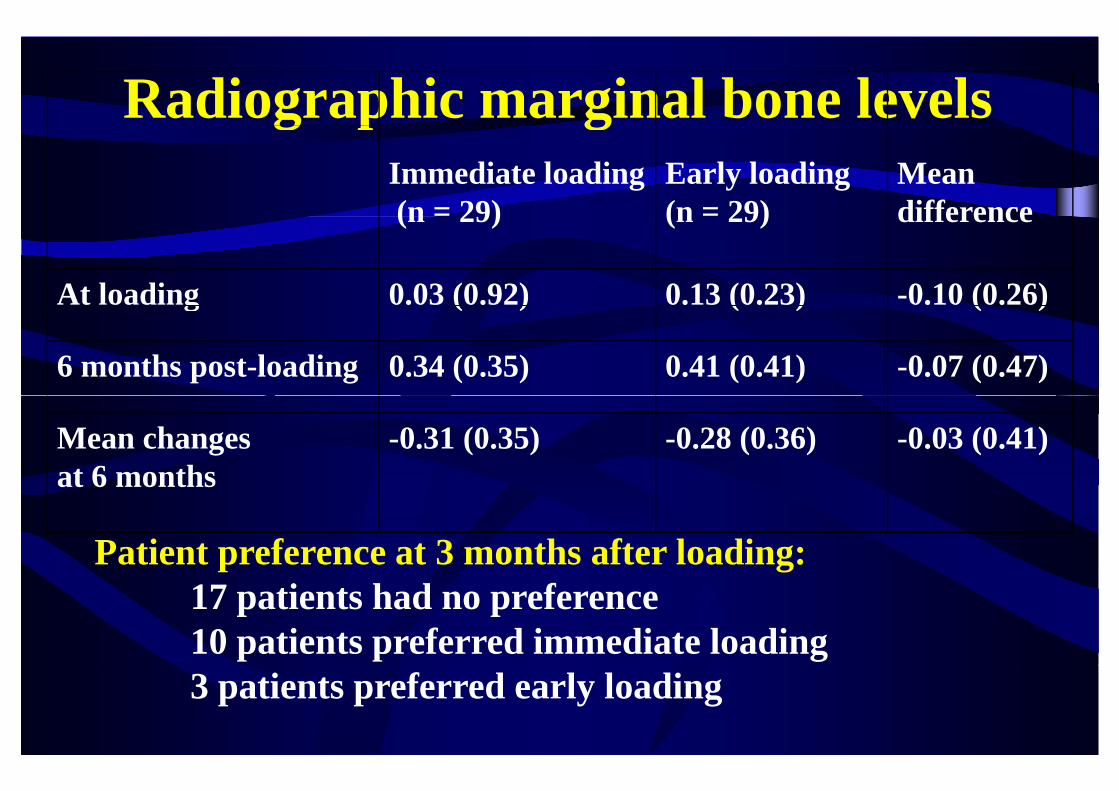
Radiographic marginal bone levelsg p gImmediate loading(n = 29)
Early loading(n = 29)
Meandifference(n 29) (n 29) difference
At loading 0.03 (0.92) 0.13 (0.23) -0.10 (0.26)g ( ) ( ) ( )
6 months post-loading 0.34 (0.35) 0.41 (0.41) -0.07 (0.47)
Mean changes at 6 months
-0.31 (0.35) -0.28 (0.36) -0.03 (0.41) at 6 months
Patient preference at 3 months after loading: 17 patients had no preference10 patients preferred immediate loading3 patients preferred early loading

CONCLUSIONSCONCLUSIONSNo differences in success and stability of peri-implant tissues when loading implantsimplant tissues when loading implants immediately or early
Even 7 mm short implants can be loaded immediately when inserted with high torqueimmediately when inserted with high torque
Wh loading implants earl then?Why loading implants early then?

CLINICAL QUESTIONCLINICAL QUESTIONIn atrophic jaws is better to use
i ( 8 )short implants (5-8 mm) or augmenting to insert longeraugmenting to insert longer implants?
Mandibles: 3 RTCsMandibles: 3 RTCsMaxillas: 2 RTCs

MANDIBULAR ATROPHY IN EDENTULOUS PATIENTS
Mobile prosthesis
Mobile prosthesis
Fixedprosthesis
Fixedprosthesis
How can we place implants in this patient?How can we place implants in this patient?
Bone augmentation proceduresBone augmentation procedures Short implantsShort implants
Esposito, Grusovin, Felice, Karatzopoulos Worthington CoulthardKaratzopoulos, Worthington, CoulthardInterventions for replacing missing teeth: p g ghorizontal and vertical bone augmentation
techniques for dental implant treatmenttechniques for dental implant treatment
The Cochrane Library 2009 issue 4The Cochrane Library 2009, issue 4
Last literature search: June 2009Last literature search: June 2009
2009; 2: 167-184

Stellingsma 2003Stellingsma 2003mandibles of 6-12 mm height - 2 year follow-up
• 20 patients: “sandwich” graft from iliac crest + 4 implants > 11 mm long• 20 patients: 4 short implants (8-11 mm)• 20 patients: Bosker staple plate (intervention of no interest)

2009: 2: 7-20Felice 2009-2010
7 mm long implants versus longer implants in vertically7 mm long implants versus longer implants in vertically augmented posterior mandibles
Outcome measures (assessed blindly):- Failure of the prosthesis - Failure of the implant- Any complicationsAny complications- Time needed to fully recover mental nerve sensitivity
M i l b l l h- Marginal bone level changes
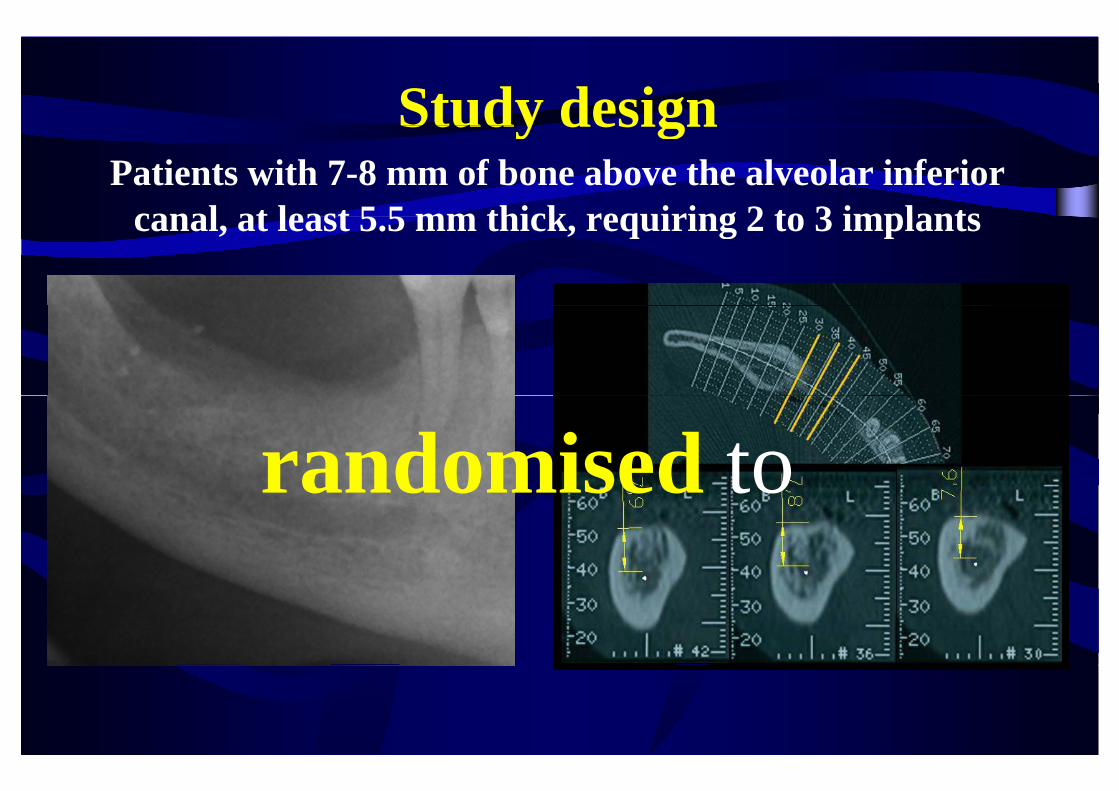
Study designStudy designPatients with 7-8 mm of bone above the alveolar inferior
canal at least 5 5 mm thick requiring 2 to 3 implantscanal, at least 5.5 mm thick, requiring 2 to 3 implants
randomised torandomised to

Felice 2009-2010
7 mm long implants 10 mm or longer implants after vertical augmentationafter vertical augmentation with Bio-Oss blocks
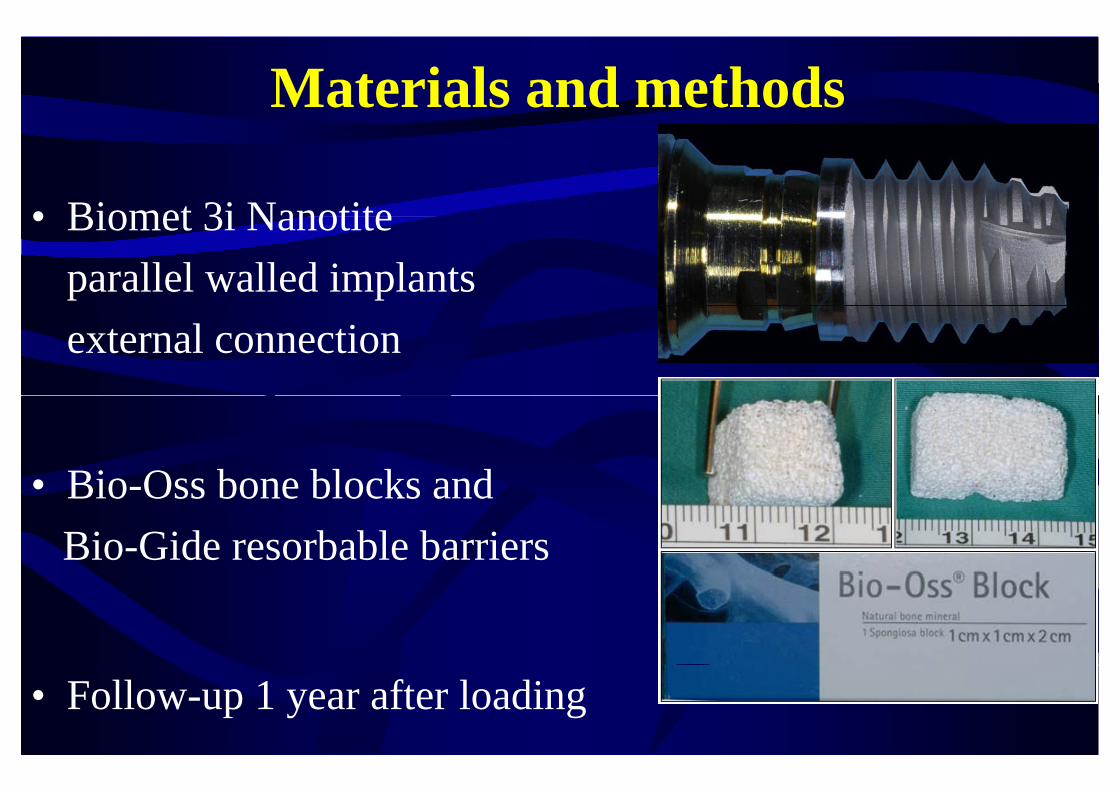
Materials and methods
• Biomet 3i Nanotite• Biomet 3i Nanotiteparallel walled implantsexternal connection
• Bio Oss bone blocks and• Bio-Oss bone blocks andBio-Gide resorbable barriers
• Follow-up 1 year after loading
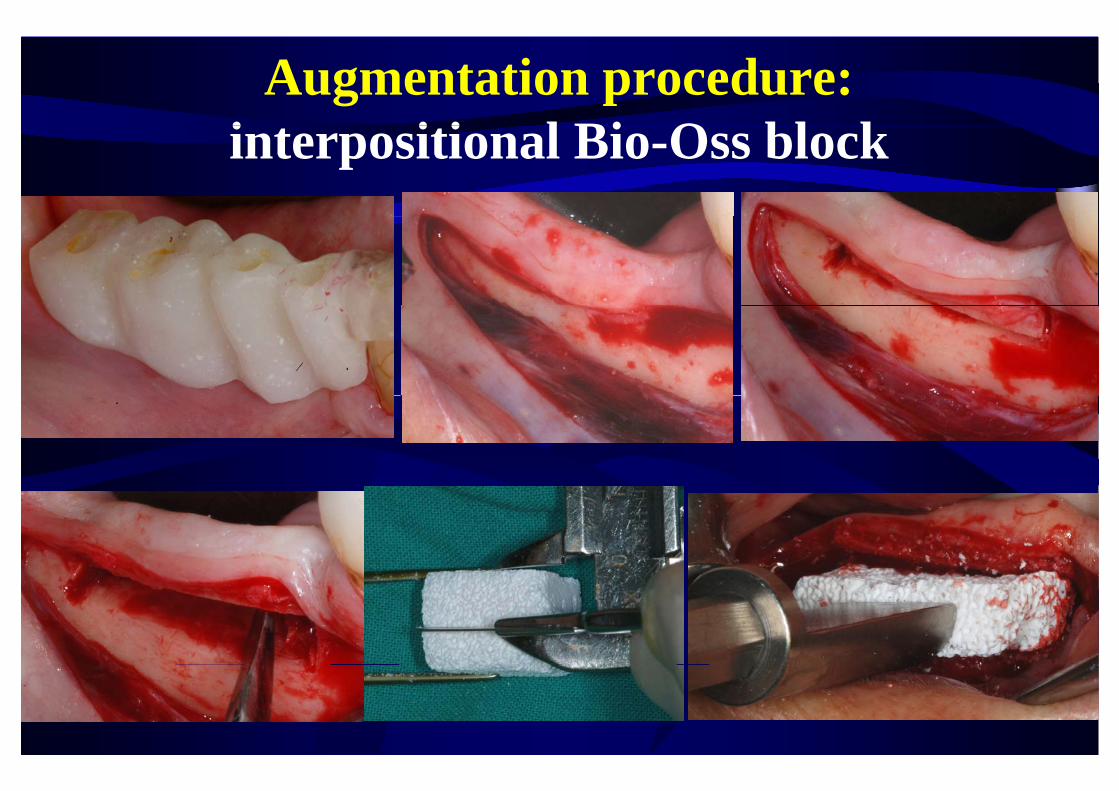
Augmentation procedure: i t iti l Bi O bl kinterpositional Bio-Oss block

Interpositional Bio-Oss blocksInterpositional Bio Oss blocks
10 mm or longer implants psubmerged for 4 months
After 5 months

Prosthetic procedurespProvisional acrylic bridges replaced by definitive ones after 4 months

Patient and intervention characteristics
Augmented (n=30) Short implants (n=30)
Females 15 23
M t i l t i ti ( ) 55 (43 67) 56 (40 83)Mean age at implant insertion (range) 55 (43-67) 56 (40-83)
Smokers 11 light 11 light + 1 heavy
Total number of inserted implants 61 60
Number of implants placed < 25 Ncm torque 12 (6 patients) 4 (2 patients)Number of implants placed 25 Ncm torque 12 (6 patients) 4 (2 patients)
Mean length of placed implants 11.2 mm 7 mm

ResultsResults1 drop-out (short implant group)
Bio-Oss blocks fractured at placement in 3 patientsp pNo augmentation obtained in 2
Most of the short implants (26 patients) become exposedMost of the short implants (26 patients) become exposed during the submerged phase since placed supracrestally
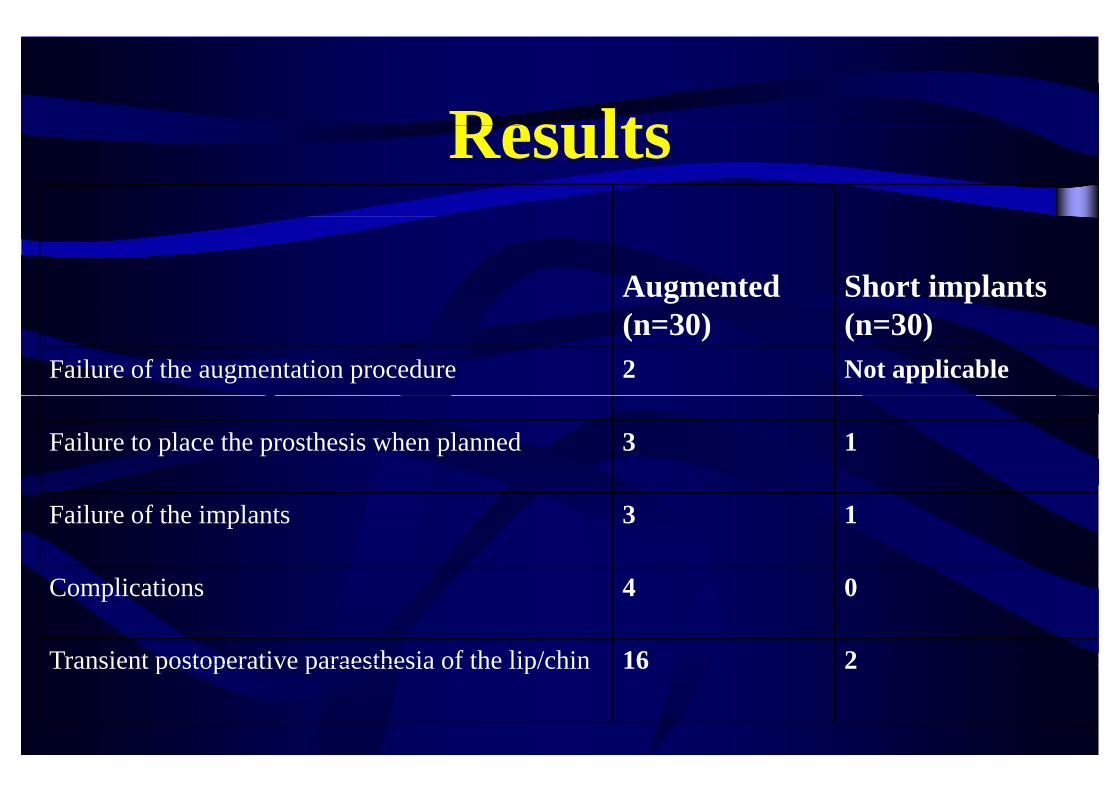
ResultsResults
Augmented Short implants(n=30) (n=30)
Failure of the augmentation procedure 2 Not applicable
Failure to place the prosthesis when planned 3 1
Failure of the implants 3 1
Complications 4 0
Transient postoperative paraesthesia of the lip/chin 16 2Transient postoperative paraesthesia of the lip/chin 16 2

ResultsResults• No permanent paraesthesia of the alveolar inferiorNo permanent paraesthesia of the alveolar inferior
nerve
• 28/30 patients with short implants (93%) had not i i d l l i f i iti itimpaired alveolar inferior nerve sensitivity versus 14/30 in the augmented group (43%)
• Patients subjected to vertical augmentation• Patients subjected to vertical augmentation recovered full mental nerve sensitivity significantly l h h d i h h i llater than those treated with short implants

Augmentation complicationsAugmentation complications• 4 dehiscence occurred during graft healingg g g
– 1 healed after resuturing2 i t d ith ti l l f th ft (1 i l t f il d)– 2 associated with partial loss of the graft (1 implant failed)
Dehiscence at implant placement, the site was infected

RESULTS: mean peri implant bone levelsRESULTS: mean peri-implant bone levels
Implantplacement
Loading 1 year after loading
Short implants 0.79 mm 1.37 mm 1.79 mm
Long implants 0.65 mm 1.21 mm 1.65 mm
Significant bone loss from baseline (1 mm)No differences between groups

Study or Subgroup1.1.1 Prosthetic failureFelice 2009aStellingsma 2003Subtotal (95% CI)
Events
31
Total
301949
Events
10
Total
301949
Weight
57.5%42.5%
100.0%
M-H, Random, 95% CI
3.22 [0.32, 32.89]3.16 [0.12, 82.64]3.20 [0.48, 21.25]
Bone grafts Short implants Odds Ratio Odds RatioM-H, Random, 95% CI
META-ANALYSISinlay grafting Total events
Heterogeneity: Tau² = 0.00; Chi² = 0.00, df = 1 (P = 0.99); I² = 0%Test for overall effect: Z = 1.21 (P = 0.23)
1.1.2 Implant failureFelice 2009aSt lli 2003
4
35
3019
1
10
3019
55.2%44 8%
3.22 [0.32, 32.89]14 79 [0 76 289 43]
inlay grafting vs
short implantsMore
f il
Stellingsma 2003Subtotal (95% CI)Total eventsHeterogeneity: Tau² = 0.00; Chi² = 0.65, df = 1 (P = 0.42); I² = 0%Test for overall effect: Z = 1.87 (P = 0.06)
1 1 3 Major complications
5
8
1949
0
1
1949
44.8%100.0%
14.79 [0.76, 289.43]5.74 [0.92, 35.82]
short implants
- failures- complications(i l di 1
1.1.3 Major complicationsFelice 2009aStellingsma 2003Subtotal (95% CI)Total eventsHeterogeneity: Tau² = 0.00; Chi² = 0.33, df = 1 (P = 0.57); I² = 0%Test for overall effect: Z = 2.09 (P = 0.04)
46
10
302050
02
2
302050
40.7%59.3%
100.0%
10.36 [0.53, 201.45]3.86 [0.67, 22.11]4.97 [1.10, 22.40]
(including 1 potentially lethal sublingual
)
Test for overall effect: Z 2.09 (P 0.04)
1.1.4 Experienced the operation negativelyStellingsma 2003Subtotal (95% CI)Total eventsHeterogeneity: Not applicable
10
10
2020
5
5
2020
100.0%100.0%
3.00 [0.79, 11.44]3.00 [0.79, 11.44]
haemorrage)- pain
t
Test for overall effect: Z = 1.61 (P = 0.11)
1.1.5 Severe pain for > 1 weekStellingsma 2003Subtotal (95% CI)Total events
17
17
2020
4
4
2020
100.0%100.0%
22.67 [4.37, 117.47]22.67 [4.37, 117.47]
- costs- timeif fti
Heterogeneity: Not applicableTest for overall effect: Z = 3.72 (P = 0.0002)
1.1.6 No improvement of facial appearance (3 weeks)Stellingsma 2003Subtotal (95% CI)Total events
6
6
2020
16
16
2020
100.0%100.0%
0.11 [0.03, 0.46]0.11 [0.03, 0.46]
if grafting Total eventsHeterogeneity: Not applicableTest for overall effect: Z = 3.01 (P = 0.003)
6 16
0.001 0.1 1 10 1000Favours bone grafts Favours short implants

What does it happen using evenWhat does it happen using even shorter implants?shorter implants?

Felice, Checchi, Pistilli, Scarano, Pellegrino, Esposito; 2009; 2: 267-281
Esposito, Pistilli, Pellegrino, Felice Rehabilitation of posterior atrophic edentulous
jaws: prostheses supported by 5 mm short implants or by longer implants in augmented bone? One-
year results from a pilot randomized clinical trialy psubmitted

15 patients with posterior bilateral mandibular edentulism with 5-7 mm of bone over the mandibular canal at least 8 mm tick5-7 mm of bone over the mandibular canal, at least 8 mm tick

1 to 3 implants per side (split-mouth)p p ( p )Follow-up: 1 year after loading
Short implants (5x6 mm) versus implants > 10 mm in bone augmented with interpositional Bio-Oss blocks
1 implant failure (augmented side)1 complication in each group1 complication in each groupStatistically > transient paresthesiae at augmented sides (10 vs 3)

What about the maxilla?E i G i R K l
What about the maxilla?Esposito, Grusovin, Rees, Karasoulos, Felice, Alissa, Worthington, CoulthardFelice, Alissa, Worthington, Coulthard
Interventions for replacing missing teeth: augmentation procedures of the
maxillary sinusmaxillary sinusThe Cochrane Library 2010, issue 3
Last literature search: January 2010
2010: 3: 7-26

C i F li L Vi l E iCannizzaro, Felice, Leone, Viola, EspositoEarly loading of hydroxyapatite coated implants inEarly loading of hydroxyapatite coated implants in
the atrophic posterior maxilla: lateral sinus lift with t b d Bi O t l i iautogenous bone and Bio-Oss versus crestal mini-sinus lift and 8 mm implants. A randomized
controlled clinical trial2009; 2: 25-382009; 2: 25-38

Cannizzaro 2009: 3-6 mm sinus floor height40 patients (20 in each group) early loading (45 days)1 year follow-up after loading
8 mm long implants8 mm long implantscrestal sinus lifta togeno s bone versus
10-16 mm long implants1-stage lateral window sinus lift
50% Bio Oss 50% boneautogenous bone versus 50% Bio-Oss - 50% bone
No significant differencesg- 5 failed implants in lateral approach (2 sinus infections = 4 implants lost)- 1 failed implant in crestal approach

What does it happen using evenWhat does it happen using even shorter implants?shorter implants?

Felice, Checchi, Pistilli, Scarano, Pellegrino, Esposito; 2009; 2: 267-281
Esposito, Pistilli, Pellegrino, Felice Rehabilitation of posterior atrophic edentulous
jaws: prostheses supported by 5 mm short implants or by longer implants in augmented bone? One-
year results from a pilot randomized clinical trialy psubmitted
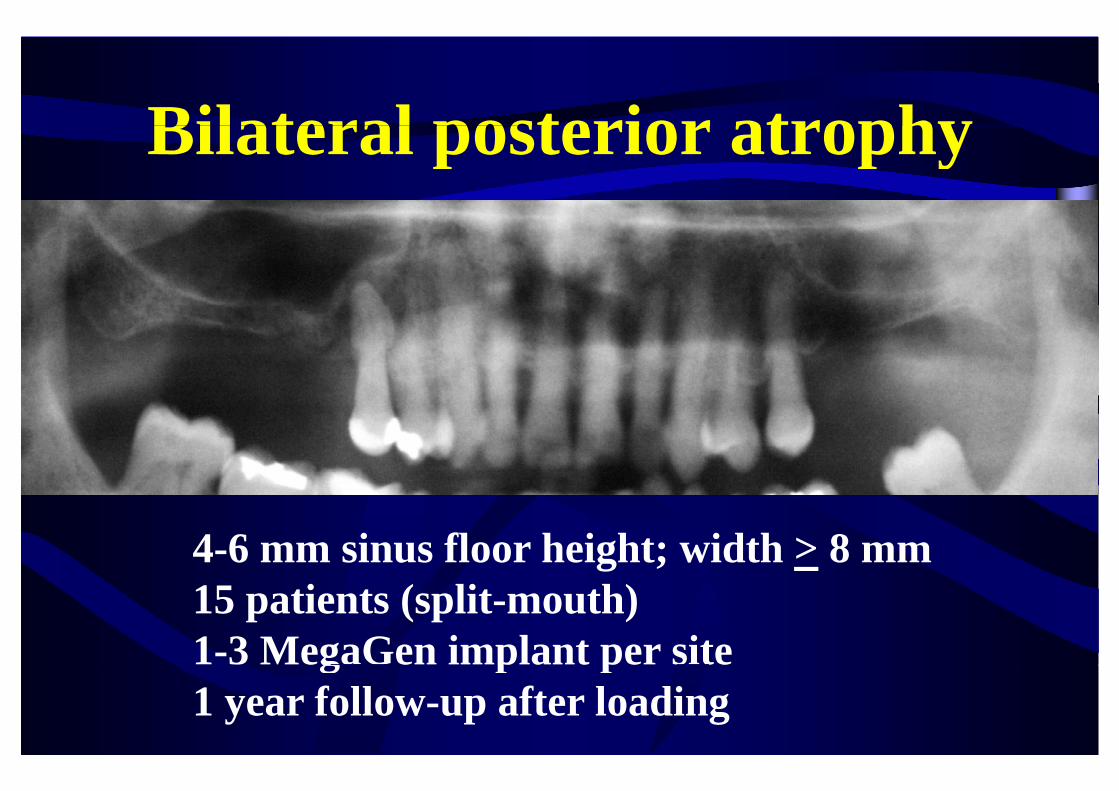
Bilateral posterior atrophyBilateral posterior atrophy
4-6 mm sinus floor height; width > 8 mm15 patients (split-mouth) 1-3 MegaGen implant per site3 eg Ge p pe s e1 year follow-up after loading

5x6 mm implants versus lateral 2-stage sinus lift with Bio-Oss & implants > 10x4 mmBio-Oss & implants > 10x4 mm
One failed implant per group – no significant difference for complications

RESULTS at 1 year after loading peri-implant mean marginal bone levels
mandible + maxillaImplant insertion
Loading 1 y after loadinginsertion loading
5 mm short implants 0.33 mm 0.55 mm 1.30 mm
Long implants 0.32 mm 0.56 mm 1.48 mm
Significant bone loss from baseline: - 1 mm (short implants)- 1 mm (short implants) - 1.2 mm (long implants)
0 2 b l t l i l ( i ifi )0.2 mm more bone loss at long implants (significant)

ConclusionsMandibles: in 5-8 mm bone height, 5-7 mm short implants provided better results at 1 year than vertical augmentation with interpositional blocks to insertaugmentation with interpositional blocks to insert implants at least 10 mm long
Maxillae: yet insufficient data, though 5-8 mm short i l t t id d h t t ltimplants seem to provide good short-term results
Crestal sinus lift techniques ought to investigated in more detailsmore details
