imiiiiiiliiiiiiiiiiidiiiiiiiiiiiiiiiiii - nasa preburner performance data - platelet injector gas...
TRANSCRIPT

IMIIIIIILIIIIIIIIIIIDIIIIIIIIIIIIIIIIIIN8224353
l
TESTING OF FUEL/OXIDIZER-RICH,HIGH-PRESSUREPREBURNERS
AEROJET LIQUID ROCKET CO.
SACRAMENTO, CA
MAY 1982
https://ntrs.nasa.gov/search.jsp?R=19820016477 2018-06-16T18:12:15+00:00Z


12.
qeDo_ t No.
NASA CR-165609
Tree _'_d ._,Jbt_tle
TESTING OF FUEL/OXI DI ZER- RIC_,
HIGH-PRESSURE PREBURNERS
_,_forming Organization Nan'wr and ,.:_ddress
Aerojet Liquid Rocket Coni)any
P.O. Box 13222
Sacramento, Cal i forni a 9581 3
SDonIoring Agency Nlme |_d Address
National Aeroneutics and Space Admi ni stration
Washington, D.C. 20546
3. Recioient's Catalog No.)
S Reoort [:)ate 1
May 1982
6. Performing Org,11n_zlzion Code
8. Performing Oroj_n,(at;on ,_e_or( NO i
10 Work Unit No,
11. Controct or Grant NO.
NAS 3-22647
13. Tyoe of ReDori ,rod Period Covered
I ontractor RePort, Final
14. Sl:x)nso_*ng A(_ncy Code
2. Government Accmion No.
15. _DD4ementlry Notes
Project Manager, H. Price
N6A-L_is Research Center
Cleveland, Ohio 44135
, , , , , |
16. A_tr_'_
This report presents the results of an evaluation of high-pressure cor_bustion of fuel-rich
and oxidizer-rich LOX/RP-I propellants using 4.O-inch-diameter prototxpe preburner injectors
and chambers. Testing covered a pressure range from 8.9 to 17.5 MN/mZ (1292 to 2540 psia).
Fuel-rich ¢ixture ratios ran.oe.d from 0.238 to 0.367; oxidizer-rich mixture ratios ranged from
27.2 tO 47.5.
Presented are performance, gas temoerature uniformity, and stability data for two fuel-rich
and two oxidizer-rich I)reburner injectors: _ conventional like-on-like (LOL) design; the other
a olaCelet design injector.
Kinetically limited combustion is shown by the excellent agreement of measured fuel-rich
gas corr_osition and C* performance data with kinetic model predictions. The oxidizer-rlch
test results support previous equilibrium, co_ustion predictions.
1"2. K_ Word- (Sugg_t_ by Author(s))
LOX/RP-I; LOX-Rich; RP-I-Rlch; Fuel-Rich
Kinetics ; Oreburners ; Gas Comoosl tion;
Combustion; High Pressure.
18. Distribution Stateme_l.
Unclassified- Unlimited
lg. F_cutitV Oauif. (of this re_l)
Unclassi fled 20. ,_,¢L_rity Cla_f. (o( this 9aOe)Uncl assi fled
21, No. of Pa_ 22, P,*ce"
243
• For sale by the Nahonal Technical InformationService Spr_n_held. V_r_)n_a22161
NASA-C-IF_ (Ray. 10-75)


FOREWORD
This final report, submitted in fulfillment of Contract NAS 3-22647,document the results of hiqh-pressure testing of fuel-rich and oxidizer-richpreburners using LOX/RP-I propellants. Presented are fuel-rich test data forchamber pressures from 8.9 to 17.5 MN/m 2 (1292 to 2540 psia) and mixture
ratios from 0.238 to 0.367, oxidizer-rich test data for chamber pressures from
12.7 to 17.2 MN/m2 (1844 to 2497 psia)and mixture ratios from 27.2 to 47.5.
The NASA-Lewis Research Center project manager was H. Price. R.L.
Friedman was the ALRC program manager, and B. R. Lawver was the ALRC project
engineer.
Precedingpageblank iii t


'..
/
I •
II.
III.
IV.
TABLE OF CONTENTS
Introduction
A. Background
B. Program Scope
Summary
Conclusions and Recommendations
Technical Discussion
A. Hot-Fire Testing
I.
2.
3.
v- •
Be
CI
De
Test Conditions and Logic .:"
Test Hardware ,:/:,o
Test Facility ,t.o
4. Instrumentatioi_::and Measurement Methods
Test Results _":
1. Fuel-Rich Testing
2. Oxidizer-Rich Testing
Data Analysis
i. Fuel-Rich Preburner Data Analysis
2. Oxidizer-Rich Preburner Data Analysis
Fuel-Rich Model Description
la
2.
o
4.
FRCM Model Description
Comparison of Original Predictions to
Experimental Resul ts
Model Modification
New Model Predictions
References
r
Page
I
1
I
3
7
9
9
9
14
25
29
36
36
114
169
175
208
214
214
218
224
230
243
\
PrecedinEpage blank


Table No.
I
II
III
IV
V
VI
Vll
VIII
IX
X
XI
Xll
XIII
XIV
XV
XVI
XVII
XVIII
XIX
XX
LIST OF TABLES
Summary of Test Points
Test Matrix for the Fuel-Rich Preburner
Test Matrix for the Oxidizer-Rich Preburner
Preburner Parts List
GO2/GH 2 Igniter Specifications
Preburner Design Conditions
Injector Hydraulic Characteristics
Ins_rumentation List
Fuel-Rich Preburner Test Data Summary
Oxidizer-Rich Preburner Test Data Summary
Fuel-Rich Preburner Performance Data - EDM Injector
Fuel-Rich Preburner Performance Data - Platelet Injector
Gas Temperature Data Summary
Fuel-Rich Preburner Combustion Stability Summary
Oxidizer-Rich Preburner Performance Data
Oxidizer-Rich Preburner Stability Data
Fuel-Rich Combustion Model Chemical Reactions
Combustion Product Sample Physical Properties
Measured Fuel-Rich Combustion Product Gas Composition
Jensen's Gas-Phase Reaction Mechanism for Methane
Soot Formation
Page
4
11 i,
15
16
20
21
22
31
37
142
176
177
183
190
209
213
219
220
222
231
i
Precedingpageblank vii


Figure No.
i
2
3
4
5
6
7
8
9
I0
11
12
13
14
15
16
17
18
19
20
21
22
23
24
LIST OF FIGURES
Fuel-Rich Testing Sequence
Oxidizer-Rich Testing Sequence
Preburner Hardware Assembly Schematic
Preburner Assembly and Component Features
Platelet Swirl, er Injectors
EDM Like-on-Like Injectors
Gas Temperature Probe Design
Fuel-Rich Preburner Test Setup - J-IA Test Stand
J-IA Preburner Test Setup Schematic
Instrumentation Locations
Model 614A Kistler Transducer
Instrumentation Rake Assemblies
Gas Sample Apparatus Schematic
Fuel-Rich Peburner Test Setup
Fuel-Rich Preburner Test Sequence
Fuel-Rich Preburner, Measured Parameters Versus
Time, Test -009
Fuel-Rich Preburner, Measured Parameters Versus
Time, Test -011
Fuel-Rich Preburner, Pressures Versus Time, Test -012
Fuel-Rich Preburner, Gas Probe Temperatures Versus
Time, Test -012
Fuel-Rich Preburner, Gas Probe Temperatures Versus
Time, Test -012
Temperature Probe Locations in Relation to the EDM-LOL Injector Pattern
Fuel-Rich Preburner, Pressures Versus Time, Test -013
Fuel-Rich Preburner, Gas Probe Temperatures Versus
Time, Test -013
Fuel-Rich Preburner, Gas Probe Temperatures Versus
Time, Test -013 Probe 2
Page
I0
13
17
18
23
24
26
27
28
30
33
34
35
43
44
45
48
5O
52
54
56
57
59
61
Precedingpageblank ix
Figure No.
25
26
27
28
29
3O
31
32
33
34
35
36
37
38
39
4O
41
LIST OF FIGURES (cont.)
Fuel-Rich Preburner, Measured Parameters Versus Time,Test -014
Fuel-Rich Preburner, Measured Parameters Versus Time,Test -015
Effect of Igniter Torch Mixture Ratio on Fuel-RichPlatelet Injector Ignition
Fuel-Rich Preburner, Gas Probe Temperatures (TGP-I, -5)Versus Time, Test -015
Fuel-Rich Preburner, Gas Probe Temperatures (TGP-6 -i0)Versus Time, Test -015
Fuel-Rich Preburner, Measured Parameters Versus Time,Test -016
Fuel-Rich Preburner, Gas Probe Temperatures (TGP-I, -5)Versus Time, Test -016
Fuel-Rich Preburner, Gas Probe Temperatures (TGP-6, -i0)Versus Time, Test -016
Fuel-Rich Preburner, Measured Parameters Versus Time,Test -018
Fuel-Rich Preburner, Gas Probe Temperatures (TGP-I, -5)Versus Time, Test -018
Fuel-Rich Preburner, Gas Probe Temperatures (TGP-6, -i0)Versus Time, Test -018
Fuel-Rich Preburner, Measured Parameters Versus Time,Test -019
Fuel-Rich Preburner, Gas Probe Temperatures (TGP-I, -5)Versus Time, Test -019
Fuel-Rich Preburner, Gas Probe Temperatures (TGP-6, -i0)Versus Time, Test -019
Fuel-Rich Preburner, Measured Parameters Versus Time,Test -020
Fuel-Rich Preburner, Gas Probe Temperatures (TGP-I, -5)Versus Time, Test -020
Fuel-Rich Preburner, Gas Probe Temperatures (TGP-6, -i0)Versus Time, Test -020
Page
64
66
68
70
72
7_
76
78
81
83
85
87
89
91
93
95
97

Figure No.
42
43
44
45
46
47
48
49
5O
51
52
53
54
55
56
57
58
59
6O
61
62
63
LIST OF FIGURES (cont.)
Page
Fuel-Rich Preburner, Pressures Versus Time, Test -021 99
Turbine Simulator Blade Spacing 101
Fuel-Rich Preburner, Pressures Versus Time, Test -022 103
Fuel-Rich Preburner, Pressures Versus Time, Test -025 106
Fuel-Rich Preburner, Pressures Versus Time, Test -027 108
Fuel-Rich Preburner, Pressures Versus Time, Test -028 ii0
Fuel-Rich Preburner, Pressures Versus Time, Test -029 112
Fuel-Rich Preburner, Measured Parameters Versus Time, 115Test -030
Fuel-Rich Preburner, Gas Probe Temperatures (TGP-I, -5) 117Versus Time, Test -030
Fuel-Rich Preburner, Gas Probe Temperatures (TGP-6, -i0) 119Versus Time, Test -030
Fuel-Rich Preburner, Measured Parameters Versus Time, 121Test -031
Fuel-Rich Preburner, Gas Probe Temperatures (TGP-I, -5) 123Versus Time, Test -030
Fuel-Rich Preburner, Gas Probe Temperatures (TGP-6, -i0) 125Versus Time, Test -030
Fuel-Rich Preburner, Measured Parameters Versus Time, 127Test -032
Fuel-Rich Preburner, Gas Probe Temperatures (TGP-I, -5) 129Versus Time, Test -032
Fuel-Rich Preburner, Gas Probe Temperatures (TGP-6, -10) 131Versus Time, Test -032
Oxidizer-Rich Preburner Test Sequence 133
Oxidizer-Rich Preburner, Measured Parameters Versus Time, 135Test -014
Oxidizer-Rich Preburner, Measured Parameters Versus Time, 137Test -014
EDM Oxidizer-Rich Injector, Post-Test -014 139
Oxidizer Manifold, Post-Test -014 140
Oxidizer-Rich Preburner Test Setup, Post-Test -014 141
xi

Figure No.
64
65
66
67
68
69
70
71
72
73
74
75
76
77
78
79
8O
81
82
83
84
85
LIST OF FIGURES (cont.)
Oxidizer-Rich Preburner, Measured Parameters Versus
Time, Test -017
Oxidizer-Rich Preburner, Measured Parameters Versus
Time, Test -017
Effect of Igniter Torch Mixture Ratio on Oxidizer-Rich
Platelet Injector Ignition
Oxidizer-Rich Preburner, Measured Parameters Versus
Time, Test -018
Oxidizer-Rich Preburner, Measured Parameters Versus
Time, Test -018
Oxidizer-Rich Preburner, Measured Parameters VersusTime, Test -019
Oxidizer-Rich Preburner, Measured Parameters VersusTime, Test -019
Oxidizer-Rich Preburner, Measured Parameters Versus
Time, Test -021
Injector Face Erosion, Post-Test -021
Minor Liner Erosion, Post-Test -021
Oxidizer-Rich Preburner, Measured Parameters Versus
Time, Test -022
Oxidizer-Rich Preburner, Measured Parameters VersusTime, Test -023
Uncooled Nozzle Erosion, Post-Test 023
Oxidizer-Rich Perburner, Measured Parameters Versus
Time, Test -024
Nozzle Erosion, Post-Test -024
Injector Face Turbulence Ring and Liners, Post-Test -024
Oxidizer-Rich Preburner Hardware, Post-Test -024
Measured Versus Predicted C* - EDM Injector
Measured Versus Predicted C* - Platelet Injector
EDM Injector C* Efficiency
EDM Injector Fuel Vaporization Efficiency
Platelet Injector C* Efficiency
Page
144
146
148
149
151
154
156
159
161
162
164
166
168
170
172
173
174
178
178
179
181
182
xii

Figure No.
86
87
88
89
90
91
92
93
94
95
96
97
98
99
i00
101
102
103
104
105
106
107
108
109
LIST OF FIGURES (cont.)
Comparison of Measured to Predicted Gas Temperatures -
EDM Injector
Comparison of Measured to Predicted Gas Temperatures -
Platelet Injector
Gas Temperature Uniformity - EDM Injector
Gas Temperature Uniformity - Platelet Injector
Comparison of Measured to PredictedPressure Amplitude
Ratios
Effect of Mixture Ratio (MR) and Chamber Pressure (Pc) on
Longitudinal Stability
Predicted Effect of Mixture Ratio (MR) and Chamber
Pressure (Pc) on Longitudinal Stability
Effect of Turbulence Ring on Longitudinal Mode Damping
Fuel-Rich Preburner Turbine Simulator Test Configurations
Typical Carbon Formation Test Results
Turbine Simulator Effective Area Time History
Turbine Simulator Area Versus Mixture Ratio
Downstream Side of Turbine Simulator - Post-Test -021
Downstream Side of Turbine Simulator - Post-Test -029
Turbine Simualtor Blade Erosion
Main Injector Simulator Erosion - Post-Test -029
Nozzle Plate Erosion - Post-Test -029
Nozzle Throat Erosion - Post-Test -029
Turbine Simulator Blade Section - Micro Photograph
Oxidizer-Rich Preburner, Comparison of Measured toPredicted C*
Oxidizer-Rich Preburner, Predicted Combustion Gas
Temperatures
Metal Ignition Temperatures in Static Oxygen
Fuel-Rich LOX/RP-I Combustion Model
Fuel Vaporization Model
Page
186
187
188
189
191
192
194
195
196
197
198
200
201
202
203
204
205
206
207
210
211
212
215
216
xiii

Figure No.
110
111
112
113
114
115
116
117
118
119
120
121
122
123
124
125
126
LIST OF FIGURES (cont.)
Fuel-Rich Combustion Model Reaction Schematic
Fuel-Rich Combustion Product Sample-Phase Distribution
Comparison of Gas Sample Mixture Ratio to PreburnerMixture Ratio
Measured Condensate Vapor Pressure
Comparison of Measured Gas Compositions to Original FreonPredicted Compositions
Comparison of Measured to Predicted Gas FractionProperties
Comparison of Mesured to Predicted Mixture Properties
Fuel-Rich Combustion Model Modification Sequence
RP-I Decomposition Reaction Scheme
Predicted Fuel Vaporization Profile - Updated Model
Predicted Gas Gemperature Profile - Updated Model
Predicted Gas-Phase C* Profile - Updated Model
Predicted Mixture C* Profile Updated Model
Predicted Major Species Mass Frctions - Updated Model
Predicted Fuel-Phase Distribution - Updated Model
Comparison of Predicted and Measured Gas Compositions -Updated Model
Comparison of Predicted and Measured Performance -Updated Model
Page
217
221
223
225
226
227
228
229
232
234
234
235
236
237
238
240
241
xiv

I. INTRODUCTION
A. BACKGROUND
During the past several years, increasing priority has been given
to the development of an economical space transportation system. Numerous
NASA-sponsored studies have identified that high-pressure liquid oxygen/
hydrocarbon (LOX/HC) booster engines have significant envelope, weight, and
payload advantages over current booster systems.
The Advanced High-Pressure Engine Study (Contract NAS 3-19727),
conducted by the Aerojet Liquid Rocket Company (ALRC) during 1975-76,
resulted in a definition of required technology and engine design criteria
for various high-pressure booster LOX/hydrocarbon engine cycles. This study
identified the need for both fuel-rich and oxidizer-rich preburners to power
their respective flow circuit turbopumps in order to achieve the required
pump discharge pressures approaching 48.3 MN/m 2 (7000 psia). To preclude
failure, these preburners must deliver thermally uniform flows to the turbine
inlets; additionally, they must be designed to have the high life cycle that
is required of an economical, reusable advanced booster engine.
Previous development experience has highlighted the need for
advanced LOX/hydrocarbon preburner technology. Fuel-rich hydrocarbon pre-
burners have consistently evidenced low combustion efficiency due to non-
equilibrium reaction kinetics and carbon deposition that fouls and reducesthe efficiency of the gas turbine. Experimental oxidizer-rich preburners
have experienced combustion chamber metal wall ignition and reaction in the
oxidizing environment due to nonuniform temperature distribution. This test
program was undertaken to address these technical issues and to develop a
technology base for LOX/HC preburner development.
B. PROGRAM SCOPE
The purpose and scope of this program was to test two fuel-rich
and two oxidizer-rich preburner injectors to generate performance, stability
and _as temperature uniformity data over a chamber pressure range from 8.9MN/mL to 17.5 MN/m 2 (1292 to 2540 psia). The injectors, chambers, and
ancillary hardware were designed and fabricated by ALRC on Contract NAS
3-21753. A kinetically limited Fuel-Rich Combustion Computer Model (FRCM)
for predicting the performance of fuel-rich preburners was also developed onthat contract.
The specific objective of the fuel-rich testing was to generate
fuel-rich performance and carbon deposition data for comparison with the FRCM
predictions. The chamber was fitted with instrumentation probes for takinggas samples and measuring gas temperature uniformity. The gas samples were
used to define combustion gas composition for verification of the FRCM pre-dictions. Carbon formation data was taken by measuring the pressure dropacross a turbine simulator flow device. The fuel-rich testing was planned to
cover a mixture ratio range from 0.238 to 0.367.

I, B, ProgramScope (cont.)
The specific objective of the oxidizer-rich testing was to demon-
strate the feasibility of oxidizer-rich preburners and to obtain performance,
stability, and gas temperature uniformity data. The oxidizer-rich testingwas planned to cover a mixture ratio range from 27 to 47.

II. SUMMARY
A total of 20 fuel-rich preburner tests were run over the range of
operating conditions listed in Table I. Sixty-two (62) data points wereobtained by running multiple points during the 14-sec duration tests. Oxi-dizer and fuel flow control valves were used to vary mixture ratio and cham-
ber pressure. The test results acquired included C* performance, gas temper-ature uniformity, stability, gas composition, and material compatibility
data.
The contract goal was to achieve an Energy Release Efficiency (ERE) of
>98% of ODE. Energy release efficiencies (ERE) were found to vary from 62 to81% of ODE. The measured C* and gas composition data are in accord with
predicted values of the Fuel-Rich Combustion Model (FRCM) previously devel-
oped on Contract NAS 3-21753, indicating that fuel-rich combustion is bothkinetically and vaporization limited. The measured C* varied from 92 to 99%
of the FRCM-predicted values for ambient-temperature fuel, indicating that
significantly greater C* efficiencies are not achievable. Injector influ-ences, unlike the effects of turbulence rings and contraction ratio, were
shown to be minor.
When no turbulence rings were used, the gas temperature uniformity of
the platelet injector was found to be better than that of the electrical-
discharge-machined (EDM) injector. With use of turbulence rings, equivalentgas temperature uniformities of better than + 5.5°K (+ tO°F) were achievedwith both injectors. The contract goal was t-oachieve a gas temperature
uniformity of + 27.8°K (+ 50°F).
Combustion instabilities in the Ist and 2nd longitudinal modes were
encountered with use of the platelet injector. These instabilities were
effectively damped and controlled by adding turbulence rings and changingcombustor length. No high-frequency instabilities were incurred since the
injectors had been provided with tuned acoustic resonators.
Gas composition measurements were made and then compared to those pre-dicted with the FRCM. Agreement was excellent, except for the CH4 and H2constituents. A minor modification to one reaction rate constant was
required to achieve agreement. The impact on predicted C* performance and
gas temperature was small.
Carbon deposition data are inconclusive due to severe erosion of theturbine simulator blades. The cause of the erosion appears to result fromchemical attack of the interstitial carbon by the hydrogen-rich (_20_)
exhaust gases. The reaction appears to be aggravated by high gas velocity andunburned fuel droplet impingement. A materials compatibility study needs tobe made to define materials acceptable for high-pressure, fuel-rich LOX/HC
preburners and turbines.

I_r
OF PO:: (:L_L,I_y
ZI
%'I
i _ _° _
0 0 0
= !
r,3
_' o'3 i'_ _ _ ¢_ _
o _

II, Summary (cont.)
Eight oxidizer-rich tests were completed as listed in Table I, and
eight data points were acquired. Due to material compatibility problems,
test durations were limited to 1 second. The C* performance data indicate
that equilibrium combustion is achieved with oxidizer-rich preburners as had
been predicted. C* performances of up to 9_ of ODE were achieved. Longitu-
dinal instabilities were incurred but were stabilized with turbulence ringsand by shortening the chamber length. Due to failure of the thermocouple
rake, gas temperature uniformity could not be measured. Uncoated stainless
steel does not appear to be compatible with oxygen-rich gases at these pres-
sures and temperatures, whereas nickel and Rokide-Z-coated nickel were com-patible. A materials compatibility study needs to be made to define other
metals acceptable for high-pressure, high-velocity oxygen-rich preburner
gases.


III. CONCLUSIONS AND RECOMMENDATIONS
Following below is a summary of the conclusions and recommendations to
be drawn from the test program.
Conclusions:
Fuel-rich Energy Release Efficiencies (ERE) of 62-81% of ODE wereachieved.
Fuel-rich ERE is limited by slow fuel decomposition kinetics and
vaporization.
Fuel-rich combustion gas properties and C* performance are pre-dictable with the Fuel-Rich Combustion Model.
The gas temperature uniformity goal (+ 27.7°K [+ 50°F]) is
achievable with a low pressure loss turbulence _ing -- + 5.5°K
(+ IO°F) demonstrated.
Longer test durations and over a broader mixture ratio range are
required to define fuel-rich carbon deposition effects.
Fuel-rich turbine and main injector simulator erosion is unac-
ceptably high with type of metal used.
Longitudinal stability with either fuel-rich or oxidizer-richoperation can be achieved with proper turbulence ring design.
Oxidizer-rich preburner operation is difficult but believed to befeasible with proper material selection and operating conditions.
Recommendations:
Run fuel-rich tests over broader mixture ratio range to define
carbon deposition.
Conduct long-duration fuel-rich turbopump assembly tests to
define carbon deposition.
Run materials tests to define fuel-rich gas metal erosion mechan-ism.
Run material reactivity tests with flowing high-pressure and high-temperature oxygen to define metal ignition temperatures.
Precedingpage blank


IV. TECHNICAL DISCUSSION
This section of the report is organized into four major subsections:(A) Hot-fire Testing; (B) Test Results; (C) Data Analysis; and (D) Fuel-Rich
Combustion Model Update.
A. HOT-FIRE TESTING
This subsection of the report describes the test conditions and
logic, the test hardware, the test facility, and the test instrumentationused.
i. Test Conditions and Logic
The fuel-rich testing was conducted ahead of the oxidizer-
rich testing. It followed the sequence shown in Figure I. Testing began
with igniter checkout and valve sequencing tests, followed by preburner
sequencing tests with the EDM injector. The injector screening tests werebegun with the EDM injector. Two successful hot firings were made to con-
clude screening of the EDM injector.
Initial platelet screening tests with a 787-mm (31-in.}
length chamber revealed the platelet injector to be unstable in the ist long-
itudinal (IL) mode at certain operating conditions. It was mutually agreed
upon by ALRC and NASA that three additional tests be run to define theeffects of chamber length and turbulence rings on longitudinal stability.
The results of these tests show that use of turbulence rings improves thelongitudinal stability characteristics. With the installation of the turbu-
lence ring in the 787-mm (31-in.) chamber, the platelet injector was stabi-
lized over the entire ope'rating range.
The platelet injector was mutually selected by ALRC and NASA
for the carbon deposition test series. Its selection was made on the basisof its superior gas temperature uniformity without the turbulence ring. It
was also agreed that only one heated fuel test rather than two would be run.Five tests, in all, were added, and three tests were deleted. Added fundingwas provided by NASA for two additional tests with the EDM injector to
evaluate chamber length and turbulence ring effects.
The planned and completed fuel-rich test conditions are
listed in Table If. Test objectives and hardware used are also included.
The oxidizer-rich testing followed the sequence shown in
Figure 2. Oxidizer-rich testing was started with the EDM injector. Three
tests were planned, but only one hot firing was completed due to damagecaused by a hot-gas leak at the igniter inlet line. The platelet injector
was installed, and three hot-firings were made. No ignition occurred on the
first test. The igniter mixture ratio was changed from 40 to 3.5 to achieve
Precedingpageblank9

II
,,y
Z
'"_-z _ -=1I
i
t'_ _. .'.' ,_"'VOF POOR _-,.',_,;-
I'--'
_Jl--
l,,,IJ
1,1
Z_,--*L6J
p-
U..mO..j --_mL_
Z
O- L_I L,61Z I._I-- Z b..-,
_ZOZ --I r_ _='_"*_"C) J'* -'_ ":::
oooo
Z
<_j zo _-
w_
w
f_
LJ
S_=.....-I l,,._,,J<"_
:> oo
0
Z
_61 Z
Z--_
_mJ
I
1Z>-
• • oo ;N .o,I
N
°_...
e-
°rm
!
I,
°_...
tO

OF POC_ QL_;,_TY
r..
L_ _-
L,_
>-
_--1 Z _ ,
_F
_i.
,-- ! _ _ _- _-.
.... _ _ ,_. ,_ . .
c ,
II

&
i
=i
_, .°-. ;. ,
OF P3:]_._":":; ,,v
• t
#
_r
_j
Lr _ "-2.
-, _'e.
?i _ 5 5 g g
A;
"7_.,' ¢_ _ _
__' -'g "g zN_--, ._,, ._, .o,..... 2_ 2Z 2_
= '- _ _ = _
"K
12

O,,..,_,r-:,- I r-,=._ ¶'_
OF POOR QUALI_"I
_" COZ
I'-- '--_
ZO_ l.z_
l.j_ .,.j -r
_>"0
L._. e_ ,..J
•_" C..O02:
I._l b-"Q'--3 L_-Z_..-4 k-.-
0
00
L_
--IL,q
0I-'-.
C,) ._"_ _.J
0'-'_ -rL,_. _.4 -r"_" ,_ I.-- O,4
Oq
Z
Z
O
O0
i f
c_
ZZ
I-- '-"
(..)Z E..._ _-.-,
0"-_ ...j -n-
;"_ O0
I !L.i
01-"-
'-3Z_=_d_
Q3
.--4
L
Z_
000
A/\
Z
(.3Z
I._I I.,i=I t_'l::_ _ I--
O0
i._i ,"_0
_::: I'--_-,., ,,_:,,,_ _.Je,, ,..-3l.a..J Z_,,*. _._..,
(..)c-'
qJ
._,,,=.4.a
G,Ii--"
.r"-e_
I5,.
N.f,,.
:,<C)
13

IV, A, Hot-Fire Testing (cont.)
ignition on the second test. The injector suffered internal manifold damageon the third test due to a hard start. It was mutually agreed upon by NASA
and ALRC to repair the EDM injector and attempt to complete the planned
testing. NASA provided the added funding necessary to make the injector
repairs.
Three hot-firings were made to check out the performance and
stability. The first hot-fire test was unstable in the 1L mode, causing some
minor damage to the injector face. After the injector had been repaired onthe stand, a second firing was made with a shorter chamber at high Pc and low
MR. A delayed ignition occurred on this test, and no data were acquired. The
third test was stable and high-performing.
A final firing was made after the turbine simulator andinstrumentation rakes had been installed. The rakes failed on start and pre-
cipitated failure of the turbine simulator and nozzle; consequently, no valid
temperature rake data were obtained. Of the nine oxidizer-rich firings
planned, eight were accomplished. The planned and completed oxidizer-richtest conditions are listed in Table Ill.
2. Test Hardware
The fuel-rich and oxidizer-rich te_t hardware was designed
and fabricated by ALRC on Contract NAS 3-21753. The hardware includes the
components listed in Table IV. Since complete and detailed dimensional des-
criptions are provided in the final report for Contract NAS 3-21753, onlyfunctional descriptions are provided herein.
A preburner assembly schematic is shown in Figure 3 to
illustrate component assembly. The major components include igniter, injec-
tor assembly, acoustic resonator ring, lined and unlined chamber segments,
turbulence rings, chamber liners, instrumentation rakes, turbine simulators,main injector simulators, and nozzle throat flanges and reducers. All of thehardware is interchangeable between fuel-rich and oxidizer-rich assemblies,
with the exception of injectors, turbine simulator blades, main injector sim-
ulators, and nozzle throat flanges and reducers.
This hardware permits a complete simulation of the preburner
gas flow path from preburner injector to main combustor injector. The rela-tive positions of all components downstream of the resonator flange are
mechanically interchangeable for test versatility. Components can be omittedor interchanged as desired. Photographs of a preburner assembly and compon-
ents are shown in Figure 4 to illustrate component design features.
14

t.
o_P
w x
o
._ _.1 E I
E
o_ , ¢o •
0
" "7', _ "_ "_ ,
._,_ "7' _" _ _
,..- '.o,-
...... >, .... _ _ _ _ _ '_
_ _._ _ _ _'-_
15

TABLE IV
PREBURNER PARTS LIST
°
2.
3.
4.
5,
6.
7.
8.
9.
10.
11.
12.
13.
14.
15.
16.
17.
18.
19.
20.
21.
22.
ITEM
Injector Manifold Assembly
Oxidizer-Rich Injector Assembly (Platelet)
Fuel-Rich Injector Assembly (Platelet)
Oxidizer-Rich Injector Assembly (EDM)
Fuel-Rich Injector Assembly (EDM)
Lined Chamber 292 mm (11,5 in.)
Lined Chamber 394 mm (15.5 in.)
Unlined chamber 292 mm (11.5 in.)
Unlined Chamber 394 mm (15.5 in.)
Instrumentation Rake Assembly
Oxidizer-Rich Turbine Simulator
Fuel-Rich Turbine Simulator
Igniter Assembly
Oxidizer Throat
Fuel Throat
Oxidizer Main Injector Simulator
Fuel Main Injector Simulator
Injector Simulator Flange
Resonator Flange
Resonator Cavity
Throat Reducer
Turbulence Ring
PART NO.
1191404
1191403-29
1191403-39
1193105-19
1193105-9
1191401-9
1191401-29
1191401-19
1191401-39
1191411-19
1191521-9
1191521-19
1191522
1191402-2
1191402-1
1191402-11
1191402-10
1191402-8
1191402-3
1191402-4
None
None
NO.
2
I
1
1
I
I
I
I
1
I + Twoextraprobes
I
I
2
I
1
I
I
I
I
I
2
2
16

I
17

9[0 dS
c-O
0
0
e-
18

IV, A, Hot-Fire Testing (cont.)
Igniter
The igniter is a spark-ignited GO2/GH 2 torch igniter.The uncooled copper torch chamber has a limited firing duration of 0.400
seconds. The igniter can be fired either fuel-rich or oxidizer-rich by
proper orificing of the inlets. The design and operating conditions for theigniter are summarized in Table V.
Injectors
Two platelet swirler coaxial element injectors and two EDM
Like-On-Like (LOL) element injectors were tested. The injector design condi-
tions are listed in Table VI. The predicted and measured hydraulic charac-teristics are listed in Table VII.
The platelet swirler injectors are shown in Figure 5 along
with their design and operating characteristics. These injectors produce
concentric cones of rich and lean propellant. As illustrated in Figure 5,the lean propellant is shrouded by the larger cone of the rich propellant.
The EDM LOL injectors are shown in Figure 6. These injec-
tors atomize the rich propellant with self-impinging like-on-like (LOL) ele-
ments to form spray fans. As illustrated in the figure, the lean propellants
are injected through small showerhead elements between the fans.
Acoustic Resonator
The acoustic resonator used is a radial inlet quarterwave
tube design with 12 equally spaced cavities. Tuning blocks provide adjust-able cavity depths. Cavity depths of 17 and 11 mm (0.65 and 0.45 in.) wereused for the fuel-rich and oxidizer-rich tests, respectively.
Combustion Chamber Segments
Two sets of chamber segments were provided: one set without
and one set with nickel liners. The nickel liners were flame-sprayed with
Rokide Z coatings prior to the oxidizer-rich testing. Each chamber set hasone 292-mm (11.5-in.) and one 394-mm (15.5-in.) long chamber. The lined
chambers are provided with ports for mounting Kistler transducers and/or
thermocouple plugs. The chambers are assembled to the other components withstuds and nuts.
Turbine Simulator
One turbine simulator flange and two sets of blades were
provided. The turbine simulator blade spacings are adjustable with spacers
19

Z0
I--
i,
t,l¢-i
i,i
I--
Z
c_-t-
C_0
e'_ ¢_ °,- _ ¢'_
_ E E
_ _ Z Z
La.. I
"5"
o
0
0v
o
0
0
p,,...0
A .e-- .r,..
0 0
o,a E
Z Z
,-_ o _
v
EC_
00
0
_ 00 4_ ._-
_- 0
•_ _J x>C "_ "_-
0 "_--
m 0°_.-
X "_0 _-
4-1 5.-,---
0 _--
r_ cl
c-O
i-
e-
l.a_
rv-
v
2O

0
Z0
t,i
Zm,."
m.'-,
0 0
,"_ ' cx.I
_.} odm E
Z
°r--
0
v
Z
Od
0
0
c_
rY
_-_O0
A
b_ c-_- o 0
.p.. _) _ .e--
_ o r_
_ C_ "___
C_ +_
o
E v" r---
CO 0 -:-I_ v
O'_ ¢M
Z:
COv
v
0
-e.-
r_ _ 0
0 _ r_
c- t__0
°e.-
0 _-
0
OJ
__ 00 _._
_ L_.
r_f.- ,---
,'_ 0 "_" 0°r-- t-.-.- _.-_ .;.-.
0 0
21

I'--_.)
U
h.-
"t-
O
U
°_
I
v
oJ
!
I
e--
-,-LZ
ORIGINAL F,"_GE ["3"
OF POOR Q_:._i, !
0 LO 0 o_ (3_ 0CO c,_ QO c,_ 0 cO
,--_ E_ ,-, E_ or")
v v v v v v
.-_ C_ _ (30 r--, p-.,
c5c5 o o oc_
v
r_
0 ,,.o
0 0 0 0 0 0 0 0t
%X
" 0
',L0 C_
L_J
_-- c-U U
I !
%X
" 0
! I
s- $.
% %
_- L--
I I
i, u-
%
X
I..J
0 0._ ..J
U U
0 0
%u_ 0
i I
% %
I ix X0 0
22

_-_ _'_-"[. \,,9_,- "-I,
b4,'m-\----_ _ /_F---[4 ))
$90 dS 0890
_.'h,
_ cJ
_ z z
iI ii
° _ °
++_<,
_: dS 0880
_ Z
• _ 90 t-h
• _ , _ '-1 c__ _:_d
Ok--
"--3z
z
p-
_..I
-,:..
_ Z
H _
,,./
x
ft.z
--_ z
i
Z
O
_O
°_.,.
_A
°_-.
23

._F
I.--Z
...J-.Jw__-Z_ ,=:Z:r,,," L_O.
>.---_- ¢_
__,_ _
t4 t',V _
!V
u _
L_41 # II II il Iq ,,_,,j
II rl
!
',...:;. _. 1; _ 7}},.-.. "" i'?' -,'- • /
i,1
[00 08r.I3
i"Ti
_!;i)i:_:!Tii:¢.
_20 dI _800
t-,..U
Z
--.I0._.1
r..)
I
L.-
,,.,,.!l.i.
I,'--
I--,-
Z
X
S-
O
U
II,,Iv
°I,,-"
,.,..,I
AoI
v"
• t,.,.-
..,.,.I
t_LiJ
,,,d
5-
-,r-
I.l-
24

IV, A, Hot-Fire Testing (cont.)
under the blades to permit control of the simulator pressure drop. Using
data obtained from GN2 cold flow, both the fuel-rich and oxidizer-richblades were adjusted prior to hot firing to provide the desired pressuredrops. The oxidizer-rich blades were sprayed with a Rokide Z coating prior
to testing.
Main Injector Simulators
Two main injector simulators and one simulator flange were
provided. The fuel-rich main injector simulator consists of a flat plate
with various size drilled orifices. The intent of the simulator is to repre-
sent the pressure drop of the main combustor injector and to evaluate theeffects of carbon deposition and erosion on the inlet of main injector ori-
fices. The oxidizer-rich main injector simulator is a flat plate with a
single orifice to simulate pressure drop.
Turbulence Rings
Two turbulence rings were provided to improve gas-phase
mixing and gas temperature uniformity. One has an orifice diameter of 76 mm(3.0 in.); the other an orifice diameter of 86 mm (3.4 in.). These rings
were flame-sprayed with Rokide Z coatings prior to oxidizer-rich testing.
Nozzle Throat Flanges and Reducers
Two nozzle throat flanges and two nozzle throat reducerswere provided for achieving the desired chamber pressures. The nozzle throat
reducer is used for performance testing prior to insertion of the turbine and
main injector simulators. The oxidizer-rich nozzle throat flange and throat
reducer were flame-sprayed with Rokide Z coatings.
Instrumentation Rakes
Four instrumentation rakes and one mounting flange were pro-
vided. Two of the rakes are mounted as shown in Figure 4; the other two are
spares. Each rake contains two (2) gas sample ports and five (5) thermo-couple probes. The gas sample ports are manifolded together as described in
Section IV.A.4. The gas temperature probe design is shown in Figure 7.
3. Test Facility
The testing was conducted on ALRC test stand J-IA, shown inFigure 8. A schematic of the test setup is shown in Figure 9. The propel-
lants are fed from high-pressure intensifiers through flow control valves.
The flow control valves are throttled during the test to permit multiple
25

f
//. ,
/, /, //
/, i /
.,' , .i': ". _L _LOW..>,, ,f/
i .,". 1.60 mm (0.063 in.) OD" GROUNDEDCHROMEL/ALUMEL T/C PROBE
.... , INSTRUMENTATIONi'• " RAKE ASSEMBLY
Figure 7. Gas Temperature Probe design
26

ORIGINAL PAG£
BLACK AND WHITE PHOTOGRAPH
Figure 8. Fuel-Rich Preburner Test Setup - J-IA Test Stand
27

L_0
O
vE_.
L
.,IZ
I'--
I=I.IC.O
0I.---
0
0
k.k.
Z
e-.r..
E
E_
Ze,_
C3u'_C3
O.J -'_t"_0C,4
)
)
i
e-
E_.1 E __
.tO-T- I".. O,J
)
)
Z
7
ZO
.r-
e-
t'-"
e-
_J
!
.r-I,
28

IV, A, Hot-Fire Testing (cont.)
MR/Pc test points. The oxygen and the RP-I are supplied from a .568 M3
(150-gallon) and a .303 M j (80-gallon) intensifier, respectively The pro-
pellants are passed through 10 micron filters before entering the intensi-fiers. 5 micron filters are used upstream of the flowmeter. Dual flowmeters
are used to ensure flow measurement accuracy.
4. Instrumentation and Measurement Methods
Both preburners were instrumented to measure C* performance,stability, and gas temperature uniformity. The fuel-rich preburner was also
instrumented to measure preburner gas compositions and turbine simulator car-
bon deposition. Instrumentation probe locations for the fuel-rich preburner
are shown in Figure 10. A complete list of measured parameters is shown inTable VIII.
C* Measurement
The measured C* was determined from the following equation:
C*meas : Pc CD At g/WT
where:
Pc = Throat stagnation pressure (N/m2 [Ib/in.2])
CD = Nozzle discharge coefficient
At = Throat area (ram2 [in.2])
g = Gravitational constant (m/s2 [ft/sec2])
WT = Total weight (g/s [Ib/sec])
The injector face pressure (Pc-l) was used when no turbulence rings or tur-
bine simulators were installed. The pressure downstream of the turbulence
ring (Pc-2) was used when applicable. The pressure at the nozzle inlet(Pc-4) was used when the turbine simulator and main injector simulator were
installed. The measured pressures were taken to be the throat stagnationpressure since the static-to-stagnation-pressure correction factor is small
(1.005% for the fuel-rich preburner, and 1.020% for the oxidizer-rich pre-burner).
The nozzle discharge coefficients were determined by cold-flow test to be 0.99. The total flowrate is the sum of the measured oxidizer
and fuel flowrates. To determine the fuel and oxidizer flowrates, the aver-
age of two series flowmeters was used. The throat area was determined by
taking the average of six post-test throat diameter measurements.
29

I--
I I
I I
!
I
!0
°_
I.J0
0o_.
4.a
c-O
k.4.a
k..-I
°_.,.;..;_
3O

ORIGINAL PP,G- _S
OF POOR QUALITY
TABLE VII [
INRTRd_',E;iTAT IO,',LIST
Parameter S!mDo I Uni ts
PREBURNER
Ox Valve Position LOV in. 0-100%
Fuel Valve Position LFV in. 0-100%
Ox Pilot Valve Current IOV Amps SIT
Fuel Pilot Valve Current IFV Amps S/T
Ox F1owrate FMO-I kg/s (lb/sec) 5.44 (0-12)
FMO-2 kg/s (lblsec) 5.44 (0-12)
Fuel Flowrate FMF-I kg/s (Ib/sec) 15.88 (0-35)
FMF-2 kgls Clblse_) 15.88 (0-35}
Ox Flowrneter Press. PoFM MNIm2 (psia) 24.1 (0-350Q)
Fuel Flowmeter Press. PFFM MN/m2 (psia) 24.l (0-3500)
Ox Flo_a_eter Temp. ToFM °C (_F) -160 + -3.9
(-_20- t 25)
Fuel Flowmeter Temo. TFFM °C (°r) 38 (0-I00)
Cham_er Pressure PC-I MN,'_2 {psia) 17.2 (0-2500)
Chamber Pressure PC-2 MN/m2 (psia) ]7.2 {0-2500)
Ox Injector I_w_nifold Press. PoJ MN/m2 (psia) 24.1 (0-3500)
Fuel Injector Manifold Press. Pfj MN/m2 (psia) 24.1 (0-350Q)
Ox Injector Manifo!_ TemD. ToJ °C ("_) -160 to 38
(-320 to +fOOl
Fuel Injector Inlet Temp. TfJ °C (_F) 204 (0-400)
Turbine Discharge Press. PC-3 MN/m2 (psia) 17.2 (0-2500)
Main Chamber Press. PC-4 MN/m2 (psia) 17.2 (0-2500)
Ox Manifold Kistler KOJ MNIm2 (psia} 0.69 (0-I00)
PK-PK
Resonator Kistler K-R MN/m2 (psia) 0.69 (0-I00)
RK-PK
Champer Kistler (He Bleed) K-l,4 MN/m2 (psia) 0.69 (O-IDOl
PK-PK
Gas Probe Temo. TGP-I,IO °C (°F) 1371 (0-2500)
Chamber Wall Temb. TCW-I,4 :C (°F) 1371 (0-2500)
Gas Sample Valve Current EGSV A,-nps S/T
Gas Sam!Die Ourge Valve Current EGSPV Amps S/T
Gas Sample Pressure PGS _i/m2 (psia) 17.2 (0-2500)
Turbine Simulator Press. Drop OPTS MN/m2 (ps_) 6.9 (O-lOgO)
Exhaust Gas Temp. TEXH °C (°F) 1371 (0-2500)
Mainstage Injector Simulator DPMS MN/m2 (psidl 6.9 (0-I000)
Press. Drop
Gas Sample Temp. TGS °E (°F_ iS71 (0-2500)
Ox Purge Valve Current IOPV Amps S/T
Fuel Purge Valve Current [FPV Amps S/T
IG_IITER
Ox Igniter Pilot Valve Current IOIV ,aJnps S/T
_uel Igniter Pilot Valve Current IFIV Amps S/T
Ox Igniter Valve Position LOIV In. O-!OOC
Fuel Igniter Valve Position LFIV In. 0-I00%
Spark Trace SPK N/A N/A
Ox Orifice Inlet Pressure PO[V MN/m2 (osia) 20.7 (0-3000)
Fuel Orifice Inlet Pressure PF[V MNIm2 (psia) 27.6 (0-4000)
Igniter Chamber Pressure PCI MN/m2 (psia) 20.7 (0-3000)
Ox Igniter Injector Press. POJI MN/m2 (psia) 20.7 (0-3000)
Fuel [gniter In_ector Press. PFJI MN/m2 (psia) 27.6 (0-4000)
Recordin_
0i Q_'tal O' Grain FM
X
X
X
X
X
X
(2)
(I0)(4)
R l R 2
X
X
X
X
X
X
X
X
X X
X
X
X
X
X
(PC-I-PC-_.)
X
(PC-2-_C-3)
X
×
X
XCA/COnly)
X(AIC Only)
(4)(A/COnly)
X
X
X
X
X
X
X
X X X
X X
X X
31

IV, A, Hot-Fire Testing (cont.)
Stability
Combustion stability was determined by using helium bleed
Kistler pressure transducers. The Model 614A Kistlers are mounted in adap-
tors as shown in Figure 11. This mounting with helium bleed provides thermal
compatibility and a flat frequency response of about 10,000 Hz. After beingrecorded on magnetic tape, the transducer output is examined for stability by
playing it back on an oscillograph at a 16/i speed reduction. The output isalso fed through a Combustion Stability Monitor (CSM) for automatic engineshutdown. The shutdown limits were set as follows"
Frequency
Amplitude
Duration
> 1,000 Hz
> 10% of Pc, PK-PK
> 30 ms
No CSM shutdown occurred since the observed instabilities were longitudinal
modes with frequencies of 600 to 700 Hz.
Gas Temperature Uniformity
The gas temPerature uniformity was measured by using the
instrumentation rakes shown in Figure 12. Two rakes with five probes eachwere used to measure radial gas temperature profiles and define gas tempera-
ture uniformity.
Gas Composition Measurement
The gas composition was measured by using the gas sample
probes shown in Figure 12. These probes were plumbed to a gas sample appara-tus as shown in the schematic of Figure 13. Each of the four 1.6-mm
(1/16-in.) probes (two on each rake) were manifolded into a 3.2-mm (i/8-in.)
tubing connected to a 300-cc CRES bomb. The bomb has a screw-on top for dis-
assembly and cleaning.
The probes are isolated from the bomb by a hand valve and a
remote-control hot-gas valve. A GHe bleed was provided to purge the probes
prior to sampling. A GN2 bleed was provided for post-test purging. Pres-sure and temperature measuring ports were provided to monitor the sample bomb
temperature and pressure.
The gas sampling test procedures used were as follows:
(i) The bomb is cleaned, evacuated, and filled with GHe
to 10.3 MN/m 2 (1500 psia) pressure for leak check.
32

OF PC,OR ,..,_.-.... /
25.40 mm(1.0 in. )
l8.509 mm(0.335 in.)
4-8.509 mm (0.335 in.)
!
18.034 mm--
"(0.71 in. )_
i II I
'' ,JI !! !
i[ *_"-F=_
I 1
! t
! t
f I
I !
63. mm
(2 in.)
1 '34. 798 mm'_
26. 924 2m_n" )
(I.i6 i
(2) 5. 156 mm(0.203 in.) DIAMTG HOLES
He INLET
['iA
Figure 11. Model 614A Kistler Transducer
33

ORIGINAL PAGE'
BLACK AND WHITE PHOTOGRAPF[
0
CO¢,J
°t-
O0_i
E
34

PreburnerChamber
Inner Tube
- Outer Tube
ORtG,,.._-'- FZ 3:Z , ,
OF PCC.? __',7_.' !'7
1.575 mm (0.062 in.) x 0.406 mm (0.016 in.) WallCRES Tubing, 4 Places
_-3.175 mm (i/8 in.) x 0_406 mm
(0.016 in.)Wall CRES Tubing, 4 Places
InstrumentationProbe J
He Bleed Valve _
GHe
30.3 MN/m2
(4400 psia)
Gas blani fold
3.175 mm {I/8 _n.) x 0.406 mm
0.016 in.)Wall CRES Tubing, 4 Places
[_-_GN 2 Purqe Valve
C><_"_"_ Ori fi ce
Io.o_o,,.1 _._o LOrifice
Gas VaIve, 1000 o - 1500°F
Hand Valve
J k l oocc
Figure 13. Gas Sample Apparatus Schematic
35

IV, A, Hot-Fire Testing (cont.)
(2) The pressure is vented to 1.4 MN/m 2 (200 psia), and
the bomb is installed in the apparatus.
(3) The sample line hand valve is opened at the lO-minute
warning signal.
(4) The GHe purge flow is started 5 seconds before fireswitch I (FS-1).
(5) The GHe purge valve is closed 50 ms ahead of openingthe hot-gas sample valve.
(6) Sample gas flows for 2 seconds and is shut down at
FS-2.
(7) The GN2 purge flow is started, and the GHe purgeflow is stopped at FS-2 +5 seconds.
(8) The hand valve is closed as soon as possible after test
termination (usually within 5 minutes).
(9) The pressure and temperature are recorded, and a pres-
sure cap is placed on the hand valve outlet to prevent leakage.
(i0) The bomb pressure and temperature are checked prior to
gas analysis to ensure that no leakage has occurred.
The gas samples were analyzed for compo'sition by using aHewlitt-Packard Model 5830A Gas-Liquid Chromatograph. A water-heated bath
was used to analyze the liquid condensate for vapor pressure. The solid
condensate was measured by collecting the solids on filter paper.
B. TEST RESULTS
This subsection of the report presents a summary of the fuel-richand oxidizer-rich test data via a test-by-test description of all tests con-
ducted for this study.
i. Fuel-Rich Testing
The fuel-rich injector test results are summarized in Table
IX. The fuel-rich test series is designated 2351-DO1-OG-XXX.
36

_- oo _ _
_o_
cc 0_4_ cc
r_
m e_
o _ 6
-j
"L_ _
_ . zo--
"T
c_
_.__
• o .
6 o66 o6*oed
__ __ _._ : : _ _ : _ ___ ,_c_
37

_-. _
J
38

_,'._-._,-._,',_.P_.O.ZOF' ' "'_ ""r,..' _.__ _'.AL!TY
_q
-?
_b
__
q
_"
_._
6 6666
#.m_c
c_
_, __ _...... _ _ ._
___L __ _
6 6_6_ e
8
39

r_
A
. _lo_-
,. _ ,r
4O

_qL_ __l_ _'_ _._ _- _ .... • .....
K
L
zc _P_
w
41

IV, B, Test Results (cont.)
Test -008
This was the first full preburner checkout test. The pre-burner test setup is shown in Figure 14. The set conditions were for a cham-
ber presure of 16.6 MN/m 2 (2409 psia) and a mixture ratio of 0.254, using anozzle throat diameter of 30 mm (1.18 in.). The run duration was set for 0.5
second; however, a premature shutdown occurred at FS-I + 0.4 seconds due to
the T4 timer kill as shown in Figure 15. Ignition had occurred and chamber
pressure was rising rapidly; however, the time to reach a chamber pressure of
6.9 MN/m 2 (1000 psia) from FS-1 had been underestimated, and the T4 timer
initiated the shutdown. There was no evidence of hardware damage.
Test -009
The set conditions for this test were the same as for Test
-008. Based on the Test -008 results, the T4 timer was extended from 130 to205 ms. The T2 tier was extended from 60 to 85 ms to delay the oxidizer
filling and achieve a s_other start. The T6 timer was increased to 1.0
second to permit longer test duration.
Data plots of the test parameters are shown in Figure 16.The actual operating point was Pc = 17.5 MN/m2 (2540 psia) and MR = 0.305
due to a higher-than-anticlpated oxidizer flow. The higher oxidizer flow is
a result of a lower-than-expected oxidizer valve pressure drop. It appearsthat the flow through the valve reattached downstream of the poppet,
resulting in a valve discharge coefficient of 0.8 compared to a design valueof 0.6.
Two anomalies occurred on the test, requiring test system
modifications. The first anomaly was an oxidizer valve malfunction thatresulted in an oxidizer-rich shutdown, causing minor nozzle throat erosion.
The oxidizer valve trace shown in Figure 16 indicates the abnormal shutdown.Post-test examination of the valve actuator hydraulic system identified actu-ation pressure interactions between the fuel and oxidizer valve servo-
actuators to be the cause of the problem. Replumbing of the servovalve dis-
charges solved the interaction problem.
Post-test examination of the high-speed movies taken clearly
shows the throat erosion occurring during the oxidizer-rich shutdown. Basedon Test -009 C* data, the throat diameter was subsequently enlarged to 33.6
mm (1.322 in.) to achieve the design point conditions of Pc = 15.2 MN/m 2
(2200 psia), MR = 0.3, and WT = 16.78 kg/s (37 Ib/sec).
The second anomaly involved backflow of fuel-rich combustion
gases into the igniter GO2 feed line, resulting in minor damage to the
42

BL/1.L.::: A:,;5 ,.' _',T:{ F;-I " .... -'"'
e'_
m
°_,-
!
%
*r-
, 43

SPARK
FIV
OTV
IGNITER Pc
FFCV
OFCV
PREBURNER Pc
OXID IGN. PURGE
FUEL IGN. PURGE
OXID INJ. PURGE
FUEL INJ PURGE
T7
\• TII
_Pc = 250 PSI, IGN
I ii I
,-,;,
T4
//'T_----Pc = 1000 PSII
1
I
1 I
I
FS 1
TIMER FUNCTIONS:
FS 2
T6
T9
I
q
I
/
\
TEST-008 -009
TIME
Tl FUEL IGNITER VALVE OPENING DELAY. DELAYS VALVE
OPENING FROM FSI-
T2 OXIDIZER FLOW CONTROL VALVE DELAY. DELAYS VALVEOPENING FROM INITIAL OPENING SIGNAL TO FUEL FLOWCONTROL VALVE.
-OlO -011
I0 MS I0 I0 I0
60 MS 85 I00 lO0
T - IGNITER CHAMBER PRESSURE SHUTDOWN. IF IGNITER 250 MS 250
3 PRESSURE IS NOT UP TO 1.7 MN/m2 (250 psi) PRESSURE BY 13,
A FS 2 SIGNAL IS OBTAINED.
T4 - PREBURNER CHAMBER PRESSURE SHUTDOWN. IF PREBURNER 130 MS 205
PRESSURE IS NOT UP TO 6.9 MN/m2 (1000 psi) BY T4, A FS2SIGNAL IS OBTAINED.
T CSM SHUTDOWNLOCKOUT. THE CSM SHUTDOWNWILL NOT BE 30 MS 305 INITIATED UNTIL AFTER T5, TO PRECLUDE ANY PRESSURE
PERTURBATIONS DURING START TRANSIENTS.
DURATION TIMER. GIVES THE TOTAL DURATION OF THE TEST. 500 MS I000
250
FUEL IGNITER VALVE CLOSING DELAY
FUEL IGNITER PURGE VALVE OPENING DELAY
T6
T7 -
T8 -
T9
190
30
25O
FUEL FLOW CONTROL VALVE CLOSING DELAY
190
30
5000 5000
50 MS 50 50 50
50 MS 50 50 50
50 MS 50 100 100
44
Figure 15. Fuel-Rich Preburner Test Sequence

L ...... ii-: 'i i . _ .... i i i-.-...i i ., TI L_i'I
. _ ....... , • i.... ': _ . _ . i . . : ........ i
............ , ............... ; ............. /"_.: .]; i I " _ !
• , _ i _ l : • .,,,_ _,.,.,/ ..... /j [ ] ..... 1
• _ - , _./ . . _ • _ -_- _ ...., .., ./_...i.. i _ ]' d ', , , ! i ' , .... .X's _' _ : I _.
• , " ".;/'; .... ' " , ..... ; _' --: ...._........i _ I' : r i ' i . ,
, t', _ i ' _ t\l ,, _ _ ,..... 1 " i _ , i , i ...... i t _ . I ; " I ." t ....___,. ,. , ,_ : , .. 0 _ ' " '/ ' ....t-
.... :---'_ .... r----" " 7 "' t _-_---"_----r---T---r " "_
' 'I I_N' ,. ' f , _ '?' ' ' 4 _ ' Io
I '-Ii>.ii _ , ' ', T +. r tt_ !- _. i- t
.. ! _., _., i _I L -__.-...-'_ ...._ ', ___.-u_ _, _ -,..__ L_--...-_-___
• [
• . i ,:: :I
..... I.
I i 1 1 I ' r ' i ' _ '0000_ 000_£ O001Z O00gl 000_ :_
s_n_G3_a
I
O00eg 0009S 0006_
NO] i [_O_ 3 k"]tJk
:5Z
_o
_LI.J z
g- - <_
N
T
• _z_
i
i
o
,_==,
I--
£.
_J
n_
c_
f_
(D
Jc-Od
O
_CD*_=
!e="
I,_ I=--
%_
01,=
45

[ .......... • .....
/
/
L/-j
'.... ?i...................: "..... _1!
' ]ii
.......... ;I .......................
.f
o
• , . T-o_c_
N
/
1* "..... _-..... .......... •............ _ ....... :.... i.... i _-_
...... : " " '2i
• i
" " i ¢_
J
00_9 0099 OOgP 000_ 002£ 00_ 0091 008
I I 1
& -_
°
O_ Z _ e_ _o
Q:5. L_ z
_z_ _. _.
E°_
I/I
E
Z
_t_"0_
._ 0
0.)
_., O,J
..¢: O_
!
46

IV, B, Test Results (cont.)
igniter and feed line. Corrective action was taken by installing a checkvalve immediately at the igniter oxidizer inlet in addition to the originalcheck valve located about 60.96 cm (2 ft) upstream of the igniter. The
igniter oxidizer feed and purge pressures were also increased to provide
added margin.
Test -010
The conditions were set for Pc = 15.2 MN/m 2 (2200 psia),
MR = 0.3, and _T = 16.78 kg/s (37 Ib/sec). The test was terminated pre-maturely by the T3 timer. Post-test analysis showed that the spark did not
receive an electrical signal from the computer sequence.
Test -011
The test conditions for Test -011 were the same as for Test
-010. The firing was successful, with no anomalies occurring. Data plots of
key test parameters are shown in Figure 17.
The actual operating point was Pc = 15.6 MN/m2 (2265
psia), MR = 0.331, and _T = 16.56 kg/s (36.5 Ib/sec). The test was stable,and there was no evidence of hardware damage.
Test -012
Test-012 was scheduled to obtain data at five operating
points. However, only three operating points were obtained due to a low-Pc
kill resulting from a lower-than-desired mixture ratio on Point 4. Diffi-
culty in achieving the desired set conditions resulted from uncertainties inthe oxidizer valve Kw at low valve openings.
The test was stable at all operating conditions. Key test
parameters are plotted in Figures 18, 19 and 20. Prior to testing, theinstrumentation probes had been installed, as shown in Figure 21, and temper-
ature and gas sample data were taken.
Test -013
Test -013 ran the scheduled duration, and five operating
points were obtained, as planned. Test data are shown in Figures 22, 23, and24.
47

OF ._OC,2 QU_,LIi'f
. I _b,
• i+ . • , .
! LS-_L- _ •
-- -- ¢m
_ w
JE
°p,..
p-
_n
u9
K.
4-*
%1
cu
K.
tn
_J
Ce-o4
.c_ o
_J
u,-.4
•,- o
!
,.- J,J
0J u_
u_p-
_J
c
.p-u_
_8

ORI_LrL_<L _r_'- :'-l* r_,.;:_ ,, ,,:.
r_P_OF PO,_... _:_ a; '-vo
, ,, .
. . L_.__.._ --wim- -
i f'.j.' ii Iix-a............. , ............................. -'_ ....
i,,l_
..... • ..... . • . .....
-I
!
I
_,:?,
t
]
Z
,y-,
_-_
_r_ m
r_-- -
_ e, g
I
OOtg
g
_LT_ • . __ .._
, - <:p_.......................... -_ ............................ -
T. _
i 1 i I I _ i loogs OO_g_ " 0001' 00._£ O0'l'Z OOol 000 0 -- N o u..
lg
o
t--
$,.
E
Ce-CxJ$..
._ 0
_¢xa
OO
• r- 0
!
i,D ,4-)
49

L . . ll,l
F
..............................:_._' • -_.....I!J_
.... i
-i
_J --
J. _-
_ c4 co
z z
F ..................
[ ..................
...... IJ- i ........ ,_
............
j ...........
l
_--. _ -_
......... . m o-Z_ -_ _
©.... °ik
............
............ {: . .
................ _ .'- I_ !1 'I I.......................... _ -- _----_---_ ......... N
......... ' t__t _
o _.
0
v
C_
o!
O_
o_
OJ
[/)
_J
o_
.Q
O_
£.
Q.
!
d
o_
i.
5O

O,J
0
OJ
O,a
0
I
°l--
On
¢._
_a
t--
e-
l
e--
(la
la-
51

E°r=.t.---
(y')
(U
4-;,
E
t,-,-
.,_0.f,.
r',,
C¢) ,.-._:: (',.j
_a
U,-,_
o!
f,.
52

! •
. _. _ s J ! _.
Z
u_o_ -
u_ _
r_- "-n
_r" C3 z i
, Y
rn L_
n," u_ -- .
0
Z
c_
r_
r_
.._0£..
d
¢._
e" _.,j
!
£.
°_...
53

. • j
....... i
r • '[ ......
Eoe--
I-'-
Cn
4--)
,%..
C'_
E
t-"
0.%..
o'1
_" O,J
_..
-._ _.
._ 0
S,. ,---_
__ -.._
_..- ¢-,j
• _- (_
I
,--.
"_ (U
O,J
OJ
c_
°_.-
54

i......
.......... t
o ¢1 _ e_
Z
p..
._J _
LLJtY
P--_I =¢
_v" CJZ , m
t.,,- _ ¢= e,_ ¢¢
L_J .._ ¢: ,.o o --
.r"-i"
¢,0
tO
OJ
E_J
p--
_J
0
c'_
_ ,.-._
O_ 0
O, CO
I !
O0 u')
_,.p--
C_
L_
55

°
0I--
"' ,-- 0mm ,..,0 .I--
0,-J
m,,"0I"-
I._
Z_===_
C_
0IN
Z
00
..J0-.J!
i,i
z-_=_
0
_.-0
m,."
0
0,.-I
0 L
U
E ";"0
56

• . I , j , k
_ . E........... t ....
i
I
......... I .................
0
v
0'3
o|
E
t--
t_
5,-
e-
0_,_
!
t_
57

..|
A
0
I
t_
,2
e-
I
i,
58

.......
i
..... i ¸
• i,,,,,,
I'-'
:>
q._
E
I.---
oc_
c_ oo
._ o')
0r-- 0
I
0
0.)
k.
-r'-
I.I-
59

i
r .......
°r=..
I--
(2)
_n
qJ
"s
I--
.._
0
0
.._
_._ ,..._
..t== _'_
°_'-" 0
I
I.._ I---
6O

t I ....... i
i ..........
or_ o o
E
I--
r'_E_J
F.'-
0
_-v
(" C_
,%..I..
t'-¢,,")
¢..},,.-_
I,..-
LL {.--
C",J
°r--
61

_ _" ;' i.,.-¸7 _-;
..........
1_........i!!i! i! ....
62
I

IV, B, Test Results (cont.)
Test -014
This was the first test conducted with the platelet injec-
tor. The objective of this test was to check out ignition and valve timing
before proceeding to the injector screening test. Ignition was delayed about
20 ms, resulting in a large overpressure, as shown in Figure 25. The delayed
ignition was initially thought to be due to a slower oxidizer manifold fill
than that experienced with the EDM injector. Consequently, the start
sequence was modified prior to Test -015 to advance the oxidizer valve
opening by 15 ms.
The steady-state combustion and shutdown transient were nor-
mal. No hardware damage was incurred.
Test -015
Test -015 was the first platelet injector screening test.
Five Pc-MR operating points were achieved. Ignition was again delayed byabout 20 ms, resulting in an overpressure as shown in Figure 26. Post-test
examination of the hardware showed damage to the resonator ring and theinstrumentation rakes. These components were replaced prior to Test -016.
The hard start was found to be a consequence of the plateletswirler injector mixing and igniter torch characteristics. As illustrated inFigure 27, the inability of the oxidizer spray fan to penetrate the fuel
spray fan near the injector face causes an extreme fuel-rich mixture ratio to
be exposed to the fuel-rich igniter torch. Consequently, there is not enough
oxygen in contact with the hot torch to cause ignition until the spray fans
mix in the throat. The result is that ignition occurs in the throat. The
flame propagates via a detonation wave to the injector face, causing theoverpressure. The 20-ms delay correlates well with the calculated gas resi-dence time.
The solution to the delayed ignition was to reorifice the
igniter to operate oxidizer-rich at a mixture ratio of 40:1. This change was
made prior to Test -016, with the result that smooth ignition was achieved on
Test -016 and all subsequent platelet injector tests.
The hard start problem was not encountered with the EDM
injector. Oxidizer orifices were purposely placed in the EDM injector facenear the igniter exit to react with the fuel-rich torch. This induces
ignition near the injector face, thus avoiding large overpressures.
Combustion instability was experienced at the low-Pc (13.1MN/m 2 [1900 psia]), low-MR (0.25) operating point. The instability was
63

-. - . . -°..,
Lx ......
' [ ; ,
..... °" " " ' " " j " - i
............ J I •i
: N _ "-
• " " c i,. ..
/
L
•......................I :......... 1 ............._
]
..... ,.............. l........ ...... l
..... ] i ........ , • ...... _'
............ ]i ...... .............. .... -IN
L .................... _.... " - : .... _ t " __ ilJ1"" _''": ...... !.......................... !
L........ I : ....... .1........ 1 z,_ s.. ' : • I : - i :I J i i . c,_c.. '_ , " _ ] _ ........... I : ........
........ | ................. 1........ t ! : _,, "_ i"! ..... !-'! .......... _''" "' ....
1 '_> ' .............i....-_ .....................'_:.....:...._..................i "°
I:::::.,:?::..-:::.:.:::;:"-:z:l:i::::::::?.i:?:
......_ . -_.,-.-.; ._..............._......,.., ,..-_.._............... _...._...........i.............._..._4...i..._....il°......._..;._ ..........;......i,.i...:;......:..I......._...........I_ _ . . : _ _ _.i_|...............•I.._--_......., ...................._._.:.......+..._-.,._......,...._...,...,..._......i._
............... .,..L.; ...... _ ; ._ : _ _ Z _ : _ _"'! • :
oooot ooot_ ooo_ _ ],_1=0_.,,=..= ooo_J1 oooot oio_I
to
o
_ z
12_ IJ- _ . _ "J
e_
,.3,;gg
,.m_E
:;:::::! :.:::.:i :;.:
_ZZ
r_j
E°p-
t--
I/1
Q_
Er_
rO
C1.
111
rO
Z
L
33 0
OJ
I
_J m
b-h-
C_d
_J
64
I

t
_ r::_:! : i : ' I_'__. l:_::iJ,. ._q..
! i 1._
z zw
TT_
'el
t--"
t/9
t-
¢0
e_
_"od
.%..
._ 0_J
•_ C_
I,.-- 4._
U-l--
0_
_.)
°_,..
65

$-
,2c" O,J
_0 0
r-t._
-_.-
I
_--F--
O,J
c_
6G

rT,'_"'__., . , _._'_7":_i:_
• I ....
[ ......i.........z .....1_rn
00SI 0001 OOS 0
Z
r,
L_Z_ _
zz
m 0,I 0 _
=
r.
=
_2E
°_,,,
E
r_
(" C'_J
_C',J
•r- 0
I
C_
Q.}
°_
L,,I-
67

IGNITER
I r-FUEL-RICH
IPLATELETINJECTOR
w:; -.. . . .
FUEL-RICH SPRAY
OX
_EL
FUEL
OX
FUEL
OX
FUEL-RICH 02/H2 IGNITER TORCH
MR = 3.5
DETONATION
ION INTHROAT
TEST -014 AND -015
IGNITER
FUEL-RICHPLATELETINJECTOR
IGNITION
FUEL
OX
FUELOX
JIOX
OXIDIZER-RICH 02/H2 TORCH
MR = 40
TEST -016 THROUGH -029
Figure 27. Effect of Igniter Torch Mixture Ratio on Fuel-Rich Platelet
Injector Ignition
68

.2, . ..
IV, B, Test Results (cont.)
identified as being in the second longitudinal (2L) mode. The frequency ofoscillation was 600 Hz, and the amplitude was .827 MN/m 2 (120 psia} PK-PK.
The gas temperatures are shown in Figures 28 and 29. The
longitudinal combustion instability usually improves the gas temperatureuniformity through improved mixing.
Test -016
Test -016 was the second platelet injector screening test.
Four Pc-MR operating points were achieved. Five operating points were
planned; however, a temperature probe kill terminated the test early in the
fourth Pc-MR step.
The temperature kill occurred at the high-Pc (17.2 MN/m 2
[2500 psia]), nominal (0.3) MR condition on thermocouple wall i (TCW-1). The
temperature kill was set for 1256°K (1800°F). Post-test examination showed
the thermocouple to be protruding about 1.6 mm (I/16 in.) into the gas streamrather than flush with the wall, thus creating an erroneous shutdown. A new
TCW-1 thermocouple was installed prior to Test -017.
ignition was smooth, with a slight overpressure as shown inFigure 30. Unstable combustion was encountered at nominal Pc (15.2 MN/m 2
[2200 psia]) and low MR (0.25). The frequency of oscillation was 600 Hz, and
the instability was identified as being the 2L mode. The gas temperatures
are shown in Figures 31 and 32. The longitudinal combustion instability
improves the gas temperature uniformity through improved mixing.
Test -017
Test -017 was to be the first of three added scope tests.
The objective of this test was to verify the effect of reduced chamber length
on the longitudinal mode stability. The 292-mm (11.5-in.) chamber sectionwas removed. The main injector simulator flange, without injector simulator,was installed ahead of the instrumentation rake to achieve an overall length
of about 533 mm (21 in.).
Ignition was smooth and normal; however, the test was ter-
minated 50 ms after ignition by the TCW-1 thermocouple kill. Post-testexamination showed that the new TCW-1 had been installed about 3.2 mm (i/B
in.) into the gas stream, causing the thermocouple (T/C) kill. TCW-1 wasretracted to be flush with the wall, and the thermocouple kill was moved to
the gas probe temperature i (TGP-I) thermocouple prior to Test -018.
69

QF ........_.I - °
Ii ............. : ....
...... : ........ I ......
". "'.'iii'!.-............
...............T ........
l
O'J
I ' ' z, i i=
{ ...... i ........ _j __
¸ i '
.... I ......... _: c=_° _ _ f'-
• i .... E JI ....... I ......... ]
- :
•ii. ii-i;iiii..i _ ................ /_ ,_- _... Ii il_l"_ .......
' ' " ' ' " I_l
" : ...... _ , , _ /,_W / / t _-Ir
................. ,,._ . ._ . . :. ,;_ _._ ..
........... I ......... i" '
................ i ................ _ if
_:"::I i:::-:i........_......_, ____Ii::itY_',_;_i;: i :::-:i
I7171yii..iiiii__i.i:ii:iii_iii_iiiiii_'I_..:.......fill._..:....,.....÷ _: _Y !_T ....1............I....... 'i!........_......_.i..i.._....i!.!..,........ii-+I......_.........
........L..L..;.._.;,...:...._....i...._ _"_i...i....i...i...i...._.._...i....iI...L..L._...._.....i......._..._....
_ _ " I II I .............. Iil.. _ ....... ill . i+ ii ._I.._ . iq _ .1. I ............. _I "1 !
iil-".'iii_iiiiii_illiii:iiiiiiiilL_iii'"_'"_......."........:,'"'_'"'_-"_:........_..._...i.........................................., _, _, ;....i""Y'i'"'f"": : : _ _ , . • ....
•.._ ..i--.÷......
0
£.
W.-
"0I,.
.T,-
..-,,,..._
r_
r,.,,'
,g
o_
7O

OF F'-_::_._ :-;:_L_I+'L
71

. . _,.-,_I"_
i
0
Z
0 _c
t--
>n,.-1.4J
COZ
UJ n"
--_r'n
L_I ..J
==No_
_z=N
__-
o
!
l--
l,-.-
0
f,,,.
f,-
"".1 I_0
D. t
,g
72

OF P*3"..'_ QUALITY"
i
...... 1
..... _r
A
o
|
_g!
£-
£-
e_
_-_0
_..
_._
4-"0
_j q_
,g
qJ
0r-
I,
73

74

01 z --.""' :'_ '_"'_ ' '_ .... :
I
• o
00_ 0
oi
4-)
I---
E°,,-
l-,-
f,,...
E
¢.._
r,,
OJ
l./m
eO
Ec"
I_
e',
c-
.I,,,-
U-
75

t ..........
_l_
L
I
!
b-.-v
L
t_
O.J
_J
0
V) .---...
"0
_J ,-.I
_0
..E u'_
U (]J
• _ I---
¢d
o_...
LI-
76

I .....
L
i
I,#1
L
_J
I
!
I---v
(¢1
L
q.J
t_
e'L
E
0
_..
O-
c_ t',J
_0
_O,J
_.0
e- U_
• _'-- t-'-
C_
,g
f,..
o_...
77

....
i _D
Z
,,,_. - __.o
1:::_- , m _ _..
0. _¢_ _ --
0..
0,_.
"0
,f,-
r'_
tY
'd
,e-
78

i
,$/}
m
',,0!
k"v
,$,,.
.¢.,..}
,$..
I'--
0
_OC'd
(--0
_0
_J(xJ
_kO
.Z3 _--¢
qJC3
U (I)
E
" I---
o_
14-
79

IV, B, Test Results (cont.)
Test -018
Test -018 was a repeat of Test -017. Five operating points
were successfully achieved. All operating points, except at high Pc (17.2MN/m 2 (2500 psia)) and low MR (0.25), were unstable in the IL mode, as
indicated in Figure 33. The gas temperatures are shown in Figures 34 and 35.
Test -019
This was the second of three added scope tests. The objec-
tive was to determine the damping effect of the turbulence ring on the long-
itudinal mode stability. Analysis indicated that the turbulence ring should
provide damping and improve stability. The 76.2 mm (3.0 in.) turbulence ringdiameter was installed about 127 mm (5 in.) from the injector face. Selec-tion of the turbulence ring location was based on thermal considerations as
discussed in Section IV.C.I. Five operatin_ points were achieved. Alloperating points, except at low Pc (3.1MN/m _ [1900 psia]) and high MR(0.35), were stable, as indicated in Figure 36.
The turbulence ring has a stabilizing effect on the 533-mm(21-in.) chamber length. It also has a significant effect on the temperatureuniformity, as shown in Figures 37 and 38.
Test -020
This was the third added scope test. The objective was to
verify the effect of the turbulence ring on the longitudinal stability withthe longer (787-mm [31-in.]) chamber. The 292-mm (11.5 in.) chamber section
was added to the 394-mm (15.5-in.) chamber section, with the turbulence ring
in the same position as for Test -019.
Five operating points were achieved. All operating pointswere stable, as indicated in Figure 39. The gas temperatures are shown inFigures 40 and 41.
Test -021
This was the first test to determine the effect of operatingpoint on carbon deposition. The platelet injector was selected for these
tests. The test configuration was as shown in Figure 42. The turbine simu-
lator blade openings were adjusted to the gap sizes shown in Figure 43.
Post-test examination showed light carbon buildup on the
turbine and main injector simulators. The chamber pressure was found to riseduring the entire test, as shown in Figure 42. A detailed evaluation of the
80

- . ., . °- . ,
I
co
oI
CU
I--
q.)
H°1--
(._
E
S-
C
S-
S-
t-
U_--.
cl:
0
::_ ,-.,_1._ _.-_
c, rb
q_
.i.--
i,
81

(: j
Si"
I -- ¢D
Z
=
taJ cc
_9
LIJ _u ea
>_
_=-_
C2 L_3 _
C_ Ct5 C_ _ .
I
I'--
,e--
I'--
:>
E
S..
L
tO.--..,
,-- 0
CO
tLv
82

OF' i:L:-';:"-.:,-:-.._; :
i,#'l
i.,-
1.1")
I
I
I--v
I=
I.--
0
l,t') ,_.'_
fO0_l
0i.
_oi... I
c'-
• i.-- I---
p.-
,_ op.
" I--
f,-
I.I-
83

.T .....
I • . .
Z
u
_Z _ _l_J OC: m
t_
!
g.
v
f_
e_
I'-
o
r_
4-._0
r_
U (L)
r,,,.
,g_ N
c_
c_
,e=,,
84

z
I
I
v
IIJ
l-
e_
i
QJ
0I.,G.
rl:it"_
_o
i.
£.
"_00
Q.,iol,,- i
e., u,i
tJ I_i
•e=. I,--,..,,.
'd_ N•_ .p.
op--
85

JJ
(/1
"',1
.I,.
0
I
I
I""v
f,,,,.
::3
i,,,..
{:::l.
EI'--
0
,e.,
¢.._
e-" g_,
U
,#
_d
t_
,r,-
86

'' _'- .-I._,_LiTY
E_ZZ
O_
0
!
+J
O_
p-
E°_==
Uq
CJ
CL
CJ
,.,,,,
m 4-
0
o_
87

Z
o_ __
• I _ li
[ i --- -_ > _
¢'_U- - . _ _
m z:Z_N
11-
f_
_ _J
II_ _
I
-II)V1
FI
_II.-
V1
SI.
S.-
V)
=E
C
S..
L
(a ..-_or,-
I
L_-_
S,.
•e,...
88

C'j+.( ,. .. 'J ;" v•_'_. :-'.' .+-,.+u.!_
OF "+"+' _'; .....
i
...... I ...........
...... i ...........
• ......i........... -__,T i ,?,
¢'¢3
• r,,,-

>gg
gg a
o
" .............. ! J '1 o_
2
', ....... 10 ; [=_[ ........
! .... t- i ........... =,
. I n .g- "....................... _, ..... _ • _ _, - -_
"} ] - = r'-.,' _ ,_. . _ _ ,............................ ,_ ,1.... ,= =:::,.-..:.,-.-:..,,.4_. " ;.-=..--, - .--....,...+-----.i_'..- ..... =
• i
i i .... _i_i " .ii 117..ii .... i15_. ' i.... " - |_ I
3[ ........... : .................... ,......... ; ............. 4. . , ....... i .......... . .........
- =+ g g g o _ ....
t_
I
g.
v
el=I.
e_
E
I--
_._.._0
u_-
_e,J
Im,
4_
._-
,g_ E_ -r,-
90

I_'. _ _ _ "_'_
OF POOR _U_,LITY
.......... i ..........
91

:!: .: L ." 3-: ''
I
,
C:_
Z
c_
cur, _,
I,-- el:
¢I')
,,,
t',_.." _.2,
L_I .-J ':t: ..,0 c_
_ _.. _ . _
C_ Z_,- _
0
,e,-.I
!
I
O-
r._I---
S.
S.
_=
F--
0
q-
,'0
Q;o,J
_Cr_
0.
U Q._
.r--
,g
92

OF _O_R WU,_LITy
...... L .... L_ : .....
. " ..... [ .... 1
/ 4 : I l............. ; ......... I1 ......... 1 ......... T.......... t-' Wl_ ...... _......."_............. !/......- ..........) '......... ,_ .............. T............. : ..... _ _ _ ...... i .........
, , , Jl i : . / L ....... l _ _ I l' I "¢*'I..................iI.........._ ....... : .......................... 1, _; i 1 ......................
...:................. :......... : .......,I.......... + ........ :....iitl:--: :.......... t ......... - 1....: .......
"'_ ........................................ I ............ + : ............. J.................... _........ !
:!;: _l': ,1: ' _: _........:t*,......._L'I .........:i ...._'.....i..... 7.._ ................. _.......t...............i ....;...............,.-- ......:...t_...._
• _ t i * j • • .oOOOOi' 0009£ 0000£ O00g_ 0000_ O00g I 00001 O00C_ 0
i a AIIGi,L IgOd IA_A
O
OI
I---
E°r-'-
E
t_
_2
r-u_-..
.I"-
I o_-P- 0(_
i,
93

.... % :. ,.,)
i
z: z
•T ,.T _ ,.,
('_
L
if.
g4

C,_,_ .'+' ".: ,' " ,+,.,'+: .L .... +,,.
i. _+.+.,+. ,_; +., , I.-,-_,.¢
H
I "-_,L _ _ _ _ _ _ • • _/. ........ _
._J _ •
............ _ 1..-, ml:F •..................................... u.+, ,.,+ _
p............ ; ............................. DL_ + ++ • + _ ++I Z
+ +"" a k-eYo_
, _j
. . J ':+"-+ ¢,._)_ , _, - .......... I, - ] ................ +'
_-+=+ a g+
........... I ........ , ....... -- ++,,+
...................... : + _,..,+,,+" _m, . i t r + ' " + ..... L .... | e",+'+...L-- . _ -.-+
............ _ +,,.= gI ...... ; .... : ..... + .... + .... _ m'- - ++.
__ _ L_ Oz=_- +- ei
+ , I
I
....................... .+;,. . ...... p.
I....... .+ ...--T_:;._..+, "-' ' /" +.-" IIi '
......... t"'., ./k","/'" /' , ....
.............. -+';i _ ..... '- L._, +.....
.............................. i
_LoZ ii ._ ...... .... I?+IL+I',. ..
........ _.................... t ......... _ ....................... +................................... +.......... ;-+ ..........................
t + :i: i i_i i i i +i.... '_:i .....:.:i::::.:::': .: ::+:i.::i+_.+I• :+:+i.. : .. .: i: ,;,:L: :.. :_:_:
::L:.:,I:!:-::L ::..:::: :::: ....: _t.......;.....t'+....:_.......'.......' I '='° ':'
+ I " I _ " _ " ' I ' _ .... I +,° .....
f.,,,.
I
I
l"--v
E0
0
0
t_O
0,--_
O0
_ °_="
LI-
+o5

LI . •
!
,.2!
I--v
L
p.-
t_
-o
_'
S.- I
• r,- F'--
.p-
96
I

o
" 'll ..................i .......... i............. T...................I ÷........ ..............." I....I I " " 1 I
I
!
I--
f_
e_E
F--
_Jr_05-
o-
_:_ o,J
_0
._o,J
e- u_
._-. _--
_ °e'-
°r'-
97

i ......
, , . , .
" " I ..... I ....
............... 7-:............ [
C:I
Z
iz
uao._ -
uJ _
_a3I--- l._l Z
C2: C2: z m mr...3Z _ _ ,-
............................................ el
¢..1
..J
A
o
!
!
I-
E
l--
aJ33o
rOC_d
"0
L_C_
_C_S- I
qJ
,g_ °_
1, )._
98
I

t ........ i
0
v
I
E
_u
r_!
u_
°_
L_
_9

z
E
, (I .
....-.....I_. .....r_I
....,........_...........................:......._
0
v
0!
I--
E
b.-
°_.,.
I
l.i-
f..
I00

• •
I ° °
I ° °
!
°/°°
I
0
°_,,,
i01

IV, B, Test Results (cont.)
chamberpressure rise with firing duration was madeto determine howmuchwasdue to thermal effects and howmuch, if any, was due to carbon buildup.These results are discussed in Section IV.C.1 of this report.
The measuredpressure ratio (Pc-I/Pc-2) was about 1.35. Asshownin Figure 43, the blade spacing was adjusted prior to Test -022 to tryto increase the pressure ratio to about 1.5. However, it was found thatreducing the gap size changes the discharge coefficient (CD) such that theoverall discharge coefficient area product (CDA) is larger than with thelarger gap. This phenomenonwas also observed during the cold-flow testing.It has been found that placing the blades close together causes the flow pas-sage to behaveas a supersonic nozzle rather than as an orifice. Conse-quently, the flow becomessupersonic in the blade and shocks up to the back-pressure.
Test -022
This was the second test run to define the carbon buildup,
at a planned chamber pressure of 17.2 MN/m 2 (2500 psia); however, due to
the lower-than-desired pressure drop through the turbine simulator, this
pressure could not be achieved.
The chamber pressure history is shown in Figure 44. Post-
test examination showed minor hard carbon buildup on the turbine simulatorinlet.
Test -023
This was to have been the third carbon buildup test; how-
ever, the test was terminated immediately after ignition due to a facilitypressure kill parameter. The kill was initiated by the fuel inlet pressuretransducer due to a waterhammer wave during the start transient. The wave
resulted from the high fuel flow transient associated with starting at the
high-Pc/high-MR condition. The pressure wave was nondamaging. The kill
pressure was reset to a higher pressure for Test -024.
Test -024
This was a repeat of Test -023. It was terminated prema-
turely by a Pc-1 kill due to a transducer failure. Post-test examinationshowed a large pressure spike in the Pc transducer. Examination of other
hot-gas transducers showed them to be contaminated with a black gunk. Subse-quently, all hot-gas transducers were removed and flushed before each
firing.
102

......, ,;'L;.:.LSTY
0
I
E
r_
.r-
!
L_
U-
103

-': ":" IS(- _-_,.",;',',",i .:';, .:;_,,_- :-.,,-.,:_ QiJ,_LITY
f,.,
o_i1
104

Oi: p:':r,:_C':'ALtTy
IV, B, Test Results (cont.)
Test -025
This was the third carbon buildup test. It was run at the
high-Pc/low-MR operating point. The test duration was limited to 10 seconds
due to the high fuel flow at this operating point.
The Pc history is shown in Figure 45. The Pc-igniter trans-
ducer line ruptured during the test. No other hardware damage resulted.
Post-test examination showed that the rupture occurred at a low point in theline. The line was replumbed to eliminate the low point and avoid material
accumulation. A purge was also added to preclude fuel-rich combustion pro-
ducts from backing up into the line after igniter shutdown.
Examination of the hardware showed some hard carbon buildup
and evidence of erosion of the turbine simulator blades.
Test -026
This test was shut down immediately after ignition by a
low-Pc kill parameter. The Pc momentarily dipped lower than expected due tothe feed system dynamics, causing the low-Pc kill to be activated. The low-Pc kill limit was reduced for Test -027.
Test -027
This was the fourth carbon buildup test. It was run at the
low-Pc/low-MR operating point. The Pc history is shown in Figure 46. Post-test examination showed some hard carbon buildup on the turbine simulator.
The turbine simulator blades and housing were noticeably eroded.
Test -028
This test was run at the low-Pc/high-MR operating point.
The Pc history is shown in Figure 47.
Post-test examination showed progressive erosion of the tur-bine simulator and housing. Erosion was also evident on the main injector
simulator and the nozzle. The erosion appears to be due to chemical reaction
aggravated by high gas velocities and liquid droplet impact.
Test -029
The objective of this test was to determine the effect of
fuel heating on carbon buildup, performance, and stability. The fuel temp-erature started at 320°K (117°F) and reached 379°K {223°F) before the end of
the test. The fuel flowrate decayed during the test, causing the MR to shiftfrom 0.3 at the start to 0.35 at the end of the test. The Pc history is shown
in Figure 48.
105

_'_4_ o
Z
.... ]] ..... ii " If:-., ............ -_l _
i
............... i "_ ......... [ ........ 7- v.............
". _ _ _ _ __ o_o
0
v
!
I--
E0r-,,
I--
L
r_
!
L._
0r,-
!08

..... +_!_ ! i: ,̧ .i_ ?+_
Z
O_ "4
5+
Z
(,J_ n
u
e_
z
o
_M
o¢
F.--
°r,-
I--
ce-
e_
e-
°_-
t
107

L_,-.
, ["r
q
q
..... "- ' t o =._
I
i , . i; II_--'i .... ¢
t ........ i-; .... 1-. ;- s
t !o(
........... 4.... L:. .............................. : .............
. Ii
r ---
..... i.
____...._.......__._...._ ..........
,,n
i
......... .... r _
!.................... .}._N
/_ -. _' ..................... Lo
I
E;
Z
_ .
I_LLJ z
..fi ,_ o _
"_ g -
zg_
_ u u
¢'M
0
v
r_
CM
0
I
t--
E
V1
¢)
v_
t_
C
E
-I
f,-
.E
U.p
¢E
I
i,
E_
L_.
108

""""""-.-.--r ' ,':'.!AL',"r*;'
i
!
........ : I" T " r i" 'T............. : ......
_J
C
_=
R.-0
q,.Iv
p,...C'_0
I
_JI'--
° I""
F-
crl=}
$...
_J,i..
r.,
sZGJ(.-
r-,_J
rL
°_-..
I
,.6
9.J
.r=,,
109

"._d_,_._ * .,_ Z "_-',_'_
rI............ T ...... !....................
ii0

t
• • . !
_, -
z
O
!
im
_P
°i'D
_Z
i
._-.
II1

OF POO_,_ C,L,;\kii-/
0
v
C)I
4,-)
F-"
E
"s
oc"S..
e-I0
L'-
(,.3.r--
_YI
%i,
S..
.r--
112

C_"_P.'.sl7, ;7 :}.
_J
',.l--O
("_I
.
0
I
I--
e,-
L
_2
£-
e_
e-
• r,,,-
[
t,.l,-
113

IV, B, Test Results (cont.)
Test -030
This was the first of the add-on tests. The chamber con-
figuration was as shown in Figure 49. The nozzle using the EDM injector with
a turbulence ring throat reducer flange was left off, resulting in a lower
chamber pressure than planned. The planned duration was 14 seconds; however,the test was terminated after 12 seconds by the fuel intensifier capacity
limit kill due to the higher-than-planned fuel flowrates.
A chamber pressure versus time plot is given in Figure a9.
The measured gas temperatures are shown in Figures 50 and 51. As can be
seen, the temperature distribution is very uniform, indicating that use ofthe turbulence ring with the EDM injector is very effective.
Test -031
Test -031 is a repeat of Test -030, but with the nozzle
throat reducer flange installed. The Pc-MR conditions are indicated inFigure 52. The gas temperatures are shown in Figures 53 and 54.
The temperatures are extremely uniform. Combustion was
stable at all operating conditions. Post-test examination showed no evidenceof erosion of the turbulence ring.
Test -032
Test -032 was run at the same Pc-MR point as Test -031 but
with a shorter-length chamber. The operating points are shown in Figure 55.
The gas temperatures are plotted in Figures 56 and 57.
2. Oxidizer-Rich Testing
Twenty-four (24) oxidizer-rich tests in all were run. Tests
-001 through -012 were propellant cold-flow tests which were run to establishmanifold fill times and injector and fuel valve Kw's. The final valve
sequence is shown in Figure 58. The oxidizer preburner valve (OTCV) and theigniter are sequenced on with FS-I. The oxidizer manifold fills about 10
msec ahead of igniter ignition. This prevents backflow of igniter gases intothe oxidizer injector manifold. The preburner fuel valve (FTCV) is not
signaled to open until the igniter chamber pressure reaches 1.7 MN/m 2 (250
psia). If the igniter chamber pressure does not achieve 1.7 MN/m 2 (250
psia) within 250 msec, then FS-2 is initiated The igniter is signaled offwhen the preburner chamber pressure reaches 619 MN/m 2 (1000 psia). The
fuel valve is signaled closed by the duration timer (T6). The oxidizer valveis delayed 150 msec to provide an oxidizer lag on shutdown. This sequence
114

_°°....._- _"_..:J1 _ k-_ '_--''¸".....
, '................."_ " ._k[.i _...i .I .:..i_.;i; i.._i.ill_i.-i;'.iii;........................................................._ .
....... !
- -. ! r ......... c t ..... t ..... _ " " _ .........
........I- /ii.;|" : ..... _ I+........." " .....
! ] ' lJ._, [ I_ -
(.D
Z
i....... i.... _', , _ , , t i -
-;;-_K-t--'-,--:--:-.-;,....;-.-:T .......::-,'-_.._--'--;---:....."
• . . _ _ : __ •.... _- ---L..........._------i__.._l ,.
I.....l--_-.........._........;......................• ":-;-rz_ .........;d--_-_-_" I " ', .... _ " " "
,I .I. _ ..... I " _ ". s_ : " " _ ' I
__._..-_. . . _.,_____'._ ..,_........ . I I.... _ _ _ _ ,i .... i
_.._.---___-_ _ ," \_._ .... _...........................--_----_
-:--,I-::I;-;-;-;-.,--;......:--:-;-:--i---;---;I-::-:-;;----:.......;--i
................. 1"4
I
S_nSS3_d
N_IL[_Od 3A3_^
i . _ _ C_
, L. i_
oooG 0000_ 000_ 0
==
E
!
V)
I--
,,,--
#.-
E
L
Ix%
sw
,/e-
e--
,-w
,---0
m* v
!15

i
£
0
CD!
I--.
E
v3
v3.L
,,,,,)f...CO
t_
m
5..
Ec-t_
,r,.
.k,
I 4-,-- 0
t.z.v
cA
.r-.1.6.
I16

OF L_r_ ...........
, .',., .;,,+ .L',.' _,T Y
I
! - .
...............
' A
" + ..... _ " - - 1 .... 1
I • , _ , +
,,, t_l
. , i.... i.... i. ; t....... L
'4, • i •
0
z
L
0
Lf)
!
I
V_
r_
Q.
Eo
t---
o
0
CD
0
0,--__','v
_0._ t')
O0
L I
..E ,./1
(J (1_.p.p..
P- 0
o E
L_-H-
c;
0r'-
LA.
117

OF FGC_ QUALITY
I
,,j
_j !"
I, I :k .'
_r, r
I "° ill ,
I -J u:, _:4
UJ
c: .
uJ -- :,_ _?,
_ --,
..w _.1
i "
I
i
u
r,
-'I
A
- 7
v
E
t--
t_
0
5..
_..
t_C_
0
S.
"_C_
U
-_-t_
'd
°_...
118

• " .-' ' ""-'" "S
OF" '"..... ' "_,.,,, :, QUALITY
I
i,.-I
!
,21
P,
I--
.I-
E
I--
r_o
e_
_OC'J
(Du,-
"0
r_,_
(.; Q;
r,-
,, _...
119

it)
//!
J _-:[
I
l
I
• , . i |
........... t i
-7
.......................
..... r_
"i
z
: ....... "_i °
[ ..............
.-j
o.J w L_
O_
_,o z2
, I
, ¢___.__,::_ _-" __ F-
o_
a: E: zm m _ 4-)
f,,=
I-..
gggg_
0
"0
_- I
,g_E"_ "F--
°_...
'LI--
120

OF.:CI_.: ' '" ....OF """
4--
0
qJ
C_
v
0I
r..j
&E
$-
r_
5-
c"5...
U
°_...
I
LI-
°_m.
I.I.
121

LO
CS)
Z
ct
c_
m
el: _') -
w_
TT_
c_
.d
CxJ
0
C',,J
IT.;
v
("3
!
4-)
(lJ
F'-
E
h-
(/I
E
"t3_J
_0
(lJ
C_
(.-
_J
o_.-,
Q:
I
L_
dLI3
qJ
122
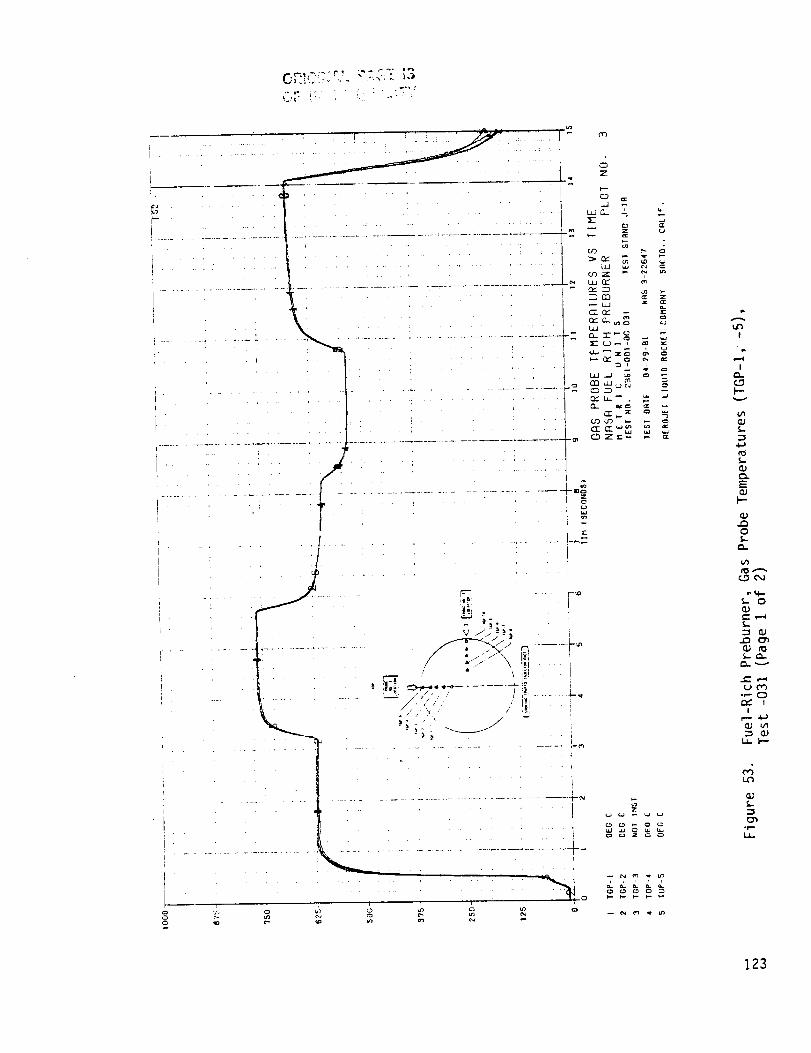
-" " I ' " "
_/_ .....I I-_" \ !;I
"-;- /
_o r-- _o
c_
Q_
2
.J
I
!
p-v
_J
S..
S..
Q;
r_
QJF-
o
c._ e,J
f.- o¢;e" ,..._
e- ,..._
C.) C'_
• '-- 0
!
_-. 1-"
,,41.0
_J
°r--
123

, ._., ,,,:_,ALITY
A
!
,.2!
v
e_
¢._
OJ
e'l
of-
_o
"_'- 0
!
124

i
i
ul
_J
!
I
v
r_o
4.._0
S,.
@0
n_
J_ ¢.n
r.j
n,,,.
,g_E
!25

............. ISc _--,,_r,-UALITY
i
!
L: Z
t ............I
I
•., ..... ,.I
: 17_Z 7Z -i----7-;. -7L _
t i_:.:: i _ . . :: _o
•- - ,
I
[ ...... II
............. i
........ i
._q
u-, t; 2 =
F
r,-- --_
r,-- D_ _ l
:z::_z , _ _ ,,o
L_I _:_ _ -- I-"
1--
r_0_..
,j.) ,....._c_J
_0c_Q;O,_
S-
o.; (1)
r,-
,--- (U
._
_J
_n
126

OF POOP, QUALITY
LT - ! .......
I ...... I ...........
L ........................................... - " "
_2d-
I
L
I
?.
(
] Ul..
&
I
" ' i]'
e_
L
S3dnSS3_o
14C_ L ]SO_ 3 ^71_ ^
CO
Sc_
_._ -- °
_-- °co
v'-:
o
L_
I
: ::_S
r
c
I
I-"
.r-
l--
G.;
I=
f,-
f,,-
f,,,.
,f,,-
c.'-
I M--
C_
LJ_v
_J5.
°_-
127

I
I
r_ _
oco_, oos£ ooo£ oo'£_
i
_ o
0_2_ O_S: O0'_t
S3_SS3_,:GCS C
.!28

07" PCC_ C.'UAL!'C'-..'
g
/d¢
/
...... Lu'_
, i
L_
' , i[_I
iil
!
!
¢.o
v
i-=
,.-so
_..
- o
s--_c_
._='
,g_ -_=-
,.6
129

._".;' ,--_._,'5.R QU._LI'I"Y
....... "
• 1
i . . ,
]
I
I
i
...... j!?
Y" S
/2 .,_"
p:• -
..,i
i -
I-=iI
f
r"
I-
_.i.J r'l 'j
'..o I,,/'l
-'2:::: _--'
_, r....9. =
- " ,= I--'
,","_-- . _ _
_e N
oz_ _ __J
f,...
§ ,g _g g. g g g g
_ o_
,g
130

i
............ J.,._
q_
!!
_,;.
Ii
l
t ' "
..................... t
0 i¢1 l'-
:,Z
=_._ _ ._
C.__-r- _ N -
¢
IT : ...... ] ._.__ _
........... __
I
,ZI
p..
$t---
0
_O,J
L !
or--
131

ell_, ,,.;.-, _ PAGe. B
OF POOR QUALITY
l.r,
[ _7 • -
...,._'
.......... [ ....
i ....... !
i
..i °.
.4 c-" :F.'
,j
c.O ,,22 "- _i' "",N U.J P-_
Q: "_,,
gCZ,,. " _' .-
.~ _ c-
_.--- , > --
.. L_fi
...... _F : :" = ';:
.... i ,: "." _ .-- --'"
ii'
r _. _ _ _. _ _
u. i-
I/I
f,,.
¢1
!
!
r',
¢D
t---v
¢1g.
,,t-}
¢Dg.
to-
o.)O
_0
_C_
,T,-
r',
'd
,_...
132
I

L,_;._I_,'_:!_ _:-_:. _
IGNITER
OTCV
FTCV
PREBURNER Pc
FUEL IGN. PURGE I
OX IGN. PURGE
I , LOXID INJ. PURGE _ =Tg
IFUEL INJ PURGE
IL
T6
FS,
T6 -
T7 -
T8 -
T9 -
Tlo -
TIMER FUNCTIONS:
Tl - OX IGNITER VALVE OPENING DELAY. DELAYS OX VALVEOPENING FROM FUEL IGNITER VALVE OPENING.
T2 - FUEL FLOW CONTROL VALVE DELAY. DELAYS VALVE 0OPENING FROM INITIAL OPENING SIGNAL TO FUEL FLOW
CONTROL VALVE.
T3 - IGNITER CHAMBER PRESSURE SHUTDOWN. IF IGNITER 250PRESSURE IS NOT UP TO 1.7 MN/m2 (250 psi) PRESSURE BY T 3,
A FS2 SIGNAL IS OBTAINED.
T4 - PREBURNER CHAMBER PRESSURE SHUTDOWN. IF PRE3URNER 250PRESSURE IS NOT UP TO 6.9 MN/m 2 (I000 psi) BY T4, A FS2SIGNAL IS OBTAINED.
T5 - CSM SHUTDOWNLOCKOUT. THE CSM SHUTDOWN WILL NOT BE 30INITIATED. UNTIL AFTER T5, TO PRECLUDE ANY PRESSUREPERTURBATIONS DURING START TRANSIENT.
DURATION TIMER. GIVES THE TOTAL DURATION OF THE TEST 500
OX IGNITER VALVE CLOSING DELAY. 50
OX IGNITER PURGE VALVE OPENING DELAY. 50
OX FLOW CONTROL VALVE CLOSING DELAY. 150
FUEL IGNITER VALVE & SPARK DELAY. 0
TIME (MSEC)
I0
Figure 58. Oxidizer-Rich Preburner Test Sequence 133

IV, B, Test Results (cont.)
ensures that the preburner mixture ratio remains oxidizer-rich from startup
to shutdown, thus avoiding temperature spikes due to adverse mixture ratio
transients. The igniter was initially orificed to provide an oxidizer-rich(MR = 40) rather than a fuel-rich torch to avoid the possibility of erosion
around the igniter exit. The igniter was subsequently run fuel-rich with the
platelet injector.
The test results are summarized in Table X on page 142. The
oxidizer- rich test series is designated2351-DO2-OG-XXX.
Test -013
This was to have been the first oxidizer'rich EDM injector
hot-fire test, but a spark box malfunction terminated the test at the start.The 394-mm (15.5 in.) chamber with a Rokide-Z-coated liner was used. The
nozzle plate and nozzle throat reducer were also sprayed with a Rokide Z
coating.
Test -014
This was the first hot-fire test with the EDM injector. The
chamber pressure, igniter pressure, valve positions, and manifold pressuresare plotted in Figures 59 and 60. The test had been scheduled for i/2 sec-
ond; however, a computer logic error caused the test to run for 1 second.
The igniter fuel line developed a leak at about 0.750 sec-ond, resulting in the loss of the igniter and damage to the injector body andoxidizer manifold. Post-test examination of the hardware indicates that the
leak probably developed at the fuel inlet line "B" nut. The failure may have
been due to fatigue associated with a high-amplitude 650-Hz IL mode oscil-lation. There is also the possibility that oxidizer was forced back into the
igniter fuel line by the oscillations. Check valves were subsequentlyinstalled at the igniter fuel line inlet to preclude this problem.
Damage to the injector faceplate is shown in Figure 61. The
damage is in the igniter mounting port area. As shown in Figure 62, the metal
slag deposits on the face are from the resonator ring which suffered some
damage when the oxidizer manifold burned through. The chamber and nozzlewere undamaged. The test stand sustained minor damage, as shown i_ Figure 63.
No erosion damage was incurred by the Rokide-Z-coated
chamber and nozzle as a result of the injector pattern or the oxidizer-rich
environment.
134
I

OF F'C.G3: O!."AL:f:[
-- o,l o i_,
v,
5-
u9
nO
I..
C
5..-.i
¢_ c,,.i.L
0
I¢ ,,-..__01",4 !
• i_,-,,
x01--
04
°r I
135

...... ' ...... PA_ IS
..... '_ C;U_,LiTY
u?.I " I oc •
...... t ..... +,_+ _+++<,++++ ._'t+i _ Z_-+ + + ,-,....... _-+.------lJ,-......... J+-,-- _ .+_ ' I I ' i ........ -+............ ++-...... _.__J,u.
........++ -<-+++ ++!....... + + "_c:) .... +
..... + .i-_ ........ i CL - "
=+ i+ + • ; =+++ : ,..+,. -- +. >,,,+-,..+ + + ++ ..... +
+ " + +M " ' u_u_. ,++ _+a_ +, | ,]/t , : z _ .......
__ ___! ++L__._L....... -__ .-
.. , ,_++.. ........ ,_ + .... , ......... -J i....... L+..... , ....... / ........ + ....
,+ . :_'_+.+.+_+:___.__. + +_+_..____
+++++.....++++++++-........ ,+....++++ +__i ...... : +_++.. + ..: . +.... +.... + I+-+ i+: ,,,.< +> 15+ .........+++++,-+....... : - + _t • ::, . . + + . ; . z.... + + ............ i- +........... _.......... '- .... ,:;,=
+ + _'++ ' : ' '+i + ; _++_.m+... ,+ 1 ' ' ' 1+ • + . + +I +.' ._,-,'I_+,.-,. + t . i _
' ' ' . , ":+ + .+-+m . '. + ' '+• II [,.,+,.+, + i_,+;_t _ +__:F-............... -_-----.+............. _ ..... _ _ --; .... _ ...... + ............... ---++-,,
[ ....... IN "l . 'i t ...... I '='l .... +..L+ ...... -'++ . : .......+.u. ..... I_++ .p + • : +
+ + ; • :+ . ++I ..... + ..... 1L............. -+---_--............. - _..... m ............................. +'+ --_.
• .++ . . . _ + .+ ..... ; +_'=. J.t .... + + .......
c.u
#
,=,
+--,
_"jr- _,.+..++<.2"+z:m -_ct z__LU
go_
1
............ + ............................. IC'J r -I - + .......... + ......... -- '
i r _ { 1 / / ......
|.... t_+_.... :__.u............. _ __+....+ '-' + + ! + c:,
' ,,<ot I " ' ' " ' +' +_ !+ ,o+.,_,_ +, 0:; + ' ' i r,'+ _..--I....................................................... _ ........ ..j...._..;_.
.............. "r................................................... +"__=.'+%+:-=;
• ! ......... +o: _.' . ..._ + _ i
..... .+,..+ • ' ............ +__+L-'_+
\i +++++/ !.+_2i:-i i!.....ii:+_::........._.21+i! _ +'- "....................... -._ +
+ +i\! ..... : I_ _+__+++I
ooo_, oos£ oo0£ oos7 ooez oos+ ooo+ oosgS_R£g3_d -- c_ o u,.
r
N{3: I [_OId _A'EIA
E• e,,,,.
im
S-
S-
S..
r,
S.
C
L
_3CM
&.
0
UCM
+_.- v
L_--+
N I.p
"_ -IJ+p V1
X
L_
S..
0p.
tt
136

•_, ._._-_.-.,.Pt_'._:_ }S
" QUALITY
i
[ " .
I .... ] . . -
. . °
0t'-
I--
(J')
4,-)
t_t_
C
e_ q-0
_,-=(°)=_v
r_I
f.. _..._
N I
"0-_
c_
_Jt._
.¢..
137

......... F';:.:ZZ i3-*_" " _ _ "4" _-;''_"
;:h _'--:¢',:);_QUALITY
E
I-'-
t_
t_
<lJ
Ee_
e_
¢-
._Q _,-_
0
t-.-
U c'x.Io_
N I°_
o_
Oh--
_0
°_..
138

ORIGINAL PAGE
8LACK Af,,/D WHITE PHOTOGRAPH
139

,.3_
!
4_
b--
0
0
N°_
.r--X
*r--
140

BLACKAND WHITE F;-iOTOGRAPH
I
(1/I.--
O
e_
g_
i--
e--
t_
e-
0_..
t
N
°r--
X
o
a_
0r,-
141

_o_
_ °
®
A
°
_2
g_
,.4 _ 2_
J
- _ _ _ "_
m
e_
_ _._ _._ 2.
.2 £
142

IV, B, Test Results (cont.)
Test -017
This was the first attempt at a hot-fire test with the
platelet injector. The 394-mm (15.5-in.) lined chamber was used with the
86-mm (3.4-in.) diameter turbulence ring. The turbulence ring was installed
to provide damping of longitudinal mode oscillations. The test duration was
0.5 second as scheduled. The igniter fired, and the fuel valve opened, butno ignition occurred as can be seen from Figures 64 and 65.
Ignition did not occur because the oxidizer-rich igniter
torch was quenched below the ignition temperature before the fuel spray could
penetrate the oxidizer spray cones. This is illustrated in Figure 66. The
fuel spray was totally encapsulated within the oxidizer spray cone, such that
the torch did not contact the ignitable mixture before it had cooled to belowthe ignition temperature. No combustion occurred between the torch exhaust
and the oxidizer spray since the torch was oxidizer-rich (MR = 40).
By contrast, good ignition was achieved with the EDM injec-tor and the oxidizer-rich igniter (MR = 40) since the injector is designed
with 10 small fuel orifices around the igniter port. The oxidizer-rich torchexhaust ignites with the fuel from these orifices and provides adequate
energy for a smooth ignition. The igniter torch was reorificed to a mixture
ratio of 3.5 prior to Test -018 to induce combustion between the torch
exhaust and the oxidizer-rich spray.
Test -018
This was the first successful oxidizer-rich platelet hot-
fire test. The test parameters are plotted in Figures 6? and 68. Ignition
of the fuel-rich igniter exhaust with the oxidizer-rich spray occurred as
planned. This is evidenced by the chamber pressure rise prior to ignition.The fuel-rich torch generated a chamber pressure of about 2.4 MN/m2 (350
psia) as compared to 1.4 MN/m 2 (200 psia) generated with the oxidizer-rich
torch on Test -017. However, ignition of the fuel spray was delayed about 40msec from fuel entry into the chamber, resulting in a pressure spike
approaching 27.6 MN/m 2 (4000 psia). The fuel does not adequately penetrate
the oxidizer spray until it achieves sufficient momentum or injector pressure
drop. The quantity of fuel which enters the chamber prior to the time this
condition is reached is sufficient to cause the large overpressure.
Post-test inspection did not reveal any external damage to
the injector although some of the fuel orifices appeared to be darkened bysoot. The resonator seal retainer ring was damaged and seal leakage was
evident. The ring was easily restored to its original shape, and a new seal
143

....... i........... _ ...................... r........... .I,-_.......
i • • i i]• , [
" " I
- • - 1 ...... ! /_ "_.... L-........... __............i............_ .... _--........ _,....7-
+---" " ° I .... : ....... ' .....
..... ! .... . : ....... [ < .
l
......:......!:l- _1 , ....... -_ l_--_tt
--*41 ...................-• . ' _ -T'_ "'-
...... } ..........., , t, ................. I _ " "
t ...... : ..... i- ......................... i ..... ; J- -f- J
/ I.... _; ...... .... ; ,
....................... -L----------.._.-- ............ _.
',,,:,....... ..... 11
t : : , ........... _ ......
, _ : ....... _1 '
: t..... _: : ........ i " ...... [ .... _:_: .......... =,_
_20o_o_9_, tl_il_ o_oo_ OOOaZ ooPOZ oooat oooot oo_a d
- II_tttCHl_a*'_*
z
f...E3 ==._J _
¢.o_Z _ o
_ , m
• = _,.,-_,, ==_=, ,. _
, L,._ -,r- c,-
z - Nm _
Eor---k'-"
f,--CJ
[,..
a3£..tt_
f,,.
L/1
_J
S..
.0 _"_¢;C'd_..
__ _,-0
,.__,.-_
C_
N I
X _JC_k-
_0
144

OJE
._=..I--"
(.q
q_
_J
OJ
0.)
b,1
C
0
m I
Oh--
Cd
145

[
[............. _ .......... , 1,__
. . ," , .- , [ , ,., .
' " ' : j_,_l , , z z , ,, , r , ........
, ; , : _ . _ : ..... _ .... i ..... I'II
11
°r-
1,!..6

..L..L..._.I.........._.._..:..l..i......._..._.....; '...,_ . _..l.........I _ £...... _.- _ : ;ll.l I
........... 1 1 [ I __J | o......i i ...._ _ i :,...._ _._...;i .i.... _ _.L..i.. . : i i. ; ....... ; z_
z:_ ,-N §
• .[ mN=g g
''[ ..... .'i "" i:1___-_ I• : .... t ,.
_ ..--._- ._ _- 4--- _
! . . : ...... o
. . [ i-i--.......................... . ...... -.' .............. _"_
i .... _ ' i. -! -, , •
..... i .... ',..... J ...... " '. _I_
_.... !.... _ .. ; -....;-;.-;--:--;_.-}Fo
: . . _ ......... } • _ ......... ,.l.fl.i _.. _.....I.; ..... :.. _ .... _.- _ TII _
.... _ _ I . _ . 1 . , _ . I_,.__-_-_'-_-.......... _-........... _ ........ -k..... _ .......... __F°,
. . L .... 1 t:
°_.=.
I--
$-
E
e_
E
_e,J
C
(.-
U_J
I P_
£_ p._
N I
op-
,p,-
X
_D
_U
E_°p.
L_-
147

IGNITER
OX-RICH
F PLATELETINJECTOR
OX
FUEL
TORCH QUENCHING
FUEL
FUELOX
OXIDIZE_RICH 02/H 2 TORCH
MR = 40
TEST -017
IGNITEROX-RICHPLATELETINJECTOR
OX
OX
()X
OX
IGNITION OF TORCHEXHAUST WITHOX-RICH SPRAY
FUEL
FUEL
FUEL
FUEL
FUEL-RICH 02/H 2 IGNITER TORCH
MR = 3.5 & 1.2
DETONATION
/ WA_
)IGNITION OF
--FUEL IN
THROAT
TESTS -018 & -019
148
Figure 66. Effect of Igniter Torch Mixture Ratio on Oxidizer-RichPlatelet Injector Tign ,tion

.,e=,
I'--
.,m
I.
Q2
_J
EE
f,-
S-
C
_c',J
__U,--
0
e'-"
,e- v
cO
N !4-.
or-. i._
X
,..L',.o
Q,;
.r"-
IJ-
149

°r--
(J1
t
2
h
_J
C_J
e"t_
0
e"
_.J t'M
e_
i C_
N I
L
°_...
150

I ....... J
I .... :! .... ;I_
o
n-Z'] Zi1 '-' =
1 III e3 "
z % _:_ G m _
, _ I'1"I rl'l
:
.-- "g_
_--_
E*r-'-
p-
S,-
4-)
ES.
Ce-
0
N I
01-"
.r.-
14-
i5!

_,L'_LL;I • .',;-
OF ?CC?. _._u,-:_i,,.
z/
0
z _rr
m -
! ......
I ....
E
I--
E
e_
C
e-
_JC_
0
T O0
O0N l
L__
152

IV, B, Test Results (cont.)
was installed. The chamber liner had expanded into the outer housing and hadto be forced out.
The turbulence ring, chamber liner, and nozzle were all
clean, with no evidence of erosion resulting from the oxidizer-rich environ-
ment. The turbulence ring was replaced with a smaller-diameter 76-ram(3.0-in.) turbulence ring to increase the IL damping for Test -019.
Test -019
In an attempt to improve the ignition characteristics, the
igniter was reorificed to a mixture ratio of 1.2 to increase the amount ofcombustion between the torch and oxidizer-rich spray. The test parameters
are plotted in Figures 69 and 70. Ignition of the fuel-rich torch occurred asplanned. The pre-ignition Pc was about 2.8 MN/m 2 (400 psia), indicating
higher torch energy, as desired. However, ignition was again delayed,
resulting in a pressure spike in excess of 27.6 MN/m 2 (4000 psia). The
combustion was smooth during the steady-state portion, with no evidence of IL
mode instability. This indicates that the smaller-diameter turbulence ringis an effective damper.
The shutdown was abnormal in that the chamber pressure
remained high for about 150 msec following fuel valve closure. Post-test
examination showed severe erosion of eight adjacent fuel orifices and minorerosion of several other orifices. The damage had the appearance of inter-
manifold leakage since the major damage was localized. It is not clear whenthe damage occurred, but it is reasonable to believe it occurred during the
ignition overpressure. The internal damage precluded further firings with
the platelet injector.
The Rokide-Z-coated chamber, turbulence ring, and nozzlewere intact, showing no evidence of erosion. The resonator seal was damaged
and significant leakage was evident.
Test -020
Test -020 was an oxidizer cold-flow and igniter checkout
firing test with the repaired EDM injector. The valve sequence was identicalto that used previously and is shown in Figure 58. Initially, the igniterwas to have been orificed to provide an oxidizer-rich mixture ratio of 40:1.
However, post- test examination showed that the igniter fuel orifice had been
left out of the line, causing the igniter to run fuel-rich and at a higherchamber pressure than anticipated. The igniter lit and functioned without
incurring damage. The igniter was orificed to the proper MR prior to Test
-021. The oxidizer cold-flow pressures and manifold fill times were asanticipated.
153

- y
O000Y 000_'£ 0000£
G A '-
...., --, .... ,..............................._,2,r_-,.
000_17 OOO0_ 00091 OOOO! O0011 0
Eo_
t--
5..
o')
T,..
rO
r_
0..
$,..
,,.,'1
0.1
COJ
r,am-._
._ _--_
r'_ _-
0
J=:
U,-'_
I
x _.)
L_
O_.m--
I,
154

0 II'_'%il_ • ,n ._,L,, ,_,._" _ ,? ' _ L"_ _ ,.-,......... ,,-,,, _ _,--,-
OF _C,:3-:'_.....:....
$]_nsg3_aOOSI 0001 OOS 0
e-
l--
I¢1
_a
a_
_a
£
_ c',,j
o
0_
mf.-,.-w_0N !
0_
0e-"
x KzJol.--
cK
(].Jf.._
0_
I.i-
155

E°p-
_=-
.4-)
E
(15
_=-
C
S.
O-q--
O
_=
°_ v
N I°_
x
°_
156

Z
(=
Z r-
UJ
z
p
z b {= E
toO-. _ -"
°_
H.-
V_
E
(_
=E
_J
0
°t-- v
N !.p.
X
o_--
E_
°_.-
U.
157

IV, B, Test Results (cont.)
Test -021
The objective of this test was to check out the performanceand stability of the repaired EDM injector. The injector and chamber were
set up as shown in the schematic of Figure 71. The 394-mm (15.5-in.) length
chamber was used with the Rokide-Z-coated liner. The effective chamber
length is 4a7 mm (17.6 in.). The 76-ram (3.0-in.) diameter Rokide-Z-coated
turbulence ring was installed to provide acoustic damping since the first EDMinjector test (Test -0!4) had experienced iL instability.
The ignition and shutdown were smooth, as shown in Figure
71. However, post-test examination showed some damage to the injector face
and resonator ring due to a 600 Hz IL mode instability. The amplitude asmeasured in the resonator cavity was 565 kN/m 2 (82 psia) PK-PK. The major
damage occurred in the center area of the injector around the igniter port,
as shown in Figure 72. It is theorized that the longitudinal instability
caused near-stoichiometric burning to occur on the _njector face, resulting
in face metal ignition and burning. The area around the igniter port islower in MR than the overall MR due to the 10 small fuel holes surroundingthe igniter port that are used to augment ignition. The result is a hotter
MR and hence greater damage in this area.
Examination of the Rokide-Z-coated chamber liner, turbulence
ring, and nozzle showed no damage, except for minor erosion of the linerleading edge adjacent to the resonator ring (Figure 73). Erosion of the
resonator ring is apparently caused by fuel being driven back into the
cavities by the longitudinal pressure waves.
The EDM injector face was repaired on the test stand by
heliarc welding prior to Test -022. The orifices surrounding the igniterport were welded shut to avoid the locally hotter MR condition.
Test -022
This was the first test following the EDM injector face
repair. The chamber length was reduced from 394 to 292 mm (15.5 to 11.5in.). The instrumentation rake was installed as shown in Figure 74 to
measure gas temperature uniformity. The effective chamber length was 389 mm(15.3 in.).
Analysis of the longitudinal instability showed that greater
stability could be achieved by going to a shorter chamber length and changing
the operating point from low Pc/high MR to high Pc/low MR. Based on thisanalysis, the chamber was shortened from 394 to 292 mm (15.5 to 11.5 in.) and
an operating point of Pc = 17.2 MN/m 2 (2500 psia), MR = 35 was selected.
158

-_-,.,-". " ,, ; ""Y4'
t
CD
Z
p-
n "_ ,.,-
r.._
I--- e_ o
i
++..................!..............(_:i...............::k ! _ . . . _ ;
ii.................... +...... :: .......... ................ ;
IO000e O00_c
i
NO|I |gOd 3 A"I_ A
=_zz
--_,; f._a:.,J .,J
O000g OOO£Z O000g 001_£i 0000; OO_OS -- _ _
_lng£3aaI
o
i-,,,-i
°r,,m
II
159

Z
I---
a_ 4 _-
u)
_z , _ _c
_C z _- _-
E°g--
F--
L_
O_
£-
OJ
E
O.
mO
_JS,.
t_
OJ
C0J
S-
0J',-4-o. o
_._v°_..,
°_
r'...
r.#
£,.
°,,,-
160

OP,IGINAE Pt-_G_
BLACK AND ,._HITr__ F_I-IOTOGRAPH
.r:!i!i__i}
O,J
I
I'--"
o
o*r--
o
_,J
tOLJ,-
0
_J
°_"3
c-
_J
161

_i_ _ -_ ,--_,....
0
!
I--
o'1
0
0.
O°_
O
e-
°_
.-.I
0
°_-,
_4
0'1
k " k_¸_
162

IV, B, Test Results (cont.)
Both shortening the chamber and increasing chamber pressure
(i.e., flowrate) are stabilizing factors. Shortening the chamber detunes the
chamber acoustics from the combustion response by going to a higher resonant
frequency. Increasing the flowrate increases the injector resistance. Theshift in MR from 45 to 35 also shifts the chamber tune to a higher frequency
through an increase in sound speed.
As shown in Figure 74, preburner ignition failed to occur
until after the fuel valve was closed. The delayed ignition caused an over-
pressure which damaged the instrumentation rake assemblies and the nozzle
flange sealing surface. The delayed ignition is attributed to the small fuel
orifices around the igniter post being welded shut. The local mixture sur-
rounding the torch does not contain sufficient fuel for reliable oxidizer-
rich torch ignition, as was the case before the fuel holes were welded shut.
The igniter was reorificed to provide a fuel-rich torch at amixture ratio of 1.2. The fuel-rich torch provided smooth reliable ignition
on subsequent Test -023 and Test -024.
Test -023
Test -023 was a repeat of the Test -022 operating condi-
tions. The damaged instrumentation rake and Rokide-Z-coated nozzle flange
were removed for repair. The uncoated fuel-rich nozzle flange was machinedopen to 63.5 mm (2.5 in.) and used in place of the damaged coated flange.
The hardware assembly is shown schematically in Figure 75.
As seen in Figure 75, ignition was smooth, with some over-shoot in Pc with the fuel-rich torch. Combustion was stable, as anticipated.
Nozzle erosion began at about 0.8 second after FS-1, as can be seen in Figure75. Severe damage was incurred by the nozzle flange and nozzle throat
reducer, as shown in Figure 76. It occurred as a result of the uncoated noz-zle wall reacting with the high-velocity oxygen at the inlet to the throat.
A study of the reactivity of uncoated metals with flowing oxygen needs to bemade.
No damage was sustained by the injector, resonator, turbu-
lence ring, or liner.
163

1 ' ]- : ' !"-
5 rZ
........... __o_""'_,_" "=_ =""-,_=_= _,_,__o-_-"- "'=_=_ " " ,'
J g-
_z: -- o w
.... i.!
0 ,
__4_................. _ " ' t..i , . _-_1 _,,_, - - r_e = . : m_, i
-:-.: - i-7:T i ! " '• :
i ....-4, !0000_' 000££ 0000£ 000£_ gO'O0_ 000£_ OOOOl 0120£ t3
f , ;0
u3
i_ m
_ _=_r,- X-- . _
03
E
_J
L_
I1;
=_
_3
C0Jc'-.I,,,.
OJ C',,J
.&-
0
m,,,,
.I.- e,,J
a Io_
x ,0Jo l,-,--
,j
,I,,..
.r=.,

\
000£
NO 2._ [_:0_ ]^'lU^
.f-
l--
(U
L/1
0
toS..
C_
(3.)
0
Cc-
O_ ¢',J
0
.._
_..) O,J
I O,J
N l
O_
i.l-
165

C¢- .... " ":" ..... Y
: : . ] , I.I[ - .
.............. ....
/
" ._i _ • l .... [k . I
l-w _I-N
,-w
=o: " " -_r,w
°S i
--.('--.'
...... a_........................ f ............. LL 2..... _°
-: .......................................... !o_
............. : .................................................. £.
!
Z
;/ -_./ IE
u
_ r.._
f..L _. >i -
n-×-. _
z L_
a g
4_
e_
e_
t_
e.-&.
0
U_
I
_0
N !
x
L
°_-
1,5,3
I

167

I
I--
0
oor..-
o
W
r_l
0
Z
r--"
oo
.r--
168

IV, B, Test Results (cont.)
Test -024
The instrumentation rake and turbine simulator were in-stalled on Test -024 to evaluate gas temperature uniformity. The test con-ditions were the same as for Test -023. The test duration was set for 9 sec-
onds. The test was planned to run 3 sec each at MR 35, 40, and 45 at a cham-ber pressure of 17.2 MN/m2 (2500 psia).
Ignition and overpressure were about the same as on Test-023. Even though the test was stable, severe erosion of the turbine simula-tor, instrumentation rake, and nozzle occurred at about 0.4 sec from FS-I, asindicated in Figure 77. The erosion probably started at the instrumentationrake since no damage was sustained upstream of the rake and everythingdownstream was severely eroded.
Figure 78 shows the nozzle erosion sustained on Test -024.Internal erosion occurred, starting from the instrumentation rake flangedownstream to the nozzle. The rake mounting flange and the turbine simulatorflange were not coated internally, although the rakes and the turbine bladesimulators had been coated with Rokide Z. The leading edge of the rake andthe thermocouples were not coated. Oxygen reaction with the uncoated compon-ents is the most probable cause for component erosion.
No erosion occurred upstream of the rake, as shown in Figure79. The injector face, turbulence ring, and liner remained intact as shownin Figure 80. All of these components are made of nickel, whereas thechambers, flanges, nozzles, and rakes are made of 304 stainless steel. Theturbine simulator blades are made of 17-4 ph CRES. The reactivity of uncoatedmetals in flowing oxygen needs to be understood better if oxygen-richpreburners are to be successful.
C. DATA ANALYSIS
This section of the report discusses the results of both thefuel-rich and the oxidizer-rich data analysis. Performance and stabi3itydata correlations are presented for both the fuel-rich and oxidizer-richpreburners. Gas temperature uniformity data are presented for the fuel-richpreburner only. Carbon deposition (coking) and hardware erosion observedwith the fuel-rich preburner are also discussed. The fuel-rich gas sampleanalysis and results are discussed in Section IV.D.
169

T
17O

0 DL_-_:_ _ ! _ _"._ ,"C........ ,',_- {S
OF POOR QUALITY
_. " i : I " = •
020_ 00_
r
0C3£ 3OSZ 8_OZ OCSi _GO_ ocs G
t =
i
E°_...
F--
c_
Q_
Q_
C}_
o_
Jc--
.__.) cxj
_,-o
m,,
_oN I
.r-
OF-
--s
°_--
171

!
I--
.I.a
o
°_,i.
%m
0
°_I
la, i.
172

BLACKAND WHITE P_OTOGR.__,p,._I
I
1/I
I"--
O
c'-
,r-
._1
i*"
°r-
eD
L
I'--
ID
Ii
0
._.-_C
._.==
173

J
174
A
l.f3
!(',,,jO0
C_
6")
4='!
,,/I0
t':
-'r"
r',,
¢,.-
°rmt_
t
U
"T<0
CO
,L
.froi..

IV, C, Data Analysis (cont.)
1. Fuel-Rich Preburner Data Analysis
a. Performance
Preburner combustion performance is indicatec_ by the
energy release efficiency (ERE) which accounts for losses due to incomplete
propellant vaporization and mixture ratio maldistributions. The ERE for the
preburners was determined by comparing the measured C* with theoretical C*predictions made using the JANNAF Standardized One-Dimensional Equilibrium
(ODE) computer program. C* predictions were also made with the fuel-richcombustion model (FRCM). The FRCM predicts the effect of kinetically limited
fuel decomposition reactions on the C* performance of fuel-rich preburners.
The FRCM is discussed in Section IV, D. Comparison of the measured C*, gas
temperature, and gas composition values to those predicted by the FRCMindicates the model's validity. The FRCM theoretical C* predictions were
used to compare injector and other hardware effects. These predictions weremade before the.model was updated (see Sectio'n IV, D).
The measured C* data for the fuel-rich preburner are
summarized in Tables XI and XII for the EDM and platelet injectors,
respectively. These C* data are compared to the ODE and FRCM theoretical C*
predictions in Figures 81 and 82. It is apparent that the FRCM prediction
best describes fuel-rich preburner performance.
Energy release efficiencies (ERE) were found to vary
from about 62 to 81% of ODE depending on mixture ratio. Efficienciessignificantly greater than these are not achievable as evidenced by the close
correspondence between the measured C* and the FRCM predicted C*. Themeasured C* varies from 92 to 99% of the FRCM predicted C_. The C* is
limited by slow fuel decomposition kinetics and vaporization. The effects of
the _ardware variables on measured C* is best illustrated by comparing it tothe FRCM C*.
The performance was evaluated as functions of injectordesign, chamber pressure, mixture ratio, chamber length, the use of
turbulence ring mixing devices, and chamber contraction ratio. The chamber
pressure varied over a range of 8.9 to i?.5 M._/m2 (1,292 to 2,540 psia), as
indicated in the data summaries. The data show the performance to have
little pressure dependence over this range of pressures. This is in
agreement with the FRCM model predictions. As seen in Figures 81 and 82, themixture ratio exhibits the single largest effect on C* level, which is also
in agreement with the FRCM predictions (see Section IV, D). The mixtureratio was varied over a range from 0.238 to 0.367. Although there is no
significant performance difference between injectors, the EDM injector has a
slightly higher average C* performance than the platelet injector.
175

p- .°_- _- - - _ _ I- ,, .-, : ,
OF 7C;C!- , :;.L.:;'i
Tes tNo.
-009
-011
-012
-012
-012
-013
-013
-013
-013
-013
-030
-030
-030
-030
-030
-031
-031
-031
-031
-031
-032
-032
-032
-032
-032
TABLE XI
FUEL-RICH PREBURNER PERFORMANCE DATA EDM INJECTOR
Pc-IMN/m2 {psi a). MR
_7.5 254o)15.6 2265)
13.5 ]960)!6.7 2424)
16.4 2381)
i5.6 2257)
15.2 2201)
16.0 2320)
17.5 (2535)
13.6 (1972)
11.3 (1643)
14.0 (203?)
]4.3 (2067)g.3 (l_SO)
g.1 (1316)
14.6 (2122)
17.8 (2578)
17.4 (2530)
12.6 (1826)
12.4 (1795)
14.8'(2151)
17.5 (2535)
17.5 (2543)
12.8 (1863)
12.7 (1841)
O.305
0.331
0.238
0.318
O.239
0.327
0.271
O. 367
0.332
0.312
0.283
0.343
0.262
0.243
0.332
0.288
O. 355
0.271
O.240
O.321
O.298
O. 360
0.278
0.254
0.341
C*
m/s Ift/sec)
792 2598)
838 275O)
655 2150)
815 26?5)
659 2163)
834 2737)
718 2355)
915 3002)
844 2770)
794 2605)
749 2458)
862 2827)
714 2343)
675 22l_)
828 2718)
729 2392)
B67 284¢)
700 2298)
641 2102)
782 2565)
742 2434)
870 2853)
708 2324)
662 2173)
811 2662)
EREoDE C*IC*FRCM L' Turb.
(%) _ mm (in.).
72.9 97.3 736.6 (29) No
76.0 97.5 736.6 (29) NO
63.8 96.0 787.4 (31) No
74.6 97.3 787.4 (31) No
64.0 96.1 787.4 (31) No
75.9 97.8 787.4 (31) No
68.0 95.7 787.4 (31) No
81,1 98.9 787.4 (31) No
76.5 97.9 787.4 (31) No
72.9 96.1 787,4 (31) No
70.3 97.1 787.4 (31) Yes
77.5 97.6 787.4 (31) Yes
68.1 97.6 787.4 (31) Yes
65.4 97.3 787.4 (31) Yes
75.0 96.2 787.4 (31) Yes
68.1 93.2 787.4 (31) Yes
77.4 95.7- 787.4 (31) Yes
66.4 93.4 787.4 (31) Yes
62.2 93.2 787.4 (31) Yes
71.3 96.2 787.4 (31) Yes
68.8 92.5 533.4 (21) Xes
77.5 95.1 533.4 (21) Yes
66.7 92.9 533.4 (21) Yes
63.5 92.4 533.4 (21) Yes
73.1 92.5 533.4 (21) Yes
Contr. TurbineRatio Simulator Stability
9.4 No Stable
9.4 No Stable
9.4 No Stable
9.4 No Stable
9.4 No Stable
9.a No Stable
9.4 No Stable
9.4 No Stable
9.4 No Stable
9.A No Stable
7.3 No Stable
7.3 No Stable
7.3 No Stable
7.3 No Stable
7.3 No Stable
9.4 NO Stable
9.4 No Stable
9.4 No Stable
9.4 No Stable
9.4 No Stable
9.4 No Stable
9.4 No Stable
9.4 No Stable
9._ No Stable
9.4 No Stable
NOTE_.__S:
I. Pc-l measured at injector face2. C* based on nozzle inlet pressure
176

Test Pc-1No. MN/m2 (psia)
-014 15.1 2185)
-0i5 15.1 2193)
-015 17.2 2492)
-015 17.3 2513)
-015 13.5 1958)
-015 13.0 1881)
-016 15.2 2204)
-016 15.2 2208)
-016 15.1 2197)
-016 17.4 2520)
-018 15.2 2208)
-018 17.3 2502)
-018 17.5 2545)
-018 13.7 199!)
-018 12.7 1842)
-019 15.2 2200)
-019 17.2 2490)
-019 17.3 2515)
-019 13.6 1972)
-019 12.8 1851)
-020 14.9 2158)
-020 17.0 2470)
-020 17.3 2506)
-020 13.5 1964)
-020 12.8 1860)
-021 14.5 2115)
-022 15.8 2292)
-02_ 16.2 235i)
-027 12.3 1786)
-028 12.1 1748)
-029 1'3.9 20!5)
TAgLE Xll
FUEL-RICH PREBURNER PERFORMANCE DATA PLATELET INJECTOR
MR
O. 303
O. 300
O. 350
0.263
0.255
0.320
0.305
0.255
0.349
0.319
0.304
0.365
0.271
0.261
0.335
0.303
0.353
0.269
0.257
0.327
0.299
0.354
0.264
0.260
0.330
0.301
0.350
0.262
0.256
0.369
0.350
C*
_s Ift/sec_
778 (2551)
768 252i)
871 2858)
707 2318)
679 2228)
803 12636)
778 2552)
687 2255)
863 2830)
806 2645)
773 2535)
888 2915)
723 2372)
698 2290)
805 2641)
751 (2465)
841 2760)
693 2273)
673 2209)
782 2564)
735 2411)
842 2762)
685 2249)
57_ 22i4)
787 2581)
798 2617)
883 (2897)
723 (2373)
711 (2334)
892 (2926)
907 (2975)
EREoDE C*/C*FRCM L' Turb.
_L_I__ Is) . _
71.9 96.1 787.4 (31) Ne
71.2 95.5 787.4 (31) No
78.! 97.2 787.4 (3i) No
67.3 96.6 787.4 (31) No
65.! 94.4 787.4 (31) No
73.4 95.5 787.4 (31) No
71.9 95.6 787.4 (31) No
65.9 96.0 787.4 (31) No
77.3 96.6 787.4 (31) No
71.7 96.2 _87.4 t ,,3_) No
71.4 95.3 533.4 (21) No
78.9 96.5 533.4 (2!) No
68.5 96.6 533.4 (21) No
66.7 95.8 533.4 (21) No
72.8 92.7 533.4 (21) No
69.5 92.8 533.4 (21) Yes
75.2 93.4 533.4 (21) Yes
65.7 93.0 533.4 (21) Yes
64.5 93.4 533.4 (21! Yes
71.1 91.6 533.4 (21) Yes
68.2 91.5 787.4 (3!) Yes
75.2 93.3 787.4 (31) Yes
65.2 93.3 787.4 (31) Yes
64.5 92.8 787.4 (31) Yes
71.4 91.7 787.4 (31) Yes
73.9 98.9 1143.0 (45) Yes
79, i 98.2 1i43.0 (45) Yes
68.9 98.9 1143.0 (45) Yes
68.1 98.1 1143.0 (45) Yes
78.9 96.0 1143.0 (45) Yes
81.3 100 1143.0 (45) Yes
Contr.Ratio
9.4
9.4
9.4
9.4
9.4
9.4
9.4
9.4
9.4
9.4
9.4
9.4
9.4
9.4
9.4
9.4
9.4
9.4
9.4
9.4
9.4
9.4
9.4
9.4
9.4
7.3
7.3
7.3
7.3
7.3
7.3
TurbineSimulator
No
No
No
No
No
No
No
No
No
No
No
No
No
No
No
No
No
No
No
No
No
No
No
No
No
Yes
Yes
Yes
Yes
Yes
Yes
Stability
Stable
Stable
Stable
Unstable
Unstable
Stable
Stable
Unstable
Stable
Staple
Unstable
Unstable
Stable
Unstable
Unstable
Stable
Stable
Stable
Stable
Unstable
Stable
Stable
Stable
Stable
Stable
Stable
Stable
Stable
Stable
Stable
Stable
NOTES:
i. Pc-I measured at injector face
2. C" based on nozzle inlet pressure
177

i
u_
E
I000
750
5OO
35O
4000--
3000 --
N-
2000 --
u
m
- 10000.1
EDM INJECTOR
I I 10.2 0.3 0.4
MIXTURE RATIO
Figure 81. Measured Versus Predicted C*- EDM Injector
IOO0
5OO
35O
400U
3000 --
LLJUS
-- F"U.
"k"
2000 -
i
-- I0000.1
Figure 82.
PLATELET INJECTOR
ODE PREDICTED C*_
FRCM PREDICTED
/4I t i
0.2 0.3 0.4
MIXTURE RATIO
Measured Versus Predicted C* Platelet Injector
178

C:?Z;:,,L'_.F.Z:':_!S, ,_. l'ry
O<O0
<0
% _ N3_t-t 3/03WFISV3N 3
01.,-i
I--
I-x
¢,-
.p-
£3,r-
1,1
.1l
o
u
.r-,_
,."m
_4oo
.t,,-
179

r , °
- -- .bqf
IV, C, Data Analysis (cont.)
The effect of the hardware variables on C* performance
is best illustrated by comparing the measured and FRCM predicted C*, as shown
in Figure 83 for the EDM injector. Comparison of the measured C* to the FRCM
predicted C* provides a comparison of the measured vaporization efficiencywith that predicted. The predicted vaporization efficiency is shown in
Figure 84 as a function of mixture ratio. A chamber length of 787 mm (31 in.)was selected for comparison. Chamber length effects are expected to be small
since the predicted vaporization efficiency does not change appreciably with
chamber length beyond 457 to 508 mm (18 to 20 in.) (see Section IV, D).
As shown in Figure 83, the effect of the turbulence
ring is to reduce C* performance. The uniform gas temperature (discussed inthe following section) that is achieved with the turbulence ring apparently
slows the vaporization, as compared to the nonuniform gas obtained withoutthe turbulence ring. Apparently, the higher temperature zones provide faster
vaporization.
The effect of reducing contraction ratio is to increase
the vaporization efficiency and C* performance. The higher chamber gas velo-
city results in higher gas-to-droplet relative velocities and thus fastervaporization. The increase in vaporization apparently more than offsets the
reduction in gas residence time. This would indicate that, for these chamber
lengths, vaporization is limiting the C* performance. This is in agreement
with the FRCM predictions discussed in Section !V.D.
The platelet C* performance data are plotted in Figure
85. The general level of C* performance is lower at the higher MR than forthe EDM injector but about equal at the low MR end. The shape of the C*
curve apparently reflects the swirler injector effects on atomization and
vaporization. The effect of adding a turbulence ring is the same for theplatelet injector as for the EDM injector; performance is reduced for either
injector. The effect of contraction ratio and turbine simulator is toincrease performance. It would appear that the vaporization is somewhatenhanced in passing through the turbine simulator. Heating the fuel from
ambient temperature to approximately 379°K (223°F) increased the C*
efficiency by about 2%.
b. Gas Temperature Uniformity
The combustion gas temperatures were measured using theinstrumentation rakes described in Section IV.A.2. Two rakes with five (5)
thermocouples each were mounted 1.57 rad (90°) apart and positioned to facetoward the injector face, as shown in Figure 21. The gas temperature thermo-
couple data are summarized in Table XIII which lists the maximum and minimum
180

";:;,-'.L F;.,L: ,. :,--.,OF /::::C',2-;_..... ,
,_ ....... y
PREDICTED WITH FRCM, L' = 787 mm (31 in.)
URBULENCE RING, L' = 787.mm (31 in.)
ioo-
_ 9o
"' 80
,=:°_-70 _J _LWITH TURBULENCE RING, -L" =-5-3_
/y/ _-WITH TURBULENCE RING, L' =-,, 60- EI_ INJECTOR
I ! 1_ 50 iu. 0.2 0.3 0.4 0.5
MIXTURE RATIO
Figure 84. EDM Injector Fuel Vaporization Efficiency
181

I
I ! I ! i _
% m ND_3.D/O3_OSV3H_D
"U°_..
L_
0
OJ
%
.-,j
°_...
182

OF +"'.: " C.+-+..:,:T:"
TABLE XIII
GAS TEMPERATURE DATA SUMMARY
Page i of 2
Test
No.
-012
-013
-015
-016
-018
-019
L l
Data mm Turbulence
Point Injector M__RR_ _ (in:_ Rin 9
i EDM 0.238 S 787.4 No
(31)
2 EDM 0.318 S 787.4 No
(31)
3 EDM 0.239 S 787.4 No(31)
i EDM 0.327 S 787.4 No
(31S
2 EDM 0.271 S 787.4 No(31)
3 EDB 0.367 S 787.4 No(31)
4 EDM 0.332 S 787.4 No
(31)
5 EDM 0.312 S 787.4 No
(31)
1 Platelet 0.300 S 787.4 No
(31)
2 Platelet 0.350 S 787.4 No
(31)
3 Platelet 0.263 Un 787.4 No
(31)
4 Platelet 0.255 Un 787.4 No
(31)
5 Platelet 0.320 S 787.4 No
(3!)
I Platelet 0.305 S 787.4 No
(31)
2 Platelet 0.255 Un 787.4 No[31)
3 Platelet 0.349 S 787.4 No(31)
4 Platelet 0.319 S 787.4 No
(31)
I Platelet 0.304 Un 533.4 No
(21)
2 Platelet 0.365 Un 533.4 No
(21)
3 Platelet 0.271 S 533.4 No
(21)
4 Platelet 0.261 Un 533.4 No
(21)
5 Platelet 0.335 Un 533.4 No
(21)
I Platelet 0.3C3 S 533.4 Yes(21)
2 Platelet 0.353 S 533.4 Yes
(21)
3 Platelet 0.269 S 533.4 Yes
(21)
4 Pla_elet 0.257 S 533.4 Yes
(21)5 Platelet 0.327 Un 533.4 Yes
(21)
Tmax°C
566
(1050)
768
(1415)
577
(1070)
77i
(1420)
635
(1175)
910
1670)
813
1495)
714
1318)
696
1285)5431550)
666
1230)
571
1060)
724
1335)
699
(1290)
577
(1070)
818
(1505)
754
(1390)
688
(1270)
802
(i475)
671
(1240)
593
(Ii00)
704(1300)
654
(1210)
754
(1390)
599
(1110)
574
(i065)
679
(1255)
T •
mln
°C
_LtEL_
419
(787)
524
(975)
446
(835)
543
(lOm)
474
(845)596
(1io5)
554(io3o)
532(990)
613
(1135)
710
(1310)
554
(1o3o)
532
(990)
638
(1180)
628
(1145)
541(1005)
699
(1290)
663
(1225)
624
(1155)
760
(1400)
549
(1020)
571
(1060)
663
(1225)
643
(li90)
738
(1360)
582
(t080)
563
(io45)66o
(1220)
Tavg
°C
499
(930)
643
(1190)
513
(955)
657
(1215)
554
(lO3O)743
(1370)
688
(i270)
638
(1180)
654
(1210)
774
(1425)
6:0
(113o)
s5z
(1o25)
685
(1265)
560
(1220)
566
(1050)
749
(i38o)
7o4
(13oo)
657
1215)782
1440)
610
1130)
582
1080)
682
1260)
649
(1200)
749
(1380)
591(1o95)
568(toss)
677
(125o)
_Tmax
°C
_LtEL
146
(263)
244
(440)
131
(235)
228
41o)
161
290)
314
565)
258
465)
182328)
83
(150)
133(240)
111
(2O0)
39
(70)
87
(155)
B1(145)
36
(65)119
(215)97
(i55)
64
(i15)42
(75)
122
(220)
22
(40)42
(75)
11
(20)
17
(30)
17
(3o)
ii
(2o)
19(35)

Test
No.
Data
Point Injector M_.R_R
TABLE XlII Icont.)
L' Tmax
mm Turbulence _C
Stability (in.) Rin 9 (°F)
T .mln
°C
121_
Page 2 of
Tavg_'C
ATma x
°C
221
-020
-02!
-022
-025
-027
-028
-029
-030
-031
-032
i
2
3
4
5
1
2
3
4
5
I
2
3
4
5
I
2
3
4
5
Platelet 0.299
Platelet 0.354
Platelet 0.264
Platelet 0.260
Platelet 0.330
Platelet 0.301
Platelet 0.350
Platelet 0.262
Platelet 0.256
Platelet 0.369
Platelet 0.350
EDM 0.283
EDM 0.343
EDM 0.262
EDM 0.243
EDM 0.332
EDM 0.288
EDM 0.355
EDM 0.271
EDM 0.240
EDM 0.321
EDM 0.298
EDM 0.360
EDM 0.278
EDM 0.254
EDM 0.341
S 787.4
(31)
S 787.4
(31)
S 787.4
(31)
S 787.4
(31)
S ?87.4
(31)
S 787.4
(31)
S 787.4
(31)
S 787.4
(31)
S 787.4
(31)
S 787.4
(31)
S 787.4
(31)
S 787.4
(31)
S 787.4
(31)
S 787.4
C31)
S 787.4
(31)
S 787.4
(31)
S 787.4
(31)
S 787.4
(31)
S 787.4
(31)
S 787.4
(31)
S 787.4
(31)
S 533.4
(21)
S 533.4
(21)
S 533.4
(2i)
S 533.4
(2!)
S 533.4
(2!)
Yes 638
(1180)
Yes 746
(1375)
Yes 588
(1090)
Yes 574
(1065)
Yes 691
(1275)
Yes 649
(1200)
Yes 738
(1360)
Yes 585
(1085)
Yes 566(1050)
Yes 749
(1380)
Yes 766
1410)
Yes 603
(1118)
Yes 721
(1329)
Yes 571
1060)
Yes 529
(985)
Yes 678
1252)
Yes 624
1156)
Yes 766
1411!
Yes 601
(1114)
Yes 534
(994)
Yes 678
(1252)
Yes 646
(1194)
Yes 803
(la77)
Yes 619
1147)
Yes 567
!o52)Yes 717
(!323)
632
(1170)
738
(1360)
588
(i090 )
574
(1065)
682
(1260)
643
(1190)
729
(1345)
579
(lO75)
560
(1040)
743
1370)
757
]395 )
600
1112)
718
1325)
570
1058)
527
(981)
673
1243)
619
1146)
762(1403)
600
(ni2)
533(992)
675
(1247)
619
(1147)
760
(1400)
596
(no5)
553
(1027)
702
(1295)
635
(li75)
743(1370)
588
(1090)
574
(1065)
688
(1270)
646
(1195)
735
(1355)
$82
io8o)
5631045)
746
1375)
7631405)
602
1115)
719
1326)
57!
i059)528
(983)
67&(I245
621
(ii50)
765
(I409)
601
(in3)
5_4
(993)
674
(1246)
632
(1i7o)
782
(144o)
609
(1128)
559
(1o38)
709
(1309)
6
I0)
8
15)
0
(o)
0
(o)8
(15)
5
(iO)
B
(i5)
6
(lO)
6
(io)
6
(io)
8
(15)
3
(6)
2
(_)
I
(2)
2
(4)
5
) (9)
6(Io)
4
(B)2
(3)i
(2)3
(5)28
(50)
43
(77)23
(42)i4
(25)t!
(28)
!84

IV, C, Data Analysis (cont.)
gas temperature, the average temperature, and the maximum temperature differ-
ential. The average gas temperature was determined by taking the arithmetic
average of the ten thermocouple readings.
The measured average gas temperatures for the EDM and
platelet injector, respectively, were compared to the predicted values in
Figures 86 and 87. Both ODE and FRCM predictions are shown. It is evident
that the FRCM provides the best prediction. The chamber length does notaffect the average temperature for either injector. The average temperature
versus mixture ratio curves are virtually identical for the two injectors,
indicating no significant injector effects on average temperature. The
mixture ratio is the most significant factor affecting average gastemperature. No pressure effects were found over the range tested. This
agrees with the FRCM predictions.
Gas temperature uniformity is affected by the injector,
turbulence ring, and chamber length, as shown in Figures 88 and 89 for theEDM and platelet injector, respectively. Figures 88 and 89 show that both theEDM and platelet injector exhibit large temperature nonuniformities without
the aid of a turbulence ring mixing device. Temperature differences ofalmost 333OK (600°F) were measured with the EDM injector in the 787-mm
(31-in.) L' chamber whereas the differences were less than 167°K (300°F) for
the platelet injector (see Figure 89). The addition of a turbulence ringdramatically reduces the nonuniformities to less than + 5.6°K (+ 10°F) for
both injectors. The platelet injector provides more unTform gas-temperatures
with the turbulence ring and shorter (533-mm [21-in.l) L' chamber than doesthe EDM injector. With a turbulence ring, either injector can easily meetthe contract temperature uniformity goal of + 27.8°K (+50°F). The influence
of the turbulence ring on gas temperature unTformity iF dramatic even though
the pressure drop across the turbulence ring is only i to 2% (20 to 50 psid)of chamber pressure.
c. Combustion Stability
The platelet injector exhibited longitudinal instabili-ties at certain operating conditions as listed in Table XIV. No transverse
high-frequency instabilities were encountered. The 600-Hz oscillation
observed on Tests -015 and -016 was identified as the second longitudinal
(2L) mode by comparing the measured Kistler pressure amplitude ratios to thepredicted pressure amplitude ratios (Figure 90). Further verification of the
mode is indicated by the close agreement between the calculated and measured
frequencies.
The occurrence of the instability was observed to be
primarily dependent on the operating mixture ratio and less dependent on
injector stiffness (Pinj/Pc), as shown in Figure 91. An analysis was
185

_r-,_"'"_:'."___- -- __. _,. ._
r-. _, " ..... . o, tA_
_W
I, I Io o 00 0 oo CD 0
Z
-.J _
mm _--0 Z >- >-
°it.- °_.= °r-
J r_ r_ _-- oo cO _'__1
.--I
0O0_- 0 D <_>-
_lo'3_INl_3dH31 SVg NOI±SNSH03
I I
_r
0
o
p-
QJ
F--X
_Z
0
r-4
! °0
0
!
_JS-
S-
Q_
(D
1"--
_J
.e-
_,_
S-
O..
0
.._
(D
0 S-
O
0 ¢2
S..
186
0 o oo o o1.0 0 U'_
0

I I IO O
(.,.) o,J
c/')
F-
i.._I ¸
,=CF-
ez') (_
I---O
c_
_Jo
Nog
o
IO
_0 '3BO1V_3dW31 SV9 N011SRSW03
I i
o o
e=-¢
I
i
-Qj
f,..
E
I---
U")
c_
uor =-
O "xm
x _
(u o
u
o ._--)E
oca4-_•_-- (_
C2.4-_
co
o,_,.
187

0
00
--J
0
I--"
Z0
0
C
0
e-
l
E0 0
_ .
_ L
E
CO
I ! 1 1 I I0 0 0 0 0 00 0 0 0 _ 0
!0
[
0
_o
I
00
I_-0
I
C_
188

I./1L_J
OZLLJ
i--...J V_O";
:E>-i,iV_..J
e_
_--' I---..Jo_OZ
\\
I 1 I I I0 0 0 0 00 0 0 0 0
.-I
0
h'-
0
6
0
I--
I---X
04--)L)
.p-jE
-I-)
p--_J
I
4.a.p-E5.-O
S.-
4-a
L(_
V1
o_CO
5-
.p.lJ-
OOcO
OC_O4
1o
OO
O
189

TABLE XIV
FUEL-RICH PREBURNER COMBUSTION STABILITY SUMMARY
Test
-015
-016
-018
-oi9
DataPoint
1
4
5
Injector
Platelet
L' Pcmm Turbulence MN/m2
(in.) Rin 9 _psia)
787.4 No 13.5(31) (1958)
Platelet 787.4 No 15.2(31) (2204)
Platelet 787.4 No 15.2(31) (2208)
Platelet 533.4 No 15.2(21) (2208)
Platelet 533.4 No 17.3(21) (2502)
Platelet 533.4 No 13.7(21) (1991)
Platelet 533.4 No 12.7(21) (1842)
Platelet 533.4 Yes 15.2(21) (2200)
Platelet 533.4 Yes 13.6(21) (1972)
Platelet 533.4 Yes 12.8(21) (1851)
MR
0.255
0.304
0.255
0.304
0.365
0.261
0.335
0.303
0.257
0.327
590
680
600
54O
59O
5OO
520
55O
5OO
515
Mode
2L
2L
2L
1L
1L
1L
1L
1L
1L
IL
Amplitude
MN/m 2
(psi)
2,21(320)
0.69(<I00)
2.21(320)
2.34(340)
2.34(340)
1.93(28O)
2.34(340)
0.69
(<I00)
0.69(<!00)
2.21(320)
190

[<I <2<3 P=Pn+ 1_7_->...1L f k I"-",,,,"-_
PRESSURE I %'\',91_ , i _ , / /, II \x _" ",¢ , \ ,,_ /\ _/" /# i
I \77L,/"...,' \, / ',../_,/,i I
86.36 mm-_ i
(3.4 in.) I_ 787.40 mm _I17 _I
(31,0 in. )
n_XCos T
AMPLITUDES MEASURED FROM SPECTRAL DENSITY PLOTS
2L 4L 6L600 HZ 1200 HZ 1800 HZ
KR 84 18 14
K1 14.5 0.8 2.2
K3 17.3 0.7 2.5
MEASUREDAMPLITUDE RATIOS
P2L/P2L P4L/P2L P6L/P2L
KR 1.0 0.22 0.17
K1 1.0 0.056 0.15
K3 1.0 0.035 0.14
PREDICTED AMPLITUDE RATIOS
K1 ,K 3 1.0 0.049 -0.011
Figure 90. Comparison of Measured to Predicted Pressure Amplitude Ratios
191

Q--_,-,'_ _i I'-_r,. _ t}_L "-rV
OF FoOR <u '_'''' '
K-1
10 MS
89 PSI
19.31 - 2800
192
17.92 --
16.55 --
15.17 --
13.79 --
12.41 --
11.03 --
9.65 --
Figure 91.
2600
2400
2200
2O00
1800
1600
1400
0.20 0.25
0
0
0.30 0.35
MR S U/S
0 •
INCREASING
INJECTOR
STIFFNESS
AP/Pc
0.40
TEST
-015
-016
Effect of Mixture Ratio (MR) and Chamber Pressure (Pc)on Longitudinal Stability

OF FC,_;, C;,J,:LL'.,",.
IV, C, Data Analysis (cont.)
made to predict the effect of mixture ratio and chamber length on
longitudinal stability. The results are shown in Figure 92. The analysis
predicted that reducing the chamber length from 787 mm (31 in.) to 533 mm (21in.) would shift the instability from a 2L to a IL mode of instability at the
high-MR condition. Test -018 confirmed this prediction.
Further analysis showed that the addition of a turbu-
lence ring would provide damping of the longitudinal mode oscillations. The
effect of the turbulence ring on the damping is illustrated in Figure 93. The
best damping is achieved by placing the turbulence ring at the velocity anti-
nodes, as illustrated. However, the turbulence ring was designed to be
placed 127-mm (5-in.) from the injector face based on thermal compatibilityproblems. Analysis indicated that impingement of unvaporized propellant
would provide adequate cooling of the turbulence ring at the 127-mm (5-in.)
chamber length. Placement further downstream may not provide adequatecooling of hot streaks, resulting in thermal compatibility problems. The
787-mm (31- in.) chamber length is predicted to be more stable than the
127-mm (21-in.) chamber length as confirmed by Tests -019 and -020. The127-mm (21-in.) chamber was more stable with the turbulence ring. The 787-mm
(31-in.) chamber was stable at all operating conditions with the turbulence
ring. It is concluded that longitudinal mode instabilities can be effec-
tively damped with properly selected turbulence rings and chamber lengths.
d. Carbon Deposition and Hardware Erosion
Tests -021 through -029 were run with the turbine and
main injector simulators installed as shown in Figure 94 to evaluate carbonbuildup (coking). The preburner was instrumented to measure pressures up-stream and downstream of the turbine simulator to detect changes in the
simulator effective flow areas. Area reductions are interpreted to be anindication of carbon buildup.
An example of a typical test result is shown in Figure
95 for Test -027. The combustor pressures upstream of the turbine simulator(Pc-I and Pc-2) are seen to slowly rise in relation to the downstream pres-
sures (Pc-3 and Pc-4). The gas temperature, flowrates, and mixture ratio aresteady, indicating a reduction in the simulator flow area. The turbine simu-
lator effective flow areas were calculated by using the measured parameters
and the isentropic flow relationships. Adjustments to the measured flow weremade to account for the unvaporized fuel. These adjustments were made on thebasis of the predicted fuel vaporization efficiency. Multiple points were
calculated during each test to determine trends. These results are plotted in
Figure 96.
193

C: ..;t_,.:,,:. F',%C'_ _$,...,, _ _ "
C,7 ,"'30°'. _,...._-..MTY
I!
//
ZH _ ADN3nO3W_
e-"
...J
_J
e_t--
c"
0
X '_'-
_ °_..,.'s
_- c"
"-s
._
• r.- 0
c"_.. 0
C_
194

PRESSURE
PRESSURE
-k"
0
TURBULENCERING
C-:'-' ;",'__ P,_Cz iSCF PO0."?QUALITY
(5.0 in.) #
..._127 mm_ BE_LOCATION
_= 787 mm(31.0 in.).
TURBULENCE RING
=._ _ BEST_CATION
"----(iO" 5in') _
533 mm-- (21.0 in. ) v
Figure 93. Effect of Turbulence Ring on Longitudinal Mode Damping
195

(xj
" _ C"J
,--' ('M
t/')
_g
t-
O
°r,-
f..
4--e--
0
u
}.-
0
3.e.-
e'-o_,._
t_
e'-
f,.
r_
e-
U.r--
I
196

O_ POOR " ......
4-}
I/I¢l
l/I¢1
I--
{-,.0
,r'-
E
0iI
el.0r_
{_}
%,p-
I--
_4
!97

m
.3
m
8"
O0 O0
N ,,I
d ,=','_l
I 0---'" "' J_'_ 1._ _._ I,._ •
,_ °## N "'_-"'
.;oe °
I !
(z'NI) _'V3_V MO'l_ _oivInWls 3NI_nJ.
I I I
_,_ c,_ tUUJ
Q
0
m _
v
w I--
0
J
0
-r
E
p--
q..
w
5-0
N
e-
t--
°r-
198
I

IV, C, Data Analysis (cont.)
......•. .... !3
"" ...... QLJ;_,£_i'Y
The data indicate slight reductions in flow area during
each firing and an increase in flow area from test to test. The area reduc-tions during the test are due to both carbon buildup and thermal expansion ofthe turbine simulator blades. It is estimated that the blades should reach
thermal equilibrium in about 6 to 7 seconds, i.e., at about half of the testduration. It is estimated that the maximum area reduction due to thermal
growth of the si.mulator blades would be about 2.5% as compared to a maximummeasured reduction of 3.5%. It is difficult to differentiate the two effects
since no clear-cut change in the slope of flow versus time curve occurs at 6to 7 seconds. Also, there are no obvious mixture ratio effects, as shown in
Figure 9?. If the area reduction is due primarily to thermal effects, it is
expected that the slope of the flow area versus mixture ratio curve would benegative. As the MR is increased, the flow area would decrease due to higher
temperatures and greater expansion. However, the slope appears to be
positive, indicating carbon deposition effects similar to those on the Titan
I gas generator. The carbon buildup effects are also clouded by the factthat no significant carbon deposits were found during post-test examinationsand that erosion of the turbine blades had occurred. If the measured area
reductions are due to carbon buildup, then the indicated rates ark 2 to 4times those observed in the Titan I gas generator. The indicated area
reductions vary from 0.13 to O.25%/sec as compared to O.06%/sec for the TitanI gas generator.
Severe erosion of the turbine simulator blades and
housing was observed to occur progressively from Test -021 to Test -029. The
main injector simulator and the nozzle were also badly eroded, with the ero-
sion having the appearance of cavitation damage. The turbine blade erosionis evident by comparing the post-test photos of Tests -021 to -029, as shown
in Figures 98 and 99. Figure I00 shows the blade areas incurring the most
damage. It appears that the areas of high velocity impingement suffer theworst erosion. This effect is also seen in the main injector simulator and
nozzle, as shown in Figures 101 and 102. Figure 102 shows that the nozzleplate is severely eroded in 8 areas directly under orifices in the maininjector simulator plate. High velocity impact seem to aggravate erosion.
As shown in Figure 103, the nozzle throat is also eroded, with the erosionresembling cavitation damage. This form of nozzle throat erosion was
observed on all of the fuel-rich testing.
One of the eroded turbine blades was sectioned for
metallurgical examination. A photograph of the section is shown in Figure
104, indicating that a definite change in the grain structure has occurred atthe blade surface. A micro-hardness test has revealed that the surface layer
(_0.025 mm [0.001 in.]) is softer than the parent material. Softening of the
surface indicates a decarburization of the material. Although decarburiza-tion was also observed on the surfaces not subjected to high velocity flows,there was no evidence of erosion on the surfaces. It is concluded that the
199

1096.8
1032.2
C_
967.7
903.2
z
v
-- f,=)
,4l,a.lmm
-e0
0I--
z_Z
(._m
Z
1.7 n
1.5--
1.40.25
0 0
00
0
0O
i
0.30
MIXTURE RATIO
0
CD
00
}SMALLERO_ GEOMETRICAREA
<> #22
• #25
_7 #27
o #28
o #29
I0.35
I0.40
Figure 97. Turbine Simulator Area Versus Mixture Ratio
2OO

Q21GINAL PAG,2'
BLACK AND WHITE PNOTOGR,-_N
4
I
¢1
I--I
0
I
0
.r--
e-
0
o
0_.,.
IJ,.
201

b
_.r, - .....
A
I
Q_I---
!
(,,,-)O
O=
I
5.-0
-I-:,
(.-°_
5.-
0
E
0
5.-
C_°_...
202

OR'Gl"b\L PAG__,_ .... ,.--,_u WHITE PHOTOGRAPI4
I
I-'-
I--
W
I---
0
0|
ILlI'--
n_
U-
l--U')0
i
0...J
0°r..-
0
L_J
04-)
=_
._,-
b'-
203

\
0I
0
!
0
0
LA_
0
E
Q
_J
°_,,_
°r-
0
204

_-;,',U VTHll _. P' <"-<"
>
_:_,',"I¸¸¸ ;'
0I
0r_
!
0
N
0Z
oJo
205

r_r_w _ i d
!
o
I
o,r,--
o
c_
0
O
z
o
L
o_,,,
206

,._', ,_, i?.!. _ -"*,-'_
TESTER IMPRINT
SURFACE VOID
SURFACE
SOFT SURFACE
PARENTMATERIAL
250X
,"__ SURFACE
"__ VOIDS
600x
Figure 104. Turbine Simulator Blade Section - Micro Photograph
207

IV, C, Data Analysis (cont.)
erosion is a result of the hydrogen-rich (20%) gas reacting with the carbon
within the interstitial grain boundaries. The carbon loss reduces strength
and causes the material to be vulnerable to unvaporized liquid droplet impact
erosion. It is recommended that a laboratory material s study be conducted to
identify materials less susceptible to fuel-rich gas erosion.
2. Oxidizer-Rich Preburner Data Analysis
The oxidizer-rich data consist of performance and stability
data only. No gas temperature uniformity data were acquired due to probe
failure early in the test run. The oxidizer-rich C* performance data aresummarized in Table XV.
The C* performance is plotted in Figure 105. It is apparentthat the ODE prediction adequately describes the anticipated oxidizer-rich C*
performance. The platelet injector C* performance is noticeably lower thanthat of the EDM injector. This may be a result of the short test durations(_i/2 sec).
The predicted combustion gas temperature versus mixture
ratio is plotted in Figure 106. Also indicated are the operating mixtureratios for each of the oxidizer-rich tests. Serious erosion of an uncoated
nozzle on Test -023 and uncoated rake probes and housings on Test -024 would
seem to indicate that gas temperatures in excess of 1111°K (2000°R) are to be
avoided with uncoated metals. Published metal ignition data are shown in
Figure 107. The nozzle wall temperature is predicted to reach a maximum of1033°K (1860°R) in a 1/2 second test. These published data would indicate
that temperatures of up to 1477 to 1533°K (2660 to 2760°R) can be tolerated
by uncoated stainless steels. However, these data are for static
(nonflowing) oxygen environments. High-oxygen gas velocities appear tosignificantly reduce metal ignition temperatures. It is recommended that alaboratory materials study be conducted to define the effect of oxygen gas
velocity on metal wall ignition.
The stability data are summarized in Table XVI. The EDM
injector exhibited 1L mode oscillations at 650 Hz in a 447-mm (17.6-in.) L'
chamber without use of a turbulence ring (Test -014). The installation of a
76.2-mm (3.0-in.) turbulence ring 127 mm (5 in.) from the injector face
reduced the amplitude (Test -021). Reducing the chamber length from 447 to345 mm (17.6 to 13.6 in.) stabilized the EDM injector, as had been analytic-
ally predicted.
The platelet injector also exhibited 1L mode oscillations inthe 447-mm (17.6-in.) L' chambers on Test -018. A 86.4-mm (3.4-in.) diameter
_',_bulence ring had been installed, based on the EDM experience on Test -014.
208

TestNo.
-014
-018
-019
-021
-023
-024
Pc-1Duration MN/m2
Sec
i 13.1(1905)
I/2 12.7(1844)
1/2 12.9(1872)
1 13.9(2023)
I 16.6(2402)
i/2 17.2(2497)
OXIDIZER-RICH
MR Injector
36.8 EDM
37.1 Platelet
35.8 Platelet
47.5 EDM
32.6 EDM
27,2 EDM
TABLE
PREBURNER
XV
!
nlm
(in.)
447(17.6)
447(17.6)
447(17.6)
447(17.6)
345(13.6)
396(15.6)
PERFORMANCEDATA
TurbulenceRingmm
(in.)
No
86.4
(3.4)
76.2(3.O)
76.2(3.0)
76.2(3.O)
C _
m/s
ft/sec
787
(2582)
648(2127)
643(2110)
659(2163)
806(2644)
102
84.9
82.4
98.7
98.6
209

I0
C_
I
re,-
l,=,-
0
m,,-0l"
L,J
I=,,,I
F--
--,I
I--""=C
<_
I00C_
0
(s/m)
0
0
__ 0t_
C:_ c_J
0
I0t_
0
F--
_J
X
0
u_
Q;
4.-0
c-O
.e.,-
0.
,2e,-
e_
e-
N t._•r-- °_"-
X I-
0
°,_..
210

0
1667
i-11i
556
_ 3000
O
r_
wr_
c_
2000-D
zO
h-v_
o
- 100025
• 0 \ oDEP_EDICTEO-023O_ •
-014
<7-021
.. I I I I I
30 35 40 45 50
MIXTURE RATIO
Figure 106. Oxidizer-Rich Preburner, Predicted Combustion Gas Temperatures
211

7C?," ....... _-
(J.) fll.Lrd),:l_,L IlO|,l.lli_l
I I I I
1141v
'i
a. !8
g_'/ } :.,_ !,_' J ° ! z
' / ' r'i i ,5: ' ' _:li _ III •
• :'°; ,,, 2_
1),1 I,_ll_ll_l/II IIOIll_l
212
I i' I
iI
Q3
X
0
r_
(,/)
S.
E
I--
c-
O
-r'-
%_J
:E
o
_Jf,-

_!.-_'i" i//i _i_OF _v:i: • .....
TABLE XVI
OXIDIZER-RICH PREBURNER STABILITY DATA
TestNo.
-014
-018
-019
-021
-023
-024
DurationSec
1/2
1/2
1/2
Pc
MN/m2
_psia)
13.1(1905)
12.7(1844)
12.9(1872)
13.9(2023)
16.6(2402)
17.2(2497)
MR Injector
36.8 EDM
37.1 Platelet
35.8 Platelet
47.5 EDM
32.6 EDM
27.2 EDM
!
mm
(in.)
447
(17.6)
447(17.6)
447(17.6)
447(17.6)
345(13.6)
396
(15.6)
Turbulence
Ringmm
<in.)
No
86.4(3.4)
76.2
(3.0)
76.2(3.O)
76.2
(3.0)
76.2(3.O)
Stable
IL
IL
Stabl e
IL
Stable
Stable
65O
667
604
213

IV, D, Fuel-Rich Combustion Model Update (cont.)
Reducing the turbulence ring diameter to 76.2 mm (3.0 in.) stabilized theplatelet injector (Test -019).
D. FUEL-RICH COMBUSTION MODEL UPDATE
This section of the report discusses the Fuel-Rich CombustionModel (FRCM) and how the measured data are used to update it. The basis for
the model, a comparison between predicted and measured results, and modelmodifications are described.
I. Fuel-Rich Combustion Model Description
The FRCM was developed on Contract NAS 3-21753 and is des-
cribed in the final report for that contract (Ref. i). An additional brief
description is included herein for the sake of completeness.
Combustion in fuel-rich preburners is presumed to occur asillustrated in Figure 108. The oxidizer is assumed to vaporize and react
immediately with a portion of the fuel. The remainder of the fuel undergoesvaporization and thermal decomposition to arrive at the final combustion
products. Equilibrium combustion of the oxidizer is assumed such that the
starting gas-phase properties are defined by the One-Dimensional-
Equilibrium (ODE) combustion products. The gas-phase temperatume is higherat the injector-end than at the nozzle-end since the starting gas-phase mix-
ture ratio is higher than the overall mixture ratio. The gas temperaturedecays as the fuel vaporizes and undergoes kinetically limited thermal
decomposition. The net effect is that the gas properties and C* performance
are slightly dependent on residence time. The rate of temperature decaydepends on the vaporization rate which is modeled as an exponential function
(see Figure 109). The appropriate vaporization rate constants are determinedfrom data calibrations.
The model assumes the chemical reaction scheme shown inFigure !10. Both the oxygen and RP-1 are injected into the combustion cham-
ber in the liquid phase. The liquid oxygen rapidly vaporizes, leaving a largeamount of unvaporized RP-I. The oxygen vapors quickly react with the avail-
able fuel vapors at a mixture ratio that is higher than the overall MR. The
oxidation of the RP-1 vapor is assumed to result in equilibrium products due
to the higher mixture ratio. With the exception of hydrogen, these products
do not undergo further reaction in the chamber. Based on previous calibra-
tions, the appropriate value for the assumed starting mixture ratio has been
determined to be on the order of 1.2. The oxidation process provides the
heat needed for the vaporization and thermal decomposition processes.
214

e FUEL RICH COMBUSTION
C,F ......
_ KiNETICALLY
VAPORIZATION_LIMITED FUELDECOMPOSITION
45.._LOCAL EQUILIBRIUM.._ GAS PHASE_...._REACTION __REACTION
"--_ (DEFINED BY ODE) ""_I_ PRODUCTS& HEAT
FUEL DECOMPOSIT!ON
FINAL PRODUCTSDEFINED BY KINETICS
KINETIC:
FUEL
C12 H26 _ H2 + CH4 + C2H 2 + C2H 4 + C2H6 + C3H 6 + .....
VAPORIZATION AND GAS PHASE
DECOMPOSITION OF EXCESS FUEL
.I
RAPID OX VAPORIZATION AND COMBUSTION
" % FUEL VAPORIZED
X v
Figure 108. Fuel-Rich LOX/RP-1 Combustion model
215

r",-. n,"CO o
>,.- oh v
.,..-,4 _ _ ",./
x Z
Z
Cz:
I! H H il
Z
A
! Z W
q X Z
H It II II
_ X
,-,_ _"_''" _-, _ , _-_.J'
% 'AON3131_33 N011VZI_OdVA
O
c6O
r'...
O
CO "IOO
O
Oor-
NOr'_
c",J
O
O
,=_o_
O
OO
216

r.9
o
c-O
4_
N
"F.0
E
e" S.. u_0,-..O 4._e'- ._- o
tel .r.- "_E-._O
e_" I.ul C_.
v
OJ-r"
E
,e.-S..4_
*r..- Q
O'O.
c-O
*r..-
O
"T
c-o
oe-
¢-_J
..d
O
c-o
.F.,.
N
"F_O¢2.
...dv
c--O
0r...
_ O"Oe" (._ O
--- O O
rO
"ZO.
v
"7O-
0f....
fO
EO
O,1..-
OO_
f....O
O
c-O._.-
EO
c-O
._...
!e-...
_J
-'sOn
or--L_
217

IV, D, Fuel-Rich Combustion Model Update (cont.)
The unreacted liquid RP-1 vaporizes and undergoes a two-
step gas-phase thermal decomposition. The two steps consist of (1) RP-1
fragmentation (primary reactions) and (2) gas-phase reaction (secondary reac-
tions). The primary reactions fragment the RP-1 into lighter hydrocarbons,
such as H2, CH4, C2H 4, C3H6, etc. These fragments then undergosecondary reactions with the hydrogen molecules that are produced by the
starting RP-1 oxidation reactions. The net effects of the propellant vapori-
zation and RP-1 decomposition are a reduction in gas temperature. As aresult, the RP-1 decomposition takes place in a low-temperature environment
and thus the decomposition reactions proceed slowly and are limited by thereaction rate.
In its currently existing form, the model does not predict
solid carbon formation since an appropriate reaction mechanism has not been
identified. It predicts only the precursors, such as C2H 2. Table XVIIis a listing of the chemical reactions considered by the model.
2. Comparison of Original Predictions to Experimental Results
The experimental results and original model predictions were
compared to determine the need for modifications. The original model predic-tions had been made for a chamber pressure of 20.7 MN/m 2 (3000 psia) and agas residence time of 12 msec whereas the actual test conditions covered a
chamber pressure range of 11.7 to 16.5 MN/m 2 (1700 to 2400 psia) and resi-
dence times of 17 to 43 msec. However, this presented no problem since boththe model and the data indicate that the pressure effects are negligible over
this pressure range. Also, the model indicates that residence time effectsare negligible above residence times of 5 to 6 msec.
The gas compositions were measured using the gas probe sys-
tem described in Section IV.A.4. Combustion gas product samples were col-lected in high-pressure bombs. The physical properties of the samples are
listed in Table XVIII. The sample included solid carbon and liquid conden-
sates as well as gas. The condensate included carbon, condensed fuel vapors,and unvaporized fuel. The gas and condensate weight fractions versus mixture
ratio are plotted in Figure 111 for comparison with those predicted by thefuel-rich combustion model. The trend with mixture ratio is excellent
although the absolute value is slightly lower than the predicted one.
The gas-phase composition was determined by using aHewlett-Packard Model 5803A gas chromatograph. The measured gas compositions
are listed in Table XIX. The gas samples were checked for oxygen/hydrocarbon
ratio to verify that there were no leaks in the sample system. The results
are plotted in Figure 112, indicating that the agreement is excellent. No
injector effects are noted in the measured gas-phase composition.
218

_t
ZCD
t.)
L_JC_
.--J,<0
"r"
C_CD
(.,-)
C0
CD
"v"
r-,-I
...J
'.U-

t,J
k-
i,rID-0
(D.
-.Jr_
LJ
C_
0
_D
0
I
=o I
N
v
• _" _" 0'_, -'-_. _ CO
• C_J 0
_ ,---i .C_ ,..._ ,_. _ c',l
• _ .N ,_- _4 _Z ,--,
0 • O0 O_.l CO 3 _ 0")• _ o0_ _ _
O_ L.'_ ,.--'- e'_ 0
• 1"_. °O,,J
v v
A
COCO _L¢_ _ N _ _
_ _. _ N._ 0 _. _ _ _ N
A
r'_-__'_ _'_ _'-_ O0 C_ L_ CO• @ON ,-_ ¢_ O_ 0 ,-_ O_
v
k_ _q. ,'-_ 0 _, O_ f_ 0 O0
• N • _ N
v
r_
E
oO
m,_ v
_ _:_ (-' 0_'- _ _ ._-
•,'- C.d _ 0...-., _ _ _ _ r.r' .,--
o 0 _ _ _. _,
"_ _ _ _ _ _Y 0
o _0 o _ _-
E
cOoO
II
v -_
0--I

C':''_ _:_ _ o ,3'
100--
9O
8O
70
a
Z
o 60h-r.)
50
v%
4O
33O
2O
10
o I I i0.20 0.25 0.30 0.35
0
MR
I0
Figure 111. Fuel-Rich Combustion Product Sample Phase Distribution
221

zO
w=.
<_
I-.-
r_O
xi
,--1 ==it.
..t-
..-.,
, ____ ,
; o
i
lml _
_ . . . ......
- _=_-__
e-
=_m=l
222

OF FCOR C_:i _, ,Tv
O.40 -- 0
o_,..0.35- o/l.IJ
0X
_ o.3o-_ 0
0.25
0o_8_ i l J20 O.25 O.30 O.35 O.40
PREBURNER MIXTURE RATIO
Figure 112. Comparison of Gas Sample Mixture Ratio to PreburnerMixture Ratio
223

IV, D, Fuel-Rich Combustion Model Update (cont.)
The vapor pressure of the condensate was measured to further
characterize its properties. The results are plotted in Figure 113 for com-parison with several known hydrocarbons. Vapor pressures for RP-1, heptane,
hexane, and butane are plotted. The condensate appears to consist of
"cracked" RP-I. Its molecular weight lies between 86 for hexane and 58 for
butane as compared to 172 for RP-I.
Figure 114 shows the predicted and measured combustion gascompositions as a function of the overall mixture ratio. The starting mix-
ture ratio used for the prediction is 1.2. All but the hydrogen and methane
species original predictions show good agreement with the experimental data.
The data trends clearly show that, as the mixture ratio increases, the
hydrogen content decreases and the methane content increases. The hydrogen
content is underpredicted while the methane content is overpredicted,
indicating that the production of one is accompanied by destruction of theother.
Figure 115 shows the measured and predicted apparent molecu-lar weight and specific heat ratio for the gas fraction of the combustion
products. The molecular weight is overpredicted while the specific heatratio is underpredicted. This indicates that the model predicts heavier
hydrocarbon gas constituents than the combustion actually generates. Figure
116 shows the molecular weight and specific heat ratio for the entire mixture
of gaseous and condensed phase combustion products. The model does not pre-
dict solid phase products and therefore the predicted condensed phase con-
stituent contains only unvaporized fuel. The experimental condensed phaseconstituent was also assumed to contain only liquid RP-I, despite the fact
that a small amount (_1%) of solid particles was collected in the gas
samples.
Figures 86 and 87 show plots of the measured and predicted
gas temperature as a function of overall propellant mixture ratio for the EDMand platelet injectors. The model overpredicts the temperatures by approxi-
mately 65.5°C (150°F). The C* variation with the mixture ratio is shown in
Figures 82 and 84 for the EDM and platelet injector, respectively. The pre-
dicted and measured values are shown to be in good agreement. It should benoted that the measured C* does not significantly vary with chamber length.
3. Model Modification
The model updating work was initially focused on finding a
chemical reaction set that would predict carbon formation as well as H2 and
CH4 gas compositions in agreement with the experimental data. The workfollowed the sequence of events illustrated in Figure 117. The first modifi-cation involved replacing the entire secondary gas- phase reaction set with
224

C,-_:, :... " ",_
OF _'Ci;_ _UALITY
689476
68948
E
6895
689
69
m,..
w
(2.
10
0.0160
HEXANE (C6H 14)
RP-1
80 I00
I l30O
120 14.0 160 180
TEMPERATURE, OF
i i i _ I320 340 360
TEMPERATURE, °K
HEPTANE (C7H16)
200 220 240
i l i
380
Figure 113. Measured Condensate Vapor Pressure
225

\ -o -_
.I"
q
r
II l I I _d _ I I i I ii,_
_- % 'NOII3VB_4 3lOW i_H3 ,:- % 'NOI.L3V_J 3"lOW 9HE3 ,_-
_ . •g N
II % 'NOI.L3V'd-I 3"lOW _H % 'NOI.L3_-_ 310W _H_3
I
<5
ic_
_z
C-)rv-i,
%c-
°_-
0
c-O,_..
,_-
0
0
u'}
"_ u_
I,. 0
cn.._
:EZ 0r-,
0 0C.)
(.-
co
-r-
E0 %.-(._:,(_..
B.
,r--I'
226

OF " ",'"r_'J:_ QUALITY
Z
II
".F,f.....
0.f,-
,...,.
0or-
_n
Q;S.-
0_L_-
%c-"
"Z
S.-
CO
4..-0
0v9
"T.
f..
227

CT .,- ....- .....
Z0
I---
r'_
O_
rv"
.-I
Z
Z0
I""
,llL_Jrv"
0
-c5
6O
-c5
0
I I I "
011_ IV3H 3_nlXIW DI_ID3dS
V" I I l0 LO 0 LO
1HgI3M 3_fllXIW _V7N_370W
0
c5
6Oe_
-c5
0eO r,t
--c_ _--
tm_m
c5
0
oc5OJ
(/%
°p-a-J
_U
0
4_X
°_
c.)°_-
S..
%em
°r"
0
0
c'-0
"E
Eo
°_.-t.l_
228
w
I

.... ti"
i ii
ORIGINAL REACTION
SCHEME
I) _LAPORIZATION
2)-3) FRAGMENTATION
4)-19) SECONDARY REACTIONS
LITERATURESTUDYi
FIRST MODIFICATION
I) VAPORIZATION
2)-3) FRAGMENTATION
4)-12)JENSEN CH4 SCHEME
RESULTS
• NO CARBON
• TOO MUCH H?
• TOO LITTLE CH4 v
FINAL PREDICTIONS
i
I2ND MODIFICATION
• REACTION SET
SAME AS ORIGINAL
• REACTION (11)RATE CHANGE
RE-EXAMINATION OF
ORIGINAL REACTION
SET
• DEFINED CONTROLLING
CH4/H2REACTION (II)
EXAMINATION OFRESULTS
• NO H2 CONSUMINGREACTION
• NO CH4 PRODUCINGREACTION
• NO CARBON FORMATION
Figure 117. Fuel-Rich Combustion Model Modification Sequence
229

IV, D, Fuel-Rich Combustion Model Update (cont.)
the methane soot-formation reaction scheme proposed by Jensen (Ref. 2) shown
in Table XX. Several computer runs were made using this set without reaction
(12) (Table XX) which is the mechanism for solid particle growth. Reaction
(12) was not included due to uncertainties in selecting active growth species
and since solid carbon is produced by reaction (11). The results of the
Jensen scheme were an overprediction of the hydrogen content and an under-
prediction of the methane content. Further examination showed that hydrogen
is produced both by the starting equilibrium oxidation reaction and by theprimary thermal decomposition reaction while the Jensen set provides no reac-tions to consume the hydrogen. Also, methane is formed only in the primary
fragmentation decomposition process and is destroyed in the soot-formation
process. The result is an overprediction of hydrogen and an underpredictionof methane.
In retrospect, it is apparent that the Jensen scheme should
have been added to the original reaction set instead of replacing it. How-ever, the effort was redirected to a modification of the original reaction
set to achieve better H2 and CH4 gas composition correlation. Subsequentdetailed analysis reveaTed that reaction (11) of the original reaction set
(Table XVII) produces CH4 at such a high rate that it consumes almost the
entire H2 generated by the oxidation and fragmentation processes:
CH3 + CH4 I---- C2H 5 + H Reaction (11)
k11 = 1013 e-(23,000/RT) Original RateConstant
kli = 1012 e-(23,000/RT) Updated Rate Constant
This explains why the original prediction indicated too much CH4 and too
little H2. It was therefore decided to change the rate constant to obtain
the appropriate amount of H2 and CH4. The pre-exponential constant waschanged from 1013 to 1012 . With thls modification, the major products of
the primary reactions are CO and H2 by the oxidation, and C2H 4 and
C_H 6 from the fragmentation. The H2 and C2H4 undergo further reac-tlon (secondary reactions) to product CH4, as shown in Figure 118.
4. New Model Predictions
Several computer runs were made with the updated model for
comparison with the experimental data and to develop a better understanding
of fuel-rich preburner combustion. These predictions were made at a chamber
pressure of 13.8 MN/m 2 (2000 psia) and 33.5 m/s (110 ft/sec) chamber gasvelocity. The starting mixture ratio was taken to be 1.2 for both the EDM
230

z0
I--
c_0i,
0
z
oI=_
z
-r
i,i
z0
i,i
--r-
Ii.r)
z
zuJ
231

OF 2L_CR',L:.".L:'_Y
Z0
N
YD
cy ",-
Z0
t---
e,,,,et
Z0
I-.-
I---Z
X
i,
0
jZ
_ "r"
-r ,:%1
A 0
0
IE
0
._.1
0
v
_ .-t-
= ;.
÷ +
_,1 t'M
ITII4-
"-r'
LLJZ
LIJI
v" _
Z0
¢.,,.,
Z0
LLJ
÷
"rL.)
IT+
0
Z0
h.-l.J
0
"I-
0
Z0
h--¢J=),.,..,l--
r-,
I.--
U_1,1
I---
Z
L_U9
¢-0
aJ(.J
_J
0
4-J
-g0
5
e_
.r--
232

IV, D, Fuel-Rich Combustion Model Update (cont.)
and the platelet injector. The overall propellant mixture ratios used were0,2, 0.3, and 0.4.
Figure 119 shows the predicted percent fuel vaporizationversuschamber axial distance for the three different mixture ratios. The
vaporization rate is quite low compared to those usually observed in main
combustors. The fuel almost stops vaporizing at approximately 508 mm (20
in.) from the face. Higher overall mixture ratios have higher fuel vapori-zation rates because of the higher combustion flame temperatures.
Figure 120 shows the predicted gas temperature variation
with chamber axial distance. The same initial gas temperature is predicted
for the three different mixture ratios because the same starting mixtureratio is used. The gas temperature quickly drops with axial distance due to
fuel vaporization and endothermic RP-1 fragmentation reactions. Higher
overall mixture ratios produce both higher end-gas temperatures and higher
fuel vaporization efficiencies. The predictions show that the temperature
drops very rapidly near the face because of the high fuel vaporization rateresulting from the higher gas temperature. Once the gas temperature drops to
a certain range, the fuel vaporization becomes very slow, as shown in Figure
119. Both the temperature and vaporization curves are almost flat at chamber
lengths beyond 457 to 508 mm (18 to 20 in.)
Figure 121 shows the predicted gas-phase C* based on the gasfraction of combustion products only. The gas-phase C* curves have trendssimilar to those of the predicted gas temperature curves since C* is propor-
tional to the square root of the gas temperature. Figure 122 shows the pre-dicted mixture C* that takes the unvaporized fuel into account. The mixture
C* is always less than the gas-phase C* unless the vaporization is complete.A noticeable difference between the two sets of C* curves is that the gas C*
decreases as the chamber axial distance increases due to the gas temperature
reduction caused by the fuel vaporization and chemistry effects, whereas themixture C* increases due to the gas mass fraction increase resulting from theexcess fuel vaporization.
Figure 123 shows the predicted mass fractions of CO, H2,CH4, and RP-1 for a mixture ratio of 0.3. The carbon monoxide ma_s frac-tion remains constant because the model assumes no further chemical reactions
for the oxides once they are formed in the starting oxidation reaction. The
hydrogen fraction declines and the methane fraction increases as the chamber
axial distance increases because the latter, as discussed earlier, is formed
at the cost of the former. These results indicate that the gas compositionceases to change significantly beyond chamber lengths of 152.4 mm (6 inches).
Fuel vaporized beyond this point does not thermally decompose due to the low
temperature environments, as illustrated in Figure 124. The sum of the
233

2000
1800
1600
1400
_2oo
I000
8OO
6OO
400
MR : 0.4i00 [-- .----.----. ____
l _" "--" "--- "" -'-- MR=03
_ ao
-60 _--------'--"---'--
20
_ 1 ! ! J I I 1O0 , 4 8 12 16 20 24 28 32 36 40
AXIAL DISTANCE FROM FACE, IN.I , I , i I I I I J I I I
0 100 200 300. 400 500 600 700 800 900 1000mm
- Figure 119. Predicted Fuel Vaporization Profile - Updated Model
3400_,
3000_
_--. MR = 0.2i
1400 - _'-'- .....
" ! I ! 1 ! 1 I I 1 II0000 4 8 12 16 20 24 28 32 36 40
- AXIAL DISTANCE FROM FACE, IN.
I I I I I I I I I I I0 100 200 300 400 500 600 700 800 900 1000
mm
Figure 120. Predicted Gas Temperature Profile - Updated Model
234

L - _. •
II
//
33S/£_ 'ALIDOq3A 311SIH313_q_VH3 SV9
s/,.
0 C)0r'-,,,
_._5

I IQOO ,,:r
I I0 0
0,'-' 0
236
-"_,_:...._,_'-:2_Cf.'_,4,-,_L_'"'":"'Y
P! I!
,.,,.
c',J
11
m,,,
O _,o e_J
I
00
33S/13 'A±IO0"I3A DI±SI_13J.DV_VH33_QIXIH
1 I I I 1
s/w
iC:)
Io0
¢,-) o
00
co
z
i,
t'_ u.j ..,,_
p-
x
Q
QJ
oCD '5"O
Q_
(D.
O i
(D
u,.OI..
Q;
xo_--
"ID
(-,j
c_J
_D _j
c_J
°_...
:oo
_D

60-
5O
CO
MR : 0.3
O0 4
| I
0 I00
D
C12 H26 (L+V)
H2 x 10
CH4
I I I I I I I I I8 12 16 20 24 28 32 36 40
AXIAL DISTANCE FROM FACE, IN.
I I I I 1 I I I I
200 300 400 500 600 700 800 go0 i000mm
Figure 123. Predicted Major Species Mass Fractions - Updated Model
237

- "7
/
j°
% 'NOllDV'dd SSVW 73fi3
0
-,-j
7_O.
I
0._,.,.
•r.,.-
r'7
_J
r_I
i,
(..)
qJ%,.
O.
qJ
238

IV, D, Fuel-Rich Combustion Model Update (cont.)
liquid-phase and vapor-phase fuel remains unchanged beyond the 152.4-mm (6-
in.) point due to the freezing of the thermal decomposition reactions.
Based on the analytical predictions and C* performance
results, it can be assumed that the gas composition and gas temperature have
achieved steady values at the gas sample location (533 mm [2i in.]) from the
face). Cross plots of predicted gas composition, gas temperature, and mix-
ture C* were made at this location for comparison with the experimentaldata.
Figure 125 compares the newly predicted mole fractions of
the major species with both the original predictions and the experimentaldata. The new predictions are generally in better agreement with the experi-
mental data than the original predictions. Obviously, the most striking
improvement is in the agreement of H2 and CH4 mole fractions.
Figure 126 shows the C*, temperature, molecular weight, and
specific heat ratio comparisons. All except the C* show better agreementwith the data obtained with the updated model. The C* is underpredicted
about 3 to 4% due to a 6 to 8% error in underpredicting the molecularweights. Closer agreement could be achieved with more effort but is notdeemed warranted at this time.
239

OF POOR QUALITf
.% 'NOIJ.3V_3 3"lOW i_H3 % 'NOIJ.DV_3 310W 9HED
iI 0 " o/ J
% 'NOIJ.3_ 3lOW ZH % 'NOIJ.3VI_ 3"lOW,i_HZ3
Io
C
I
!
I
, I I I_2
% 'NOIl3_a S]ON 03
i •
0
0
0
00
I I I I I
% 'NOII3_ 370N ZO3
c_
l-'-
u • i.I
¢M
I--l'--x
¢D
0
I
0°m...
0
0¢.)
(.J
r_
4,_0
C0
"Z
N0
t,a_
240

1219
610
305
- _ 3000
i2000
3
- _ 1ooo-
_ < __ .2
_./_// 1221999
777
I I 5550.3 0.4
MIXTURE RATIO
" 2200
o:
1800
- # 1400 -
- 10000.2
B
_ NEwo
0
I 10.3 0.4
MIXTURE RATIO
SYMBOL INJECTOR LENGTH
O EDM-LOL 787mm (31in.)
SWIRL 787m_ (31 in.)
0 SWIRL 533 mm (21 in.)
SWIRL 533 mm (21 in.)
_C SWIRL 787mm (31 in.)• SWIRL 1168mm (46 in.)
T.R. T.S. M.I.S.
NO NO NO
NO NO NO
NO NO NO
YES NO NO
YES NO NO
YES YES YES
SOLIDLINE - OLD PREDICTION
CENTERLINE- NEW PREDICTION
F-
= 40
-:m
e,,,,,
,.,.J
oi,i.,..io
e,,,,,,,_)I,=-X
Figure 126.
_ MW : MWG + Nc/N G MWC
3O
2O0.2
0 UNBURNED FUEL-- ASSUMED TO BE< 1.2 - IN VAPOR PHASE
_1.1
X
1 I _I.0 I0.3 0.4 0.2 0.3
MIXTURE RATIO MIXTURE RATIO
Comparison of Predicted to Measured Performance- Updated Model
i0.4
241


REFERENCES
io
o
Schoenman, L. "Fuel/Oxidizer-Rich High-Pressure Preburners," FinalReport, NASA CR-16544, NASA/Lewis Research Center, October 1981.
Jensen, D.E., "Soot Formation in Liquid Propellant Rocket Motors;A Basic Modeling Approach," Combustion Institute/European Symposium,1973.
Precedingpageblank
243


DISTRIBUTION LIST FOR FINAL REPORT - CR~165609CONTRACTNAS 3-22647
No. of
Name
Nationai Aeronautics & Space Adminis;rationLewis Research Center
21000 Brookpark RoadCleveland, Ohio 44135
Attn: Contracting Officer, MS 500-306 iTechnical Utilization Office, MS 7-3 i
Technical Report Control Office, MS 5-5 I
AFSC Liaison Office, MS 501-3 2
Library, MS 60-3 2Office of Reliability & Quality Assurance, IMS 500-211
N. T. Musial, MS 500-318 IH. J. Price, Project Manager, MS 501-6 10E. A. Bourke, MS 501-5 5
T. Bra_bs, MS 86-5 I
National Aeronautics & Space Administration
Headquarters
Washington, D.C. 20546
Attn: Office of Aeronautics & Space Technology
RS/Oirector, Manned Space Technology IRP/Director, Space Propulsion & Power I
RW/Director, Materials & Structures I
RTP-B/F. W. Stephenson i
Attn: Office of Manned Space Flight
MT/Director, Advanced Manned Mission 1
Attn: Gffice of Space Science
SG/Oirector, Physics & Astronomy Programs i
SL/Oirector, Planetary Programs iSV/Director, Launch Vehicles & Propulsion I
Attn: Office of Technology Ut%lization Division
KT/Director, Technology Utilization I
National Aeronautics & Space AdministrationAmes Research Center
Moffett Field, CA 94035
Attn: Library I
National Aeronautics & Space Administration
F]ight Research CenterP.O. Box 273
Edwards, CA 93523
Attn: Library I
National Aeronautics & Space Administration
Goddard Space Flignt CenterGreenbelt, MD 20771
Attn: Library I
National Aeronauzics & Space AdministrationGeorge C. Marshall Space Flight Center
Marshall Space Flight Center, AL 35812Attn: Library i
J. L. Sanders/PDl3 iR. Richmond/EP24 I
J. A. Lombardo/EP21 I
C. R. Bailey/EP23 i
D. E. Pryor/EP23 I
National Aeronautics & Space Administration
John F. Kennedy Space CenterKennedy Space Center, FL 32899
Attn: Library I
National Aeronautics & Space Administration
Lyndon B. Johnson Space CenterHouston, TX 77058
Attn: Library iEP2/M. F. Lausten i
National Aeronautics & Space Administration
Langley Research Center
Hampton, VA 23665
Attn: Library IJ. A. Martin, MS 365 1
Name
NASA Scientific & Technical Information
FacilityP.O. aox 8757
Baltimore-Washington Intnl. AirportBaltimore, MD 21240
Attn: Accessioning Department
Office of the Director of Defe_;e
Research & EngineeringWashington, D.C. 20301Attn: Office of Assistant Director
(Chemical Technology)
Jet Propulsion Laboratory4800 Oak Grove Drive
Pasadena, CA 91103
Attn: Library
Defense Documentation Center
Cameron Station, Bldg 550!0 Duke St.
Alexandria, VA 22314Attn: TISIA
Advanced Research Projects AgencyWasMngton, D.C. 20625
Attn: Library
Aeronautical Systems Division
Air Force Systems Command
Wright-Patterson Air FOrce BaseDayton, Ohio 45433
Attn: LibraryE. E. Bailey
Air Force Rocket Propulsion Laboratory (R_M)Edwards, CA 93523
Attn: Library
Air Force FTC (FTAT-2)
Edwards Air Force Base, CA 93523
Attn: Library
Air Force Office of Scientific Research
1400 Wilson Blvd.
Arlington, VA 22209Attn: Library
U.S. Air Force, Office of InformationOffice of Sec. of Air Force
The PentagonWashington, D.C. 20333Attn: Library
Air Force Aero Propulsion LaboratoryResearch & Technology Division
U.S. Air Force Systems Command
Wright Patterson AFB, Ohio ¢5433
Attn: Library (APRP)
Arnold Engineering Development Center
Air Force Systems CommandTullahoma, TN 37388
Attn: Library
Bureau of Naval Weapons
Department of the NavyWashington, O.C.
Attn: Library
U.S. Naval Research Laboratory
Washington, D.C. 20390Attn: Library
U.S. Army Research Office (Durham)
Box OM, Duke Station
Durham, NC 27706Attn: Library
No. of
i0
i
i
i
1
i
I
I
I
i
I
I
I
I
i
I
245

DISTRIBUTION LIST FOR FINAL REPORT - CR 165609
Name
U.S. Army Missile CommandRedstone Scientific Information Center
Redstone Arsenal, AL 35808Attn: Docun_nt Section
U.S. Naval Missile Center
Point Mugu, CA 93041
Attn: Technical Library
U.S. Naval Weapons CenterChina Lake, CA 93557
Attn: Library
Aro Incorporated
Arnold Engineering Development CenterArnold AF Station, TN 37389
Attn: Library
Battelle .Memorial Institute
505 King AvenueColumbus, Ohio 43201
Attn: Library
Bell Aerosystems inc.Box I
Buffalo, NY 14240
Attn: Library
Boeing Company, Space DivisionP.O. Box 868
Seattle, WA 98124
Attn:. Library
Chemical Propulsion Information Agency
Applied Physics Laboratory
8621 Georgia AvenueSilver Spring, MD 20910
Chrysle_ CorporationSpace DivisionP.O. Box 29200
New Orleans, LA 70129
Attn: Library
General Dynamics/ConvairP.O. Box 1i28
San Diego, CA 92112
Attn: Library
General Electric Company
Missiles & Soac_ Systems Center
Valley Forge Space Tech. CenterP.O. Box 8555Philadelphia, PA 19101
Attn: Library
Grumman Aerospace Corp.
Bethpage, L.I., NY 11714Attn: Library
Ling-Temco-Vought CoroorationP.O. Box 5907
Dallas, TX 75222
Attn: Library
Lockheed Missiles & Space Co.
P.O. Box 504
Sunnyvale, CA 94088
Attn: Library
Marquardt Corporation16555 Saticoy Street
Box 2013 South Annex
Van Nuys, CA 9_409
Attn: Library
CONTRACT NAS 3-22647
No. of
_ies
I
Na_
Martin-Marietta Corp.P.O. Box 179
Denver, CO 80201
Attn: Library
McDonnell Douglas Astronautics5301Bolsa Avenue
Huntington Beach, CA 92547Attn: Library
Philco-Ford CorporationAeronautics Div.
Ford Rd.
Newport Beach, CA 92663
Attn: Library
Purdue University
Lafayette, IN 47907
Attn: Library
RocketdyneA Div. of Rockwell Corp.
6633 Canoga Avenue
Canoga Park, CA 91304Attn: Library
G. Brefaer
F. M. Kirby
Rocket Research CorporationWillow Road at 116th Street
Redmond, WA 98052
Attn: Library
Thiokol Chemical CorporationP.O. Box i000
Newton, PA 18940Attn: Library
TRW Systems, Inc.i Space Park
Redondo Beach, CA 90278
Attn: Library
United Aircraft Corporation
Pratt & Whitney Division
Florida Research & Development CenterP.O. Box 2691
West Palm Beach, FL 33402
Attn: Library
United Technologies Research Center
East Hartford, CT
Attn: Library
No. of
copies
246