imi protect case study: structured benefit-risk applied to ... events... · imi protect case study:...
TRANSCRIPT
IMI PROTECT Case Study: Structured Benefit-Risk Applied to Natalizumab
European Statistical Meeting EFSPI/PSI Structured Benefit-Risk Assessment Richard Nixon • IMI PROTECT Work Program 5 • Decision System Sciences, Novartis AG, Switzerland 17 September 2013, RSS, London
Acknowledgments
• Christoph Dierig, Isabelle Stoeckert, Silvia Kuhls – Bayer
• Thai Son Tong Nguyen – ScHARR, Sheffield
• John Pears - Astra Zeneca
• Shahrul Mt-Isa, Ed Waddingham, Kimberly Hockley, Ioanna Tzoulaki – Imperial
• Gemma Hodgson - Takeda
• Andrew Thomson – MHRA
• Dolores Montero - Agencia Española de Medicamentos y Productos Sanitarios
EFSPI/PSI September 2013 | Richard Nixon | BRAT framework 2
Disclaimers
“The processes described and conclusions drawn from the work
presented herein relate solely to the testing of methodologies
and representations for the evaluation of benefit and risk of
medicines.
This report neither replaces nor is intended to replace or
comment on any regulatory decisions made by national
regulatory agencies, nor the European Medicines Agency.”
3 EFSPI/PSI September 2013 | Richard Nixon | BRAT framework

Acknowledgments
• The research leading to these results was conducted as part of
the PROTECT consortium (Pharmacoepidemiological Research
on Outcomes of Therapeutics by a European ConsorTium,
www.imi-protect.eu) which is a public-private partnership
coordinated by the European Medicines Agency.
• The PROTECT project has received support from the Innovative
Medicine Initiative Joint Undertaking (www.imi.europa.eu)
under Grant Agreement n° 115004, resources of which are
composed of financial contribution from the European Union's
Seventh Framework Programme (FP7/2007-2013) and EFPIA
companies’ in kind contribution.
4 EFSPI/PSI September 2013 | Richard Nixon | BRAT framework

EFSPI/PSI September 2013 | Richard Nixon | BRAT framework 5
Decide on a Multiple Sclerosis treatment Three outcomes are important to you
Treatment A Treatment B
40% 30%
5% 3%
0% 0% PML*
Flu-like reaction
Disability progression
0.5%
For two treatments given over a two-year period the proportion of patients experiencing each of three outcomes is:
* PML: Progressive multifocal leukoencephalopathy
Which treatment would you choose? • How often does each outcome occur?
• How important is each outcome if it occurs?
In real life the decision is more complex • Which outcomes do you choose to make the decision?
• Which treatments do you choose between?
• How do you assess how important each outcome is to you?

• Represents a framework, not a recipe
– A tool to support decision makers, not an algorithm to replace them.
– Helps a team develop a common understanding of what is of central importance.
– Process to structure and analyze information.
– Visualization tools to communicate benefit-risk.
• Built on well-established Decision Analysis principles
– Promotes traceability, transparency and consistency.
• Communication tool for internal decision making and sponsor – health authority alignment
– Consolidated view of key benefit and risk outcome measures.
• Provides a structured framework for a drug through its lifecycle
EFSPI/PSI September 2013 | Richard Nixon | BRAT framework 6
Fundamental principles of benefit-risk Built on methods to support decision making
Structured benefit risk assessment - increasingly important role in the regulatory environment
Major HAs actively developing benefit risk assessment approaches to increase transparency of decisions
• FDA: PDUFA V commitments include use of structured benefit risk assessment in review of NME NDAs and original BLAs as of 2014.
• EMA: Benefit Risk Methodology project to improve/standardize benefit risk decision making at EMA and in Member State HAs is an EMA priority for 2013.
• PSUR: inclusion of a structured benefit-risk section is now mandatory (EU requirement).
• “The benefit-risk evaluation should be presented in a structured manner....”
EFSPI/PSI September 2013 | Richard Nixon | BRAT framework 7
“The benefit risk assessment represents the most crucial part of assessment report.” - EMA day 80 assessment report guidance:
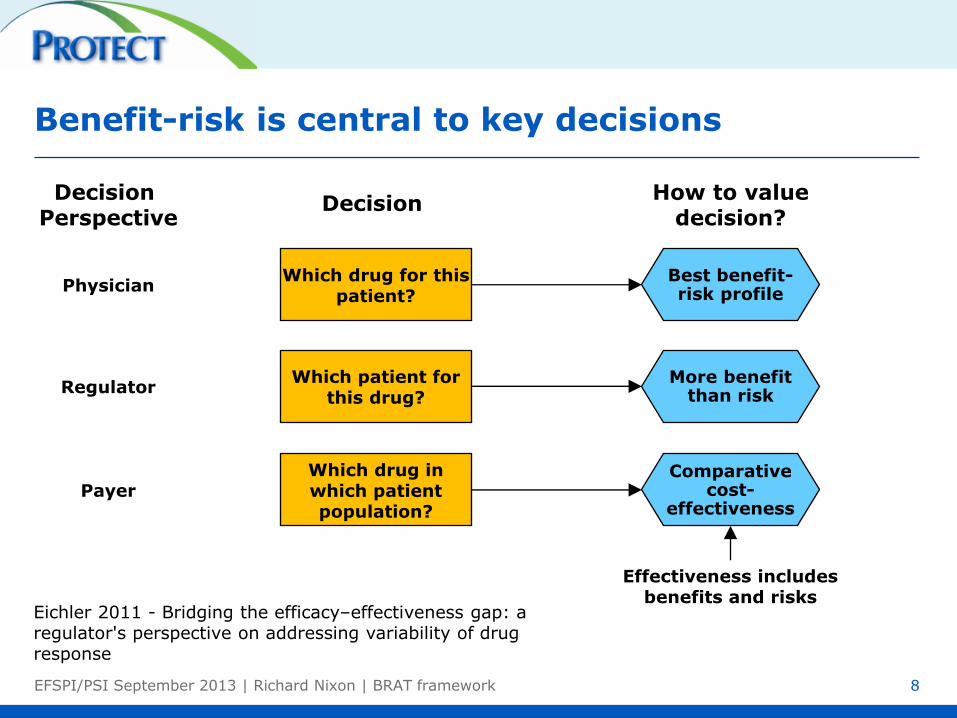
Benefit-risk is central to key decisions
EFSPI/PSI September 2013 | Richard Nixon | BRAT framework 8
Which drug for this patient?
Best benefit-risk profile
Decision Perspective
Regulator
Physician
Payer
Which patient for this drug?
More benefit than risk
Which drug in which patient population?
Comparative cost-
effectiveness
Decision How to value
decision?
Effectiveness includes benefits and risks
Eichler 2011 - Bridging the efficacy–effectiveness gap: a regulator's perspective on addressing variability of drug response
IMI (Innovative Medicines Initiative) PROTECT
• PROTECT (Pharmacoepidemiological Research on Outcomes of
Therapeutics by a European Consortium)
– Collaborative European project coordinated by the EMA
– Multi-national consortium of 32 partners including academics,
regulators, and pharmaceutical companies
• Work program 5 is focusing on
benefit-risk integration and representation
– This includes case studies to evaluate various frameworks and
quantitative methods for benefit-risk assessment
EFSPI/PSI September 2013 | Richard Nixon | BRAT framework 9

Natalizumab – A short history
• Natalizumab was approved in 2004 by the FDA for the
treatment of relapsing remitting multiple sclerosis (RRMS).
• In 2005 the drug was suspended because of an associated
incidence of progressive multifocal leukoencephalopathy (PML),
a rare neurological disorder.
• In 2006 it was re-introduced due to patient demand, but with
strict risk minimization measures.
• In 2009, due to occurrence of further PML in monotherapy post
marketing, CHMP reassessed the PML risk of Tysabri and
confirmed the current approval.
EFSPI/PSI September 2013 | Richard Nixon | BRAT framework 10
EFSPI/PSI September 2013 | Richard Nixon | BRAT framework
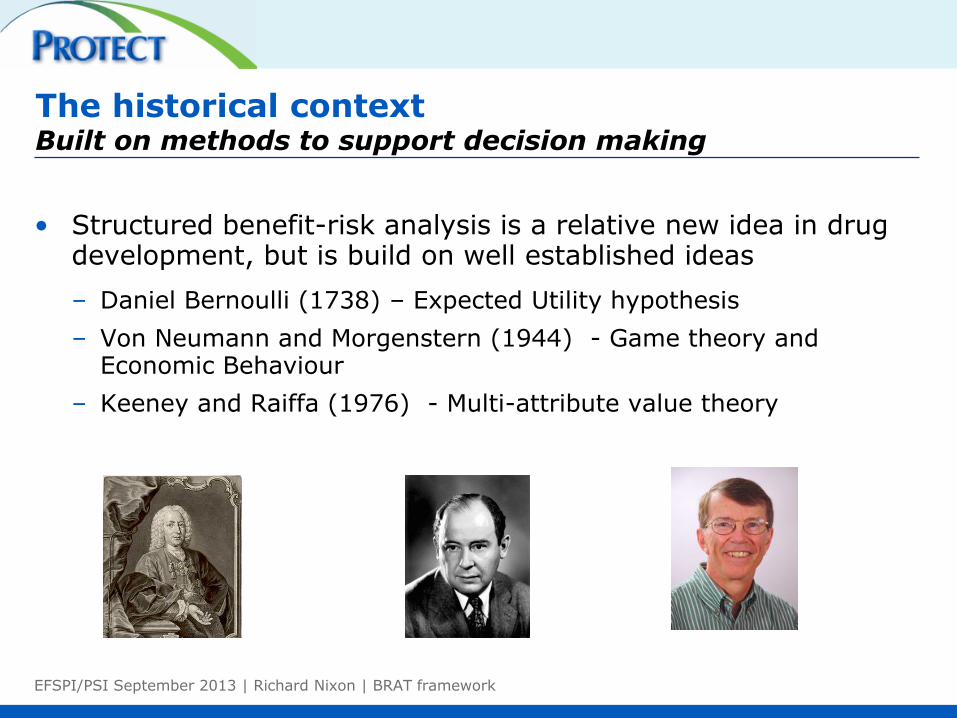
The historical context Built on methods to support decision making
• Structured benefit-risk analysis is a relative new idea in drug development, but is build on well established ideas
– Daniel Bernoulli (1738) – Expected Utility hypothesis
– Von Neumann and Morgenstern (1944) - Game theory and Economic Behaviour
– Keeney and Raiffa (1976) - Multi-attribute value theory

The BRAT* Framework for benefit-risk Six step process
12 EFSPI/PSI September 2013 | Richard Nixon | BRAT framework *Benefit Risk Action Team
Identify key benefits and
risks
Customize Weighting Outcome
Importance
B-R metrics
Decision Context
Source Data

Objective Should natalizumab be kept on the market given that episodes of PML are
observed?
Indication Relapsing remitting multiple sclerosis
Population Adults with relapsing remitting multiple sclerosis
Drug Natalizumab, 300mcg, iv, qm.
Comparative
Treatment
Alternative(s)
Placebo,
Interferon beta-1a, 30mcg, im, qw
Glatiramer acetate, 20mg, sc, qd
Time Horizon Two years. For PML fives year as it takes longer to manifest.
Stakeholder
perspective EMA
1) Define a decision context Sets the frame of the structured benefit-risk assessment
13 EFSPI/PSI September 2013 | Richard Nixon | BRAT framework 13
EFSPI/PSI September 2013 | Richard Nixon | BRAT framework 14
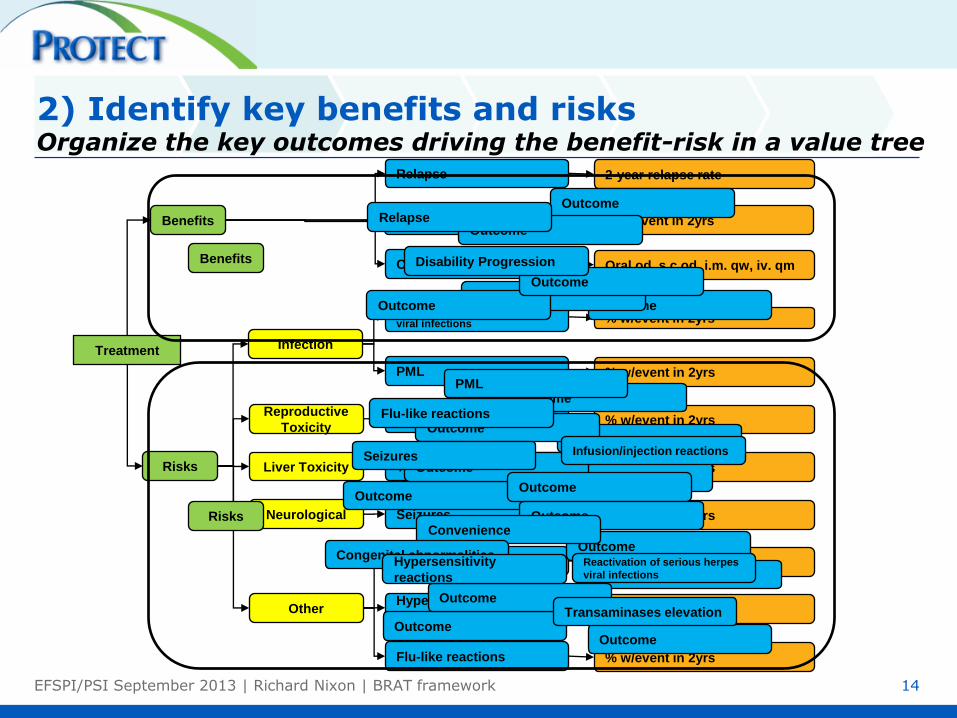
2) Identify key benefits and risks Organize the key outcomes driving the benefit-risk in a value tree
Treatment
Oral od, s.c od, i.m. qw, iv. qm Convenience
Benefits
Risks
Infection
Reproductive
Toxicity
Liver Toxicity
Neurological
Other
2-year relapse rate Relapse
% w/event in 2yrs Disability Progression
% w/event in 2yrs Reactivation of serious herpes
viral infections
% w/event in 2yrs PML
% w/event in 2yrs Congenital abnormalities
% w/event in 2yrs Transaminases elevation
% w/event in 2yrs Seizures
% w/event in 2yrs Infusion/injection reactions
% w/event in 2yrs Hypersensitivity
reactions
% w/event in 2yrs Flu-like reactions
Outcome
Outcome
Outcome
Outcome
Outcome
Outcome
Outcome
Outcome
Outcome
Outcome
Outcome
Outcome
Outcome
Outcome
Outcome
Outcome
Outcome
Outcome
Outcome
Convenience
Relapse
Disability Progression
Reactivation of serious herpes
viral infections
PML
Congenital abnormalities
Transaminases elevation
Seizures Infusion/injection reactions
Hypersensitivity
reactions
Flu-like reactions
Benefits
Risks

3) Consolidate source data Pool clinical data from internal and external studies
EFSPI/PSI September 2013 | Richard Nixon | BRAT framework 15
Identify Select Extract Aggregate
Search strategy
Search query
Study eligibility
criteria
Study worksheet Data source table Data summary table
Extraction
guidelines
one row per study one row per
outcome
e.g. meta-analysis,
placebo-calibration
one row per
study/treatment/outcome

4) Customize and communicate Re-visit key benefits and risks
EFSPI/PSI September 2013 | Richard Nixon | BRAT framework 16
The benefit-risk process can be iterative.
The key benefits and risks may need to be “tuned”.
• Changes outcomes in value tree if data are not available.
• Outcome measures may be refined in response to how data are measured.
Guard against bias.
• Changing the value tree in response to observed data could bias the benefit-risk balance.
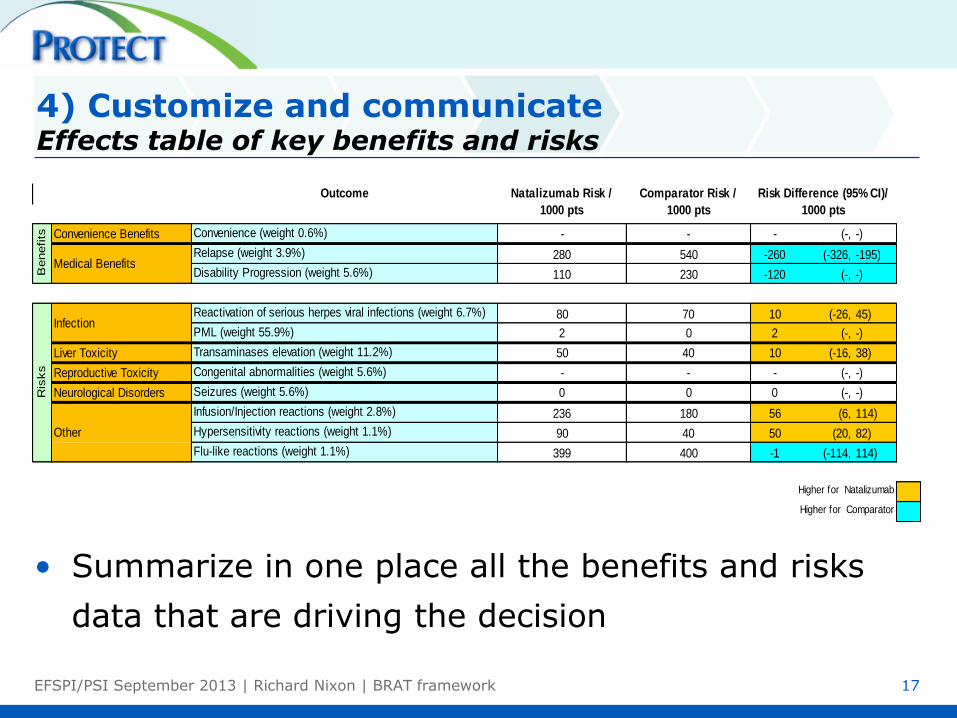
• Summarize in one place all the benefits and risks
data that are driving the decision
EFSPI/PSI September 2013 | Richard Nixon | BRAT framework 17
Convenience Benefits Convenience (weight 0.6%) - - - (-, -)
Relapse (weight 3.9%) 280 540 -260 (-326, -195)
Disability Progression (weight 5.6%) 110 230 -120 (-, -)
Reactivation of serious herpes viral infections (weight 6.7%) 80 70 10 (-26, 45)
PML (weight 55.9%) 2 0 2 (-, -)
Liver Toxicity Transaminases elevation (weight 11.2%) 50 40 10 (-16, 38)
Reproductive Toxicity Congenital abnormalities (weight 5.6%) - - - (-, -)
Neurological Disorders Seizures (weight 5.6%) 0 0 0 (-, -)
Infusion/Injection reactions (weight 2.8%) 236 180 56 (6, 114)
Hypersensitivity reactions (weight 1.1%) 90 40 50 (20, 82)
Flu-like reactions (weight 1.1%) 399 400 -1 (-114, 114)
Outcome Natalizumab Risk /
1000 pts
Comparator Risk /
1000 pts
Risk Difference (95% CI)/
1000 pts
Higher for Natalizumab
Higher for Comparator
Benefits
Medical Benefits
Infection
Other
Ris
ks
4) Customize and communicate Effects table of key benefits and risks
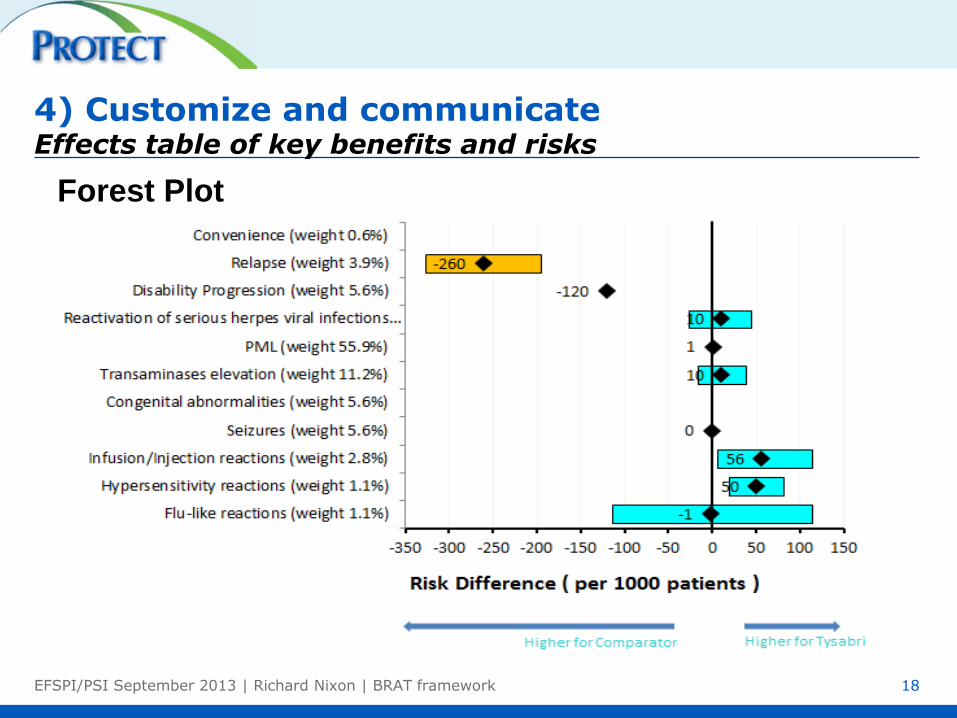
Forest Plot
18
4) Customize and communicate Effects table of key benefits and risks
EFSPI/PSI September 2013 | Richard Nixon | BRAT framework

EFSPI/PSI September 2013 | Richard Nixon | BRAT framework 19
5) Assess outcome importance MCDA and the Women's heptathlon
Event Jessica
Ennis
Lilli
Schwarzkopf
Tatyana
Chernova
Javelin throw (m) 47.49 51.73 46.29
High Jump (cm) 186 183 180
200 metres (s) 22.83 24.77 23.67
Event Jessica
Ennis Value
Lilli
Schwarzkopf Value
Tatyana
Chernova Value
Javelin throw (m) 47.49 812 51.73 894 46.29 789
High Jump (cm) 186 1055 183 1016 180 979
200 metres (s) 22.83 1096 24.77 909 23.67 1013
Event Jessica
Ennis Value
Lilli
Schwarzkopf Value
Tatyana
Chernova Value
Javelin throw (m) 47.49 812 51.73 894 46.29 789
High Jump (cm) 186 1055 183 1016 180 979
200 metres (s) 22.83 1096 24.77 909 23.67 1013
Total 2963 2819 2781

EFSPI/PSI September 2013 | Richard Nixon | BRAT framework 20
5) Assess outcome importance MCDA and multiple sclerosis drugs
Placebo Natalizumab
Outcome Measure Measure Benefit-
risk
Relapse 1.46 0.47
PML 0 0.0015
Infusion reactions
injection reactions 0 0.24
Total
Placebo Natalizumab
Outcome Measure Value Benefit-
risk Measure Value
Benefit-
risk
Relapse 1.46 0.27 0.47 0.766
PML 0 1 0.0015 0.998
Infusion reactions
injection reactions 0 1 0.24 0.764
Total
Placebo Natalizumab
Outcome Weight Measure Value Benefit-
risk Measure Value
Benefit-
risk
Relapse 8% 1.46 0.27 0.47 0.766
PML 54% 0 1 0.0015 0.998
Infusion reactions
injection reactions 3% 0 1 0.24 0.764
Total
Placebo Natalizumab
Outcome Weight Measure Value Benefit-
risk Measure Value
Benefit-
risk
Relapse 8% 1.46 0.27 0.022 0.47 0.766 0.061
PML 54% 0 1 0.54 0.0015 0.998 0.54
Infusion reactions
injection reactions 3% 0 1 0.03 0.24 0.764 0.02
Total 0.59 0.62
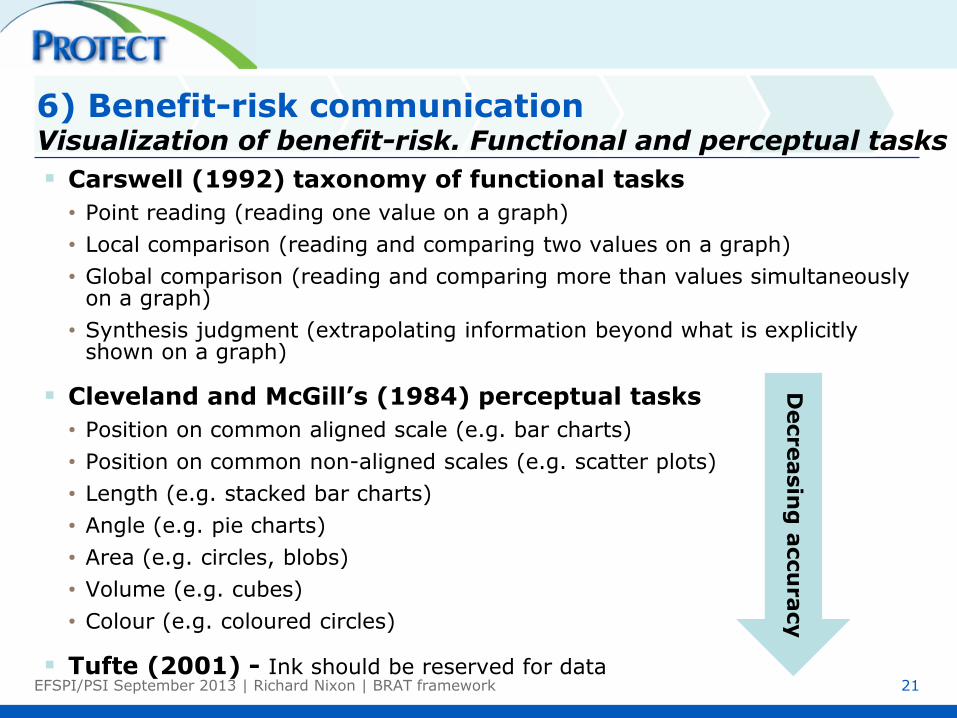
6) Benefit-risk communication Visualization of benefit-risk. Functional and perceptual tasks
EFSPI/PSI September 2013 | Richard Nixon | BRAT framework 21
Carswell (1992) taxonomy of functional tasks
• Point reading (reading one value on a graph)
• Local comparison (reading and comparing two values on a graph)
• Global comparison (reading and comparing more than values simultaneously on a graph)
• Synthesis judgment (extrapolating information beyond what is explicitly shown on a graph)
Cleveland and McGill’s (1984) perceptual tasks
• Position on common aligned scale (e.g. bar charts)
• Position on common non-aligned scales (e.g. scatter plots)
• Length (e.g. stacked bar charts)
• Angle (e.g. pie charts)
• Area (e.g. circles, blobs)
• Volume (e.g. cubes)
• Colour (e.g. coloured circles)
Tufte (2001) - Ink should be reserved for data
Decreasin
g a
ccu
racy

Drill down to the values and the weights Incremental benefit-risk of natalizumab – placebo
EFSPI/PSI September 2013 | Richard Nixon | BRAT framework 22
• This shows which
outcomes are contributing most to the total benefit-risk.
• Even thought the weight given to PML is large, the incidence is small, leading to a small contribution to the benefit-risk.

Waterfall plot Incremental benefit-risk of natalizumab – placebo
EFSPI/PSI September 2013 | Richard Nixon | BRAT framework 23
• The length of each bar gives the contribution to the overall BR.
• End of the last bar gives the overall benefit-risk.
– Denominated in the BR of one EDSS progression
• Green = positive BR.
• Red = negative BR.
• The contribution to the overall BR of PML is very small.
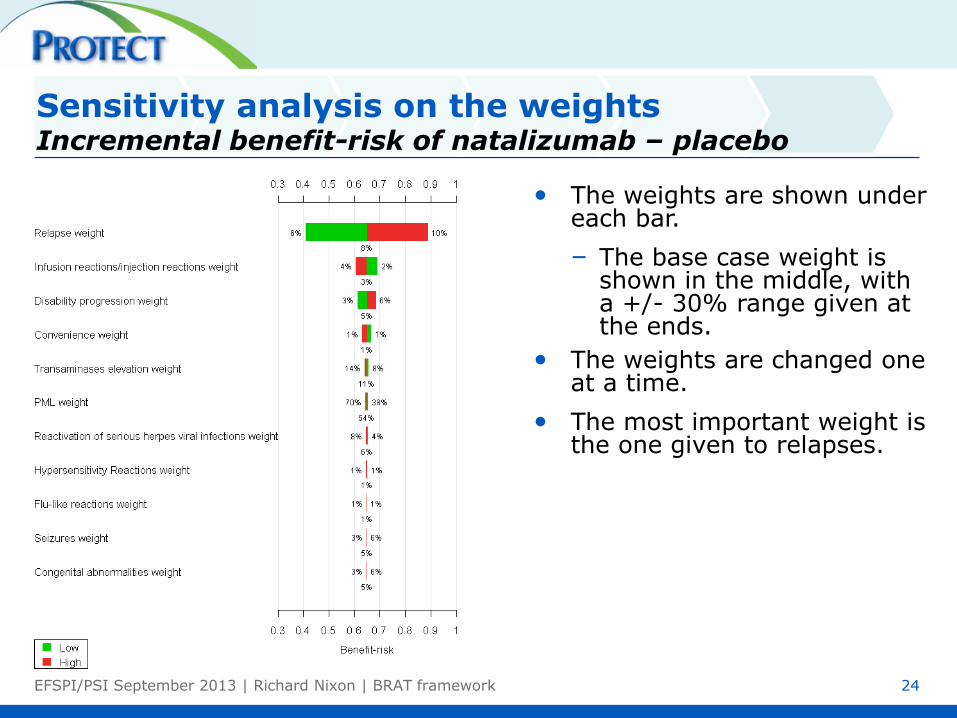
Sensitivity analysis on the weights Incremental benefit-risk of natalizumab – placebo
EFSPI/PSI September 2013 | Richard Nixon | BRAT framework 24
• The weights are shown under each bar.
– The base case weight is shown in the middle, with a +/- 30% range given at the ends.
• The weights are changed one at a time.
• The most important weight is the one given to relapses.
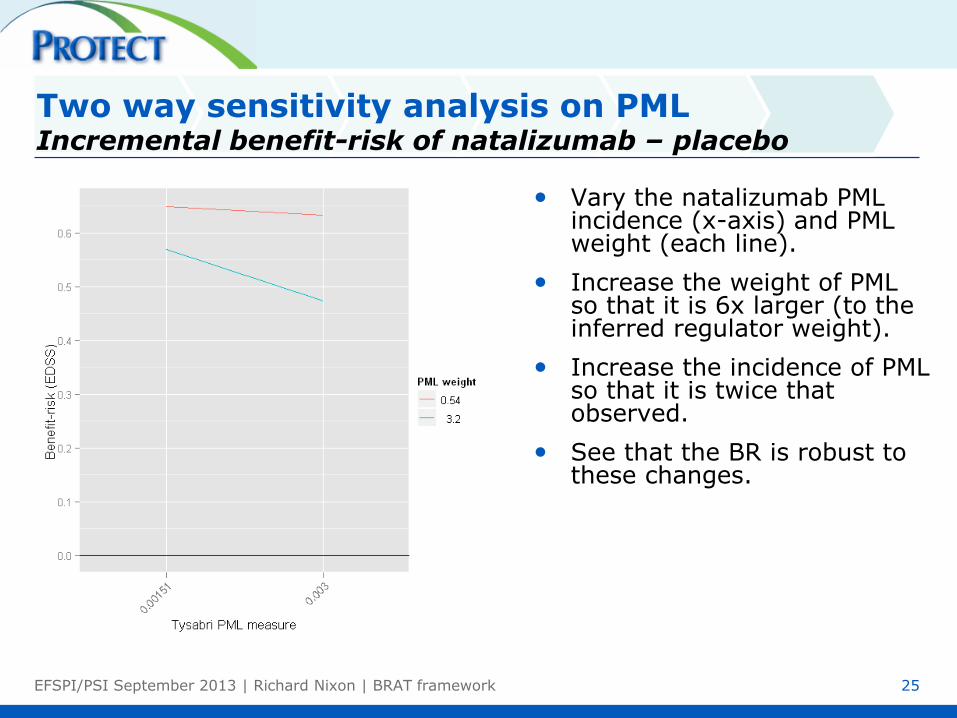
Two way sensitivity analysis on PML Incremental benefit-risk of natalizumab – placebo
EFSPI/PSI September 2013 | Richard Nixon | BRAT framework 25
• Vary the natalizumab PML incidence (x-axis) and PML weight (each line).
• Increase the weight of PML so that it is 6x larger (to the inferred regulator weight).
• Increase the incidence of PML so that it is twice that observed.
• See that the BR is robust to these changes.

Required natalizumab effect on outcomes to reach a neutral benefit-risk vs. placebo
EFSPI/PSI September 2013 | Richard Nixon | BRAT framework 26
Outcome Weight Current
Tysabri
Effect
Required
Tysabri
effect
Required
Change
(Absolute)
New BR
PML 54% 0.15% 6.36% 6% 0.00
Transaminases elevation 11% 5% 36% 31% 0.00
Relapse 8% 0.47 1.31 0.84 0.00
Reactivation of serious herpes viral infections 6% 0% 56% 56% 0.00
Seizures 5% 1% 68% 67% 0.00
Congenital abnormalities 5% 0% 67% 67% 0.00
Disability progression 5% 11% 78% 67% 0.00
Infusion reactions/injection reactions 3% 24% 100% 76% 0.21
Flu-like reactions 1% 40% 100% 60% 0.55
Hypersensitivity Reactions 1% 0% 100% 100% 0.47
Convenience 1% iv qm hosp sc od NA 0.53

EFSPI/PSI September 2013 | Richard Nixon | BRAT framework 27
Long text describing benefits and risks.
Lacking explicit identification of key benefit and key risk outcomes.
Limited systematic comparison of active drug vs. comparators for all key benefits and key risks.
No structured, quantitative summary of all key benefit and key risk outcomes.
Which key benefits and key risks were considered and why.
Which comparators were chosen.
The magnitude of benefit and risk effects.
The rationale for the relative importance of outcomes.
Presentation in a concise graphical/tabular summary.
In the future, the benefit-risk communication will be
transparent and defensible on:
Current benefit-risk communication
Current vs. future benefit-risk communication From a narrative to a structured framework

Conclusions
• The BRAT framework using MCDA is a sufficiently generic and flexible framework for performing a structured benefit-risk in any common context.
• Benefit-risk analysis is conceptually easy but hard to operationalize – in particular:
– To define consistent criteria across decision options, find data matching these criteria, and elicit value judgments
– Squash the messy complexity of real life into a simple model
• A structured benefit-risk assessment does not necessarily give you the answer.
– It is a framework for decomposing and understanding a problem
– Assesses the main value drivers of a decision
– Communicates issues in a transparent, rational and consistent way
– Allows sensitivity analysis
EFSPI/PSI September 2013 | Richard Nixon | BRAT framework 28

References
IMI PROTECT Benefit- Risk integration and representation Reports
http://www.imi-protect.eu/benefitsRep.shtml
Carswell, C. M. (1992). An evaluation of the basic tasks model of graphical perception.
Human Factors, 34, (5) 535-554.
Cleveland, W. S. and R. Mcgill (1984). Graphical Perception - Theory, Experimentation,
and Application to the Development of Graphical Methods. Journal of the American
Statistical Association, 79, (387) 531-554.
Tufte, E. R. (2001). The Visual Display of Quantitative Information., Second edition ed.
Cheshire, CT, Graphics Press.
EFSPI/PSI September 2013 | Richard Nixon | BRAT framework 29

BACK UP
EFSPI/PSI September 2013 | Richard Nixon | BRAT framework 30

Step 5: Assess outcome importance Linear Additive models
31
X
• Linear Additive Models with Swing Weights
– Value functions: Within outcome importance
– Swing weights: Between outcome importance
Measure
= 0.47 BR
Contribution
= 0.062 Elicited Weight
= 8%
Value(measure)
= 0.77
Outcome:
2-year relapse
rate
2-year relapse rate 0% 2
Value = 0.77 1
0
Identify
Outcomes Customize
Outcome Importance
B-R
metrics
Decision
Context
Source Data
EFSPI/PSI September 2013 | Richard Nixon | BRAT framework
Step 5: Assess outcome importance Three common methods for weight elicitation that use linear additive models
32
• Multi-criteria Decision Analysis (MCDA)
• MACBETH (Measuring Attractiveness by a Categorical Based Evaluation Technique)
• AHP (Analytic Hierarchy Process)
Identify
Outcomes Customize
Outcome Importance
B-R
metrics
Decision
Context
Source Data
EFSPI/PSI September 2013 | Richard Nixon | BRAT framework
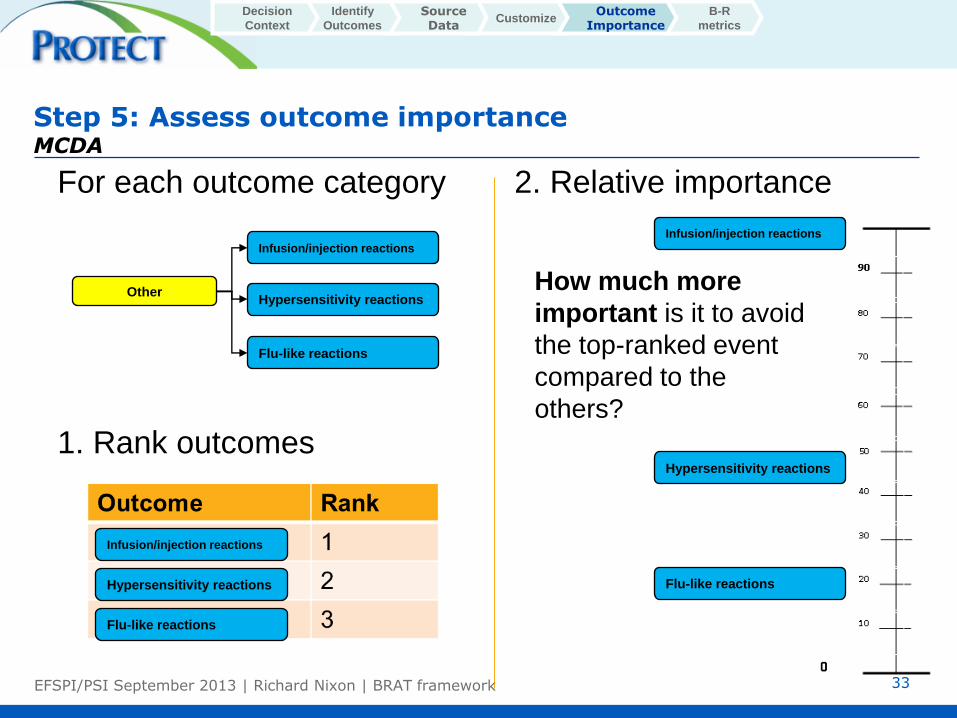
Step 5: Assess outcome importance MCDA
33
2. Relative importance
For each outcome category
1. Rank outcomes
How much more
important is it to avoid
the top-ranked event
compared to the
others?
Other
Infusion/injection reactions
Hypersensitivity reactions
Flu-like reactions
Infusion/injection reactions
Hypersensitivity reactions
Flu-like reactions
Infusion/injection reactions
Hypersensitivity reactions
Flu-like reactions
Identify
Outcomes Customize
Outcome Importance
B-R
metrics
Decision
Context
Source Data
EFSPI/PSI September 2013 | Richard Nixon | BRAT framework

Repeat this process all the way up the value tree The top ranked outcome in each category is carried up the tree
• Move bottom-up through the tree and compare the top-ranked outcomes from each category
• Finally, the top-ranked benefit is compared to the top-ranked risk
• The individual weights for each outcome can then be calculated
34
Identify
Outcomes Customize
Outcome Importance
B-R
metrics
Decision
Context
Source Data
Treatment
Convenience
Benefits
Risks
Infection
Reproductive
Toxicity
Liver Toxicity
Neurological
Other
Relapse
Disability Progression
Reactivation of serious herpes
viral infections
PML
Congenital abnormalities
Transaminases elevation
Seizures
Infusion/injection reactions
Hypersensitivity
reactions
Flu-like reactions
EFSPI/PSI September 2013 | Richard Nixon | BRAT framework

35
Compute the overall weights
Treatment
Convenience
Benefits
Risks
Infection
Reproductive
Toxicity
Liver Toxicity
Neurological
Other
Relapse
Disability Progression
Reactivation of serious herpes
viral infections
PML
Congenital abnormalities
Transaminases elevation
Seizures
Infusion/injection reactions
Hypersensitivity
reactions
Flu-like reactions
Note that as the weight for a relapse is for a value function with the measure scale with a range from 0 to 2, then actual weight of a single relapse is half that shown here.
Identify
Outcomes Customize
Outcome Importance
B-R
metrics
Decision
Context
Source Data
Weights
PML is 10x worse
than disease
progression
EFSPI/PSI September 2013 | Richard Nixon | BRAT framework

Example question to assess between outcome importance
• Imagine a clinical trial of 1000 patients with 1 patient
developing PML in the treatment arm.
• How many patients would need to have an EDSS progression
prevented for you to be indifferent about the benefit and harm
caused by the treatment?
EFSPI/PSI September 2013 | Richard Nixon | BRAT framework 36
MACBETH (Measuring Attractiveness by a Categorical Based Evaluation Technique) Qualitative assessment
37
• MACBETH is similar to MCDA, except that it provides a different way to get the weights
• Step 1: Qualitatively assess how much more attractive it is to move from worst to best for outcome i vs. moving from worst to best for outcome j and keeping everything else at the worst measure (Do this for each pair of criteria)
• Step 2: Check consistency of answers
• Step 3: Compute initial guess at weights with optimization
• Step 4: Refine weights while maintaining consistency
Identify
Outcomes Customize
Outcome Importance
B-R
metrics
Decision
Context
Source Data
EFSPI/PSI September 2013 | Richard Nixon | BRAT framework

MACBETH Qualitative assessment
38
Identify
Outcomes Customize
Outcome Importance
B-R
metrics
Decision
Context
Source Data
EFSPI/PSI September 2013 | Richard Nixon | BRAT framework

AHP (Analytic Hierarchy Process) Qualitative assessment
39
• Weights are elicited by making pairwise comparisons between criteria
• “How much more important is outcome i vs. outcome j?”
• Must provide number from 1 to 9 on relative scale
• Weight is calculated by finding the dominant eigenvector of the corresponding matrix
• Value functions are computed in a similar manner (do not necessarily come from linear function)
• No consistency check, but rather a score (<0.2 is okay)
Identify
Outcomes Customize
Outcome Importance
B-R
metrics
Decision
Context
Source Data
EFSPI/PSI September 2013 | Richard Nixon | BRAT framework

40
Two way sensitivity analysis on weights Incremental Benefit-Risk of Tysabri – Placebo
Identify
Outcomes Customize
Outcome Importance
B-R metrics
Decision
Context
Source Data
• Vary the PML weight (x-axis) and the relapse weight (each line).
• Green line in the middle is the elicited weight. Change by +/- 30%.
• Again the BR is robust to these changes.
EFSPI/PSI September 2013 | Richard Nixon | BRAT framework

41
Probabilistic sensitivity analysis of the measures Incremental Benefit-Risk of Tysabri – Placebo
Identify
Outcomes Customize
Outcome Importance
B-R metrics
Decision
Context
Source Data
• 80% CI are included in the waterfall plot.
• The uncertainty in the overall BR is robust to uncertainty in the outcome measures
• The components of the uncertainty can be seen.
EFSPI/PSI September 2013 | Richard Nixon | BRAT framework

Work Package 5 of PROTECT (membership)
Public Private
EMA AstraZeneca
DKMA Bayer
AEMPS GSK
MHRA Lundbeck
Imperial College (co-leader) Merck KGaA (co-leader)
Mario Negri Institute Novartis
CPRD Novo Nordisk
IAPO Pfizer
Roche
Sanofi-Aventis
Takeda Eli Lilly Amgen
42 EFSPI/PSI September 2013 | Richard Nixon | BRAT framework