imf country report no. 15/132 switzerland · ©2015 international monetary fund imf country report...
TRANSCRIPT

©2015 International Monetary Fund
IMF Country Report No. 15/132
SWITZERLAND 2015 ARTICLE IV CONSULTATION—STAFF REPORT; PRESS RELEASE; AND STATEMENT BY THE EXECUTIVE DIRECTOR FOR SWITZERLAND
Under Article IV of the IMF’s Articles of Agreement, the IMF holds bilateral discussions with members, usually every year. In the context of the 2015 Article IV consultation with Switzerland, the following documents have been released and are included in this package: The Staff Report prepared by a staff team of the IMF for the Executive Board’s
consideration on May 18, 2015, following discussions that ended on March 23, 2015, with the officials of Switzerland on economic developments and policies. Based on information available at the time of these discussions, the staff report was completed on May 4, 2015.
An Informational Annex prepared by the IMF.
A Press Release summarizing the views of the Executive Board as expressed during its May 18, 2015 consideration of the staff report that concluded the Article IV consultation with Switzerland.
A Statement by the Executive Director for Switzerland.
The publication policy for staff reports and other documents allows for the deletion of market-sensitive information.
Copies of this report are available to the public from
International Monetary Fund Publication Services PO Box 92780 Washington, D.C. 20090
Telephone: (202) 623-7430 Fax: (202) 623-7201 E-mail: [email protected] Web: http://www.imf.org
International Monetary Fund
Washington, D.C.
May 2015

SWITZERLAND STAFF REPORT FOR THE 2015 ARTICLE IV CONSULTATION
KEY ISSUES
Switzerland has once again had to contend with capital flow volatility. Following the
exit from the exchange rate floor in mid-January 2015 and the subsequent appreciation
of the franc, the Swiss economy faces exchange rate overvaluation, slower near-term
growth, and deflation. Both growth and inflation are expected to recover gradually over
the medium term—to around 2 percent and 1 percent, respectively—as the economy
adjusts to the shock. However, this relatively benign scenario is subject to important
risks, most notably that operating in a low inflation environment may prove more
difficult than assumed in the central scenario.
Monetary and fiscal policies can support faster adjustment and reduce risks. Further
monetary easing via purchases of (mainly foreign) assets would help limit the near-term
growth slowdown, reduce risks related to low inflation, and lessen franc overvaluation.
Central bank communication should also be geared toward building an understanding
of policy objectives and ensuring that inflation expectations do not become entrenched
at low levels. Scope for fiscal policy to support aggregate demand is limited by
Switzerland’s fiscal rule and the small, open nature of Switzerland’s economy. That said,
fiscal policy can still support recovery by allowing automatic stabilizers to operate freely,
as allowed under the rule. The rule’s escape clause should be triggered in the event of a
severe downturn to allow discretionary fiscal stimulus, as monetary policy would likely be
overburdened in such a scenario.
The financial sector reform agenda should also be completed. The Swiss authorities
have made important progress in this regard, and further steps are planned. Specific
priorities, as laid out in last year’s Financial Sector Assessment Program (FSAP) update,
include raising the leverage ratios of the two large international banks, increasing public
disclosure of information on risk weights, reforming FINMA’s use of external auditors,
overhauling deposit insurance, and containing housing- and mortgage-related risks.
Over the medium term, Switzerland faces a number of structural challenges; the
authorities’ ongoing efforts to address them are welcome and should continue.
Priorities include adopting proposed pension reforms to ensure the sustainability of the
system for future generations; completing ongoing reforms of corporate taxation and
financial controls in ways that ensure full compliance with international initiatives aimed
at limiting money laundering and cross-border tax evasion and avoidance; and reducing
uncertainties related to future immigration policies and relations with the European
Union.
May 4, 2015
SWITZERLAND
2 INTERNATIONAL MONETARY FUND
Approved By Mahmood Pradhan
and Mary Goodman
Discussions took place in Bern and Zurich on March 13–23. The staff
team comprised Messrs. Fletcher (head), Ishi, Mrkaic (all EUR), and
Lundback (MCM). Ms. Denis and Ms. Jung (both EUR) supported the
mission from headquarters. Messrs. Heller and Cavaliere (OED)
participated in the discussions.
CONTENTS
MACROECONOMIC CONTEXT __________________________________________________________________ 4
A. Recent Developments __________________________________________________________________________ 4
B. External Assessment ___________________________________________________________________________ 11
C. Outlook and Risks _____________________________________________________________________________ 14
MACROECONOMIC POLICIES: SUPPORTING SUSTAINABLE GROWTH _____________________ 16
A. Monetary and Exchange Rate Policies _________________________________________________________ 17
B. Fiscal Policy ___________________________________________________________________________________ 18
COMPLETING FINANCIAL SECTOR REFORM _________________________________________________ 21
A. The Big Banks _________________________________________________________________________________ 21
B. Broader FSAP Recommendations _____________________________________________________________ 23
C. Housing Market _______________________________________________________________________________ 24
STRUCTURAL ISSUES __________________________________________________________________________ 27
STAFF APPRAISAL _____________________________________________________________________________ 28
BOXES
1. Guaranteed Rate of Return in Swiss Pension Funds ___________________________________________ 20
2. Measures to Reduce Housing- and Mortgage-Related Risks __________________________________ 25
FIGURES
1.The Long View, 2000–15 ________________________________________________________________________ 5
2. Recent Economic Developments, 2011–14 _____________________________________________________ 6
3. Selected Monetary Indicators, 2010–14 ________________________________________________________ 8
4. Selected Financial Indicators, 2010–15 _________________________________________________________ 9
5. Indicators for Global Systemic Banks, 2006–15 ________________________________________________ 10
6. External Accounts and Exchange Rates, 2000–14 ______________________________________________ 13
7. Housing Markets, 1980–2014 __________________________________________________________________ 26

SWITZERLAND
INTERNATIONAL MONETARY FUND 3
TABLES
1. Selected Economic Indicators, 2010–18 _______________________________________________________ 31
2. Balance of Payments, 2010–18 ________________________________________________________________ 32
3. SNB Balance Sheet, 2009–14 __________________________________________________________________ 33
4. General Government Finances, 2010–18 _______________________________________________________ 34
5. General Government Operations, 2003–12 ____________________________________________________ 35
6. Financial Soundness Indicators, 2007–14 ______________________________________________________ 36
ANNEXES
I. External Sector Assessment ____________________________________________________________________ 37
II. Risk Assessment Matrix ________________________________________________________________________ 45
III. Debt Sustainability Analysis ___________________________________________________________________ 47
IV. FSAP Update—Status of Key Recommendations _____________________________________________ 53
V. Authorities’ Response to Past IMF Policy Recommendations __________________________________ 57

SWITZERLAND
4 INTERNATIONAL MONETARY FUND
MACROECONOMIC CONTEXT
Switzerland has once again had to contend with capital flow volatility. Following the exit from the
exchange rate floor and the subsequent appreciation of the franc, the Swiss economy faces exchange
rate overvaluation, slower near-term growth, and deflation. Both growth and inflation are expected to
recover gradually over the medium term, to around 2 percent and 1 percent, respectively. However,
this relatively benign scenario is subject to important risks, most notably that operating in a low
inflation environment may prove more difficult than assumed in the central scenario.
A. Recent Developments
1. The Swiss economy grew steadily in 2014. Output expanded by 2.0 percent, driven by
strong external demand and private consumption (Table 1, Figures 1–2). Solid growth narrowed the
output gap to around -0.3 percent, with capacity utilization nearing its historic average. The
unemployment rate stabilized at 3.2 percent.
2. In 2015, the outlook shifted following the exit from the exchange rate floor.
The floor of 1.2 francs per euro, which had been in place since 2011, faced little pressure for
most of 2013–14. However, in late 2014 the Swiss National Bank (SNB) started intervening
heavily to defend the floor in response to increased capital inflows arising from a combination of
events, including anticipation of the European Central Bank’s quantitative easing program and
geopolitical turmoil in Europe. In response, in December 2014 the SNB announced a cut in the
interest rate on SNB deposits from zero to -0.25 percent (effective January 22, 2015), but
significant interventions were still required to maintain the exchange rate floor.
At the same time, the franc’s depreciation against the dollar since mid-2014 had reduced the
likelihood of franc overvaluation, raising risks that further intervention would ultimately result in
losses on the SNB’s balance sheet, which was approaching 90 percent of GDP. In addition, the
SNB was concerned that, once the magnitude of its interventions became public, speculation
about exit from the floor would mount, fueling a vicious cycle of rising inflows and a rapidly
growing balance sheet.
In this context, the SNB decided that the costs of maintaining the floor were no longer worth its
benefits. The SNB thus exited from the floor on January 15, 2015. It also announced a cut in its
effective policy rate from -0.25 percent to -0.75 percent (effective January 22, 2015). The policy
rate applies on deposits at the SNB that exceed a high threshold (for domestic banks, the
threshold is 20 times a bank’s required reserves as of the reporting period ending November 19,
2014; minus (plus) any increase (decrease) in cash held). In this way, the effect of negative
interest rates on bank profits is limited, while still creating incentives at the margin for agents to
shift out of franc deposits and thereby depreciate the franc.
Following significant intervention (purchases of roughly CHF 40 billion,1 or 6 percent of GDP)
during the subsequent two weeks, the franc has since hovered between 1.00 and 1.10 per euro,
with limited intervention since end-January.
1 Staff estimate based on weekly changes in SNB sight deposits.

SWITZERLAND
INTERNATIONAL MONETARY FUND 5
Figure 1. Switzerland: The Long View, 2000–15
-
Sources: Haver Analytics; InformationNotice System; State Secretariat for Economic Affairs;and Swiss National Bank.
-10
-8
-6
-4
-2
0
2
4
6
8
10
12
-10
-8
-6
-4
-2
0
2
4
6
8
10
12
2000 2002 2004 2006 2008 2010 2012 2014
Consumption
Construction
Fixed investment
Net exports
Inventories and others
GDP
Contribution to Real GDP Growth
(percent)
Growth has remained robust since the global crisis...
-20
-15
-10
-5
0
5
10
15
20
25
30
-20
-15
-10
-5
0
5
10
15
20
25
30
2000 2002 2004 2006 2008 2010 2012 2014
Secondary income
Primary income
Services
Goods
Current account
Current Account Balance
(percent of GDP)
...while the current account surplus has shrunk.
-2
-1
0
1
2
3
4
5
6
7
8
0
1
2
3
4
5
6
7
8
9
10
2000 2002 2004 2006 2008 2010 2012 2014
Unemployment rate (left scale)
Employment growth (right scale)
Labor Markets
(percent)
Employment has grown moderately, contributing to
low unemployment rates...
80
85
90
95
100
105
110
115
120
125
130
80
85
90
95
100
105
110
115
120
125
130
2000 2002 2004 2006 2008 2010 2012 2014
NEER
REER
Effective Exchange Rates
(index 2010=100)
...with the franc appreciating in the post-crisis period , partly
reflecting safe-haven inflows.
-2.0
-1.5
-1.0
-0.5
0.0
0.5
1.0
1.5
2.0
2.5
-2.0
-1.5
-1.0
-0.5
0.0
0.5
1.0
1.5
2.0
2.5
2000 2002 2004 2006 2008 2010 2012 2014
General Government
Confederation
Fiscal balances have been strong...
Fiscal Balance
(percent of GDP)
0
10
20
30
40
50
60
70
80
90
100
0
10
20
30
40
50
60
70
80
90
100
2000 2002 2004 2006 2008 2010 2012 2014
Confederation
Cantons
Communes
Social Security
General Goverment Debt
(percent of GDP)
...resulting in lower debt.

SWITZERLAND
6 INTERNATIONAL MONETARY FUND
Figure 2. Switzerland: Recent Economic Developments, 2011–14
Sources:Haver Analytics; Swiss Federal Statistical Office; Swiss Institutefor Business Cycle Research; and Swiss National
Bank.
-6
-4
-2
0
2
4
6
8
-6
-4
-2
0
2
4
6
8
Mar-11 Dec-11 Sep-12 Jun-13 Mar-14 Dec-14
Switzerland
United States
European Union
Output Growth
(quarterly percent change, SAAR)
Growth picked up in the second half of 2014...
-6
-4
-2
0
2
4
6
8
10
-6
-4
-2
0
2
4
6
8
10
Mar-11 Dec-11 Sep-12 Jun-13 Mar-14 Dec-14
Private consumption
Fixed assets
Construction
Real Consumption and Investment
(quarterly percent change, SAAR, 3qma)
...mainly driven by consumption and investment in fixed assets...
-30
-25
-20
-15
-10
-5
0
5
10
15
20
-40
-30
-20
-10
0
10
20
30
40
50
Mar-11 Dec-11 Sep-12 Jun-13 Mar-14 Dec-14
Consumer sentiment (left scale)
EU-compatible consumer confidence
Consumer Confidence
Consumer confidence has been soft..
0
10
20
30
40
50
60
70
80
90
100
-100
-90
-80
-70
-60
-50
-40
-30
-20
-10
0
Mar-11 Dec-11 Sep-12 Jun-13 Mar-14 Dec-14
Outlook, job security (left)
Outlook, unemployment (right)
Labor Market Outlook
(percent, SA)
...with rising concern about job security.
0
10
20
30
40
50
60
70
80
60
70
80
90
100
110
120
130
140
150
160
Mar-11 Dec-11 Sep-12 Jun-13 Mar-14 Dec-14
Balance (right scale)
Total exports
Total imports
Trade
(millions of 2010 CHF)
...while the trade balance remains in surplus.
30
40
50
60
70
80
90
40
60
80
100
120
140
160
Jan-07 Jan-09 Jan-11 Jan-13 Jan-15
KOF leading indicator
Manufacturing PMI (right scale)
Leading Indicators
High-frequency indicators show weakening activity following
the franc's appreciation.

SWITZERLAND
INTERNATIONAL MONETARY FUND 7
3. Following the appreciation, near-
term growth indicators have weakened.
After exhibiting modest growth during 2012–
14, KOF survey indexes of the current and
future business climate have declined sharply
following the exit from the exchange rate
floor, as has manufacturing PMI. The current
climate index has sunk to its lowest level
since the 2009 recession.
4. Inflation has fallen deeper into
negative territory. The strong franc,
together with lower oil prices, drove headline
CPI inflation down to -0.9 percent in March
2015, with positive inflation for domestically produced goods (0.3 percent) being more than offset
by sharply negative inflation for foreign goods (-4.3 percent). Measures of underlying inflationary
pressures were similarly contained at end-March—core inflation was -0.2 percent, and unit labor
cost growth remained muted near zero (Figure 3).
5. The initial effects from negative interest rates and the exit from the exchange rate
floor on the financial sector appear to have been fairly limited. The stock market and stock
prices for major banks have returned to levels similar to those before the immediate sharp drop
following the exchange rate floor exit (Figures 4-5). Similarly, CDS spreads for the major banks have
not moved much. However, it is too early to
clearly see what the full effects will be. The
large global banks foresee some fairly small
negative effects, but are taking measures to
adjust; some business segments will also
benefit due to the increased FX market
activity. The effect of negative interest rates
on banks’ profits is mitigated by the fact that
(i) the rate applies only on deposits at the
SNB over a high threshold (20 times reserves)
and (ii) banks are passing on the negative
rates to wholesale depositors. However, these
effects vary across banks, such that some
specific smaller banks may be more adversely
affected.
0
10
20
30
40
50
60
70
-70
-60
-50
-40
-30
-20
-10
0
10
20
30
2008 2009 2010 2011 2012 2013 2014 2015
Business Climate
Business Plans
Manufacturing PMI (right scale)
Switzerland: KOF Business Survey Indices
Source: Haver Analytics.
-0.8
-0.6
-0.4
-0.2
0.0
0.2
0.4
-0.8
-0.6
-0.4
-0.2
0.0
0.2
0.4
2010 2011 2012 2013 2014 2015
Policy rate
Time deposits (3 month)
Saving deposits
Source: Swiss National Bank.
Switzerland: Retail Deposit Interest Rates
(Percent)

SWITZERLAND
8 INTERNATIONAL MONETARY FUND
Figure 3. Switzerland: Selected Monetary Indicators, 2010–14
Sources:Haver Analytics; Swiss Federal Statistics Office; and Swiss National Bank.
1/ Nominal rate minusinflation.
-2.0
-1.5
-1.0
-0.5
0.0
0.5
1.0
1.5
2.0
2.5
3.0
-2.0
-1.5
-1.0
-0.5
0.0
0.5
1.0
1.5
2.0
2.5
3.0
2010 2011 2012 2013 2014 2015
Inflation
(y/y percent change)
CPI inflation
Core inflation
Inflation is falling sharply...
-5
-4
-3
-2
-1
0
1
2
3
-5
-4
-3
-2
-1
0
1
2
3
2010 2011 2012 2013 2014 2015
Inflation by Component
(y/y percent change)
CPI
CPI domestic
CPI foreign
...as falling foreign CPI continues to put downward
pressures on overall CPI.
0
2
4
6
8
10
12
14
0
2
4
6
8
10
12
14
2010 2011 2012 2013 2014 2015
Real Lending Rates
(percent)
Current account advance facilities
Investment loans with fixed interest rates
Mortgages with fixed interest rates
Real lending rates have edged up due to lower inflation.
-4
-3
-2
-1
0
1
2
3
4
-4
-3
-2
-1
0
1
2
3
4
2010 2011 2012 2013 2014
Unit Labor Costs
(y/y percent change)
Meanwhile, domestic inflationary pressures have also
weakened.
-2.0
-1.5
-1.0
-0.5
0.0
0.5
1.0
1.5
2.0
-2.0
-1.5
-1.0
-0.5
0.0
0.5
1.0
1.5
2.0
2010 2011 2012 2013 2014 2015
Interest Rates
(percent)
Policy rate
Real policy rate 1/
Against this backdrop, the SNB has cut the policy
rate to negative territory.
0.7
0.9
1.1
1.3
1.5
1.7
1.9
-8
-6
-4
-2
0
2
4
6
8
2007 2008 2009 2010 2011 2012 2013 2014 2015
CPI Foreign Inflation and Exchange Rates
(y/y percent change)
CPI foreign G&S
CHF/Euro (level, right scale)
Foreign CPI has fallen along with exchange rate
movements.

SWITZERLAND
INTERNATIONAL MONETARY FUND 9
Figure 4. Switzerland: Selected Financial Indicators, 2010–15
Sources: Bloomberg;and Datastream.
0.6
0.7
0.8
0.9
1.0
1.1
1.2
1.3
1.4
1.5
0.6
0.7
0.8
0.9
1.0
1.1
1.2
1.3
1.4
1.5
Jan-1
1
May-
11
Sep
-11
Jan-1
2
May-
12
Sep
-12
Jan-1
3
May-
13
Sep
-13
Jan-1
4
May-
14
Sep
-14
Jan-1
5
May-
15
CHF/USD CHF/EUR
Foreign Currency Exchange Rates
(Units)
The franc appreciated sharply following the SNB's
decision to exit from the floor on January 15...
0
200
400
600
800
1,000
1,200
1,400
0
200
400
600
800
1,000
1,200
1,400
Jan-1
1
May-
11
Sep
-11
Jan
-12
May-
12
Sep
-12
Jan
-13
May-
13
Sep
-13
Jan-1
4
May-
14
Sep
-14
Jan-1
5
May-
15
Overall Financials
Stock Market Indices
(Index)
...and Swiss stock indices fell, but have since
recovered.
-1.0
-0.5
0.0
0.5
1.0
1.5
2.0
2.5
3.0
3.5
4.0
-1.0
-0.5
0.0
0.5
1.0
1.5
2.0
2.5
3.0
3.5
4.0
Jan-1
1
May-
11
Sep
-11
Jan
-12
May-
12
Sep
-12
Jan
-13
May-
13
Sep
-13
Jan-1
4
May-
14
Sep
-14
Jan
-15
May-
15
Switzerland Germany
United States
10-Year Government Bond Yields
(Percent)
Swiss sovereign bond yields remain the lowest in the world...
0
20
40
60
80
100
120
140
0
20
40
60
80
100
120
140
Jan
-11
May-
11
Sep
-11
Jan
-12
May-
12
Sep
-12
Jan
-13
May-
13
Sep
-13
Jan
-14
May-
14
Sep
-14
Jan
-15
May-
15
Switzerland
Germany
United States
5-Year Soverign CDS Spreads
(Units)
...and Swiss sovereign CDS spreads are also low.
-1.25
-1.00
-0.75
-0.50
-0.25
0.00
0.25
0.50
0.75
1.00
-1.25
-1.00
-0.75
-0.50
-0.25
0.00
0.25
0.50
0.75
1.00
Jan
-11
May-
11
Sep
-11
Jan
-12
May-
12
Sep
-12
Jan
-13
May-
13
Sep
-13
Jan
-14
May-
14
Sep
-14
Jan
-15
May-
15
1-Month LIBOR
6-Month LIBOR
12-Month LIBOR
Short-Term Interest Rates
(Percent)
Interbank interest rates are currently negative...
-2.0
-1.5
-1.0
-0.5
0.0
0.5
1.0
1.5
2.0
-2.0
-1.5
-1.0
-0.5
0.0
0.5
1.0
1.5
2.0
3M 1Y 3Y 5Y 7Y 9Y 12Y 20Y 30Y 50Y
4/28/2015
3/31/2015
12/31/2014
12/31/2013
Sovereign Yield Curve
(Percent)
...so are longer-term interest rates all the way out to 12-year
maturities, as of late April.

SWITZERLAND
10 INTERNATIONAL MONETARY FUND
Figure 5. Switzerland: Indicators for Global Systemic Banks, 2006–151
Sources: Bankscope; Bloomberg; and IMF staff calculations.
1/ Switzerland numbers are for Credit Suisse and UBS. "Other"includes Citigroup, Deutsche Bank, HSBC, JP Morgan Chase,
Barclays, BNP, Bank of America, New York Mellon, Goldman Sachs, Mitsubishi, Morgan Stanley, Royal Bank of Scotland,
Bank of China, BBVA, BPCE, Crédit Agricole, ING, Mizuho, Nordea, Santander, Société Générale, Standard Chartered, State
Street, Sumitomo, UniCredit, Wells Fargo, Commerzbank, and Lloyds.
0
1
2
3
4
5
6
0
1
2
3
4
5
6
2006 2007 2008 2009 2010 2011 2012 2013 2014
CHE Other
Tangible Common Equity to Tangible Assets
(Percent)
0
20
40
60
80
100
120
0
20
40
60
80
100
120
Loans-to-deposits Liquid assets-to-deposits and short-term borrowings
CHE Other
Loans-to-Deposits and Liquidity
(Percent)
0
10
20
30
40
50
60
70
0
10
20
30
40
50
60
70
2006 2007 2008 2009 2010 2011 2012 2013 2014
CHE Other
Wholesale Funding
(Percent of total funding)
0
5
10
15
20
25
30
35
40
45
50
0
5
10
15
20
25
Jan
-11
May-
11
Sep
-11
Jan
-12
May-
12
Sep
-12
Jan
-13
May-
13
Sep
-13
Jan
-14
May-
14
Sep
-14
Jan
-15
May-
15
UBS
Credit Suisse (right scale)
Equity Prices
0
50
100
150
200
250
0
50
100
150
200
250
Jan-1
1
May-
11
Sep
-11
Jan-1
2
May-
12
Sep
-12
Jan-1
3
May-
13
Sep
-13
Jan-1
4
May-
14
Sep
-14
Jan-1
5
May-
15
UBS
Credit Suisse
CDS Spreads
0
10
20
30
40
50
60
0
10
20
30
40
50
60
2006 2007 2008 2009 2010 2011 2012 2013 2014
CHE Other
RWA to Assets
(Percent)

SWITZERLAND
INTERNATIONAL MONETARY FUND 11
6. The most affected parts of the financial sector are likely life insurers and private banks.
Life insurers have been under pressure due to a low-yield environment for several years now,
forcing them to make significant adjustments. As a result, they actually recorded stronger
positions, on average, in FINMA’s latest Solvency Stress Test (based on end-2013 data) relative
to two years earlier. Still, the recent drop in yields will create further challenges for life insurers,
and the authorities should remain vigilant and support consolidation as needed.
The same applies to private banks, which have significant revenue in foreign currency, but most
of their costs in Swiss franc. Moreover, private banks were already facing pressure from
international initiatives aimed at increasing transparency (e.g., the automatic exchange of tax
information and AML/CFT-related initiatives). So far, the fallout on smaller Swiss private banks
from the policy changes in 2015 appears to have been more limited than initially feared, but the
situation must be continuously monitored.
7. The appreciation of the franc also had outward spillovers.
Franc appreciation affected several economies in Eastern Europe with a sizeable stock of franc-
denominated housing loans, notably Croatia and Poland, where such loans accounted for 6.3
and 7.7 percent of GDP, respectively. In general, the immediate macroeconomic impact of the
franc’s appreciation appears somewhat limited and is partly offset by lower franc interest rates;
however, the Croatian government temporarily prevented pass-through to borrowers by fixing
the applicable exchange rate at the pre-appreciation parity while a permanent solution is being
negotiated between banks and borrowers. The contained effect is also partly due to actions by
supervisors in some Eastern European countries to halt the provision of new franc-denominated
mortgages in recent years and to manage related risks. Hungary mandated the conversion of all
FX mortgages into domestic currency in November 2014.
The exit from the exchange rate floor might also have modest effects on aggregate demand in
other countries. In particular, the appreciation of the franc might increase external demand in
trading partners, though such effects are likely to be modest given the relatively small size of the
Swiss economy (only 0.5 percent of global GDP on a PPP basis). Any positive effects on
aggregate demand in trading partners may also be at least partially mitigated by higher interest
rates in these countries due to lessened SNB intervention to defend the floor.
B. External Assessment
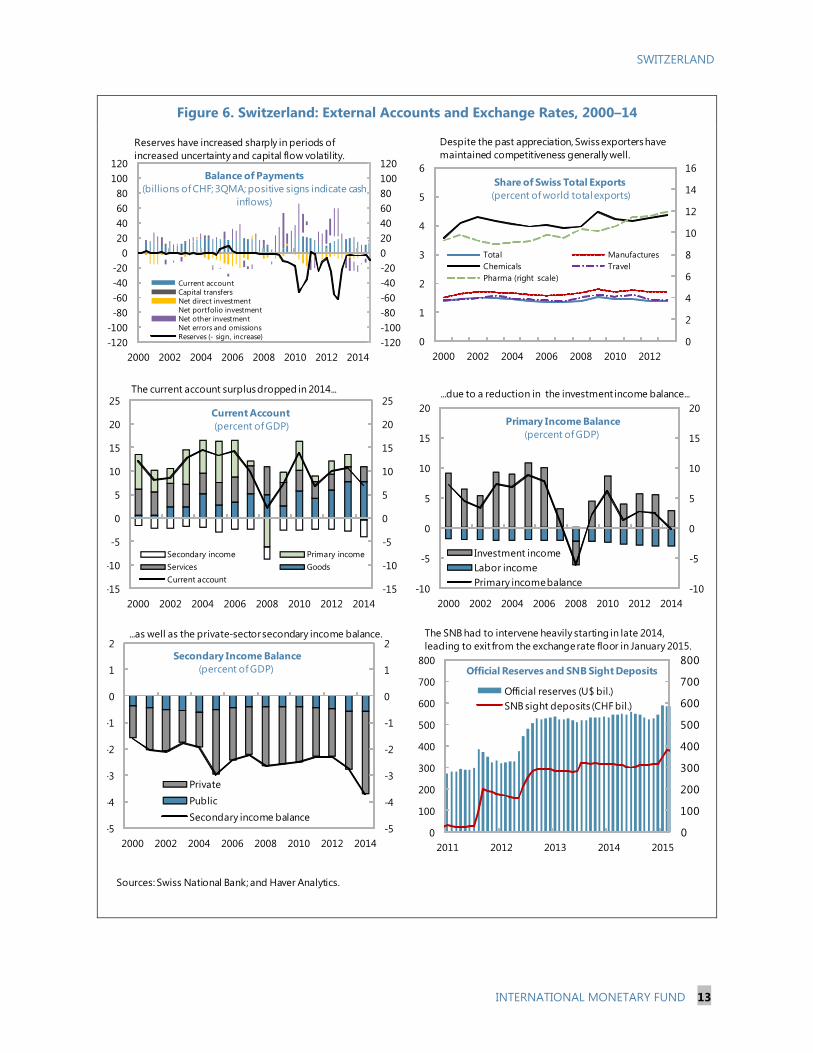
8. Switzerland has long run high current account surpluses. Over the last 15 years,
Switzerland’s current account surplus has averaged around 10 percent of GDP (Table 2 and Figure 6).
However, these surpluses are in some ways misleadingly high because they are driven by non-
traditional flows, such as merchanting activities, commodity trading, financial and insurance services,
and net FDI earnings (Annex 1), that are highly affected by the operations of large multinationals,
financial firms, and wealthy foreigners for whom Switzerland is a desirable destination to centralize
income and assets—reflecting Switzerland’s economic stability and tax competitiveness, among
other factors—but whose savings may not be fundamentally Swiss. For example, Swiss multinational

SWITZERLAND
12 INTERNATIONAL MONETARY FUND
firms are often partly owned by foreigners through portfolio shares. Thus, a part of these companies’
retained earnings really belong to foreign shareholders, generating an upward statistical bias to the
current account of about 3 percent of GDP. Similarly, Switzerland, like other low-tax economies that
host large multinational corporations and their affiliates, is susceptible to attempts by those firms to
minimize their taxes by booking profits in the country, thereby inflating net exports and net
investment income, though such effects are difficult to quantify.
9. Staff views Switzerland’s external position as having been broadly in line with
fundamentals in 2014, though this assessment is subject to high uncertainty.
The External Balance Assessment’s (EBA) current account regression methodology suggests a
current account norm for Switzerland of about 6¾ percent of GDP, reflecting Switzerland’s
financial center structure, demographics, and high per capita income. This norm is slightly below
preliminary estimates of Switzerland’s cyclically-adjusted current account surplus in 2014
(7½ percent of GDP), implying a slightly strong current account and slight undervaluation of the
exchange rate.
However, the EBA methodology does not
fully take into account the special factors and
anomalies in Switzerland’s current account
statistics discussed above. In addition,
estimates of REER overvaluation in 2014
based on EBA methodologies (text table)
suggest a moderate degree of overvaluation,
not undervaluation. The lack of a trend in Switzerland’s net international investment position
(NIIP) to GDP ratio over the last 10 years (Table 2) also suggests that Switzerland’s large current
account surpluses do not result in explosive dynamics for the NIIP, whose large size is partly
explained by the volatility of capital flows.2
Adjusting for these considerations, staff assesses a current account gap for 2014 centered close
to zero. However, the uncertainty band is wide, with the estimated gap ranging
from -3½ percent of GDP to 2½ percent of GDP, reflecting the significant uncertainty
introduced by the various idiosyncrasies of Switzerland’s external statistics (Annex 1). Similarly,
staff assesses the franc to have been broadly in line with fundamentals in 2014, with this
assessment also subject to significant uncertainty.
2 The increase in Switzerland’s NIIP is less than its current account surplus in part because of the statistical bias noted
in paragraph 8. In particular, the retained earnings of Swiss multinational corporations boost Switzerland’s current
account, but not its NIIP because the foreign portfolio investment (FPI) claims of non-Swiss shareholders on the firm
rise in value to reflect the retained earnings.
Model Overvaluation
(percent)
Index 11.2
Level 12.6
Source: Staff estimates.
Switzerland: EBA REER Analysis, 2014
SWITZERLAND
INTERNATIONAL MONETARY FUND 13
Figure 6. Switzerland: External Accounts and Exchange Rates, 2000–14
Sources: Swiss National Bank; and Haver Analytics.
-15
-10
-5
0
5
10
15
20
25
-15
-10
-5
0
5
10
15
20
25
2000 2002 2004 2006 2008 2010 2012 2014
Secondary income Primary income
Services Goods
Current account
Current Account
(percent of GDP)
The current account surplus dropped in 2014...
-10
-5
0
5
10
15
20
-10
-5
0
5
10
15
20
2000 2002 2004 2006 2008 2010 2012 2014
Investment income
Labor income
Primary income balance
Primary Income Balance
(percent of GDP)
...due to a reduction in the investment income balance...
-5
-4
-3
-2
-1
0
1
2
-5
-4
-3
-2
-1
0
1
2
2000 2002 2004 2006 2008 2010 2012 2014
Private
Public
Secondary income balance
Secondary Income Balance
(percent of GDP)
...as well as the private-sector secondary income balance.
0
100
200
300
400
500
600
700
800
0
100
200
300
400
500
600
700
800
2011 2012 2013 2014 2015
Official reserves (U$ bil.)
SNB sight deposits (CHF bil.)
Official Reserves and SNB Sight Deposits
The SNB had to intervene heavily starting in late 2014,
leading to exit from the exchange rate floor in January 2015.
0
2
4
6
8
10
12
14
16
0
1
2
3
4
5
6
2000 2002 2004 2006 2008 2010 2012
Total Manufactures
Chemicals Travel
Pharma (right scale)
Despite the past appreciation, Swiss exporters have
maintained competitiveness generally well.
Share of Swiss Total Exports
(percent of world total exports)
-120
-100
-80
-60
-40
-20
0
20
40
60
80
100
120
-120
-100
-80
-60
-40
-20
0
20
40
60
80
100
120
2000 2002 2004 2006 2008 2010 2012 2014
Current account
Capital transfers
Net direct investment
Net portfolio investment
Net other investment
Net errors and omissions
Reserves (- sign, increase)
Balance of Payments
(billions of CHF; 3QMA; positive signs indicate cash
inflows)
Reserves have increased sharply in periods of
increased uncertainty and capital flow volatility.

SWITZERLAND
14 INTERNATIONAL MONETARY FUND
60
70
80
90
100
110
120
130
140
150
160
60
70
80
90
100
110
120
130
140
150
160
2000 2001 2003 2004 2006 2007 2009 2011 2012 2014
Euro Area Germany Switzerland USA
Real Effective Exchange Rates--Unit Labor Cost Basis
(January 2010=100)
Sources IMF International Financial Statistics.
10. The appreciation in early 2015 is
likely to weaken the external position and
to have left the franc overvalued. As of
April 2015, the REER has appreciated by
about 10 percent relative to its average 2014
value. This appreciation is likely to reduce net
exports due to lessened competiveness and
has likely left the franc overvalued. This
overvaluation partly reflects a policy gap of
insufficiently easy monetary policy—simple
Taylor rules suggest an optimal policy rate
well below current levels—which in turn
reflects various operational challenges associated with unconventional monetary policy (see
monetary policy discussion in the next main section).
C. Outlook and Risks
11. The appreciated franc will weigh on growth during 2015–16, but the economy is
expected to recover over the medium term. Staff and consensus forecasts expect real GDP
growth to slow to around ¾ percent and 1¼ percent in 2015 and 2016, respectively, mainly due to
weaker net exports (Table 1). Unemployment is expected to rise only modestly (peaking at
3½ percent in 2015), as widespread use of short-time working arrangements in Switzerland lessens
the adverse impact of weaker demand on unemployment. The output gap, almost closed at end-
2014, is projected to widen in 2015. Over the medium term, this gap is expected to close and growth
is expected to rise gradually as the economy adjusts to the shock and as increasing divergence
between Switzerland’s monetary policy stance and that of some other major advanced economies
(due to a gradual increase in policy rates in the latter) helps ease appreciation pressure on the franc,
supporting recovery of external demand.
12. Inflation is projected to trough in late 2015 before becoming slightly positive over the
medium term.
Headline inflation is projected to fall near -1½ percent by late 2015, as the gradual pass-through
from franc appreciation and lower commodity prices reaches peak effects. As these one-off
effects dissipate, inflation is projected to gradually rise back into positive territory by early 2017.
Assessing where exactly inflation will stabilize in the medium term is difficult, in part due to the
lack of market-based measures of inflation expectations. However, if one assumes that real
yields are similar to those in other safe havens (Germany, UK), then Switzerland’s nominal
government bond yields—which have recently set world-record lows (Figure 4)—imply that
markets expect inflation to be roughly 1 percent 3–4 years from now.

SWITZERLAND
INTERNATIONAL MONETARY FUND 15
Similarly, an analysis of the recent
relationship between core inflation and
the output gap shows that the Phillips
curve crosses the vertical axis at around
½ percent, implying that steady-state
inflation expectations are anchored
around that level.
Taking both considerations into account
and assuming unchanged monetary
policy, staff project medium-term inflation
in the range of ½–1 percent (Table 1), an
outcome consistent with the SNB’s definition of price stability of “less than 2 percent” inflation.
13. However, this central scenario is subject to important risks (see Annex 2 for further
discussion of key risks).
Risks related to low inflation. One key risk is that operating in an environment of very low
inflation may prove more challenging than assumed in the central scenario. In particular, low
levels of inflation may make it difficult for monetary policy to reduce the real interest rate as
needed to ensure full employment, given constraints on further significant reductions in nominal
interest rates (i.e., “a liquidity trap”). Moreover, this risk may be higher than in previous periods
due to the global drop in equilibrium real interest rates over the last decade. Such difficulties
arising from low inflation may become especially acute if various risks to external demand (see
below and Annex 1) are realized. Low equilibrium rates of inflation also imply low equilibrium
nominal interest rates, posing challenges for some sectors such as defined-benefit pension plans
and life insurers, and may make relative wage and price adjustments more difficult due to
resistance to nominal wage and price cuts.
Uncertainty about EU relations and immigration. Last year’s vote to move away from the free
movement of labor with the EU has created substantial uncertainty about medium-term growth
prospects, as such a move may reduce labor force growth, restrict firms’ ability to recruit
personnel, increase the fiscal challenges of population aging, and reduce Swiss firms’ access to
EU markets if existing cooperation agreements with the EU are revised. This uncertainty may also
weigh on investment (see later section for further discussion of this issue).
Global economic environment. This risk goes in both directions. On one hand, downside
surprises to global growth and further bouts of market risk aversion (e.g., due to a protracted
period of turmoil in Greece or geopolitical events) could fuel franc appreciation and deflationary
pressures and reduce growth. On the other hand, growth in Europe and other advanced
economies could also surprise on the upside (e.g., due to a larger-than-expected boost from
lower oil prices), supporting a more competitive franc, faster Swiss growth, and a quicker exit
from deflation.
y = 0.18x + 0.45
R² = 0.23
-1.5
-1.0
-0.5
0.0
0.5
1.0
1.5
2.0
-1.5
-1.0
-0.5
0.0
0.5
1.0
1.5
2.0
-4 -3 -2 -1 0 1 2 3 4
Switzerland: Core Inflation and Output Gap
(Correlations between CPI(t) and output gap(t-1), 2000–14)
Source: IMF staff calculations.
Inflati
on (y
ear o
n y
ear p
erc
ent)
Output Gap (percent of potential)

SWITZERLAND
16 INTERNATIONAL MONETARY FUND
Financial Sector. The banking sector is highly globally interconnected; the largest banks (UBS
and Credit Suisse) remain highly leveraged in comparison with most other global systemically
important banks and still have large investment banking operations. Consequently, they could
be a source of outward spillovers and remain vulnerable to inward spillovers from instability in
global financial markets.
Housing Market. Though it has cooled recently, Switzerland’s house prices have had a rapid
run-up over the last decade, and mortgage debt is high as percent of GDP (see later section for
more details). The economy could thus be vulnerable to a sharp decline in house prices, which
would weaken household balance sheets and impede growth. Such a decline would also
adversely affect the banking and insurance industries, with their large respective exposures to
the mortgage market and real estate.
Authorities’ views
14. The authorities broadly agreed with staff’s assessment of macroeconomic
developments and risks. They agreed that the franc was now overvalued. They also agreed that the
sharp appreciation of the franc has depressed growth prospects in the short run and presents a
challenge for the export sector, especially in those industries where the market power of Swiss firms
is limited. On the low-inflation environment, they noted that domestic inflation was still positive and
viewed the current deflation as a transitory phenomenon, driven by lower energy prices and
currency appreciation, and projected inflation to move back into positive territory over the medium
term. On spillovers to Eastern Europe from the franc’s appreciation, the SNB noted that the
authorities in Eastern Europe had been aware of risks related to franc-denominated mortgages for
some time.
MACROECONOMIC POLICIES: SUPPORTING
SUSTAINABLE GROWTH
Further monetary easing via purchases of (mainly foreign) assets and strong communication of the
SNB’s objective to boost inflation over the medium term could help lessen the near-term growth
slowdown, reduce risks of entrenching low inflation, and limit franc overvaluation. Scope for fiscal
policy to support aggregate demand is limited by Switzerland’s fiscal rule and the small, open nature
of its economy. That said, fiscal automatic stabilizers should be allowed to operate freely, as allowed
under the rule, and the rule’s escape clause should be triggered in the event of a severe downturn to
allow discretionary fiscal stimulus. Pension and corporate tax reforms are key priorities for fiscal
structural reforms.

SWITZERLAND
INTERNATIONAL MONETARY FUND 17
A. Monetary and Exchange Rate Policies
15. Further monetary easing would support
economic adjustment and reduce risks. The
output gap is expected to widen in the near term,
and the negative rates for both core inflation and
10-year bond yields suggest significant risks of a
protracted period of low inflation. In this context,
monetary easing would helpfully limit the growth
slowdown, reduce risks of inflation expectations
becoming anchored at low levels, and lessen
exchange rate overvaluation.
16. However, with the policy rate already at
-0.75 percent, room for further conventional
easing appears limited. The policy rate should
remain at its current negative level for now, as this
helps ease franc appreciation pressures and
encourages domestic consumption and investment.
However, additional deep policy rate cuts could risk
adverse nonlinear effects, such as increased cash
hoarding. This in turn could reduce financial
intermediation and weaken monetary transmission
mechanisms. In this regard, the SNB has
appropriately intensified the monitoring of
depositors’ behavior. So far there are few signs of
significant cash hoarding.
17. Monetary easing could instead be achieved via a pre-announced program of asset
purchases.
Purchases of foreign assets could help directly address deflationary pressures arising from the
overvalued exchange rate. The amount of foreign-asset purchases could be preannounced (e.g.,
X billion per month, to be continued until further notice) and adjusted as necessary to achieve
inflation objectives. Compared to the previous approach of setting the exchange rate floor,
fixing the quantity of foreign-asset purchases would not unduly suppress exchange rate
volatility, thereby reducing the risk of a “one-way bet” in the market. Fixing the quantity also
avoids an unlimited commitment of the SNB’s balance sheet. Compared to the current approach
of ad hoc interventions, pre-announced interventions might help signal monetary dovishness,
thereby raising inflation expectations, spurring franc depreciation, and further supporting higher
inflation.
Purchases of domestic assets could also be considered. However, the scope for such purchases
is more limited, given that domestic yields are already very low (yields are negative out to 12-
-0.4
-0.2
0.0
0.2
0.4
0.6
0.8
1.0
1.2
-0.4
-0.2
0.0
0.2
0.4
0.6
0.8
1.0
1.2
Jan-14 Apr-14 Jul-14 Oct-14 Jan-15 Apr-15
Core inflation (y/y)
10-year gov. bond yield
Switzerland: Core Inflation and Bond Yields
(percent)
Source: Haver Analytics.
-5
0
5
10
15
20
25
30
-5
0
5
10
15
20
25
30
2005 2006 2007 2009 2010 2011 2013 2014
Switzerland: Currency in Circulation
(Year-on-year growth; percent)
Sources: Haver Analytics; IFS; and Swiss National Bank.

SWITZERLAND
18 INTERNATIONAL MONETARY FUND
year maturities as of late April) and given the limited supply of domestic assets. In particular, the
outstanding stock of federal government bonds is only 12 percent of GDP.
18. The SNB could also further enhance communication and the articulation of its
monetary policy framework. The SNB’s decision to abandon the floor has created some
uncertainty about its monetary policy framework going forward. The SNB could therefore helpfully
elaborate on its medium-term monetary policy objectives. More specifically, it may be useful to
indicate a preference for moving inflation back near the upper end of the target range (i.e., closer to
2 percent) over the medium term, given the benefits to re-anchoring inflation expectations at higher
levels to avoid the complications of operating monetary policy at low levels of inflation.
19. The SNB’s capital buffers should be kept in line with risks. The SNB’s balance sheet is
likely to remain large for a prolonged period, with large fluctuations in mark-to-market profits
(Table 3). Although a central bank’s main objective is to achieve price stability, not maximize profits,
the SNB could nonetheless encounter reputational problems if it incurred a large capital deficiency.
To reduce related risks to the SNB’s operations and independence, the SNB should continue to
prioritize provisioning over transfers to its distribution reserve and maintain a prudent profit
distribution policy.
Authorities’ views
20. The SNB agreed with much of staff’s analysis, but preferred to see how the outlook
develops before taking further monetary policy action. The SNB agreed that monetary
conditions were too tight, the franc was overvalued, and preannounced purchases of foreign assets
was one option for further monetary easing. However, the SNB wanted to allow more time to see
how the outlook develops in both Switzerland and elsewhere in Europe before taking further
monetary policy action. On the communication strategy, the SNB did not see a strong case for
announcing a preference for moving inflation back near the upper end of the target range (i.e.,
closer to 2 percent) over the medium term. The SNB considers inflation in the range of 0–1 percent
to be consistent with its monetary policy framework and, therefore, does not share staff’s risk
assessment.
B. Fiscal Policy
21. Switzerland’s fiscal rule has helped it maintain low deficits and debt. In place since
2003, Switzerland’s “debt brake” rule requires that the federal government budget be in structural
balance ex ante and that any ex post overruns be made up by running structural surpluses in
subsequent years. Parliament can temporarily suspend the debt-brake rule in cases of “exceptional
financial requirements” (e.g., war, severe recession) by a simple majority vote in both houses, but
this option has rarely been invoked. The federal rule and similar rules for cantons have helped keep
the budget in balance and helped limit general government gross debt to 46 percent of GDP at
end-2014 (Tables 4–5, Annex 3).
22. The mission recommended continued compliance with the rule in the central scenario.
Suspending the rule in response to the mild growth slowdown envisaged in the central scenario
would set a precedent that could undermine the rule’s ability to restrict fiscal irresponsibility over

SWITZERLAND
INTERNATIONAL MONETARY FUND 19
the longer run. In addition, exchange rate overvaluation suggests that relying more heavily on
monetary, rather than fiscal, easing to boost demand should lead to better external balance. Fiscal
multipliers may also be small in Switzerland given its openness.
23. However, fiscal policy should do what it can to support demand. In the central scenario,
fiscal automatic stabilizers should be allowed to operate fully, as allowed by the rule. The authorities
should also avoid budgeting overperformance against the rule in 2016, as this would add an
unnecessary contractionary impulse. If a deep or prolonged recession materializes, discretionary
fiscal easing should be employed to support growth and inflation and avoid overburdening
monetary policy. Such easing could be achieved by temporarily suspending the rule under
established procedures.
24. Pension reforms will help address longer-term fiscal challenges. Population aging is
projected to substantially increase fiscal costs related to pensions over the longer run. To help
address this challenge, the government has submitted a comprehensive reform proposal to
parliament. The reform includes measures to equalize retirement ages for men and women and to
reduce the rate at which pension savings are converted into pension annuities by reducing this
conversion rate from 6.8 to 6.0 percent per annum. In addition, the government has proposed to
increase VAT rates by 2 percentage points by 2029 to ensure more stable funding for the pension
system. Such reforms will help ensure the sustainability of the social safety net and its continued
availability for future generations. In relation to the second pillar, staff recommended reducing the
minimum guaranteed return on invested assets, as such returns have become more difficult to
achieve in the low interest-rate environment (Box 1).
25. Switzerland has prepared a comprehensive corporate tax reform (Corporate Tax
Reform III). Switzerland has faced international pressure in recent years to reduce the favorable tax
treatment provided to multinational corporations in many cantons. In this context, the authorities
have developed a corporate tax reform, expected to be submitted to parliament this summer and
implemented by 2019, that intends to reform special tax regimes that give more favorable treatment
to income from foreign operations than income from domestic operations. As this will in some cases
result in a net revenue loss, the federal government has proposed to provide fiscal support to
cantons to assist the reform—the current estimate of the needed transfer is approximately
¼ percent of GDP. Staff welcomed efforts to reduce distortions in the corporate tax code and
encouraged the authorities to finalize the reform in ways that are consistent with ongoing
international initiatives to counter base erosion and profit shifting.
Authorities’ views
26. The authorities emphasized the value of the fiscal rule and the importance of pension
and corporate taxation reforms. The authorities agreed that automatic fiscal stabilizers should
operate freely and saw no need for discretionary fiscal stimulus, including because the expected
growth slowdown was expected to be limited. The authorities also indicated that they did not expect
budgetary overperformance to occur either this year or next. They instead emphasized the
importance of structural fiscal reforms, especially those related to pensions and corporate taxation.
On the minimum guaranteed rate of return, the authorities noted that it is reviewed each year on a
regular schedule and the next review will be undertaken in the autumn of 2015.
SWITZERLAND
20 INTERNATIONAL MONETARY FUND
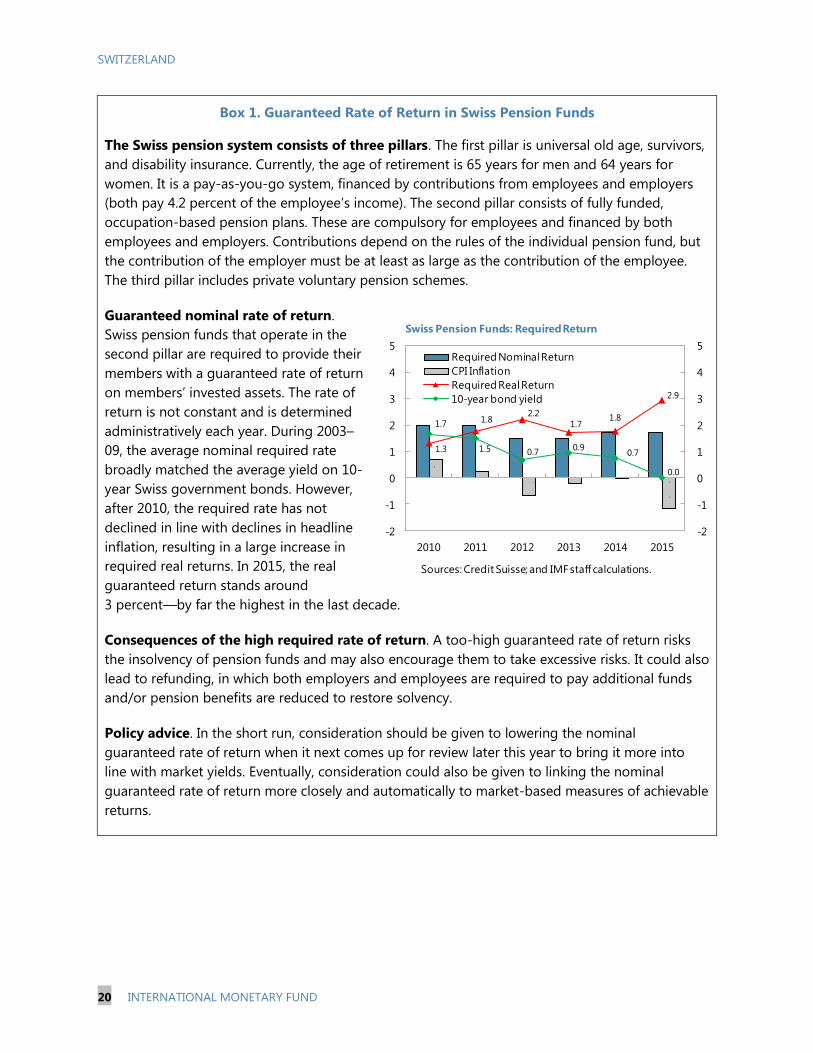
Box 1. Guaranteed Rate of Return in Swiss Pension Funds
The Swiss pension system consists of three pillars. The first pillar is universal old age, survivors,
and disability insurance. Currently, the age of retirement is 65 years for men and 64 years for
women. It is a pay-as-you-go system, financed by contributions from employees and employers
(both pay 4.2 percent of the employee’s income). The second pillar consists of fully funded,
occupation-based pension plans. These are compulsory for employees and financed by both
employees and employers. Contributions depend on the rules of the individual pension fund, but
the contribution of the employer must be at least as large as the contribution of the employee.
The third pillar includes private voluntary pension schemes.
Guaranteed nominal rate of return.
Swiss pension funds that operate in the
second pillar are required to provide their
members with a guaranteed rate of return
on members’ invested assets. The rate of
return is not constant and is determined
administratively each year. During 2003–
09, the average nominal required rate
broadly matched the average yield on 10-
year Swiss government bonds. However,
after 2010, the required rate has not
declined in line with declines in headline
inflation, resulting in a large increase in
required real returns. In 2015, the real
guaranteed return stands around
3 percent—by far the highest in the last decade.
Consequences of the high required rate of return. A too-high guaranteed rate of return risks
the insolvency of pension funds and may also encourage them to take excessive risks. It could also
lead to refunding, in which both employers and employees are required to pay additional funds
and/or pension benefits are reduced to restore solvency.
Policy advice. In the short run, consideration should be given to lowering the nominal
guaranteed rate of return when it next comes up for review later this year to bring it more into
line with market yields. Eventually, consideration could also be given to linking the nominal
guaranteed rate of return more closely and automatically to market-based measures of achievable
returns.
1.3
1.82.2
1.71.8
2.9
1.7
1.5 0.70.9
0.7
0.0
-2
-1
0
1
2
3
4
5
-2
-1
0
1
2
3
4
5
2010 2011 2012 2013 2014 2015
Required Nominal Return
CPI Inflation
Required Real Return
10-year bond yield
Sources: Credit Suisse; and IMF staff calculations.
Swiss Pension Funds: Required Return

SWITZERLAND
INTERNATIONAL MONETARY FUND 21
0
1
2
3
4
5
6
0
1
2
3
4
5
6
CHE Europe US
Sources: Bank Reports; and IMF staff calculations.
G-SIB Basel III Tier 1 Leverage Ratios, 2014Q4
(Median, Percent)
COMPLETING FINANCIAL SECTOR REFORM
The financial sector reform agenda, as laid out in last year’s FSAP, should also be completed. Priorities
include raising the leverage ratios of the two large international banks to safer levels, increasing public
disclosure of information on risk weights, reforming FINMA’s use of external auditors, overhauling
deposit insurance, and ensuring that risks related to housing and mortgage markets are contained.
A. The Big Banks
27. Switzerland’s two global systemically important banks (G-SIBs) have continued their
strategic adjustments, and their balance sheets appear strong by many metrics. Both banks
have met the 10 percent minimum CET1 capital ratio required under Swiss Too-Big-To-Fail
legislation well in advance of the 2019 deadline and are in line with or comfortably above the
average ratio for other G-SIBs. Both banks are above the Liquidity Coverage Ratio minimum of
100 percent, effective in 2015 in Switzerland, and had, based on a not-yet-final methodology,
estimated Net Stable Funding Ratios above 100 percent as of spring 2014. The NSFR is not yet part
of Swiss regulation but planned to be introduced in 2016. Both banks have remained profitable in
2014, though substantial provisions for litigation and regulatory issues (e.g., those related to
foreign-exchange market manipulation, U.S. and other cross-border tax matters, and legacy issues
related to the sale of residential mortgage-backed securities and U.S. mortgage crisis fines and
penalties) weighed on the results.
28. However, there are still important areas for further improvement, as identified by last
year’s FSAP (Annex 4).
These banks’ leverage ratios are above current regulatory minima. However, their ratios remain
low by international standards (Table 6, Figure
5, and text chart). Given the risks to the Swiss
economy posed by the large size of these
banks, the authorities should tighten
minimum leverage ratio requirements for G-
SIBs to ensure that they are more ambitious
than international minima and that the quality
of capital is aligned with or more demanding
than international standards.3 In addition, the
authorities should encourage the large banks
to further strengthen their capitalization,
including multi-year plans to increase their
leverage ratios, and promote conservative
dividend policies to bolster the capital base.4
3 The current Swiss Too-Big-To-Fail framework was to a large extent formulated before many of details of Basel III
had been worked out; consequently, some capital definitions are not aligned.
4 Dividend plans compared to earnings per share are fairly high for the Swiss G-SIBs compared to other G-SIBs,
although part of the dividends will be scrip dividends (dividends paid in shares, which does not deplete capital).

SWITZERLAND
22 INTERNATIONAL MONETARY FUND
The authorities should also vigilantly challenge risk weights from internal ratings-based models
and increase banks’ disclosure requirements regarding capital-weights to enhance transparency
and bolster understanding of, and credibility in, banks’ soundness and business strategies.
Continued action is needed to improve the resolvability of the G-SIBs through strengthened
cross-border coordination and further restructuring. Given the global reach of these banks,
reaching agreements with partner supervisors is critical. While both banks have made structural
changes, including by organizing through holding companies, and have updated their global
recovery and resolution plans in 2014 to improve their resolvability, this process needs to
continue to further improve resolvability.
The authorities must also continue to proactively address operational risks by intense
supervision of risk management practices and provisioning, to avoid and mitigate effects from
negative surprises related to, for example, trading activities and investigations of tax evasion or
money laundering.
29. Encouragingly, the authorities are moving to address these concerns.
One important element is the follow-up to recommendations related to Too-Big-To-Fail (TBTF)
in the December 2014 report of the “Group of Experts on the Further Development of the
Financial Market Strategy,” or the “Brunetti Report”.5 Recommendations included recalibration of
capital requirements and adjustments to capital quality, and the Federal Council has instructed
the Federal Department of Finance (FDF) to formulate concrete legislative proposals in this area.
The details are yet to be worked out, but it is generally expected that that requirements on
capital ratios, including leverage, will be set high, and that capital quality will be adjusted to be
at least as stringent as international standards.
The authorities are adopting international standards related to increased disclosure regarding
risk weights and are involved in international initiatives to strengthen standards further. This is
welcome, but in the possible absence of significant progress internationally, the Swiss authorities
should stand ready to take the lead and heighten disclosure requirements.
Regarding resolution, the authorities are cooperating with foreign supervisors and expect to
conclude cooperation agreements on crisis management with the Crisis Management Group
members for the Swiss G-SIBs. This would be an important step, but the details remain to be
seen and assessed.
5 “Group of Experts on the Further Development of the Financial Market Strategy—Final Report”
https://www.news.admin.ch/message/index.html?lang=en&msg-id=55545

SWITZERLAND
INTERNATIONAL MONETARY FUND 23
Authorities’ views
30. The authorities generally agreed with staff’s assessment and recommendations, but
stressed caveats on several issues. Support appeared broad among the authorities for raising the
leverage ratio to more ambitious levels and for increasing public disclosure requirements for risk
weights in internal risk models. FINMA also emphasized that it is closely monitoring the calculation
of risk weights and has taken action when shortcomings have been observed, including by
introducing multipliers and a moratorium on capital-reducing model changes. FINMA agreed with
the need for banks to continue building capital, but cautioned that an overly conservative dividend
policy might hinder banks’ ability to attract equity capital. On resolvability, the authorities fully
recognize that the work to make the G-SIBs resolvable is not finished, but stressed that progress in
recent years has been substantial. On conduct risks, FINMA explained that related supervision and
enforcement efforts are being stepped up, which in combination with large investments in these
banks to control these risks could help reduce adverse events going forward.
B. Broader FSAP Recommendations
31. Switzerland continues to take measures to strengthen its financial sector more
generally, including with respect to key FSAP update recommendations (Annex 4). Such efforts
are important not only for Switzerland, but also to promote global financial stability, given the
prominent role of the Swiss banking and insurance sectors. Still, the FSAP update was concluded
only a year ago, and many of the reforms are work in progress. Thus, continued efforts are needed
to further strengthen the post-crisis transition to a safer financial sector.
32. The authorities are therefore encouraged to complete the financial sector reform
agenda, as laid out in last year’s FSAP update. The TBTF policies (discussed above) and policies to
contain the potential build-up of risks in the domestic real estate and mortgage markets (discussed
below) are important policy areas in this regard. Other priority measures going forward include the
following.
Continue to refine FINMA’s use of external auditors. FINMA has taken regulatory measures to
strengthen its guidance to external auditors. This is encouraging, and implementation must be
forceful to validate the work of the auditors and ensure supervisory harmonization across
entities. FINMA also reports that it has intensified its direct supervisory activities, including on-
site inspections, and resources will be redirected to further strengthen these supervisory
activities. However, more resources for FINMA may still be needed, as pointed out by the FSAP
and for which there are no plans. The use of external auditors could also be strengthened by
paying auditors from a FINMA-managed, bank-financed fund rather than by the bank that is
being audited to avoid conflicts of interest, and by periodically rotating auditing firms.
Overhaul deposit insurance. The governance of the deposit insurance scheme should be
reformed to make it more independent by substantially limiting the influence of the banking
industry in its board. Dedicated ex ante funding with a back-up line of support should also be
built up to strengthen access to funds and confidence in case of bank failures. The Brunetti

SWITZERLAND
24 INTERNATIONAL MONETARY FUND
Report has encouraging recommendations in this direction, and the authorities should take
steps to reform the scheme accordingly. In addition, deposit insurance funds should be made
available to finance resolution measures on a least-cost basis.
Authorities’ views
33. The authorities emphasized that they are taking many steps for financial sector reform
and that many of the FSAP update recommendations would be implemented. Regarding
banking supervision, FINMA explained that they are working hard to further strengthen the
management of the use of external auditors. They do not see a need for a substantial increase in the
overall resource envelope unless new statutory tasks are assigned to FINMA. Rather, further
reallocation within FINMA would be sufficient. FINMA agreed that reforming how external auditors
are being paid to reduce conflicts of interest could be helpful, but was more skeptical about the
benefit from mandatory rotation of auditors, as it is an oligopoly market with few firms available. On
deposit insurance, the Federal Council has taken note of the Brunetti Report and will decide on how
to proceed with the expert group's recommendations at a later date.
C. Housing Market
34. The Swiss authorities have
undertaken various prudential measures
over the last three years aimed at reducing
housing-related risks. Swiss household debt
(mainly mortgages) is high by international
standards, and mortgage debt has been rising
steadily since 2008, in tandem with a buoyant
housing market (Figure 7). To reduce related
financial stability risks, the authorities have
undertaken a number of prudential measures,
including strengthened bank “self-regulation”
standards approved by FINMA, effective
September 2014 (Box 2).
35. These measures appear to have had
some effect, as housing and mortgage markets
show some signs of cooling. The growth rate of
residential real estate prices has eased both for
owner-occupied apartments and single family
houses, including in areas, such as Lake Geneva,
that previously saw rapid house price growth
(Figure 7). Mortgage growth has also decelerated,
although this effect is less pronounced (text
chart). Similarly, price-to-rent and price-to-income
0
50
100
150
200
250
300
350
0
50
100
150
200
250
300
350
ITA
DEU
AU
TBEL
FRA
GR
CU
SA
FIN
JPN
ESP
PO
RG
BR
CA
NN
ZL
SW
EA
US
CH
EIR
LN
OR
NLD
DN
KSource: Haver Analytics.
Household Debt
(Percent of gross disposable income; 2014 or latest )
-6
-4
-2
0
2
4
6
8
10
12
-6
-4
-2
0
2
4
6
8
10
12
2000 2002 2004 2006 2008 2010 2012 2014
Owner-occupied apartment prices
Single-family home prices
Mortgages
Sources: Haver Analytics; and Swiss National Bank.
Switzerland: House Price and Mortgage Growth
(Real growth rates, y/y percent change)

SWITZERLAND
INTERNATIONAL MONETARY FUND 25
ratios have started to stabilize (Figure 7). The percent of new mortgages for owner-occupied real
estate with loan-to-value ratios exceeding 80 percent have also been on a declining trend. As the
authorities have taken a range of measures to address the risk of a build-up of imbalances in the
housing and mortgage markets, it is difficult to clearly disentangle which have been the most
effective. However, the consensus view among the authorities and banks was that the required
down payment from the borrower's own funds (not funded by using pension savings) has perhaps
been the most important measure.
Box 2. Measures to Reduce Housing- and Mortgage-Related Risks
Revised minimum requirements for mortgages, drawn up by the Swiss Bankers Association and
approved by FINMA, effective mid-2012:
Mortgages must entail a down payment of at least 10 percent of the lending value of the property
from the borrower's own funds, which may not be obtained by pledging or early withdrawal of
Pillar 2 pension assets.
Mortgages must be paid down to two-thirds of the lending value of the mortgage within a
maximum of 20 years.
FINMA tightened rules for risk-weighting new and renewed mortgages for banks applying an
internal ratings-based approach, effective 2013.
Federal Council measures, effective 2013:
Mortgages that do not comply with the new minimum standards are allowed, but subject to a risk
weight of 100 percent.
Mortgages exceeding 80 percent of the property value will have a risk weight of 100 percent
applied to the part of the loan exceeding the 80 percent threshold.
On the SNB’s proposal, the Federal Council activated the countercyclical capital buffer (CCB). The
CCB applies to risk-weighted positions associated to residential property mortgages in Switzerland.
The CCB was activated to a level of 1 percent (to be met in the form of CET1) capital by end–
September 2013 and raised to 2 percent in January 2014, to be fulfilled by end-June 2014.
Amended minimum standards for mortgage financing issued by the Swiss Bankers Association
and approved by FINMA, effective September 1, 2014:
The amortization period for repayment down to two-thirds of the lending value of the mortgage
was shortened from 20 years to 15 years. Moreover, the loan must now be repaid in regular
tranches of an equal amount from the start.
Stricter use of second incomes when assessing financial sustainability.
For future lending, real estate values must now be based on the market value or the purchase
price, whichever is lower.

SWITZERLAND
26 INTERNATIONAL MONETARY FUND
Sources: State Secretariat for Economic Affairs;Swiss National Bank; IMF Global House Price Index; and Haver
Analytics.
0
50
100
150
200
250
0
50
100
150
200
250
1985 1990 1995 2000 2005 2010
Rental apartments
Single family homes
Business and office
Owner occupied apartments
Real House Price Indices
(1970=100)
Real house prices have risen steadily over the last decade...
100
105
110
115
120
125
130
135
140
145
100
105
110
115
120
125
130
135
140
145
2000 2002 2004 2006 2008 2010 2012 2014
Mortgages
(percent of GDP)
Nonetheless, households' mortgagedebt continues
to rise as a percent of GDP...
60
70
80
90
100
110
120
130
140
60
70
80
90
100
110
120
130
140
1985 1990 1995 2000 2005 2010 2015
Single family home
Owner occupied apartments
Price-to-Income Ratio
(Q4 1992=100)
...as are price-to-income ratios.
60
70
80
90
100
110
120
130
140
150
60
70
80
90
100
110
120
130
140
150
1985 1990 1995 2000 2005 2010 2015
Single family home
Owner occupied apartments
Price-to-Rent Ratio
(Q4 1992=100)
However, there are tenative signs that price-to rent
ratios may be stabilizing...
-2
0
2
4
6
8
10
12
-2
0
2
4
6
8
10
12
2000 2003 2006 2009 2012
Other liabilities
Mortgage
Real estate
Other financial assets
Currency and deposits
Net worth
Household Net Worth
(percent GDP)
...though their net worth is 5 times GDP.
90
110
130
150
170
190
210
230
250
270
290
310
90
110
130
150
170
190
210
230
250
270
290
310
2000 2002 2004 2006 2008 2010 2012 2014
Switzerland Zurich area
Eastern Central
Northwestern Berne area
Southern Western
Geneva area
Real House Price by Selected Regions
(2000=100)
...especially in Geneva.
Figure 7. Switzerland: Housing Markets, 1980–2014

SWITZERLAND
INTERNATIONAL MONETARY FUND 27
36. However, the cooling of mortgage-related risks is still tentative and partial. Mortgage
debt is high and still rising as a percent of GDP, and loan-to-income ratios on new mortgages have
not yet declined. It is thus important to continue monitoring housing and mortgage-related risks
closely and to fully enforce existing regulations and minimum standards, especially given recent
interest rate cuts for SNB sight deposits, which could re-ignite mortgage demand. If risks are not
reduced or re-accelerate, tighter and more binding prudential measures, such as explicit limits on
the percent of new mortgages that can exceed a given debt-service-to-income and/or debt-to-
income ratio should be adopted. Likewise, efforts to address concentration and interest-rate risks, as
identified by the SNB in its most recent Financial Stability Report, may need to be stepped up via
Pillar 2 measures, including, if necessary, additional capital charges.
Authorities’ views
37. The authorities believe their measures have had some effect, but are still concerned, as
imbalances are still large and have not fallen substantially. Consequently, they agree that further
policy action may be warranted, in particular to target affordability and the income-producing real
estate sector. However, they also emphasized that the effects of measures are lagged, as can be
seen from the experience in recent years, and it is therefore appropriate to let the measures
announced in mid-2014 work through the system first. The SNB, furthermore, explained that, if
imbalances appear set to increase further, an upward adjustment of the CCB could be proposed.
FINMA also emphasized that they carefully analyze interest rate and concentration risks of banks
and that they in several instances have taken action to reduce risks in individual institutions.
STRUCTURAL ISSUES
38. A referendum in February 2014 obliges the government to set unspecified limits on
immigration from the EU by 2017. Tight limits could hurt Switzerland’s growth potential by
restricting the availability of highly-skilled foreign labor. Limits on immigration are also incompatible
with agreements with the EU, which would have the right to respond by terminating Swiss-EU
bilateral agreements. Such actions would severely constrain Swiss companies’ access to EU markets,
which account for over half of Switzerland’s exports and three-quarters of its imports. A constructive
resolution to this uncertainty would help underpin near-term economic recovery and support long-
term growth.
39. Switzerland continues progress toward implementation of international standards for
AML/CFT and the transparency and exchange of information on tax matters. In December
2014, parliament approved a bill aimed at implementing the 2012 Financial Action Task Force (FATF)
Recommendations. The FATF is now in the process of assessing these measures, and it will be
important for the Swiss authorities to ensure full compliance, particularly with regard to
transparency of legal persons and arrangements, tax crimes, and politically exposed persons. In
January 2015, the Federal Council embarked on consultations on the ratification of the Multilateral
Convention and on the legal framework for the implementation of the reporting standard on
automatic exchange of information. The parliamentary process in this regard is expected to begin in

SWITZERLAND
28 INTERNATIONAL MONETARY FUND
mid-2015, possibly followed by a referendum, with the relevant laws expected to be in place by
2017. Staff welcomes this progress and encourages the authorities to forcefully implement the FATF
and Global Forum standards in order to protect the integrity of Switzerland as an international
financial center.
40. Structural reforms should continue to ensure long-run sustainable growth. OECD and
World Bank Doing Business reports indicate scope for further improvement in areas such as
facilitating full-time labor participation of women (e.g., reducing child care costs and marginal tax
rates on second earners) and improving access and equity in education, both of which could help
boost growth.
Authorities’ views
41. The authorities broadly shared staff’s views on structural issues. The authorities agreed
that uncertainty over the immigration reform and EU relationships would not encourage investor
sentiments. The policy goal is to preserve bilateral agreements with the EU, while building a
sustainable immigration policy that would contribute to balanced growth. The implementation of
OECD and FATF recommendations is underway, and the authorities are committed to launching
automatic exchange of information with partner states starting in 2018. The authorities also agreed
with staff’s view that there remains scope to enhance women’s full-time labor participation.
STAFF APPRAISAL
42. Economic growth in Switzerland is likely to slow in the near term while inflation
becomes more negative. Switzerland’s economy has performed relatively well in the aftermath of
the global financial crisis. However, exchange rate appreciation in early 2015 has likely left the Swiss
franc overvalued and weakened the near-term outlook. In particular, GDP growth is expected to
ease to around ¾ percent in 2015, mainly due to weaker net exports. The strong franc, together
with lower oil prices, is also likely to drive inflation down to well past -1 percent by late 2015.
0
5
10
15
20
25
30
0
5
10
15
20
25
30
1-earner
couple 1/
2-earner
couple
(100-33)
2/
2-earner
couple
(100-67)
3/
1-earner
couple 1/
2-earner
couple
(100-33)
2/
2-earner
couple
(100-67)
3/
Source: OECD Taxing Wages database.
1/ One-earner married couple at 100% of average earnings, 2 children.
2/ Two-earner married couple, one at 100% of average earnings and the other at
33%, 2 children.
3/ Two-earner married couple, one at 100% of average earnings and the other at
67%, 2 children.
Switzerland: Income Tax Rates, 2013
(Percent)
(Average tax rates)
(Marginal tax rates)
0
20
40
60
80
100
120
0
20
40
60
80
100
120
ISL
CH
ES
WE
NLD
NO
RN
ZL
DN
KC
AN
DE
UG
BR
AU
SA
UT
ES
PE
ST
JPN
FIN
PR
TC
ZE
US
AIS
RFR
AS
VN
IRL
LUX
SV
KG
RC
BE
LP
OL
KO
RC
HL
ITA
Participation rate
Share of full-time women employment
Women Labor Participation And Full-time Employment
(Percent)
Source: OECD Labor Force Statistics.

SWITZERLAND
INTERNATIONAL MONETARY FUND 29
43. Over the medium term, the economy is expected to recover gradually, but uncertainty
around this central scenario is wide. As the economy adjusts to the exchange rate appreciation,
growth is projected to rise gradually back to around 2 percent over the medium term while inflation
increases to around 1 percent. However, this scenario is subject to important risks, including risks
related to very low inflation, uncertainty about EU relations and immigration, global and regional
economic developments, the effects of ongoing changes in the international financial regulatory
landscape, and the potential for price reversals in the housing market.
44. Further monetary easing would support adjustment and reduce risks. Easing would help
limit the near-term growth slowdown and lessen exchange rate overvaluation. Boosting inflation
closer to 2 percent over the medium term would also reduce risks associated with operating in a
low-inflation environment.
45. Monetary easing could perhaps be achieved via a program of pre-announced asset
purchases. Such purchases could consist of foreign-currency assets—and perhaps some domestic
assets, though scope for this is more limited—with the pace of purchases adjusted as necessary in
response to developments. In addition, the policy rate should be maintained at its current negative
level for now, as this has been helpful in reducing franc appreciation and deflationary pressures.
Central bank communication should also be geared toward building an understanding of policy
objectives and ensuring that inflation expectations do not become entrenched at low levels. In
particular, it may be useful to indicate a preference for moving inflation back near the upper end of
the target range (i.e., closer to 2 percent) over the medium term. The SNB should also prioritize
provisioning over transfers to its distribution reserve to ensure that its capital remains in line with
risks.
46. Fiscal policy can also support recovery. In the central scenario, automatic stabilizers
should be allowed to operate fully, as allowed under Switzerland’s debt-brake rule, which has served
Switzerland well. Overperformance against the rule should also be avoided, as this would add an
unnecessary contractionary impulse. If the economic slowdown is significantly more severe or
protracted than envisaged, discretionary fiscal stimulus could also be employed by triggering the
rule’s temporary escape clause to help boost growth and inflation and avoid overburdening
monetary policy.
47. Pension reforms will help address longer-term fiscal challenges. Population aging is
projected to substantially increase fiscal costs related to pensions and healthcare over the longer
run. The government’s pension reform proposals will help address this challenge and help ensure
the sustainability of the social safety net and its continued availability for future generations.
48. Continued structural reforms will help support medium-term growth potential. A top
priority in this regard is to achieve a constructive resolution to the uncertainty about EU relations
and immigration. Efforts to reform corporate taxation and implement AML/CFT reforms and
automatic exchange of tax information are welcome and should be pursued in ways that are fully
consistent with international standards, thereby ensuring the integrity of Switzerland as an
international financial center and avoiding adverse effects on growth from potential international

SWITZERLAND
30 INTERNATIONAL MONETARY FUND
countermeasures. Reforms to boost full-time female labor force participation, such as lowering
marginal tax rates on second incomes, could also boost potential growth over the medium term.
49. Continuing the financial sector reform agenda will strengthen the system’s soundness
and resilience. Important progress has been made over the last year, including measures to tighten
lending standards for mortgages, which appear to have supported some reduction in mortgage-
related risks. However, additional financial sector reforms can be undertaken to further strengthen
financial sector regulation and supervision. In this regard, the authorities’ plans to adopt further
measures along the lines of those recommended in the Brunetti Report are encouraging. In this
context and in line with FSAP update recommendations, the authorities are encouraged to:
Continue to monitor closely financial stability risks related to Switzerland’s housing market and
its high levels of mortgage debt. If risks do not decline, consider tighter and more binding
prudential measures, such as explicit limits on the percent of new mortgages that can exceed a
given debt-service-to-income or debt-to-income ratio.
Press the largest banks to continue rapidly bringing their leverage ratios into line with other
large international banks and raise minimum leverage ratio requirements to more ambitious
levels.
Continue to refine FINMA’s use of external auditors, including by periodically rotating auditing
firms; providing more guidance on their supervisory focus; paying auditors from a FINMA-
managed, bank-financed fund rather than by the bank that is being audited to avoid conflicts of
interest; and intensifying FINMA’s own onsite inspections, including by increasing the number of
deep dives.
Increase banks’ disclosure requirements regarding capital-weights to enhance transparency and
bolster understanding of, and credibility in, banks’ soundness and business strategies.
Continue to monitor closely the possible effects on the financial sector of the recent exchange
rate appreciation and low interest-rate environment. The second factor is particularly important
for life insurers and defined-benefit pension plans. To ensure the sustainability of the latter, the
minimum guaranteed rate of return that applies to some plans and that is established by the
government should be reduced to bring it into line with market rates.
Overhaul the deposit insurance scheme to bring it into line with emerging international best
practices, including by building up dedicated ex-ante funding with a back-up credit line from the
authorities, reforming the scheme’s governance so that a majority of board members are
independent of the banking industry, and allowing the scheme to finance resolution measures.
Continue discussions with international counterparts to reach agreement on measures to make
the largest banks resolvable without public-sector support.
50. It is recommended that the next Article IV consultation take place on the standard 12-month
cycle.

SWITZERLAND
INTERNATIONAL MONETARY FUND 31
Table 1. Switzerland: Selected Economic Indicators, 2010–18
2010 2011 2012 2013 2014 2015 2016 2017 2018
Staff
estimate
Real GDP (percent change) 2.9 1.9 1.1 1.9 2.0 0.8 1.2 1.5 1.9
Total domestic demand -0.6 4.2 -1.2 -0.8 1.7 2.5 1.8 1.4 1.8
Final domestic demand 2.1 1.9 2.7 2.0 1.2 2.0 1.5 1.6 1.7
Private consumption 1.6 0.9 2.8 2.2 1.0 2.5 2.0 1.8 1.8
Public consumption 0.2 2.1 2.9 1.4 1.1 1.8 1.2 1.2 1.2
Gross fixed investment 4.2 4.4 2.5 1.8 1.8 1.0 0.5 1.4 1.8
Inventory accumulation 1/ -2.4 2.1 -3.5 -2.5 0.4 0.4 0.2 -0.2 0.1
Foreign balance 1/ 3.4 -1.9 2.2 2.7 0.5 -1.4 -0.4 0.2 0.3
Nominal GDP (billions of Swiss francs) 605.6 618.5 624.4 635.7 651.8 648.2 651.1 662.1 678.3
Savings and investment (percent of GDP)
Gross national saving 38.0 33.8 34.1 33.2 30.5 28.6 28.5 28.3 28.5
Gross domestic investment 24.0 27.0 24.2 22.5 23.6 22.8 22.9 22.8 22.8
Current account balance 14.0 6.8 9.9 10.7 7.0 5.8 5.6 5.5 5.7
Prices and incomes (percent change)
GDP deflator 0.2 0.2 -0.2 -0.1 0.5 -1.4 -0.8 0.2 0.5
Consumer price index (period average) 0.7 0.2 -0.7 -0.2 0.0 -1.1 -0.4 0.4 0.8
Consumer price index (end of period) 0.5 -0.7 -0.4 0.1 -0.3 -1.4 0.3 0.5 1.0
Nominal hourly earnings 0.8 1.0 0.8 0.8 0.8 0.1 0.5 1.0 2.0
Unit labor costs (total economy) -2.2 2.0 1.5 -1.1 -1.2 -0.7 -0.7 -0.5 0.1
Employment and slack measures
Unemployment rate (in percent) 3.5 2.8 2.9 3.2 3.2 3.4 3.6 3.4 3.3
Output gap (in percent of potential) -0.4 -0.4 -1.0 -0.7 -0.2 -0.9 -0.9 -0.8 -0.2
Capacity utilization 81.1 84.3 81.5 80.7 82.0 … … … …
Potential output growth 2.0 1.9 1.7 1.7 1.5 1.5 1.3 1.3 1.4
General government finances (percent of GDP)
Revenue 31.1 31.7 31.3 31.3 31.3 31.3 31.3 31.3 31.3
Expenditure 31.0 31.4 31.4 31.5 31.1 31.6 31.6 31.5 31.4
Balance 0.1 0.3 -0.1 -0.1 0.2 -0.3 -0.3 -0.2 -0.1
Cyclically adjusted balance 0.2 0.4 0.2 0.1 0.3 0.0 0.0 0.0 0.0
Gross debt 2/ 47.1 47.1 48.2 47.0 46.1 46.1 45.6 44.6 43.5
Monetary and credit (percent change, average)
Broad money (M3) 7.0 7.2 9.8 7.7 3.3 … … … …
Domestic credit, non-financial 2.1 3.7 5.3 3.9 2.7 … … … …
Three-month SFr LIBOR 0.2 0.1 0.1 0.0 0.0 … … … …
Yield on government bonds (7-year) 1.3 1.2 0.4 0.6 0.4 … … … …
Exchange rates (levels)
Swiss francs per U.S. dollar (annual average) 1.0 0.9 0.9 0.9 0.9 … … … …
Swiss francs per euro (annual average) 1.4 1.2 1.2 1.2 1.2 … … … …
Nominal effective rate (avg., 2000=100) 128.6 144.8 144.2 145.3 148.9 … … … …
Real effective rate (avg., 2000=100) 3/ 109.8 118.0 114.0 114.0 116.0 … … … …
Sources: Haver Analytics; IMF's Information Notice System; Swiss National Bank; and IMF Staff estimates.
1/ Contribution to growth.
3/ Based on relative consumer prices.
Staff projections
2/ Reflects new GFSM 2001 methodology, which values debt at market prices. Calculated as the sum of Federal, Cantonal, Municipal and
Social security gross debts.

SWITZERLAND
32 INTERNATIONAL MONETARY FUND
Table 2. Switzerland: Balance of Payments, 2010–18
2010 2011 2012 2013 2014 2015 2016 2017 2018
Current account 85 42 62 68 45 37 37 37 39
Goods balance 36 26 37 50 51 48 45 44 45
Exports 288 307 312 346 300 291 296 307 322
Imports 252 281 274 297 250 243 251 263 277
Service balance 27 22 21 20 20 20 19 19 20
Net primary income 37 8 17 16 -2 -6 -1 -2 -1
Net secondary income -15 -14 -14 -18 -24 -25 -26 -25 -25
Private capital and financial account 106 13 84 98 44 37 36 36 38
Capital transfers -5 -8 -2 1 -1 0 0 0 0
Financial account 110 22 86 98 45 37 36 36 38
Net foreign direct investment 59 18 26 30 28 29 29 29 29
Net portfolio investment -33 13 -17 16 -1 8 4 6 5
Net financial derivatives 0 0 -1 -1 -1 -1 -1 -1 -1
Net other investment -54 -51 -96 39 9 -8 0 3 6
Change in reserves 138 43 175 13 9 10 5 0 0
Net errors and omissions 30 -12 26 29 0 0 0 0 0
Current account 14.0 6.8 9.9 10.7 7.0 5.8 5.6 5.5 5.7
Goods balance 5.9 4.2 6.0 7.8 7.8 7.4 6.8 6.7 6.6
Exports 47.6 49.6 49.9 54.5 46.1 44.9 45.4 46.4 47.5
Imports 41.7 45.4 43.9 46.7 38.3 37.5 38.6 39.7 40.8
Service balance 4.4 3.6 3.4 3.1 3.1 3.1 3.0 2.9 2.9
Net primary income 6.2 1.3 2.8 2.5 -0.3 -0.9 -0.2 -0.3 -0.1
Net secondary income -2.5 -2.3 -2.3 -2.8 -3.7 -3.9 -3.9 -3.8 -3.7
Private capital and financial account 17.4 2.1 13.4 15.5 6.7 5.8 5.5 5.5 5.6
Capital transfers -0.8 -1.4 -0.4 0.1 -0.1 0.0 -0.1 0.0 0.0
Financial account 18.2 3.5 13.8 15.3 6.8 5.8 5.6 5.5 5.6
Net foreign direct investment 9.7 2.8 4.1 4.8 4.3 4.5 4.4 4.4 4.2
Net portfolio investment -5.4 2.1 -2.7 2.5 -0.1 1.2 0.5 0.8 0.7
Net financial derivatives 0.0 -0.1 -0.2 -0.1 -0.2 -0.1 -0.2 -0.2 -0.2
Net other investment -8.9 -8.2 -15.3 6.2 1.4 -1.3 0.0 0.4 0.9
Change in reserves 22.8 6.9 28.0 2.0 1.4 1.5 0.8 0.0 0.0
Net errors and omissions 5.0 -1.9 4.2 4.5 0.0 0.0 0.0 0.0 0.0
Memorandum items:
Net IIP (in percent of GDP) 134.0 138.9 132.9 117.7 121.6 128.1 133.1 136.3 138.7
Official reserves
(billions of U.S. dollars, end-period) 240.1 295.1 439.5 542.5 509.7 … … … …
Reserve cover (in months of imports) 8.6 9.3 13.7 15.3 16.2 … … … …
Sources: Haver Analytics; Swiss National Bank; and IMF staff estimates.
(In percent of GDP, unless otherwise indicated)
(In billions of Swiss francs, unless otherwise indicated)
Staff projections

SWITZERLAND
INTERNATIONAL MONETARY FUND 33
Table 3. Switzerland: SNB Balance Sheet, 2009–14
(Millions of Swiss francs; unless otherwise indicated)
2009 2010 2011 2012 2013 2014
Assets
Gold 38,186 43,988 49,380 50,772 35,565 39,630
Foreign currency reserves 94,680 203,810 257,504 432,209 443,275 510,062
IMF, international, and monetary assistance loans 5,905 4,971 4,923 4,528 4,538 4,627
Swiss franc repos 36,208 ... 18,468 ... ... ...
U.S. dollar repos ... ... 371 ... ... ...
Swaps against Swiss francs 2,672 ... ... ... ... ...
Money market, Swiss franc securities, other 29,614 17,187 15,434 11,925 7,004 6,883
Total assets 207,264 269,955 346,079 499,434 490,382 561,202
Liabilities
Currency in circulation (banknotes) 49,966 51,498 55,729 61,801 65,766 67,596
Sight deposits 57,102 48,917 216,701 369,732 363,910 387,666
Repo, SNB bills and time liabilities 27,473 121,052 15,086 … … …
Foreign currency and other liabilities 6,820 5,897 5,441 9,825 12,682 19,635
Provisions and equity capital 65,902 42,591 53,123 58,075 48,023 86,305
Total liabilities 207,264 269,955 346,079 499,434 490,382 561,202
Memorandum items:
Nominal GDP (billions of Swiss francs) 587 606 619 624 636 652
Balance sheet, percent of GDP 35.3 44.6 56.0 80.0 77.1 86.1
Banknotes, percent of total liabilities 24.1 19.1 16.1 12.4 13.4 12.0
Refinancing operations, percent of total assets 18.8 … 5.4 … … …
Provisions and equity capital, percent of total assets 31.8 15.8 15.3 11.6 9.8 15.4
Monetary base 1/ 89,156 74,185 231,954 350,965 380,523 384,920
Sources: Swiss National Bank; and IMF staff estimates.
1/ Currency in circulation and sight deposits of domestic banks.

SWITZERLAND
34 INTERNATIONAL MONETARY FUND
Table 4. Switzerland: General Government Finances, 2010–18
2010 2011 2012 2013 2014 2015 2016 2017 2018
Staff
estimate
General government
Revenue 189 196 196 199 204 203 204 207 212
Expenditure 188 194 196 200 203 205 206 209 213
Net lending/net borrowing 1 2 0 -1 1 -2 -2 -1 0
Confederation (Federal government) 1/
Revenue 61 63 62 63 64 63 64 65 66
Expenditure 59 63 62 64 61 65 65 66 68
Net lending/net borrowing 2 1 0 -1 2 -2 -1 -1 -2
Cantons
Revenue 76 78 79 80 82 82 82 83 85
Expenditure 75 80 81 82 85 83 83 84 85
Net lending/net borrowing 1 -1 -3 -2 -3 -1 -1 -1 0
Communes/municipalities
Revenue 42 43 43 44 45 45 45 46 47
Expenditure 43 43 44 44 45 45 45 45 46
Net lending/net borrowing -1 0 -1 0 0 0 0 1 1
Social security 2/
Revenue 53 58 59 60 61 61 61 62 64
Expenditure 55 55 56 58 58 60 61 62 63
Net lending / net borrowing -2 3 3 2 3 1 0 0 1
General government gross debt 3/ 285 291 301 299 300 299 297 296 295
Confederation (Federal government) 1/ 145 148 150 146 148 147 145 144 142
Cantons 69 72 78 80 77 76 75 75 75
Communes/municipalities 63 65 66 68 67 67 67 68 69
Social security 2/ 8 6 7 5 8 9 9 9 10
General government operations
Revenue 31.1 31.7 31.3 31.3 31.3 31.3 31.3 31.3 31.3
Expenditure 31.0 31.4 31.4 31.5 31.1 31.6 31.6 31.5 31.4
Net lending/net borrowing 0.1 0.3 -0.1 -0.1 0.2 -0.3 -0.3 -0.2 -0.1
Confederation (Federal government) 1/ 0.3 0.1 0.1 -0.1 0.3 -0.2 -0.2 -0.2 -0.3
Cantons 0.2 -0.2 -0.4 -0.3 -0.5 -0.1 -0.1 -0.1 0.0
Communes/municipalities -0.1 0.0 -0.2 -0.1 -0.1 0.0 0.0 0.1 0.1
Social security -0.3 0.5 0.5 0.3 0.4 0.2 0.0 0.0 0.1
General government gross debt 3/ 47.1 47.1 48.2 47.0 46.1 46.1 45.6 44.6 43.5
Confederation (Federal government) 1/ 23.9 24.0 24.1 23.0 22.8 22.6 22.3 21.7 20.9
Cantons 11.4 11.6 12.5 12.6 11.8 11.7 11.5 11.3 11.0
Communes/municipalities 10.4 10.5 10.6 10.7 10.3 10.4 10.4 10.3 10.1
Social security 2/ 1.3 1.0 1.1 0.8 1.2 1.4 1.4 1.4 1.5
Memorandum items:
Nominal GDP (billions of francs) 606 619 624 636 652 648 651 662 678
Output gap (percent) -0.4 -0.4 -1.0 -0.7 -0.2 -0.9 -0.9 -0.8 -0.2
General Government cyclically adjusted balance 0.2 0.4 0.2 0.1 0.3 0.0 0.0 0.0 0.0
Sources: Federal Ministry of Finance; and IMF staff estimates.
2/ Includes old age, disability, survivors protection scheme as well unemployment and income loss insurance.
3/ Data are unconsolidated.
1/ Includes the balance of the Confederation and extrabudgetary funds (Public Transport Fund, ETH, Infrastructure Fund, Federal
Pension Fund).
(In percent of GDP)
(In billions of Swiss francs, unless otherwise specified)
Staff projections

SWITZERLAND
INTERNATIONAL MONETARY FUND 35
Table 5. Switzerland: General Government Operations, 2003–12
2003 2004 2005 2006 2007 2008 2009 2010 2011 2012
Revenue 161.1 164.7 171.1 179.7 187.7 187.5 186.8 188.7 196.0 195.5
Taxes 94.5 97.7 102.2 108.3 114.6 122.6 121.1 122.4 126.1 126.2
Taxes on income, profits, and capital gains 55.1 56.7 60.5 64.7 69.4 74.9 74.3 73.8 77.2 76.3
Taxes on goods and services 28.1 29.1 30.3 31.5 32.4 29.6 28.8 30.5 31.2 32.8
Taxes on property 10.3 10.8 10.5 11.0 11.8 11.8 11.8 11.9 11.7 11.0
Taxes on international trade and transactions 1.1 1.1 1.0 1.0 1.0 6.2 6.2 6.2 6.1 6.1
Social contributions 32.7 31.9 32.4 33.5 35.1 36.9 38.1 38.3 40.9 41.8
Grants 0.1 0.1 0.1 0.1 -1.4 0.1 0.2 0.2 0.2 0.2
Other revenue 33.8 35.0 36.3 37.8 39.3 28.0 27.3 27.9 28.8 27.3
Of which: property income 8.3 8.4 9.1 9.5 9.7 9.3 8.9 9.0 9.4 7.7
Expenditure 167.4 170.7 173.9 174.9 180.5 177.3 184.0 188.0 194.2 195.8
Expense 164.6 168.5 172.3 173.7 179.1 177.1 182.6 186.6 193.0 195.3
Compensation of employees 47.7 48.4 49.2 49.9 51.2 41.0 43.1 44.1 45.3 46.1
Purchases/use of goods and services 22.6 22.9 23.5 23.8 24.4 21.8 22.5 21.6 23.2 23.7
Interest expense 6.9 6.6 6.9 7.2 6.9 6.5 5.7 5.5 5.4 5.1
Social benefits 55.2 56.6 58.4 58.6 59.6 60.3 64.3 66.4 66.1 67.6
Expense n.e.c. 32.3 33.9 34.3 34.2 37.0 47.6 47.0 48.9 53.0 52.9
Net acquisition of nonfinancial assets 2.8 2.2 1.6 1.3 1.4 0.2 1.4 1.4 1.2 0.5
Net operating balance -3.5 -3.8 -1.2 6.0 8.6 10.5 4.2 2.1 3.0 0.2
Net lending/borrowing -6.4 -6.1 -2.7 4.8 7.2 10.2 2.8 0.6 1.8 -0.3
Net acquisition of financial assets … … … … … … 14.5 -19.3 12.9 21.1
Net incurrence of liabilities … … … … … … 11.7 -19.9 11.1 21.4
Revenue 34.0 33.7 33.7 33.4 32.7 31.4 31.8 31.2 31.7 31.3
Taxes 19.9 20.0 20.1 20.1 20.0 20.5 20.6 20.2 20.4 20.2
Taxes on income, profits, and capital gains 11.6 11.6 11.9 12.0 12.1 12.6 12.7 12.2 12.5 12.2
Taxes on goods and services 5.9 6.0 6.0 5.9 5.7 5.0 4.9 5.0 5.0 5.2
Taxes on property 2.2 2.2 2.1 2.0 2.1 2.0 2.0 2.0 1.9 1.8
Taxes on international trade and transactions 0.2 0.2 0.2 0.2 0.2 1.0 1.1 1.0 1.0 1.0
Social contributions 6.9 6.5 6.4 6.2 6.1 6.2 6.5 6.3 6.6 6.7
Other revenue 7.1 7.2 7.2 7.0 6.9 4.7 4.7 4.6 4.7 4.4
Expenditure 35.3 34.9 34.3 32.5 31.5 29.7 31.3 31.1 31.4 31.4
Expense 34.7 34.5 34.0 32.3 31.2 29.7 31.1 30.8 31.2 31.3
Compensation of employees 10.0 9.9 9.7 9.3 8.9 6.9 7.3 7.3 7.3 7.4
Purchases/use of goods and services 4.8 4.7 4.6 4.4 4.3 3.7 3.8 3.6 3.7 3.8
Interest expense 1.4 1.4 1.4 1.3 1.2 1.1 1.0 0.9 0.9 0.8
Social benefits 11.6 11.6 11.5 10.9 10.4 10.1 10.9 11.0 10.7 10.8
Expense n.e.c. 6.8 6.9 6.8 6.4 6.5 8.0 8.0 8.1 8.6 8.5
Net acquisition of nonfinancial assets 0.6 0.5 0.3 0.2 0.2 0.0 0.2 0.2 0.2 0.1
Net operating balance -0.7 -0.8 -0.2 1.1 1.5 1.8 0.7 0.3 0.5 0.0
Net lending/borrowing -1.3 -1.2 -0.5 0.9 1.3 1.7 0.5 0.1 0.3 -0.1
Net acquisition of financial assets … … … … … … 2.5 -3.2 2.1 3.4
Net incurrence of liabilities … … … … … … 2.0 -3.3 1.8 3.4
Source: Federal Ministry of Finance.
(In billions of Swiss francs, unless otherwise specified)
(In percent of GDP)
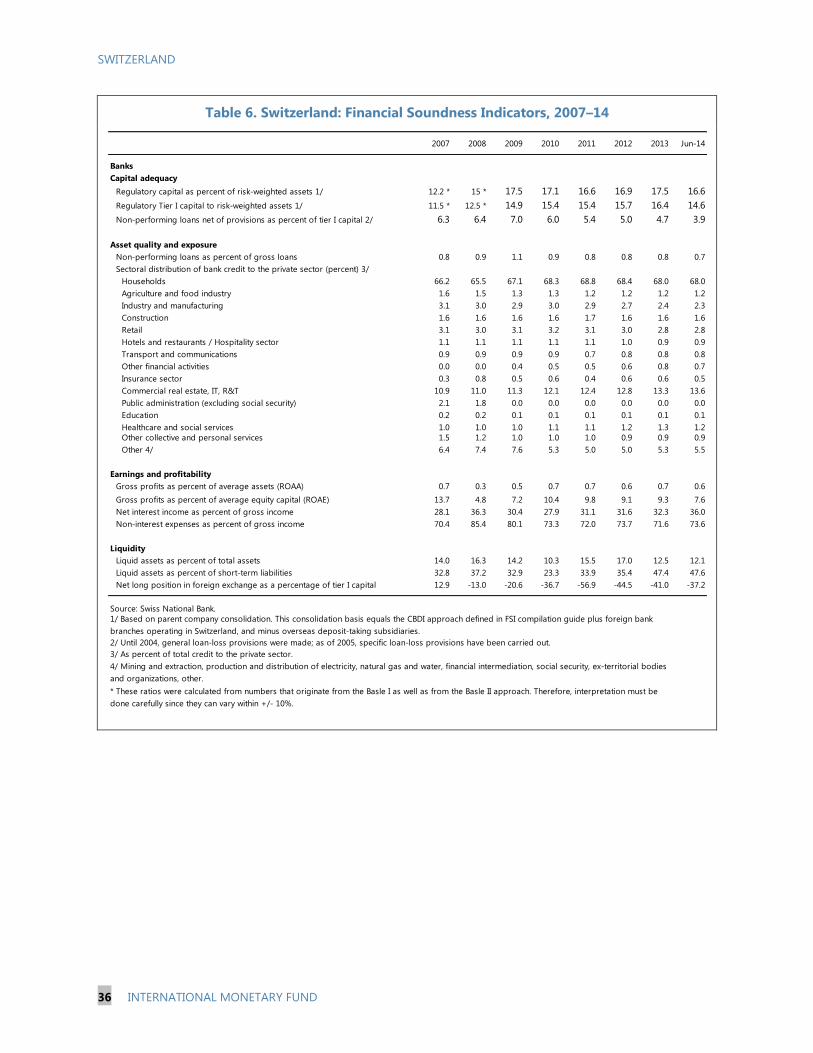
SWITZERLAND
36 INTERNATIONAL MONETARY FUND
Table 6. Switzerland: Financial Soundness Indicators, 2007–14
2007 2008 2009 2010 2011 2012 2013 Jun-14
Banks
Capital adequacy
Regulatory capital as percent of risk-weighted assets 1/ 12.2 * 15 * 17.5 17.1 16.6 16.9 17.5 16.6
Regulatory Tier I capital to risk-weighted assets 1/ 11.5 * 12.5 * 14.9 15.4 15.4 15.7 16.4 14.6
Non-performing loans net of provisions as percent of tier I capital 2/ 6.3 6.4 7.0 6.0 5.4 5.0 4.7 3.9
Asset quality and exposure
Non-performing loans as percent of gross loans 0.8 0.9 1.1 0.9 0.8 0.8 0.8 0.7
Sectoral distribution of bank credit to the private sector (percent) 3/
Households 66.2 65.5 67.1 68.3 68.8 68.4 68.0 68.0
Agriculture and food industry 1.6 1.5 1.3 1.3 1.2 1.2 1.2 1.2
Industry and manufacturing 3.1 3.0 2.9 3.0 2.9 2.7 2.4 2.3
Construction 1.6 1.6 1.6 1.6 1.7 1.6 1.6 1.6
Retail 3.1 3.0 3.1 3.2 3.1 3.0 2.8 2.8
Hotels and restaurants / Hospitality sector 1.1 1.1 1.1 1.1 1.1 1.0 0.9 0.9
Transport and communications 0.9 0.9 0.9 0.9 0.7 0.8 0.8 0.8
Other financial activities 0.0 0.0 0.4 0.5 0.5 0.6 0.8 0.7
Insurance sector 0.3 0.8 0.5 0.6 0.4 0.6 0.6 0.5
Commercial real estate, IT, R&T 10.9 11.0 11.3 12.1 12.4 12.8 13.3 13.6
Public administration (excluding social security) 2.1 1.8 0.0 0.0 0.0 0.0 0.0 0.0
Education 0.2 0.2 0.1 0.1 0.1 0.1 0.1 0.1
Healthcare and social services 1.0 1.0 1.0 1.1 1.1 1.2 1.3 1.2
Other collective and personal services 1.5 1.2 1.0 1.0 1.0 0.9 0.9 0.9
Other 4/ 6.4 7.4 7.6 5.3 5.0 5.0 5.3 5.5
Earnings and profitability
Gross profits as percent of average assets (ROAA) 0.7 0.3 0.5 0.7 0.7 0.6 0.7 0.6
Gross profits as percent of average equity capital (ROAE) 13.7 4.8 7.2 10.4 9.8 9.1 9.3 7.6
Net interest income as percent of gross income 28.1 36.3 30.4 27.9 31.1 31.6 32.3 36.0
Non-interest expenses as percent of gross income 70.4 85.4 80.1 73.3 72.0 73.7 71.6 73.6
Liquidity
Liquid assets as percent of total assets 14.0 16.3 14.2 10.3 15.5 17.0 12.5 12.1
Liquid assets as percent of short-term liabilities 32.8 37.2 32.9 23.3 33.9 35.4 47.4 47.6
Net long position in foreign exchange as a percentage of tier I capital 12.9 -13.0 -20.6 -36.7 -56.9 -44.5 -41.0 -37.2
Source: Swiss National Bank.
2/ Until 2004, general loan-loss provisions were made; as of 2005, specific loan-loss provisions have been carried out.
3/ As percent of total credit to the private sector.
1/ Based on parent company consolidation. This consolidation basis equals the CBDI approach defined in FSI compilation guide plus foreign bank
branches operating in Switzerland, and minus overseas deposit-taking subsidiaries.
4/ Mining and extraction, production and distribution of electricity, natural gas and water, financial intermediation, social security, ex-territorial bodies
and organizations, other.
* These ratios were calculated from numbers that originate from the Basle I as well as from the Basle II approach. Therefore, interpretation must be
done carefully since they can vary within +/- 10%.

SWITZERLAND
INTERNATIONAL MONETARY FUND 37
Annex I. Switzerland: External Sector Assessment1
Much of Switzerland’s current account surplus is accounted for by nontraditional factors, such as
merchanting profits, net exports of financial/insurance services, and a statistical bias due to the
treatment of retained earnings of multinationals with large foreign ownership. These factors reflect
Switzerland’s role as a global hub for commodity trading, wealth management, and multinational
corporations (MNCs), which in turn boosts reported Swiss income and savings, even though some of
this saving may not be fundamentally Swiss. In addition, the SNB reported significant earnings on its
large foreign exchange reserves built up in response to post-crisis safe-haven inflows. Stripping away
these nontraditional factors reveals a much more modest “underlying” current account balance that is
consistent with evidence on the overvaluation of the Swiss franc. The sharp decline in the current
account in 2014 (linked to a decline in net income from abroad) highlights the importance of adjusting
for these nontraditional factors for purposes of Swiss external assessments.
A. Stylized Facts about the Swiss Current Account
1. At 9.2 percent of GDP in 2012–14,
Switzerland’s current account surplus
appears high by international standards,
but not by its own. As can be seen, the Swiss
current account surplus averaged just over
10 percent of GDP during 2000–14 and
reached or exceeded 14 percent of GDP in
2004, 2006, and 2010.
2. The structure of the Swiss current
account is complex, with “nontraditional”
items accounting for a large fraction of the
surplus (Annex Table 1).
The statistical treatment of retained earnings of MNCs with substantial foreign ownership
generates an upward bias in the current account. In particular, under balance of payments
accounting rules, all retained earnings of Swiss MNCs are reported as net FDI income for
Switzerland, even if foreign shareholders have a claim on those earnings. Because Swiss MNCs
distribute less of their earnings to their foreign shareholders than foreign MNCs distribute to
their Swiss shareholders, this biases the Swiss current account upwards. In Switzerland, the bias
is estimated at approximately 3 percent of GDP in 2014. The attraction of Switzerland as a base
for MNCs also partly explains Switzerland’s high NIIP (Annex Figure 1) .
The 2012–14 goods balance of +7.2 percent of GDP mostly reflects net exports of goods under
merchanting, i.e. profit made on goods bought and sold offshore by Swiss merchanting firms.
1 Prepared by S. Ali Abbas (SPR), S. Denis (EUR), and M. Mrkaic (EUR).
12
8 9
1315
13 14
102
7
14
7
10 117
-15
-10
-5
0
5
10
15
20
25
30
35
-15
-10
-5
0
5
10
15
20
25
30
35
2000 2002 2004 2006 2008 2010 2012 2014
Goods Services Income
Swiss Current Account Balance and Major Components
(Percent of GDP)
Source: Haver Analytics.

SWITZERLAND
38 INTERNATIONAL MONETARY FUND
The 2012–14 services balance of +3.2 percent of GDP was more than fully accounted for by
financial and insurance services, reflecting Switzerland’s role as one of the world’s leading wealth
management centers.
Although the 2012–14 income balance was -1.3 percent of GDP, it masks large positive net
investment earnings of 4¾ percent of GDP, which are offset by even larger negative labor and
secondary income balances. Much of large positive net investment earnings are due to the
statistical bias explained in the first bullet above.
3. This complexity sets apart the Swiss current account from those of many other major
economies with large surpluses. Factors such as merchanting, financial and insurance services, net
FDI earnings, and income on FX reserves only play a marginal role in the current account dynamics
of other major economies with large surpluses, e.g. Germany (Annex Figure 2). The same factors
seem to play a larger role in some smaller economies that—like Switzerland—offer competitive tax
regimes and host important financial centers.
4. The Swiss current account exhibits large volatility that is largely unrelated to
movements in the real exchange rate and global demand. The standard deviation of the Swiss
surplus, computed over the last decade, is 4 percentage points of GDP, one of the highest among
advanced economies (Annex Figure 3). Some of this volatility comes from fluctuations in net exports
of nonmonetary gold and merchanting (which are strongly correlated with international gold and
commodity price movements), and some from financial and insurance services (which respond
strongly to global financial shocks). As shown in Annex Table 1, most of the volatility comes from
net investment income, in particular net FDI receipts. The latter, which are an outcome of the
complex activities of MNCs based out of Switzerland (and motivated sometimes by tax optimization
objectives), are difficult to estimate, with official revisions between first estimates and final accounts
averaging 3 percentage points of GDP in the last four years. An example of the current account’s
high volatility is the decline in its surplus from 10.7 percent of GDP in 2013 to 7.0 percent of GDP in
2014, which can be accounted for by the nontraditional factors. The decline in the current account
balance occurred despite a stable REER and relatively stable domestic and foreign demand.
5. The association between the Swiss REER and the current account surplus is mild.
Movements in the exchange rate are likely to have some effects on export/import volumes of some
traditional goods and on cross-border trade. Consequently, the appreciation in 2015 is likely to
adversely affect near-term growth, as noted in the main text. However, the dominance of
nontraditional items in the current account and their volatility mean that the year-to-year
relationship between the REER and the current account is mild, as the nontraditional items
dominating the Swiss current account are unlikely to be highly exchange-rate sensitive. In addition,
even many of the “traditional” items in the trade balances may be less exchange rate-sensitive in
Switzerland than in other economies due to tax optimization strategies contaminating intra-MNC
cross-border trade. Annex Figure 4 confirms the mild association between movements in the Swiss
REER (CPI basis) in a given year and current account-to-GDP changes in the following year.

SWITZERLAND
INTERNATIONAL MONETARY FUND 39
Annex 1. Figures
B. Assessment of the Swiss Current Account and Real Exchange Rate
6. Staff views Switzerland’s external position as having been broadly in line with
fundamentals in 2014, though this assessment is subject to high uncertainty. This judgment
reflects a balance of a number of factors, including the EBA current account norm estimates, EBA
REER overvaluation estimates, and special Swiss-specific factors, as elaborated upon in the main text
(paragraphs 8–10), this previous section of this annex, and the draft country page for the 2015
External Sustainability Report (see below). Consistent with this view, staff assesses the franc to have
been broadly in line with fundamentals in 2014, with this assessment also subject to significant
uncertainty.
7. The appreciation in early 2015 is likely to weaken the external position and to have
left the franc overvalued. As of April 2015, the REER has appreciated by about 10 percent relative
to its average 2014 value. This appreciation is likely to reduce net exports due to lessened
competiveness and has likely left the franc overvalued. This overvaluation partly reflects a policy gap
of insufficiently easy monetary policy—simple Taylor rules suggest an optimal policy rate well below
-150
-100
-50
0
50
100
150
200
250
300
350
-150
-100
-50
0
50
100
150
200
250
300
IRL
ESP
NZL
USA
ITA
GBR
SW
EFR
AC
AN
AU
TFI
ND
EU
LUX
NLD
DN
KBEL
JPN
CH
ESG
PH
KG
Figure 1. Net IIP Stocks
(Percent of GDP in 2014)
Source: Haver Analytics.
0
1
2
3
4
5
6
0
1
2
3
4
5
6
FRA
DEU
SW
E
GBR
USA
JPN
ITA
AU
T
DN
K
CA
N
LUX
NZL
BEL
FIN
NLD
CH
E
SG
P
IRL
ESP
HKG
Figure 3. Standard Deviation of Current Account
(Last 10 years, percentage points of GDP)
Sources: Haver Analytics; WEO; and IMF staff
calculations.
-10
-8
-6
-4
-2
0
2
4
6
8
10
-10
-8
-6
-4
-2
0
2
4
6
8
10
1991 1994 1997 2000 2003 2006 2009 2012
Figure 4. Correlation between REER depreciation (t) and
Change in CAB/GDP (t+1) is not strong
Source: IMF staff calculations.
REER
depreciation
(percent)
One-year ahead change in current
account (percent of GDP)
-30
-20
-10
0
10
20
30
40
-40
-30
-20
-10
0
10
20
30
40
50
NO
R
NLD
KO
R
CH
N
DEU
DN
K
SW
E
AU
T
ESP
JPN
SA
U
CH
E
RU
S
SG
P
HKG
LUX
IRL
ITA
Goods 1/
Services 2/
Rest (incl. income balance)
Figure 2. Structure of Largest Current Account Surpluses
(Percent of GDP in 2014)
Sources: Haver Analytics; WEO; IMF staff calculations.
1/ Excluding nonmonetary gold and merchanting.
2/ Excluding finance, insurance and license fees.

SWITZERLAND
40 INTERNATIONAL MONETARY FUND
current levels—which in turn reflects various operational challenges associated with unconventional
monetary policy (see monetary policy discussion in main text).
8. Further insights for the Swiss external sector assessment can be obtained by stripping
nontraditional components from the Swiss surplus and focusing on an “underlying” measure
of the current account. Note that we are adopting a slightly different approach here than used in
the EBA, in that the EBA assumes that all economies’ current accounts are comparable, while making
a 2½ percent of GDP adjustment for three financial center economies. This approach is somewhat
unsatisfactory, given that, in the Swiss case, net exports of merchanting and finance/insurance
services alone add up to 7 percent of GDP in 2014. In our approach, therefore, we adjust the Swiss
current account for nontraditional items in a consistent manner over time, producing three
definitions of “core current account” (bottom 3 rows of Annex Table 1):
The narrow definition sums the (i) goods balance less merchanting and nonmonetary gold net
exports; (ii) services balance less finance and insurance services and patents/license fees; and
(iii) income balance less all net investment income. As can be seen, during 2000-14 this balance
averaged -1.4 percent of GDP, with a low volatility of 1.2 percentage points of GDP.
The medium definition adds to the narrow definition the excluded services net exports (finance,
insurance, and patent/license fees), as it could be argued that this income accrues to Swiss
residents as remuneration for providing services that the Swiss economy has built a comparative
advantage in over a period of decades. This balance averaged 3.9 percent of GDP over 2000–14,
with a volatility of 1.8 percentage points of GDP.
The broad definition adds to the medium definition one-half of X, where X is net investment
income excluding income earned on the SNB’s foreign exchange reserves. This definition treats
half of the foreign assets owned by Swiss corporate and individual citizens as reliably Swiss, with
the other half seen as representing decisions by globally mobile firms and individuals to invest
their wealth via Switzerland for security and stability, tax optimization, or other reasons. This
balance averaged 6.5 percent of GDP over 2000–14, with a volatility of 2.6 percentage points of
GDP.
9. These smaller and relatively stable “core balances” lend further support to the
overvaluation of the REER. The sizes of the core surpluses are small; in fact, the cleanest measure
(“narrow” definition) shows an average deficit of 1.4 percent of GDP over 2000–14 and a consistent
widening of this deficit since 2008 (cumulatively 4.2 percentage points of GDP). The medium and
broad definitions of the core surplus also undershoot the estimated EBA norm.
10. Switzerland’s central bank reserves are large by most metrics, but partly reflect the
high volatility of its capital flows. As a percent of GDP, Switzerland’s reserves are some of the
highest among advanced economies, but similar to those of other financial centers (Hong Kong SAR,
Singapore). However, relative to bank debt, Switzerland’s reserves are not as high as in some other
small, open economies.

SWITZERLAND
INTERNATIONAL MONETARY FUND 41
Advanced Economies: Foreign Exchange Reserves, End-20141
Sources: IMF World Economic Outlook database; and World Bank/IMF/BIS External Debt database.
1/ For several countries, the data are for end-2013.
0
20
40
60
80
100
120
0
20
40
60
80
100
120
In percent of GDP
020
406080
100
120140
160180200
In percent of banks' total external debt
0
50
100
150
200
250
300
In percent of banks' short-term external debt
0
50
100
150
200
250
300350400450500
400
410
420
430
440
450
460
470
480
490
500
510

Annex Table 1. The Structure of the Swiss Current Account Balance (2000–14)
Sources: SNB; Haver Analytics; and Fund staff calculations.
Percent of GDP 2000 2001 2002 2003 2004 2005 2006 2007 2008 2009 2010 2011 2012 2013 2014
Avg.
(2000-
14)
Std.
dev.
(2000-
14)
Avg.
(2000
-02)
Avg.
(2012
-14)
Avg(2012-
14) minus
Avg(2000-
02)
2014
minus
2011
Headline current accountbalance: 12.0 8.2 8.6 12.7 14.5 13.4 14.2 10.0 2.2 7.1 14.0 6.8 9.9 10.7 7.0 10.1 3.5 9.6 9.2 -0.4 0.2
Goods and services balance 6.3 5.7 7.4 7.3 9.6 7.6 8.7 11.2 11.0 7.6 10.3 7.8 9.4 11.0 11.0 8.8 1.8 6.4 10.5 4.0 3.2
Goods balance 0.7 0.7 2.4 2.4 5.2 2.8 3.5 5.2 5.0 2.7 5.9 4.2 6.0 7.8 7.8 4.2 2.2 1.3 7.2 6.0 3.6
Goods_ex-gold&merchanting -0.6 -0.3 1.6 1.4 2.0 1.2 1.6 2.5 3.0 2.9 2.6 2.9 3.2 2.9 3.9 2.1 1.3 0.2 3.4 3.1 1.0
Goods_nonmonetary gold 0.9 0.6 0.2 0.2 1.9 -0.1 -0.4 0.1 -1.3 -3.6 -1.3 -3.2 -1.5 1.2 0.0 -0.4 1.5 0.6 -0.1 -0.6 3.2
Goods_merchanting 0.4 0.4 0.6 0.7 1.3 1.6 2.3 2.6 3.3 3.4 4.6 4.5 4.3 3.7 3.9 2.5 1.6 0.5 3.9 3.5 -0.6
Services balance 5.6 5.0 5.0 4.9 4.4 4.8 5.2 6.0 5.9 4.9 4.4 3.6 3.4 3.1 3.1 4.6 0.9 5.2 3.2 -1.9 -0.4
Services_ex-FIL -0.6 -0.4 -0.6 -0.6 -1.1 -1.1 -0.8 -0.5 0.1 -0.3 -0.3 -0.6 -0.8 -1.1 -0.8 -0.6 0.3 -0.5 -0.9 -0.4 -0.3
Services_finance & insurance (FI) 5.7 4.8 4.8 4.9 4.9 5.1 5.3 5.9 5.1 4.3 3.8 3.4 3.5 3.5 3.4 4.6 0.9 5.1 3.5 -1.7 0.0
Services_patents & license fees (L) 0.5 0.6 0.7 0.6 0.7 0.8 0.7 0.6 0.8 0.9 0.9 0.7 0.7 0.7 0.6 0.7 0.1 0.6 0.7 0.1 -0.1
Income balance 5.7 2.5 1.2 5.4 4.9 5.8 5.5 -1.2 -8.8 -0.5 3.7 -1.0 0.5 -0.3 -4.0 1.3 4.2 3.1 -1.3 -4.4 -3.0
Primary income balance 7.3 4.5 3.3 7.2 6.8 8.8 7.9 1.0 -6.2 2.1 6.2 1.3 2.8 2.5 -0.3 3.7 3.9 5.0 1.7 -3.4 -1.6
Labor income -1.8 -1.9 -2.0 -2.0 -2.1 -2.0 -2.1 -2.2 -2.2 -2.3 -2.5 -2.7 -2.9 -3.0 -3.1 -2.3 0.4 -1.9 -3.0 -1.1 -0.4
Investment income 9.1 6.5 5.3 9.2 8.9 10.8 10.0 3.2 -3.9 4.4 8.7 4.0 5.7 5.5 2.8 6.0 3.8 6.9 4.7 -2.3 -1.2
Inv income_ex-FX 8.5 5.9 4.8 8.8 8.4 10.4 9.7 2.9 -4.3 3.9 7.8 3.0 4.6 4.2 1.4 5.3 3.8 6.4 3.4 -3.0 -1.7
Inv income_FDI 5.8 3.9 2.2 6.1 6.0 8.0 7.2 0.2 -6.5 2.2 6.3 1.5 3.4 3.6 1.5 3.4 3.6 4.0 2.8 -1.2 -0.1
Inv income_FPI 2.7 2.3 2.4 2.4 2.3 2.5 2.6 2.9 2.4 2.2 2.0 1.5 1.4 0.6 0.1 2.0 0.8 2.5 0.7 -1.8 -1.4
Inv income_Other 0.0 -0.3 0.2 0.3 0.1 -0.1 -0.2 -0.2 -0.1 -0.4 -0.4 0.0 -0.2 0.0 -0.2 -0.1 0.2 0.0 -0.1 -0.1 -0.2
Inv income_reserves (FX) 0.6 0.6 0.5 0.5 0.5 0.4 0.3 0.3 0.3 0.5 0.8 1.0 1.1 1.3 1.5 0.7 0.4 0.5 1.3 0.8 0.5
Secondary income balance -1.6 -2.0 -2.1 -1.8 -1.9 -3.0 -2.4 -2.2 -2.6 -2.6 -2.5 -2.3 -2.3 -2.8 -3.7 -2.4 0.5 -1.9 -2.9 -1.0 -1.4
Public -0.4 -0.4 -0.5 -0.5 -0.6 -0.5 -0.5 -0.4 -0.4 -0.4 -0.4 -0.5 -0.5 -0.6 -0.6 -0.5 0.1 -0.5 -0.6 -0.1 -0.1
Private -1.2 -1.6 -1.5 -1.2 -1.3 -2.4 -2.0 -1.8 -2.2 -2.1 -2.1 -1.8 -1.8 -2.2 -3.1 -1.9 0.5 -1.4 -2.4 -0.9 -1.3
Underlying current account balance:
Narrow = blue cells only -1.9 -2.7 -0.5 -0.3 -0.7 -2.4 -1.3 0.2 0.5 -0.5 -1.1 -1.2 -1.5 -3.4 -3.9 -1.4 1.3 -1.7 -2.9 -1.3 -2.7
Medium = blue + FIL services 4.3 2.7 5.1 5.1 4.8 3.4 4.8 6.8 6.4 4.7 3.6 3.0 2.7 0.9 0.1 3.9 1.8 4.0 1.2 -2.8 -2.9
Broad = blue + 0.5*(FIL services + 8.6 5.7 7.5 9.5 9.0 8.6 9.6 8.2 4.2 6.6 7.5 4.5 5.0 3.0 0.8 6.6 2.6 7.2 2.9 -4.3 -3.7
Inv. income ex-reserves)
SW
ITZ
ER
LAN
D
42
IN
TER
NA
TIO
NA
L MO
NETA
RY F
UN
D

Switzerland: Draft Page for the 2015 External Sustainability Report Overall Assessment
Foreign asset
and liability
position and trajectory
Background. Switzerland is a financial center with a positive NIIP of about 120 percent of GDP and large gross foreign
asset and liability positions of 624 and 504 percent of GDP, respectively. The NIIP to GDP ratio has been volatile with no
significant trend over the last 10 years, despite large current account surpluses. The ratio is projected to rise moderately in
the medium term as recent exchange rate appreciation contributes to a wider output gap and significant inflation
undershooting, both of which will temporarily depress nominal GDP growth. Over the longer run, the ratio is expected to
stabilize and then decline modestly.
Assessment. Switzerland’s large gross liabilities and the volatility of its capital flows present risks, but these are mitigated
by Switzerland’s large net asset position and foreign reserves.
Overall Assessment:
In 2014, the underlying external
position was broadly consistent
with medium-term
fundamentals and desirable
policy settings.
This assessment takes into
account measurement
anomalies in the Swiss balance
of payments. After the
significant REER appreciation in
early 2015, the external position
will likely weaken.
Potential policy responses:
Monetary easing, perhaps via a
schedule of FX purchases (given
limited options for other
methods of monetary easing),
would help limit the near-term
growth slowdown, reduce risks
of inflation expectations
becoming anchored at low
levels, and lessen franc
overvaluation.
Current account Background. Switzerland has a moderate to large CA surplus, dominated by net investment income and goods balance.
Preliminary estimates from the authorities indicate a surplus of 7 percent of GDP in 2014, down from 11 percent in 2013,
reflecting mainly a decline in primary income. Correcting for net foreign ownership of FDI retained earnings and other
factors (e.g., merchanting exports) that have a tangential relation to the real Swiss economy would further reduce the “true” CA surplus.
1/
Assessment. The EBA CA regression approach estimates a CA gap of around 0.7 percent of GDP, reflecting a cyclically-
adjusted current account surplus of 7.5 percent of GDP and an EBA CA regression-estimated norm of 6.8 percent of GDP.
However, Switzerland’s current account surplus is misleadingly high because it is driven by non-traditional flows—such as
merchanting activities, commodity trading, financial and insurance services, and net FDI earnings—that are highly affected
by the operations of large multinationals, financial firms, and wealthy foreigners, whose savings may not be fundamentally
Swiss. The CA assessment is subject to unusually high uncertainty, given these anomalies, the high volatility of income
flows, and the potential for large revisions to the preliminary 2014 CA estimate. Taking these considerations into account,
staff assesses a CA gap for 2014 ranging from -3.5 to 2.5 percent of GDP. The CA gap is expected to become more negative in the near term due to REER appreciation so in far in 2015, which will adversely affect competiveness.
Real exchange
rate
Background. The REER (CPI basis) appreciated by 26 percent from 2007 to 2011. In September 2011, the SNB established
a floor of 1.20 for the CHF/EUR exchange rate, and the REER depreciated by 4 percent during 2011–14. The SNB exited
from the floor on January 15, 2015. As of April 2015, the REER has appreciated by about 10 percent from its average 2014 level.
Assessment. The EBA REER index and level regression-based estimates suggest that the average REER in 2014 was
overvalued by 11 and 13 percent, respectively, relative to its fundamentals and desirable policy settings. Taking into
consideration these estimates, the somewhat smaller estimates implied by staff’s CA assessment, and staff’s broader
analysis, staff assesses that the franc was broadly in line with fundamentals in 2014 (overvalued by 0–10 percent). Overvaluation likely increased in 2015 due to the appreciation so far this year.
Capital and
financial accounts:
flows and policy measures
Background. Significant net outward FDI (mostly reinvested earnings) has been a consistent feature of the financial
account in recent years, although bank lending flows have become critical since the crisis. The SNB absorbed very large safe-haven inflows (intermediated by the banking system) during 2009–12 through reserve accumulation.
Assessment. Safe-haven capital inflows may return in the event of a re-emergence of euro area stress, an intensification of emerging market turmoil (including due to a disorderly UMP exit by major central banks), or political risks.
SW
ITZ
ER
LAN
D
INTER
NA
TIO
NA
L MO
NETA
RY F
UN
D
43

Switzerland (continued)
FX intervention
and reserves level
Background. The SNB accumulated foreign exchange reserves of about 70 percent of GDP during 2009–14 in various
rounds of intervention, including to defend the CHF/EUR floor. At end-2014 the SNB’s balance sheet was approaching
90 percent of GDP. The SNB exited from the floor on January 15, 2015. The franc has since floated between 1.00–1.10 CHF/EUR, with the SNB intervening occasionally (mainly in the immediate aftermath of the exit from the floor).
Assessment. Reserves are large relative to GDP but more moderate relative to external liabilities. Substantial reserves are
explained in part by the volatility of capital flows. In recent years, interventions have been monetary policy operations
aimed at avoiding persistent inflation undershooting and given the limited supply of domestic assets available for purchase. Interventions have also helped limit exchange rate overvaluation.
Technical
Background Notes
1/ Swiss multinational firms are often partly owned by foreigners through portfolio shares. Thus, a part of the retained
earnings of these companies, which form a large component of Swiss current account receipts, should be attributed to
foreign shareholders, rather than counted as domestic income. See T. Mancini-Griffoli and N. Stoffels, “Adjusting the
Current Account to Better Capture Wealth Accumulation,” mimeo, SNB, August 2012. See also the discussion elsewhere in
this annex.
SW
ITZ
ER
LAN
D
44
IN
TER
NA
TIO
NA
L MO
NETA
RY F
UN
D

SWITZERLAND
INTERNATIONAL MONETARY FUND 45
Annex II. Switzerland: Risk Assessment Matrix1
Source of Risks Relative
Likelihood Expected impact Policy Response
Globally Originated Risks from the G-RAM
1. A surge in financial volatility, as investors move to safe-haven assets
High
High
Potential triggers could include market displacement from asynchronous policy normalization, a reassessment of fundamentals, and commodity price volatility. Demand for safe-haven assets would rise, leading to sharp appreciation pressures on Swiss franc assets. The franc appreciation adds to deflation and hurts Swiss competitiveness and growth.
Further ease monetary policy via additional FX purchases.
Consider temporarily suspending the fiscal rule to allow deeper fiscal easing if downturn is sustained and/or deep.
2. Protracted period of slower growth in advanced and EM economies
High
High
Europe is Switzerland’s main trading partner. A protracted period of slower European growth would dampen economic growth.
Same as 1 above.
3. Heightened risk of geopolitical fragmentation in Russia/Ukraine and the Middle East
Medium
High
The direct impact should be limited. However, contagion and heightened volatility in financial markets may trigger renewed safe-haven flows.
Same as 1 above.
Globally Originated Risks not in the G-RAM
4. Upside surprises to demand (external or domestic), inflation, and/or franc depreciation
Medium
Medium
Higher-than-expected growth in major trading partners or increased global risk appetite could boost franc depreciation, inflation, and growth.
Scale back monetary easing relative to baseline recommendations.
5. Growing changes in the international regulatory landscape and increased enforcement actions against banks
Medium
Medium
Switzerland’s attraction as a financial center may diminish, affecting financial sector assets, growth, employment, and public finances.
Compliance and effective implementation of relevant international standards, including those issued by the FATF.
1 The Risk Assessment Matrix (RAM) shows events that could materially alter the baseline path (the scenario most
likely to materialize in the view of IMF staff). The relative likelihood is the staff’s subjective assessment of the risks surrounding the baseline (“low” is meant to indicate a probability below 10 percent, “medium” a probability between 10 and 30 percent, and “high” a probability between 30 and 50 percent). The RAM reflects staff views on the source of risks and overall level of concern as of the time of discussions with the authorities. Non-mutually exclusive risks may interact and materialize jointly.
SW
ITZ
ER
LAN
D

SWITZERLAND
46 INTERNATIONAL MONETARY FUND
Source of Risks Relative
Likelihood Expected impact Policy Response
Domestically Originated Risks
6. A surge in house prices and mortgage borrowings, which eventually collapses
Medium
High
Households’ balance sheets would be hit hard, and domestic demand would be reduced. The financial sector would suffer through both direct and indirect effects.
Keep tightening supervision and macroprudential policies during the upswing. Loosen macro policies following the bust.
7. Weaker economic relationships with EU
Medium
Medium
Re-introducing immigration quotas could restrict access to skilled workers and EU markets, weakening long-run growth.
Secure a constructive
resolution to uncertainties
related to EU relations and
immigration.

SWITZERLAND
INTERNATIONAL MONETARY FUND 47
Annex III. Switzerland: Debt Sustainability Analysis
Summary: Public debt sustainability risks remain subdued due to the strict implementation of fiscal
rules and the low stock of public debt.1
Baseline Scenario: The two main assumptions underlying the baseline scenario are a gradual but
steady recovery of economic growth and the continued adherence to federal and sub-federal fiscal
rules. Under the baseline scenario, public debt is projected to decline from 46 percent of GDP in
2015 to 41 percent of GDP in 2020. Gross financing needs are expected to remain around 10 percent
of GDP during the medium term.
Stress Tests: The main risk to debt dynamics is a negative growth shock. Other risks—for example,
an adverse interest rate shock or a shock to financing needs—affect the public debt trajectory only
to a minor extent.
Real GDP growth shock. Real GDP growth rates are assumed to be one standard deviation
(1.8 percent) below the baseline during 2015–16. Under this scenario, the debt-to GDP ratio
approaches 48 percent in 2017 (3 percentage points higher than the baseline).
Primary balance shock. The primary balance in 2015–16 is hit by a negative shock of
0.4 percent of GDP. This shock results in a debt-to-GDP ratio that is only slightly above the
baseline during 2015–20.
Real interest rate shock. The nominal interest rate increases by 200 basis points during
2015–20. The debt-to-GDP ratio increases only marginally in 2016 and continues declining
afterwards.
Real exchange rate shock. This scenario assumes that the nominal CHF/USD exchange rate
increases by 14 percent in 2016 relative to its 2015 level. As with other non-growth related
shocks, the impact of this shock on the trajectory of public debt is minor.
Combined shock. A simultaneous combination of the previous three shocks would result in
an increasing debt-to-GDP ratio that approached 48 percent in 2017 (approximately
3 percentage points higher than the baseline). However, after 2017, the debt would start
declining on a trajectory that is parallel to the one under the baseline scenario.
1 For the purpose of this analysis, the general government includes the federal government, cantonal governments,
municipal governments, and the social security fund.

SWITZERLAND
48 INTERNATIONAL MONETARY FUND
Switzerland: Public Sector Debt Sustainability Analysis (DSA) – Baseline Scenario
(in percent of GDP unless otherwise indicated)
As of April 15, 20152/
2013 2014 2015 2016 2017 2018 2019 2020 Sovereign Spreads
Nominal gross public debt 54.0 47.0 46.1 46.1 45.6 44.6 43.5 42.4 41.3 Bond Spread (bp) 3/ -25
Public gross financing needs 1.4 1.7 1.3 11.0 12.5 11.7 10.9 10.2 9.9 5Y CDS (bp) 15
Public debt (in percent of potential GDP) 54.1 46.7 46.0 45.7 45.2 44.3 43.4 42.4 41.3
Real GDP growth (in percent) 2.2 1.9 2.0 0.8 1.2 1.5 1.9 1.9 1.9 Ratings Foreign Local
Inflation (GDP deflator, in percent) 0.9 -0.1 0.5 -1.4 -0.8 0.2 0.5 0.8 0.8 Moody's Aaa Aaa
Nominal GDP growth (in percent) 3.1 1.8 2.5 -0.6 0.4 1.7 2.5 2.7 2.8 S&Ps AAA AAA
Effective interest rate (in percent) 4/ 2.0 1.6 1.6 1.6 1.6 1.6 1.6 1.6 1.6 Fitch AAA AAA
2013 2014 2015 2016 2017 2018 2019 2020 cumulative
Change in gross public sector debt -1.6 -1.1 -0.9 0.0 -0.5 -1.0 -1.1 -1.1 -1.1 -4.8
Identified debt-creating flows -1.7 -0.4 -1.0 0.9 0.4 -0.2 -0.7 -0.7 -0.8 -1.1
Primary deficit -1.0 -0.2 -0.6 -0.1 -0.1 -0.1 -0.3 -0.3 -0.3 -1.1
Primary (noninterest) revenue and grants 31.9 31.0 31.0 31.0 31.0 31.0 31.0 31.0 31.0 185.8
Primary (noninterest) expenditure 30.9 30.7 30.4 30.9 30.9 30.8 30.7 30.7 30.7 184.6
Automatic debt dynamics 5/
-0.7 -0.1 -0.4 1.0 0.5 -0.1 -0.4 -0.5 -0.5 0.1
Interest rate/growth differential 6/
-0.7 -0.1 -0.4 1.0 0.5 -0.1 -0.4 -0.5 -0.5 0.1
Of which: real interest rate 0.6 0.8 0.5 1.4 1.1 0.6 0.4 0.3 0.3 4.1
Of which: real GDP growth -1.3 -0.9 -0.9 -0.4 -0.6 -0.7 -0.8 -0.8 -0.8 -4.0
Exchange rate depreciation 7/
0.0 0.0 0.0 … … … … … … …
Other identified debt-creating flows 0.0 0.0 0.0 0.0 0.0 0.0 0.0 0.0 0.0 0.0
Residual, including asset changes 8/
0.1 -0.8 0.1 -0.9 -0.9 -0.8 -0.5 -0.4 -0.4 -3.7
Source: IMF staff.
1/ Public sector is defined as general government.
2/ Based on available data.
3/ Long-term bond spread over German bonds (bp).
4/ Defined as interest payments divided by debt stock (excluding guarantees) at the end of previous year.
5/ Derived as [r - π(1+g) - g + ae(1+r)]/(1+g+π+gπ) times previous period debt ratio, with r = effective nominal interest rate; π = growth rate of GDP deflator; g = real GDP growth rate;
a = share of foreign-currency denominated debt; and e = nominal exchange rate depreciation (measured by increase in local currency value of U.S. dollar).
6/ The real interest rate contribution is derived from the numerator in footnote 5 as r - π (1+g) and the real growth contribution as -g.
7/ The exchange rate contribution is derived from the numerator in footnote 5 as ae(1+r).
8/ Includes asset changes and interest revenues (if any). For projections, includes exchange rate changes during the projection period.
9/ Assumes that key variables (real GDP growth, real interest rate, and other identified debt-creating flows) remain at the level of the last projection year.
-0.5
balance 9/
primary
Debt, Economic and Market Indicators 1/
2004-2012
Actual
Projections
Contribution to Changes in Public Debt
Projections
2004-2012
Actual
debt-stabilizing
-8
-6
-4
-2
0
2
4
6
8
2004 2005 2006 2007 2008 2009 2010 2011 2012 2013 2014 2015 2016 2017 2018 2019 2020
Debt-Creating Flows
Primary deficit Real GDP growth Real interest rate
Exchange rate depreciation Other debt-creating flows Residual
Change in gross public sector debt
projection
(in percent of GDP)
-10
-8
-6
-4
-2
0
2
4
6
cumulative

SWITZERLAND
INTERNATIONAL MONETARY FUND 49
Switzerland: Public DSA – Alternative Scenario
Baseline Scenario 2015 2016 2017 2018 2019 2020 Historical Scenario 2015 2016 2017 2018 2019 2020
Real GDP growth 0.8 1.2 1.5 1.9 1.9 1.9 Real GDP growth 0.8 2.1 2.1 2.1 2.1 2.1
Inflation -1.4 -0.8 0.2 0.5 0.8 0.8 Inflation -1.4 -0.8 0.2 0.5 0.8 0.8
Primary Balance 0.1 0.1 0.1 0.3 0.3 0.3 Primary Balance 0.1 1.0 1.0 1.0 1.0 1.0
Effective interest rate 1.6 1.6 1.6 1.6 1.6 1.6 Effective interest rate 1.6 1.6 1.5 1.5 1.5 1.5
Constant Primary Balance Scenario
Real GDP growth 0.8 1.2 1.5 1.9 1.9 1.9
Inflation -1.4 -0.8 0.2 0.5 0.8 0.8
Primary Balance 0.1 0.1 0.1 0.1 0.1 0.1
Effective interest rate 1.6 1.6 1.6 1.6 1.6 1.6
Source: IMF staff.
Underlying Assumptions(in percent)
Alternative Scenarios
Composition of Public Debt
Baseline Historical Constant Primary Balance
Debt (in
percent of
potential GDP)
0
5
10
15
20
25
30
35
40
45
50
2013 2014 2015 2016 2017 2018 2019 2020
Gross Nominal Public Debt 1/
(in percent of GDP)
projection
0.0
2.0
4.0
6.0
8.0
10.0
12.0
14.0
2013 2014 2015 2016 2017 2018 2019 2020
Public Gross Financing Needs
(in percent of GDP)
projection
0
10
20
30
40
50
60
70
80
2004 2006 2008 2010 2012 2014 2016 2018 2020
By Maturity
Medium and long-term
Short-term
projection
(in percent of GDP)
0
10
20
30
40
50
60
70
80
2004 2006 2008 2010 2012 2014 2016 2018 2020
By Currency
Local currency-denominated
Foreign currency-denominated
projection
(in percent of GDP)

Switzerland: Public DSA – Realism of Baseline Assumptions
SW
ITZ
ER
LAN
D
50
IN
TER
NA
TIO
NA
L MO
NETA
RY F
UN
D

SWITZERLAND
INTERNATIONAL MONETARY FUND 51
Switzerland: Public DSA – Stress Test
Primary Balance Shock 2015 2016 2017 2018 2019 2020 Real GDP Growth Shock 2015 2016 2017 2018 2019 2020
Real GDP growth 0.8 1.2 1.5 1.9 1.9 1.9 Real GDP growth 0.8 -0.6 -0.3 1.9 1.9 1.9
Inflation -1.4 -0.8 0.2 0.5 0.8 0.8 Inflation -1.4 -1.2 -0.3 0.5 0.8 0.8
Primary balance 0.1 -0.3 -0.2 0.3 0.3 0.3 Primary balance 0.1 -0.6 -1.3 0.3 0.3 0.3
Effective interest rate 1.6 1.6 1.6 1.6 1.6 1.6 Effective interest rate 1.6 1.6 1.6 1.6 1.6 1.6
Real Interest Rate Shock Real Exchange Rate Shock
Real GDP growth 0.8 1.2 1.5 1.9 1.9 1.9 Real GDP growth 0.8 1.2 1.5 1.9 1.9 1.9
Inflation -1.4 -0.8 0.2 0.5 0.8 0.8 Inflation -1.4 -0.3 0.2 0.5 0.8 0.8
Primary balance 0.1 0.1 0.1 0.3 0.3 0.3 Primary balance 0.1 0.1 0.1 0.3 0.3 0.3
Effective interest rate 1.6 1.6 1.9 2.1 2.2 2.4 Effective interest rate 1.6 1.6 1.6 1.6 1.6 1.6
Combined Shock
Real GDP growth 0.8 -0.6 -0.3 1.9 1.9 1.9
Inflation -1.4 -1.2 -0.3 0.5 0.8 0.8
Primary balance 0.1 -0.6 -1.3 0.3 0.3 0.3
Effective interest rate 1.6 1.6 1.9 2.1 2.2 2.4
Source: IMF staff.
Macro-Fiscal Stress Tests
Baseline Primary Balance Shock
Real GDP Growth Shock
Real Interest Rate Shock
(in percent)
Real Exchange Rate Shock
Combined Macro-Fiscal Shock
Additional Stress Tests
Baseline
Underlying Assumptions
36
38
40
42
44
46
48
50
2015 2016 2017 2018 2019 2020
Gross Nominal Public Debt(in percent of GDP)
115
120
125
130
135
140
145
150
155
160
2015 2016 2017 2018 2019 2020
Gross Nominal Public Debt
(in percent of Revenue)
0
2
4
6
8
10
12
14
16
2015 2016 2017 2018 2019 2020
Public Gross Financing Needs
(in percent of GDP)

SWITZERLAND
52 INTERNATIONAL MONETARY FUND
Switzerland: Public DSA – Risk Assessment
Switzerland
Source: IMF staff.
1/ The cell is highlighted in green if debt burden benchmark of 85% is not exceeded under the specific shock or baseline, yellow if exceeded under specific shock but not
baseline, red if benchmark is exceeded under baseline, white if stress test is not relevant.
Real Interest
Rate Shock
External
Financing
Requirements
Real GDP
Growth Shock
Heat Map
Upper early warning
Evolution of Predictive Densities of Gross Nominal Public Debt
(in percent of GDP)
Debt profile 3/
Lower early warning
(Indicators vis-à-vis risk assessment benchmarks, in 2014)
Debt Profile Vulnerabilities
Gross financing needs 2/
Debt level 1/ Real GDP
Growth Shock
Primary
Balance Shock
3/ The cell is highlighted in green if country value is less than the lower risk-assessment benchmark, red if country value exceeds the upper risk-assessment benchmark,
yellow if country value is between the lower and upper risk-assessment benchmarks. If data are unavailable or indicator is not relevant, cell is white.
Lower and upper risk-assessment benchmarks are:
Change in the
Share of Short-
Term Debt
Foreign
Currency
Debt
Public Debt
Held by Non-
Residents
Primary
Balance Shock
Real Interest
Rate Shock
Exchange Rate
Shock
Contingent
Liability Shock
Exchange Rate
Shock
Contingent
Liability shock
5/ External financing requirement is defined as the sum of current account deficit, amortization of medium and long-term total external debt, and short-term total external
debt at the end of previous period.
4/ Long-term bond spread over German bonds (bp), an average over the last 3 months, 15-Jan-15 through 15-Apr-15.
2/ The cell is highlighted in green if gross financing needs benchmark of 20% is not exceeded under the specific shock or baseline, yellow if exceeded under specific shock
but not baseline, red if benchmark is exceeded under baseline, white if stress test is not relevant.
400 and 600 basis points for bond spreads; 17 and 25 percent of GDP for external financing requirement; 1 and 1.5 percent for change in the share of short-term debt; 30
and 45 percent for the public debt held by non-residents.
Market
Perception
1 2
Not applicable
for Switzerland
400
600
-35
bp
1 2
17
25
-7%1 2
1
1.5
-
3.6%
1 2
Bond spreadExternal Financing
Requirement
Annual Change in
Short-Term Public
Debt
Public Debt in
Foreign Currency
(in basis points) 4/ (in percent of GDP) 5/ (in percent of total) (in percent of total)
0
10
20
30
40
50
60
2013 2014 2015 2016 2017 2018 2019 2020
10th-25th 25th-75th 75th-90thPercentiles:Baseline
Symmetric Distribution
0
10
20
30
40
50
60
2013 2014 2015 2016 2017 2018 2019 2020
Restricted (Asymmetric) Distribution
0 is the max positive growth rate shock (percent)
0 is the max negative interest rate shock (percent)
0 is the max positive pb shock (percent GDP)
no restriction on the exchange rate shock
Restrictions on upside shocks:
30
45
13%
1 2
Public Debt Held
by Non-Residents
(in percent of total)

SWITZERLAND
INTERNATIONAL MONETARY FUND 53
Annex IV. Switzerland: FSAP Update—Status of Key
Recommendations
Recommendation Actions taken by the authorities
Short term
Impose a leverage ratio on banks
that is tougher than international
minima.
In December, 2014, the final report of the “Group of Experts on the Further
Development of the Financial Market Strategy,” appointed by the Federal
Council and led by Professor Aymo Brunetti, was released. It has
recommendations for modifying the current Swiss Too-Big-To-Fail
framework, including that Switzerland should be among the leading
countries in terms of going-concern capital requirements based on both
risk-weighted requirements and the leverage ratio. In February 2015, the
Federal Council expressed its support for the recommendations and has
instructed the FDF to submit proposals for necessary legal adjustments by
end-2015.
Remain alert to the build-up of
risks in domestic real estate and
mortgage markets. Fully enforce
self-regulation, and consider
further raising the countercyclical
capital buffer and introducing
additional tools (e.g., debt-to-
income (DTI) and loan-to-value
(LTV) limits).
FINMA and the SNB closely monitor real estate and mortgage market
developments and are still concerned about imbalances, notwithstanding a
slowdown in both real-estate price and mortgage growth. The authorities
are enforcing self-regulations and have taken the following new measures,
implemented since September 2014: stricter (i) amortization requirements;
(ii) use of second incomes for financial sustainability evaluation; and
(iii) valuation of properties for mortgages. There are currently no plans to
introduce new macroprudential tools.
Bring Financial Market
Infrastructures (FMIs) into
compliance with new international
principles and establish crisis
management arrangements
between the authorities of FMIs.
The CPMI-IOSCO Principles for Financial Market Infrastructures (PFMIs)
have been transferred into national law for central counterparties, payment
systems and central securities depositories as well as securities settlement
systems by revising the requirements for such FMIs in the National Bank
Ordinance (NBO).
For trade repositories, the international principles will be transferred into
national law in the new Financial Market Infrastructures Act, which is
currently in Parliament and is expected to enter into force at the earliest at
the beginning of 2016.
Crisis management will also be strengthened as the new Financial Market
Infrastructure Act is completed and implemented by the Financial Market
Infrastructure Ordinance. FINMA and the SNB intend to identify and
implement the arrangements needed to ensure effective coordination and
cooperation between the authorities and with FMIs for FMI-specific crisis
scenarios.
Establish transparency in the
financial sector as a core element
of the Swiss “brand,” in particular
through heightening banks’
disclosure requirements, including
as regards capital weighting and
providing data for adequate risk
analysis.
A FINMA circular (2008/22) is being revised to reflect the revised pillar 3
disclosure requirements. This circular has previously been updated to
comply with Basel Committee on Banking Supervision requirements
regarding: a) composition of capital disclosure, b) leverage ratio framework
and disclosure; and c) liquidity coverage ratio disclosure standards.
The two Swiss big banks have increased transparency related to model-
based RWA in line with the recommendations of the Enhanced Disclosure
Task Force (a private sector initiative). For example, both institutions

SWITZERLAND
54 INTERNATIONAL MONETARY FUND
recently started to disclose changes in their RWA, broken down by cause,
including reductions attributable to model adjustments. There is no
information for the period between 2009 and 2012, during which large
decreases in the big banks’ RWA occurred.
In addition, Swiss accounting rules for banks were revised in 2014,
providing the authorities with the opportunity to require more information,
especially in the notes to the financial statements.
Overhaul the deposit insurance
scheme: make its provisions more
transparent; reform its
governance; and build-up
dedicated ex ante funding with a
back-up line of support. Make
deposit insurance funds available
to finance resolution measures on
a least-cost basis.
On December 5, 2014, the Federal Council took due note of the final
Brunetti Report, which includes several recommendations largely in keeping
with the FSAP recommendations, including transparency, governance
reform in line with international standards, shorter payout period (20 to 7
working days), and ex ante funding.
The Federal Council will decide on how to proceed with the expert group's
recommendations at a later date.
There is no proposal to make deposit insurance funds available to finance
resolution measures on a least-cost basis, however.
Issue guidance on the cantonal
banks’ governance, based on their
best practice, including reducing
political interconnectedness. Issue
guidance on guarantees for
cantonal banks, to enhance
transparency and create a level
playing field both across the
cantonal banks and with the rest
of the banking sector.
A full revision of the primary reference for governance issues (FINMA
Circular 2008/24 “Supervision and Internal Control—Banks”) is planned for
2015, with particular focus on the latest international developments in this
area. More concise formulation of qualification criteria for board members
and a bank’s risk governance framework will also be considered.
FINMA reports that governance issues are given considerable weight in its
ongoing supervision of big and middle-sized banks, including cantonal
banks. Qualification and composition of the supreme governing body as a
whole are periodically challenged at the regular supervisory dialogue with
the banks.
All the cantonal banks, except one, now have a majority of independent
board members as set out in FINMA Circular 08/24.
No explicit guidance on guarantees for cantonal banks is planned or likely
to occur in the near future.
Ensure that the likely consolidation
among the private banks in
response to U.S. tax pressures
proceeds smoothly.
In 2014, the consolidation process for private banks continued. Five private
banks ceased their business and were released from FINMA’s supervision.
One private bank was merged with another firm. One private bank was
liquidated and another one is still in the process of liquidation. These
transactions proceeded smoothly, except in one case unrelated to U.S. tax
pressures. So far, the extent of problems in smaller Swiss private banks
appears to have been more limited than feared.
Issue guidance to auditors to
ensure consistency of supervision,
and undertake more “deep dives”
into particular areas of concern.
Increase the intensity of onsite
supervision, including of middle-
sized and smaller banks.
In 2013, FINMA established Circular 2013/3 focusing on prudential audits
performed by external auditors. This text is being implemented and
supplemented by templates and instructions concerning risk analysis, audit
strategy and form and content of long-form audit reports. FINMA has
furthermore decided to issue detailed guidance describing how to audit
each regulatory audit field. The circular provides the possibility to mandate
experts or audit firms that are not in charge of the ordinary audit to
investigate a special field, and FINMA uses this option.
FINMA has intensified its direct supervisory activities over recent years, in
particular through internal analytical work and on-site inspections. FINMA
is currently examining the possibility to redirect some resources in order to

SWITZERLAND
INTERNATIONAL MONETARY FUND 55
further strengthen these supervisory activities.
The Federal Council adopted a report on December 20, 2014, which
concludes that there is no fundamental need for institutional reform.
However, it identified certain areas for improvement, including (i) FINMA to
further develop their own monitoring activities, notably by enhancing their
analytical work and increased on-site inspections; (ii) FINMA to ensure that
institutions with comparable activities and risks are supervised consistently;
(iii) FINMA to use their human resources according to the importance of
the individual areas of supervision.
The Federal Council will decide on how to proceed with the expert group's
recommendations at a later date.
Short to medium term
Increase FINMA’s resources so it
can carry out its agenda for
supervisory enhancement. The
resource pool for highly qualified
staff could be expanded.
There are no plans to increase FINMA’s resources, as the authorities do not
share the view that additional resources are needed.
Medium term
Reach agreement with partner
supervisors as to the resolution of
the country’s G-SIFIs.
FINMA reports that it has reached a consensus on the resolution strategy of
its G-SIBs with the Crisis Management Group (CMG) of both G-SIBs and is
currently concluding cooperation agreements on crisis management of the
Swiss G-SIBs between the CMG members. Detailed implementation of the
agreements still needs to be defined and agreed upon.
Make available the full range of
best practice resolution powers to
handle any bank deemed systemic
at the time.
No changes made to directly address the FSAP recommendation. The
authorities plan to amend the banking act to provide a statutory basis for
FINMA bail-in powers and grant it resolution powers for holding companies
and non-operational entities.
Monitor closely the condition of
the life insurance firms in advance
of the prospective elimination of
the palliative measures protecting
the companies from the effects of
low interest rates, and enhance
public understanding of the Swiss
Solvency Test.
Life insurers are monitored closely. For 2014, FINMA expects that the
effects of the palliative measures have been smaller compared to previous
years. FINMA engages in the exchange of information on Swiss Solvency
Test-related topics with regulators and supervisors in other jurisdictions
(e.g., EIOPA, BaFin). In addition, FINMA representatives give presentations
about the Swiss Solvency Test, both in Switzerland and abroad.
Prioritize regulatory reform of
securities markets, to bring
arrangements up to international
standards. Enhance focus on
conduct of business supervision of
banks and securities dealers.
The Federal Council has taken note of the results of the consultation on the
Financial Services Act (FinSA) and the Financial Institutions Act (FinIA) and
instructed the FDF to carry out various adjustments. The aim is to upgrade
the quality of the services provided by Swiss financial institutions and to
improve client protection, while at the same time, bring regulations in line
with international standards and equivalent to EU regulation. The FinSA,
inter alia, governs financial institutions’ relationship with their clients with
regard to the most important financial products, and harmonizes the
associated code of conduct. The FinIA brings together various existing laws
on the supervision of financial institutions that operate an asset
management business in any form in a new piece of legislation.
The new Financial Market Infrastructure Act, currently in parliament,

SWITZERLAND
56 INTERNATIONAL MONETARY FUND
governs the organization and operation of financial market infrastructure.
The provisions that are currently dispersed in various federal acts will be
combined in a single law aligned with market developments and
international requirements.
Pursue legislation to improve
policyholder protection, enhance
brokers’ supervision, and increase
the level of public disclosure.
In March 2015, a revision of the Insurance Supervisory Ordinance went into
force. This includes improvements of policyholder protection, increased
public disclosure of insurance companies, and the supervision of insurance
brokers.
Policyholder protection is intended to be enhanced by: (i) applying the
Swiss Solvency Test also to reinsurance captives and (ii) increasing the
qualitative requirements, such as additional requirements on organization
and corporate governance. In particular, insurers are required to have
independent risk management and compliance functions. In addition, the
Own Risk and Solvency Assessment (ORSA) has been assembled in a
dedicated section. Parts of these requirements existed until now as a
collection of individual items. For liquidity of insurers, existing qualitative
requirements are complemented with quantitative requirements, which
FINMA has been tasked to further specify.
Public reporting requirements of insurers are increased by requiring
insurers to publicly report on their activities, profits, risk management, risk
profile, methods for technical provisions, capital management, and
solvability. This obligation will be synchronized with the application of the
public disclosure requirements in the European Union. FINMA is to further
elaborate the specifications.
The supervision of insurance brokers is enhanced by the obligation to
report to FINMA items from criminal records, if they are related to certain
criminal actions.

SWITZERLAND
INTERNATIONAL MONETARY FUND 57
Annex V. Switzerland: Authorities’ Response to Past IMF Policy
Recommendations
IMF 2014 Article IV Recommendations Authorities’ Response
Monetary and Exchange Rate Policies
Monetary conditions should remain expansionary and
the exchange rate floor should remain in place.
The SNB has maintained an expansionary monetary
policy stance with the policy rate reduced to
-0.75 percent. However, in early 2015, the SNB had to
intervene heavily to maintain the exchange rate floor
against the euro. At the same time, depreciation
against the dollar reduced the likelihood of franc
overvaluation. In this context, the SNB judged that the
franc needed more flexibility and that, with this change
in conditions, the costs of maintaining the floor were
no longer worth the benefits, resulting in an exit from
the floor on January 15, 2015.
Negative interest rates on banks’ excess reserves may
need to be introduced in case of renewed strong
pressures on the franc.
Implemented.
Provisions need to be strengthened to bring SNB
capital in line with risks.
The SNB built up provisions for currency reserves in
2014.
Housing Market Policies
Discourage vulnerable households from taking on
too much mortgage debt.
Existing self-regulation measures should be
tightened, for example to speed up loan
amortization.
Curb mortgage growth in the buy-to let segment.
Stricter direct regulation may be necessary, including
mandatory affordability caps and maximum loan-to
value ratios.
Phase out tax incentives that encourage borrowing to
finance home buying.
The authorities are enforcing self-regulations and have
taken new measures, implemented since September
2014: (i) stricter amortization requirements; (ii) stricter
use of second income for financial sustainability
evaluation; and (iii) stricter valuation requirements for
residential real estate. There are currently no
immediate plans to introduce new macroprudential
tools, though the authorities are continuously
assessing whether further action is needed.
Structural and Fiscal Policies
Address the challenges of an aging population. The government submitted the Pension 2020 reform
package to the parliament.
A rapid resolution of uncertainty related to future
immigration policy.
In progress.

SWITZERLAND
58 INTERNATIONAL MONETARY FUND
Financial Sector Policies
Press the large banks to continue efforts to rapidly
bring their leverage ratios into line with those of other
major international banks, ensure an ambitious
minimum leverage ratio requirement, and improve
transparency as regards risk weights.
The Federal Council expressed its support for the
recommendations of the Brunetti Report, which
includes that Switzerland should be among the leading
countries in terms of going-concern capital
requirements based on both risk-weighted
requirements and the leverage ratio, and instructed the
FDF to submit proposals for necessary legal
adjustments by end-2015. The authorities are adopting
international standards related to increased disclosure
of risk weights and involved in international initiatives
to strengthen standards further.
Continue discussions with international counterparts to
reach agreement on measures to make the large banks
resolvable without public sector support.
FINMA reports that it has reached a consensus on the
resolution strategy of its G-SIBs with the Crisis
Management Group (CMG) of both G-SIBs and is
currently concluding cooperation agreements on crisis
management of the Swiss G-SIBs between the CMG
members.
Increase resources available to FINMA for banking
supervision, in particular so it can extend its intensive
supervision in the sector beyond the largest banks.
FINMA reports that it has intensified its direct
supervisory activities, including on-site inspections, and
resources will be redirected to further strengthen these
supervisory activities. They do not see a need for
substantially increased resources.
Refine FINMA’s use of external auditors for onsite
supervision of the banks, including through periodic
rotation of auditing firms, ensuring auditors are paid
from a FINMA-managed bank-financed fund, and
providing more guidance on their supervisory focus.
In 2013, FINMA established Circular 2013/3 focusing
on prudential audits performed by external auditors.
This text is being implemented and supplemented by
templates and instructions concerning risk analysis,
audit strategy, and form and content of long-form
audit reports. FINMA has furthermore decided to issue
detailed guidance describing how to audit each
regulatory audit field.
Overhaul the deposit insurance scheme to bring it into
line with emerging international best practices and the
schemes being established in the region. This involves
greater transparency to depositors on coverage
conditions, commitment to faster payouts, ex ante
financing in a dedicated fund, and the fund to have
powers to take action other than bank closure when
there is a cheaper alternative.
The Federal Council took note of the recommendations
of the Brunetti Report on this issue, which includes
several recommendations largely in keeping with the
FSAP recommendations, including transparency,
governance reform in line with international standards,
shorter payout period, and ex ante funding. The
Federal Council will decide on how to proceed with the
recommendations at a later date. There is no proposal
to make deposit insurance funds available to finance
resolution measures on a least-cost basis.

SWITZERLAND
STAFF REPORT FOR THE 2015 ARTICLE IV
CONSULTATION—INFORMATIONAL ANNEX
Prepared By
European Department
FUND RELATIONS _______________________________________________________________________ 2
STATISTICAL ISSUES ____________________________________________________________________ 4
CONTENTS
May 4, 2015
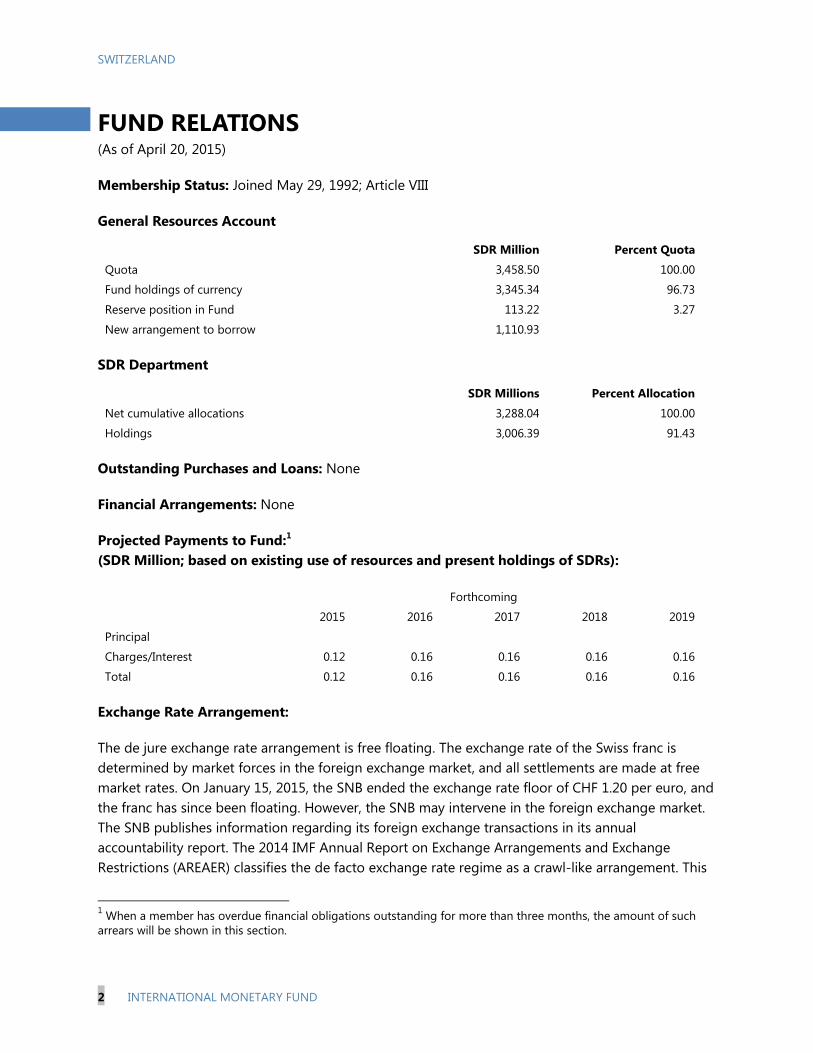
SWITZERLAND
2 INTERNATIONAL MONETARY FUND
FUND RELATIONS (As of April 20, 2015)
Membership Status: Joined May 29, 1992; Article VIII
General Resources Account
SDR Million Percent Quota
Quota 3,458.50 100.00
Fund holdings of currency 3,345.34 96.73
Reserve position in Fund 113.22 3.27
New arrangement to borrow 1,110.93
SDR Department
SDR Millions Percent Allocation
Net cumulative allocations 3,288.04 100.00
Holdings 3,006.39 91.43
Outstanding Purchases and Loans: None
Financial Arrangements: None
Projected Payments to Fund:1
(SDR Million; based on existing use of resources and present holdings of SDRs):
Forthcoming
2015 2016 2017 2018 2019
Principal
Charges/Interest 0.12 0.16 0.16 0.16 0.16
Total 0.12 0.16 0.16 0.16 0.16
Exchange Rate Arrangement:
The de jure exchange rate arrangement is free floating. The exchange rate of the Swiss franc is
determined by market forces in the foreign exchange market, and all settlements are made at free
market rates. On January 15, 2015, the SNB ended the exchange rate floor of CHF 1.20 per euro, and
the franc has since been floating. However, the SNB may intervene in the foreign exchange market.
The SNB publishes information regarding its foreign exchange transactions in its annual
accountability report. The 2014 IMF Annual Report on Exchange Arrangements and Exchange
Restrictions (AREAER) classifies the de facto exchange rate regime as a crawl-like arrangement. This
1 When a member has overdue financial obligations outstanding for more than three months, the amount of such
arrears will be shown in this section.

SWITZERLAND
INTERNATIONAL MONETARY FUND 3
classification does not take into account the exit from the exchange rate floor in January 2015; the
implications of this move for the de facto classification will be assessed in the context of the 2015
AREAR.
Switzerland has accepted the obligations of Article VIII, Sections 2, 3, and 4, and maintains a system
free of restrictions on the making of payments and transfers for current international transactions
except for restrictions in place for security reasons notified to the Fund pursuant to Decision No.
144-(52/51).
On April 30, 2014, Switzerland notified the IMF of the exchange restrictions that have been imposed
against certain countries, individuals, and entities, in accordance with relevant UN Security Council
resolutions and EU regulations.
Latest Article IV Consultation: The last Article IV consultation was concluded on April 30, 2014,
with the staff report published on May 28, 2014. Switzerland is on the standard 12-month
consultation cycle.
Technical Assistance: None
Resident Representatives: None
Financial System Stability Assessment Update and ROSCs:
A Financial System Stability Assessment Update was conducted in 2013–14, and the report was
issued on May 28, 2014.
Reports on the Observance of Standards and Codes (Basel core principles, IAIS core principles,
and IOSCO objectives and principles) were conducted in 2013–14, and the report was issued on
May 28, 2014.

SWITZERLAND
4 INTERNATIONAL MONETARY FUND
STATISTICAL ISSUES
Switzerland’s economic and financial statistics are adequate for surveillance purposes.
Switzerland publishes timely economic statistics and posts most of the data and the underlying
documentation on the internet. In June 1996, Switzerland subscribed to the Fund’s Special Data
Dissemination Standard (SDDS), and its metadata are posted on the Dissemination Standards
Bulletin Board. Switzerland is in full observance of SDDS requirements, and it is availing itself of the
SDDS’s flexibility options on dissemination of production index data (for periodicity and timeliness)
and of wages and earnings data (for periodicity). The Swiss Federal Council has come out in favor of
Switzerland participating in the IMF’s new, extended statistical standard SDDS Plus. Implementing
the requirements of SDDS Plus in Switzerland—a task in which an interagency working group (SIF,
SNB, FSO, FFA, FSIO, SECO, and FINMA) plays an active role—will take several years. A number of
statistical gaps and deficiencies remain, mainly reflecting a lack of resources and the limited
authority of the Federal Statistical Office (FSO) to request information. More specifically:
general government finance statistics are finalized with considerable lags, mainly due to delays
in compiling fiscal accounts at the level of cantons and communes;
pension statistics are published with a long lag;
GDP by industry are published with a considerable lag.
To address deficiencies, the authorities are taking or intend to take the following steps:
Progress has been made in the area of balance of payments (BOP) statistics. In 2013, the
content-related revision of surveys in connection with financial flows (investment BOP) was
completed. Reporting institutions have reported data according to the new concept for the first time
for 2014 Q3. The new surveys aim, among other things, to meet the requirements of the bilateral
statistical agreement between Switzerland and the EU. This means in particular that more details on
the breakdown of financial flows by country will be collected. Since 2014, the BOP and international
investment position data have been published based on the sixth edition of the IMF’s Balance of
Payments Manual (BPM6). To ensure that new and old data are comparable and to ensure that data
users have long data series at their disposal, the SNB formally reclassified the old data series in line
with BPM6.
Switzerland has continued to provide data on Financial Soundness Indicators (FSIs) and
participated in the 2009 Coordinated Direct Investment Survey. The data and metadata have
been posted on the IMF website. Both the SNB and FINMA have continued to transmit FSB Data
Gaps related data to the central data hub hosted by the BIS and have continued their preparatory
work for phase 3 of the project. In the area of cashless payment transactions, the various surveys
have been thoroughly revised. The prime aim of the revision was to enable a full reflection of the
technological innovations of the past few years in the area of cashless payment transactions.
Reporting institutions have reported data according to the revised surveys for the first time as of
December 31, 2014 (reference date).

SWITZERLAND
INTERNATIONAL MONETARY FUND 5
The FSO has taken various steps in 2014 to improve core business statistics. In September 2014,
national accounts results were published for the first time according to the 2008 version of the
System of National Accounts (SNA 2008). This enabled users to have internationally comparable
data with a timing that was tightly coordinated with Switzerland’s European partners. Given the
importance of R&D in Switzerland, the impact was quite high in terms of GDP level, but moderate in
terms of dynamics. For 2015, the FSO plans to publish new data on jobs, which will be in line with
the concepts of the business census introduced in the last quarter of 2012. In addition, a project was
initiated to produce prices on real estate transactions. First results are expected in 2017 and will
assist monitoring of the housing market.

SWITZERLAND
6 INTERNATIONAL MONETARY FUND
Table of Common Indicators Required for Surveillance
(As of April 31, 2015)
Date of
Latest
Observation
Date
Received
Frequency
of
Data6
Frequency
of
Reporting6
Frequency
of
Publication6
Exchange Rates Same day Same day D and M M and M D and M
International Reserve Assets and Reserve Liabilities
of the Monetary Authorities1
Feb 15 Mar 15 M M M
Reserve/Base Money Mar 15 Apr 15 M M M
Broad Money Mar 15 Apr 15 M M M
Central Bank Balance Sheet Mar 15 Apr 15 M M M
Consolidated Balance Sheet of the Banking System Feb 15 Apr 15 M M M
Interest Rates2
Same day Same day D and M M and M D and M
Consumer Price Index Mar 15 Apr 15 M M M
Revenue, Expenditure, Balance and Composition of
Financing – General Government3,4
2012 Feb 15 A A A
Revenue, Expenditure, Balance and Composition of
Financing – Central Government
3
Feb 15 Mar 15 M M M
Stocks of Central Government and Central
Government-Guaranteed Debt5
Q4/14 Feb 15 Q Q Q
External Current Account Balance Q4/14 Mar 15 Q Q Q
Net International Investment Position Q4/14 Mar 15 Q Q Q
Exports and Imports of Goods and Services Feb 15 Mar 15 M M M
GDP/GNP Q4/14 Mar 15 Q Q Q
Gross External Debt
Q4/14 Mar 15 Q Q Q
1 Includes reserve assets pledged or otherwise encumbered as well as net derivative positions.
2 Both market-based and officially-determined, including discount rates, money market rates, rates on treasury bills, notes
and bonds.
3 Foreign, domestic bank, and domestic non-bank financing.
4 The general government consists of the central government (budgetary funds, extra budgetary funds, and social security
funds) and state and local governments.
5 Including currency and maturity composition.
6 Daily (D), Weekly (W), Monthly (M), Quarterly (Q), Annually (A); Irregular (I); and Not Available (NA)

Press Release No. 15/xx
FOR IMMEDIATE RELEASE
May […], 2015
IMF Executive Board Concludes 2015 Article IV Consultation with Switzerland
On May 18, 2015, the Executive Board of the International Monetary Fund (IMF) concluded the
Article IV consultation1 with Switzerland.
Switzerland’s economy has performed relatively well in the aftermath of the global financial
crisis, with growth reaching 2 percent in 2014. However, the economic environment became
more complicated in late 2014, as increased capital inflows forced the Swiss National Bank
(SNB) to start intervening heavily to defend its exchange rate floor of 1.20 francs per euro. The
SNB eventually exited the floor on January 15, 2015, while also cutting its policy rate (the
interest rate on deposits at the SNB exceeding 20 times required reserves) to -0.75 percent.
Following these moves, the exchange rate appreciated substantially before stabilizing at around
1.05 francs per euro.
In the near term, economic growth in Switzerland is likely to slow, as the strong franc, which is
now likely overvalued, reduces net exports. Consistent with this view, leading economic
indicators have declined so far in 2015. For the full year, GDP growth is projected to slow to
about ¾ percent and to about 1¼ percent in 2016. This growth slowdown is expected to increase
unemployment, but only modestly, in part due to the cushioning effects of short-time work
arrangements. Inflation, which is already very low at -1.1 percent as of April 2015, is expected to
fall further in 2015, as the effects from exchange rate appreciation and the recent decline in oil
prices continue to pass through into final prices.
Over the medium term, the economy is expected to recover gradually. As the economy adjusts to
the exchange rate appreciation, growth is projected to rise gradually back to around 2 percent
over the medium term while inflation increases to around 1 percent. Switzerland’s fiscal rules are
expected to keep the structural fiscal deficit near zero and government debt low.
1 Under Article IV of the IMF's Articles of Agreement, the IMF holds bilateral discussions with members, usually
every year. A staff team visits the country, collects economic and financial information, and discusses with officials
the country's economic developments and policies. On return to headquarters, the staff prepares a report, which
forms the basis for discussion by the Executive Board.
International Monetary Fund
700 19th
Street, NW
Washington, D. C. 20431 USA

2
However, this central scenario is subject to important risks. One key risk is that very low levels
of inflation may complicate the operation of monetary policy by making it more difficult to
reduce real interest rates as necessary in response to shocks. Indeed, yields on 10-year
government bonds are negative and the lowest in the world, indicating significant risks of a
protracted period of very low inflation and sluggish growth. Other important risks include
uncertainty about future immigration policy and its effects on EU relations, global and regional
economic developments, the effects of ongoing changes in the international financial regulatory
landscape, and the potential for price reversals in the housing market, which has been buoyant in
recent years.
To help address risks and medium-term challenges, the authorities have recently undertaken or
proposed a numbers of reforms. These include various financial sector reforms (e.g., adoption of
tighter lending standards for mortgages), proposed reforms to bolster the sustainability of the
pension system, and proposed reforms of corporate taxation and financial controls to help
comply with international initiatives aimed at limiting money laundering and cross-border tax
evasion and avoidance.
Executive Board Assessment2
Executive Directors commended Switzerland's continued strong economic fundamentals
underpinned by sound policy management. Directors noted, however, that following the exit
from the exchange rate floor earlier this year and the subsequent appreciation of the franc, the
economy faces currency overvaluation and weakened near-term growth and low inflation
prospects.
Directors agreed that further monetary easing would support growth and reduce exchange
rate overvaluation. In addition, they noted that moving inflation closer to the upper end of the
target range over the medium term could mitigate risks associated with low inflation. However, a
number of Directors considered that controlling inflation to this extent may not be feasible for
the small and open Swiss economy.
Given the limited room for conventional monetary easing, Directors saw need to explore
various options. In this regard a pre-announced program for asset purchases could be an option,
although many Directors were not convinced about the effectiveness of such a program at this
juncture. Looking ahead, Directors agreed that the policy rate should be maintained at its current
level for now, as this has been helpful in reducing deflationary pressures. More broadly, they
encouraged the central bank to further enhance communication of its monetary policy framework
and to continue to prioritize provisioning over transfers to its distribution reserve to ensure that
its capital remains in line with risks.
2 At the conclusion of the discussion, the Managing Director, as Chairman of the Board, summarizes the views of
Executive Directors, and this summary is transmitted to the country's authorities. An explanation of any qualifiers
used in summing up can be found here: http://www.imf.org/external/np/sec/misc/qualifiers.htm.

3
Directors commended Switzerland’s fiscal rule which has helped maintain low deficits
and debt. They concurred that for fiscal policy to support growth, automatic stabilizers should be
allowed to operate fully, as permitted under Switzerland’s debt-brake rule, while avoiding
budgeting over-performance against the rule. Directors generally agreed that in the event of a
severe or protracted recession, discretionary fiscal stimulus could be employed by triggering the
rule’s temporary escape clause to help boost growth and inflation and avoid overburdening
monetary policy.
Directors welcomed the progress made in financial sector reforms and encouraged further
action in line with the Brunetti Report and the FSAP update. They highlighted the need to
closely monitor financial stability risks in the housing market and adopt further prudential
measures as needed. These could include raising minimum leverage ratio requirements of the
two large international banks and improving their resolvability, increasing banks’ disclosure of
information of risk weights, further refining FINMA’s use of external auditors, and overhauling
deposit insurance. Directors also called for continued monitoring of the effects of the
low-interest rate environment, especially for life insurers and defined-benefit pension plans.
Directors underscored the need to sustain structural reforms to support medium-term
growth and address challenges. In this regard, they called for action to reduce uncertainty related
to future immigration policy and its effect on relations with the European Union. Directors
looked forward to the timely completion of the corporate tax reforms and financial controls,
consistent with international initiatives aimed at limiting money laundering and cross-border tax
evasion and avoidance. Reforms to boost full-time female labor force participation, such as
lowering marginal tax rates on second incomes, could also enhance potential growth. Directors
welcomed the proposed pension reforms, which would help ensure the sustainability of the social
safety net and its continued availability for future generations.

4
Switzerland: Selected Economic Indicators, 2012–16
2012 2013 2014 2015 2016
Real GDP (percent change) 1.1 1.9 2.0 0.8 1.2
Total domestic demand -1.2 -0.8 1.7 2.5 1.8
Final domestic demand 2.7 2.0 1.2 2.0 1.5
Private consumption 2.8 2.2 1.0 2.5 2.0
Public consumption 2.9 1.4 1.1 1.8 1.2
Gross fixed investment 2.5 1.8 1.8 1.0 0.5
Inventory accumulation 1/ -3.5 -2.5 0.4 0.4 0.2
Foreign balance 1/ 2.2 2.7 0.5 -1.4 -0.4
Nominal GDP (billions of Swiss francs) 624.4 635.7 651.8 648.2 651.1
Savings and investment (percent of GDP)
Gross national saving 34.1 33.2 30.5 28.6 28.5
Gross domestic investment 24.2 22.5 23.6 22.8 22.9
Current account balance 9.9 10.7 7.0 5.8 5.6
Prices (percent change)
GDP deflator -0.2 -0.1 0.5 -1.4 -0.8
Consumer price index (period average) -0.7 -0.2 0.0 -1.1 -0.4
Consumer price index (end of period) -0.4 0.1 -0.3 -1.4 0.3
General government finances (percent of GDP)
Revenue 31.3 31.3 31.3 31.3 31.3
Expenditure 31.4 31.5 31.1 31.6 31.6
Balance -0.1 -0.1 0.2 -0.3 -0.3
Cyclically adjusted balance 0.2 0.1 0.3 0.0 0.0
Gross debt 2/ 48.2 47.0 46.1 46.1 45.6
Employment and slack measures
Unemployment rate (percent) 2.9 3.2 3.2 3.4 3.6
Output gap (percent of potential GDP) -1.0 -0.7 -0.2 -0.9 -0.9
Capacity utilization 81.5 80.7 82.0 … …
Potential output growth 1.7 1.7 1.5 1.5 1.3
Exchange rates (levels)
Swiss francs per USD (annual average) 0.9 0.9 0.9 … …
Swiss francs per euro (annual average) 1.2 1.2 1.2 … …
Real effective rate (avg., 2000=100) 3/ 114.0 114.0 116.0 … …
Sources: Haver Analytics; IMF's Information Notice System; Swiss National Bank; and IMF staff estimates.
1/ Contribution to growth.
2/ Unconsolidated and reflects GFSM 2001 methodology, which values debt at market prices.
3/ Based on relative consumer prices.

Statement by Messers. Daniel Heller, Executive Director for Switzerland, and Marco Cavaliere, Senior Advisor to the Executive Director
May 18, 2015
General On behalf of the Swiss authorities, we would like to thank staff for presenting a helpful report and for their candid policy recommendations. The report includes a thorough and insightful analysis of the macroeconomic situation. Moreover, it adds considerable value to the domestic policy discussions in Switzerland. In most aspects, we share staff's opinion on the challenges going forward.
Outlook Staff's outlook for the Swiss economy is well in line with our authorities’ latest forecast, which was done in March 2015. We are slightly more optimistic than the Fund regarding growth prospects for 2016, as our forecast relies on a firming recovery in export sectors. We fully share staff’s risk assessment.
Monetary and exchange rate policy The Swiss National Bank (SNB) shares staff’s view that monetary conditions are too tight, given the overvaluation of the Swiss Franc. The SNB will therefore remain active in the foreign exchange market, as necessary, in order to influence monetary conditions. Regarding a preannounced program of foreign purchases, this might be one of the policy options. However, the effectiveness of such a policy should not be overestimated. As the recent experience suggests, the quantity of foreign assets to be purchased would presumably need to be fairly high to have a meaningful effect on the exchange rate. Moreover, this would expand the balance sheet at a pace that might limit the flexibility of monetary policy in the future. As it regards moving inflation back near the upper end of the target range (i.e., closer to 2 percent) over the medium term, the SNB’s view is that it is not possible, in a small open economy like Switzerland, to fine-tune inflation to such an extent. Announcing a narrow target would suggest that the SNB has better control of inflation than it actually does.
Fiscal policy We agree with staff that both the debt brake rule at the federal level as well as the different fiscal rules at the cantonal level have largely contributed to the success of fiscal policy in recent years. According to our latest estimates, the general government should record a small deficit amounting to 0.1 percent of GDP in 2014. This nearly balanced result, which was reached in an increasingly difficult environment, underscores the decisive efforts at all government levels to keep fiscal policy on a sustainable path. In moving forward, we remain committed to the fiscal strategy of (i) complying with the requirements of the debt brake rule in the short and medium-term and (ii) maintaining expenditure growth at a sustainable level. At the same time, we are aware that economic indicators for Switzerland have recently worsened, pointing to a slowdown in growth. We share staff's opinion that in this situation allowing automatic stabilizers to operate freely is the best way forward. Discretionary stabilization measures should remain an option only in case of a severe recession.

2
External assessment We welcome the very helpful analysis of the factors underlying Switzerland's large current account surplus. As rightly noted by staff, several special factors, such as (i) the treatment of retained earnings of multinational corporations, (ii) merchanting activities, and (iii) financial services, are important to understand the level and movement of the Swiss current account. It should be also noted that merchanting activities are not the only key driver of the goods balance surplus. In fact, the pharmaceutical and chemical export industry, which is not mentioned in the report, makes an even larger contribution, by accounting for more than 40 percent of total exports in goods.
Pension reform We welcome staff's recommendation to go forward with the comprehensive pension reform package prepared by the government. We also take note of the recommendation to reduce the minimum guaranteed interest rate on invested assets for second pillar pension funds. In this regard, we would like to note that our authorities review this minimum interest rate every year and acts, on the recommendation of a commission of external experts, to ensure an adequate level of objectivity, reliability, and transparency. The criteria considered include, among others, movements in equities, bonds, and real estate. Thus, the average yield of 10- year Swiss government bonds is not the key reference for setting the aforementioned minimum interest rate, as the staff’s report might suggest. The last review of the rate in October 2014 did not give grounds for a rate reduction. In fact, while the yield on Swiss government bonds remained low, other asset classes including real estate posted good performances. The next review will take place in autumn 2015.
Financial sector policies We generally agree with staff’s assessment and recommendations on Swiss financial sector policies. We would like to provide comments in these three key areas.
Large banks We welcome staff’s support for the recommendations in the “Brunetti Report,” especially regarding the need to raise leverage ratio requirements for large banks to levels that are internationally leading. We agree that while these banks are well capitalized relative to peers in terms of risk weighted capital ratios, their leverage ratios are below the average of other major banks. We also share staff’s view that improvements in risk weighted assets (RWA) transparency are needed. To address these and other issues, a working group led by the Federal Department of Finance is reviewing the Too-Big-To-Fail framework and will make concrete proposals by end-2015, taking into account the finalization of an international standard on Total Loss-Absorbing Capacity (TLAC) for global systemic banks. This group has a mandate, in particular, to recalibrate risk weighted and leverage ratio requirements so that they are internationally leading and to review the method of calculating RWA and propose adjustments, if necessary. Finally, we share staff’s view that, while the large banks have announced important steps to adapt their legal structure, continued action, including at international level, is needed to further improve their resolvability.
Housing and mortgage sector We share staff’s assessment that, despite a partial slowing of dynamics in the housing and mortgage sectors, risks remain high. Various prudential measures have been undertaken
3
between 2012 and 2014 to address these risks. While the measures appear to have had some positive effect, large imbalances remain. As noted in the report, measures implemented recently require more time to take full effect. Our authorities will continue to (i) closely monitor developments in the housing and mortgage markets and (ii) reassess on a regular basis the need for an adjustment to the countercyclical capital buffer. Moreover, they agree that further policy action may be warranted, in particular, to target affordability and the income-producing real estate sector.
FINMA's supervisory approach Regarding staff’s recommendation to improve the system of external audit firms used for regulatory audits, we understand that directly mandating audit firms and paying them through a FINMA-managed and bank-financed fund may reduce conflicts of interests. Switching to such a system would, however, require legislative changes. Furthermore, effective measures are already in place to ensure FINMA’s control over the work conducted by audit firms and to prevent banks from influencing their auditors. Our authorities are also of the opinion that periodic rotation of audit firms, as recommended by staff, would not be an effective measure to enhance the Swiss supervisory approach, owing to the oligopolistic structure of the audit market. Finally, after a recent significant expansion in staffing, FINMA considers its current resource to be adequate.