imf country report no. 15/110 republic of latvia©2015 international monetary fund imf country...
TRANSCRIPT

©2015 International Monetary Fund
IMF Country Report No. 15/110
REPUBLIC OF LATVIA 2015 ARTICLE IV CONSULTATION––STAFF REPORT; INFORMATIONAL ANNEX; AND PRESS RELEASE
Under Article IV of the IMF’s Articles of Agreement, the IMF holds bilateral discussions with members, usually every year. In the context of the 2015 Article IV consultation with the Republic of Latvia, the following documents have been released and are included in this package: The Staff Report prepared by a staff team of the IMF for the Executive Board’s
consideration o a lapse of time basis, following discussions that ended on March 2, 2015, with the officials of the Republic of Latvia on economic developments and policies. Based on information available at the time of these discussions, the staff report was completed on April 9, 2015.
An Informational Annex prepared by the IMF.
A Press Release
The document listed below has been or will be separately released Selected Issues Paper
The policy of publication of staff reports and other documents allows for the deletion of market-sensitive information.
Copies of this report are available to the public from
International Monetary Fund Publication Services 700 19th Street, N.W. Washington, D.C. 20431
Telephone: (202) 623-7430 Telefax: (202) 623-7201 E-mail: [email protected] Internet: http://www.imf.org
Price: $18.00 a copy
International Monetary Fund
Washington, D.C.
May 2015

REPUBLIC OF LATVIA STAFF REPORT FOR THE 2015 ARTICLE IV CONSULTATION
KEY ISSUES
Context. Latvia has made remarkable economic progress since the crisis: the output gap
is now largely closed, the current account deficit has been reduced to sustainable levels,
and unemployment continues to fall. However, the economy has recently slowed
considerably in the face of a deteriorating external environment, weak investment, and
persistently shrinking bank credit.
Challenges. Subdued economic growth is expected to continue in 2015 due to
continued weakness in trade partners, particularly Russia. An escalation of geo-political
tensions or protracted low growth in the Euro Area poses further downside risks. Rapid
productivity growth will be needed over the medium term if per capita income is to
converge to core Euro Area levels.
Staff views.
The continued contraction of bank credit is likely to constrain investment going
forward. Recent efforts to catalyze SME lending and improve the implementation of
insolvency procedures are welcome.
Over the medium term efforts are needed to increase the revenue envelope to
ensure that necessary capital and social expenditures can be accommodated.
Although geopolitical tensions do not appear to have significantly affected the
inflow of non-resident deposits (NRDs) to date, continued vigilant supervision and
regulation of the NRD banking sector is needed.
Structural reforms are needed in several areas—such as education, infrastructure,
labor markets and the judicial system—to maintain competitiveness over time in the
Euro Area currency union.
Authorities’ views. The authorities were in broad agreement with staff
recommendations, notwithstanding some differences on tax and benefit policies. They
agreed to explore ways to build fiscal space over the medium-term to accommodate
essential expenditures. They also concurred with the need for higher prudential
standards and intensive monitoring of risks associated with NRD banking sector.
April 9, 2015

REPUBLIC OF LATVIA
2 INTERNATIONAL MONETARY FUND
Approved By Philip Gerson (EUR)
and Mark Flanagan (SPR)
Discussions were held in Riga during February 19-March 2, 2015.
The team comprised Mr. Aiyar (head), Messrs. Srour and Lian (all
EUR), and Ms. Diouf (SPR). Mr. Rutkaste (OED) also joined the
discussions.
CONTENTS
CONTEXT_________________________________________________________________________________________ 4
RECENT ECONOMIC DEVELOPMENTS __________________________________________________________ 4
OUTLOOK AND RISKS ___________________________________________________________________________ 6
POLICY DISCUSSIONS ___________________________________________________________________________ 7
A. Fiscal Policy ____________________________________________________________________________________ 7
B. Financial Supervision ___________________________________________________________________________ 9
C. Resuscitating Bank Credit _____________________________________________________________________ 10
D. Structural Reforms ____________________________________________________________________________ 12
STAFF APPRAISAL _____________________________________________________________________________ 13
BOXES
1. Russia Linkages ________________________________________________________________________________ 15
2. External Sector Assessment ___________________________________________________________________ 16
3. Risk Assessment Matrix ________________________________________________________________________ 18
FIGURES
1. Real Sector, 2009–14 __________________________________________________________________________ 19
2. Inflation and the Labor Market, 2007–14 ______________________________________________________ 20
3. Fiscal Developments, 2008–14 _________________________________________________________________ 21
4. Financial Market Developments, 2006–15 _____________________________________________________ 22
5. Banking Sector Development, 2007–14________________________________________________________ 23
6. Balance of Payments, 2007–14 ________________________________________________________________ 24
7. External Debt and Vulnerabilities in the Banking System ______________________________________ 25
TABLES
1. Selected Economic Indicators, 2008–15 _______________________________________________________ 26
2. Macroeconomic Framework, 2010–20 _________________________________________________________ 27
3. General Government Operations, 2010–20 ____________________________________________________ 28
4. Medium-Term Balance of Payments, 2010–20 _________________________________________________ 29
5. Financial Soundness Indicators, 2006–14 ______________________________________________________ 30
6. Indicators of Fund Credits, 2009–16 ___________________________________________________________ 31
REPUBLIC OF LATVIA
INTERNATIONAL MONETARY FUND 3
ANNEXES
I. Public Debt Sustainability Analysis (DSA) ______________________________________________________ 32
II. External Debt Sustainability Analysis (DSA) ____________________________________________________ 34

REPUBLIC OF LATVIA
4 INTERNATIONAL MONETARY FUND
CONTEXT
1. Latvia has made remarkable economic progress since the financial crisis. The output
gap has almost closed; unemployment, although still high,
is now mainly structural in nature; and the real effective
exchange rate is broadly in line with fundamentals. The
current account—which was more than 20 percent of GDP
in deficit just before the output collapse—is close to
balance. Fiscal policy is prudent, and public debt is among
the lowest in Europe. The country experienced a smooth
entry into the Euro Area. Going forward, policy continuity
is likely, as the incumbent center-right coalition remains in
power following parliamentary elections last October.
2. The 2014 Article IV consultation commended
the authorities for prudent macroeconomic policies,
but argued for an extensive medium-term agenda of
structural reforms. The staff appraisal recommended
gradual fiscal consolidation in line with the Fiscal Discipline
Law (FDL); measures to reduce inequality and strengthen
the social safety net; structural reforms to boost productivity; and close supervision of non-resident
deposits (NRDs) in the banking system. Policy making has broadly reflected these recommendations.
Fiscal policy has been in line with the FDL, and some measures, such as raising the minimum non-
taxable allowance under the income tax, have targeted vulnerable sections of society. The electricity
sector has been liberalized, and close supervision of NRD-specialized banks continues.
RECENT ECONOMIC DEVELOPMENTS
3. The recovery slowed considerably in 2014 amid a deteriorating external environment.
GDP growth fell from 4.2 percent in 2013 to an estimated 2.4 percent, reflecting the prolonged
closure of a large steel manufacturer Liepajas Metalurgs (LM), and weak economic performance in
the Euro Area (EA) and Russia amid rising geopolitical tensions. Despite the decline, the GDP growth
rate remained well above the Euro Area average of 0.9 percent. To date the direct impact of the
Russia-Ukraine conflict, including sanctions, is estimated to be relatively small (Box 1). However, the
conflict—together with the lingering economic malaise in the Euro Area—has raised uncertainty and
likely been a key factor in holding back domestic demand.
4. Consumption growth decelerated strongly, and the anticipated investment recovery
was modest. Private consumption growth was only 2.3 percent in 2014, much lower than
6.3 percent in 2013, as the uncertain economic climate led to more precautionary savings. Gross
fixed investment increased by a sluggish 1.6 percent, belying expectations of a strong rebound from
the 5.2 percent contraction of 2013. Apart from weak external conditions, controversy over
-35
-25
-15
-5
5
15
2008 2009 2010 2011 2012 2013 2014
Change in inventory
Gross fixed investment
Net exports
Government consumption
Private consumption
GDP
GDP Growth and Contributions
(Real, annual percent)
Sources: CSB and IMF staff calculations.

REPUBLIC OF LATVIA
INTERNATIONAL MONETARY FUND 5
proposed amendments to the insolvency law likely contributed to an uncertain domestic
environment. Exports remained subdued due to tepid growth among trading partners and the full-
year impact of the closure of LM in mid-2013, while the depreciation of the ruble against the euro
had a negative impact on export receipts, especially in the last quarter. The current account deficit
widened slightly to about 3 percent of GDP.
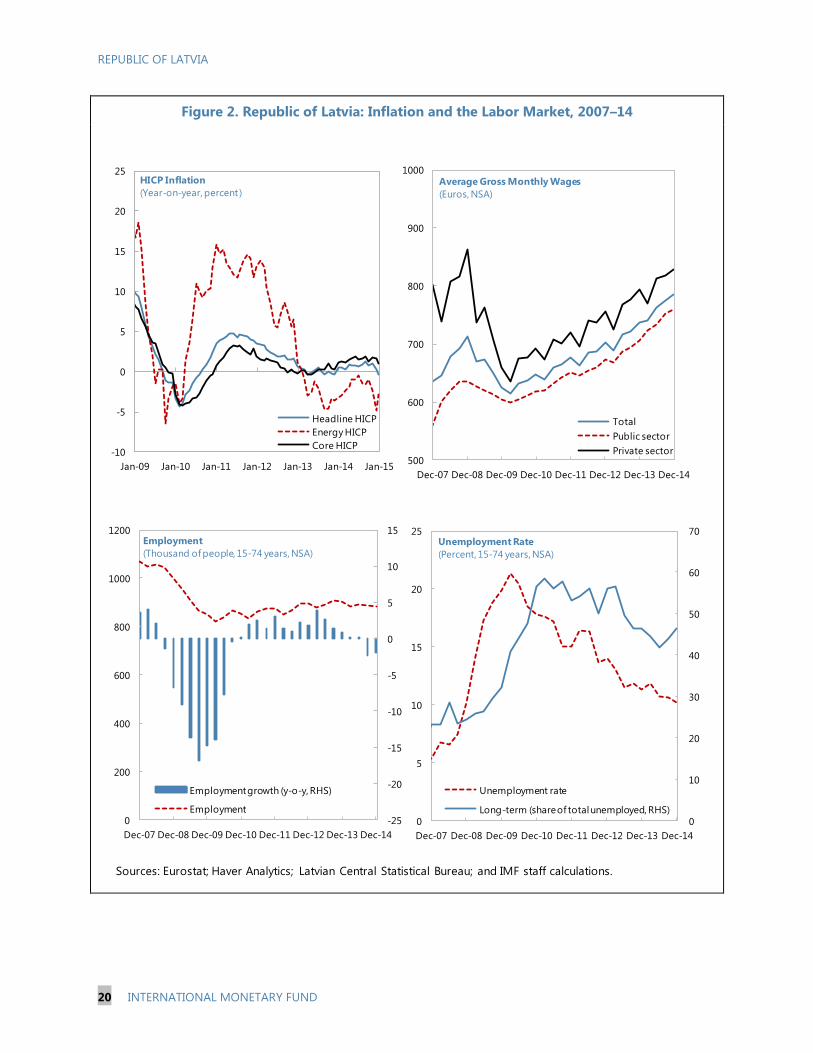
5. The labor market continued to tighten. Real wages increased 6.3 percent and the
increases were broad-based, resulting from both a higher minimum wage (320 euros per month, up
from the previous level of 280 euros) and competition for higher skilled workers. It is unlikely that
the rapid wage growth signals an overheating labor market at this juncture: few companies reported
labor shortages as an important obstacle to businesses, and part of the recorded wage increase
probably reflects successful tax compliance measures, which have led to more accurate reporting
and reduced under-the-table “envelope wages”. The unemployment rate declined further to about
10.5 percent in December 2014, down from 11.3 percent a year ago, while the participation rate
stayed constant.
6. Inflation recovered slightly on the back of robust core inflation. Headline inflation
averaged only 0.7 percent, following zero price growth the previous year. Despite a significant
increase in core inflation to 1.5 percent (from 0.2 percent the previous year), reflecting strong wage
growth, the continued decline in food and energy prices held back headline inflation. In comparison,
core inflation in the Euro Area was 0.7 percent in 2014.
7. Banks continued to repair their balance sheets. Bank profitability improved further, while
the overall NPL ratio declined to 6.8 percent in December 2014 from 8.3 percent a year earlier.
However, deleveraging continues, with the stock of bank credit to the private sector declining by
about 7.6 percent (y-on-y) in December 2014. Moreover, the issuance of new loans actually
decreased in 2014. The shrinking stock of domestic credit—extended primarily by large Nordic
subsidiary banks—was matched by the repatriation of funds to parent banks. Asset prices continued
their gradual recovery (Figure 6), although both stock prices and property prices remain well under
the levels reached just prior to the financial crisis.
8. There is little evidence that geopolitical tensions have disrupted the flow of NRDs into
Latvia. NRD growth was stable in 2014 and accelerated slightly towards the end of the year.
Excluding exchange rate effects, which were substantial due to the depreciation of the euro against
the US dollar, the stock of NRDs increased by 14 percent year-on-year in December 2014, broadly in
line with the average rate of growth over the last three years.
9. The general government deficit widened by about ½ percentage point to around
1.4 percent of GDP in 2014. While this exceeded the nominal budget target of 0.9 percent of GDP,
the breach was largely accounted for by a one-off payment related to the sale of Citadele bank (see
below). The negative budgetary impact of the economic slowdown was largely offset by revenue
gains from improved tax compliance and higher wages. With the output gap still negative, staff
estimate that the structural deficit, excluding the one-off cost, remains just under 1 percent of GDP.

REPUBLIC OF LATVIA
6 INTERNATIONAL MONETARY FUND
OUTLOOK AND RISKS
10. Lackluster economic growth is expected to continue this year. This reflects the adverse
impact of the anemic external environment, particularly Russia’s sharp slowdown, on exports and
investment. This will be mitigated but not fully offset by higher disposable income due to lower oil
prices and robust real wages, which would tend to support private consumption. LM has now
reopened and is gradually ramping-up production, but is not expected to reach full capacity until
the fourth quarter. Given abundant liquidity in the banking system, the accommodative monetary
stance of the ECB is unlikely to exercise much impact except through a weaker euro and
expectations of a more robust recovery in the Euro Area. While inflation is expected to fall in 2015,
reflecting the sharply lower oil price forecast, the liberalization of electricity tariffs will support prices
to some extent.1
11. Over time, growth is expected to accelerate as the external climate improves and
investment picks-up, but this is predicated on strong reform efforts. Annual medium-term
growth of around 4 percent—higher than in core economies—should be achievable as the economy
converges towards Euro Area average income levels. This is conditional on measures to enhance
competitiveness, and continued prudent macroeconomic management. Adverse demographics,
including continuing emigration, will tend to reduce the labor force, so reforms aimed at reducing
high structural unemployment will be needed simply to keep employment constant. Robust growth
will depend on capital accumulation—underpinned by a resumption of credit supply—and TFP
growth (see selected issues paper on Latvia’s medium-term growth). International evidence shows
that while several countries at a similar level of development have been able to increase labor
productivity rapidly and converge towards frontier income levels, others have failed to do so: the
key is to attract sufficient investment, especially in industries with high investment multipliers, and
lay the foundations for rapidly improving productivity, including by building infrastructure and
through reforms to education.
12. The outlook is subject to significant downside risks (RAM). A prolonged slowdown in
Russia and the Euro Area would further dampen confidence and thwart a pick-up in economic
activity, while a further escalation of sanctions and counter-sanctions could disrupt trade
settlements. A sharp supply-driven rise in oil prices would remove an important factor supporting
projected growth, especially in the near-term. Resurgent sovereign stress arising from events in
Greece could spill over to higher bond yields in Latvia. A failure to tackle the structural reform
agenda would impede productivity growth and diminish competitiveness over the medium term;
indeed the external assessment (Box 2) shows that there are already some signs of eroding
competitiveness due to recently rising unit labor costs (although so far these losses are minor
1 From January 1st, 2015, smaller enterprises and households—which had hitherto bought electricity from the state-
owned JSC Latvenergo at subsidized rates—shifted to purchasing electricity on the free market (with some
exemptions for special groups such as poor households or households with many children). This reform—long
advocated by the European commission—was originally scheduled for April, 2014 but was delayed to develop a
proper compensation mechanism for low income households.

REPUBLIC OF LATVIA
INTERNATIONAL MONETARY FUND 7
compared to the gains made from internal devaluation since the crisis). The external assessment also
shows that Latvia is vulnerable to a severe growth or current account shock, which could reverse the
projected medium-term trend of a gradually falling debt-to-GDP ratio. The authorities broadly
concurred with these risks, but noted that while sovereign stress arising in the European periphery
might increase somewhat the cost of the government’s external financing from the current
extremely low rates, Latvia’s low public debt and sound macroeconomic fundamentals make it very
unlikely to be rationed from credit markets. Indeed, ratings agencies have repeatedly upgraded the
country’s sovereign rating over the last three years. The authorities also noted that—partly as a
result of the ECB’s unconventional policy actions—there were upside risks from a stronger-than-
expected recovery in the Euro Area.
POLICY DISCUSSIONS
A. Fiscal Policy
13. The 2015 budget is broadly neutral. A 1 percentage point cut in the personal income tax
(PIT) rate to 23 percent, which will result in an estimated revenue loss of ¼ percent of GDP, is
expected to be offset by growth of the tax base, as tax compliance continues to improve and wages
rise (including through a further 40 euros increase in the minimum wage), and by a cut in capital
spending. The structural deficit target of 1 percent of GDP is in line with the authorities’ Fiscal
Discipline Law (FDL), and strikes an appropriate balance between the need to rebuild fiscal space
over the cycle and that of avoiding fiscal drag in a weak economic environment.2 The authorities
agreed with staff that, given the unusually large uncertainties regarding external conditions, the
budget should be implemented flexibly in accordance with the FDL. Automatic stabilizers should be
allowed to operate fully in case economic growth falls below the forecast.
14. Staff urged further measures targeted at reducing inequality and strengthening the
social safety net. At less than one fifth the EU average (per inhabitant) social protection benefits in
Latvia remain among the lowest in Europe. At the same time, income inequality (as reflected for
instance in the ratio of the highest to the lowest income quintile) is among the highest. The
authorities have recently taken some measures to alleviate these problems, such as the 2014
increase in the non-taxable minimum allowance, but more is needed. In particular, the cuts to
Latvia’s Guaranteed Minimum Income (GMI) benefit in 2013, and the de-centralization of the
scheme’s financing should be reversed, in line with the recommendations of the World Bank study.
15. Current fiscal policies could significantly reduce the budget envelope and constrain
priority spending over the medium term. Planned declines in the PIT rate and SOEs’ payout ratio,
together with increases in tax allowances and cuts in social contributions, are estimated to reduce
2 The FDL sets a medium-term objective (MTO) of 0.5 percent of GDP, but permits deviations from this target for
revenue transfers to the privately managed Pillar II pension fund. The FDL is designed to be compatible with Latvia’s
commitments under the Stability and Growth Pact (SGP).

REPUBLIC OF LATVIA
8 INTERNATIONAL MONETARY FUND
revenue by over three percentage points
of GDP between 2013 and 2017.3 Staff
estimate that additional revenue
measures equivalent to 0.6 percent of
GDP in 2016 and 2017 will be needed to
safeguard priority investment,
particularly infrastructure investment
(thus keeping public capital expenditure
above a historical low of about three
percent of GDP), and social spending,
including on improving social exclusion
benefits and introducing progressive tax
allowances. Alternatively, sizable
expenditure reductions would be
required in other areas, but staff and the
authorities agreed that there was limited
scope for substantial permanent cuts in
other parts of the budget, given the
already low level of public expenditures
in Latvia (see text chart).
16. Several options could be
considered to open fiscal space while
reducing inequality. 4 First the PIT rate
cut should be reconsidered. While the
authorities view the PIT cut as a measure to
improve work incentives, a more targeted way
to achieve this goal would be to further
expand the non-taxable minimum allowance,
and to introduce a more gradual phasing-out
of the GMI benefit, which currently falls one-
to-one with income. Second, property tax
revenue, which currently amounts to less than
0.8 percent of GDP, (well below European and
OECD average levels) should be expanded.
Staff urged the authorities to enable local
municipalities to raise the real estate tax rate
3 The PIT rate is scheduled to be lowered by one percentage point in 2015 and again in 2016, while SOE payout ratios
are to be cut from the current 90 percent level to 70 percent in 2016 and to 27 percent in 2017.
4 The measures considered here have a permanent effect on revenue, i.e., if enacted in 2016 a measure would entail a
gain in 2017 and future years as well (provided it is not reversed).
-10
0
10
20
30
40
50
60
-10
0
10
20
30
40
50
60
Ro
man
ia
Lith
uan
ia
Irela
nd
Latv
ia
Bu
lgari
a
Po
lan
d
Est
on
ia
Slo
vakia
UK
Cze
ch R
ep
.
Cro
ati
a
Germ
an
y
EU
Eu
ro A
rea
Hu
ng
ary
Italy
Sw
ed
en
Fra
nce
Fin
lan
d
Change 2006-13
2006
General Government Revenue
(End-2006, Percent of GDP)
Source: Eurostat
-10
0
10
20
30
40
50
60
70
-10
0
10
20
30
40
50
60
70
Lith
uan
ia
Latv
ia
Bu
lgari
a
Est
on
ia
Irela
nd
Slo
vakia
Cze
ch R
ep
.
Germ
an
y
Po
lan
d
UK
Cro
ati
a
EU
Eu
ro A
rea
Hu
ng
ary
Italy
Sw
ed
en
Fra
nce
Fin
lan
d
Change 2006-13
2006
General Government Expenditure
(End-2006, Percent of GDP)
Source: Eurostat
2016 2017
Measures
Maintain PIT rate at the 2015 rate of 23 percent 0.21 0.20
Increase property tax rate by 0.5 ppt on buildings
and land
0.22 0.22
Improve cadastral revenue 0.08 0.08
Reverse ceiling introduced on social contributions
for incomes above 48,600
0.14 0.14
Better-targeted tax allowances 1/ 0.20 0.20
Increase CIT from current 15 to 16% 0.10 0.10
Remove excise exemptions on gazoil for agriculture 0.14 0.14
Total 1.1 1.1
Memorandum items
Structural deficit: authorities' target -0.8 -0.7
Structural deficit: staff estimate without measures -1.5 -1.3
Gap -0.6 -0.6
Potential Fiscal Measures
In percent of GDP
Impact on revenue
1/ Including lower tax allowances for pensioners, lower tax allowances for
dependents and elimination of non-taxable threshold for high-income individuals,
Source: Latvian authorities and staff calculations

REPUBLIC OF LATVIA
INTERNATIONAL MONETARY FUND 9
on high-valued land and buildings above the current 1.5 percent ceiling. This should go hand-in-
hand with cadastral reform to remove substantial discrepancies in property valuation, for instance
between old and renovated or new buildings and to correct inconsistent valuation of agricultural
land; such discrepancies damage both tax collection and credibility. Third, the cap on social security
contributions could be removed (while maintaining the cap on benefits). The combined effect of
these measures should suffice to close the revenue gap estimated under current policies. Moreover,
other options exist should the authorities choose not to fully implement the measures above. For
example, the minimum non-taxable threshold for pensioners and the tax allowance for dependents
could be reduced, and excises on fuel used in agriculture raised, in conjunction with better-targeted
direct support for low- and middle-income households. Alternatively, the corporate income tax rate,
which is among the lowest in the EU, could be raised.
17. The authorities recognized the need for enhancing revenue over the medium term and
reducing inequality. They emphasized ongoing measures for combating the grey economy, noting
the significant gains achieved to-date, and agreed that revenues from property taxes could be
improved. They were not amenable to reversing and decentralizing the cuts to the GMI benefit this
year, but noted that medium-term plans are under consideration for increasing GMI benefits within
an integrated social benefit system (under which a minimum level of combined benefits—
comprising the GMI, unemployment insurance, parental benefits, etc—would be defined relative to
the economy’s median wage). They will also consider introducing progressive minimum non-taxable
thresholds in the future, which would help ameliorate inequality.
B. Financial Supervision
18. Latvia’s three largest banks comfortably passed the ECB’s Comprehensive Assessment.
The wider banking system is also well capitalized and liquid, with an average CET1 ratio of about
18 percent and a liquidity ratio of around 64 percent, substantially higher than regulatory minimum
requirements of 8 percent and 30 percent respectively. Citadele, the “good bank” created upon the
dissolution of Parex, was sold to a consortium of international investors within the timetable set by
DG Competition.5 The sale triggered the exercise of a put-option equivalent to about 0.4 percent of
GDP compensating the EBRD for its injection of equity capital in Parex at the outset of the crisis.
19. Banking supervision is now shared between the Latvian regulator (the FCMC) and the
SSM. The SSM directly supervises Latvia’s three largest banks, accounting for about 42 percent of
the banking system by assets. The Joint Supervisory Teams (JSTs) for these banks are led by an ECB
official and include Latvian representation. On the other hand, the Colleges of Supervisors for the
large banking groups—two of which are subsidiaries of Swedish parent banks and are among
Latvia’s three largest banks— are chaired by the Swedish supervisory authorities and include
representatives from the ECB , while Latvia’s FCMC has observerstatus. The authorities report that
information sharing and cooperation among these supervisory bodies has so far been good. They
5 Latvia’s economic crisis was sparked by a run on the country’s largest domestic bank, Parex, in 2008.

REPUBLIC OF LATVIA
10 INTERNATIONAL MONETARY FUND
agreed with staff that open communication channels among the ECB, the Swedish regulators and
the FCMC will remain essential going forward, especially when capital and liquidity conditions are
less benign than at present.
20. Ongoing geopolitical tensions and the deep economic downturn in Russia highlight
potential risks stemming from the high level of NRDs in Latvia’s banking system. NRDs, over
80 percent of which are estimated to originate from Russia and other CIS countries, currently
account for about half of the banking sector’s total deposits, and could therefore be vulnerable to a
sudden stop or flow reversal. Moreover, since NRDs are covered by the country’s deposit guarantee
scheme, they represent a significant contingent fiscal liability.6 That said, to date there are few signs
of NRD inflows being impeded due to geopolitical events (Box 1). Risks to the domestic economy
are mitigated by various factors. NRD banks hold the major share of their assets abroad in liquid
instruments such as European and US government securities, and bank deposits.7 They are already
subject to higher capital and liquidity requirements, in line with past staff advice. Moreover, the
FCMC plans to impose a “business model risk” add-on to NRD banks’ contributions to Latvia’s
deposit guarantee scheme, ensuring that NRD banks pay more into the scheme per dollar of
deposits.
21. The authorities remain keenly aware of the need for vigilant supervision of the NRD
banking sector. AML / CFT supervision is being strengthened and made more risk-based. The
Latvian bank regulator, the FCMC, reported that it conducts frequent offsite and onsite bank
inspections, and that customer due diligence guidelines have been strengthened since the Moneyval
report in 2012. The authorities noted that the Financial Intelligence Unit responsible for fighting
money laundering and other financial crimes now receives greater budgetary support—which it has
used to expand staff, undertake more training programs and invest in more sophisticated risk-
assessment software—and works in cooperation with the State Revenue Service and foreign
regulators.
C. Resuscitating Bank Credit
22. Bank deleveraging reflects both demand and supply factors. The debt overhang and
uncertain outlook continue to hold back credit growth and investment in an environment of
tightened lending standards. Discussions with bank representatives suggest that SMEs and low
income households in particular face hurdles accessing funding because of the higher risks they
represent and their lack of collateral. The credit contraction has persisted well past the point in the
cycle when most countries see a resumption of credit growth.8 It is particularly worrying in the
6 As a recent example, the bankruptcy of Latvijas Krajbanka—which in September 2011 accounted for about 1½
percent of Latvia’s NRDs and 8 percent of domestic deposits—required the Deposit Guarantee Fund to pay out
about 336 million lats (about 2.2 percent of GDP) to cover insured deposits, of which 200 million lats came from a
treasury loan.
7 See Appendix I, 2012 Article IV Consultation with Latvia.
8 See Baltic Cluster Report, 2014, IMF Country Report No. ISCR/14/116.

REPUBLIC OF LATVIA
INTERNATIONAL MONETARY FUND 11
context of a tightening labor market and high real
wage growth. For several years after the trough of the
crisis, firms were able to finance investment through
retained profits, since productivity growth outstripped
wages. But now the lack of credit is likely to be a
binding constraint on investment.
23. The authorities have few direct levers to
encourage credit supply, given the dominance of
Nordic subsidiaries in Latvia’s domestic economy.
ECB quantitative easing is unlikely to have an impact
on bank lending, since Nordic subsidiaries depend on
parent banks for funding rather than wholesale
markets, while the parent banks themselves are not
liquidity constrained. The subsidiary banks note that,
while they have indeed tightened lending standards
since the crisis, the main reason for anemic lending is
lack of demand. The reduction in their loan book over the last few years has created excess cash
holdings, which in turn have been repatriated to the parent banks; thus the observed increase in the
percentage of local deposit funding for the subsidiaries is not a conscious change in business model
but rather a consequence of excess liquidity.
24. The recently created Single Development Institute (SDI) is appropriately taking a more
active role in supporting SME lending.9 The SDI has introduced a number of programs designed
to catalyze private bank lending, including loan guarantee schemes and a program to reduce credit
risk for private lenders by providing subordinated loans. The authorities also pointed to recent
efforts to develop credit bureaus to make available potential borrowers’ credit related information in
a standardized way, which would help banks to screen borrowers and reduce informational
asymmetries in the loan market. Staff encouraged all these initiatives, while noting that care is
needed to ensure that the SDI is genuinely addressing market failures rather than supporting
unviable businesses.
25. Policy measures to reduce the still high debt overhang would increase demand for
credit while improving perceptions of credit risk on the supply side. While earlier legal
amendments have already strengthened the insolvency regime, its administration and
implementation could be further improved. Banks report that insolvency procedures can be very
lengthy and insolvency administrators obstructive. The authorities pointed to various measures
being planned, or already implemented, to reduce the backlog of pending cases, such as a greater
number of courts and better specialization and allocation of judges across courts. A new law makes
9 As described in previous staff reports, the SDI is a new institution formed through the merger of the Latvian
Guarantee Agency, the Rural Development Fund and the Mortgage and Land Bank.
-8
-6
-4
-2
0
2
4
6
8
2009 2010 2011 2012 2013 2014
Productivity growth
Real wage growth
Productivity Growth and Real Wage Growth
(Percent)
Sources: CSB and IMF staff calculations.

REPUBLIC OF LATVIA
12 INTERNATIONAL MONETARY FUND
insolvency administrators state officials, subjecting them to greater income disclosure and stricter
supervision. And reforms are underway to encourage mediation or arbitration as an alternative to
much lengthier regular court procedures.
26. A compromise has been reached on the implementation of recent amendments to the
insolvency law which could have had the unintended consequence of further dampening
credit supply. The amendments—passed by Parliament last year—limited the liability of mortgage
borrowers to collateral and reduced the discharge period for debtors from 3.5 years to 1 year after
declaring insolvency. While the amendments did not apply retroactively, thus limiting the immediate
impact on bank balance sheets, they created further uncertainty amid an already weak lending
environment. Several banks responded by charging higher mortgage down payments and rationing
credit to low-income households and households that live outside major cities, despite the
amendments not having taken effect. Staff therefore welcomed the recent compromise which
requires banks to offer customers a choice between a “regular” mortgage and a limited-recourse
mortgage of the type prescribed by the amendments (which can be priced differently).
D. Structural Reforms
27. Latvia’s most important medium-term challenge is to maintain competitiveness within
the Euro Area currency union. The substantial real depreciation following the crisis allowed the
country to make rapid competitiveness gains, but now that the exchange rate is broadly in line with
fundamentals (see External Assessment), the focus must shift to structural reforms. In order for
Latvia to consistently exceed average Euro Area growth and thereby close the income gap with core
economies, productivity growth must be supported by appropriate policies. Over the last two years,
wages have grown rapidly as labor market slack has diminished, and this is reflected in a slight
erosion of competitiveness as measured by unit labor costs. Against this background—and in the
context of large increases to the minimum wage in 2014 and 2015—staff recommended that future
increases should not exceed productivity growth. The authorities concurred that future changes to
the minimum wage would need to take account of economic developments.
28. Labor market reforms to improve work incentives should be implemented. A system of
in-work tax credits and benefits should be considered because empirical evidence suggests that
these have proven effective in increasing employment of lower skilled workers. Active labor market
policies (AMLPs) should continue to be strengthened. The coverage ratio of ALMPs has improved
substantially, from 42 percent in 2012 to 62 percent in 2014, partly due to the decline in the
unemployment rate. The authorities pointed to several active projects targeted at various segments
of the unemployed population, including an active ageing project as well as measures to improve
internal mobility.
29. Upgrading public infrastructure and improving state-owned enterprise (SOE)
governance are important elements of strengthening competitiveness. Improving public
infrastructure could also help attract FDI and associated technological knowhow. Moreover, the
current juncture is propitious for well-planned projects to attract centralized funding from the

REPUBLIC OF LATVIA
INTERNATIONAL MONETARY FUND 13
Juncker plan. An important area where reforms are both necessary and well-identified is ports: Riga
and Ventspils ports both remain overly dependant on low-value added bulk traffic and face strong
competition, especially from Russian ports. Staff urged speedy implementation of the
recommendations of the World Bank study on ports, which made several specific suggestions to
increase capacity and enhance connectivity to land transport, while improving governance and
accountability. On a related front, centralizing SOE management while divesting non-core
activities—in line with long-planned reforms—would improve efficiency and accountability,
contributing to an improvement in the business environment. The authorities noted that a working
group has been set up to consider the World Bank recommendations on ports, while a framework
law to strengthen SOE governance was passed in October 2014. The latter will require a centralized
SOE manager to be established, and independent boards and annual reporting will be re-introduced
for largest SOEs.
30. Reforms to higher and vocational education would help reduce skills mismatches and
structural unemployment. The authorities—in conjunction with European partners—have already
developed an ambitious reform agenda. Plans include introducing quality-based accreditation of
study fields, consolidation of higher education institutions (which are currently too numerous) and
better targeting of public funds to universities (shifting resources from social sciences to STEM
fields). A new financing model for higher education that seeks to reward quality is being prepared in
cooperation with World Bank experts. These measures, together with the promotion of EU foreign
(i.e. not Latvian) languages in teaching, would build a more skilled workforce. Meanwhile, reforms to
vocational education could help reduce skills mismatches and hence alleviate structural
unemployment in the medium-term. Efforts should continue to expand vocational training from a
pilot program encompassing 6 institutions to a wider base of institutions, and to include a council of
social partners and sector experts. The authorities agreed with staff that unwavering implementation
of the education reform agenda would be crucial over the next few years.
STAFF APPRAISAL
31. Latvia’s economic slowdown is expected to persist this year. GDP growth is estimated to
have decelerated to about 2.4 percent in 2014, reflecting the prolonged closure of steel
manufacturer Liepajas Metalurgs, and weak economic performance in the Euro Area and Russia
amid rising geopolitical tensions. In 2015 the anemic external environment—particularly the sharp
recession in Russia—will continue to weigh on exports and investment. This is expected to be
somewhat mitigated by higher disposable income due to lower oil prices and robust real wages, the
reopening of LM, and the accommodative monetary stance of the ECB.
32. Faster medium-term growth will be necessary if Latvia is to close the income gap with
the rest of the Euro Area, but this cannot be taken for granted. Medium-term growth of around
4 percent should be feasible. But adverse demographic trends will exert a downward pull on the
growth trajectory, so robust growth depends on reforms to reduce still-high structural
unemployment, and on boosting capital accumulation and labor productivity. Moreover, the near-

REPUBLIC OF LATVIA
14 INTERNATIONAL MONETARY FUND
term forecast is subject to several downside risks, most importantly a prolonged slowdown in
important trading partners such as Russia and the Euro Area.
33. While the 2015 budget is broadly appropriate, fiscal space needs to be built-up over
the medium-term. Automatic stabilizers should be allowed to operate fully this year, given the
weak and uncertain external environment. Over the medium-term, various factors, such as planned
reductions to the personal income tax (PIT) rate, could constrain the budget’s capacity for necessary
capital and social expenditure. The authorities should explore ways to increase the revenue
envelope, for example by reconsidering future PIT rate cuts, greater land taxation in conjunction
with cadastre reform, the removal of the cap on social security contributions, and better targeting of
a number of tax allowances. Such measures would complement the welcome focus on shrinking the
grey economy through better tax compliance.
34. The continuing contraction of bank credit is increasingly likely to constrain
investment. Staff supports recent public sector initiatives to catalyze SME lending, including by
providing loan guarantees, taking subordinated positions and encouraging the development of
credit bureaus. Reforms to insolvency procedures and the court system are needed to encourage
writedowns and accelerate the reduction in private sector debt. This would provide a spur to new
lending from both the demand and supply side.
35. So far there have been no significant disruptions to NRD flows arising from
geopolitical tensions. But the Russia-Ukraine conflict highlights the need for maintaining vigilant
supervision of NRD banks, which account for almost half of all deposits in the banking system. In this
context, the authorities are encouraged to continue their efforts to strengthen and effectively
implement the AML/CFT framework. Appropriately, the Financial Intelligence Unit responsible for
combating money laundering and financial terrorism has been strengthened. Minimum capital and
liquidity requirements are higher for NRD banks, in line with previous staff advice; and the
authorities plan to impose on NRDs proportionately higher contributions to the deposit guarantee
fund.
36. Latvia’s most important medium-term challenge is to maintain competitiveness within
the Euro Area currency union. Future increases to the minimum wage should not exceed
productivity growth. In order for Latvia to consistently exceed average Euro Area growth and
thereby close the income gap with core economies, productivity growth must be supported by
appropriate structural policies. Reforms are needed in a number of areas such as labor markets,
higher and vocational education, infrastructure, and SOE management.
37. Staff recommends that the next Article IV consultation be held on the standard
12-month cycle.

REPUBLIC OF LATVIA
INTERNATIONAL MONETARY FUND 15
Box 1. Republic of Latvia: Russia Linkages
Latvia is strongly linked to Russia through both trade and finance. Russia accounted for around
11 percent of Latvia’s exports of goods and services in 2013. Trade linkages have strengthened in the past
decade due to the faster growth of the Russian economy compared to Latvia’s other trading partners. As a
regional banking centre, Latvia also receives a large amount of Russian deposits. More than 80 percent of
non-resident deposits (NRDs) in the Latvian banking system come from CIS countries, mostly Russia. Latvia’s
linkages with Ukraine are much weaker: Ukraine accounted for only 1 percent of Latvia’s exports in 2013.
Latvia is currently fully dependent on Russia for gas imports. Supply has so far been reliable, and in any
event Latvia has a large gas storage facility in Incukalns. A new LNG terminal at the port of Klaipeda,
Lithuania, capable of meeting most of the Baltic countries’ gas needs, will become operational this year.
With Lithuania upgrading its pipelines to Latvia, natural gas imported through the LNG terminal can be
supplied to Latvia.
Slower Russian GDP growth is expected to lower Latvia’s growth directly through the trade channel
and through second round effects. Every 1 percent decline in Russia’s GDP growth is estimated to directly
reduce Latvia’s export growth by 0.4 percent and GDP growth by 0.2 percent. Persistently weaker Russian
demand for Latvian goods and services may negatively affect Latvian GDP through second round effects,
increasing precautionary savings (hence reducing consumption) and dampening investment sentiment. The
recent crash in oil price is expected to pull down Russian GDP growth in 2015 by around 3–4 percent, which
is expected to slow down Latvia’s growth by around 0.6–0.8 percent.
Russian counter-sanctions have had only a marginal impact on Latvia’s economy. The Russian
measures were directed at Latvian food exports, but food exports to Russia as a share of Latvian GDP are
small. Moreover, Latvian food exporters are expected to find new markets to substitute the loss of the
Russian market. On the other hand, counter-sanctions may exert a downward pull on food prices and
inflation. Moreover, if geopolitical tensions and the cycle of sanctions and counter-sanctions were to
escalate, the effect on Latvia could be much more serious.
So far the Russia-Ukraine conflict has had little discernible impact on the Latvian banking system.
Although some small banks experienced large drops in NRDs after sanctions against Russia were
announced, overall there was no disruption of NRD inflows. In fact NRD deposit growth in 2014 was more
robust than in the previous year: after correcting for valuation effects from the euro’s movement against the
dollar the growth rate of NRDs reached 14 percent (y-on-y) in December 2014, compared to 8.3 percent in
December 2013.
Russian FDI to Latvia somewhat surprisingly accelerated in the first half of 2014. Russia’s share in
inward FDI was stable at around 6 percent in the first and second quarters of 2014, higher than around
4.5 percent in 2012–13. This is consistent with strong NRD inflows, suggesting that the incentives of Russian
investors to allocate their deposits and capital to Latvia have not so far been harmed by geopolitical
tensions.

REPUBLIC OF LATVIA
16 INTERNATIONAL MONETARY FUND
Box 2. Republic of Latvia: External Sector Assessment
The macroeconomic imbalances of the pre-crisis period have been largely addressed, and the current account
is close to balance. Model-based assessments suggest that the exchange rate is broadly in line with
fundamentals. However, the substantial competitiveness gains that accrued to Latvia from correcting its
overvalued real exchange rate have now been exhausted, and the focus will need to shift to generating
sustained improvements in productivity.
Exchange rate assessments based on CGER methodologies conclude that the REER is broadly in line
with fundamentals (Table A). The external sustainability (ES) and the macroeconomic balance (MB)
approaches indicate that the Latvia’s REER is close to equilibrium. The equilibrium real exchange rate (ERER)
points to a higher misalignment than the other two methodologies, showing a moderate overvaluation. In
Latvia, where there have been profound structural changes over the last decade, the former two
estimates are likely more reliable, producing results very close to one another, and consistent with
external sector developments.
Table A. Latvia: 2015 Real Exchange Rate Assessment Using CGER Methodology
The EBA-lite methodology concludes that Latvia’s policies are broadly appropriate, but finds an
unrealistically large real exchange rate undervaluation. A small policy gap of 1 percent is estimated,
suggesting that Latvia’s fiscal, external (reserves and capital account), and financial policies are appropriate.
But the current account norm is estimated as -5.5 percent of GDP, much larger than the actual 2014 CA
deficit of -3.1 percent. This result should be interpreted with caution, as it seems inconsistent with the
country’s still high negative net international investment position, which would deteriorate further if the
actual current account deficit were in line with the model’s estimated current account norm. The underlying
model does not appear to capture well
the specifics of the Latvian experience, in
particular, the overheating of the
economy prior to the crisis (with a CA
deficit in excess of 20 percent), the
subsequent collapse in output and
demand, and the large internal
devaluation that was instrumental in
rebalancing the economy.
An examination of REER time-series (Panel 6) suggests that there have been very substantial gains in
competitiveness since the crisis, but recent developments present a more mixed picture. The HIPC-
based REER has appreciated modestly by 2.5 percent since 2013, reflecting NEER appreciation somewhat
mitigated by a decline in Latvia’s HIPC relative to its main trading partners—many of which, such as the
Nordics and CIS countries, are outside the Euro Area. Real wage growth continued to be strong in 2014, and
this is reflected in a simple index of export profitability—the ratio of the export deflator to nominal ULCs—
Approach Norm Underlying Equilibrium Actual Misalignment 1
External Sustainability -3.5 -2.2 … … -2.6
Macroeconomic Balance -2.8 -2.2 … … -1.2
Equilibrium Real Exchange Rate … … 4.9 5.0 10.3
Source: IMF staff estimates .1 A pos itive number indicates overvaluation.
Current Account Balance REER (in logs)
Latvia: 2015 Exchange Rate Assessment using EBA-lite Methodology
Summary TableCA-Actual -3.1% CA-Fitted -4.5%
CA-Norm -5.5% Residual 1.4%
CA-Gap 2.4% Policy gap 1.0%
Elasticity -0.36
Real Exchange Rate Gap -6.5% Cyclical Contributions -0.6%
Cyclically adjusted CA -2.5%
Cyclically adjusted CA Norm -4.9%

REPUBLIC OF LATVIA
INTERNATIONAL MONETARY FUND 17
Box 2. Republic of Latvia: External Sector Assessment (concluded)
whose continuing decline suggests that profit margins in
Latvia are being squeezed relative to Euro Area countries,
and more sharply than in the other Baltic countries.
Accelerating the development of the export sector
will require structural reforms to improve
competitiveness. Since the crisis, export growth has
been supported by the large internal devaluation. Latvia
has successfully diversified its export base, both in terms
of product mix and trade partners.1 But the weak external
environment, notably in Russia and main trading partners
in Euro Area, will pose challenges to export expansion,
despite mitigating effects from the euro depreciation and the recent drop in oil prices. Now that Latvia has
joined the Euro Area and the severe wage restraint of the crisis period is being unwound, the focus must
shift to generating productivity improvements that consistently exceed wage growth. A major effort should
be made, inter alia, on reforms to upgrade the country’s infrastructure, reduce skills mismatches in the labor
market, improve work incentives, speed up the judicial process and reform SOE governance.
Growth Prospects in Main Trading Partners
External debt increased slightly in 2014, owing to government Eurobond issuances and exchange rate
developments, but remains contained. The government issued 2 billion of Eurobonds in 2014 partly to
amortize European Commission loans. In addition, the euro value of dollar-denominated debt, estimated at
39.4 percent of GDP or 28.1 percent of total debt, has increased following the depreciation of the euro
against the dollar. However the largest share of dollar-denominated debt is owed by banks, mostly by NRD-
banks, the majority of whose assets are held abroad in liquid instruments, and which face restrictions on
currency mismatches. Over the medium-term external debt is expected to resume its post-crisis downward
trend, decreasing by more than 10 percentage points by the end of the projection period. Capital flows are
expected to be stable and sufficient to cover the modest CA deficit, as they have been for the past few years.
The main components of capital flows are government bond issuances, Nordic parent bank funding, and
NRDs.
__________________________ 1/
See Baltic Cluster Report, 2014, IMF Country Report No. ISCR/14/116
Euro Area, 47%
Russia, 16%
Poland, 7%
Sweden, 5%
Denmark, 4%
United Kingdom, 3%
Norway, 2%
Belarus, 2% Other, 14%
Export Shares1
(Percent of total exports)
Sources: Direction of Trade Statistics and IMF staff calculations.1 Based on exports of goods in 2013.
-5
-4
-3
-2
-1
0
1
2
3
4
Euro Area
Russia Poland Sweden Denmark United Kingdom
Norway Belarus
Real GDP Growth in Main Trading Partners, 2014-15
(Percent)
2014
2015
REP
UB
LIC O
F LA
TV
IA
60
70
80
90
100
110
120
130
140
Latvia
Lithuania
Estonia
Latvia: Export Profitability Compared to Euro Area, 2000-14
(Export Deflator/Nominal ULC)
Sources: European Commission and IMF staff calculations.

REPUBLIC OF LATVIA
18 INTERNATIONAL MONETARY FUND
Box 3. Republic of Latvia: Risk Assessment Matrix 1/
Risk Relative
Likelihood Impact if Realized
Side-effects from global financial conditions.
A surge in financial volatility:
As investors reassess underlying risk and move to safe-haven assets given slow and uneven growth as well as asymmetric monetary exit,
with poor market liquidity amplifying the effect on volatility.
High
Low/Medium
Could lower funding for Nordic parent banks
reliant on wholesale funding, further hindering
credit growth.
Protracted period of slower growth in
advanced and emerging economies.
Euro Area and Japan: Weak demand and persistently low inflation
from a failure to fully address crisis legacies and appropriately calibrate macro policies, leading to “new mediocre” rate of growth.
Emerging markets: Maturing of the cycle, misallocation of investment, and incomplete structural reforms
leading to prolonged slower growth.
High
Medium
High The Euro Area remains Latvia’s single largest
trade partner, while Russia and other CIS countries are also significant export destinations. A protracted slowdown would have a direct
impact on exports while also eroding business and consumer confidence.
Geopolitical fragmentation that erodes the
globalization process and fosters inefficiency.
Russia/Ukraine: The mounting conflict depresses business
confidence and heightens risk aversion, amid disturbances in global financial, trade and commodity markets.
Heightened risk of fragmentation/ state failure/security dislocation in the Middle East and some countries in Africa, leading to
a sharp rise in oil prices, with negative global spillovers.
Medium
Medium
High Escalating sanctions/countersanctions could threaten other sectors of the Latvian economy
(apart from food exports, which are already sanctioned). Non-resident deposits (NRDs) could be susceptible to sudden stops or reversals in
case of a sufficiently large shock.
Medium A sharp supply-driven rise in oil prices would remove an important factor supporting projected growth, especially in the near-term.
Bond market stress from a reassessment in
sovereign risk.
Euro Area: Sovereign stress re-emerges due to policy uncertainty, faltering reforms, and
political and social upheaval, particularly in Greece.
Medium
Medium A rise in sovereign spreads would raise the price
of external financing, but is unlikely to cause credit to be rationed, given the lack of macroeconomic imbalances and low public debt.
Failure to advance on structural reforms. Medium High
In the absence of structural reforms productivity
growth and the business environment would suffer, harming competitiveness and employment.
1/ The Risk Assessment Matrix (RAM) shows events that could materially alter the baseline path (the scenario most likely
to materialize in the view of IMF staff). The relative likelihood is the staff’s subjective assessment of the risks
surrounding the baseline (“low” is meant to indicate a probability below 10 percent, “medium” a probability between
10 and 30 percent, and “high” a probability between 30 and 50 percent). The RAM reflects staff views on the source of
risks and overall level of concern as of the time of discussions with the authorities. Non-mutually exclusive risks may
interact and materialize jointly.

REPUBLIC OF LATVIA
INTERNATIONAL MONETARY FUND 19
Figure 1. Republic of Latvia: Real Sector, 2009–14
REPUBLIC OF LATVIA
20 INTERNATIONAL MONETARY FUND
Figure 2. Republic of Latvia: Inflation and the Labor Market, 2007–14
Sources: Eurostat; Haver Analytics; Latvian Central Statistical Bureau; and IMF staff calculations.
-10
-5
0
5
10
15
20
25
Jan-09 Jan-10 Jan-11 Jan-12 Jan-13 Jan-14 Jan-15
HICP Inflation
(Year-on-year, percent )
Headline HICP
Energy HICP
Core HICP
500
600
700
800
900
1000
Dec-07 Dec-08 Dec-09 Dec-10 Dec-11 Dec-12 Dec-13 Dec-14
Average Gross Monthly Wages
(Euros, NSA)
Total
Public sector
Private sector
0
10
20
30
40
50
60
70
0
5
10
15
20
25
Dec-07 Dec-08 Dec-09 Dec-10 Dec-11 Dec-12 Dec-13 Dec-14
Unemployment Rate
(Percent, 15-74 years, NSA)
Unemployment rate
Long-term (share of total unemployed, RHS)-25
-20
-15
-10
-5
0
5
10
15
0
200
400
600
800
1000
1200
Dec-07 Dec-08 Dec-09 Dec-10 Dec-11 Dec-12 Dec-13 Dec-14
Employment
(Thousand of people, 15-74 years, NSA)
Employment growth (y-o-y, RHS)
Employment

REPUBLIC OF LATVIA
INTERNATIONAL MONETARY FUND 21
Figure 3. Republic of Latvia: Fiscal Developments, 2008–14

REPUBLIC OF LATVIA
22 INTERNATIONAL MONETARY FUND
Figure 4. Republic of Latvia: Financial Market Developments, 2006–15

REPUBLIC OF LATVIA
INTERNATIONAL MONETARY FUND 23
Figure 5. Republic of Latvia: Banking Sector Development, 2007–14

REPUBLIC OF LATVIA
24 INTERNATIONAL MONETARY FUND
Figure 6. Republic of Latvia: Balance of Payments, 2007–14

REPUBLIC OF LATVIA
INTERNATIONAL MONETARY FUND 25
Figure 7. Republic of Latvia: External Debt and Vulnerabilities in the Banking System
REPUBLIC OF LATVIA
26 INTERNATIONAL MONETARY FUND
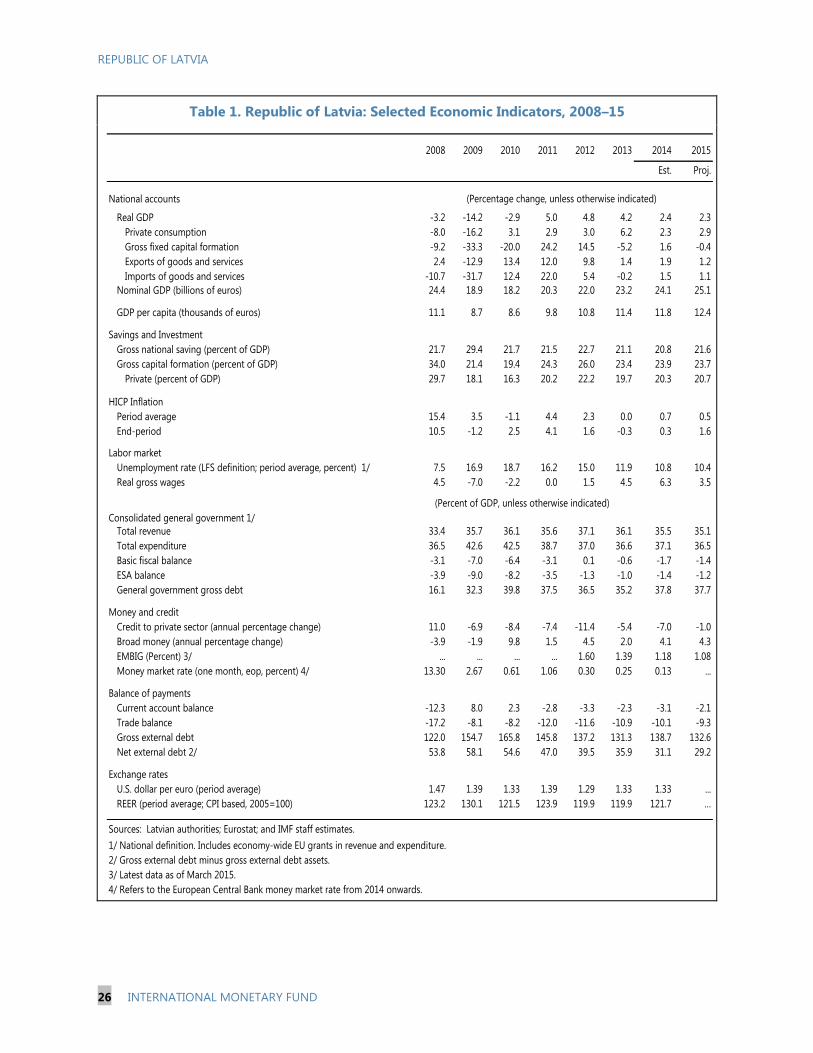
Table 1. Republic of Latvia: Selected Economic Indicators, 2008–15
2008 2009 2010 2011 2012 2013 2014 2015
Est. Proj.
National accounts
Real GDP -3.2 -14.2 -2.9 5.0 4.8 4.2 2.4 2.3
Private consumption -8.0 -16.2 3.1 2.9 3.0 6.2 2.3 2.9
Gross fixed capital formation -9.2 -33.3 -20.0 24.2 14.5 -5.2 1.6 -0.4
Exports of goods and services 2.4 -12.9 13.4 12.0 9.8 1.4 1.9 1.2
Imports of goods and services -10.7 -31.7 12.4 22.0 5.4 -0.2 1.5 1.1
Nominal GDP (billions of euros) 24.4 18.9 18.2 20.3 22.0 23.2 24.1 25.1
GDP per capita (thousands of euros) 11.1 8.7 8.6 9.8 10.8 11.4 11.8 12.4
Savings and Investment
Gross national saving (percent of GDP) 21.7 29.4 21.7 21.5 22.7 21.1 20.8 21.6
Gross capital formation (percent of GDP) 34.0 21.4 19.4 24.3 26.0 23.4 23.9 23.7
Private (percent of GDP) 29.7 18.1 16.3 20.2 22.2 19.7 20.3 20.7
HICP Inflation
Period average 15.4 3.5 -1.1 4.4 2.3 0.0 0.7 0.5
End-period 10.5 -1.2 2.5 4.1 1.6 -0.3 0.3 1.6
Labor market
Unemployment rate (LFS definition; period average, percent) 1/ 7.5 16.9 18.7 16.2 15.0 11.9 10.8 10.4
Real gross wages 4.5 -7.0 -2.2 0.0 1.5 4.5 6.3 3.5
Consolidated general government 1/
Total revenue 33.4 35.7 36.1 35.6 37.1 36.1 35.5 35.1
Total expenditure 36.5 42.6 42.5 38.7 37.0 36.6 37.1 36.5
Basic fiscal balance -3.1 -7.0 -6.4 -3.1 0.1 -0.6 -1.7 -1.4
ESA balance -3.9 -9.0 -8.2 -3.5 -1.3 -1.0 -1.4 -1.2
General government gross debt 16.1 32.3 39.8 37.5 36.5 35.2 37.8 37.7
Money and credit
Credit to private sector (annual percentage change) 11.0 -6.9 -8.4 -7.4 -11.4 -5.4 -7.0 -1.0
Broad money (annual percentage change) -3.9 -1.9 9.8 1.5 4.5 2.0 4.1 4.3
EMBIG (Percent) 3/ ... ... ... ... 1.60 1.39 1.18 1.08
Money market rate (one month, eop, percent) 4/ 13.30 2.67 0.61 1.06 0.30 0.25 0.13 ...
Balance of payments
Current account balance -12.3 8.0 2.3 -2.8 -3.3 -2.3 -3.1 -2.1
Trade balance -17.2 -8.1 -8.2 -12.0 -11.6 -10.9 -10.1 -9.3
Gross external debt 122.0 154.7 165.8 145.8 137.2 131.3 138.7 132.6
Net external debt 2/ 53.8 58.1 54.6 47.0 39.5 35.9 31.1 29.2
Exchange rates
U.S. dollar per euro (period average) 1.47 1.39 1.33 1.39 1.29 1.33 1.33 ...
REER (period average; CPI based, 2005=100) 123.2 130.1 121.5 123.9 119.9 119.9 121.7 …
Sources: Latvian authorities; Eurostat; and IMF staff estimates.
1/ National definition. Includes economy-wide EU grants in revenue and expenditure.
2/ Gross external debt minus gross external debt assets.
3/ Latest data as of March 2015.
4/ Refers to the European Central Bank money market rate from 2014 onwards.
(Percent of GDP, unless otherwise indicated)
(Percentage change, unless otherwise indicated)

REPUBLIC OF LATVIA
INTERNATIONAL MONETARY FUND 27
Table 2. Republic of Latvia: Macroeconomic Framework, 2010–20
2010 2011 2012 2013 2014 2015 2016 2017 2018 2019 2020
Est.
National accounts
Real GDP -2.9 5.0 4.8 4.2 2.4 2.3 3.3 3.7 3.9 3.9 4.0
Consumption 0.4 3.0 2.4 5.5 2.6 3.0 3.9 3.5 3.5 3.5 3.5
Private consumption 3.1 2.9 3.0 6.2 2.3 2.9 4.1 4.0 4.0 4.0 4.0
Public consumption -8.1 3.1 0.4 2.9 3.6 3.1 3.1 1.6 1.6 1.6 1.6
Gross capital formation -16.2 42.1 2.6 -4.0 0.2 0.0 7.4 4.0 4.5 5.0 5.0
Gross fixed capital formation -20.0 24.2 14.5 -5.2 1.6 -0.4 7.3 4.0 4.5 5.0 5.0
Stockbuilding 1.0 3.5 -2.6 0.3 -0.3 0.1 0.1 0.0 0.0 0.1 0.1
Exports of goods and services 13.4 12.0 9.8 1.4 1.9 1.2 2.6 4.9 4.8 4.7 4.7
Imports of goods and services 12.4 22.0 5.4 -0.2 1.5 1.1 4.9 4.6 4.5 4.5 4.5
Contributions to growth
Domestic demand -3.3 10.6 2.6 3.3 2.1 2.4 4.8 3.8 3.9 4.0 4.0
Net exports 0.3 -5.6 2.1 1.0 0.2 0.0 -1.5 0.0 0.0 -0.1 -0.1
HICP inflation
Period average -1.1 4.4 2.3 0.0 0.7 0.5 1.7 2.3 2.2 2.0 2.0
End-period 2.5 4.1 1.6 -0.3 0.3 1.6 1.7 2.3 2.2 2.0 2.0
Labor market
Unemployment rate (LFS definition; period average, percent) 18.7 16.2 15.0 11.9 10.8 10.4 10.2 9.8 9.6 9.4 9.3
Employment (period average, percent change) -5.8 2.2 1.6 2.1 -1.0 0.3 0.1 0.0 0.0 0.1 0.0
Real gross wages -2.2 0.0 1.5 4.5 6.3 3.5 3.2 3.7 3.8 3.9 3.9
Consolidated general government 1/
Total revenue 36.1 35.6 37.1 36.1 35.5 35.1 33.9 32.7 33.6 33.4 32.7
Total expenditure 42.5 38.7 37.0 36.6 37.1 36.5 34.9 34.5 34.1 33.7 33.2
ESA balance -8.2 -3.5 -1.3 -1.0 -1.4 -1.2 -0.9 -0.8 -0.5 -0.5 -0.5
ESA structural balance -2.8 -1.6 -0.1 -0.8 -0.9 -1.0 -0.8 -0.7 -0.5 -0.5 -0.5
General government gross debt 39.8 37.5 36.5 35.2 37.8 37.7 37.0 36.6 35.0 33.5 31.9
Saving and investment
Gross national saving 21.7 21.5 22.7 21.1 20.8 21.6 21.9 22.0 22.4 22.6 22.9
Private 24.5 19.9 18.4 17.3 17.8 18.8 18.4 19.0 18.2 18.2 18.5
Public 2/ -2.8 1.6 4.4 3.8 3.0 2.8 3.5 3.0 4.2 4.4 4.4
Foreign saving 3/ -2.3 2.8 3.3 2.3 3.1 2.1 2.8 2.7 2.4 2.3 2.2
Gross capital formation 19.4 24.3 26.0 23.4 23.9 23.7 24.6 24.7 24.8 24.9 25.1
Private 16.3 20.2 22.2 19.7 20.3 20.7 21.6 21.5 21.6 21.7 21.9
Public 3.1 4.1 3.8 3.7 3.6 3.0 3.1 3.1 3.2 3.2 3.2
External sector
Current account balance 2.3 -2.8 -3.3 -2.3 -3.1 -2.1 -2.8 -2.7 -2.4 -2.3 -2.2
Net IIP -81.2 -74.1 -67.3 -65.3 -61.2 -57.4 -55.2 -53.0 -50.2 -47.8 -45.5
Gross external debt 165.8 145.8 137.2 131.3 138.7 132.6 135.0 131.1 129.1 126.9 124.6
Net external debt 4/ 54.6 47.0 39.5 35.9 31.1 29.2 27.2 25.2 22.4 19.2 15.9
Memorandum items:
Nominal GDP (billions of euros) 18.2 20.3 22.0 23.2 24.1 25.1 26.3 27.9 29.6 31.4 33.3
Sources: Latvian authorities; and IMF staff estimates.
1/ National definition. Includes economy-wide EU grants in revenue and expenditure.
2/ Includes bank restructuring costs.
3/ Current account deficit
4/ Gross external debt minus gross external debt assets.
(Percent of GDP)
(Percentage change, unless otherwise indicated)
Proj.
REPUBLIC OF LATVIA
28 INTERNATIONAL MONETARY FUND
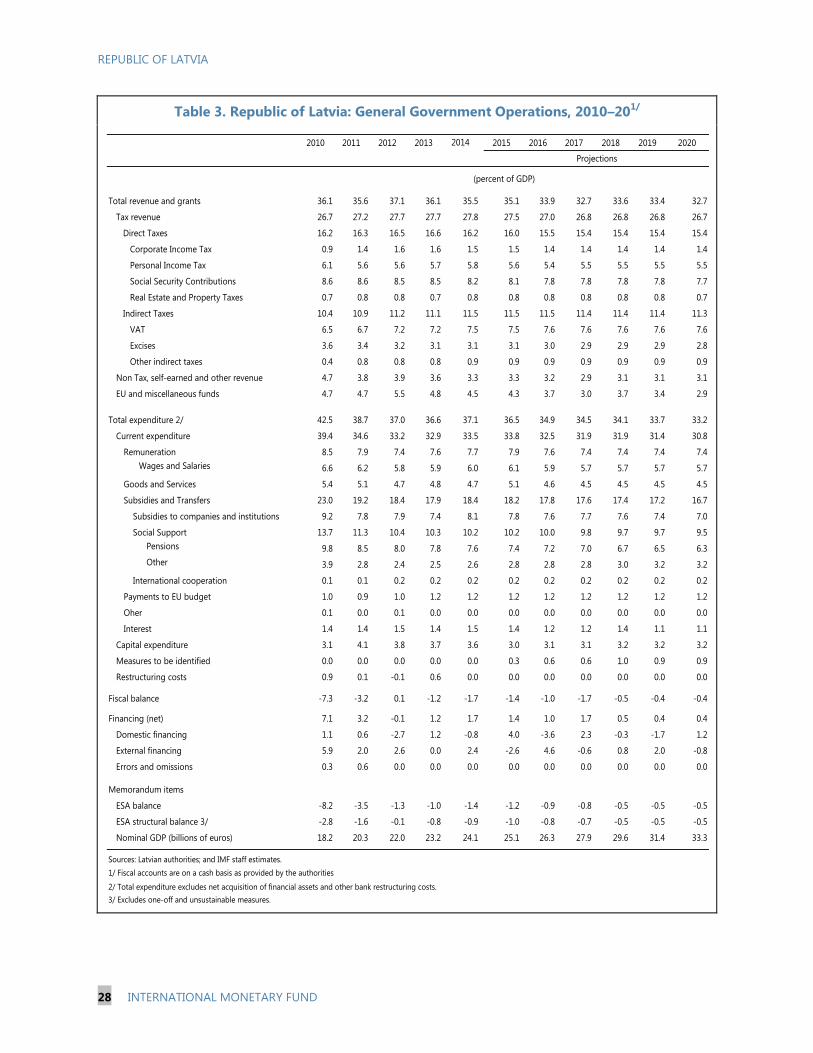
Table 3. Republic of Latvia: General Government Operations, 2010–201/
2010 2011 2012 2013 2015 2016 2017 2018 2019 2020
Total revenue and grants 36.1 35.6 37.1 36.1 35.5 35.1 33.9 32.7 33.6 33.4 32.7
Tax revenue 26.7 27.2 27.7 27.7 27.8 27.5 27.0 26.8 26.8 26.8 26.7
Direct Taxes 16.2 16.3 16.5 16.6 16.2 16.0 15.5 15.4 15.4 15.4 15.4
Corporate Income Tax 0.9 1.4 1.6 1.6 1.5 1.5 1.4 1.4 1.4 1.4 1.4
Personal Income Tax 6.1 5.6 5.6 5.7 5.8 5.6 5.4 5.5 5.5 5.5 5.5
Social Security Contributions 8.6 8.6 8.5 8.5 8.2 8.1 7.8 7.8 7.8 7.8 7.7
Real Estate and Property Taxes 0.7 0.8 0.8 0.7 0.8 0.8 0.8 0.8 0.8 0.8 0.7
Indirect Taxes 10.4 10.9 11.2 11.1 11.5 11.5 11.5 11.4 11.4 11.4 11.3
VAT 6.5 6.7 7.2 7.2 7.5 7.5 7.6 7.6 7.6 7.6 7.6
Excises 3.6 3.4 3.2 3.1 3.1 3.1 3.0 2.9 2.9 2.9 2.8
Other indirect taxes 0.4 0.8 0.8 0.8 0.9 0.9 0.9 0.9 0.9 0.9 0.9
Non Tax, self-earned and other revenue 4.7 3.8 3.9 3.6 3.3 3.3 3.2 2.9 3.1 3.1 3.1
EU and miscellaneous funds 4.7 4.7 5.5 4.8 4.5 4.3 3.7 3.0 3.7 3.4 2.9
Total expenditure 2/ 42.5 38.7 37.0 36.6 37.1 36.5 34.9 34.5 34.1 33.7 33.2
Current expenditure 39.4 34.6 33.2 32.9 33.5 33.8 32.5 31.9 31.9 31.4 30.8
Remuneration 8.5 7.9 7.4 7.6 7.7 7.9 7.6 7.4 7.4 7.4 7.4
Wages and Salaries 6.6 6.2 5.8 5.9 6.0 6.1 5.9 5.7 5.7 5.7 5.7
Goods and Services 5.4 5.1 4.7 4.8 4.7 5.1 4.6 4.5 4.5 4.5 4.5
Subsidies and Transfers 23.0 19.2 18.4 17.9 18.4 18.2 17.8 17.6 17.4 17.2 16.7
Subsidies to companies and institutions 9.2 7.8 7.9 7.4 8.1 7.8 7.6 7.7 7.6 7.4 7.0
Social Support 13.7 11.3 10.4 10.3 10.2 10.2 10.0 9.8 9.7 9.7 9.5
Pensions 9.8 8.5 8.0 7.8 7.6 7.4 7.2 7.0 6.7 6.5 6.3
Other 3.9 2.8 2.4 2.5 2.6 2.8 2.8 2.8 3.0 3.2 3.2
International cooperation 0.1 0.1 0.2 0.2 0.2 0.2 0.2 0.2 0.2 0.2 0.2
Payments to EU budget 1.0 0.9 1.0 1.2 1.2 1.2 1.2 1.2 1.2 1.2 1.2
Oher 0.1 0.0 0.1 0.0 0.0 0.0 0.0 0.0 0.0 0.0 0.0
Interest 1.4 1.4 1.5 1.4 1.5 1.4 1.2 1.2 1.4 1.1 1.1
Capital expenditure 3.1 4.1 3.8 3.7 3.6 3.0 3.1 3.1 3.2 3.2 3.2
Measures to be identified 0.0 0.0 0.0 0.0 0.0 0.3 0.6 0.6 1.0 0.9 0.9
Restructuring costs 0.9 0.1 -0.1 0.6 0.0 0.0 0.0 0.0 0.0 0.0 0.0
Fiscal balance -7.3 -3.2 0.1 -1.2 -1.7 -1.4 -1.0 -1.7 -0.5 -0.4 -0.4
Financing (net) 7.1 3.2 -0.1 1.2 1.7 1.4 1.0 1.7 0.5 0.4 0.4
Domestic financing 1.1 0.6 -2.7 1.2 -0.8 4.0 -3.6 2.3 -0.3 -1.7 1.2
External financing 5.9 2.0 2.6 0.0 2.4 -2.6 4.6 -0.6 0.8 2.0 -0.8
Errors and omissions 0.3 0.6 0.0 0.0 0.0 0.0 0.0 0.0 0.0 0.0 0.0
Memorandum items
ESA balance -8.2 -3.5 -1.3 -1.0 -1.4 -1.2 -0.9 -0.8 -0.5 -0.5 -0.5
ESA structural balance 3/ -2.8 -1.6 -0.1 -0.8 -0.9 -1.0 -0.8 -0.7 -0.5 -0.5 -0.5
Nominal GDP (billions of euros) 18.2 20.3 22.0 23.2 24.1 25.1 26.3 27.9 29.6 31.4 33.3
Sources: Latvian authorities; and IMF staff estimates.
1/ Fiscal accounts are on a cash basis as provided by the authorities
2/ Total expenditure excludes net acquisition of financial assets and other bank restructuring costs.
3/ Excludes one-off and unsustainable measures.
Table 3. Latvia: General Government Operations, 2010-20 1/
Projections
(percent of GDP)
2014

REPUBLIC OF LATVIA
INTERNATIONAL MONETARY FUND 29
Table 4. Republic of Latvia: Medium-Term Balance of Payments, 2010–20
2010 2011 2012 2013 2014 2015 2016 2017 2018 2019 2020
Est.
Current account 2.3 -2.8 -3.3 -2.3 -3.1 -2.1 -2.8 -2.7 -2.4 -2.3 -2.2
Goods and services (fob) -1.0 -4.7 -4.3 -3.3 -2.9 -2.1 -3.6 -3.5 -3.2 -3.1 -2.9
Goods (fob) -8.2 -12.0 -11.6 -10.9 -10.1 -9.3 -10.5 -10.4 -10.3 -10.1 -10.0
Exports 36.6 40.9 43.8 42.2 42.1 40.4 40.1 40.3 40.4 40.5 40.6
Imports -44.8 -52.9 -55.4 -53.2 -52.2 -49.7 -50.6 -50.8 -50.7 -50.6 -50.6
Services 7.2 7.3 7.4 7.6 7.3 7.2 6.9 7.0 7.0 7.1 7.1
Credit 16.8 17.1 17.1 16.8 16.0 15.7 15.6 15.7 15.7 15.8 15.8
Debit -9.6 -9.8 -9.7 -9.2 -8.7 -8.5 -8.7 -8.7 -8.7 -8.7 -8.7
Primary Income 1.0 0.0 -0.6 -0.3 -0.8 -0.9 -1.0 -1.0 -1.3 -1.5 -1.7
Compensation of employees 2.4 2.3 2.3 2.2 2.3 2.3 2.3 2.3 2.2 2.2 2.2
Investment income -2.6 -3.4 -4.2 -3.8 -3.8 -3.9 -3.9 -3.9 -4.1 -4.2 -4.4
Secondary Income 2.3 1.9 1.6 1.3 0.5 0.9 1.8 1.8 2.2 2.2 2.3
of which: from EU 4.7 4.7 5.5 4.8 4.5 4.3 3.7 3.0 3.7 3.4 3.2
Capital and financial account -4.1 2.5 2.3 1.5 -1.0 2.1 2.8 2.7 2.4 2.3 2.2
Capital account 1.9 2.1 3.0 2.5 3.0 3.4 2.3 1.8 2.0 1.9 1.8
Financial account -6.1 0.4 -0.7 -1.0 -4.0 -1.4 0.5 0.9 0.3 0.4 0.4
Direct investment 1.5 4.9 3.2 1.6 1.1 1.9 2.1 2.4 2.7 3.1 3.6
Portfolio investment and financial derivatives -2.8 -1.8 4.7 0.1 -0.5 0.4 2.8 -2.1 -0.3 1.2 -0.7
of which: general government net issuance -0.1 1.2 7.3 -0.3 6.8 2.4 4.9 -0.3 1.7 2.9 1.0
Other investment -0.7 -7.2 -5.1 -1.0 -5.0 -3.7 -4.4 0.7 -2.1 -4.0 -2.5
Reserve assets -4.0 4.5 -3.6 -1.7 0.5 0.0 0.0 0.0 0.0 0.0 0.0
Errors and omissions 1.8 0.3 1.0 0.8 4.1 0.0 0.0 0.0 0.0 0.0 0.0
Goods and Services
Export value (fob) 18.9 21.3 13.9 2.2 1.8 0.7 4.1 6.7 6.5 6.1 6.3
Import value (fob) 19.8 28.7 12.7 0.9 1.2 -0.4 6.8 6.5 6.1 5.8 6.0
Export volume 13.4 12.0 9.8 1.4 1.9 1.2 2.6 4.9 4.8 4.7 4.7
Import volume 12.4 22.0 5.4 -0.2 1.5 1.1 4.9 4.6 4.5 4.5 4.5
Gross reserves (billions of euros) 5.8 4.9 5.7 5.8 2.7 2.7 2.7 2.7 2.7 2.7 2.7
Gross external debt (percent of GDP) 165.8 145.8 137.2 131.3 138.7 132.6 135.0 131.1 129.1 126.9 124.6
Medium and long term (percent of GDP) 113.0 100.4 87.2 77.3 76.0 68.7 71.0 67.7 66.5 65.1 63.7
Short term (percent of GDP)1 52.8 45.4 50.0 54.0 62.7 63.9 64.0 63.4 62.6 61.8 60.9
Net external debt (percent of GDP)2 54.6 47.0 39.5 35.9 31.1 29.2 27.2 25.2 22.4 19.2 15.9
Memo items
Nominal GDP (billions of euros) 18.2 20.3 22.0 23.2 24.1 25.1 26.3 27.9 29.6 31.4 33.3
U.S. dollar per euro (period average) 1.33 1.39 1.29 1.33 1.33 … … … … … …
Sources: Latvian authorities; and IMF staff estimates.1 Based on detailed data until 2013. Extrapolated for debt outside the public sectors and MFIs starting 2014.
2 Gross external debt minus gross external debt assets.
(Percent change, unless otherwise indicated)
(Percent of GDP, unless otherwise indicated)
Projections

REPUBLIC OF LATVIA
30 INTERNATIONAL MONETARY FUND
Table 5. Republic of Latvia: Financial Soundness Indicators, 2006–14
(in percent, unless otherwise indicated)
Dec-06 Dec-07 Dec-08 Dec-09 Dec-10 Dec-11 Dec-12 Dec-13 Dec-14
Commercial banks
Capital Adequacy
Regulatory capital to risk-weighted assets 1/ 10.2 11.1 11.80 14.6 14.6 17.4 17.60 18.9 17.9
Regulatory Tier I capital to risk-weighted assets 1/ 8.8 9.8 10.50 11.5 11.5 14.2 15.20 17.3 17.9
Capital and reserves to assets 7.6 7.9 7.30 7.4 7.3 7.5 9.36 9.9 9.9
Asset Quality
Annual growth of bank loans 56.2 37.2 11.2 -7.0 -7.1 -8.1 -10.9 -6.5 -6.1
Sectoral distribution of loans (in % of total loans, stock) 100.0 100.0 100.0 100.0 100.0 100.0 100.0 100.0 100.0
Agriculture, hunting and related service activities 1.8 1.6 1.7 1.6 1.6 2.0 2.4 3.2 2.8
Construction and real estate activities 18.9 18.8 19.6 20.8 20.4 20.0 18.6 18.1 17.9
Industry and trade 22.0 21.6 23.1 22.3 22.0 22.0 24.3 24.2 22.0
Financial intermediation 8.0 6.0 6.0 4.5 3.2 2.8 2.7 3.6 4.7
Households 39.4 40.0 38.4 39.3 39.8 40.0 39.1 38.4 37.8
Non-residents 9.9 12.1 11.2 11.4 13.1 13.2 12.9 12.6 14.0
Loans past due over 90 days 0.5 0.8 3.6 16.4 19.0 17.5 11.1 8.3 6.9
Loans to households 4.7 16.8 18.4 19.3 15.2 12.0 9.5
Loans to corporations 2.8 18.5 20.8 16.2 9.7 7.0 5.9
Earnings and Profitability
ROA (after tax) 2.1 2.0 0.3 -3.5 -1.6 -0.9 0.6 0.9 1.1
ROE (after tax) 25.6 24.3 4.6 -41.6 -20.4 -11.2 5.6 8.7 11.1
Liquidity
Liquid assets to total assets 23.9 25.0 21.6 21.1 27.3 27.4 32.3 36.5 39.9
Liquid assets to short term liabilities 51.1 55.7 52.8 62.8 67.9 63.9 59.8 64.4 63.1
Customers deposits to (non-interbank) loans 71.3 68.2 58.8 61.9 77.5 84.1 106.3 124.9 158.4
Sensitivity to Market Risk
FX deposits to total deposits 2/ 70.7 69.4 74.5 72.6 73.5 76.2 75.9 40.3
FX loans to total loans 2/ 81.8 85.0 87.1 88.9 86.3 84.5 88.5 13.0
Memorandum Items
Number of banks dealing with residents 3/ 9.0 9.0 14.0 15.0 15.0 17.0 13.0 13.0 11.0
Number of banks dealing with non-residents 3/ 14.0 14.0 13.0 12.0 14.0 13.0 16.0 15.0 15.0
Assets of banks dealing with residents/Total banking system assets 3/ 51.1 60.8 63.9 78.4 66.6 63.3 54.5 54.8 49.2
Assets of banks dealing with non-residents/Total banking system assets 3/ 48.9 39.2 36.1 21.6 33.4 36.7 45.5 45.2 50.8
Source: CSB, BoL, FCMC, Latvian Leasing Association, staff calculations
1/ Regulatory Tier 1 capital to risk weighted assets as from Dec 2009 is calculated as Tier 1 capital (including deduction)/risk-weighted assets
Regulatory capital to risk-weighted assets and Regulatory Tier 1 capital to risk-weighted assets in the column of Dec 2014 uses data from Sep 2014.
2/ Euro-denominated positions are included in and before 2013, but not in 2014.
3/ Banks dealing with residents (non-residents) are defined as banks in which non-resident non-MFI deposits are below (above) 20 percent of their assets.
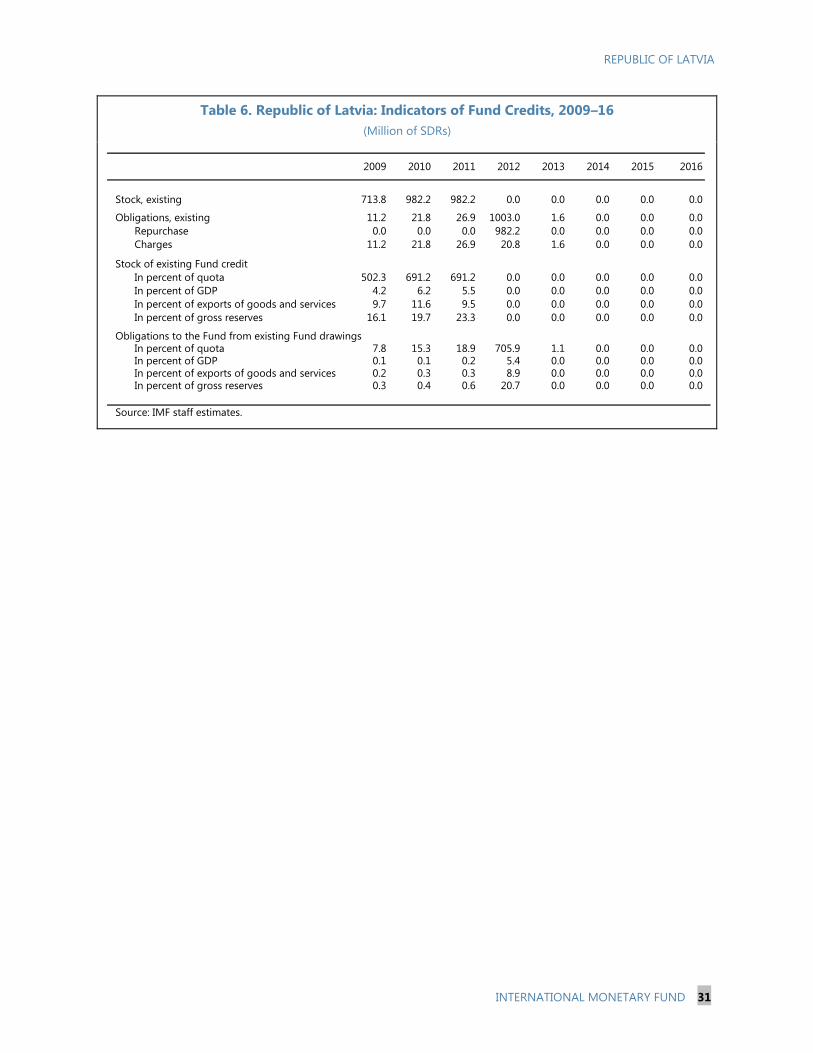
REPUBLIC OF LATVIA
INTERNATIONAL MONETARY FUND 31
Table 6. Republic of Latvia: Indicators of Fund Credits, 2009–16
(Million of SDRs)
2009 2010 2011 2012 2013 2014 2015 2016
Stock, existing 713.8 982.2 982.2 0.0 0.0 0.0 0.0 0.0
Obligations, existing 11.2 21.8 26.9 1003.0 1.6 0.0 0.0 0.0
Repurchase 0.0 0.0 0.0 982.2 0.0 0.0 0.0 0.0
Charges 11.2 21.8 26.9 20.8 1.6 0.0 0.0 0.0
Stock of existing Fund credit
In percent of quota 502.3 691.2 691.2 0.0 0.0 0.0 0.0 0.0
In percent of GDP 4.2 6.2 5.5 0.0 0.0 0.0 0.0 0.0
In percent of exports of goods and services 9.7 11.6 9.5 0.0 0.0 0.0 0.0 0.0
In percent of gross reserves 16.1 19.7 23.3 0.0 0.0 0.0 0.0 0.0
Obligations to the Fund from existing Fund drawingsIn percent of quota 7.8 15.3 18.9 705.9 1.1 0.0 0.0 0.0In percent of GDP 0.1 0.1 0.2 5.4 0.0 0.0 0.0 0.0In percent of exports of goods and services 0.2 0.3 0.3 8.9 0.0 0.0 0.0 0.0In percent of gross reserves 0.3 0.4 0.6 20.7 0.0 0.0 0.0 0.0
Source: IMF staff estimates.

REPUBLIC OF LATVIA
32 INTERNATIONAL MONETARY FUND
Annex I. Public Debt Sustainability Analysis (DSA) */
Republic of Latvia: Public Sector Debt Sustainability Analysis (DSA)––Baseline Scenario
(in percent of GDP unless otherwise indicated)
As of March 10, 20152/
2013 2014 2015 2016 2017 2018 2019 2020 Sovereign Spreads
Nominal gross public debt 21.7 34.9 37.9 37.8 37.2 37.0 35.5 34.4 33.3 EMBIG (bp) 3/ 1
Public gross financing needs 4.4 0.6 3.6 10.7 6.2 9.8 6.0 5.9 10.7 5Y CDS (bp) 92
Real GDP growth (in percent) 3.3 4.2 2.4 2.3 3.3 3.7 3.9 3.9 4.0 Ratings Foreign Local
Inflation (GDP deflator, in percent) 6.9 1.1 1.2 1.8 1.6 2.2 2.2 2.0 2.1 Moody's A3 A3
Nominal GDP growth (in percent) 10.9 5.3 3.6 4.2 5.0 6.0 6.2 6.0 6.1 S&Ps A- A-
Effective interest rate (in percent) 4/ 5.3 4.2 4.3 4.1 3.7 4.0 4.6 4.9 5.2 Fitch A- A-
2013 2014 2015 2016 2017 2018 2019 2020 cumulative
Change in gross public sector debt 2.6 -0.8 3.0 0.0 -0.6 -0.2 -1.5 -1.2 -1.1 -4.6
Identified debt-creating flows 1.6 -3.0 2.7 0.1 -0.4 0.0 -1.2 -0.9 -0.8 -3.3
Primary deficit 2.1 -0.3 0.4 0.1 0.0 0.7 -0.7 -0.6 -0.5 -0.9
Primary (noninterest) revenue and grants 34.5 36.1 35.3 34.9 33.7 32.5 33.4 33.2 32.6 200.4
Primary (noninterest) expenditure 36.7 35.8 35.7 35.0 33.7 33.3 32.7 32.6 32.1 199.5
Automatic debt dynamics 5/
-0.5 -2.8 2.3 0.0 -0.5 -0.7 -0.6 -0.4 -0.3 -2.5
Interest rate/growth differential 6/
-0.7 -1.5 -0.8 0.0 -0.5 -0.7 -0.6 -0.4 -0.3 -2.5
Of which: real interest rate -0.4 -0.1 0.0 0.8 0.7 0.6 0.8 0.9 1.0 4.8
Of which: real GDP growth -0.3 -1.4 -0.8 -0.8 -1.2 -1.3 -1.4 -1.3 -1.3 -7.3
Exchange rate depreciation 7/
0.2 -1.3 3.2 … … … … … … …
Other identified debt-creating flows 0.0 0.0 0.0 0.0 0.0 0.0 0.0 0.0 -0.1 0.1
Privatization/Drawdown of Deposits (+ reduces financing need) (negative)0.0 0.0 0.0 0.0 0.0 0.0 0.0 0.0 -0.1 0.1
Contingent liabilities 0.0 0.0 0.0 0.0 0.0 0.0 0.0 0.0 0.0 0.0
Please specify (2) (e.g., ESM and Euroarea loans)0.0 0.0 0.0 0.0 0.0 0.0 0.0 0.0 0.0 0.0
Residual, including asset changes 8/
0.9 2.2 0.3 -0.1 -0.2 -0.2 -0.2 -0.2 -0.2 -1.3
Source: IMF staff.
*/ Latvia is characterized as a low-scrutiny contry despite financing needs marginally exceed the 10 percent threshold in two years, 2015 and 2020. The excess in 2020 is
1/ Public sector is defined as general government.
2/ Based on available data.
3/ Long-term bond spread over German bonds.
4/ Defined as interest payments divided by debt stock (excluding guarantees) at the end of previous year.
5/ Derived as [(r - π(1+g) - g + ae(1+r)]/(1+g+π+gπ)) times previous period debt ratio, with r = interest rate; π = growth rate of GDP deflator; g = real GDP growth rate;
a = share of foreign-currency denominated debt; and e = nominal exchange rate depreciation (measured by increase in local currency value of U.S. dollar).
6/ The real interest rate contribution is derived from the numerator in footnote 5 as r - π (1+g) and the real growth contribution as -g.
7/ The exchange rate contribution is derived from the numerator in footnote 5 as ae(1+r).
8/ Includes asset changes and interest revenues (if any). For projections, includes exchange rate changes during the projection period.
9/ Assumes that key variables (real GDP growth, real interest rate, and other identified debt-creating flows) remain at the level of the last projection year.
marginal, while financing needs in 2015 are already mostly convered. Latvia has been very successful in accessing markets recently and have been repeatedly upgraded by
by rating agencies.
-0.4
balance 9/
primary
Debt, Economic and Market Indicators 1/
2004-2012
Actual
Projections
Contribution to Changes in Public Debt
Projections
2004-2012
Actual
debt-stabilizing
-10
-5
0
5
10
15
20
2004 2005 2006 2007 2008 2009 2010 2011 2012 2013 2014 2015 2016 2017 2018 2019 2020
Debt-Creating Flows
Primary deficit Real GDP growth Real interest rate Exchange rate depreciation
Other debt-creating flows Residual Change in gross public sector debt
projection
(in percent of GDP)
-12
-10
-8
-6
-4
-2
0
2
4
6
cumulative
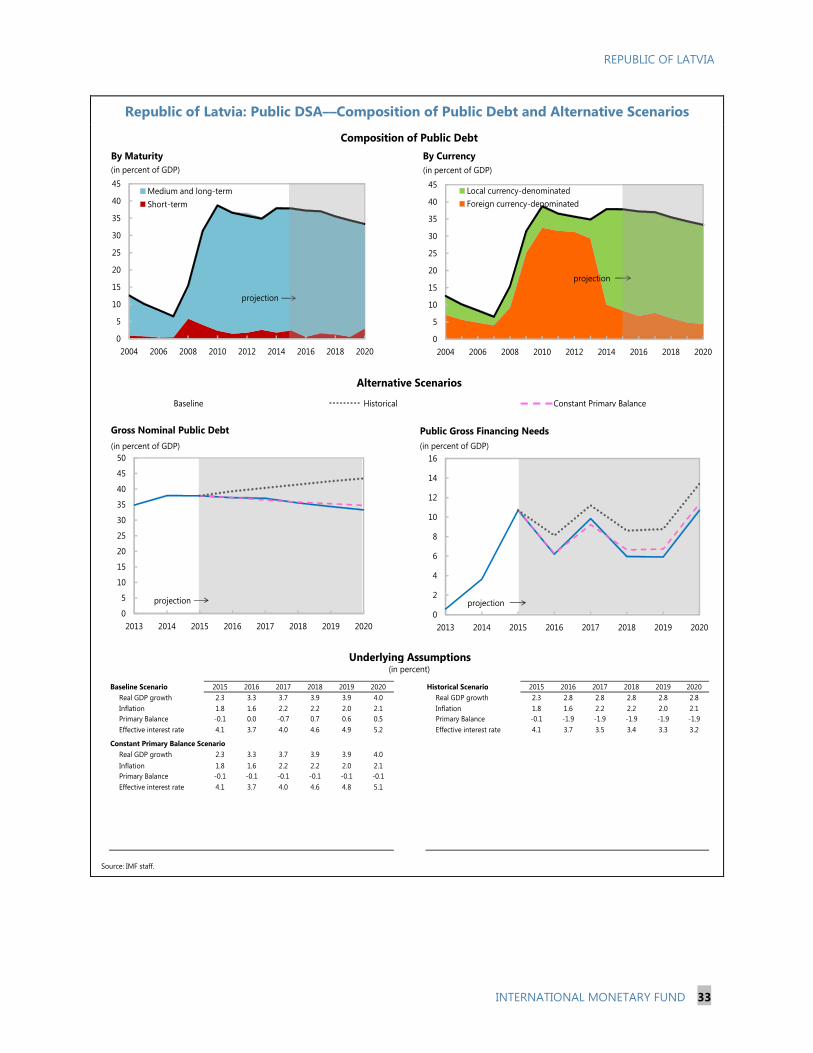
REPUBLIC OF LATVIA
INTERNATIONAL MONETARY FUND 33
Republic of Latvia: Public DSA––Composition of Public Debt and Alternative Scenarios
Baseline Scenario 2015 2016 2017 2018 2019 2020 Historical Scenario 2015 2016 2017 2018 2019 2020
Real GDP growth 2.3 3.3 3.7 3.9 3.9 4.0 Real GDP growth 2.3 2.8 2.8 2.8 2.8 2.8
Inflation 1.8 1.6 2.2 2.2 2.0 2.1 Inflation 1.8 1.6 2.2 2.2 2.0 2.1
Primary Balance -0.1 0.0 -0.7 0.7 0.6 0.5 Primary Balance -0.1 -1.9 -1.9 -1.9 -1.9 -1.9
Effective interest rate 4.1 3.7 4.0 4.6 4.9 5.2 Effective interest rate 4.1 3.7 3.5 3.4 3.3 3.2
Constant Primary Balance Scenario
Real GDP growth 2.3 3.3 3.7 3.9 3.9 4.0
Inflation 1.8 1.6 2.2 2.2 2.0 2.1
Primary Balance -0.1 -0.1 -0.1 -0.1 -0.1 -0.1
Effective interest rate 4.1 3.7 4.0 4.6 4.8 5.1
Source: IMF staff.
Composition of Public Debt
Alternative Scenarios
Baseline Historical Constant Primary Balance
Underlying Assumptions(in percent)
0
5
10
15
20
25
30
35
40
45
50
2013 2014 2015 2016 2017 2018 2019 2020
Gross Nominal Public Debt
(in percent of GDP)
projection
0
2
4
6
8
10
12
14
16
2013 2014 2015 2016 2017 2018 2019 2020
Public Gross Financing Needs
(in percent of GDP)
projection
0
5
10
15
20
25
30
35
40
45
2004 2006 2008 2010 2012 2014 2016 2018 2020
By Maturity
Medium and long-term
Short-term
projection
(in percent of GDP)
0
5
10
15
20
25
30
35
40
45
2004 2006 2008 2010 2012 2014 2016 2018 2020
By Currency
Local currency-denominated
Foreign currency-denominated
projection
(in percent of GDP)

Republic of Latvia: External Debt Sustainability Framework, 2009–19
(in percent of GDP, unless otherwise indicated)
An
nex II. E
xte
rnal D
eb
t Su
stain
ab
ility A
naly
sis (DS
A)
2009 2010 2011 2012 2013 2014 2015 2016 2017 2018 2019 Debt-stabilizing
non-interest
current account 6/
Baseline: External debt 154.7 165.8 145.8 137.2 131.3 138.7 132.6 135.0 131.1 129.1 126.9 -7.5
Change in external debt 32.7 11.1 -20.0 -8.6 -5.9 7.3 -6.1 2.4 -3.9 -2.0 -2.2
Identified external debt-creating flows (4+8+9) 38.7 10.7 -25.4 0.6 -11.0 -1.7 -3.4 -3.3 -4.2 -4.9 -5.4
Current account deficit, excluding interest payments -16.5 -8.4 -2.4 -1.0 -0.8 0.1 -1.1 -0.3 -0.5 -0.8 -0.8
Deficit in balance of goods and services 0.5 1.0 4.7 4.3 3.3 2.9 2.1 3.6 3.5 3.2 3.1
Exports 43.2 53.4 58.0 60.8 59.0 58.0 56.1 55.7 56.0 56.2 56.2
Imports 43.7 54.5 62.7 65.1 62.3 60.9 58.2 59.2 59.5 59.4 59.3
Net non-debt creating capital inflows (negative) 2.2 -1.1 -3.9 -2.2 -2.2 -1.8 -2.0 -1.9 -2.2 -2.5 -2.9
Automatic debt dynamics 1/ 53.0 20.3 -19.0 3.8 -8.0 0.0 -0.2 -1.1 -1.5 -1.6 -1.7
Contribution from nominal interest rate 8.5 6.1 5.3 4.3 3.1 3.0 3.1 3.1 3.2 3.1 3.1
Contribution from real GDP growth 23.6 4.9 -7.1 -7.0 -5.3 -3.0 -3.4 -4.2 -4.7 -4.7 -4.7
Contribution from price and exchange rate changes 2/ 20.9 9.3 -17.2 6.5 -5.8 ... ... ... ... ... ...
Residual, incl. change in gross foreign assets (2-3) 3/ -5.9 0.4 5.4 -9.2 5.1 9.0 -2.8 5.8 0.3 2.9 3.2
External debt-to-exports ratio (in percent) 357.9 310.3 251.5 225.6 222.5 239.0 236.2 242.6 234.0 229.8 225.6
Gross external financing need (in billions of US dollars) 4/ 18.8 19.7 20.4 20.0 22.2 22.8 22.0 21.4 23.7 24.3 25.9
in percent of GDP 71.6 81.7 72.3 70.6 71.9 10-Year 10-Year 71.2 73.1 67.5 69.7 66.7 66.2
Scenario with key variables at their historical averages 5/ 138.7 116.8 115.9 111.8 109.9 107.6 -8.9
Historical Standard
Key Macroeconomic Assumptions Underlying Baseline Average Deviation
Real GDP growth (in percent) -14.2 -2.9 5.0 4.8 4.2 3.4 8.0 2.4 2.3 3.3 3.7 3.9 3.9
GDP deflator in US dollars (change in percent) -14.6 -5.7 11.6 -4.3 4.4 8.5 13.7 1.3 -8.1 2.1 3.3 3.4 3.1
Nominal external interest rate (in percent) 5.1 3.6 3.7 2.9 2.5 4.7 2.6 2.4 2.1 2.5 2.5 2.6 2.5
Growth of exports (US dollar terms, in percent) -21.3 13.2 27.2 5.3 5.6 18.2 18.8 1.9 -9.1 4.6 7.8 7.8 7.2
Growth of imports (US dollar terms, in percent) -38.1 14.1 34.9 4.1 4.2 71.0 172.9 1.3 -10.1 7.3 7.6 7.4 6.9
Current account balance, excluding interest payments 16.5 8.4 2.4 1.0 0.8 -2.5 11.1 -0.1 1.1 0.3 0.5 0.8 0.8
Net non-debt creating capital inflows -2.2 1.1 3.9 2.2 2.2 2.4 2.2 1.8 2.0 1.9 2.2 2.5 2.9
1/ Derived as [r - g - r(1+g) + ea(1+r)]/(1+g+r+gr) times previous period debt stock, with r = nominal effective interest rate on external debt; r = change in domestic GDP deflator in US dollar terms, g = real GDP growth rate,
e = nominal appreciation (increase in dollar value of domestic currency), and a = share of domestic-currency denominated debt in total external debt.
2/ The contribution from price and exchange rate changes is defined as [-r(1+g) + ea(1+r)]/(1+g+r+gr) times previous period debt stock. r increases with an appreciating domestic currency (e > 0) and rising inflation (based on GDP deflator).
3/ For projection, line includes the impact of price and exchange rate changes.
4/ Defined as current account deficit, plus amortization on medium- and long-term debt, plus short-term debt at end of previous period.
5/ The key variables include real GDP growth; nominal interest rate; dollar deflator growth; and both non-interest current account and non-debt inflows in percent of GDP.
6/ Long-run, constant balance that stabilizes the debt ratio assuming that key variables (real GDP growth, nominal interest rate, dollar deflator growth, and non-debt inflows in percent of GDP) remain at their levels
of the last projection year.
Actual
Table 1. Latvia: External Debt Sustainability Framework, 2009-2019
(In percent of GDP, unless otherwise indicated)
Projections
REP
UB
LIC O
F LA
TV
IA
34
INTER
NA
TIO
NA
L MO
NETA
RY
FU
ND

REPUBLIC OF LATVIA
INTERNATIONAL MONETARY FUND 35
Republic of Latvia: External Debt Sustainability: Bound Tests 1/
2/
(External debt percent of GDP)
i-rate
shock135
Baseline 127
0
50
100
150
200
2009 2011 2013 2015 2017 2019
Interest rate shock (in percent)
Sources: International Monetary Fund, Country desk data, and staff estimates.
1/ Shaded areas represent actual data. Individual shocks are permanent one-half standard deviation
shocks. Figures in the boxes represent average projections for the respective variables in the baseline
and scenario being presented. Ten-year historical average for the variable is also shown.
2/ For historical scenarios, the historical averages are calculated over the ten-year period, and the
information is used to project debt dynamics five years ahead.
3/ Permanent 1/4 standard deviation shocks applied to real interest rate, growth rate, and current
account balance.
4/ One-time nominal depreciation of 30 percent occurs in 2010.
Historical 108
Baseline
127
0
50
100
150
200
0
50
100
150
200
2009 2011 2013 2015 2017 2019
Baseline and historical scenarios
CA shock 153
Baseline 127
0
50
100
150
200
2009 2011 2013 2015 2017 2019
Combine
d shock
158
Baseline 127
0
50
100
150
200
2009 2011 2013 2015 2017 2019
Combined shock 3/
30 % depreciation 142
Baseline 127
0
50
100
150
200
2009 2011 2013 2015 2017 2019
Nominal depreciation shock 4/
Gross financing need
under baseline
(right scale)
Non-interest current account shock
(in percent of GDP)
Growth
shock 155
Baseline 127
0
50
100
150
200
2009 2011 2013 2015 2017 2019
Baseline:
Scenario:
Historical:
2.4
3.8
4.7
Baseline:
Scenario:
Historical:
3.4
-0.6
3.4
Baseline:
Scenario:
Historical:
0.7
-4.9
-2.5
Growth shock
(in percent per year)

REPUBLIC OF LATVIA
STAFF REPORT FOR THE 2015 ARTICLE IV
CONSULTATION—INFORMATIONAL ANNEX
Prepared By
European Department
FUND RELATIONS _______________________________________________________________________ 2
STATISTICAL ISSUES ____________________________________________________________________ 6
CONTENTS
April 9, 2015

REPUBLIC OF LATVIA
2 INTERNATIONAL MONETARY FUND
FUND RELATIONS
(As of April 9, 2015)
Membership Status: Joined May 19, 1992; Article VIII
General Resources Account:
SDR Million Percent of Quota
Quota 142.10 100.00
Fund holdings of currency (Exchange Rate) 142.06 99.97
Reserve Tranche Position 0.06 0.04
SDR Department:
SDR Million Percent of Allocation
Net cumulative allocation 120.82 100.00
Holdings 120.82 100.00
Outstanding Purchases and Loans: None
Latest Financial Arrangements:
Date of Expiration Amount Approved Amount Drawn
Type Arrangement Date (SDR Million) (SDR Million)
Stand-By Dec 23, 2008 Dec 22, 2011 1,521.63 982.24
Stand-By Apr 20, 2001 Dec 19, 2002 33.00 0.00
Stand-By Dec 10, 1999 Apr 09, 2001 33.00 0.00
Projected Payments to Fund:
(SDR Million; based on existing use of resources and present holdings of SDRs):
Forthcoming
2014 2015 2016 2017 2018
Principal 0.00 0.00 0.00 0.00 0.00
Charges/Interest 0.00 0.00 0.00 0.00 0.00
Total 0.00 0.00 0.00 0.00 0.00

REPUBLIC OF LATVIA
INTERNATIONAL MONETARY FUND 3
Exchange Rate Arrangement:
As of January 1, 2014, the currency of Latvia is the euro, which floats freely and independently against
other currencies. Prior to 2014, the currency of Latvia was the lat, which was introduced in March 1993
to replace the Latvian ruble. The exchange rate was pegged to the SDR from February 1994 to
December 2004, within a ±1 percent band. On January 1, 2005, the lat was re-pegged to the euro at
the rate 1 euro = 0.702804 lats, and on April 29, 2005, Latvia entered ERM II, maintaining the previous
band width. Latvia maintains an exchange system free of restrictions on the payments or transfers for
current international transactions. Exchange restrictions maintained for security reasons have been
notified to the Fund for approval most recently in January 2013 (see EBD/13/3, January 28, 2013).
Previous Article IV Consultation:
Latvia is on the 12-month consultation cycle. The last Article IV consultation was concluded on
May 2, 2014 (IMF Country Report No. 14/115). The Executive Board assessment is available at
http://www.imf.org/external/np/sec/pr/2014/pr14205.htm.
Safeguards Assessment:
The safeguards assessment completed on July 8, 2009 concluded that the Bank of Latvia (BoL)
operates robust internal audit and control systems. The assessment recommended clarifying the
respective roles of the BoL and the Treasury in holding, managing, and reporting to the Fund audited
international reserves data. It also recommended amendments to the mandate of the BoL’s audit
committee and improvements to the financial statements' disclosures. The authorities have already
taken steps to implement these recommendations, notably by establishing a formal arrangement
between the BoL and the Treasury, revising the audit committee charter and expanding the existing
accounting framework.
FSAP Participation and ROSCs:
A joint World Bank-International Monetary Fund mission conducted an assessment of Latvia’s
financial sector as part of the Financial Sector Assessment Program (FSAP) during
February 14–28, 2001. The Financial Sector Stability Assessment (FSSA) report was discussed at the
Board on January 18, 2002, together with the 2001 Article IV staff report (Country Report No. 02/10).
An AML/CFT assessment mission took place during March 8–24, 2006, and the report was sent to the
Board on May 23, 2007. A joint IMF-World Bank mission conducted an FSAP Update during
February 27–March 9, 2007. A World Bank mission conducted an FSAP development module during
November 8–18, 2011. Moneyval conducted a follow-up assessment during May 9–13, 2011, and the
mutual evaluation report was adopted on July 5, 2012.

REPUBLIC OF LATVIA
4 INTERNATIONAL MONETARY FUND
ROSC Modules
Standard/Code assessed Issue date
Code of Good Practices on Fiscal Transparency March 29, 2001
Code of Good Practices on Transparency in Monetary and Financial Policies January 2, 2002
Basel Core Principles for Effective Banking Supervision January 2, 2002
CPSS Core Principles for Systemically Important Payment Systems January 2, 2002
IOSCO Objectives and Principles of Securities Regulation January 2, 2002
IAIS Core Principles January 2, 2002
OECD Corporate Governance Principles January 2, 2002
Data Module June 23, 2004

REPUBLIC OF LATVIA
INTERNATIONAL MONETARY FUND 5
Republic of Latvia: Technical Assistance (2007–12):
Dept. Project Action Timing Counterpart
FAD Expenditure Policy Mission June 2007 Ministry of Finance
FAD Tax Policy Mission March 2008 Ministry of Finance
FAD Revenue Administration Mission January 2009 Ministry of Finance
MCM Bank Resolution Mission January 2009 FCMC, Bank of Latvia
FAD Public Financial Management Mission March 2009 Ministry of Finance
MCM/
LEG
Debt Restructuring Mission
March 2009
Ministry of Finance,
FCMC
LEG Legal Aspects of
P&A Transactions
Mission Feb-March 2009 FCMC
MCM Bank Intervention Procedures
and P&A
Mission March 2009 FCMC
FAD Public Financial Management Mission April-May 2009 Ministry of Finance
FAD Revenue Administration Mission July 2009 Ministry of Finance
FAD Public Financial Management Resident
Advisor
July 2009-
June 2010
Ministry of Finance
FAD Cash Management Mission July-August 2009 Ministry of Finance
MCM
MCM
Mortgage and Land Bank
Deposit Insurance
Mission
Mission
Sept. 2009
Sept. 2009
Ministry of Finance
FCMC
MCM Liquidity Management Mission November 2009 Bank of Latvia
LEG Bank Resolution Legal
Framework
Mission January 2010 FCMC
FAD Tax Policy Mission February 2010 Ministry of Finance
LEG Bank Resolution Legal
Framework
Mission February 2010 FCMC
LEG Corporate and Personal
Insolvency Law
Mission March 2010 Ministry of Justice
FAD Public Financial Management Mission April 2010 Ministry of Finance
LEG Corporate and Personal
Insolvency Law
Mission April 2010 Ministry of Justice
MCM Stress Testing Mission June 2010 Bank of Latvia
FAD Expenditure Policy Mission August 2010 Ministry of Finance
FAD Revenue Administration Mission Sept. 2010 Ministry of Finance
LEG Legal Framework for
Foreclosure Procedures
Missions November 2010 Ministry of Justice
FAD Public Financial Management Mission Feb-March 2011 Ministry of Finance
FAD Tax Administration Mission June 2011 Ministry of Finance
MCM Bank Resolution Mission July 2012 FCMC
FAD Expenditure Rationalization Mission October 2012 Ministry of Finance
Resident Representative Post: Mr. David Moore was appointed Resident Representative from
June 11, 2009 to June 11, 2013.
REPUBLIC OF LATVIA
6 INTERNATIONAL MONETARY FUND
STATISTICAL ISSUES
Assessment of Data Adequacy for Surveillance
General: Data provision to the Fund for surveillance purposes is classified as adequate (A). Latvia is a
subscriber of the SDDS (Special Data Dissemination Standard) and a link to Latvia’s metadata is available at the
IMF’s website for the DSBB (Dissemination Standards Bulletin Board).
National Accounts: The CSB compiles and publishes quarterly national accounts with the production and
expenditure approaches on a regular and timely basis. Since September 2011, national accounts are calculated
with the NACE rev. 2 classifications, determined by the European Commission. However, there are
discrepancies between the GDP estimates based on production and those based on expenditure. The
statistical discrepancy is included in changes in inventories on the expenditure side.
The underlying data for the production approach are obtained primarily through a survey of businesses and
individuals, and are supplemented by data from labor force surveys and administrative sources. The CSB
believes that the basic data understate economic activity, particularly in the private sector, and there is an
ongoing effort to increase coverage. Additional data for the expenditure-based accounts are obtained from
household budget surveys and other surveys from the State Treasury and ministries.
Government finance statistics: Fund staff is provided quarterly with monthly information on revenues and
expenditures of the central and local governments and special budgets. With some limitations, the available
information permits the compilation of consolidated accounts of the general government. The Government
Finance Statistics database in the IMF’s eLibrary website contains cash data in the GFSM 2001 format. Quarterly
general government data on an accrual basis are provided through Eurostat for the International Financial
Statistics on a timely basis.
Monetary statistics: Monetary statistics could provide more detail in the liabilities of depository corporations
by subsectors of the general government in line with international standards.
Balance of payments: The BoL assumed responsibility for compiling the balance of payments statistics from
the CSB in early 2000. The data collection program is a mixed system, with surveys supplemented by monthly
information from the international transactions reporting system (ITRS), and administrative sources. Contrary
to international standards—but similar to a number of other EU countries—the BoL includes provisions for
expected losses of foreign-owned banks. Between Q4 2008–Q2 2010, this treatment led to the recording of
negative reinvested earnings (i.e., losses) of foreign-owned banks as negative outflows. These “inflows” in the
income account of the balance of payments thus gave a positive contribution to the current account.
Data Standards and Quality: Latvia is a participant in the IMF’s Special Data Dissemination Standard since
November 1, 1996. A Data ROSC was published in June 2004.
Reporting to STA: The authorities are reporting data for the Fund’s International Financial Statistics,
Government Finance Statistics Yearbook, the Direction of Trade Statistics, and the Balance of Payments
Statistics Yearbook.

Republic of Latvia: Table of Common Indicators Required for Surveillance
As of November 30, 2012
Date of
Latest
Observation
Date
Received
Frequency
of Data7
Frequency
of
Reporting7
Frequency of
Publication7
Memo Items:
Data Quality –
Methodological
Soundness8
Data Quality –
Accuracy and
Reliability9
Exchange Rates 02/28/2014 03/01/2014 M M M
International Reserve Assets
and Reserve Liabilities of the
Monetary Authorities1
02/28/2014 03/01/2014 M M M
Reserve/Base Money 02/28/2014 03/15/2014 M M M O, O, LO, O O, O, O, O, O
Broad Money 02/28/2014 03/15/2014 M M M
Central Bank Balance Sheet 02/28/2014 03/01/2014 M M M
Consolidated Balance Sheet of
the Banking System
02/28/2014 03/15/2014 M M M
Interest Rates2
02/28/2014 03/15/2014 M M M
Consumer Price Index 02/28/2014 03/15/2014 M M M O, LO, O, O O, O, O, O, O
Revenue, Expenditure, Balance
and Composition of Financing3
– General Government4
12/31/2013 02/28/2014 M Q M O, O, O, O O, O, O, O, O
Revenue, Expenditure, Balance
and Composition of
Financing3– Central
Government
12/31/2013 02/28/2014 M Q M
REP
UB
LIC O
F LA
TV
IA
INTER
NA
TIO
NA
L MO
NETA
RY F
UN
D 7

Republic of Latvia: Table of Common Indicators Required for Surveillance (concluded)
As of November 30, 2012
Stocks of Central Government
and Central Government-
Guaranteed Debt5
12/31/2013 02/28/2014 M Q M
External Current Account
Balance
9/30/2013 12/4/2013 M M M O, O, O, O O, O, O, O, O
Exports and Imports of Goods
and Services
9/30/2013 12/4/2013 M M M
GDP/GNP Q4 2013 03/15/2014 Q Q Q O, O, O, O O, LO, LO, LO, LO
Gross External Debt
Q3 2013 12/4/2013 Q Q Q
International Investment
Position6
Q3 2013 12/4/2013 Q Q Q
1 Any reserve assets that are pledged of otherwise encumbered should be specified separately. Also, data should comprise short-term liabilities linked to a foreign currency
but settled by other means as well as the notional values of financial derivatives to pay and to receive foreign currency, including those linked to a foreign currency but
settled by other means 2 Both market-based and officially-determined, including deposit and lending rates, discount rates, money market rates, rates on treasury bills, notes and bonds.
3 Foreign, domestic bank, and domestic nonbank financing.
4 The general government consists of the central government (budgetary funds, extra budgetary funds, and social security funds) and state and local governments.
5 Including currency and maturity composition.
6 Includes external gross financial asset and liability position vis-à-vis nonresidents.
7 Daily (D), Weekly (W), Monthly (M), Quarterly (Q), Annually (A); Not Available (NA).
8 Reflects the assessment provided in the data ROSC published in July 2004, the findings of the mission that took place during September 2003 for the dataset
corresponding to the variable in each row. The assessment indicates whether international standards concerning concepts and definitions, scope,
classification/sectorization, and basis for recording are fully observed (O), largely observed (LO), largely not observed (LNO), or not observed (NO).
9 Same as footnote 8, except referring to international standards concerning source data, statistical techniques, assessment and validation of source data, assessment and
validation of intermediate data and statistical outputs, and revision studies.
8
INTER
NA
TIO
NA
L MO
NETA
RY F
UN
D
REP
UB
LIC O
F LA
TV
IA
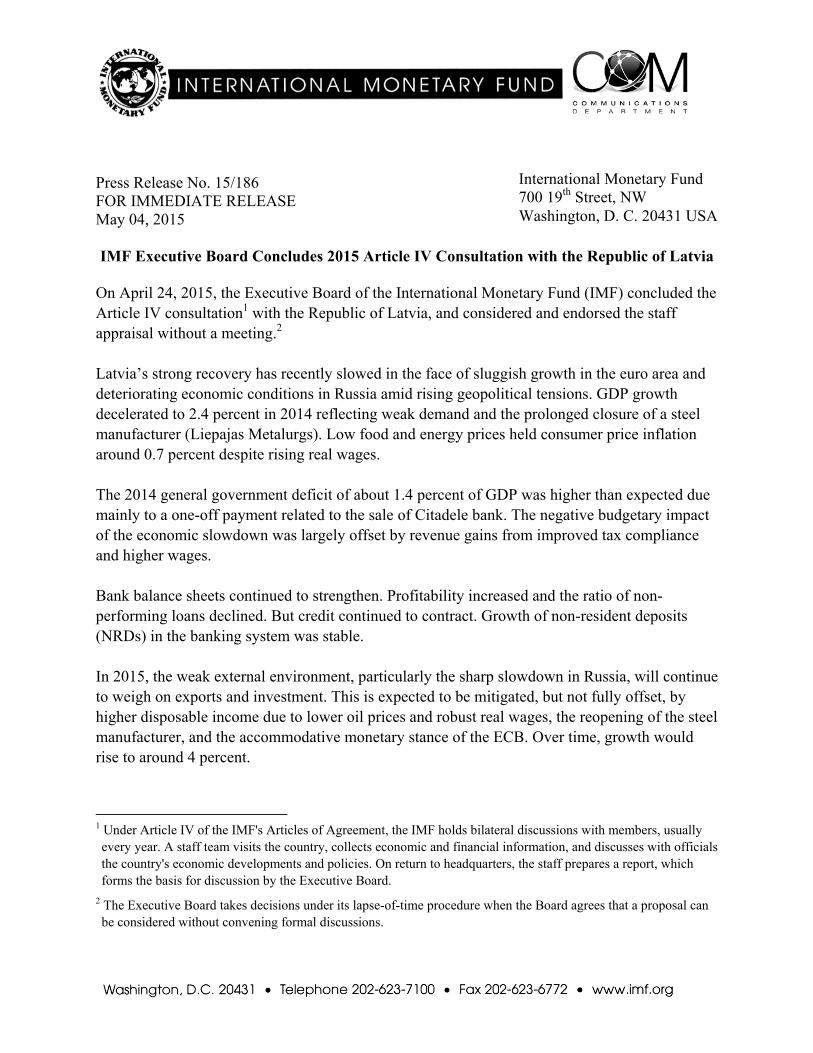
Press Release No. 15/186 FOR IMMEDIATE RELEASE May 04, 2015 IMF Executive Board Concludes 2015 Article IV Consultation with the Republic of Latvia
On April 24, 2015, the Executive Board of the International Monetary Fund (IMF) concluded the Article IV consultation1 with the Republic of Latvia, and considered and endorsed the staff appraisal without a meeting.2 Latvia’s strong recovery has recently slowed in the face of sluggish growth in the euro area and deteriorating economic conditions in Russia amid rising geopolitical tensions. GDP growth decelerated to 2.4 percent in 2014 reflecting weak demand and the prolonged closure of a steel manufacturer (Liepajas Metalurgs). Low food and energy prices held consumer price inflation around 0.7 percent despite rising real wages. The 2014 general government deficit of about 1.4 percent of GDP was higher than expected due mainly to a one-off payment related to the sale of Citadele bank. The negative budgetary impact of the economic slowdown was largely offset by revenue gains from improved tax compliance and higher wages. Bank balance sheets continued to strengthen. Profitability increased and the ratio of non-performing loans declined. But credit continued to contract. Growth of non-resident deposits (NRDs) in the banking system was stable. In 2015, the weak external environment, particularly the sharp slowdown in Russia, will continue to weigh on exports and investment. This is expected to be mitigated, but not fully offset, by higher disposable income due to lower oil prices and robust real wages, the reopening of the steel manufacturer, and the accommodative monetary stance of the ECB. Over time, growth would rise to around 4 percent.
1 Under Article IV of the IMF's Articles of Agreement, the IMF holds bilateral discussions with members, usually every year. A staff team visits the country, collects economic and financial information, and discusses with officials the country's economic developments and policies. On return to headquarters, the staff prepares a report, which forms the basis for discussion by the Executive Board.
2 The Executive Board takes decisions under its lapse-of-time procedure when the Board agrees that a proposal can be considered without convening formal discussions.
International Monetary Fund 700 19th Street, NW Washington, D. C. 20431 USA

2
Executive Board Assessment In concluding the 2015 Article IV consultation with the Republic of Latvia, Executive Directors endorsed staff’s appraisal, as follows: Latvia’s economic slowdown is expected to persist this year. GDP growth is estimated to have decelerated to about 2.4 percent in 2014, reflecting the prolonged closure of steel manufacturer Liepajas Metalurgs, and weak economic performance in the euro area and Russia amid rising geopolitical tensions. In 2015 the anemic external environment—particularly the sharp recession in Russia—will continue to weigh on exports and investment. This is expected to be somewhat mitigated by higher disposable income due to lower oil prices and robust real wages, the reopening of LM, and the accommodative monetary stance of the ECB. Faster medium-term growth will be necessary if Latvia is to close the income gap with the rest of the euro area, but this cannot be taken for granted. Medium-term growth of around 4 percent should be feasible. But adverse demographic trends will exert a downward pull on the growth trajectory, so robust growth depends on reforms to reduce still-high structural unemployment, and on boosting capital accumulation and labor productivity. Moreover, the near-term forecast is subject to several downside risks, most importantly a prolonged slowdown in important trading partners such as Russia and the euro area. While the 2015 budget is broadly appropriate, fiscal space needs to be built-up over the medium-term. Automatic stabilizers should be allowed to operate fully this year, given the weak and uncertain external environment. Over the medium-term, various factors, such as planned reductions to the personal income tax (PIT) rate, could constrain the budget’s capacity for necessary capital and social expenditure. The authorities should explore ways to increase the revenue envelope, for example by reconsidering future PIT rate cuts, greater land taxation in conjunction with cadastre reform, the removal of the cap on social security contributions, and better targeting of a number of tax allowances. Such measures would complement the welcome focus on shrinking the grey economy through better tax compliance. The continuing contraction of bank credit is increasingly likely to constrain investment. Staff supports recent public sector initiatives to catalyze SME lending, including by providing loan guarantees, taking subordinated positions and encouraging the development of credit bureaus. Reforms to insolvency procedures and the court system are needed to encourage writedowns and accelerate the reduction in private sector debt. This would provide a spur to new lending from both the demand and supply side. So far there have been no significant disruptions to NRD flows arising from geopolitical tensions. But the Russia-Ukraine conflict highlights the need for maintaining vigilant supervision of NRD banks, which account for almost half of all deposits in the banking system. In this context, the authorities are encouraged to continue their efforts to strengthen and effectively
3
implement the AML/CFT framework. Appropriately, the Financial Intelligence Unit responsible for combating money laundering and financial terrorism has been strengthened. Minimum capital and liquidity requirements are higher for NRD banks, in line with previous staff advice; and the authorities plan to impose on NRDs proportionately higher contributions to the deposit guarantee fund. Latvia’s most important medium-term challenge is to maintain competitiveness within the euro area currency union. Future increases to the minimum wage should not exceed productivity growth. In order for Latvia to consistently exceed average euro area growth and thereby close the income gap with core economies, productivity growth must be supported by appropriate structural policies. Reforms are needed in a number of areas such as labor markets, higher and vocational education, infrastructure, and SOE management.
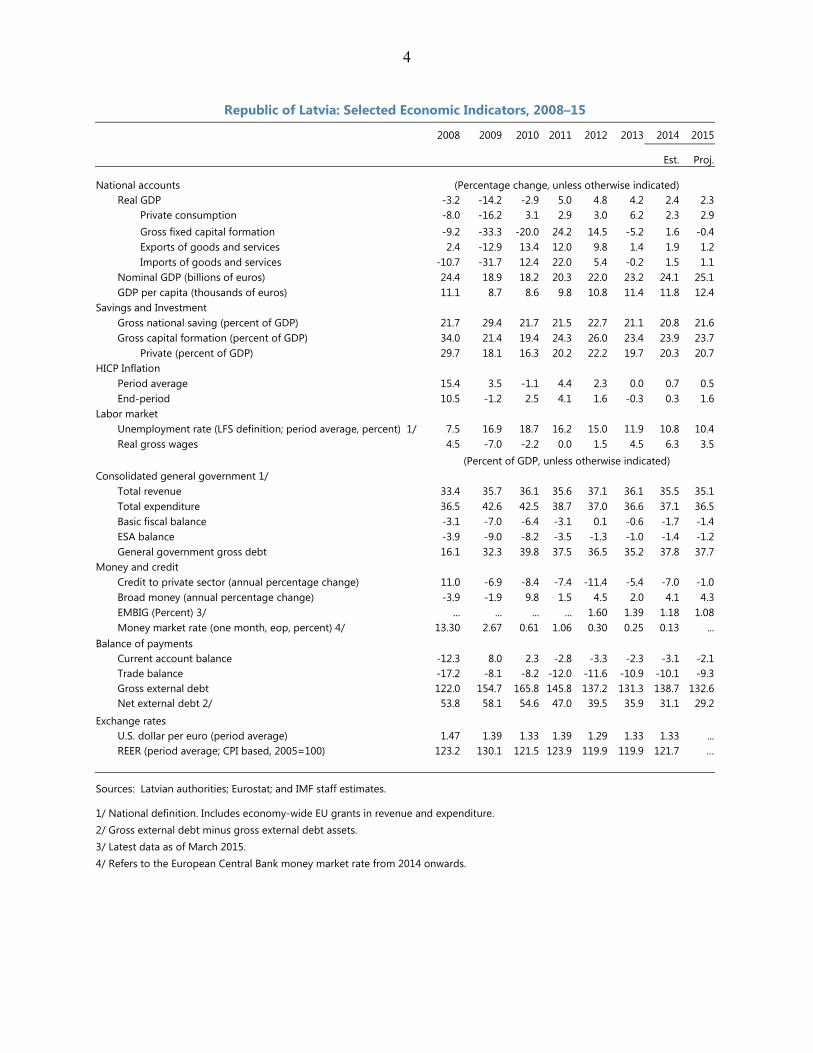
4
Republic of Latvia: Selected Economic Indicators, 2008–15
2008 2009 2010 2011 2012 2013 2014 2015
Est. Proj.
National accounts (Percentage change, unless otherwise indicated) Real GDP -3.2 -14.2 -2.9 5.0 4.8 4.2 2.4 2.3
Private consumption -8.0 -16.2 3.1 2.9 3.0 6.2 2.3 2.9Gross fixed capital formation -9.2 -33.3 -20.0 24.2 14.5 -5.2 1.6 -0.4Exports of goods and services 2.4 -12.9 13.4 12.0 9.8 1.4 1.9 1.2Imports of goods and services -10.7 -31.7 12.4 22.0 5.4 -0.2 1.5 1.1
Nominal GDP (billions of euros) 24.4 18.9 18.2 20.3 22.0 23.2 24.1 25.1GDP per capita (thousands of euros) 11.1 8.7 8.6 9.8 10.8 11.4 11.8 12.4
Savings and Investment Gross national saving (percent of GDP) 21.7 29.4 21.7 21.5 22.7 21.1 20.8 21.6Gross capital formation (percent of GDP) 34.0 21.4 19.4 24.3 26.0 23.4 23.9 23.7
Private (percent of GDP) 29.7 18.1 16.3 20.2 22.2 19.7 20.3 20.7HICP Inflation
Period average 15.4 3.5 -1.1 4.4 2.3 0.0 0.7 0.5End-period 10.5 -1.2 2.5 4.1 1.6 -0.3 0.3 1.6
Labor market Unemployment rate (LFS definition; period average, percent) 1/ 7.5 16.9 18.7 16.2 15.0 11.9 10.8 10.4Real gross wages 4.5 -7.0 -2.2 0.0 1.5 4.5 6.3 3.5
(Percent of GDP, unless otherwise indicated) Consolidated general government 1/
Total revenue 33.4 35.7 36.1 35.6 37.1 36.1 35.5 35.1Total expenditure 36.5 42.6 42.5 38.7 37.0 36.6 37.1 36.5Basic fiscal balance -3.1 -7.0 -6.4 -3.1 0.1 -0.6 -1.7 -1.4ESA balance -3.9 -9.0 -8.2 -3.5 -1.3 -1.0 -1.4 -1.2General government gross debt 16.1 32.3 39.8 37.5 36.5 35.2 37.8 37.7
Money and credit Credit to private sector (annual percentage change) 11.0 -6.9 -8.4 -7.4 -11.4 -5.4 -7.0 -1.0Broad money (annual percentage change) -3.9 -1.9 9.8 1.5 4.5 2.0 4.1 4.3EMBIG (Percent) 3/ ... ... ... ... 1.60 1.39 1.18 1.08Money market rate (one month, eop, percent) 4/ 13.30 2.67 0.61 1.06 0.30 0.25 0.13 ...
Balance of payments Current account balance -12.3 8.0 2.3 -2.8 -3.3 -2.3 -3.1 -2.1Trade balance -17.2 -8.1 -8.2 -12.0 -11.6 -10.9 -10.1 -9.3Gross external debt 122.0 154.7 165.8 145.8 137.2 131.3 138.7 132.6Net external debt 2/ 53.8 58.1 54.6 47.0 39.5 35.9 31.1 29.2
Exchange rates U.S. dollar per euro (period average) 1.47 1.39 1.33 1.39 1.29 1.33 1.33 ...REER (period average; CPI based, 2005=100) 123.2 130.1 121.5 123.9 119.9 119.9 121.7 …
Sources: Latvian authorities; Eurostat; and IMF staff estimates.
1/ National definition. Includes economy-wide EU grants in revenue and expenditure. 2/ Gross external debt minus gross external debt assets. 3/ Latest data as of March 2015. 4/ Refers to the European Central Bank money market rate from 2014 onwards.