imdex limited fy17 results presentation · 3 / imdex limited / imdex limited • • increased...
TRANSCRIPT
1 / IMD
EX LIM
ITED
/ IM
DE
X LIMITE
D
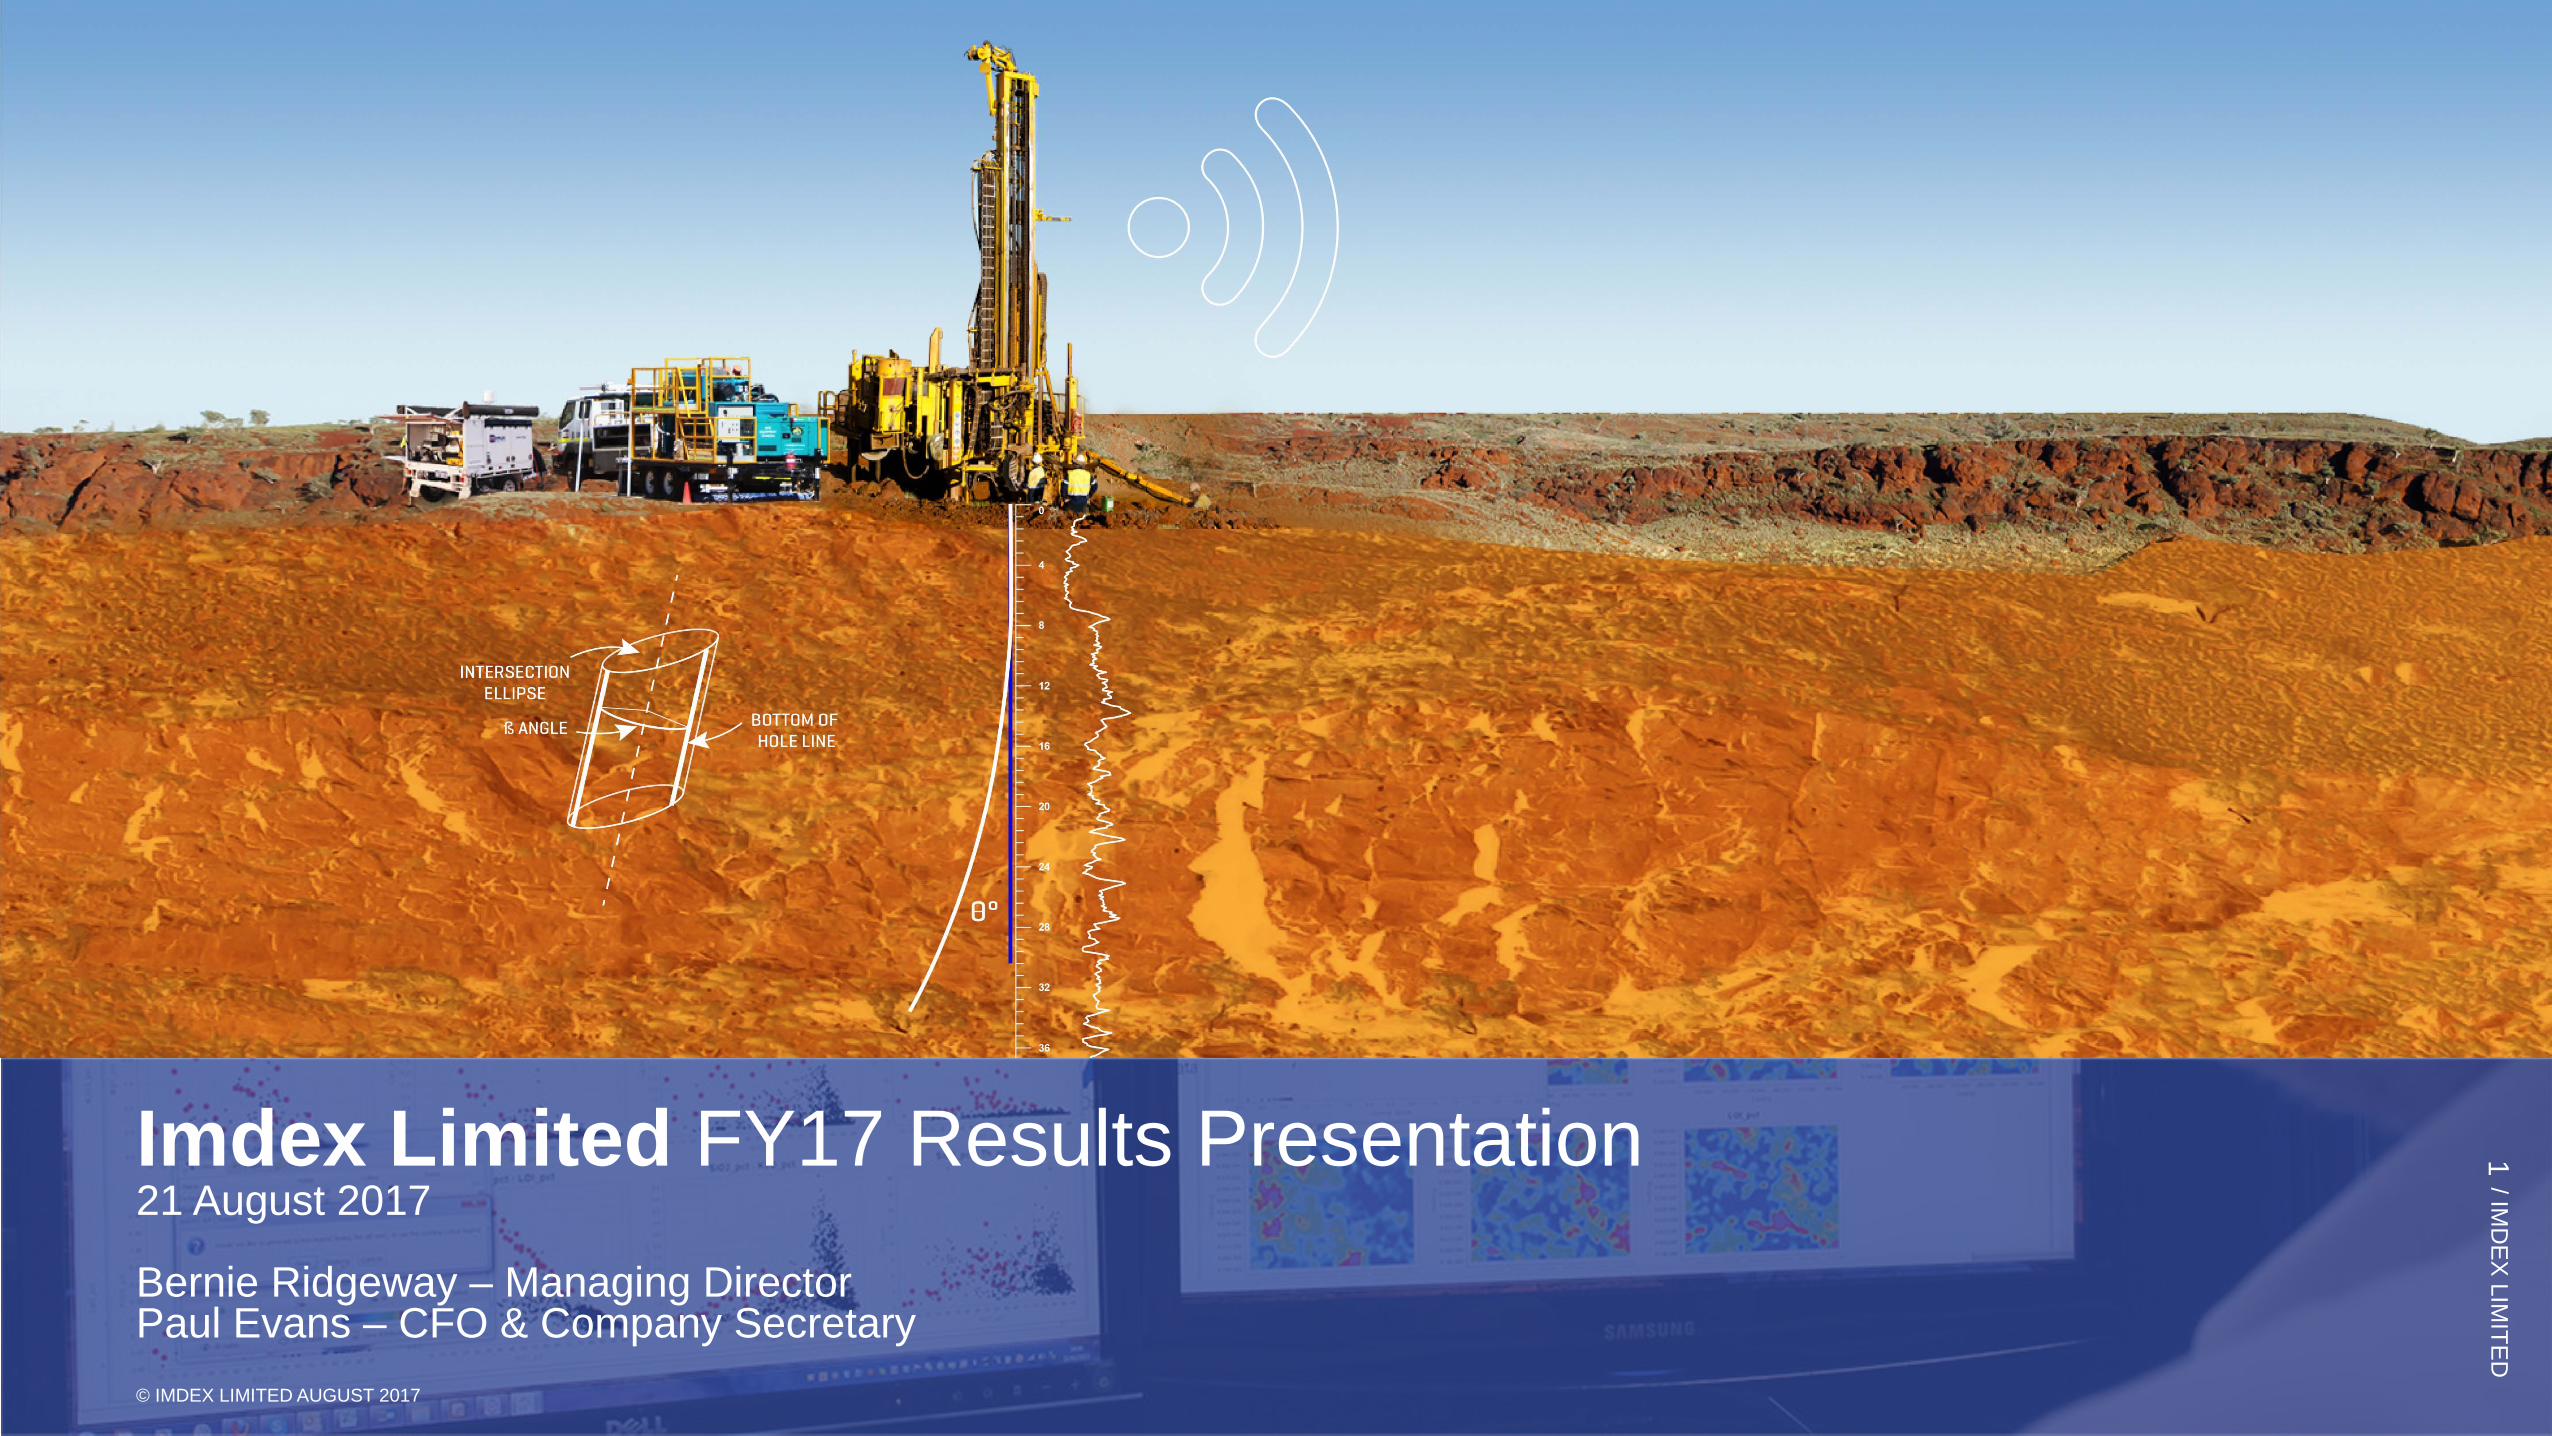
1 Imdex Limited FY17 Results Presentation 21 August 2017 Bernie Ridgeway – Managing Director Paul Evans – CFO & Company Secretary © IMDEX LIMITED AUGUST 2017
2 / IMD
EX LIM
ITED
/ IM
DE
X LIMITE
D
2
We are a leading global METS* company.
Our solutions improve the process of identifying and extracting what is below the earth’s surface for drilling
contractors and resource companies – we let clients know where it is and what it is…now.
Our vision is to be the leading provider of real-time subsurface intelligence solutions to the global minerals industry.
*Mining equipment, technology and services

3 / IMD
EX LIM
ITED
/ IM
DE
X LIMITE
D
3
• Increased revenue and earnings
• Strong balance sheet
• Successful capital raising
• $30 million Bankwest facility secured on attractive terms
• Paid out Bain Capital in full
• Divestment of wholly owned oil and gas businesses – 100% minerals focused
• Early stages of minerals industry upswing
• Increase of REFLEX instruments on hire
• Continued to invest in R&D
• Commercialised new technologies
• Commenced internal digital transformation project
• Board renewal – appointment of new Non-Executive Chairman and Non-Executive Director
FY17 Highlights

4 / IMD
EX LIM
ITED
/ IM
DE
X LIMITE
D
4
Key Metrics ($million)
$MILLIONS UNLESS INDICATED OTHERWISE FY17 FY16 VAR VAR%
Revenue from continuing operations1 176.2 143.3 32.9 23%
EBITDA from continuing operations 31.5 20.32 11.2 55%
NPAT 3.63 -56.24 59.8
EPS (cents) 1.1 -23.1 24.2
Operating cash flow from continuing operations (excluding financing costs) 20.7 10.0 10.7 107%
Net assets 159.8 115.6 44.2 38%
Number of employees as at 30 June 437 4685 -31 -7%
1 AMC Oil & Gas is discontinued and Imdex’s 30% share in VES has been written-off 2 Normalised to exclude restructure and other one-off costs totalling $5.2m 3 Includes $16.2m (non-cash $11.5m) of financing costs in relation to Bain Capital , which has been fully repaid 4 Includes impairment costs of $32.2m associated with the VES JV and $17.8m of restructuring and other costs, of which $12.6m relates to the divestment of AMC Oil & Gas 5 Includes 74 AMC Oil & Gas employees within discontinued operations

5 / IMD
EX LIM
ITED
/ IM
DE
X LIMITE
D
5
Minerals Revenue by Region ($million)
• FY17 revenue up 23% on pcp • Increasing revenue trend across all
regions
• Business benefited from global presence and regional expertise
• Uplift continues into FY18
FY11 FY12 FY13 FY14 FY15 FY16 FY17EMEA Americas Asia Pac
241.7
182.7
125.4 142.3 143.3
176.2 177.7

6 / IMD
EX LIM
ITED
/ IM
DE
X LIMITE
D
6
• Core business profitable throughout downturn
• FY17 EBITDA up 55% on pcp • Additional investment in key
personnel in 4Q17
• Focused on cost discipline while driving revenue growth
• EBITDA margin improvement
expected in FY18 while increasing investment in the business of ~$5 million
EBITDA ($million)
53.8
83.6
41.71
7.41 15.61 20.31
31.5
FY11 FY12 FY13 FY14 FY15 FY16 FY171Normalised minerals revenue – continuing operations

7 / IMD
EX LIM
ITED
/ IM
DE
X LIMITE
D
7
Balance Sheet & Working Capital ($millions)
$MILLIONS UNLESS INDICATED OTHERWISE 30 JUN 2017 30 JUN 2016
Cash 19.4 13.0
Receivables 41.5 28.8
Inventory 29.9 27.4
Assets held for sale1 - 3.2
Fixed assets 32.2 38.2
Intangibles 60.4 60.9
Other assets / deferred tax 27.5 24.9
TOTAL ASSETS 210.9 196.4
Payables 30.4 20.8
Bank loans 6.5 43.0
HP finance 0.6 1.2
Other liabilities, provisions, current tax 13.6 15.8
TOTAL EQUITY 159.8 115.6
1Oil and gas technology written-off
EBITDA fromcontinuing operations
Working Capital Other Taxes Cash from continuingoperations (excl.financing costs
31.5 (5.9)
(1.5) (3.4)
20.7
2Represents cash inflows of $19.5m (prior to financing costs) adjusted for cash outflows from discontinued operations of $1.2m.
)2

8 / IMD
EX LIM
ITED
/ IM
DE
X LIMITE
D
8
Global Business with Operational Leverage
Imdex presence – map does not include distributors
Mining industry hot spots

9 / IMD
EX LIM
ITED
/ IM
DE
X LIMITE
D
9
• Increased activity in the minerals sector – particularly in Canada, Latin America, West Africa and Australia
• Activity uplift initially associated with stronger gold price
– now a broader-based recovery • Major, intermediate and junior companies well-funded
with increased budgets
• Large resource companies – continuing to focus on increasing efficiencies, cost reduction
• New technologies are gaining momentum in order to
drive efficiencies and productivity • Mining companies need to replace depleting reserves
Market Update

10 / IMD
EX LIM
ITED
/ IM
DE
X LIMITE
D
10
REFLEX Instruments on Hire (Number of units)
• As more rigs return to work, additional instrumentation is required – all commodities
• Instruments on hire increased CY14-CY16 despite significant decrease in exploration expenditure over those 3 years
• 30 June 2017, 42% increase compared to 30 June 2016
• Increased demand for and adoption of traditional survey and core instrumentation, together with more recent technologies
• Most newer technologies yield higher rental rates due to greater value add for clients

11 / IMD
EX LIM
ITED
/ IM
DE
X LIMITE
D
11
Market Update
Despite increased expenditure, gold and copper discoveries are not keeping up with production – grades decreasing, deeper, more complex ore bodies, more difficult and longer lead times to develop

12 / IMD
EX LIM
ITED
Driving Sustainable Earnings Growth
• Growth of core business historically driven by cyclical upswing and the introduction of new technologies
• Strategic positioning for sustainable earnings growth
• FY18 investing in two-tiered strategy:
• Organic – protect and grow core business
• Transformational – extension into new market segments
13 / IMD
EX LIM
ITED
/ IM
DE
X LIMITE
D
13
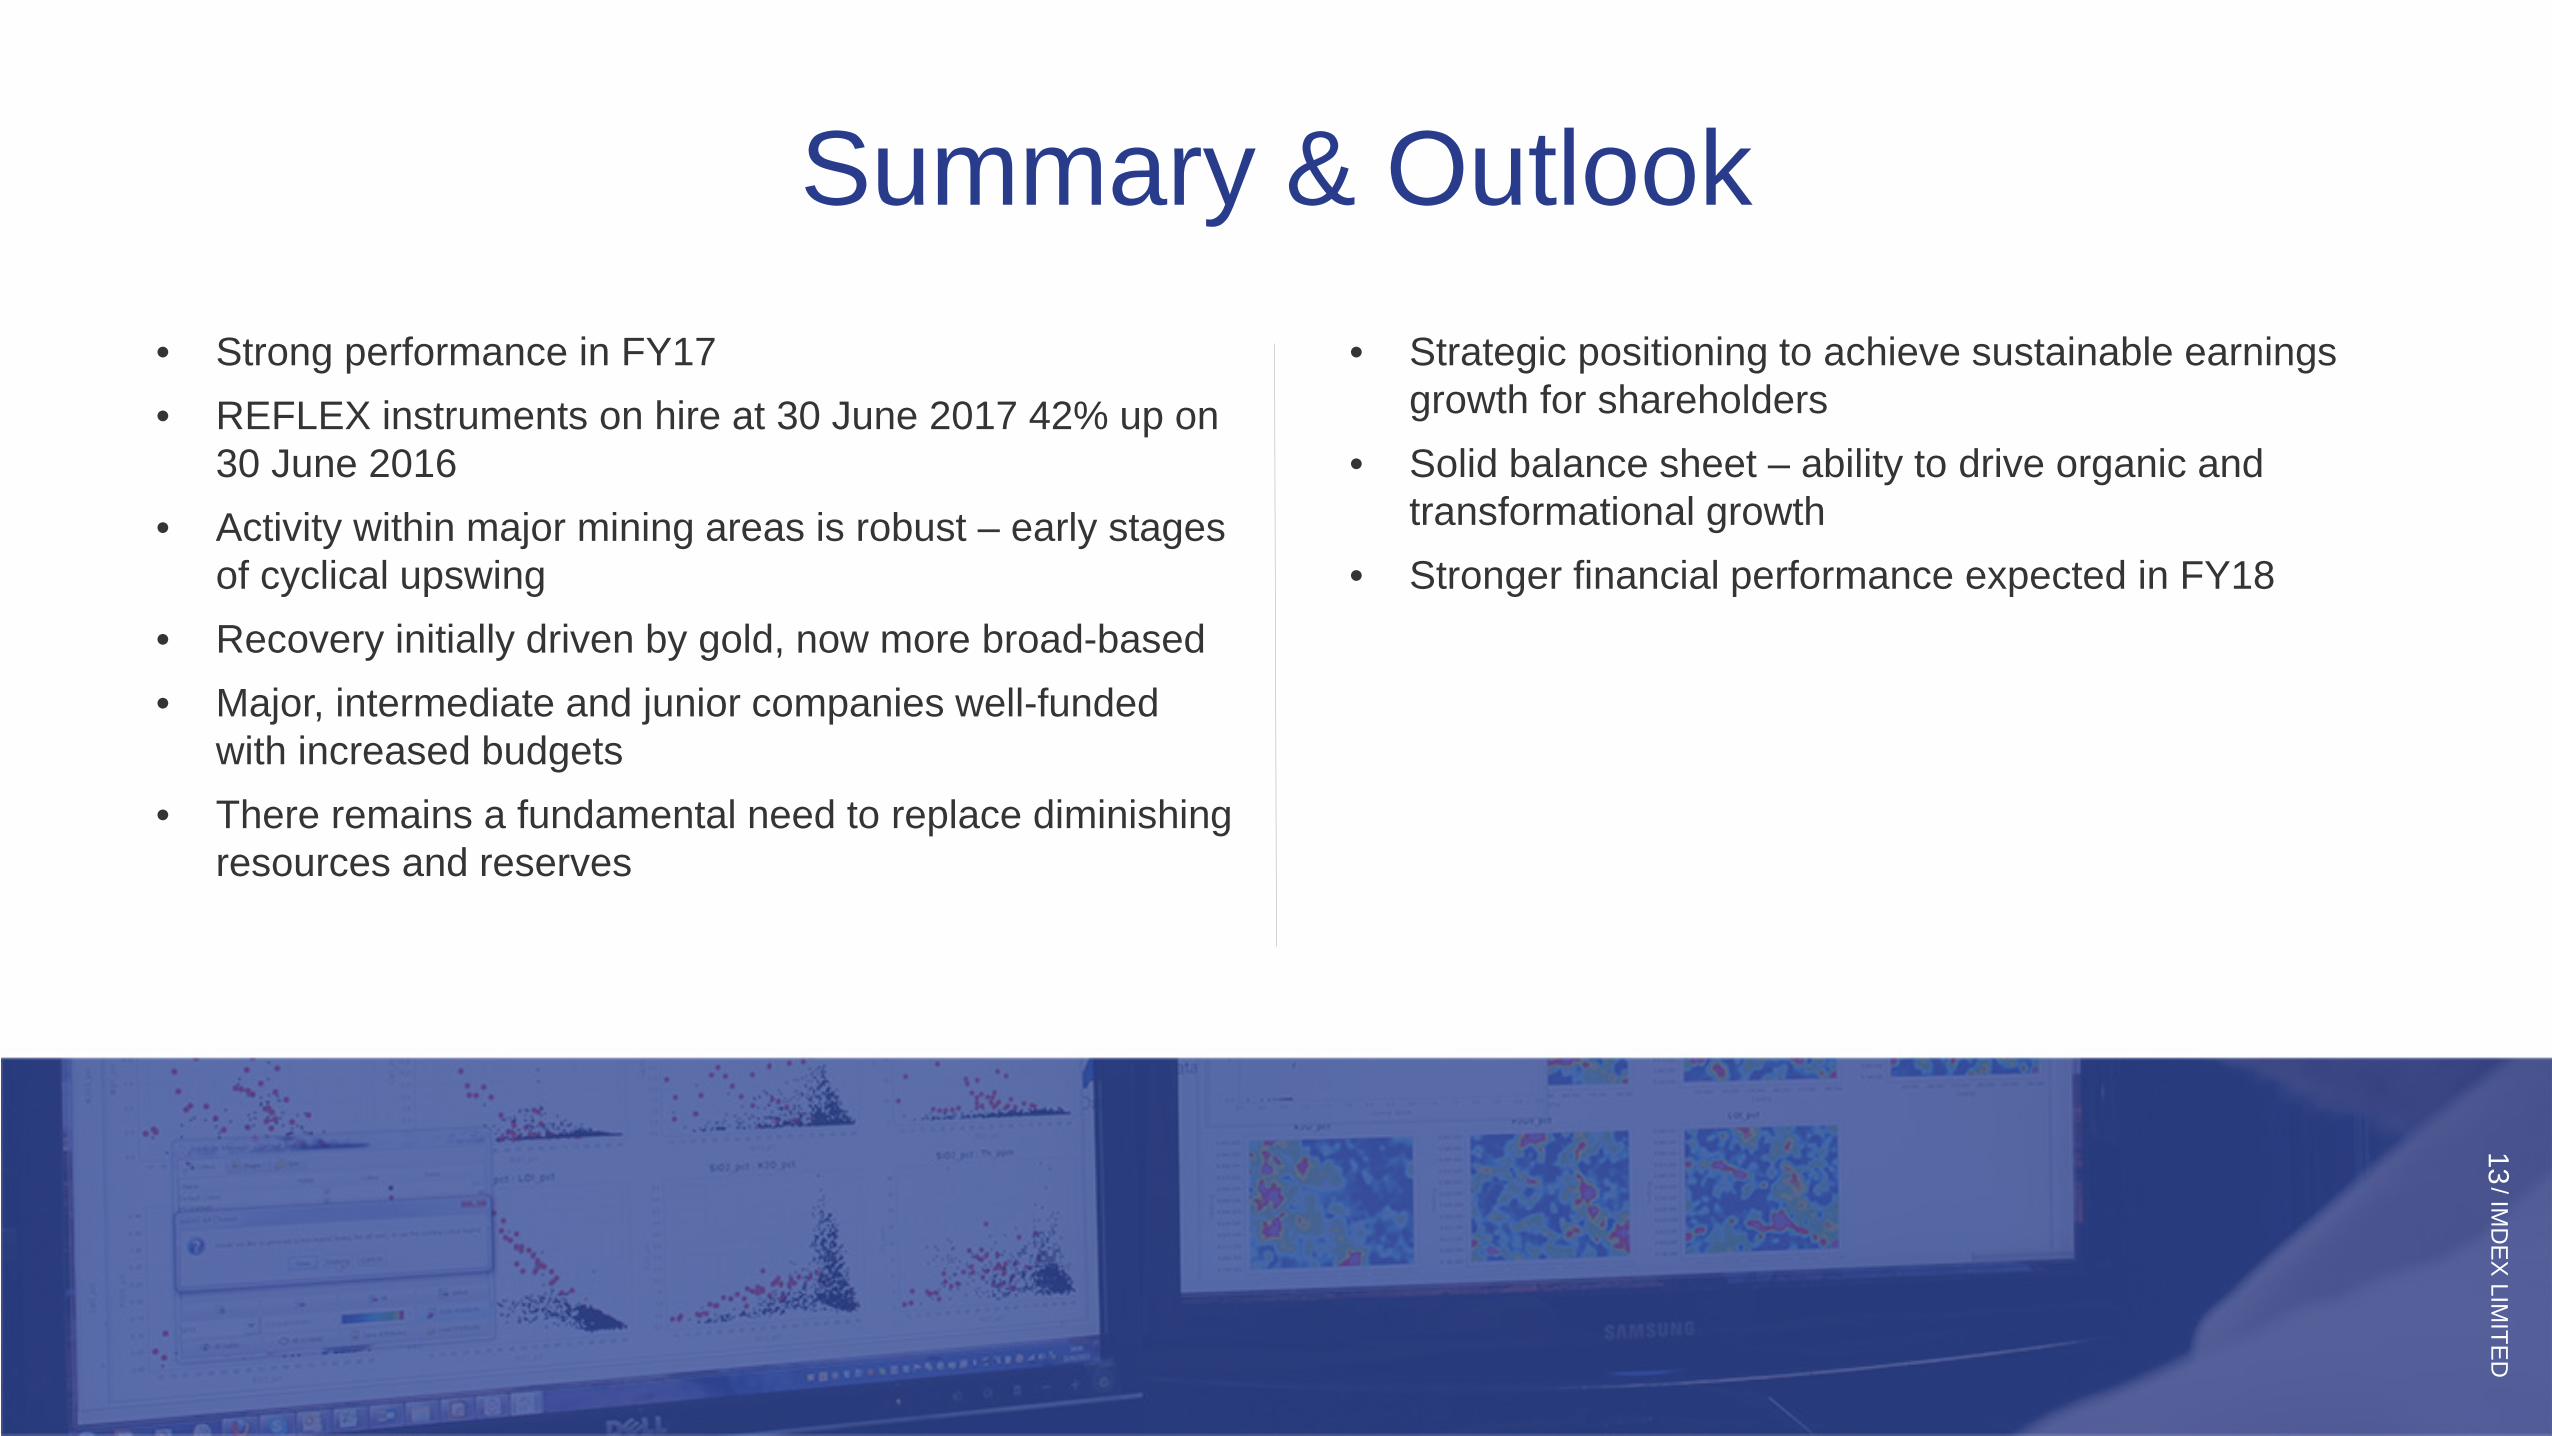
Summary & Outlook • Strong performance in FY17
• REFLEX instruments on hire at 30 June 2017 42% up on 30 June 2016
• Activity within major mining areas is robust – early stages of cyclical upswing
• Recovery initially driven by gold, now more broad-based
• Major, intermediate and junior companies well-funded with increased budgets
• There remains a fundamental need to replace diminishing resources and reserves
• Strategic positioning to achieve sustainable earnings growth for shareholders
• Solid balance sheet – ability to drive organic and transformational growth
• Stronger financial performance expected in FY18

14 / IMD
EX LIM
ITED
14 / IM
DE
X LIMITE
D
Appendices

15 / IMD
EX LIM
ITED
/ IM
DE
X LIMITE
D
15
Imdex Board
Mr Anthony Wooles BCom, MBA (Finance)
• Non-Executive Chairman • Appointed to the Board 1 July 2016
Mr Bernard Ridgeway B.Bus (ACCTG) ACA
• Managing Director • Appointed to the Board 23 May 2000
Mr Kevin Dundo BCom, LLB
• Non-Executive Director • Appointed to the Board 14 January 2004
Ms Sally-Anne Layman B Eng (Mining), Hon, BCom
• Non-Executive Director • Appointed to the Board 6 February 2017
Mr Ivan Gustavino B.Bus
• Non-Executive Director • Appointed to the Board 1 July 2015

16 / IMD
EX LIM
ITED
Company Snapshot Corporate Information
ASX Listed IMD
Share Price (30 June 2017) A$ 0.76
Issued Shares m 367.5
Market Cap (30 June 2017) A$m 279.3
Share Register Analysis of top shareholders as at 30 June 2017
Share Price Performance Substantial Shareholders – June 2017 Shares (m) %
Fidelity Investments 36.5 9.9
Perennial Value Management 34.9 9.5
Wilson Asset Management 23.2 6.3
Tribeca Investment Partners 22.7 6.2
Perpetual Investment Management 18.4 5.0
Institutions
Employee, Directors & Company Related Parties
Corporate Holders
Private Shareholders
Brokers & Banks

17 / IMD
EX LIM
ITED
/ IM
DE
X LIMITE
D
17
Global Leader in Exploration & Mining
Substantial competitive advantage
Economies of scale
Leading brands and strong reputation
Barriers to entry
Market leadership in technology
Strong client relationships
Strong balance sheet
Scale and efficiency that comes from being the leading provider of subsurface intelligence solutions to the exploration and mining markets globally AMC and REFLEX are the world’s leading brands with strong market share and a first class reputation for innovative solutions and reliable supply
Market leadership in technology and innovation. Through the cycle investment in R&D and innovation. R&D centres of excellence in California and Australia.
High barriers to entry due to specialised knowledge, in-field personnel, global reach and product/service complexity
Strong and longstanding client relationships with service providers and resource companies
Clean balance sheet with net cash position
Global footprint/connectivity Unrivalled scale, facility footprint and market presence and connectivity to service clients in multiple jurisdictions regionally and globally

18 / IMD
EX LIM
ITED
/ IM
DE
X LIMITE
D
18
Simple Scalable Structure
• Dominant within minerals industry – strong brands and
market share • REFLEX
− Downhole Navigation − Structural Geology − In-field Geoanalysis − Driller Operable Geophysics
• AMC
− Drilling Optimisation
19 / IMD
EX LIM
ITED
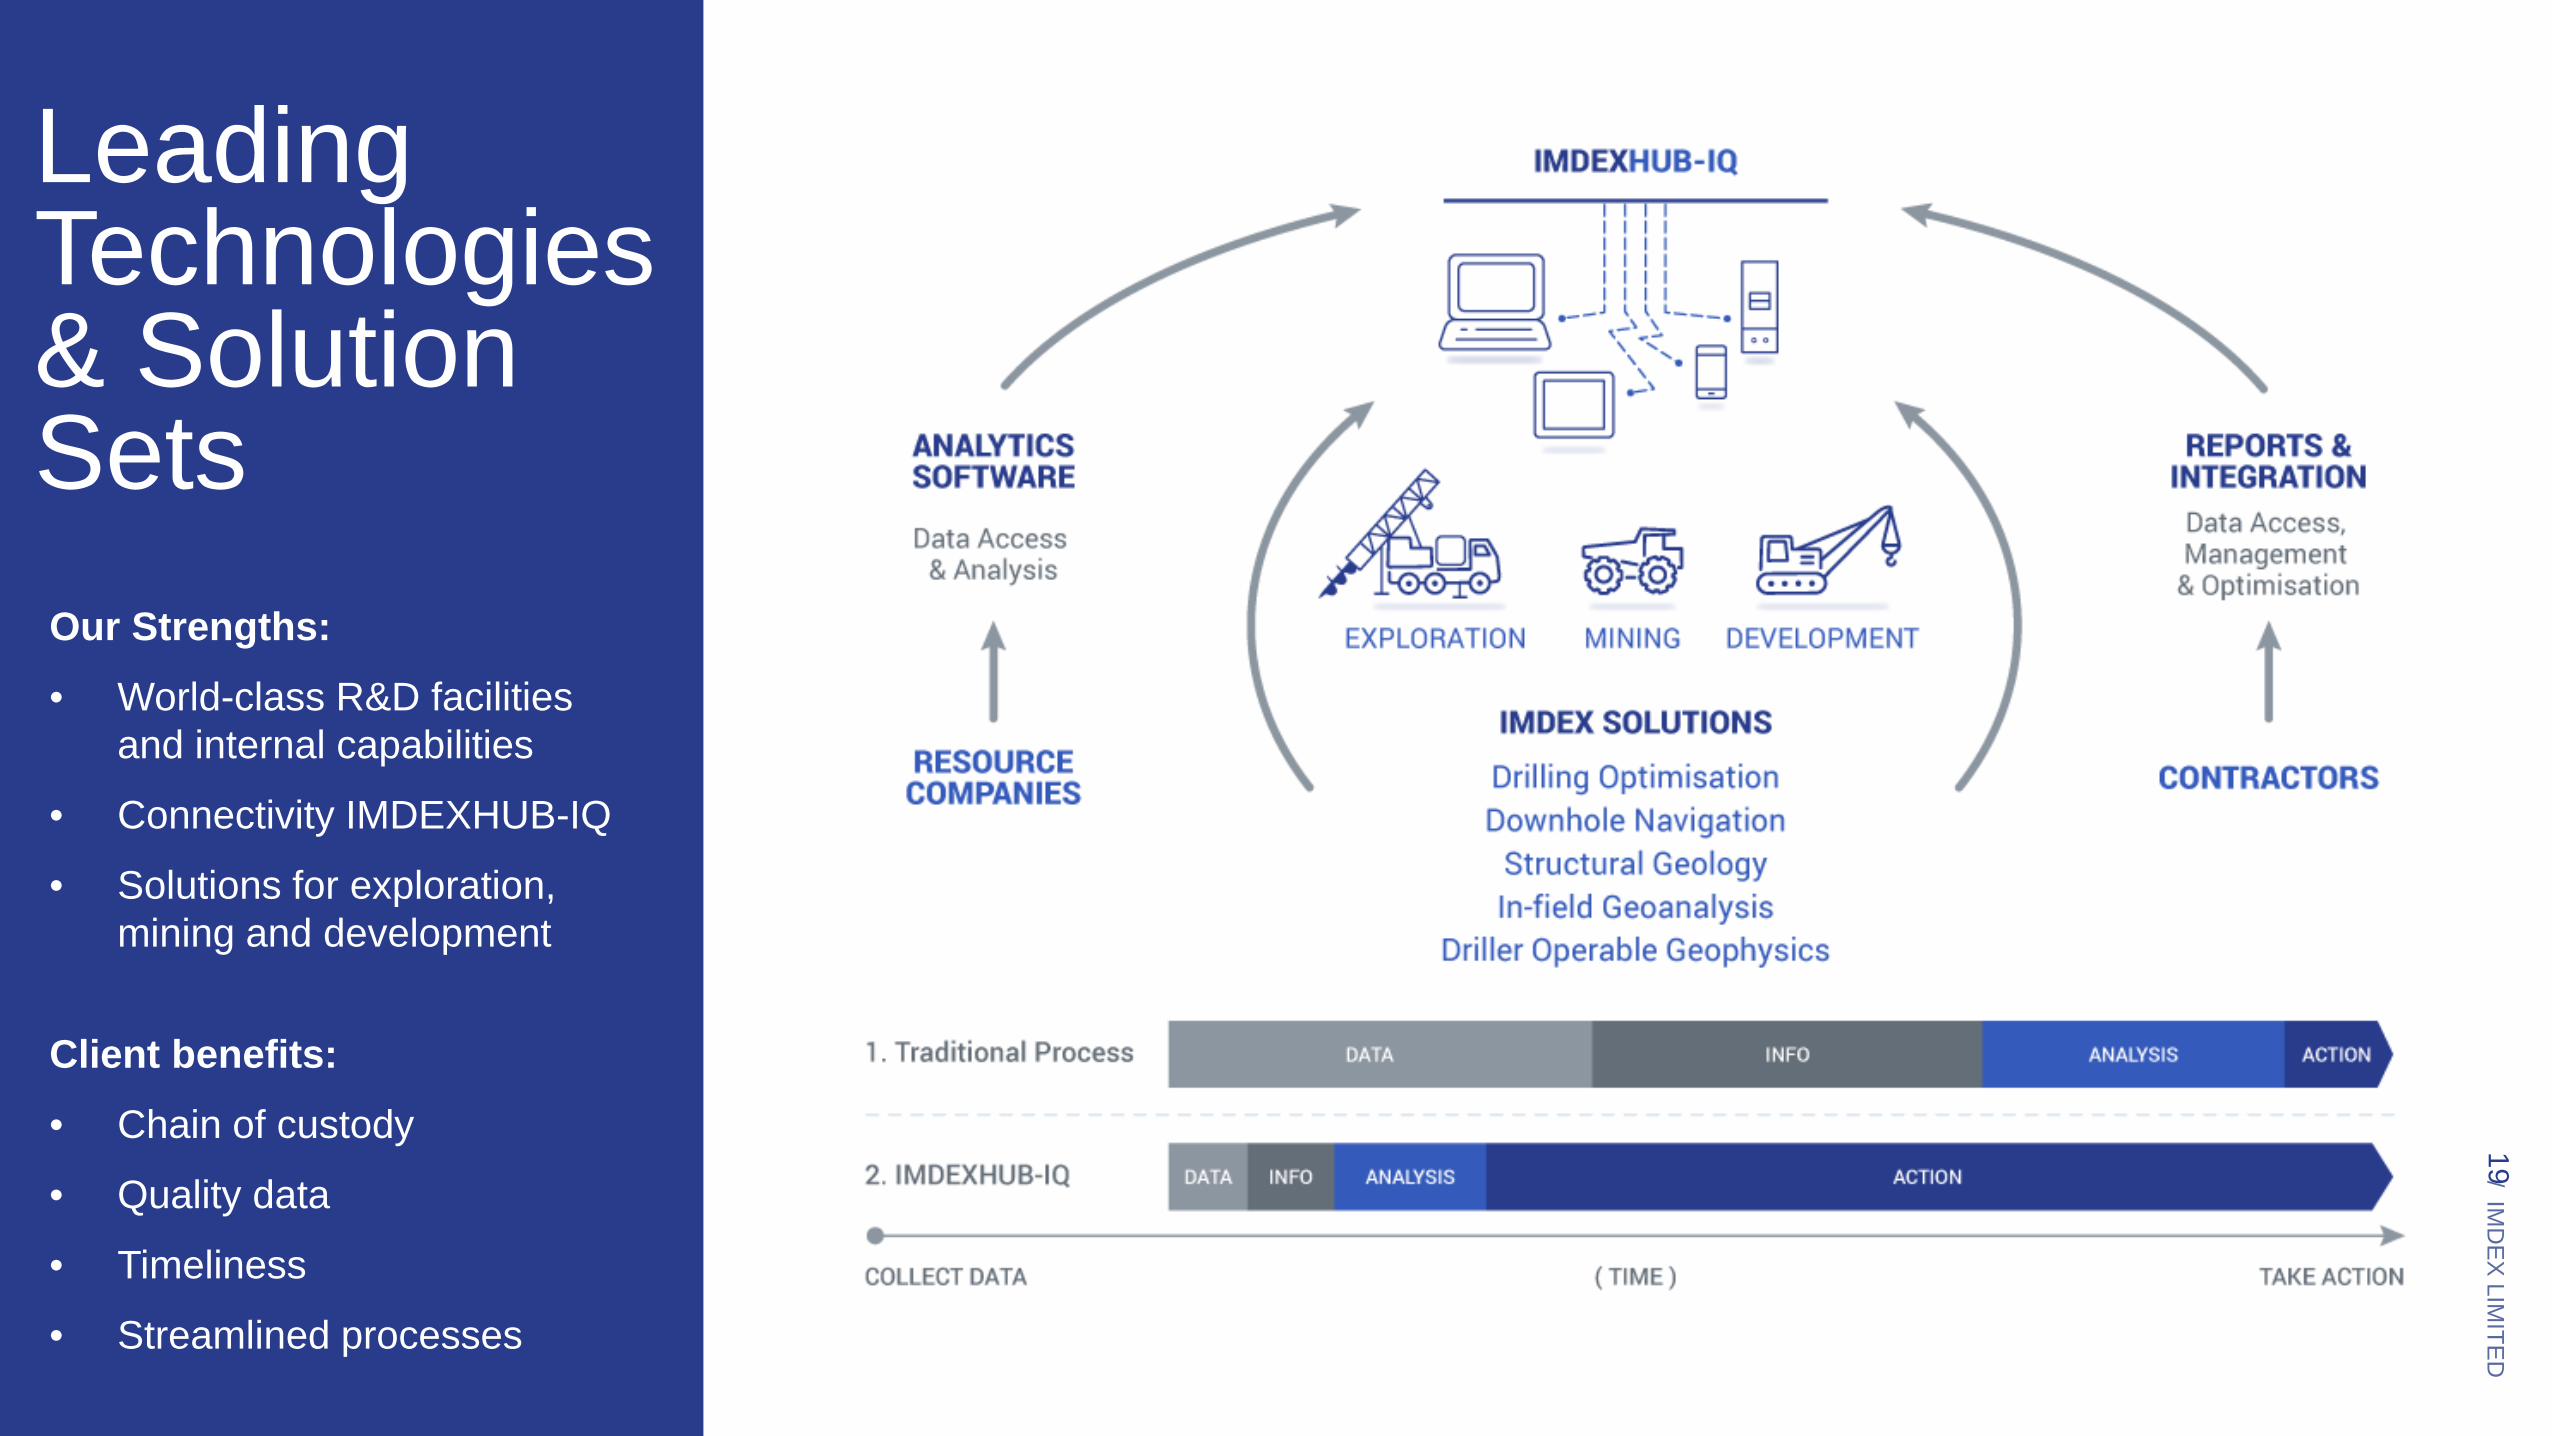
Leading Technologies & Solution Sets
Client benefits:
• Chain of custody
• Quality data
• Timeliness
• Streamlined processes
Our Strengths:
• World-class R&D facilities and internal capabilities
• Connectivity IMDEXHUB-IQ
• Solutions for exploration, mining and development

20 / IMD
EX LIM
ITED
Imdex Solution Sets Our solution sets simplify the process of identifying and extracting what is below the earth’s surface for drilling contractors and resource companies. Together our technologies provide geological information in real-time supporting critical decision making from exploration to production. Our products and technologies can assist clients to control their costs and increase their productivity by providing end-to-end solutions across the full mining life cycle.

21 / IMD
EX LIM
ITED
/ IM
DE
X LIMITE
D
21
This presentation has been prepared by Imdex Limited (“the Company”). It contains general background information about the Company’s activities current as
at the date of the presentation. It is information given in summary form and does not purport to be complete. The distribution of this presentation in jurisdictions
outside Australia may be restricted by law and you should observe any such restrictions.
This presentation is not (and nothing in it should be construed as) an offer, invitation, solicitation or recommendation with respect to the subscription for,
purchase or sale of any security in any jurisdiction, and neither this document nor anything in it shall form the basis of any contract or commitment. The
presentation is not intended to be relied upon as advice to investors or potential investors and does not take into account the investment objectives, financial
situation or needs of any particular investor. These should be considered, with or without professional advice, when deciding if an investment is appropriate.
The Company has prepared this presentation based on information available to it, including information derived from publicly available sources that have not
been independently verified. No representation or warranty, express or implied, is made as to the fairness, accuracy, completeness, correctness or reliability of
the information, opinions and conclusions expressed.
Any statements or assumptions in this presentation as to future matters may prove to be incorrect and differences may be material. To the maximum extent
permitted by law, none of the Company, its directors, employees or agents, nor any other person accepts any liability, including, without limitation, any liability
arising from fault or negligence on the part of any of them or any other person, for any loss arising from the use of this presentation or its contents or otherwise
arising in connection with it.
Disclaimer