imbalance in the carbonate budget of surficial sediments ... · imbalance in the carbonate budget...
TRANSCRIPT

Progress in Oceanography 50 (2001) 201–221www.elsevier.com/locate/pocean
Imbalance in the carbonate budget of surficial sediments inthe North Atlantic Ocean: variations over the last
millenium?
C. Rabouillea,*, H. Stahlb, F. Bassinota, A. Tengbergb, J. Brunnegardb,P. Hall b, K. Kiriakoulakis c, J.-L. Reyssa, L. Dezileaua, P. Crassousd,
P. Roose, R.S. Lampittf
a Laboratoire des Sciences du Climat et de l’Environnement, UMR CEA-CNRS, Av. de la Terrasse, 91198 Gif sur Yvette, Franceb Department of Analytical and Marine Chemistry, Goteborg University, SE-412 96 Goteborg, Sweden
c Department of Earth Sciences, University of Liverpool, PO Box 147, Liverpool L69 3BX, UKd IFREMER centre de Brest, BP 70, 29263 Plouzane, France
e The Jubileum Institute, Department of Radiation Physics, Lund University S-221 85, Lund, Swedenf Southampton Oceanography Centre, Empress Dock, Southampton SO14 3ZH, UK
Abstract
Fluxes contributing to the particulate carbonate system in deep-sea sediments were investigated at the BENGAL sitein the Porcupine Abyssal Plain (Northeast Atlantic). Deposition fluxes were estimated using sediment traps at a nominaldepth of 3000 m and amounted to 0.37±0.1 mmol C m�2 d�1. Dissolution of carbonate was determined using flux oftotal alkalinity from in situ benthic chambers, is 0.4±0.1 mmol C m�2 d�1. Burial of carbonate was calculated fromdata on the carbonate content of the sediment and sedimentation rates from a model age based on14C dating onforaminifera (0.66±0.1 mmol C m�2 d�1). Burial plus dissolution was three times larger than particle deposition fluxwhich indicates that steady-state is not achieved in these sediments. Mass balances for other components (BSi,210Pb),and calculations of the focusing factor using230Th, show that lateral inputs play only a minor role in this imbalance.Decadal variations of annual particle fluxes are also within the uncertainty of our average. Long-term change in dissol-ution may contribute to the imbalance, but can not be the main reason because burial alone is greater than the inputflux. The observed imbalance is thus the consequence of a large change of carbonate input flux which has occured inthe recent past. A box model is used to check the response time of the solid carbonate system in these sediments andthe time to reach a new steady-state is in the order of 3 kyr. Thus it is likely that the system has been perturbedrecently and that large dissolution and burial rates reflect the previously larger particulate carbonate deposition rates.We estimate that particulate carbonate fluxes have certainly decreased by a factor of at least 3 and that this changehas occurred during the last few centuries. 2001 Elsevier Science Ltd. All rights reserved.
* Corresponding author.E-mail address: [email protected] (C. Rabouille).
0079-6611/01/$ - see front matter 2001 Elsevier Science Ltd. All rights reserved.PII: S0079 -6611(01 )00054-4

202 C. Rabouille et al. / Progress in Oceanography 50 (2001) 201–221
Contents
1. Introduction . . . . . . . . . . . . . . . . . . . . . . . . . . . . . . . . . . . . . . . . . . . . . . . . . . . . . . . . . 202
2. Methods . . . . . . . . . . . . . . . . . . . . . . . . . . . . . . . . . . . . . . . . . . . . . . . . . . . . . . . . . . . 2032.1. Sampling . . . . . . . . . . . . . . . . . . . . . . . . . . . . . . . . . . . . . . . . . . . . . . . . . . . . . . . . . 203
2.1.1. Sediment traps . . . . . . . . . . . . . . . . . . . . . . . . . . . . . . . . . . . . . . . . . . . . . . . . . . . . 2032.1.2. Autonomous benthic chamber . . . . . . . . . . . . . . . . . . . . . . . . . . . . . . . . . . . . . . . . . . . 2032.1.3. Coring and sample handling . . . . . . . . . . . . . . . . . . . . . . . . . . . . . . . . . . . . . . . . . . . . 203
2.2. Analytical methods . . . . . . . . . . . . . . . . . . . . . . . . . . . . . . . . . . . . . . . . . . . . . . . . . . . 2042.2.1. Particulate inorganic carbon in sediment trap samples . . . . . . . . . . . . . . . . . . . . . . . . . . . . 2042.2.2. Inorganic carbon in sediment samples and dry bulk density . . . . . . . . . . . . . . . . . . . . . . . . . 2042.2.3. Alkalinity (At) measurements and flux determination . . . . . . . . . . . . . . . . . . . . . . . . . . . . . 2052.2.4. Thorium isotopes . . . . . . . . . . . . . . . . . . . . . . . . . . . . . . . . . . . . . . . . . . . . . . . . . . 2052.2.5. Calculation of the focusing factor using 230Th . . . . . . . . . . . . . . . . . . . . . . . . . . . . . . . . . 2062.2.6. δ18O measurements . . . . . . . . . . . . . . . . . . . . . . . . . . . . . . . . . . . . . . . . . . . . . . . . . 2062.2.7. 14C dating . . . . . . . . . . . . . . . . . . . . . . . . . . . . . . . . . . . . . . . . . . . . . . . . . . . . . . . 207
3. Results . . . . . . . . . . . . . . . . . . . . . . . . . . . . . . . . . . . . . . . . . . . . . . . . . . . . . . . . . . . . 2073.1. PIC flux in the water column . . . . . . . . . . . . . . . . . . . . . . . . . . . . . . . . . . . . . . . . . . . . . 2073.2. Dissolution . . . . . . . . . . . . . . . . . . . . . . . . . . . . . . . . . . . . . . . . . . . . . . . . . . . . . . . . 2083.3. Sediment accumulation rates and carbonate burial . . . . . . . . . . . . . . . . . . . . . . . . . . . . . . . . 2113.4. Focusing . . . . . . . . . . . . . . . . . . . . . . . . . . . . . . . . . . . . . . . . . . . . . . . . . . . . . . . . . 214
4. Discussion . . . . . . . . . . . . . . . . . . . . . . . . . . . . . . . . . . . . . . . . . . . . . . . . . . . . . . . . . . 214
5. Conclusion . . . . . . . . . . . . . . . . . . . . . . . . . . . . . . . . . . . . . . . . . . . . . . . . . . . . . . . . . . 219
Acknowledgements . . . . . . . . . . . . . . . . . . . . . . . . . . . . . . . . . . . . . . . . . . . . . . . . . . . . . . . . . 219
References . . . . . . . . . . . . . . . . . . . . . . . . . . . . . . . . . . . . . . . . . . . . . . . . . . . . . . . . . . . . . . 220
1. Introduction
It is accepted that carbonate balance in the ocean controls atmospheric pCO2 over millenial time scales(Broecker & Peng, 1987; Archer & Maier-Raimer, 1994). Over timescales longer than that of oceanicoverturning, the balance between burial of solid carbonate and the carbonate inputs from the rivers exertsa dominant influence on CO2 concentration in the atmosphere (Milliman, 1993). Based on modelling results,it has also been proposed that the carbonate balance in the ocean might be responsible for long-termdamping of the anthropogenic CO2 perturbation (Archer, Keshgi, & Maier-Raimer, 1998).
In deep-sea sediments, carbonate preservation is the result of the balance between the rates of dissolutionand burial. Dissolution occurs in sediments wherever sufficient undersaturation exists, either beneath thelysocline or where metabolic CO2 released during mineralization of organic matter reduces the ambientpH (Emerson & Bender, 1981; Berelson, Hammond, McManus, & Kilgore, 1994; Jahnke, Craven, & Gail-lard, 1994; Martin & Sayles, 1996). Carbonate burial is thus the net result of a complex interplay betweendeposition of carbonate particles which is controlled by production of calcareous plankton and dissolutionwhich is controlled by topography, ocean water chemistry and organic carbon mineralization.
Earlier studies have presented carbonate mass balances for deep-sea sediments (Dymond & Lyle, 1991)and have investigated the potential implications of calcite preservation during glacial–interglacial transitions
203C. Rabouille et al. / Progress in Oceanography 50 (2001) 201–221
(Dymond & Lyle, 1985). Other papers have emphasized the causes of imbalance between the inputs andthe dissolution plus burial of carbonate in Pacific sediments (Berelson et al., 1997) and explained it byincreased dissolution during the recent Holocene period.
In this paper, we investigate mass balance for carbonate at a site situated in the Northeast Atlantic at adepth of 4850 m using sediment trap data for the input flux, in situ benthic chamber measurements ofsediment regeneration and estimates of burial based on 14C dating and δ180 stratigraphy coupled withcarbonate concentration. We report imbalance in the carbonate budget with inputs proving to be less thanthe sum of the burial and dissolution rates. This observed non-steady state raises several issues. Is theimbalance a consequence of biases in the downward flux to the sediment (lateral variation, decadal changeof particulate flux)? What are the causes of this imbalance? What is the timing of the biogeochemicalchange which has promoted such an imbalance? We assess different explanations for this imbalance using230Th and 14C data and a simple box model which accounts for the fate of carbonates in deep-sea sediments.
2. Methods
2.1. Sampling
2.1.1. Sediment trapsSediment traps were deployed at the Porcupine Abyssal Plain (PAP) at 48°50�N, 16°30�W where the
water depth was 4850 m. Results presented here are derived from a three year sampling programme fromOctober 1995 to March 1999. Three PARFLUX sediment traps (surface area 0.5 m2) were deployed at1092–1097 m (trap A), at 3063–3092 m (trap B) and at 4750 m (i.e. 100 m above sea floor; trap C at thetop of the benthic boundary layer). The traps were recovered and re-deployed on five different cruises (fordetails see Lampitt et al., 2001)
2.1.2. Autonomous benthic chamberThe Goteborg autonomous benthic chamber lander (Tengberg et al., 1995) was deployed during four of
the cruises (August 1996–April 1999) at the PAP site to obtain in situ benthic solute fluxes of total alkalinity(At). The lander free-falls to the seabed where it carries out up to 90 different pre-programmed actions.These involved activating different sampling devices with stepper or DC motors, recording signals fromdifferent sensors (temperature, conductivity) and controling a video camera. The lander was recovered atthe surface after releasing acoustically the ballast weights.
One hour after its arrival on the seabed, the lander was activated by a microprocessor and four chambers,each enclosing off an area of 400 cm2 of the sea floor, were inserted gently (4 cm/min) into the sediment.The average chamber penetration varied between 13–21 cm. After an additional hour, four separate refer-ence samples were taken outside the chambers and the chamber lids were closed, marking the start of theincubation. During the incubation, 9 discrete water samples were drawn from each chamber (in 60 ml plasticsyringes) at pre-programmed intervals. Data from the analyses of these samples were used to calculate thebenthic flux (concentration changes with time) of the total alkalinity (At) in each chamber. After 50–70hours, the incubations were terminated and the incubated sediments were brought up to the surface togetherwith the ambient bottom water with a technique similar to the one used on a multicorer (Barnett, Watson, &Conelly, 1984). The overlying water height was measured at eight different places within each chamberafter recovery.
2.1.3. Coring and sample handlingSurface sediments were sampled using either a multicorer (Barnett et al., 1984), a box corer or with the
incubated cores of the lander. Positions of the different cores analysed for this paper are presented in Table

204 C. Rabouille et al. / Progress in Oceanography 50 (2001) 201–221
1. Multicores samples were selected, in which the overlying water was clear and the sediment interfacesshowed no visual signs of disturbance. Box cores were used only if the sediment water interface remainedundisturbed by the collection procedure. This was assessed by the presence of visible animal tracks andburrow structures.
For the study of sediment preservation over millennial time scales, samples were collected using a Kastencorer with a 15x15 cm square cross section. The Kasten corer generally overpenetrated in the sedimentresulting in a loss of a significant part of the Holocene sediment, so data on these upper layers were derivedfrom the boxcore and multicore samples.
Sediment cores, from either the multicorer or the lander, were used for solid carbonate determination.They were sectioned at room temperature onboard ship and then preserved in plastic bags. Box core sub-samples were stored in plastic core-liners and kept at 4°C until the core was opened and sampled in thelaboratory. Kasten cores were opened onboard ship and subsampled using U-channels after removing thelayer in contact with and disturbed by the core liner.
2.2. Analytical methods
2.2.1. Particulate inorganic carbon in sediment trap samplesAliquots of freeze-dried trap samples (~1 mg and 5–10 mg) were weighed into silver capsules (pre-
extracted in a 1:1 mixture of acetone and hexane and heated in a muffled furnace at 250°C for 14 h). Atthe same time aliquots (~2 mg) of pure CaCO3 (standard) were weighed into separate Teflon cups. Thealiquots used for total particulate carbon (PC) determinations, together with half of the standards, werethen analysed immediately, using a Carlo Erba 1106 CHN analyser. Aliquots used for particulate organiccarbon (POC) were de-carbonated according to the acid vapour method of Yamamouro and Kayanne (1995).This consists of wetting (Milli-Q water; 18 M� cm�1 resistivity) the weighed samples and placing themin a dessicator containing concentrated HCl (~250 mL) until the CaCO3 disappears (i.e. ~3–4 h in thiscase). The de-carbonated samples were then dried (~60°C; 4–6 h), in order to drive off the water and excessacid and analysed (Carlo Erba 1106 CHN analyser). Particulate inorganic carbon (PIC) concentrations (%of total dry trap material) were calculated as the difference between the PC and POC. The analyses werecarried out in duplicate and gave reproducibility better than 10%.
2.2.2. Inorganic carbon in sediment samples and dry bulk densityTwo different methods were used to measure inorganic carbon content of the sediment. For two multico-
res (stations 12930#44 and 12930#63; Table 1), total carbon was measured on a LECO analyser afterdrying and weighing the samples. Organic carbon was measured using the same technique after removalof carbonates by treating the samples with 2 N HCl at room temperature until bubbling stopped. Inorganic
Table 1Positions of the different cores used in this study. They are all situated in the BENGAL area
Core label Position Date Cruise Gear
12930#44 48°49.95�N 16°30.20�W September 1996 D222 BC12930#63 48°50.66�N 16°30.40�W September 1996 D222 BC12930#87 48°49.65�N 16°30.30�W September 1996 D222 MC13078#18 48°49.96�N 16°30.51�W April 1997 D226 BC13368#58 48°50.06�N 16°29.88�W March 1998 D231 KASTENM42/2#425 48°59.54�N 16°25.49�W July 1998 M42/2 MCM42/2#432 48°58.01�N 16°28.02�W July 1998 M42/2 MC

205C. Rabouille et al. / Progress in Oceanography 50 (2001) 201–221
carbon was determined by difference between total carbon content and organic carbon concentration. Repro-ducibility was around 5%.
In the box core (station 13078#18), calcium carbonate content was measured using Bomb-calcimetricmethod on the same discrete samples taken for dry density calculation. Calcium carbonate was estimatedfrom the measurement of CO2 pressure released by the digestion of 100 mg of dry sediment by 6 N HClacid in a reaction chamber of a known internal volume 22.4 cm3. The accuracy of the method was ±1%.
Dry bulk densities (DBD) were measured on samples from the same box core. Known volumes ofsediment (V) were sampled using syringes. The dry weights (DW) of these samples were measured after48 h of dessication at 60°C in a ventilated oven. Dry bulk densities (DBD) were calculated according tothe formula:
DBD�DW/V
2.2.3. Alkalinity (At) measurements and flux determinationTotal alkalinity (At) in the bottom water samples and in the water samples from the flux chambers
were determined on-board ship using a rapid, high-precision potentiometric titration method (Haraldsson,Anderson, Hasselloev, Hulth, & Olsson, 1997). The precision of the alkalinity titration was better than0.25% RSD (100*SD/average; n=10) using a sample volume of 1 ml. Before analysis all samples werefiltered through disposable sterile cellulose acetate filters (0.45 µm) and stored refrigerated in clean poly-ethylene vials (thoroughly rinsed in MQ-water) until analysis on-board ship.
The benthic flux of alkalinity (meq m�2 d �1) in the chambers was calculated from the slope of the plotof At versus time, and the height of overlying water. Since each sample taken inside the chamber wasreplaced with an equal volume of ambient bottom water from outside, all the calculations of the trend inAt were corrected for this replacement water. The alkalinity in the reference samples taken from outsidethe chamber at the start of the incubation was used to make this correction, which did not exceed 4–6%of the measured alkalinity flux.
The determination of alkalinity in bottom water is a key issue for the correct estimation of fluxes frombenthic chambers. To achieve a precise measurement of this concentration, at each station where the landerwas deployed, bottom water alkalinity was determined on samples collected a few metres above the bottomwith water samplers on the CTD rosette as well as with reference syringes on the lander taking samplesoutside the chambers. At several stations, bottom water was also collected with the GEOMAR bottomwater sampler collecting samples from 20, 60 and 100 cm above the seafloor. The alkalinity determinedin all these bottom water samples collected in the various different ways agreed very well (within about10 µM). During the first cruise of the BENGAL project (D222) the accuracy of the alkalinity determinationswas not checked versus a Certified Reference Material (CRM), but on subsequnet cruises we used analkalinity-CRM provided by A. Dickson at Scripps. The accurate bottom water alkalinity is therefore closeto 2415 µM.
2.2.4. Thorium isotopesFor samples from multicore 12930#87, uranium and thorium isotopes were measured by α spectrometry
following separation on anion exchange columns and deposition onto aluminium foil. The radiochemicalprocedure used for thorium and uranium isotope measurement was similar to that described by Ku (1965).Details can be found in Legeleux (1994). For samples from multicores M42/2#425 and #432, about 2 gof dried material were treated with aqua regia overnight after adding yield determinant (229Th). The non-dissolved residue was filtered off and attacked with HF/HNO3 until dissolution was complete. After remov-ing excess fluorides using boric acid and repeated hydroxide precipitations the two sample fractions werecombined and passed through an anion exchange column in 8 M HNO3. After repeated washing with 8

206 C. Rabouille et al. / Progress in Oceanography 50 (2001) 201–221
M HNO3, thorium was eluted with 9 M HCl, evaporated and electroplated onto stainless steel discs in asulphate medium (Hallstadius, 1984) and then analysed by alpha spectrometry using surface barrier or PIPSdetectors. Precision for the 230Th determinations was around 5%.
2.2.5. Calculation of the focusing factor using 230ThWe used the 230Th normalization flux method (Bacon, 1984; Suman & Bacon, 1989) to estimate the
amount of laterally supplied material. Excess 230Th activity was calculated by correcting 230Th activity bydecay of uranium in the sediment. Total uranium measured in the samples consists of two components:uranium present in detrital minerals and bio-authigenic uranium derived from seawater.
At the BENGAL site, the good correlation of 232Th with 238U (r2=0.8) suggested that bio-authigenicuranium was not present. The detrital 230Th was substracted from the raw data by using the mean(238U/232Th)d ratio (0.58) and multiplying it by the measured 232Th:
230Thex�230Thmeas�(232Th∗0.58)
230Thex is the 230Th activity corrected for the detrital contribution (dpm/g), 230Thmeas is the measured 230Thactivity (dpm/g) and 232Th is the measured activity of 232Th (dpm/g).
To estimate excess 230Th at the time of deposition (230Th°ex), a correction for the time spent in the sediment
is achieved using 14C age scale. The correction for decay was achieved using:
230Th°ex�
230Thex∗elt
230Th°ex is the time corrected excess 230Th, l is the decay constant of 230Th, and t is time.
Lateral sediment fluxes was estimated by the flux of 230Th°ex compared with the production of 230Th in
the water column. These calculations were based on the assumption that the flux of 230Th to the seaflooris constant and equal to its rate of production in the water column (Bacon, 1984; Suman & Bacon, 1989;Francois, Bacon, & Suman, 1990). When lateral sediment redistribution occurs, the flux of 230Thex into thesediments (Fs) deviates from the expected flux value based on the production in the overlying water column(Fw). In the case of sediment focusing the value (Fs) exceeds the value (Fw) and the focusing factor (�)can be defined as:
��Fs
Fw�
230Th°exwDBDbZ
(1)
where Fs is the flux or accumulation rate of 230Th°ex (dpm cm�2 ky�1), Fw is the production rate of 230Th
in the water column (dpm cm�2 ky�1), 230Th°ex is the 230Th activity at a depth x in the sediment (dpm/g),
w is the sedimentation rate (cm ky�1), DBD is the dry bulk density (g cm�3), Z is the water depth (cm)at the core location and b is the production rate of 230Th in the water column (2.63*10�5 dpm cm�3 ky�1).
2.2.6. d18O measurementsLong-term age models were developed by correlation between the sedimentary records and isotopic
stratigraphy. Oxygen stable isotopic measurements were performed on the planktonic foraminiferan speciesGlobigerina bulloides picked in the narrow size fraction 250–315 µm from cores at station 13078#18 and13668#58. After ultrasonic cleaning in methanol, the foraminiferan shells were heated at 400°C for 45minutes to remove organic matter prior to isotopic analysis. The analyses were carried out on a VG-Optimadual inlet gas mass spectrometer equipped with an automatic carbonate device. Samples of about 100 µg(corresponding to ~12–14 shells of G. bulloides) were immersed in concentrated phosphoric acid at 90°Cto produce the CO2 analysed in the mass spectrometer. During the same analysis, we obtained both 13C/12Cand 18O/16O ratios. Following the conventional notation, results were expressed in δ with respect to thePDB (Pee Dee Belemnite) value. The analytical precision was ±0.06 for δ18O.

207C. Rabouille et al. / Progress in Oceanography 50 (2001) 201–221
2.2.7. 14C datingAccelerator Mass Spectrometry (AMS) 14C ages were performed on shells from the planktonic foramini-
fer species Globorotalia inflata picked in the 250–315 µm size range. This species is generally considerednot to be optimal for 14C dating because of the relatively large water depth range with different 14C contentin which it can live. However, G. inflata was by far the most abundant foraminifera in the sedimentsretrieved these cores and allowed us to obtain, at each level, the ~10 mg of CaCO3 (around 1000 shells)required for one replicated AMS dating.
Foraminiferan shells were carefully hand picked under binocular microscope. They were cleaned with10�2 M HNO3 and then dissolved with concentrated phosphoric acid to produce CO2. This CO2 was reducedunder H2 atmosphere using iron as a catalyst to produce graphite. After reaction was complete, the iron-graphite powder was compressed to form a solid target and introduced in to the accelerator. The analyticalnoise of this preparation technique was about 1‰ of today’s 14C activity (Arnold, Bard, Maurice, &Duplessy, 1987).
14C conventionnal ages were corrected for reservoir age from the upper water column by substracting400 years to the AMS ages obtained (Bard, 1988).
3. Results
3.1. PIC flux in the water column
PIC fluxes in the water column collected by sediment traps were estimated using PIC concentration andmass flux (Fig. 1). We estimated that the relative uncertainty on each flux was 15%, owing to mass fluxand carbonate content uncertainties. Evolution of the carbonate flux displayed a seasonal trend with lowvalues in autumn and winter and higher values in spring and summer at 3100 m. Low year-to-year varia-bility was visible on the spring peak values. Flux measurement reached 1.1 mmol C m�2 d �1 in 1998 and1.0 mmol C m�2 d �1 in 1999 at ~3100 m. The average flux for the two different years (1998 and 1999)
Fig. 1. PIC fluxes in the water column collected by sediment traps. Five deployments, which span over four years, are shown. Onedeployment failed between May 1996 and September 1996 for 3100 m trap and two deployments failed at 100 mab (4750 m) betweenMay 1996 and March 1997. Winter periods are shown as dotted areas on the graph and the inversion in flux is clearly visible overthese periods. The straight line display the average flux at 3100 m (full line) and 4750 m (dotted line) for March 1997–March 1999.

208 C. Rabouille et al. / Progress in Oceanography 50 (2001) 201–221
were similar (Table 2). A comparison of the PIC fluxes for traps situated at ~3100 m and 100 mab indicatesthat fluxes were often larger closer to the seafloor (Fig. 1) especially during winter periods. This wasprobably linked to local resuspension events as suggested by Lampitt, Newton, Jickells, Thomson, andKing (2000). The difference on annual inorganic carbon fluxes between the two depths did not exceed 30%.
3.2. Dissolution
The Goteborg autonomous benthic chamber was used to measure benthic fluxes of alkalinity in situ.Twenty six flux measurements were obtained on the four cruises. Some representative examples of themeasured concentration change of alkalinity with time in the chambers of the lander are given in Fig. 2with variations during the deployment typical of the deep sea (Berelson, Hammond, & Cutter, 1990; Jahnkeet al., 1994). The uncertainty on each flux determination was calculated by estimating the error on theslope of the regression on the individual plots of alkalinity versus time. Since variations of alkalinityconcentrations are small, uncertainties on the calculated fluxes can be large (Table 3). We chose to excludefrom the data set the values for which the relative error was larger than 100%, i.e. when the uncertaintywas larger than the flux. The excluded fluxes (7 values) also correspond to deployments where the scatterof the data points was larger than average and the absolute uncertainty was large. On this reduced datasetshown on Fig. 3 (19 of the initial 26 values), the average flux was 0.88 meq m�2 d �1. We checked thatthis average was not biased by the method used to reduce the data set by using another method of reduction.In this alternative method, we excluded all flux estimates for which the absolute error was above a fixedthreshold of 0.45 meq m�2 d �1, which is half of the weighted average on the total dataset. The averageon this reduced data set (14 of the 26 initial values) was 0.93 meq m�2 d �1. We estimated the standarddeviation of the population using the first reduction method. One sigma deviation was 0.58 meq m�2 d �1
which corresponded to an error for a population of 19 data points of 0.13 meq m�2 d �1 (s/√N)Fluxes of alkalinity from deep-sea sediments must be corrected for nitrification and denitrification before
they can be used to estimate calcium carbonate dissolution rates. Nitrate fluxes measured by the lander(Brunnegard, Stahl, Grandel, Tengberg, & Hall, pers.comm.) were used to estimate nitrification and denitri-fication rates. It was assumed that 80% of the nitrate formed during nitrification constituted the benthicnitrate flux, and that 20% of the nitrate formed during nitrification was denitrified. From organic nitrogento nitrate, there is one mole of alkalinity consumed per mole of nitrate formed (Emerson et al., 1980;Stumm & Morgan, 1981). One mole of alkalinity is produced per mole of ammonium generated fromorganic nitrogen, but two moles of alkalinity are consumed for each mole of ammonium oxidized to nitrate.Based on the fact that measured ammonium fluxes were zero or very small (Brunnegard et al., pers.comm.),
Table 2Average PIC fluxes derived from sediment traps at the BENGAL site at 3100 m depth in the water column and 100 m above bottom(mab). Interannual variability displays averages over two different years. 1—Honjo and Manganini (1993); 2—Newton et al. (1994)
PIC flux (3100 m) (mmol PIC flux (100 mab) (mmolm�2 d�1) m�2 d�1)
Average fluxesMarch 97–March 99 0.37±0.05 0.46±0.06Interannual variabilityMarch 97–March 98 0.36±0.05 0.47±0.06March 98–March 99 0.39±0.05 0.46±0.06Comparison to other flux measurementsJune 89–September 90(1) 0.41±0.06 (3700 m)June 89–September 90(2) 0.28±0.04 0.48±0.07

209C. Rabouille et al. / Progress in Oceanography 50 (2001) 201–221
Fig. 2. Representative examples of alkalinity versus time plots for benthic chamber deployments at the BENGAL site from differentcruises. Alkalinity fluxes and their uncertainty are indicated on the graph. Note that the mid-panel presents two different chambersof the same lander deployment. The dashed line regression corresponds to the diamond (Chamber 2) which shows a larger alkalinityflux. Error bars showed on the graph are 0.25% reproducibility (see text for details).

210 C. Rabouille et al. / Progress in Oceanography 50 (2001) 201–221
Table 3Complete alkalinity fluxes data set measured during benthic chamber deployment. Uncertainties on the determination (1s) is alsodisplayed (�At). The values in italic were removed from average calculations because they display a relative error larger than 100%(see text for details)
Cruise ref Date At flux (meq m�2 d�1) �At (meq m�2 d�1)
D222 September 1996 0.56 0.08D222 – 1.94 0.42D222 – 0.93 0.24D222 – 1.63 0.38D222 – 0.56 0.42D222 – 0.71 0.62D231 March 1998 0.72 0.32D231 – �0.40 0.72D231 – �0.13 0.60D231 – 0.95 0.35D231 – 0.27 0.38D231 – 0.74 0.29D231 – 0.47 0.47D231 – 1.26 0.31M42- 2 July 1998 0.89 0.34M42- 2 – �0.25 0.65M42- 2 – 1.49 1.53M42- 2 – 0.39 0.53M42- 2 – 1.20 0.39M42- 2 – 1.39 1.08M42- 2 – 0.95 0.91M42- 2 – 0.74 0.71142 September 98 1.24 0.85142 – �0.09 0.69142 – 0.45 0.35142 – �0.95 0.45Reduced average 0.86
Fig. 3. The reduced data set with 19 individual alkalinity flux measurements and their associated error bars. The straight line is theaverage of this data set (see text for details).

211C. Rabouille et al. / Progress in Oceanography 50 (2001) 201–221
most of the ammonification is likely to have been nitrified suggesting that the 1:1 ratio between alkalinityconsumption and nitrate production is valid for these sediments. We used a 1:1 ratio also for denitrifi-cation:alkalinity production; for each mole of nitrate consumed one mole of alkalinity is produced (Emersonet al., 1980). The average contribution to alkalinity fluxes from the sum of nitrification and denitrificationwas small, �0.09 meq m�2 d �1. This value was substracted from the average of the measured alka-linity fluxes.
As each mole of dissolving calcium carbonate generates two moles of alkalinity, the average alkalinityflux was divided by two to obtain the average calcium carbonate dissolution rate, 0.4±0.1 mmol m�2 d �1.
3.3. Sediment accumulation rates and carbonate burial
In order to estimate the burial flux of inorganic carbon in BENGAL sediments, we built a model agefor the last 400 years using δ18O and 14C data and coupled the sediment accumulation rates determinedby this model with inorganic carbon and dry bulk density distributions. Inorganic carbon measured in threedifferent cores displayed a two stepped profile with a large inorganic carbon content in the upper mixedlayer and a decreasing content with depth down to around 25 cm where there was a sharp increase ofconcentration (Fig. 4). This enriched layer is visible in BENGAL cores as a whiter layer. At greater depth,the inorganic carbon concentration decreases as it does in the top 25 cm. Dry bulk densities increased withdepth from the surface owing to the decrease in water content of the layers deeper in the sediment. Highervalues (~1 g cm�3) were found in the carbonate rich layer.
By correlating the δ18O record of Kasten core 13668#58 to the standard SPECMAP isotopic record, apreliminary, low-resolution age-model was developed which indicated that the mean sedimentation rateover the deglaciation and the Holocene was about 6 cm kyr�1, in good accordance with the mean sedimen-tation rate found for core SU90-44 (~5.5 cm/kyr; Cortijo, 1995).
Results obtained from our longest kasten core (13368#58) and from a box-core (13078#18) showed lowδ18O values (around 1‰) measured at the top of the core, which indicated that the box core record spannedonly the Holocene period (Fig. 5). At depth, the largest δ18O value measured was only 3.15‰ at 75 cmdowncore, indicating that the Kasten core 13668#58 record did not extend beyond the deglaciation values.Indeed, slightly larger δ18O values of 3.5‰ at around 80–100 cm downcore corresponding to the lastglacial maximum (LGM) were recorded in the piston core SU90-44 retrieved in the vicinity of BENGALarea (4279 m, Cortijo, 1995). At the BENGAL site, no δ18O could be measured for the LGM intervalbecause there was a lack of foraminiferan shells within the interval 82–157 cm downcore, which showedup as a carbonate-poor layer. Strong carbonate dissolution during the LGM in this deep core (located at 4850m of water depth) has caused heavy fragmentation and disappearance of almost all foraminiferan shells.
The 14C ages measured in box core 13078#18 were used to produce a more accurate age model. Thisallowed the calculation of sediment accumulation rates and carbonate burial fluxes during the recent Holo-cene (Fig. 6). The top of the core was dated at 830 14C years BP, and lowest sample at 44 cm was datedat 6700 years 14C BP. The sediments in the box core 13078#18 showed large changes in carbonate content,so a mean sediment accumulation rate could not be used to estimate burial fluxes precisely. As an alterna-tive, we have calculated sediment accumulation rates over discrete depth intervals. We subdivided theupper sediment record into three intervals, over which sedimentation rates appeared to have been relativelyconstant from a simple visual inspection of the 14C ages versus depth plot and over which sediment compo-sition did not vary much. These sediment accumulation rates varied from 6.1 cm kyr�1 to 15.3 cm kyr�1
(Fig. 6). The very high value of 15.3 cm kyr�1 corresponded to the carbonate rich layer.In the upper part of the core, bioturbation has homogenized 14C ages so the surficial sediment appears
to be rather old. Bioturbation effects in box core 13078#18 were clearly apparent from the 14C correctedage of 830 years at the surface. Also the two ages obtained in the upper 3 cm (830 and 900 years) canbe considered to be nearly identical, given the error bar of ±60 years associated with those 14C dates. The

212 C. Rabouille et al. / Progress in Oceanography 50 (2001) 201–221
Fig. 4. Inorganic carbon (in percent dry weight) and dry bulk density profiles in the sediment at the BENGAL site.
210Pb penetration profiles obtained at the BENGAL site indicated a mixing depth of around ~7 cm (Reyss,unpublished data), so we have estimated the age of the mixed layer by calculating the average of the agesover the mixed layer (940 yrs BP). We derived sediment accumulation rates over the interval 7.75–13.75cm by using a linear regression on the 14C ages versus depth. The chosen interval corresponded to a ratherconstant sediment composition and provided a mean sediment accumulation rate of 6.1 cm kyr�1. Theuncertainty of this value was around 1 cm kyr�1. By extrapolating our linear regression equation upwards,the bottom limit of the mixed layer, which corresponded to the intercept with the age of the mixed layer(940 yrs) was found at ~6 cm (Fig. 6). This is in good agreement with the 210Pb data given the lowresolution of 14C ages profile over the top interval.

213C. Rabouille et al. / Progress in Oceanography 50 (2001) 201–221
Fig. 5. δ18O values on one box core (13078#18) and one Kasten core (13368#58) from the BENGAL site compared to a pistoncore from a nearby site (SU90-44).
Fig. 6. (A) 14C age (�400 yr to account for the reservoir age) plotted as a function of depth with the multiple regressions over thefirst 27 cm superimposed. Mixed layer depth and sediment accumulation rates are also plotted on this graph (B) inorganic carbonburial rate as a function of depth.
We calculated accumulation rates for carbonate (burial fluxes, BFc) based on sediment accumulationrates (w), dry bulk density (DBD) and inorganic carbon content (IC) according to the following equation:
BFc�w∗DBD∗IC
BFc values ranged from 0.6 mmol m�2 d �1 (0.001 g cm�2 yr�1) in the upper layer, including the mixedlayer to 1.2 mmol m�2 d �1 in the mid-core, carbonate rich interval found around 25 cm downcore.
Uncertainty in both the DBD and carbonate content measurements arises from the spatial heterogeneity
214 C. Rabouille et al. / Progress in Oceanography 50 (2001) 201–221
of the site but is rather restricted to around ±10% (Fig. 4). The error bar associated with sediment accumu-lation rate estimate is ±1 cm kyr�1. Thus, we conclude that inorganic carbon burial below the sedimentmixed layer over the uppermost interval is 0.66±0.1 mmol m�2 d �1.
3.4. Focusing
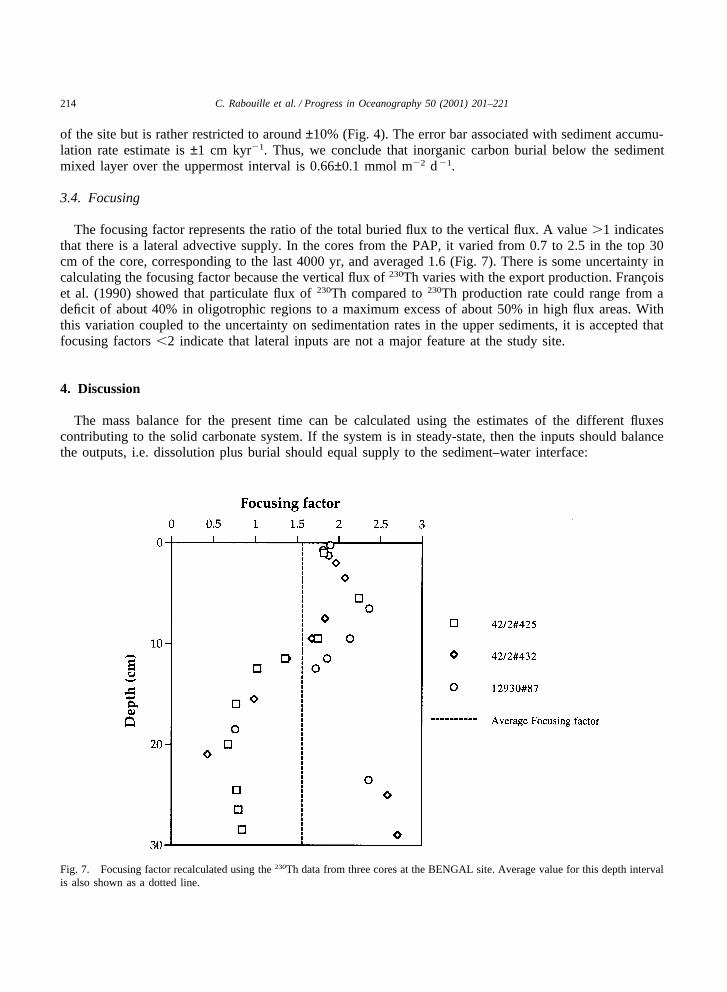
The focusing factor represents the ratio of the total buried flux to the vertical flux. A value �1 indicatesthat there is a lateral advective supply. In the cores from the PAP, it varied from 0.7 to 2.5 in the top 30cm of the core, corresponding to the last 4000 yr, and averaged 1.6 (Fig. 7). There is some uncertainty incalculating the focusing factor because the vertical flux of 230Th varies with the export production. Francoiset al. (1990) showed that particulate flux of 230Th compared to 230Th production rate could range from adeficit of about 40% in oligotrophic regions to a maximum excess of about 50% in high flux areas. Withthis variation coupled to the uncertainty on sedimentation rates in the upper sediments, it is accepted thatfocusing factors �2 indicate that lateral inputs are not a major feature at the study site.
4. Discussion
The mass balance for the present time can be calculated using the estimates of the different fluxescontributing to the solid carbonate system. If the system is in steady-state, then the inputs should balancethe outputs, i.e. dissolution plus burial should equal supply to the sediment–water interface:
Fig. 7. Focusing factor recalculated using the 230Th data from three cores at the BENGAL site. Average value for this depth intervalis also shown as a dotted line.

215C. Rabouille et al. / Progress in Oceanography 50 (2001) 201–221
PIC deposition�PIC dissolutionPIC burial
It is clear from Table 4 that there is not a mass balance for carbonate at the BENGAL station. Burialalone is almost the double the deposition flux and dissolution equals it. Thus the combined burial anddissolution fluxes are three times higher than deposition rate. Even though the uncertainty associated witheach estimate is rather large, this difference between the particle flux determined by sediment traps andthe dissolution and burial is much larger than the sum of the individual uncertainties (Table 4).
This observed imbalance could be the result of different processes: (i) Lateral advection near the bottomcould be adding material to the seafloor but would not be recorded in mid-water sediment traps; and (ii)the average deposition flux may show strong variability over decadal timescales, and the two years of oursampling happened to occur during a low-flux period.
1. Lateral advection transports sediment over oceanic basins through bottom currents. In the western Atlan-tic ocean, it appears to be contributing significantly to accumulation rates (Suman & Bacon, 1989). Butat PAP there are several indicators that the vertical flux is not being supplemented by significant lateralinputs. The average PIC flux at 3100 m and 4700 m differ by 30% at most, which does not indicatethere is massive transfer by deep-water circulation. A multi-tracer study has indicated that this increaseof flux with depth is linked to wintertime resuspension of locally deposited sediments (Lampitt et al.,2000). Non-conservative components of the flux which undergo little or no burial (biogenic silica or210Pb) are in good agreement between sediment trap fluxes and sediment deposition. Biogenic silicabudget is in balance within 30%; dissolution accounts for 90% of the particulate input and burial is lessthan 10% (Ragueneau et al., 2001). A similar feature is observed for 210Pbxs (Reyss, unpublished results):particulate flux caught in sediment traps at 4750 m compare within 20% with sediment inventory. Thisoverall agreement between sediment trap flux and sediment recycling also points towards a good trappingefficiency for BENGAL sediment traps in the mid-water column. The focusing factor calculated using230Th measurement shows a similar picture but gives an historical perspective to lateral advection. Inour case, the average focusing factor is 1.6 over the first 30 cm of the core, which represent a 4000year record. This is similar to the findings of Thomson et al. (1993) and Thomson, Colley, Anderson,Cook and Mackenzie (1995) who found a focusing factors of 1.5 over the Holocene in the PorcupineAbyssal Plain at the NABE site 200 km to the SW of the BENGAL site. These results indicate thatlateral advection is not the dominant supply in this region either at present or during the recent past.
2. Decadal variability in particulate flux is another potential bias that needs to be addressed. The regionwhere the BENGAL program was conducted is close to the site where the NABE experiment (JGOFS)was carried out in 1989–1990. During the NABE experiment, two arrays of sediment traps of similardesign (PARFLUX Mark VII) were deployed simultaneously for one year; at 48°N, 21°W (Honjo &Manganini, 1993) and 48°N, 20°W (Newton, Lampitt, Jickells, King, & Boutle, 1994). Their annualfluxes differed slightly with the Honjo and Manganini (1993) value being 30% higher than Newton et
Table 4Carbonate mass balance for the BENGAL site
Flux (mmol C m�2 d�1) Ratio to deposition (%)
PIC flux traps at 3100 m 0.37±0.1carbonate dissolution 0.4±0.1 105carbonate burial 0.66±0.1 180Burial+dissolution 1.05±0.15 280Imbalance 0.7±0.2

216 C. Rabouille et al. / Progress in Oceanography 50 (2001) 201–221
al. (1994) value in the mid-water column. This indicates that at this scale spatial variability of yearlyaveraged biogenic fluxes is limited in this region. The average PIC flux recorded during BENGAL fallswithin the range of the two estimates for 1989–1990. Therefore, it seems likely that decadal and mesos-cale variability of the average PIC flux in this region of the temperate North Atlantic does not exceed30% of the value reported for the BENGAL site. Concerning the long-term change in PIC flux in theNorth Atlantic, Deuser, Jickells, King, and Commeau (1995) showed that this flux was nearly stablefrom 1978 to 1991, contrary to opal flux.
Thus, the observed imbalance in the carbonate system is the result of neither lateral advection nor decadalscale variation in water column fluxes. Nor is this observation restricted to our sampling site. Lampitt etal. (2000) reported that Al and CaCO3 burial exceeds deposition at the NABE site by a factor of 2. Thepossibility that the imbalance is caused by a recent increase of dissolution, as has been suggested byBerelson et al. (1997) for the Equatorial Pacific, can be excluded. In fact, at the BENGAL site, burialalone exceeds deposition, which is not the case in the Equatorial Pacific. Thus, even if dissolution hasbeen very low during the recent past, the carbonate system was still in imbalance with burial exceedingdeposition.
The conclusion from above is that this imbalance in the carbonate budget is indicative of a long-termshift in particulate carbonate fluxes to the seafloor. The timescales on which the different terms of thebudget are calculated are clearly different. For sediment trap PIC fluxes, the data indicate stability overthe last ten years, but no data are available for earlier periods. Dissolution is dominated by the presentand the recent past conditions. Since dissolution certainly affects the content of the whole sediment mixedlayer, the measured alkalinity flux at the present reflects the integration of dissolution over the transit timeof particles within the sediment mixed layer (L/w), which is of the order of 1 kyr. Sediment accumulationrates estimated using 14C dating on foraminiferans occupy a different timescale. Estimates are not measur-able in the bioturbated layer (6 cm) and are calculated below the mixed layer, i.e. for periods older thana millenium.
The imbalance observed in this study between the inputs and dissolution plus burial is therefore certainlylinked to the non-steady state of the inorganic carbon system in the sediment over millennial timescalesreflecting a change in carbonate deposition. Therefore we postulate that in the recent past deposition ofcarbonate was larger than today’s PIC flux.
The estimation of the response time of the carbonate system to such a variation in deposition flux overthis timescale can be made using a box model. This provides estimates of the magnitude of relaxation timeof the system (i.e. the time taken for the system to reach a new steady-state) and to assess the possibilitythat the non-steady state will still prevail for longer than 1 kyr, i.e. the typical transit time in the sedimentmixed layer. The model used is similar to that developed by Keir and Michel (1993) for the mixed layerradiocarbon age of carbonate sediments. Deposition of carbonate in superficial sediments occurs at a pre-scribed rate (Fent), burial is proportional to sedimentation rate and carbonate concentration. Dissolutionoccurs following a first order rate law (Table 5) which is different from the model of Keir and Michel(1993). The choice of a first order kinetic formulation for carbonate dissolution implies that calcium carbon-ate dissolution is proportional to the standing stock in the sediment mixed layer and that undersaturationin the bottom water remains constant throughout time. Another formulation of the kinetics (surfacedissolution) is discussed below.
We simulate the response of the sediment to a rapid drop of carbonate deposition flux by a factor of 3.The sediment accumulation rate decreases in proportion to the PIC and detrital flux. The e-folding responsetime can be evaluated from the solutions of the equation in Table 5:
tcarb1/2 �ln 2/(w/Lk)
Since 1) detrital flux is kept constant and represents a third of the total accumulation and 2) PIC is reduced

217C. Rabouille et al. / Progress in Oceanography 50 (2001) 201–221
Table 5Equations for the box model describing the evolution of solid carbonate concentration in surface sediments
(1�f)LdCarb
dt=Fcarb
ent �(1�f)wCarb�(1�f)kLCarb
Boundary conditions:t=0 Carb=Carb0
Carb: carbonate concentration (mmol m�3 solid)L: mixed layer depth (m)j: porosityw: sedimentation rate (m d�1)k: dissolution rate constant for carbonate (d�1)Fcarb
ent : deposition flux of carbonate (mmol m�2 d�1)Solutions:
Carb=�Carb0�Fcarb
ent
(1−f)(w+kL)�exp���wL+k�t�+Fcarb
ent
(1−f)(w+kL)
by a factor of three after perturbation, the final sedimentation rate would be around 3 cm kyr�1. Thedissolution kinetic coefficient can be estimated if we assume that 15% of the input of carbonate wasdissolved before the onset of the perturbation. This assumption is based on the difference between theinorgC/Al ratio in sediment traps to the inorgC/Al ratio in sediments below the mixed layer (24 and 21respectively; Lampitt et al., 2000). The difference between these ratios compares the dissolution of carbon-ate to the insoluble alumino-silicates. Changes in this dissolution fraction will modify the kinetic constant,but has a low influence on the response time of the system (see below and Table 5). Since the burial fluxis 0.66 mmol C m�2 d �1, dissolution rate is estimated to be about 0.12 mmol C m�2 d �1 and the inventoryof carbonate in the mixed layer is 2.4.105 mmol m�2 (8% PIC, DBD of 0.6 and mixed layer of 6 cm),this produces a dissolution rate constant of:
k�Disscarb/(Invcarb)�4.5·10−7 d −1
The orders of magnitude of the rate constant and the ratio of w/L for a sedimentation rate of 3 cm kyr�1
(14.10�7 d �1) are similar. With such values for the different constants, we obtain the values quoted inTable 6 under a ‘standard case’ . With an e-folding time (tcarb
1/2 ) of 1 kyr, perturbation would be largelydamped and the system attains a new steady-state after about 3 kyr (3 periods which correspond to 90%of the system relaxation).
Changing either the dissolution formulation or magnitude does not significantly alter the order of magni-tude of the response time (Table 5). If dissolution is formulated as a constant share of the deposited flux(interface dissolution; Keir & Michel, 1993), then k=0 and sediment accumulation rate after perturbation
Table 6Half response time of the solid carbonate in the mixed layer as a function of carbonate dissolution kinetics (k) and sediment accumu-lation rate (w)
k (d�1) w (cm kyr�1) tcarb1/2 (kyr)
Standard case 4.8.10�7 3 1.0Larger dissolution rate constant 14.10�7 3 0.7Larger dissolution, lower sedimentation rate 14.10�7 2 0.8Interface dissolution 0 3 1.4Interface dissolution, larger sedimentation rate 0 4 1.0

218 C. Rabouille et al. / Progress in Oceanography 50 (2001) 201–221
would be slightly higher than in the standard case. Indeed, interface dissolution only affects newly depositedfluxes and not the standing stock. In the case of decreasing particulate flux where the inventory remainshigh in the sediment mixed layer, dissolution rate is thus much lower and leaves more carbonate to beburied compared to the standard case. It can be seen in Table 5 that depending on sedimentation rate,response time would vary between 1.0 kyr and 1.4 kyr. However, if the dissolution rate constant forcarbonate was three times larger than in the standard case, the response time would be between 0.7 kyrand 0.8 kyr depending on the change of sedimentation rate after perturbation. This would correspond to35% of the initial flux being dissolved instead of 15%. From these results, it is clear that the responsetime is closely confined to around 1 kyr and the whole relaxation time of the carbonate system in themixed layer is around 3 kyr.
The response time obtained from our simple model indicates that the response of the carbonate systemto a rapid perturbation is slow compared to the transit time in the mixed layer (L/w). As a consequence,the presently observed imbalance where burial is larger than deposition is a result of the slow relaxationof the system towards its new steady-state. Indeed, burial at 10 cm reflects the balance which prevailed1000 yr ago. The changing deposition flux has now promoted new burial conditions that will be detectablewhen this layer has reached the historical record below the sediment mixed layer. The present balancereflects the transition period with low deposition (present state of the system) and large dissolution andlarge burial inherited from the previous state of the system.
One problem remaining is the timing of the transition. If it had occured thousands of year ago, then themixed layer would mostly be reflecting the conditions of the present inputs to the system. One simple wayto assess whether the transition is recent, i.e. that the sediment accumulation rate has not decreased by alarge amount, is from the 14C age of the foraminiferans situated just below the mixed layer. At 7–8 cm,this age is 1270 yr BP. This means that the average sediment accumulation rate over the mixed layerhas been around 6 cm kyr�1 (8 cm/1.3 kyr) which is very close to the value estimated just below themixed layer.
Another way to approach the sediment accumulation rate in the mixed layer is the average 14C age ofthe mixed layer which is largely determined by sediment accumulation rate. Indeed, when sediment accumu-lation rates are low, particles have longer residence times in the sediment mixed layer, which therefore onaverage becomes older. Following Erlenkeuser (1980) the age of the mixed layer is linked to the sedimen-tation rate and the extrapolated sediment surface age following:
TML�TSFL/w
where TML is the observed age of the mixed layer, w is the sedimentation rate, L is the mixed layer depth,and TSF is the extrapolated age of the sediment–water interface calculated from the regression on 14C agesbelow the mixed layer. Thus, the age of the mixed layer corrected by the extrapolated age will be largerfor larger mixed layer depths and lower sediment accumulation rates. In our case, the difference betweenthe two ages is around 0.9 kyr which indicates that sedimentation rate has been rapid. In comparison,sedimentation rates of 2–3 cm kyr�1 on the Ontong-Java Plateau provided differences (TML�TSF) between2.2–3.9 kyr (Erlenkeuser, 1980).
This indicates that the change in sedimentation rate which is visible with the present accumulationestimated in traps, is recent and has not yet had a significant effect on the age of the mixed layer.
The imbalance observed on the particulate carbonate system can thus be summarized as being a conse-quence of sharp decrease in the net deposition of carbonate, which has occured relatively recently duringthe last millenium. The oceanic carbonate mass balance is known to fluctuate over longer periods. Cremer,Grousset, Faugeres, Duprat, and Gonthier (1992) showed that in the Northeastern Atlantic basin, carbonateand terrigenous accumulation fluxes were larger during the Holocene than during glacial periods. Using230Th as a tracer of focusing Bacon (1984) came to the same conclusion for the Western basin of the NorthAtlantic. Several studies in the Equatorial Pacific have suggested that the dissolution magnitude varied

219C. Rabouille et al. / Progress in Oceanography 50 (2001) 201–221
during the Holocene (Keir, 1984; Berelson et al., 1997). Based on 14C and carbonate balance arguments,these authors proposed that dissolution is greater at present than during the early Holocene, which impliesthere has been a change in bottom water carbonate chemistry in the Equatorial Pacific.
Our analysis of the observed imbalance suggests that the situation in the North Atlantic is different withcarbonate fluxes showing variations over recent periods (maybe a few centuries) declining to lower valuesat present compared to during the last millennium. To match the imbalance in the carbonate budget, theparticulate carbonate input flux must have decreased by a factor of three assuming that dissolution is notrecycling a larger fraction of the flux today than in the past. This variation over the last portion of theHolocene is very large and would certainly influence the budgets of CO2 over the late Holocene and thepre-industrial period.
5. Conclusion
Fluxes contributing to the carbonate mass balance in deep-sea sediments of the BENGAL site in theNE Atlantic were investigated using different techniques. Sediment traps situated at 3100 m allowed theestimation of input fluxes, benthic chambers permitted the in situ determination of dissolution in the sedi-ment, and a 14C age model coupled with carbonate and dry bulk densities determinations has allowed theestimation of rates of burial. When comparing these fluxes, even when full allowance is made for theiruncertainties, a large imbalance for the solid carbonate system becomes evident at this site, with burial ofcarbonate alone exceeding the particulate flux from the water column.
Using other tracers such as 230Th, we conclude that sediment deposition is not strongly influenced bylateral advection at this site. A comparison with previously published sediment trap records of PIC fluxesindicates that carbonate flux settling through the water column has not dramatically changed over thelast decade.
One explanation of this imbalance is that there has been the drastic three-fold decrease in the depositionflux sometime during the last millenium. A box model describing the behavior of solid carbonate in deep-sea sediments indicates that the response of the system to such a perturbation would be damped afteraround 3 kyr, which is much longer than the transit time in the sediment mixed layer. The 14C age of themixed layer indicates that the change in sediment accumulation rate has occured within the last 1 kyr andmost probably within the last few centuries. This large variation of carbonate flux in the water columnindicates a major shift has occurred in biogeochemical conditions of the upper ocean at the same timescale.If confirmed by other studies, this decrease of carbonate production could be important when estimatingvariations of marine sources and sinks of CO2 in the Atlantic over the last millenium.
Acknowledgements
We thank the captains and crews of RRS Discovery, RRS Challenger and R.V. Meteor for their helpat sea. We thank G. Wolff for his PIC values in traps, M. Paterne, N. Tisnerat and M. Arnold for the 14Cdates on foraminiferans. We are grateful to Pr L. Labeyrie for his original input to the programme. PascalL’henoret is thanked for collecting most of the samples at sea for the LSCE. This study was part of theBENGAL program supported financially by the EU-MAST program under contract number MAS3-CT950018. Financial support was also given to the Goteborg group by the Swedish Natural ScienceResearch Council (NFR). R. Lampitt received support from NERC. This is LSCE contribution number 493.

220 C. Rabouille et al. / Progress in Oceanography 50 (2001) 201–221
References
Archer, D., Keshgi, H., & Maier-Raimer, E. (1998). Dynamics of fossil fuel CO2 neutralization by marine CaCO3. Global Biogeochem-ical Cycles, 12, 259–276.
Archer, D., & Maier-Raimer, E. (1994). Effect on deep-sea sedimentary calcite preservation on atmospheric CO2 concentration.Nature, London, 367, 260–263.
Arnold, M., Bard, E., Maurice, P., & Duplessy, J. C. (1987). 14C dating with the Gif-sur-Yvette Tandetron Accelerator: status report.Nuclear Instrumental Methods in Physical Research, B29, 120–123.
Bacon, M. P. (1984). Glacial to interglacial changes in carbonate and clay sedimentation in the Atlantic ocean estimated from 230Thmeasurements. Isotope Geoscience, 2, 97–111.
Bard, E. (1988). Correction of accelerator mass spectrometry 14C ages measured in planktonic foraminifera: paleoceanographic impli-cations. Paleoceanography, 3, 635–645.
Barnett, P. R. O., Watson, J., & Conelly, D. (1984). A multiple corer for taking virtually undisturbed samples from shelf, bathyaland abyssal sediments. Oceanologica Acta, 7, 257–263.
Berelson, W., Anderson, R. F., Dymond, J., Demaster, D. J., Hammond, D. E., Collier, R., Honjo, S., Leinen, M., McManus, J.,Pope, R. H., Smith, C. R., & Stephens, M. (1997). Biogenic budgets of particle rain, benthic remineralization and sedimentaccumulation in the Equatorial Pacific. Deep-Sea Research II, 44, 2251–2282.
Berelson, W. M., Hammond, D. E., & Cutter, G. A. (1990). In situ measurements of calcium carbonate dissolution rates in deep-seasediments. Geochimica Cosmochimica Acta, 54, 3013–3020.
Berelson, W. M., Hammond, D. E., McManus, J., & Kilgore, T. E. (1994). Dissolution kinetics of calcium carbonate in equatorialPacific sediments. Global Biogeochemical Cycles, 8, 219–235.
Broecker, W. S., & Peng, T. H. (1987). The role of CaCO3 compensation in the glacial to interglacial atmospheric CO2 change.Global Biogeochemical Cycles, 1, 15–29.
Cortijo, E. (1995). La variabilite climatique rapide dans l’Atlantique Nord depuis 128 000 ans: relations entre les calottes de glaceet l’ocean de surface. Ph.D. Thesis, Universite Paris-Sud.
Cremer, M., Grousset, F., Faugeres, J. C., Duprat, J., & Gonthier, E. (1992). Sediment flux patterns in the Northeastern Atlantic:variability since the last interglacial. Marine Geology, 104, 31–53.
Deuser, W. G., Jickells, T. D., King, P., & Commeau, J. A. (1995). Decadal and annual changes in biogenic opal and carbonatefluxes to the deep Sargasso Sea. Deep-Sea Research I, 42, 1923–1932.
Dymond, J., & Lyle, M. (1985). Flux comparisons between sediments and sediment traps in the eastern tropical Pacific: implicationsfor atmospheric CO2 variations during the Pleistocene. Limnology and Oceanography, 30, 699–712.
Dymond, J., & Lyle, M. (1991). Particle fluxes in the ocean and implications for sources and preservation of ocean sediments. InW. W. Hay, Geomaterial fluxes, glacial to recent (pp. 1–24). Washington DC: National Research Council, National Academyof Science.
Emerson, S. R., & Bender, M. (1981). Carbon fluxes to the sediment–water interface of the deep-sea: calcium carbonate preservation.Journal of Marine Research, 39, 139–162.
Emerson, S., Jahnke, R., Bender, M., Froelich, P., Klinkhammer, G., Bowser, C., & Setlock, G. (1980). Early diagenesis in sedimentsfrom the Eastern Equatorial Pacific, 1. Pore water nutrient and carbonate results. Earth Planetary Science Lettters, 49, 57–80.
Erlenkeuser, H. (1980). 14C age and vertical mixing of deep-sea sediments. Earth Planetary Science Letters, 47, 319–326.Francois, R., Bacon, M. P., & Suman, D. O. (1990). Thorium 230 profiling in deep-sea sediments: high-resolution records of flux
and dissolution of carbonate in the equatorial Atlantic during the last 24,000 years. Paleoceanography, 5, 761–787.Hallstadius, L. (1984). A method for the electrodeposition of actinides. Nuclear Instrumental Methods in Physical Research, 223,
226–273.Haraldsson, C., Anderson, L. G., Hasselloev, M., Hulth, S., & Olsson, K. (1997). Rapid, high-precision potentiometric titration of
alkalinity in ocean and sediment pore waters. Deep-Sea Research I, 44, 2031–2044.Honjo, S., & Manganini, S. J. (1993). Annual biogenic particle fluxes to the interior of the North Atlantic Ocean; studied at 34°N
21°W and 48°N 21°W. Deep-Sea Research II, 40, 587–607.Jahnke, R. A., Craven, D. B., & Gaillard, J.-F. (1994). The influence of organic matter diagenesis on CaCO3 dissolution at the deep-
sea floor. Geochimica Cosmochimica Acta, 58, 2799–2809.Keir, R. S. (1984). Recent increase in Pacific CaCO3 dissolution: a mechanism for generating old 14C ages. Marine Geology, 59,
227–250.Keir, R. S., & Michel, R. L. (1993). Interface dissolution control of the 14C profile in marine sediment. Geochimica Cosmochimica
Acta, 57, 3563–3573.Ku, T. L. (1965). An evaluation of the 234U/238U method as a tool for dating pelagic sediments. Journal of Geophysical Research,
70, 3457–3474.Lampitt, R. S., Bett, B. J., Kiriakoulakis, K. Popova, E. E., Ragueneau, O., Vangrieshem, A., & Wolff, G. A. (2001). Material supply
to the abyssal seafloor in the Northeast Atlantic. Progress in Oceanography, 50, 27–63.

221C. Rabouille et al. / Progress in Oceanography 50 (2001) 201–221
Lampitt, R. S., Newton, P. P., Jickells, T. D., Thomson, J., & King, P. (2000). Near-bottom particle flux in the abyssal NortheastAtlantic. Deep-Sea Research II, 47, 2051–2071.
Legeleux, F. (1994). Relations entre particules marines et message sedimentaire: flux de matiere dans la colonne d’eau et transform-ations a l’ interface eau–sediment dans l’ocean Atlantique tropical du nord-est. Ph.D. thesis, Universite Paris 6, Paris, 232 pp.
Martin, W. R., & Sayles, F. L. (1996). CaCO3 dissolution in sediments of the Ceara Rise, western equatorial Atlantic. GeochimicaCosmochimica Acta, 60, 243–263.
Milliman, J. D. (1993). Production and accumulation of calcium carbonate in the ocean: budget of a nonsteady state. Global Biogeoch-emical Cycles, 7, 927–957.
Newton, P. P., Lampitt, R. S., Jickells, T. D., King, P., & Boutle, C. (1994). Temporal and spatial variability of biogenic particlefluxes during the JGOFS Northeast Atlantic process studies at 47°N, 20°W. Deep-Sea Research I, 41, 1617–1642.
Ragueneau, O., Gallinari, M., Corrin, L., Grandel, S., Hall, P., Hauvespre, A., Lampitt, R. S., Rickert, D., Stahl, H., Tengberg, A., &Witbaard, R. (2001). The benthic silica cycle in the Northeast Atlantic: annual mass balance, seasonality, and importance of non-steady-state processes for the early diagenesis of biogenic opal in deep-sea sediments. Progress in Oceanography, 50, 171–200.
Suman, D. O., & Bacon, M. P. (1989). Variations in Holocene sedimentation in the North American basin determined from 230Thmeasurements. Deep-Sea Research, 36, 869–878.
Stumm, W., & Morgan, J. J. (1981). Aquatic chemistry (2nd ed.). New York: Wiley Interscience.Tengberg, A., de Bovee, F., Hall, P., Berelson, W., Chadwick, B., Ciceri, G., Crassous, P., Devol, A., Emerson, S., Gage, J., Glud,
R., Graziottin, F., Gundersen, J., Hammond, D., Helder, W., Hinga, K., Holby, O., Jahnke, R., Khripounoff, A., Lieberman, H.,Nuppenau, V., Pfannkuche, O., Reimers, C., Rowe, G., Sahami, A., Sayles, F., Schurter, M., Smallman, D., Wehrli, B., & deWilde, P. (1995). Benthic chamber and profiling landers in oceanography—a review of design, technical solutions and functioning.Progress in Oceanography, 35, 253–294.
Thomson, J., Colley, S., Anderson, R., Cook, G. T., & Mackenzie, A. B. (1995). A comparison of sediment accumulation chronologiesby the radiocarbon and the 230Thexcess method. Earth Planetary Science Letters, 133, 59–70.
Thomson, J., Colley, S., Anderson, R., Cook, G. T., Mackenzie, A. B., & Harkness, D. D. (1993). Holocene sediment fluxes in thenortheast atlantic from 230Thexcess and radiocarbon measurements. Paleoceanography, 8, 631–650.
Yamamouro, Y., & Kayanne, H. (1995). Rapid direct determination of organic carbon and nitrogen in carbonate-bearing sedimentswith a Yanaco MT5 CHN analyser. Limnology and Oceanography, 40, 1001–1005.