imaging single enzyme molecules under in situ conditions
TRANSCRIPT
Bio-ElectrochemistryDOI: 10.1002/anie.200806144
Imaging Single Enzyme Molecules under In Situ Conditions**Claudia Baier and Ulrich Stimming*
The electrochemical investigation of redox enzymes hasbecome a broad field of research because the redox propertiesof the enzymes make them candidates for biosensors andbioelectronic nanodevices.[1] The degree of surface coverage,the surface orientation of the enzymes, that is, the position ofthe active site, and the activity of a single enzyme are still aquestion of dispute; this data can not be extracted fromintegral electrochemical measurements, such as cyclic vol-tammetry (CV). It has been shown, however, that scanningprobe techniques, especially the electrochemical scanningtunneling microscopy (EC-STM),[2, 3] can reveal the structureand reactivity of enzymes down to a single-molecule level,[4–6]
although some experimental problems remain. To avoid anydamage to the protein structure only small tunneling currentsIT can be applied. Therefore, scanning electrochemicalpotential microscopy (SECPM), a technique which measuresthe potential at zero current (I = 0) may be advantageous. Thehardware is similar to an EC-STM, however the tip, is used asa potential sensor. The potential difference between the tipand the applied potential at the working electrode ismeasured with a high-impedance potential amplifier andserves as a feedback signal in the x–y scanning mode. Inaddition, SECPM also offers the possibility to map thepotential distribution of the interface in the x–z direction, thatis, perpendicular to the electrode surface. According to theGouy–Chapman–Stern theory, at the electrode/electrolyteinterface of every electrode there is an electrochemicaldouble layer (EDL), the potential of which decreases withthe distance from the electrode surface.[7]
Woo et al.[8] measured the local potential profile of anAu(111) electrode in 1 mm NaBF4 by moving the tip of ahome-built instrument based on a modified EC-STM per-pendicular to the surface (x–z direction). Hurth et al.[9]
performed similar experiments to study the influence of thesurface potential and of the electrolyte concentration on thedouble layer profile of a Pt foil in KCl. Corbella et al.[10] firstused the constant potential mode of this technique toinvestigate the distribution of tungsten in diamond-likecarbon films by imaging the surface in the x–y direction.
These are the only examples described to date for thistechnique.
SECPM appears to be especially suited for the inves-tigation of organic and biological molecules adsorbed onelectrode surfaces under electrochemical conditions. Hereinwe report the use of constant-potential-mode SECPM toimage single enzymes adsorbed on electrode surfaces. Study-ing enzymes of different size, chemical composition, andelectrochemical properties, we can show that SECPM is ableto image biomolecules under in situ conditions with anunprecedented resolution. Comparing SECPM images withEC-STM images indicates that a potentiometric technique,such as SECPM, may be advantageous for imaging enzymesat the solid–liquid interface and has the potential to inves-tigate the dynamic behavior of an enzyme on the surface.
As in all scanning probe techniques the tip preparationhas to be tailored to the specific needs of the technique. Thetip geometry determines the resolution, because the change inthe potential distribution perpendicular and parallel to theelectrode surface is different, the tip should be chosen basedon the scan mode. For the x–z direction a tip with a shortextension Dz along the z-axis and for the x–y mapping a sharptip (Dx and Dy are small) as in STM are advantageous.
The tip is a metal electrode with an EDL at the solid–liquid interface. Thus when the tip approaches the electrodeboth EDLs will overlap; again the x–z and the x–y mode haveto be distinguished. Moving in the x–z direction towards thesurface, the potential measured at the tip is increasinglyinfluenced by the overlapping EDLs. With a model of twooverlapping EDLs at identical metals, both following theGouy–Chapman theory (dilute electrolyte), it is possible todeconvolute the potentials and to calculate the EDL at theelectrode surface.[11]
In the x–y mode, the influences of two overlapping EDLscan be considered as almost constant throughout the imaging.In this case it is also possible to deconvolute the potentials.Further discussions of the tip influence are given in theSupporting Information.
The iron-storage protein ferritin and the iron-free con-formation apoferritin have a well defined 3D structure. Bothproteins consist of 24 subunits forming a spherical proteinshell, 12 nm in diameter. Whereas each ferritin can storeabout 4500 FeIII ions (as 8FeO(OH)·FeO(H2PO3) crystallites)in a core which has a diameter of up to 8 nm,[12] apoferritinonly consists of the hollow protein shell.[13] Figure 1 shows twoferritin molecules adsorbed on line defects of an oxidizedhighly oriented pyrolytic graphite (HOPG) surface imaged in10 mm PBS (phosphate buffer solution) in constant-current-mode EC-STM (UBias = 0.1 V, IT = 0.5 nA; Figure 1A1) andconstant-potential-mode SECPM (DU = 5 mV; Figure 1B1).Both images show a similar shape of the molecules with adiameter of 7.5 nm (left enzyme) and 6.9 nm (right enzyme)
[*] C. Baier, U. StimmingDepartment of Physics E19, Technische Universit�t M�nchenJames-Franck-Strasse 1, 85748 Garching (Germany)Fax: (+ 49)89-2891-2530E-mail: [email protected]
[**] The authors thank Dr. J�rg Eppinger for his help with the simulationof the surface potential of horseradish peroxidase. This work wassupported by the International Graduate School Materials Scienceof Complex Interfaces in the framework of Elitenetzwerk Bayern andMax-Buchner Forschungsstiftung (DECHEMA).
Supporting information for this article is available on the WWWunder http://dx.doi.org/10.1002/anie.200806144.
Communications
5542 � 2009 Wiley-VCH Verlag GmbH & Co. KGaA, Weinheim Angew. Chem. Int. Ed. 2009, 48, 5542 –5544

and a height of 0.5 nm relative to the HOPG flat surface (linescans in Figure 1A2, B2). During STM measurements arti-facts are sometimes observed, probably arising from tip–electrode interactions, especially when agglomerates ofmolecules are imaged. The same electrode area can beimaged in SECPM mode without any disturbance.
Apoferritin was also examined using SECPM and STM.SECPM images resolve single molecules (Figure 2A) thathave a diameter of approximately 12 nm (Figure 2B),whereas the investigation by EC-STM completely failed.
From these results we assume:1) With SECPM it is possible to visualize the protein
structure of the hollow apoferritin (diameter 12 nm), thelow image contrast may result from the rather evenpotential distribution of the protein;
2) With STM it is not possible to image apoferritin, probablybecause of the low conductivity of the protein polypep-tide;
3) With STM and SECPM it is possible to resolve ferritinmolecules with comparable resolution. The measureddiameter, however, is much smaller than that of apoferri-tin. We assume that the conductivity (STM) and thepotential distribution (SECPM) of the iron atoms insidethe cavity of the ferritin molecule dominate in the imaging
process at the expense of the properties of the proteinshell.
In contrast to ferritin, the redox enzyme horseradishperoxidase (HRP) contains only one iron atom which islocated in the active site, the heme group.[14] Single HRPmolecules were imaged in 10 mm PBS by constant-potential-mode SECPM (Figure 3A; DU = 5 mV). All five visiblemolecules exhibit an open-loop-shaped structure with meandimensions of 54 � 52 � 3.2 �3. The same area was also imagedin STM (Figure 3B; UBias = 0.1 V, IT = 0.5 nA). The four brightspots represent single molecules with dimensions of 43 � 34 �2.4 �3.
Comparing STM and SECPM, the molecules could beresolved to a much greater extent in SECPM. Furthermore, inSECPM an additional HRP molecule in the upper part of theimage (Figure 3 A, black circle) can be observed which is notvisible in STM. A poor electrical contact between enzyme andelectrode in STM may inhibit the electron transfer to the tipand thus prevent imaging of the molecules. Since SECPMonly maps the charge distribution of the molecule no electrontransfer is required.
In addition, the resolution of the STM image is relativelylow, especially the size of the molecules is smaller than thatreported by Zhang et al.[4] based on ex situ (62 � 43 � 12 �3)and in situ (68 � 44 � 40 �3) STM studies performed onHOPG with IT = 0.5–1.2 nA. A possible explanation for thisobservation may be again a poor contact of the enzymes withthe substrate possibly impairing the STM image. Further-more, contributions from tip intrusion into the molecule mustbe taken into account. It has to be considered that in STM,applying a tunneling current of 0.5 nA means that approx-imately 109 e� s�1 flow through the molecule, that is, oneelectron per nanosecond. This flow may have a negative effectnot only on the image quality, but also on the proteinstructure.
In a 3D representation of the SECPM image (Figure 4A)of two molecules the open-loop structure is clearly recogniz-able. Figure 4 B shows the corresponding contour plot ofFigure 4A. The lines represent constant height slices with aconstant height difference of 0.27 �. From X-ray crystallo-graphic data it is concluded that the heme is located in apocket between the distal and the proximal domain of themolecule (Figure 4C).[14] Comparing the 3D image and the X-ray structure it could be suggested that the open-loop seen in
Figure 1. A1) EC-STM image and B1) SECPM image of ferritin on aHOPG electrode (40 nm � 40 nm) with corresponding line scans (A2)and (B2).
Figure 2. A) SECPM image of apoferritin on a HOPG electrode(90 nm � 90 nm) and B) corresponding line scan.
Figure 3. A) SECPM image and B) EC-STM image of HRP on a HOPGelectrode.
AngewandteChemie
5543Angew. Chem. Int. Ed. 2009, 48, 5542 –5544 � 2009 Wiley-VCH Verlag GmbH & Co. KGaA, Weinheim www.angewandte.org
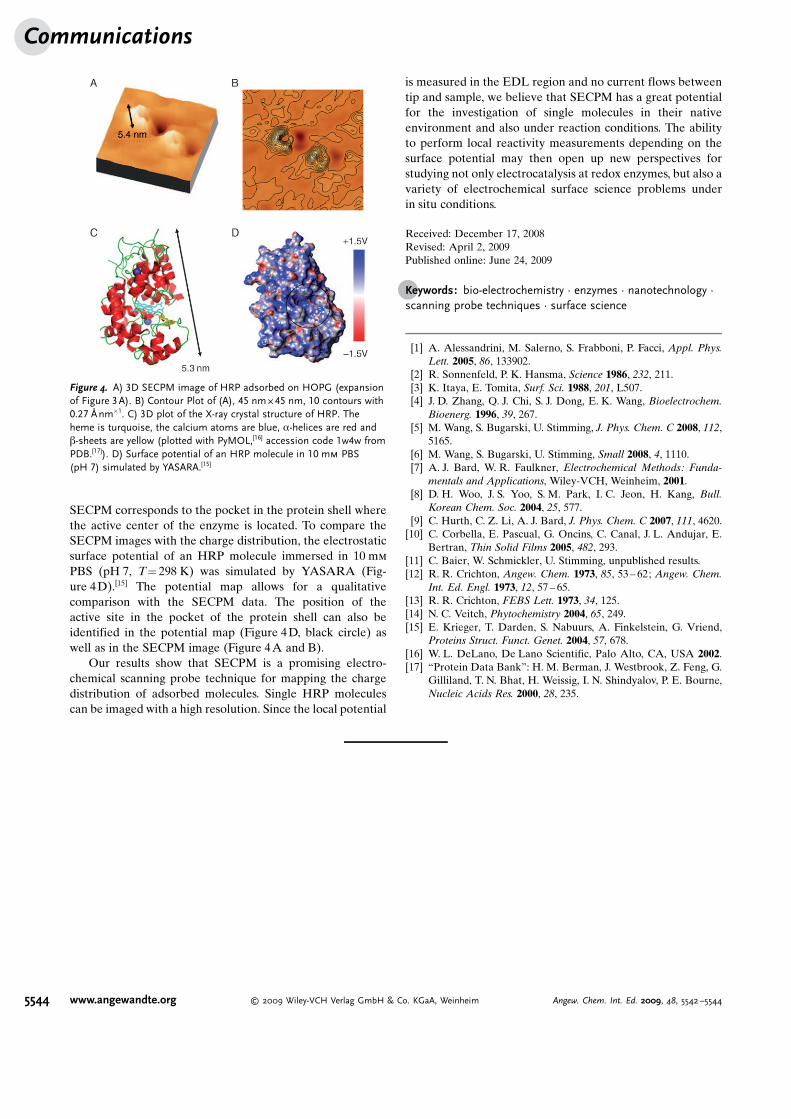
SECPM corresponds to the pocket in the protein shell wherethe active center of the enzyme is located. To compare theSECPM images with the charge distribution, the electrostaticsurface potential of an HRP molecule immersed in 10 mm
PBS (pH 7, T= 298 K) was simulated by YASARA (Fig-ure 4D).[15] The potential map allows for a qualitativecomparison with the SECPM data. The position of theactive site in the pocket of the protein shell can also beidentified in the potential map (Figure 4D, black circle) aswell as in the SECPM image (Figure 4A and B).
Our results show that SECPM is a promising electro-chemical scanning probe technique for mapping the chargedistribution of adsorbed molecules. Single HRP moleculescan be imaged with a high resolution. Since the local potential
is measured in the EDL region and no current flows betweentip and sample, we believe that SECPM has a great potentialfor the investigation of single molecules in their nativeenvironment and also under reaction conditions. The abilityto perform local reactivity measurements depending on thesurface potential may then open up new perspectives forstudying not only electrocatalysis at redox enzymes, but also avariety of electrochemical surface science problems underin situ conditions.
Received: December 17, 2008Revised: April 2, 2009Published online: June 24, 2009
.Keywords: bio-electrochemistry · enzymes · nanotechnology ·scanning probe techniques · surface science
[1] A. Alessandrini, M. Salerno, S. Frabboni, P. Facci, Appl. Phys.Lett. 2005, 86, 133902.
[2] R. Sonnenfeld, P. K. Hansma, Science 1986, 232, 211.[3] K. Itaya, E. Tomita, Surf. Sci. 1988, 201, L507.[4] J. D. Zhang, Q. J. Chi, S. J. Dong, E. K. Wang, Bioelectrochem.
Bioenerg. 1996, 39, 267.[5] M. Wang, S. Bugarski, U. Stimming, J. Phys. Chem. C 2008, 112,
5165.[6] M. Wang, S. Bugarski, U. Stimming, Small 2008, 4, 1110.[7] A. J. Bard, W. R. Faulkner, Electrochemical Methods: Funda-
mentals and Applications, Wiley-VCH, Weinheim, 2001.[8] D. H. Woo, J. S. Yoo, S. M. Park, I. C. Jeon, H. Kang, Bull.
Korean Chem. Soc. 2004, 25, 577.[9] C. Hurth, C. Z. Li, A. J. Bard, J. Phys. Chem. C 2007, 111, 4620.
[10] C. Corbella, E. Pascual, G. Oncins, C. Canal, J. L. Andujar, E.Bertran, Thin Solid Films 2005, 482, 293.
[11] C. Baier, W. Schmickler, U. Stimming, unpublished results.[12] R. R. Crichton, Angew. Chem. 1973, 85, 53 – 62; Angew. Chem.
Int. Ed. Engl. 1973, 12, 57 – 65.[13] R. R. Crichton, FEBS Lett. 1973, 34, 125.[14] N. C. Veitch, Phytochemistry 2004, 65, 249.[15] E. Krieger, T. Darden, S. Nabuurs, A. Finkelstein, G. Vriend,
Proteins Struct. Funct. Genet. 2004, 57, 678.[16] W. L. DeLano, De Lano Scientific, Palo Alto, CA, USA 2002.[17] “Protein Data Bank”: H. M. Berman, J. Westbrook, Z. Feng, G.
Gilliland, T. N. Bhat, H. Weissig, I. N. Shindyalov, P. E. Bourne,Nucleic Acids Res. 2000, 28, 235.
Figure 4. A) 3D SECPM image of HRP adsorbed on HOPG (expansionof Figure 3A). B) Contour Plot of (A), 45 nm � 45 nm, 10 contours with0.27 � nm�1. C) 3D plot of the X-ray crystal structure of HRP. Theheme is turquoise, the calcium atoms are blue, a-helices are red andb-sheets are yellow (plotted with PyMOL,[16] accession code 1w4w fromPDB.[17]). D) Surface potential of an HRP molecule in 10 mm PBS(pH 7) simulated by YASARA.[15]
Communications
5544 www.angewandte.org � 2009 Wiley-VCH Verlag GmbH & Co. KGaA, Weinheim Angew. Chem. Int. Ed. 2009, 48, 5542 –5544