imagine - new york university
TRANSCRIPT

the possibilities
2001
Financial Report
and 10k
the possibilities
imagine
financials
Securities and Exchange CommissionWashington, D.C. 20549
FORM 10-K
ANNUAL REPORT EXCHANGE ACT OF 1934
For the fiscal year ended December 31, 2001 Commission file number 1-3507
ROHM AND HAAS COMPANY(Exact name of registrant as specified in its charter)
DELAWARE 23-1028370(State or other jurisdiction of (I.R.S. Employer Identification No.)
incorporation or organization)
100 INDEPENDENCE MALL WEST, PHILADELPHIA, PA 19106(Address of principal executive offices) (Zip Code)
Registrant's telephone number, including area code: 215-592-3000
Securities registered pursuant to Section 12(b) of the Act:
Name of Each Exchange onTitle of Each Class Which Registered
Common Stock of $2.50 par value New York Stock Exchange
Securities registered pursuant to Section 12(g) of the Act:
NONE
Indicate by check mark whether the registrant (1) has filed all reports required to be filed by Section 13 or 15(d) of theSecurities Exchange Act of 1934 during the preceding 12 months, and (2) has been subject to such filing requirements forthe past 90 days.Yes X No .
Indicate by check mark if disclosure of delinquent filers pursuant to Item 405 of Regulation S-K is not contained herein,and will not be contained, to the best of registrant's knowledge, in definitive proxy or information statements incorporatedby reference in Part III of this Form 10-K or any amendment to this Form 10-K.
Aggregate market value of voting stock held by nonaffiliates of the registrant as of February 28, 2002: $4,313,328,027
Common stock outstanding at February 28, 2002: 220,677,633 shares.
Documents incorporated by reference:
Part III- Definitive Proxy Statement to be filed with the Securities and Exchange Commission, except the Report onExecutive Compensation, Graph titled “Cumulative Total Return to Shareholders” and Audit Committee Report includedtherein.

3
Rohm and Haas Company -
Net Sales by Business (in millions)
Pro Forma2001(1) 2000( 1) 1999 (1,2)
Coatings $ 1,445 $ 1,494 $ 1,512Adhesives and Sealants 661 707 737Plastics Additives 398 441 490Monomers 357 382 305Surface Finishes 309 373 507Performance Polymers $ 3,170 $ 3,397 $ 3,551
Consumer and Industrial Specialties $ 388 $ 406 $ 374Inorganic and Specialty Solutions 203 236 248Ion Exchange Resins 214 224 211Chemical Specialties $ 805 $ 866 $ 833
Shipley Ronal $ 470 $ 699 $ 621Microelectronics 472 511 246Electronic Materials $ 942 $ 1,210 $ 867
Salt $ 749 $ 876 $ 930
Total Net Sales $ 5,666 $ 6,349 $ 6,181
(1) Restated to conform to current year presentation and exclude the discontinued oper-ations of the Agricultural Chemicals business.
(2) Pro forma results include Morton International, Inc. (Morton), a specialty chemicals pro-ducer (acquired in June 1999) and LeaRonal, Inc. (LeaRonal), an electronic materialsbusiness (acquired in January 1999) as if these acquisitions had occurred on January 1,1999. The results are restated to conform to the current year presentation and exclude thediscontinued operations of the Agricultural Chemicals business. Pro forma information isnot presented for other acquisitions and divestitures occurring in 2001, 2000 and 1999because they were not material to the Company's results of operations or consolidatedfinancial position.
PART I
Item 1. Business
Rohm and Haas
Company
Rohm and Haas Company (theCompany), is a global specialty mate-rials company that reported 2001 netsales of approximately $5.7 billion.The Company is a public corporationwhose shares are traded on the NewYork Stock Exchange under the‘‘ROH’’ symbol and was incorporatedin 1917 under the laws of the State ofDelaware. The Company’s head-quarters office is located at 100Independence Mall West,Philadelphia, Pennsylvania 19106-2399 (phone number (215) 592-3000; internet addresswww.rohmhaas.com).
In 2001, the Company operated fourglobal businesses:
Performance Polymers (56 percent of2001 sales): This segment includesthe sales and operating results forCoatings, Adhesives and Sealants,Plastics Additives, Monomers andSurface Finishes.
Chemical Specialties (14 percent of2001 sales): This segment includesthe sales and operating results forConsumer and Industrial Specialties,Inorganic and Specialty Solutionsand Ion Exchange Resins.
Electronic Materials (17 percent of2001 sales): This segment includesthe sales and operating results forShipley Ronal (including PrintedWiring Board and Electronic andIndustrial Finishes) and Micro-electronics (including Shipley Micro-electronics and Rodel).
Salt (13 percent of 2001 sales): This seg-ment includes the sales and operat-ing results for the most recognizedconsumer salt brands in NorthAmerica (Morton Salt and Windsor
Salt), along with sales derived fromother end-use markets, includingwater conditioning, highway ice con-trol, food processing, chemical/industrial and agriculture.
Rohm and Haas is a geographicallydiverse company, with approximately100 manufacturing and technicallocations in 25 countries. In 2001,53% of net sales were made outsideof the United States. The Company’stechnology can be found in a widerange of end-use markets, includingbuilding and construction, electron-ic and computing devices, food, foodprocessing and packaging, architec-tural and industrial coatings, watertreatment, pharmaceutical, homecleaning and personal care.
Strategy
Rohm and Haas brings technologyand innovation to the market thatenhances the performance of the
end-use consumer products made byits customers and by leveraging itsbroad technology base on a globalbasis within markets where it enjoysleading positions.
The Company is committed to:
• continually bring innovation to themarketplace; even through the2000-2001 economic downturn,the Company maintained its levelof investment in research anddevelopment.
• continually improve the efficiencyof its cost structure, and repositionthe Company geographically toenhance the ability of its customersto serve their market needs.
• achieve, enhance and defend lead-ing market positions; this meansholding the first or second posi-tion in each of the markets or mar-ket segments in which theCompany competes.

financials
4
Summary of Business Segments
Business 2001 Sales Markets Products/ End UsesTechnology
Performance $3,170 millionPolymers:
Coatings $1,445 million Bldg. and Construction A range of House paintsHome Improvement intermediate Traffic paints(do-it-yourself products and Metal coatingsand contractor additives for Coated paperssegments) paints and coatings, Printing inksPackaging textiles, non-woven Non-woven fibersGraphic Arts and leather applications Textile finishesApparel an array of versatile InsulationHome/Office Goods emulsion polymers and LeatherTransportation other technologies
Adhesives $ 661 million Packaging A full-range of Pressure-sensitiveand Sealants Bldg and Construction adhesives and tapes and labels
Transportation laminate materials Packaging tapesHome Improvement (acrylic, urethane, Car interiors
polyester/urethane Weather strippingemulsion polymers) Engine mounts
Flexible packagingGraphic artsCaulks, cementsRoof coatingsSealants
Plastics $ 398 million Bldg. and Construction A wide range of PVC pipeAdditives Home/Office Goods additives that impart Plastic packaging
Transportation desired properties Vinyl sidingRecreation into the end plastic, Wall systemsPackaging or help machinery Vinyl windows
run more efficiently Fencing and decks(acrylic-based Interior automotive modifiers, tin based partsstabilizers, lubricants Appliances andand additives) business machines
Monomers $ 357 million Bldg. and Construction Produces essential AdhesivesPersonal Care starting materials Paints and coatingsAutomotive for acrylic products Floor polishesPackaging and specialty Hair sprays
monomers Super-absorbentproducts

5
Business 2001 Sales Markets Products/ End UsesTechnology
Surface $ 309 millionFinishes
Automotive $ 98 million Transportation Water, solvent and Cars Coatings urethane-based Trucks
exterior and interiorcoatings for plasticparts
Powder $ 211 million Home/Office Goods Epoxy, polyester Cars, shelving, Coatings Recreation, Lawn and and acrylic powder tables and chairs,
Garden Coatings office furniture,Transportation Lamineer, a low cabinetry andBldg. and Construction temperature curing machineryElectronics and coating
Comms. Devices
Chemical $ 805 millionSpecialties:
Consumer and $ 388 million Household Products Antimicrobial, Laundry andIndustrial Personal Care dispersant, and dishwasher Specialties Industrial Processing a range of other detergents
Bldg. and Construction technologies Shampoos, lotionsconditioners andhair sprays
Inorganic $ 203 million Industrial Processing Sulfur-based Corrosionand Specialty Lubricants and Fuels intermediates inhibitorsSolutions and salt-forming Pharmaceutical
bases productsSodium borohydride Papers and and related recycled newsprinttechnologies
Ion $ 214 million Food and Food-related Anion and cation Soft drinks andExchange Electronics and ion exchange resins juicesResins Comms. Devices and adsorbents Ultrapure water
Pharmaceutical CatalysisHome/Office Goods PharmaceuticalsIndustrial Processing

financials
6
Business 2001 Sales Markets Products/ End UsesTechnology
Electronic $ 942 millionMaterials:
Shipley $ 470 million Electronics and Enabling technology Cellular phonesRonal Comms. Devices for all aspects of the PCs
Transportation manufacture of Mainframe Home/Office Goods printed wiring computersRecreation boards; processes Automotive parts
critical to electronic Office equipmentcomponents, advanced Electronic gamespackaging and industrial Steel and metalfinishing markets finishing
Micro- $ 472 million Electronics and Essential technology PCselectronics Comms. Devices for creating state- Cellular phone and
Home/Office Goods of-the-art integrated other comms. Transportation circuits: devicesRecreation photoresists, Home appliances
anti-reflective Office equipmentcoatings, Electronic gameschemical mechanical Cars, trucks, etc.planarization (CMP)
Salt $ 749 million Food and Food Salt in all forms Table saltrelated produced through Cooking saltTransportation vacuum pan Home waterIndustrial Processing production, conditioning saltHome/Office Goods solar evaporation, or Highway salt
mined rock salt Chemical processingsalt
Salt blocks for feed

7
In addition to the summary of busi-ness segments, additional informa-tion appears in Item 7,“Management’s Discussion andAnalysis of Financial Condition andResults of Operations,” and theinformation indicated below appearsin the 2001 “Notes to ConsolidatedFinancial Statements” and is incorpo-rated herein by reference:
Notes toConsolidated
Financial Statements
Industry segment Footnote 9information for years 1999-2001
Foreign operations Footnote 9for years 1999-2001
Raw Materials
The Company uses a variety of com-modity chemicals as raw materials inits operations. In most cases, theseraw materials are purchased frommultiple sources under long-termsupply contracts, created to provideaccess to key raw materials. For theCompany’s Performance Polymersand Chemical Specialties segments,many of these materials are hydro-carbon derivatives such as propylene,acetone and styrene.
Competition and
Seasonality
The Company experiences vigorouscompetition in each of its segmentsand its competitors include manylarge multinational chemical firmsbased in Europe, Asia and the UnitedStates. In some cases, the Companycompetes against firms which areproducers of commodity chemicalswhich the Company must purchaseas the raw materials to make its prod-ucts. The Company however, doesnot believe this places it at any signif-icant competitive disadvantage. TheCompany's products compete withproducts offered by other manufac-turers on the basis of product qualityand specifications, customer serviceand price. Most of the Company'sproducts are specialty chemicalswhich are sold to customers whodemand a high level of customerservice and technical expertise fromthe Company and its sales force. TheSalt segment is most affected byweather-driven sales of highway icecontrol salt in the Eastern UnitedStates and Eastern Canada. To amuch lesser extent, sales in theCoatings segment destined for thepaint market are affected by weatherin various regions.
Research and
Development
The Company maintains its principalresearch and development laborato-ries at Spring House, Pennsylvania.Research and development expensestotaled $230 million, $224 millionand $174 million in 2001, 2000 and1999, respectively. The Companybelieves that its many intellectualproperties are of substantial value inthe manufacturing, marketing andapplication of its various products.Though the Company is not depend-ent, to a material extent, upon anyone trademark, patent or license,certain of the Company’s businessesmay be so dependent.
Environmental
A discussion of environmental relat-ed factors is incorporated herein byreference to Footnote 25:“Contingent Liabilities, Guaranteesand Commitments” in the accompa-nying “Notes to ConsolidatedFinancial Statements.”
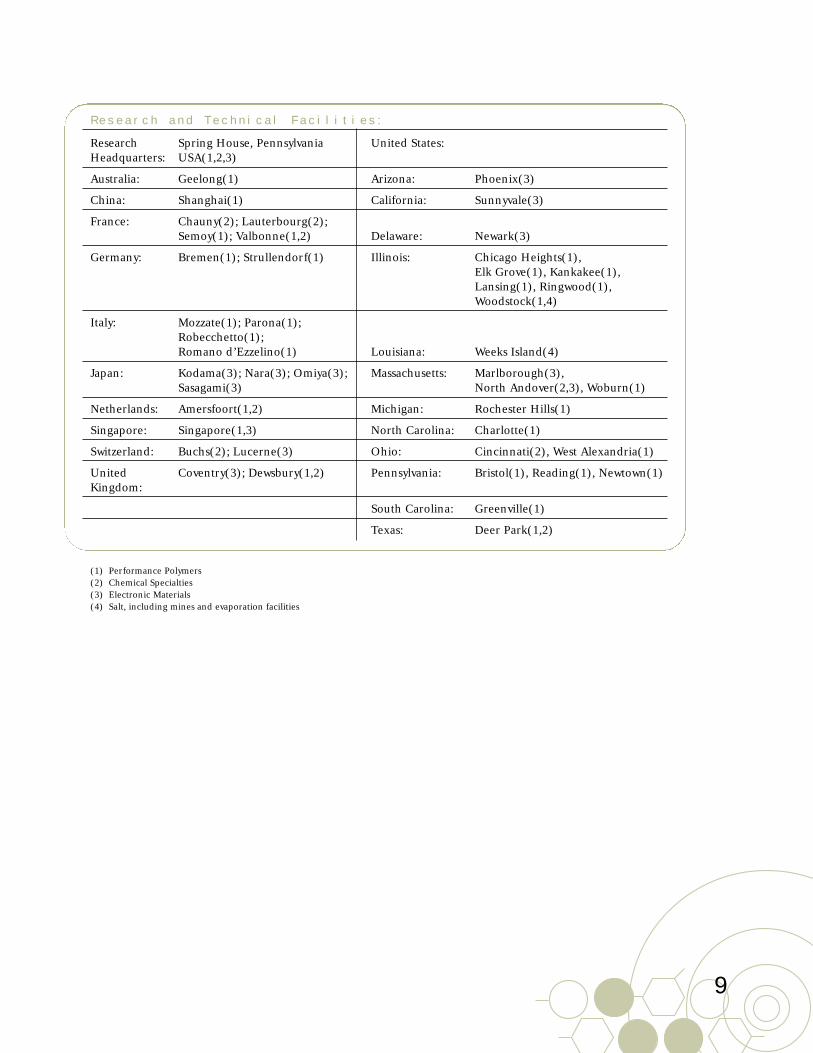
Item 2. Properties
The Company, its subsidiaries andaffiliates presently operate morethan 100 manufacturing facilities,mines and salt evaporation facilitiesin 25 countries. The facilities andthe segment for which they are pro-ductive are detailed below:

financials
8
Manufacturing Locations
Argentina: Zarate(1) United States:
Australia: Geelong(1) Arizona: Glendale(4), Phoenix(3)
Bahamas: Inagua(4) California: Hayward(1), La Mirada(1), LongBeach(4), Newark(4), Sunnyvale(3)
Brazil: Jacarei(1,2) Delaware: Newark(3)
Canada: Iles-De-La-Madeleine(4); Lindbergh(4); Ojibway(4); Pugwash(4); Regina/Belle Plaine(4); West Hill(1,2); Windsor(4) Florida: Cape Canaveral(4)
China: Beijing(1); Dongguan(3); Illinois: Chicago Heights(1),Hong Kong(3); Elk Grove(1), Kankakee(1),Shanghi(1); Songjiang(2) Lansing(1), Ringwood(1)
Colombia: Barranquilla(1,2) Indiana: Warsaw(1)
France: Chauny(2); Lauterbourg(1,2); Semoy(1); Villers-Saint-Paul(2) Kansas: Hutchinson(4)
Germany: Bremen(1); Marl(1); Strullendorf(1) Kentucky: Louisville(1)
Indonesia: Cilegon(1,2) Louisiana: Weeks Island(4)
Italy: Castronno(2,3); Garlasco(1); Mozzanica(1); Mozzate(1); Parona(1); Robecchetto(1); Massachusetts: Marlborough(3), Romano d’Ezzelino(1) North Andover(2,3)
Japan: Kodama(3); Kurosaki(3); Mie(3); Nagoya(1); Nara(3); Ogaki(3); Osaka(3); Sasagami(3); Soma(1); Tokyo(2) Michigan: Manistee(2,4)
Mexico: Apizaco(1,2); Toluca(1) Mississippi: Moss Point(3)
Netherlands: Amersfoort(1,2); Delfijl(2) New Jersey: Perth Amboy(4)
New Zealand: Auckland(1,2) New York: Freeport(2,3), Silver Springs(4)
Philippines: Las Pinas(1,2) North Carolina: Charlotte(1)
Singapore: Singapore(1,3) Ohio: Cincinnati(4), Painesville(4),Rittman(4), West Alexandria(1)
South Africa: New Germany(1) Pennsylvania: Bristol(1), Croydon(1), Philadelphia(2), Reading(1)
Spain: Tudela(1) South Carolina: Greenville(1), Spartanburg(3)
Sweden: Landskrona(1) Tennessee: Knoxville(1)
Switzerland: Buchs(2); Lucerne(3) Texas: Bayport(1), Deer Park(1,2), Grand Saline(4)
Taiwan: Chiayi Hsien(3); Ta Yuan(1,2); Taoyuan Hsien(3) Utah: Grantsville(4)
Thailand: Maptaphut(1,2) Virginia: Wytheville(1)
United Buxton(3); Coventry(3); Kingdom: Dewsbury(1,2); Grangemouth(1);
Jarrow(2); Warrington(2,3)
9
Research and Technical Facilities:
Research Spring House, Pennsylvania United States:Headquarters: USA(1,2,3)
Australia: Geelong(1) Arizona: Phoenix(3)
China: Shanghai(1) California: Sunnyvale(3)
France: Chauny(2); Lauterbourg(2); Semoy(1); Valbonne(1,2) Delaware: Newark(3)
Germany: Bremen(1); Strullendorf(1) Illinois: Chicago Heights(1), Elk Grove(1), Kankakee(1), Lansing(1), Ringwood(1),Woodstock(1,4)
Italy: Mozzate(1); Parona(1); Robecchetto(1);Romano d’Ezzelino(1) Louisiana: Weeks Island(4)
Japan: Kodama(3); Nara(3); Omiya(3); Massachusetts: Marlborough(3), Sasagami(3) North Andover(2,3), Woburn(1)
Netherlands: Amersfoort(1,2) Michigan: Rochester Hills(1)
Singapore: Singapore(1,3) North Carolina: Charlotte(1)
Switzerland: Buchs(2); Lucerne(3) Ohio: Cincinnati(2), West Alexandria(1)
United Coventry(3); Dewsbury(1,2) Pennsylvania: Bristol(1), Reading(1), Newtown(1)Kingdom:
South Carolina: Greenville(1)
Texas: Deer Park(1,2)
(1) Performance Polymers (2) Chemical Specialties (3) Electronic Materials (4) Salt, including mines and evaporation facilities

10
CashPeriod High Low Dividends
20011st Quarter $ 38.7000 $ 29.7700 $ 0.202nd Quarter $ 37.2300 $ 30.0900 $ 0.203rd Quarter $ 36.7800 $ 24.9000 $ 0.204th Quarter $ 37.3000 $ 30.8000 $ 0.20
20001st Quarter $ 47.6250 $ 33.0000 $ 0.192nd Quarter $ 49.4375 $ 32.8750 $ 0.193rd Quarter $ 37.5000 $ 25.6875 $ 0.204th Quarter $ 37.3125 $ 24.3750 $ 0.20
The Company’s manufacturing oper-ations ran well throughout 2001.The plants recorded good operatingefficiencies and cost control, espe-cially considering the decline indemand due to slower globaleconomies. Safety was a key focus, aswell, and significant improvementwas made during the year. The over-all corporate safety record improvedfrom a rate of 2.3 injuries for every200,000 hours worked in 2000, to 1.7injuries on a comparable basis for2001. Sixty-three sites operatedinjury-free throughout the year.
As part of the Company’s compre-hensive 2001 repositioning efforts,Rohm and Haas closed manufactur-ing facilities in Tustin and Orange,California; Moss Point, Mississippiand Paterson, New Jersey. TheCompany announced plans to makefurther reductions in manufacturingcapacity in several businesses in 2002.Continual improvements in design,operation, and process control havesignificantly improved the efficiencyof the Company’s remaining manu-facturing capacity. The Companybelieves it has the ability to generatesignificant additional productioncapacity using its existing manufac-turing operations.
Item 3. Legal
Proceedings
A discussion of legal proceedings isincorporated herein by reference toFootnote 25: “Contingent Liabilities,Guarantees and Commitments” inthe accompanying “Notes toConsolidated Financial Statements.”
Item 4. Submission
of Matters to a
Vote of Security
Holders
There were no matters submitted toa vote of security holders during thefourth quarter of 2001.
PART II
Item 5. Market for
the Registrant's
Common Equity and
Related Stockholder
Matters
The Company's common stock of $2.50par value is traded on the New YorkStock Exchange (Symbol: ROH).There were 9,234 registered commonstockholders as of December 31, 2001.On February 28, 2002, the last sale priceof the Company’s common stock was$38.41. The following table sets forth,for the period indicated, the high andlow sales prices and cash dividends ofthe Company’s common stock.
financials
11
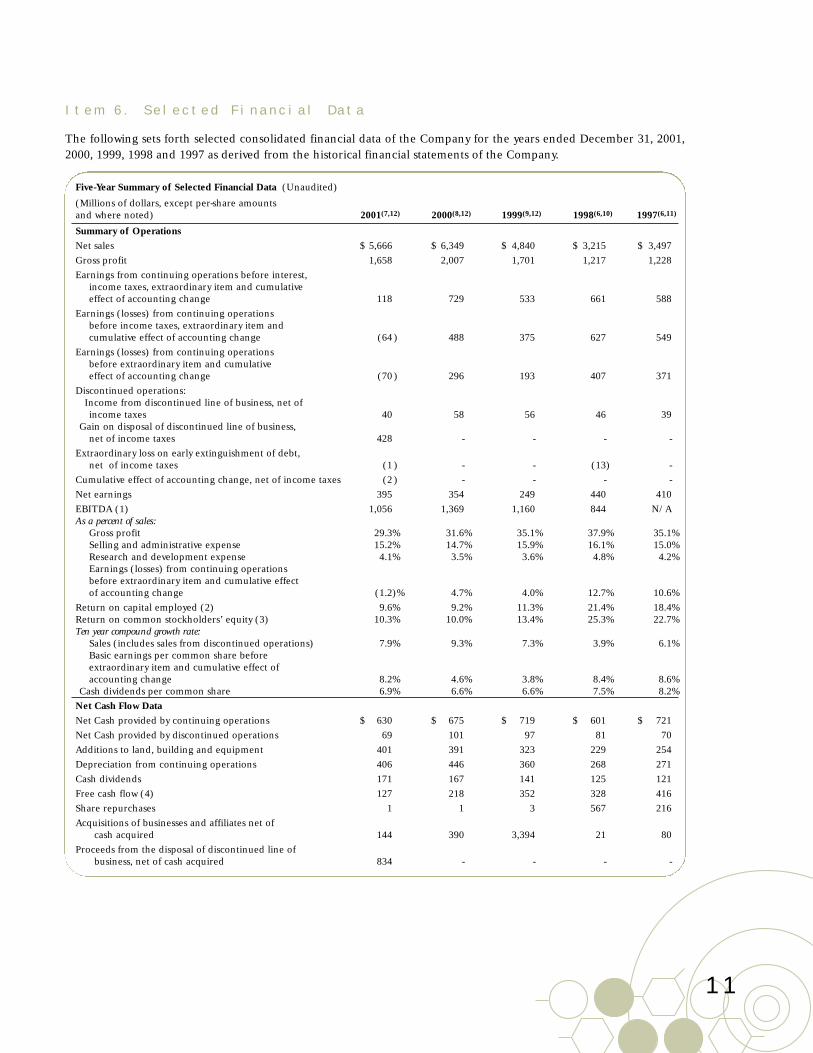
Item 6. Selected Financial Data
The following sets forth selected consolidated financial data of the Company for the years ended December 31, 2001,2000, 1999, 1998 and 1997 as derived from the historical financial statements of the Company.
Five-Year Summary of Selected Financial Data (Unaudited)
(Millions of dollars, except per-share amounts and where noted) 2001(7,12) 2000(8,12) 1999(9,12) 1998(6,10) 1997(6,11)
Summary of OperationsNet sales $ 5,666 $ 6,349 $ 4,840 $ 3,215 $ 3,497Gross profit 1,658 2,007 1,701 1,217 1,228Earnings from continuing operations before interest,
income taxes, extraordinary item and cumulative effect of accounting change 118 729 533 661 588
Earnings (losses) from continuing operations before income taxes, extraordinary item and cumulative effect of accounting change (64 ) 488 375 627 549
Earnings (losses) from continuing operations before extraordinary item and cumulative effect of accounting change (70 ) 296 193 407 371
Discontinued operations:Income from discontinued line of business, net of income taxes 40 58 56 46 39
Gain on disposal of discontinued line of business, net of income taxes 428 - - - -
Extraordinary loss on early extinguishment of debt, net of income taxes (1 ) - - (13) -
Cumulative effect of accounting change, net of income taxes (2 ) - - - -Net earnings 395 354 249 440 410EBITDA (1) 1,056 1,369 1,160 844 N/A As a percent of sales:
Gross profit 29.3% 31.6% 35.1% 37.9% 35.1%Selling and administrative expense 15.2% 14.7% 15.9% 16.1% 15.0%Research and development expense 4.1% 3.5% 3.6% 4.8% 4.2%Earnings (losses) from continuing operations before extraordinary item and cumulative effect of accounting change (1.2)% 4.7% 4.0% 12.7% 10.6%
Return on capital employed (2) 9.6% 9.2% 11.3% 21.4% 18.4%Return on common stockholders’ equity (3) 10.3% 10.0% 13.4% 25.3% 22.7%Ten year compound growth rate:
Sales (includes sales from discontinued operations) 7.9% 9.3% 7.3% 3.9% 6.1%Basic earnings per common share before extraordinary item and cumulative effect of accounting change 8.2% 4.6% 3.8% 8.4% 8.6%
Cash dividends per common share 6.9% 6.6% 6.6% 7.5% 8.2%Net Cash Flow DataNet Cash provided by continuing operations $ 630 $ 675 $ 719 $ 601 $ 721Net Cash provided by discontinued operations 69 101 97 81 70Additions to land, building and equipment 401 391 323 229 254Depreciation from continuing operations 406 446 360 268 271Cash dividends 171 167 141 125 121Free cash flow (4) 127 218 352 328 416Share repurchases 1 1 3 567 216Acquisitions of businesses and affiliates net of
cash acquired 144 390 3,394 21 80Proceeds from the disposal of discontinued line of
business, net of cash acquired 834 - - - -

financials
12
Five-Year Summary of Selected Financial Data (Unaudited) (continued)
(Millions of dollars, except per-share amounts and where noted) 2001(7,12) 2000(8,12) 1999(9,12) 1998(6,10) 1997(6,11)
Per Common Share Data and Other Share Information Earnings (losses) from continuing operations before
extraordinary items and cumulative effect of accounting changes:Basic $ (0.31) $ 1.34 $ .99 $ 2.29 $ 1.96Diluted $ (0.31) $ 1.34 $ .98 $ 2.26 $ 1.93
Cash dividends per common share $ .80 $ .78 $ .74 $ .70 $ .63Common stock price
High $ 38.7000 $ 49.4375 $ 49.2500 $ 38.8750 $ 33.7500Low $ 24.9000 $ 24.3750 $ 28.1250 $ 26.0000 $ 23.5625Year-end close $ 34.6300 $ 36.3125 $ 40.6875 $ 30.1250 $ 31.9375
Number of shares repurchased, in thousands 33 18 70 17,459 7,653Average number of shares outstanding –
basic, in thousands 220,249 219,535 192,586 175,591 185,808Average number of shares outstanding –
diluted, in thousands 220,249 220,500 195,700 179,700 192,400
At Year-EndGross fixed assets $ 6,618 $ 6,699 $ 6,349 $ 4,471 $ 4,492Total assets 10,350 11,252 11,256 3,648 3,900Total debt 2,898 3,774 4,053 581 606Stockholders’ equity 3,815 3,653 3,475 1,561 1,797Debt ratio (5) 42% 49% 52% 25% 22%Number of registered common stockholders 9,234 9,226 9,462 4,451 4,352Number of employees 18,210 20,248 21,512 11,265 11,592
(1) Earnings before interest, taxes, depreciation and amortization. EBITDA excludes non-recurring items and is presented to assist security ana-lysts and others in evaluating the Company’s performance and its ability to generate cash. EBITDA should not be considered an alternativeto cash flow from operating activities as a measure of liquidity or as an alternative to net income as an indicator of the Company’s operatingperformance in accordance with generally accepted accounting principles. The Company’s definition of EBITDA may not be consistent withthat used by other companies. The Company did not calculate this measure prior to 1998.
(2) Net earnings plus after-tax amortization and interest expense divided by average total assets less cash and average non-interest bearing lia-bilities. Years 2000 and 1999 exclude the purchased in-process research and development (IPR&D) charges. Years 2001 and 1998 excludeextraordinary loss on early extinguishment of debt and year 2001 excludes the cumulative effect of accounting change.
(3) Excluding ESOP adjustment and cumulative effect of accounting changes. Years 2000 and 1999 exclude IPR&D charges.(4) Cash provided by operating activities including discontinued operations less dividends and additions to land, building and equipment. (5) Total debt, net of cash (net debt), divided by the sum of net debt, minority interest, stockholders’ equity and ESOP shares.(6) Reclassified to conform to current year presentation, primarily as a result of discontinued operations.
Notes 7-11 reflect all amounts net of income taxes (see table on page 16 for additional information related to 2001, 2000 and 1999 non-recurringitems):
(7) Included in 2001 results are net non-recurring charges in continuing operations of $259 million, gain on disposal of line of business of $428million and income from discontinued operations of $40 million, an extraordinary loss on early extinguishment of debt of $1 million and a$2 million charge for the cumulative effect of accounting change.
(8) Included in 2000 results are net non-recurring charges in continuing operations of $28 million and income from discontinued operationsof $58 million.
(9) Included in 1999 results are net non-recurring charges in continuing operations of $161 million and income from discontinued operationsof $56 million. Also included in 1999 are results from Morton, a specialty chemicals producer acquired in June 1999 and LeaRonal, an elec-tronic materials business acquired in January 1999.
(10) Included in 1998 results is net non-recurring income of $45 million, consisting of a gain in continuing operations from the sale of the Company’sinterest in the AtoHaas and RohMax joint ventures, a loss from the early extinguishment of debt, the write-off of certain intangible assets inEurope and business realignment costs primarily in Asia. Also included is income from discontinued operations of $46 million.
(11) Included in 1997 results is a net non-recurring gain in continuing operations of $16 million, the net result of remediation settlements withinsurance carriers and discontinued operations income of $39 million.
(12) See 2001, 2000 and 1999 results in “Management’s Discussion and Analysis of Financial Condition and results of Operations” for additionalinformation.
13
Item 7.Management's
Discussion and
Analysis of
Financial Condition
and Results of
Operations
The following commentary shouldbe read in conjunction with the con-solidated financial statements andnotes to financial statements for theyears ended December 31, 2001,2000 and 1999.
“Same business basis” as it relates tothe comparison of sales betweenreporting periods includes onlythose businesses, segments or divi-sions that have been in place duringthe entire reportable period.
Earnings (losses) from continuingoperations before extraordinary itemand cumulative effect of accountingchange are abbreviated as “Earnings(losses) from continuing operations”within the “Management’s Discussionand Analysis of Financial Conditionand Results of Operations” and “Notesto Consolidated Financial Statements.”
Significant ItemsAffecting 2001, 2000and 1999 Results ofOperations
In January 1999, the Companyacquired LeaRonal, an electronicmaterials business and in June of1999, Morton. Details of these trans-actions are discussed under“Liquidity, Capital Resources andOther Financial Data” below. Theresults of these significant acquisi-tions have been included in the con-solidated financial statements sincethe dates of acquisition. Unauditedpro forma information is presentedin the table on page 19.
The LeaRonal and Morton acquisi-tions, accounted for using the pur-chase method, significantly impactedthe comparability of 2000 and 1999results. Accordingly, 1999 pro forma
sales and earnings excluding non-recurring items are provided in theresults of operations discussions tofacilitate comparisons. The proforma results include Morton andLeaRonal as if these significant acqui-sitions had occurred on January 1,1999. Pro forma adjustments weremade primarily to reflect increasedgoodwill and intangible amortizationand interest expense. Cost savingsfrom integration efforts were notreflected. Though useful for compar-ison, pro forma results are not intend-ed to reflect actual earnings had theacquisitions occurred on the datesindicated and are not a projection offuture results or trends. Pro formainformation is not presented for otheracquisition and divestiture activitiesoccurring in 2001, 2000 and 1999because these were not material to theCompany's results of operations orconsolidated financial position.
Non-recurring Items
Non-recurring items represent gains orlosses arising from events or transac-tions that are unusual in nature, occurinfrequently or satisfy the definition ofan extraordinary item in accordancewith Accounting Principles Board(APB) 30 “Reporting the Results ofOperations - Reporting the Effects ofDisposal of a Segment of a Businessand Extraordinary, Unusual andInfrequently Occurring Events andTransactions.” Unless otherwise indi-cated, the impact of non-recurringitems on operations within the contextof the Management’s Discussion andAnalysis is stated net of tax.
Sale of the
Agricultural Chemicals
Business
Following the sale of its AgriculturalChemicals business (Ag) in June2001, the Company reported theoperating results as discontinuedoperations in accordance with APB
30 “Reporting the Results ofOperations - Reporting the Effects ofDisposal of a Segment of a Businessand Extraordinary, Unusual andInfrequently Occurring Events andTransactions.” AgriculturalChemicals had been a separate majorline of business in the ChemicalSpecialties segment. The operatingresults of Ag have been reported sep-arately as discontinued operations inprior years.
Critical Accounting
Policies
In response to the Securities andExchange Commission’s (SEC)Release No. 33-8040, “CautionaryAdvice Regarding Disclosure AboutCritical Accounting Policies,” theCompany has identified the criticalaccounting policies that are mostimportant to the portrayal of theCompany’s financial condition andresults of operations. The policies setforth below require management’smost subjective or complex judg-ments, often as a result of the need tomake estimates about the effect ofmatters that are inherently uncertain.
• Litigation and EnvironmentalReservesThe Company is involved in liti-gation in the ordinary course ofbusiness, including personalinjury, property damage andenvironmental litigation. TheCompany also expends signifi-cant funds for environmentalremediation of both company-owned and third-party locations.In accordance with GenerallyAccepted Accounting Principles(GAAP), specifically Statement ofFinancial Accounting Standards(SFAS) No.5, “Accounting forContingencies” and Statement ofPosition 96-1, “EnvironmentalRemediation Liabilities”, theCompany records a loss andestablishes a reserve for litigation

financials
14
or remediation when it is proba-ble that an asset has beenimpaired or a liability exists andthe amount of the liability can bereasonably estimated. Reason-able estimates involve judgmentsmade by management after con-sidering a broad range of infor-mation including: notifications,demands, or settlements whichhave been received from a regu-latory authority or private party,estimates performed by inde-pendent engineering companiesand outside counsel, availablefacts, existing and proposed tech-nology, the identification ofother potentially responsible par-ties and their ability to contributeand prior experience. Thesejudgments are reviewed quarterlyas more information is receivedand the amounts reserved areupdated as necessary. However,the reserves may materially differfrom ultimate actual liabilities ifthe loss contingency is difficult toestimate or if management’sjudgments turn out to be inaccu-rate. If management believes nobest estimate exists, the mini-mum loss is accrued in accor-dance with GAAP.
• RestructuringIn June 2001, the Companyrecorded a $330 million restruc-turing and asset impairmentcharge in connection with its2001 repositioning efforts, ofwhich $82 million representedrestructuring charges. The repo-sitioning effort consisted of 112separate initiatives affecting allbusiness groups across theCompany, and will take approxi-mately twelve months to com-plete from date of commence-ment. The $82 million ofrestructuring included $71 mil-lion of severance terminationbenefits for 1,860 employeesaffected by plant closings or
capacity reductions, as well as var-ious personnel in corporate,administrative and shared servicefunctions. Severance termina-tion benefits were based on vari-ous factors including length ofservice, contract provisions andsalary levels. Management esti-mated the restructuring chargebased on these factors as well asprojected final service dates.
Given the complexity of esti-mates and broad reaching scopeof the 2001 repositioning effort,actual expenses could differ frommanagement’s estimates. If actu-al results are different from orig-inal estimates, the Company willrecord additional expense orreverse previously recordedexpense through the “Provisionfor Restructuring and AssetImpairment” line in theStatement of ConsolidatedEarnings. As of December 31,2001, the Company recognized afavorable change to the originalestimate of $4 million, due inpart to changes in estimates forseverance expense and the recog-nition of settlement gains.Management will continue tomake adjustments if necessary asactions under the plan are car-ried out.
• Valuation of Long-Lived AssetsThe Company's long-lived assetsinclude property, plant, equip-ment, long-term investments,goodwill and other intangibleassets. Long-lived assets, otherthan investments, goodwill andindefinite-lived intangible assets,are depreciated over their esti-mated useful lives, and arereviewed for impairment whenev-er changes in circumstances indi-cate the carrying value may not berecoverable. In conjunction withthe Company’s 2001 reposition-ing efforts, $245 million in assetswere deemed impaired and writ-
ten-off based on estimated fairvalue assumptions. Fair values areestimated based upon forecastedcash flows discounted to presentvalue. If actual cash flows or dis-count rate estimates change, theCompany may have to recordadditional impairment chargesnot previously recognized.
The fair value of the long-terminvestments is dependant on theperformance of the Company’sinvestees, as well as volatility inher-ent in their external markets. Inassessing potential impairment forthese investments the Companywill consider these factors as wellas the forecasted financial per-formance of its investees. If theseforecasts are not met, theCompany may have to recordadditional impairment chargesnot previously recognized.
• Pension and Other EmployeeBenefitsCertain assumptions are used inthe calculation of the actuarial val-uation of the Company-sponsoreddefined benefit pension plans andpost-retirement benefits. Theseassumptions include the weightedaverage discount rate, rates ofincrease in compensation levels,expected long-term rates ofreturn on assets and increases ortrends in health care costs. Ifactual results are less favorablethan those projected by manage-ment, lower levels of pensioncredit or other additional expensemay be required. See Notes 10and 11 in the accompanying“Notes to Consolidated FinancialStatements” for additional infor-mation regarding assumptionsused by the Company.
• Inventory ReservesThe Company adjusts the valueof its obsolete and unmarketableinventory to the estimated mar-ket value based upon assump-

15
tions of future demand and mar-ket conditions. If actual marketconditions are less favorable thanthose projected by management,additional inventory write-downsmay be required.
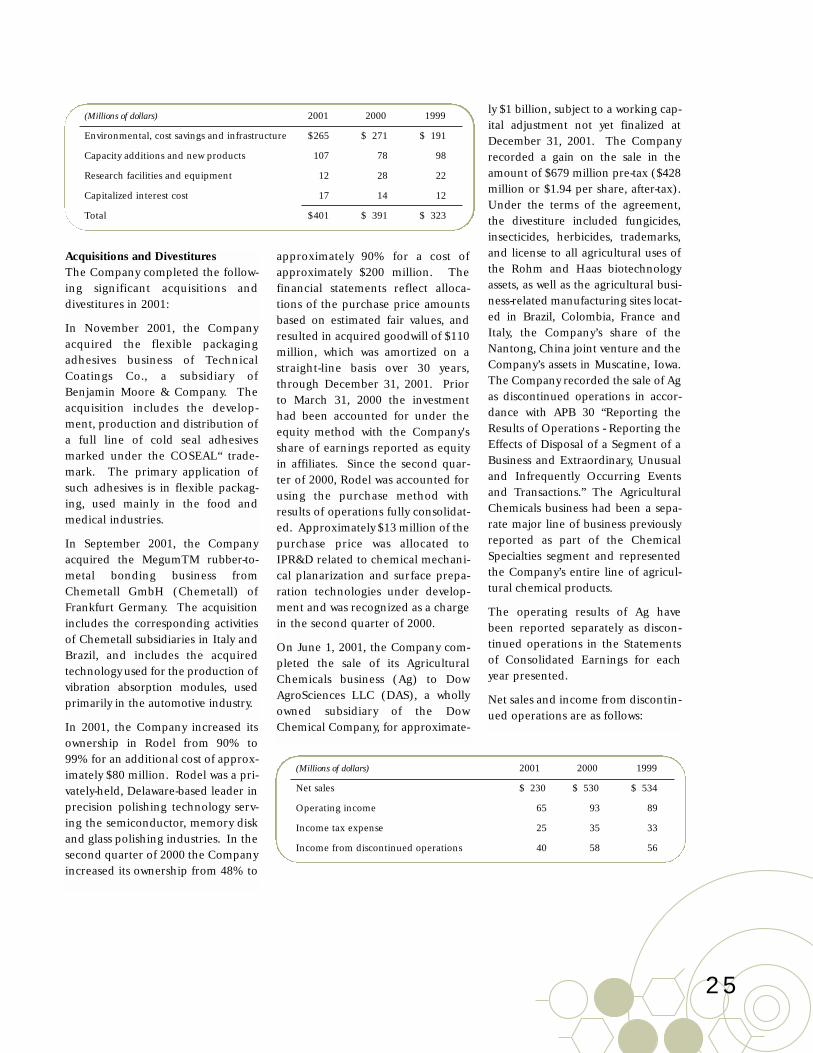
• Gain on Sale of the AgriculturalChemicals BusinessIn June 2001, the Company com-pleted the sale of its AgriculturalChemicals business to DowAgroSciences LLC (DAS), a whol-ly-owned subsidiary of the DowChemical Company for approxi-mately $1 billion, subject to aworking capital adjustment. Theworking capital adjustment hasnot been finalized as of December31, 2001. The Company hasrecorded a receivable from DASfor the amount of the workingcapital adjustment based uponmanagement's best estimate ofthe ultimate adjustment. TheCompany's calculation of theworking capital adjustmentrequired estimates related to thevaluation of certain assets, princi-pally accounts receivable, invento-ry, and rebate liabilities trans-ferred to DAS on June 1, 2001. Ifthe final working capital adjust-ment differs from management'sestimate as of December 31, 2001,the Company will be required torecord an adjustment to the gainon disposal of discontinued lineof business initially recorded inthe second quarter of 2001.
Consolidated Results
of Operations for the
Year Ended December
31, 2001, as Compared
to the Year Ended
December 31, 2000
Net SalesConsolidated net sales in 2001 were$5,666 million, 11% below 2000 net
sales of $6,349 million. The decreasefrom the prior-year was driven by per-sistently weak global demand acrossall businesses. 2001 net sales com-pared to the prior-year declined 22%for Electronic Materials, which hasbeen buffeted by a precipitous indus-try-wide decline since April 2001, 7%for Performance Polymers on lowervolumes and 7% for ChemicalSpecialties due to persistent sluggish-ness in the paper and industrial mar-kets served by the businesses in thisgroup. Salt sales, on a same businessbasis, remained flat as both periodsbenefited from strong demand forhighway ice control products in the2000 winter season. In the fourthquarter of 2000, the Company sold itsEuropean Salt business.
Net EarningsNet earnings as reported for the year2001 were $395 million, a 12%increase from 2000 net earnings of$354 million. Earnings per share on adiluted basis were $1.79 in 2001, com-pared with $1.61 per share in 2000.The Company reported a loss fromcontinuing operations for the year2001 of $70 million or $0.31 per com-mon share, compared to income fromcontinuing operations of $296 millionor $1.34 per common share in 2000.Net income excluding non-recurringitems for the year 2001 was $189 mil-lion, or 42% less than 2000 earningsof $324 million. The year-over-yeardecline can be attributed to theimpact of poor external economicconditions on all business segments,particularly Electronic Materials andPerformance Polymers whichaccounted for $134 million, or 99%,of the total decline from 2000. TheCompany actively managed throughthe economic downturn to mitigatesignificantly reduced demand byannouncing and implementingrestructuring initiatives to bringcapacity more in line with market
demand. Expenditures continued tobe made on research and develop-ment, enterprise resource planning(ERP) initiatives and small acquisi-tions in Adhesives and Sealants.
In June 2001, the Company complet-ed the sale of Ag to Dow AgroSciencesLLC (DAS), a wholly owned sub-sidiary of the Dow ChemicalCompany, for approximately $1 bil-lion, subject to a working capitaladjustment not yet finalized atDecember 31, 2001. The Companyrecorded a gain on the sale in theamount of $679 million pre-tax ($428million or $1.94 per share after-tax).Income from discontinued opera-tions, prior to the June 2001 sale, was$40 million or $0.18 per share after-tax as compared to income from dis-continued operations in 2000 of $58million or $0.27 per common shareafter-tax.
The impact of non-recurring items onearnings from continuing operationsin 2001 was a charge of $259 millionand consisted primarily of $226 mil-lion of restructuring and asset impair-ment charges; $18 million of costsassociated with the repositioningefforts including plant shutdown anddismantlement costs; $10 million ofasset valuation adjustments in theElectronic Materials segment; and $5million of remediation-relatedcharges, net of insurance settlements.The impact of non-recurring chargeson earnings from continuing opera-tions in 2000 was $28 million, andconsisted of $14 million of purchasedin-process research and development(IPR&D) and other one-time chargesrelated to the Rodel acquisition and$14 million of costs associated withrestructuring and integration efforts.Refer to the following table for a rec-onciliation of reported earnings toearnings excluding non-recurringitems for all years presented.

financials
16
Table of Non-Recurring Items
(in millions) 2001 2000 1999
Net Earnings as-reported $ 395 $ 354 $ 249
Non-recurring gains (losses):IPR&D and other one-time charges related to acquisitions - (14) (115)Joint venture dispositions - - (14)Remediation related charges, net of insurance settlements (5) - 17Provision for restructuring and asset impairments (226) (8) (23)Asset write-downs, integration and other restructuring costs (28) (6) (26)
Impact on continuing operations (259) (28) (161)
Income from discontinued line of business 40 58 56Gain on disposal of discontinued line of business 428 - -
Discontinued operations 468 58 56
Extraordinary loss on early extinguishment of debt (1) - -Cumulative effect of accounting change (2) - -
Total non-recurring gains (losses) 206 30 (105)
Earnings excluding non-recurring items $ 189 $ 324 $ 354
Gross Profit Gross profit for 2001 was $1,658 mil-lion, a 17% decline from $2,007 mil-lion in 2000 and the gross profit mar-gin was 29%, down from 32% in2000. The change in gross profitmargin is primarily the result oflower manufacturing efficiency driv-en by reduced demand. TheCompany continues to respond bymaintaining price increases andimproving internal efficiencies.
Selling, Administrative and Research(SAR) ExpensesSAR expenses were $1,091 millionfor 2001, a 6% decrease from $1,157million in 2000, reflecting savingsfrom the Company’s repositioningefforts as well as a decrease inemployee related expenses. Thesecost reductions were offset byincreased research and developmentcosts reflecting the Company’s con-tinued focus on developing cuttingedge technologies and ERP informa-tion system expenditures. SARexpenses were 19% of net sales for2001, compared to 18% in 2000.
Purchased In-Process Research andDevelopment (IPR&D)IPR&D in acquisitions accounted forby the purchase method, represents
the value assigned to research anddevelopment projects of an acquiredcompany where technological feasi-bility had not yet been established atthe date of the acquisition, andwhich, if unsuccessful, have no alter-native future use. Amounts assignedto IPR&D are charged to expense atthe date of acquisition. Accordingly,the Company charged $13 million toexpense in 2000 in connection withthe Rodel acquisition. (See Note 4:“Purchased In-process Research andDevelopment” in the accompanying“Notes to Consolidated FinancialStatements”).
Interest Expense Interest expense for 2001 was $182million, a 24% decline from $241million in 2000, primarily due tolower debt levels and interest rates ascompared to the prior-year period.
Amortization of Goodwill and OtherIntangiblesAmortization of goodwill and otherintangibles for 2001 was $156 mil-lion, a 2% decline from $159 millionin 2000.
Share of Affiliate Net Earnings Share of affiliate net earnings in 2001was $12 million, a 33% decline fromearnings of $18 million in 2000, pri-
marily due to the increased owner-ship in Rodel and the sale of affiliatesrelated to the disposition of Ag (SeeNote 2: “Acquisitions andDispositions of Assets” in the accom-panying “Notes to ConsolidatedFinancial Statements”). Prior toMarch 31, 2000 the investment inRodel was accounted for under theequity method with the Company'sshare of earnings reported as equityin affiliates. Since the second quar-ter of 2000, Rodel’s results of opera-tions have been fully consolidated.
Provision for RestructuringProvision for restructuring of $320million pre-tax or $226 million after-tax for the year ended December 31,2001 is comprised primarily of assetimpairment and restructuringcharges relating to the Company’srepositioning initiatives that com-menced in June 2001. The Companyrecognized a $330 million one-timerestructuring and asset impairmentcharge in the second quarter of 2001,to enable several of its businesses torespond to structural changes in theglobal marketplace. The largest com-ponent related to the partial closureof certain manufacturing andresearch facilities across all businessgroups and included exit costs related

17
to the Liquid Polysulfide Sealantsbusiness in Performance Polymersand part of the dyes business inChemical Specialties. Approximately75% of the assets impaired were in theNorth American region. The one-time charge included severance bene-fits; the employees receiving sever-ance benefits will include those affect-ed by plant closings or capacity reduc-tions, as well as various personnel incorporate, administrative and sharedservice functions. Approximately1,860 positions will be affected by therestructuring efforts. Offsetting theoriginal charge of $330 millionrecorded in June 2001, is a pre-taxgain of $4 million from the recogni-tion of settlement gains and changesin estimates to restructuring liabilitiesestablished for the 2001 initiatives, aswell as a pre-tax gain of $6 millionfrom changes in estimates to restruc-turing liabilities established in 1999. Itis the Company’s policy to recognizesettlement gains at the time anemployee’s pension liability is settled.
In the first half of 2000, a restructur-ing reserve of $13 million pre-tax wasrecorded in the Ion Exchange Resinsbusiness for the write-down of plantassets and severance costs for approx-imately 100 people. These chargeswere net of certain pension settle-ment and curtailment gains.
Other Income Other income for 2001 was $15 mil-lion, a 67% decline from $46 millionin 2000. The decline is primarily dueto lower foreign currency gains com-pared to the prior year. In addition,the Company incurred a $4 millioncasualty loss resulting from a fire at ajoint venture manufacturing facility.
Effective Tax RateThe loss from continuing operationsof $70 million contains $6 million ofincome taxes, which computes to a9% effective tax rate. This reflects theimpact of a 29% tax rate on the $320million loss provision for restructur-
ing and asset impairment, whichincluded non-deductible restructur-ing expenses. Excluding the impactof this provision, the effective tax rateon continuing operations was 39%,the same as 2000. The effective taxrate for 2000, excluding non-taxdeductible IPR&D charges was 38%.
Consolidated Results
of Operations for the
Year Ended December
31, 2000, as Compared
to the Year Ended
December 31, 1999
Net SalesNet sales in 2000 were $6,349 mil-lion, a 3% increase from 1999 proforma net sales of $6,181 million anda 31% increase from 1999 actual netsales of $4,840 million. The increasefrom pro forma 1999 net sales wasdriven largely by an acquisition-driv-en sales increase in the ElectronicMaterials segment and to a lesserextent the acquisition of 95% ofAcima A.G. (Acima) in the ChemicalSpecialties segment. The effect ofthese acquisitions was partially offsetby unfavorable currency impacts.
Net EarningsNet earnings on an as-reported basisfor 2000 were $354 million, a 42%increase from 1999 net earnings of$249 million. Diluted earnings percommon share were $1.61 in 2000compared to $1.27 in 1999. Earningsfrom continuing operations for theyear 2000 were $296 million or $1.34per diluted common share, comparedto $193 million or $0.98 per dilutedcommon share in 1999. Net earningsexcluding non-recurring items for theyear 2000 were $324 million, a 2%decline from pro forma 1999 and an8% decline from actual 1999 net earn-ings excluding non-recurring items.Earnings per share excluding non-recurring items on a diluted basis was$1.47 in 2000, compared with $1.81per share in actual 1999.
The impact of the non-recurringcharges on continuing operations in2000 was $28 million, and consistedof $14 million of IPR&D and otherone-time charges related to theRodel acquisition, and $14 million ofcosts associated with the restructur-ing and integration efforts. Non-recurring items impacting continu-ing operations for 1999 includecharges of $161 million, including acharge of $115 million for IPR&Dand other one-time charges from theMorton acquisition, a charge of $23million for restructuring costs result-ing both from the integration ofMorton and the Company's redesignof its selling and administrative infra-structure, $26 million related to assetwrite-downs, integration and otherrestructuring costs, a gain of $17 mil-lion from remediation related insur-ance recoveries, and a $14 millionloss on disposition of the AtoHaasjoint venture.
The operating results of Ag havebeen reported separately as discon-tinued operations in prior years.Income from discontinued opera-tions in 2000 was $58 million or $0.27per share as compared to incomefrom discontinued operations in1999 of $56 million or $0.29 per com-mon share.
Gross ProfitGross profit for the year 2000 was$2,007 million, an 18% increase from$1,701 million in 1999; however, thegross profit margin was 32% in 2000,down from 35% from 1999. Thechange in gross profit margin wasprimarily the result of increasedhydrocarbon-based raw materialprices in addition to higher energycosts in the form of higher naturalgas prices and increased freight costsdue to higher fuel prices. Theimpact of increased raw materialprices was primarily in thePerformance Polymers business seg-ment. Overall raw material price

financials
18
increases were not offset by overallselling price increases. To a lesserextent, higher depreciation resultingfrom fair values being assigned toacquired assets also contributed tothe change in gross profit margin.
Selling, Administrative and Research(SAR) ExpensesSAR expenses for 2000 decreased to18% of net sales from 19% in 1999.In 1999, the Company began imple-menting a redesign of its selling andadministrative infrastructure andinstituted other cost saving measuresassociated with the integration of theMorton and LeaRonal acquisitions.The stated goal of these efforts was toreduce annual procurement, SARand other expenses by $300 million.By year-end 2000, the run rate goalwas achieved through cost reductionsin support services, procurementand manufacturing.
Purchased In-Process Research andDevelopment (IPR&D)IPR&D in acquisitions accounted forby the purchase method, representsthe value assigned to research anddevelopment projects of an acquiredcompany where technological feasi-bility had not yet been established atthe date of the acquisition, andwhich, if unsuccessful, have no alter-native future use. Amounts assignedto IPR&D were charged to expense at
the date of acquisition. Accordingly,the Company charged $13 millionand $105 million to expense in 2000and 1999, respectively, related to theRodel and Morton acquisitions (SeeNote 4: “Purchased In-processResearch and Development” in theaccompanying “Notes to Consoli-dated Financial Statements”).
Interest ExpenseInterest expense in 2000 was $241million, a 53% increase from $158million in 1999, due to higher debtlevels resulting from acquisitions. Inyear 2000 a full year of interest at thehigher debt levels is reflected versussix months in 1999.
Amortization of Goodwill and OtherIntangiblesAmortization in 2000 was $159 mil-lion, a 92% increase from $83 mil-lion in 1999. The increase was attrib-utable to significant 1999 acquisi-tions and year 2000 reflects amortiza-tion for a full year versus six monthsin 1999 related to these acquisitions.
Share of Affiliate Net EarningsEarnings of $18 million in 2000increased from earnings of $6 millionin 1999. The 2000 earnings resultedfrom a full year of affiliates acquiredin mid-1999 and from earnings of cer-tain affiliated businesses of Rodel.Since the second quarter of 2000,
Rodel’s results of operations havebeen fully consolidated. The 1999earnings resulted largely from Rodel,which was an affiliate during that year.
Other IncomeOther income for 2000 was $46 mil-lion, a $32 million increase from $14million in 1999. The increase islargely from foreign currency gainsresulting from risk managementactivities. The 1999 period includesMorton integration costs offset by again related to a favorable settlementwith insurance carriers over certainenvironmental remediation matters.
Effective Tax RateThe effective tax rate for 2000 and1999 was 39% and 49%, respectively.The effective tax rate for 1999 was49%, largely as a result of the non-deductible write-off of IPR&D.Excluding the non-tax deductibleIPR&D charges, the effective tax ratewas 38% for both years. Rates alsoreflect the effect of certain non-taxdeductible amortization chargesresulting from the Company's acqui-sition activities.
Summary by Business SegmentThe Company's operations areorganized by worldwide business seg-ments. Descriptions of theCompany’s business segments arelocated in Item 1. Business includedin the beginning of this report.

19
Net Sales from Continuing Operations by Business Segment and Region
Performance Chemical ElectronicPolymers Specialties Materials Salt Total
(Millions of dollars)
North America2001 $ 1,915 $ 340 $ 488 $ 749 $ 3,4922000 2,083 399 584 750 3,8161999 1,847 320 352 326 2,845
Europe2001 $ 865 $ 268 $ 167 $ - $ 1,3002000 923 266 213 126 1,5281999 780 211 168 113 1,272
Asia-Pacific2001 $ 235 $ 146 $ 287 $ - $ 6682000 242 145 413 - 8001999 197 122 235 - 554
Latin America2001 $ 155 $ 51 $ - $ - $ 2062000 149 56 - - 2051999 115 54 - - 169
Total2001 $ 3,170 $ 805 $ 942 $ 749 $ 5,6662000 3,397 866 1,210 876 6,3491999 2,939 707 755 439 4,840
Summary of 1999-2001 Results by Business Segment
ProActual Forma(2)
(Millions of dollars) 2001 2000(1) 1999(1) 1999(1)
Net SalesPerformance Polymers $ 3,170 $ 3,397 $ 2,939 $ 3,551Chemical Specialties 805 866 707 833Electronic Materials 942 1,210 755 867Salt 749 876 439 930
Total $ 5,666 $ 6,349 $ 4,840 $ 6,181
Earnings (Loss) from Continuing Operations Before Extraordinary Item and Cumulative Effect of Accounting Change
Performance Polymers $ 85 $ 282 $ 350 $ 388Chemical Specialties 7 55 59 86Electronic Materials 1 110 57 64Salt 13 24 10 35Corporate(3) (176) (175) (283) (241 )
Total $ (70) $ 296 $ 193 $ 332
(1) Reclassified to conform to current year presentation.(2) Pro forma results include Morton and LeaRonal as if these 1999 acquisitions had occurred on January 1, 1999. Pro forma net earnings
exclude non-recurring items.(3) Corporate includes non-operating items such as interest income and expense, corporate governance costs, and corporate exploratory
research. In 2000 and 1999, it included charges for purchased in-process research and development costs associated with the Rodel andMorton acquisitions. (See “Management’s Discussion and Analysis”)

financials
20
Performance Polymers
2001 versus 2000Performance Polymers sales for 2001were $3,170 million, a 7% declinefrom $3,397 million in 2000. Salesand earnings decreases were felt inall businesses primarily due to poorexternal economic conditions and asa result of the continued slow downin the building and constructionindustry which are served largely bythe Coatings, Adhesives and Sealantsand Plastic Additives businesses.Automotive and Powder Coatingssales decreased primarily due to weakdemand in the automotive andindustrial markets, as compared tothe prior-year. Earnings from contin-uing operations for 2001 were $85million, a 70% decline from $282million in 2000. Excluding non-recurring items, earnings were $229million, an 18% decline from 2000earnings of $278 million.
2000 versus 1999Performance Polymers sales for 2000were $3,397 million, a decrease of 4%from $3,551 million pro forma 1999sales and a 16% increase from actualsales of $2,939 million in 1999.Earnings from continuing operationsfor 2000 were $282 million, a 19%decline from $350 million in 1999.Excluding non-recurring items, earn-ings were $278 million in 2000, a 28%decrease from 1999 pro forma earn-ings of $388 million and a 21%decrease from $352 million in 1999.Sales and earnings in the year wereimpacted by an economic slowing inthe U.S. building and constructionmarkets in the second half of 2000.These markets are served largely bythe Coatings, Adhesives and Sealantsand Plastics Additives businesses.Similar slowing in the automotive mar-kets served by Surface Finishes wasalso a factor. Sales were also affectedby weaker European currencies. The21% decrease in earnings, excludingnon-recurring items, was a result of
these demand factors and by sharplyhigher hydrocarbon base raw materialcosts and energy costs, particularly nat-ural gas (see Gross Profit discussionunder “Summary of ConsolidatedResults” below). The Monomer busi-ness continued to report stronggrowth in the year as a result of theacquired Stockhausen merchantmonomer business in Europe. Amongthe Surface Finishes businesses, salesof Powder Coatings on a pro formabasis continued to improve, but wereoffset by weaker sales in AutomotiveCoatings driven by slowing in the U.S.automotive markets.
Chemical Specialties
2001 versus 2000Chemical Specialties reported salesof $805 million, a 7% decline from$866 million in 2000. Inorganic andSpecialty Solutions sales decreased by$33 million, representing 54% of thetotal year-over-year decline, as thebusiness continues to suffer frompersistently low demand for sodiumborohydride related applications inthe newsprint, pharmaceutical andelectronic markets. Consumer andIndustrial Specialties sales declined$18 million from 2000, representing30% of the total decline as a result ofdecreased demand in industrial mar-kets. Ion Exchange Resins salesdeclined due to a weakness in indus-trial water treatment and catalystmarkets. Earnings from continuingoperations for 2001 were $7 million,an 87% decline from $55 million in2000. Earnings for 2001, excludingnon-recurring items were $63 mil-lion, a 10% decline from $70 millionin 2000 as lower demand producedhigher manufacturing variances,which negatively impacted earnings.
2000 versus 1999Chemical Specialties sales for 2000were $866 million, a 4% increasefrom pro forma 1999 sales of $833million and a 22% increase from
actual sales of $707 million in 1999.Sales increases were driven byConsumer and Industrial Specialties,helped by the acquired Acima bio-cides business, with a contributionfrom Ion Exchange Resins. Earningsfrom continuing operations for 2000were $55 million, a 7% decline from$59 million in 1999. Net earnings,excluding non-recurring items, were$70 million in 2000, a 19% declinefrom pro forma 1999 earnings of $86million and a 3% decline from actualearnings of $72 million in 1999.
Electronic Materials
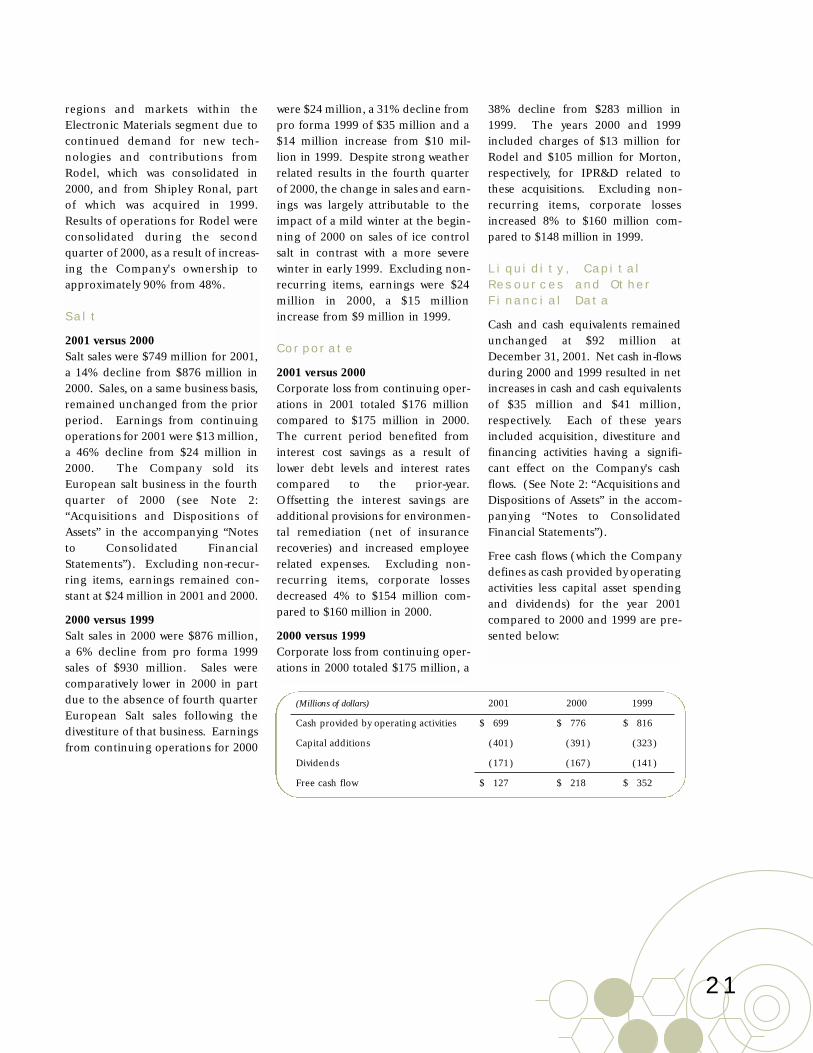
2001 versus 2000Electronic Materials sales were $942million, a 22% decline from $1,210million in 2000. The sales decline wasdriven by a significant decrease indemand across all businesses, with theexception of sophisticated technolo-gies including deep UV photoresists,chemical mechanical planarizationproducts and anti-reflective coatings.Earnings from continuing operationsfor 2001 were $1 million compared to$110 million in 2000, reflecting costsassociated with the Company’s reposi-tioning efforts. Excluding non-recur-ring items, earnings were $27 million,a 76% decline from $112 million in2000, because of significantlydecreased demand impacting manu-facturing efficiencies.
2000 versus 1999Electronic Materials sales for 2000were $1,210 million, a 40% increasefrom pro forma 1999 sales of $867million and a 60% increase fromactual sales of $755 million in 1999.Earnings from continuing operationsfor 2000 were $110 million, a 72%increase from pro forma 1999 of $64million and a 93% increase from $57million in 1999. Excluding non-recurring items, earnings were $112million in 2000, a 62% increase from$69 million in 1999. Increases insales and earnings were evident in all
21
regions and markets within theElectronic Materials segment due tocontinued demand for new tech-nologies and contributions fromRodel, which was consolidated in2000, and from Shipley Ronal, partof which was acquired in 1999.Results of operations for Rodel wereconsolidated during the secondquarter of 2000, as a result of increas-ing the Company's ownership toapproximately 90% from 48%.
Salt
2001 versus 2000Salt sales were $749 million for 2001,a 14% decline from $876 million in2000. Sales, on a same business basis,remained unchanged from the priorperiod. Earnings from continuingoperations for 2001 were $13 million,a 46% decline from $24 million in2000. The Company sold itsEuropean salt business in the fourthquarter of 2000 (see Note 2:“Acquisitions and Dispositions ofAssets” in the accompanying “Notesto Consolidated FinancialStatements”). Excluding non-recur-ring items, earnings remained con-stant at $24 million in 2001 and 2000.
2000 versus 1999Salt sales in 2000 were $876 million,a 6% decline from pro forma 1999sales of $930 million. Sales werecomparatively lower in 2000 in partdue to the absence of fourth quarterEuropean Salt sales following thedivestiture of that business. Earningsfrom continuing operations for 2000
were $24 million, a 31% decline frompro forma 1999 of $35 million and a$14 million increase from $10 mil-lion in 1999. Despite strong weatherrelated results in the fourth quarterof 2000, the change in sales and earn-ings was largely attributable to theimpact of a mild winter at the begin-ning of 2000 on sales of ice controlsalt in contrast with a more severewinter in early 1999. Excluding non-recurring items, earnings were $24million in 2000, a $15 millionincrease from $9 million in 1999.
Corporate
2001 versus 2000Corporate loss from continuing oper-ations in 2001 totaled $176 millioncompared to $175 million in 2000.The current period benefited frominterest cost savings as a result oflower debt levels and interest ratescompared to the prior-year.Offsetting the interest savings areadditional provisions for environmen-tal remediation (net of insurancerecoveries) and increased employeerelated expenses. Excluding non-recurring items, corporate lossesdecreased 4% to $154 million com-pared to $160 million in 2000.
2000 versus 1999Corporate loss from continuing oper-ations in 2000 totaled $175 million, a
38% decline from $283 million in1999. The years 2000 and 1999included charges of $13 million forRodel and $105 million for Morton,respectively, for IPR&D related tothese acquisitions. Excluding non-recurring items, corporate lossesincreased 8% to $160 million com-pared to $148 million in 1999.
Liquidity, Capital
Resources and Other
Financial Data
Cash and cash equivalents remainedunchanged at $92 million atDecember 31, 2001. Net cash in-flowsduring 2000 and 1999 resulted in netincreases in cash and cash equivalentsof $35 million and $41 million,respectively. Each of these yearsincluded acquisition, divestiture andfinancing activities having a signifi-cant effect on the Company's cashflows. (See Note 2: “Acquisitions andDispositions of Assets” in the accom-panying “Notes to ConsolidatedFinancial Statements”).
Free cash flows (which the Companydefines as cash provided by operatingactivities less capital asset spendingand dividends) for the year 2001compared to 2000 and 1999 are pre-sented below:
(Millions of dollars) 2001 2000 1999
Cash provided by operating activities $ 699 $ 776 $ 816
Capital additions (401) (391) (323)
Dividends (171) (167) (141)
Free cash flow $ 127 $ 218 $ 352

financials
22
The Company’s short-term, primarysource of liquidity will be cash flowfrom operations, supplemented asnecessary with commercial paperand or bank borrowings. At year end2001, the Company maintains anunused credit facility with a syndicat-ed group of banks of $900 million;$500 million of which is committeduntil 2004. The commitment of thisfacility is not contingent on theCompany’s credit rating. TheCompany does not believe there is amaterial risk to short-term liquidity.As of December 31, 2001, theCompany had no letters of credit ormaterial guarantees outstanding.
Financing Total borrowings at year-end 2001were $2,898 million, only 7% ofwhich is due prior to 2004. Total bor-rowings were $3,774 million at yearend 2000. At the end of 2001, thedebt ratio was 42% compared with49% at the end of 2000.
In 2000, the Company issued 400 mil-lion Euros (or $376 million) of 6.0%notes due 2007.
On February 27, 2002, the Companyissued 20 billion yen (or $149 mil-lion) of 3.5% notes, interest payablesemiannually on March 29th and
September 29th, beginning in March2002. The maturity date is March 29,2032, callable annually after March2012. Proceeds from the issuance ofthe note will be used for general cor-porate purposes.
The Company contemplates someearly retirement of debt via calls andrepurchases as opportunities arise inorder to gain the long-term benefitsof reduced interest expense. As aresult, some non-recurring losses willbe recorded during 2002.
Contractual Obligations
The following table provides the Company’s contractual obligations and commitments for future payments:
(Millions of dollars) Payments due by period
Less thanContractual obligations Total 1 year 1-3 years 4-5 years Over 5 years
Total borrowings/ capital lease obligations $ 2,898 $ 178 $ 516 $ 375 $ 1,829Operating leases 228 50 90 57 31
Total contractual cash obligations $ 3,126 $ 228 $ 606 $ 432 $ 1,860
Trading ActivitiesThe Company does not have anytrading activity that involves non-exchange traded contracts account-ed for at fair value.
Unconsolidated EntitiesThe Company has no controlling own-ership in significant entities which arenot consolidated. There are no signif-icant contractual requirements tofund losses of unconsolidated entities.Material contingent liabilities, guaran-tees and commitments not included inthe consolidated balance sheet are dis-closed in the accompanying “Notes toConsolidated Financial Statements”under Note 25: “Contingent Liabilities,Guarantees and Commitments.”
Environmental There is a risk of environmentalimpact in chemical manufacturingoperations. The Company's environ-mental policies and practices are
designed to ensure compliance withexisting laws and regulations and tominimize the possibility of significantenvironmental impact.
The laws and regulations underwhich the Company operates requiresignificant expenditures for capitalimprovements, the operation of envi-ronmental protection equipmentand remediation. Future develop-ments and even more stringent envi-ronmental regulations may requirethe Company to make additionalunforeseen environmental expendi-tures. The Company's major com-petitors are confronted by substan-tially similar environmental risks andregulations.
The Company is a party in variousgovernment enforcement and privateactions associated with former wastedisposal sites, many of which are on
the U.S. Environmental ProtectionAgency's (EPA) National Priority Listand has been named a potentiallyresponsible party at approximately140 inactive waste sites where remedi-ation costs have been or may beincurred under the Federal Com-prehensive Environmental Response,Compensation and Liability Act andsimilar state statutes. In some of thesecases the Company may also be heldresponsible for alleged property dam-age. The Company has provided forfuture costs at certain of these sites.The Company is also involved in cor-rective actions at some of its manufac-turing facilities.

23
The Company considers a broad rangeof information when determining theamount of its remediation accruals,including available facts about thewaste site, existing and proposed reme-diation technology and the range ofcosts of applying those technologies,prior experience, government propos-als for this or similar sites, the liabilityof other parties, the ability of otherprincipally responsible parties to paycosts apportioned to them and currentlaws and regulations. These accrualsare assessed quarterly and updated asadditional technical and legal informa-tion becomes available. However, atcertain sites, the Company is unable,due to a variety of factors, to assess andquantify the ultimate extent of itsresponsibility for study and remedia-tion costs. Major sites for whichreserves have been provided are thenon-company-owned Lipari, Wood-land and Kramer sites in New Jersey,Whitmoyer in Pennsylvania and com-pany-owned sites in Bristol andPhiladelphia, Pennsylvania andHouston, Texas. The Morton acquisi-tion introduced two major sites: MossPoint, Mississippi and Wood-Ridge,New Jersey.
In Wood-Ridge, New Jersey, Mortonand Velsicol Chemical Corporation("Velsicol") have been held jointlyand severally liable for the cost ofremediation necessary to correctmercury-related environmentalproblems associated with a mercuryprocessing plant on the site prior toits acquisition by Morton. At the dateof acquisition, Morton had disclosedand accrued for certain ongoingstudies, which are expected to becompleted during 2002, with regula-tory decisions expected by the end of2002. In its allocation of the pur-chase price of Morton, the Companyaccrued for additional study costs atDecember 31, 1999 and additionalremediation costs in 2000 based onthe progress of the technical studies.A separate study of probable contam-
ination in Berry's Creek, which runsnear the plant site, and of the sur-rounding wetlands is on a timetableyet to be determined. Therefore, theestimated costs of this separate studyand any resulting remediationrequirements have not been consid-ered in the allocation of the Mortonpurchase price. There is muchuncertainty as to what will berequired to address Berry’s Creek butcleanup costs could be very high andthe Company’s share of these costscould be material. The Company'sexposure will also depend upon thecontinued ability of Velsicol and itsindemnitor, Fruit of the Loom, Inc.,which has filed for protection underthe bankruptcy laws, to contribute tothe cost of remediation. In 2001,these parties have stopped payingtheir share of expenses. Ultimately,the Company’s exposure will alsodepend on the results of attempts toobtain contributions from othersbelieved to share responsibility. Acost recovery action against theseresponsible parties is pending in fed-eral court. This action has beenstayed pending future regulatorydevelopments and the appeal of asummary judgment ruling in favor ofone of the defendants. Settlementshave been reached with some defen-dants for claims considered de min-imis associated with the Wood-Ridgeplant site.
During 1996, the EPA notifiedMorton of possible irregularities inwater discharge monitoring reportsfiled by its Moss Point, Mississippiplant in early 1995. Morton investi-gated and identified other environ-mental issues at the plant. Though atthe date of acquisition Morton hadaccrued for some remediation andlegal costs, the Company revisedthese accruals as part of the alloca-tion of the purchase price of Mortonbased on its discussions with theauthorities and on the informationavailable as of June 30, 2000. In
2000, the Company reached agree-ment with the EPA, the Departmentof Justice and the State of Mississippi,resolving these historical environ-mental issues. The agreementreceived court approval in early2001. The final settlement includespayment of $20 million in civil penal-ties, which were paid in the first quar-ter of 2001, $2 million in criminalpenalties, which were paid in thefourth quarter of 2000 and $16 mil-lion in various SupplementalEnvironmental Projects. The accru-als established for this matter weresufficient to cover these and otherrelated costs of the settlement. InDecember 2001, the Company closedthe chemicals portion of the MossPoint facility.
The amount charged to earningsbefore-tax for environmental remedi-ation was $28 million and $4 millionfor the years ended December 31,2001 and 1999, respectively, and theamount charged in 2000 was immate-rial. The reserves for remediationwere $156 million and $185 million atDecember 31, 2001 and 2000, respec-tively, and are recorded as “other lia-bilities” (current and long-term). TheCompany is pursuing lawsuits overinsurance coverage for environmentalliabilities. It is the Company's practiceto reflect environmental insurancerecoveries in results of operations forthe quarter in which the litigation isresolved through settlement or otherappropriate legal processes.Resolutions typically resolve coveragefor both past and future environmen-tal spending. The Company settledwith several of its insurance carriersand recorded income before-tax ofapproximately $13 million, $1 millionand $17 million for the years endedDecember 31, 2001, 2000 and 1999,respectively.
In addition to accrued environmentalliabilities, the Company had reason-ably possible loss contingencies relat-

financials
24
ed to environmental matters ofapproximately $73 million and $73million at December 31, 2001 and2000, respectively. Further, theCompany has identified other sites,including its larger manufacturingfacilities, where additional future envi-ronmental remediation may berequired, but these loss contingenciescannot reasonably be estimated at thistime. These matters involve signifi-cant unresolved issues, including thenumber of parties found liable at eachsite and their ability to pay, the out-come of negotiations with regulatoryauthorities, the alternative methods ofremediation and the range of costsassociated with those alternatives.The Company believes that these mat-ters, when ultimately resolved, whichmay be over an extended period oftime, will not have a material adverseeffect on the consolidated financialposition or consolidated cash flows ofthe Company, but could have a mate-rial adverse effect on consolidatedresults of operations or cash flows inany given period.
Capital spending for new environ-mental protection equipment was$26 million in 2001 versus $27 mil-lion in 2000 and $30 million in 1999.Spending for 2002 and 2003 isexpected to be $26 million and $21million, respectively. Capital expen-ditures in this category include proj-ects whose primary purposes are pol-lution control and safety, as well asenvironmental aspects of projects inother categories that are intendedprimarily to improve operations orincrease plant efficiency. TheCompany expects future capitalspending for environmental protec-tion equipment to be consistent withprior-year spending patterns. Capitalspending does not include the cost ofenvironmental remediation of wastedisposal sites.
Cash expenditures for waste disposalsite remediation were $51 million in2001, $33 million in 2000 and $27million in 1999. The expenditures
for remediation are charged againstaccrued remediation reserves. Thecost of operating and maintainingenvironmental facilities was $129 mil-lion, $114 million and $107 millionin 2001, 2000 and 1999 respectively,and was charged against current-yearearnings.
Other LitigationThere has been increased publicityabout asbestos liabilities faced by man-ufacturing companies. As a result ofthe bankruptcy of most major asbestosproducers, plaintiffs’ attorneys areincreasing their focus on peripheraldefendants. The Company believes ithas adequate reserves and insuranceand does not believe its asbestos expo-sure is material.
There are pending lawsuits filedagainst Morton related to employeeexposure to asbestos at a manufactur-ing facility in Weeks Island, Louisianawith additional lawsuits expected. TheCompany expects that most of thesecases will be dismissed because theyare barred under worker’s compensa-tion laws; however, cases involvingasbestos-caused malignancies may notbe barred under Louisiana law.Subsequent to the Morton acquisition,the Company commissioned medicalstudies to estimate possible futureclaims and recorded accruals based onthe results. Morton has also been suedin connection with the former FrictionDivision of the former ThiokolCorporation which merged withMorton in 1982. Settlements to datetotal $350 thousand and many caseshave closed with no payment. Thesecases are fully insured. In addition,like most manufacturing companies,Rohm and Haas has been sued, gener-ally as one of many defendants, bynon-employees who allege exposureto asbestos on the Company premises.
The Company and its subsidiaries arealso parties to litigation arising out ofthe ordinary conduct of its business.Recognizing the amounts reservedfor such items and the uncertainty of
the ultimate outcomes, it is theCompany’s opinion that the resolu-tion of all these pending lawsuits,investigations and claims will nothave a material adverse effect, indi-vidually or in the aggregate, uponthe results of operations, cash flowsor the consolidated financial posi-tion of the Company.
Dividends Total common stock dividends paid in2001 were $.80 per share, compared to$.78 per share in 2000. TheCompany's common stock dividendpayout is targeted at approximately35% of trend-line earnings. Commonstock dividends have been paid eachyear since 1927, and the payout hasincreased annually since 1977.
Additions to Land, Building andEquipment Capital additions were $401 millionin 2001 compared to $391 million in2000. Fixed asset additions during2001 included spending on theCompany’s upgrade and consolida-tion of its ERP infrastructure; spend-ing on a human resource/payrollproject; completion of the Rodelexpansion and the de-bottleneckingof the USA Methyl Methacrylate(MMA) facility in Houston. Capitaladditions during 2000 includedacrylics expansion in Texas; spendingon emulsions plants in the UnitedKingdom and Argentina; facilityexpansion in Electronic Materials,particularly at the Rodel facilities andspending on the Company’s ERPproject.
Capital expenditures in 2002 are notexpected to exceed depreciationexpense. Spending for environmen-tal protection equipment, which isincluded in several of the categoriesin the table shown below, was $26million in 2001, $27 million in 2000and $30 million in 1999.
Expenditures for the past threeyears, categorized by primary pur-pose of project, are presented below:
25
(Millions of dollars) 2001 2000 1999
Environmental, cost savings and infrastructure $265 $ 271 $ 191
Capacity additions and new products 107 78 98
Research facilities and equipment 12 28 22
Capitalized interest cost 17 14 12
Total $401 $ 391 $ 323
Acquisitions and Divestitures The Company completed the follow-ing significant acquisitions anddivestitures in 2001:
In November 2001, the Companyacquired the flexible packagingadhesives business of TechnicalCoatings Co., a subsidiary ofBenjamin Moore & Company. Theacquisition includes the develop-ment, production and distribution ofa full line of cold seal adhesivesmarked under the COSEAL“ trade-mark. The primary application ofsuch adhesives is in flexible packag-ing, used mainly in the food andmedical industries.
In September 2001, the Companyacquired the MegumTM rubber-to-metal bonding business fromChemetall GmbH (Chemetall) ofFrankfurt Germany. The acquisitionincludes the corresponding activitiesof Chemetall subsidiaries in Italy andBrazil, and includes the acquiredtechnology used for the production ofvibration absorption modules, usedprimarily in the automotive industry.
In 2001, the Company increased itsownership in Rodel from 90% to99% for an additional cost of approx-imately $80 million. Rodel was a pri-vately-held, Delaware-based leader inprecision polishing technology serv-ing the semiconductor, memory diskand glass polishing industries. In thesecond quarter of 2000 the Companyincreased its ownership from 48% to
approximately 90% for a cost ofapproximately $200 million. Thefinancial statements reflect alloca-tions of the purchase price amountsbased on estimated fair values, andresulted in acquired goodwill of $110million, which was amortized on astraight-line basis over 30 years,through December 31, 2001. Priorto March 31, 2000 the investmenthad been accounted for under theequity method with the Company'sshare of earnings reported as equityin affiliates. Since the second quar-ter of 2000, Rodel was accounted forusing the purchase method withresults of operations fully consolidat-ed. Approximately $13 million of thepurchase price was allocated toIPR&D related to chemical mechani-cal planarization and surface prepa-ration technologies under develop-ment and was recognized as a chargein the second quarter of 2000.
On June 1, 2001, the Company com-pleted the sale of its AgriculturalChemicals business (Ag) to DowAgroSciences LLC (DAS), a whollyowned subsidiary of the DowChemical Company, for approximate-
ly $1 billion, subject to a working cap-ital adjustment not yet finalized atDecember 31, 2001. The Companyrecorded a gain on the sale in theamount of $679 million pre-tax ($428million or $1.94 per share, after-tax).Under the terms of the agreement,the divestiture included fungicides,insecticides, herbicides, trademarks,and license to all agricultural uses ofthe Rohm and Haas biotechnologyassets, as well as the agricultural busi-ness-related manufacturing sites locat-ed in Brazil, Colombia, France andItaly, the Company’s share of theNantong, China joint venture and theCompany’s assets in Muscatine, Iowa.The Company recorded the sale of Agas discontinued operations in accor-dance with APB 30 “Reporting theResults of Operations - Reporting theEffects of Disposal of a Segment of aBusiness and Extraordinary, Unusualand Infrequently Occurring Eventsand Transactions.” The AgriculturalChemicals business had been a sepa-rate major line of business previouslyreported as part of the ChemicalSpecialties segment and representedthe Company’s entire line of agricul-tural chemical products.
The operating results of Ag havebeen reported separately as discon-tinued operations in the Statementsof Consolidated Earnings for eachyear presented.
Net sales and income from discontin-ued operations are as follows:
(Millions of dollars) 2001 2000 1999
Net sales $ 230 $ 530 $ 534
Operating income 65 93 89
Income tax expense 25 35 33
Income from discontinued operations 40 58 56

financials
26
The Company completed the follow-ing acquisition and joint venture activ-ities in 2000:
In the first quarter of 2000, theCompany entered into a joint ven-ture with Stockhausen GmbH & Co.KG (Stockhausen) of Germany toform a global partnership (StoHaas)for the manufacture of reliable, lowcost supply of acrylic acid in NorthAmerica and Europe. Under theterms of the joint venture both part-ners purchase acrylic acid fromStoHaas for use as raw materials.Since StoHaas is not controlled bythe Company its operations are notconsolidated; instead, the Company'sinvestment in StoHaas is accountedand reported as an investment underthe equity method. The earningsimpact in 2001, the first year of oper-ations, was minimal. The Companyexpects minimal earnings impactfrom operations of the joint venturein future years as well. In conjunc-tion with the joint venture, theCompany acquired Stockhausen'smerchant monomer business inEurope.
Acquired 95% of Acima A.G. (Acima),a Swiss company specializing in bioci-dal formulations, polyurethane cata-lysts and other specialty chemicals andalso acquired an 80% interest inSilicon Valley Chemical Laboratories,Inc. (SVC), a privately-held supplier ofhigh technology products for thesemiconductor industry. These trans-actions were accounted for using thepurchase method.
In the second quarter of 2000, theCompany acquired the photoresistbusiness of Mitsubishi ChemicalCorporation. Mitsubishi Chemical is aleading producer of G-line, I-line anddeep UV photoresist chemistry used tomake semiconductor chips. Thetransaction was accounted for usingthe purchase method.
In conjunction with the acquisitions ofAcima, SVC and Mitsubishi photore-sist, the Company recorded goodwillof $36 million which was amortizedover a range of 20 to 40 years, throughDecember 31, 2001.
The Company completed the follow-ing divestitures in 2000:
In the first quarter of 2000, theCompany sold its Industrial Coatingsbusiness to BASF Corporation forapproximately $169 million, net ofworking capital adjustments.
In the third quarter of 2000, theCompany sold its Thermoplastic Poly-urethane business to Huntsman Cor-poration for approximately $117 mil-lion, net of working capital adjustments.
In the fourth quarter of 2000, theCompany sold its European Salt busi-ness, Salins-Europe, to a consortium,which includes management, led byUnion d'Etudes et d'InvestissementsSA, a wholly-owned subsidiary ofCredit Agricole, for approximately$270 million.
These three businesses were acquiredby the Company in June 1999 as partof the acquisition of Morton and wererecorded at fair value. Accordingly, nogain or loss was recorded on thesetransactions.
In the fourth quarter of 2000, theCompany sold its 50% interest inTosoHaas to its joint venture partner,Tosoh Corporation.
Pro forma information is not present-ed, as the 2001 and 2000 acquisitionsand divestitures were not material tothe Company's results of continuingoperations or consolidated financialposition. The results of operations ofacquired businesses are included inthe Company's consolidated financialstatements from the respective datesof acquisition.
Change in Functional Currencies On December 31, 2000, the Companysubstantially completed the legalrestructuring and business integrationof its foreign operations, primarily inEurope, following the Morton andLeaRonal acquisitions in 1999. Basedon these significant operationalchanges at January 1, 2001, theCompany determined that the func-tional currency of a majority of theCompany’s foreign entities is theirrespective local currency. This changeresulted in a one-time write-down offixed assets and inventories of approx-imately $50 million in the first quarterof 2001 with a corresponding chargeto other comprehensive income.
Working Capital Accounts receivable from customersdecreased $314 million and inventorydecreased $255 million. Days sales was67 days, down from 72 in 2000. Dayscost of sales in ending inventorydecreased to 65 days from 74 days.
Details about two major componentsof working capital at the end of 2001and 2000 are summarized below:
(Millions of dollars) 2001(1) 2000(2)
InventoriesYear-end balance $ 712 $ 967Annual turnover 5.6x 4.8x
Customer receivablesYear-end balance $ 1,045 $ 1,359Annual turnover 5.4x 5.1x
(1) 2001 reflects the divestiture of the Agricultural Chemicals business and reflect the cur-rent rate.
(2) 2000 includes the discontinued operations and statement of position of theAgricultural Chemicals business and reflect historical rate.

27
Annual turnover figures are calculatedby dividing annual sales (for customerreceivables and land, buildings andequipment, net) or cost of goods sold(for inventories) by the year-end bal-ance. Days sales outstanding was cal-culated by dividing ending customerreceivables by daily sales, and days costof sales in ending inventory was calcu-lated by dividing ending inventory bydaily cost of sales.
Asset Turnover equals sales divided byyear-end total assets. Asset turnoverwas .6 in 2001, .6 in 2000 and .6 in1999. The 1999 amount was calculat-ed using pro forma sales.
Return on Capital Employed (ROCE)equals net earnings plus after-taxamortization and after-tax interestexpense, divided by average totalassets less cash and average non-inter-est bearing liabilities. ROCE was 9.6%in 2001, 9.2% in 2000 and 11.3% in1999, excluding IPR&D charges in2000 and 1999. The year 2001excludes extraordinary loss on earlyextinguishment of debt and the cumu-lative effect of accounting change.
Return on Common Stockholders'Equity (ROE) is obtained by dividingnet earnings less preferred stock divi-dends by average year-end commonstockholders' equity. Average year-endcommon stockholders' equity is calcu-lated without the reduction for theESOP transaction. ROE was 10.3% in2001, 10.0% in 2000 and 13.4% in1999, excluding the IPR&D charge.
in July 2001 the Company adoptedDIG Issue G20, “Assessing andMeasuring the Effectiveness of aPurchased Option Used in a CashFlow Hedge.”
This standard requires that all deriv-ative instruments be reported onthe balance sheet at fair value. Forinstruments designated as fair valuehedges, changes in the fair value ofthe instrument will largely be offseton the income statement bychanges in the fair value of thehedged item. For instruments des-ignated as cash flow hedges, theeffective portion of the hedge isreported in other comprehensiveincome until it is assigned to earn-ings in the same period in whichthe hedged item has an impact onearnings. For instruments designat-ed as a hedge of net investment inforeign operating units not usingthe U.S. Dollar as its functional cur-rency, changes in the fair value ofthe instrument will be offset inother comprehensive income to theextent that they are effective as eco-nomic hedges. Changes in the fairvalue of derivative instruments,including embedded derivatives,that are not designated as a hedgewill be recorded each period in cur-rent earnings along with any inef-fective portion of hedges.
Using market valuations for deriva-tives held as of December 31, 2000,the Company recorded a $6 millionafter-tax cumulative income effectto accumulated other comprehen-sive income, and a charge to netincome of $2 million, to recognizeat fair value all derivative instru-ments on January 1, 2001. Changesin the Company's derivative instru-ment portfolio or changes in themarket values of this portfolio couldhave a material effect on accumu-lated other comprehensive income.
The Company has concluded that
Information Systems The Company began an investment in2000 to upgrade and consolidate itsinformation systems infrastructure.The effort is underway and on sched-ule with the Plastics Additives businessin production. As it is implemented,this infrastructure is expected toenable more efficient e-commerceconnections among the Company, itssuppliers and customers. TheCompany has also engaged an imple-mentation consultant to help installthe components of the new system asquickly and efficiently as possible andhas created an internal e-Trans-formation group to coordinate theseefforts so that the new electronic busi-ness tools and support systems can bein place as rapidly as possible. Initialareas of concentration include,finance, human resources, customerrelationship management, materialsmanagement, production scheduling,procurement, maintenance, sales anddistribution.
New Accounting
Pronouncements
• Accounting for DerivativeInstruments and Other HedgingActivitiesOn January 1, 2001, the Companyadopted SFAS No.133, "Accountingfor Derivative Instruments andHedging Activities," which establish-es a new model for the accountingand reporting of derivative andhedging transactions. Additionally,
(Millions of dollars) 2001(1) 2000(2)
Year-end balance $ 2,916 $ 3,294Annual turnover 1.9x 2.1x
(1) 2001 reflects the divestiture of the Agricultural Chemicals business and reflect the cur-rent rate.
(2) 2000 includes the discontinued operations and statement of position of theAgricultural Chemicals business and reflect historical rate.
Land, Building and Equipment, NetInvestments in land, buildings and equipment, net is summarized below:

financials
28
the adoption of SFAS No. 133 willnot materially change manage-ment’s risk policies and practicesnor will compliance with the stan-dard materially impact the reportedresults from operations.
• Business CombinationsSFAS No. 141, “Business Com-binations,” which is effective for allbusiness combinations completedafter June 30, 2001, mandates thatall business combinations beaccounted for by only the purchasemethod (thereby eliminating theoption for pooling of interests); seg-regation of other intangible assetsfrom goodwill if they meet the con-tractual legal criterion or the sepa-rability criterion; and expanded dis-closure requirements on the pri-mary reasons for a business combi-nation and the allocation of thepurchase price to the assets and lia-bilities assumed by major balancesheet caption.
• Goodwill and Other IntangibleAssetsSFAS No. 142, “Goodwill and OtherIntangible Assets,” is effective for fis-cal years beginning after December15, 2001. SFAS No. 142, which theCompany adopted on January 1,2002, requires the Company tocease amortization of goodwill andcertain indefinite-lived intangibleassets and evaluate goodwill andintangible assets for impairment. Inaccordance with the Statement, theCompany reviewed its intangibleassets in order to identify intangibleassets with indefinite lives which willno longer be amortized and intan-gible assets which may be reclassi-fied as goodwill and thus no longerbe amortized. In addition theCompany is in the process of assess-ing the remaining useful lives ofintangible assets which will contin-ue to be subject to amortization. Asof January 1, 2002, the Company
ceased amortization of goodwilland intangibles deemed to haveindefinite lives and reclassified cer-tain intangibles in accordance withthe provisions of this statement.
The evaluation of the Company’sgoodwill is performed at the report-ing unit level and is a two-stepprocess. When evaluating goodwillfor impairment, the Statementrequires the Company to first com-pare a reporting unit’s book valueto its fair value. To the extent thatthe book value exceeds fair value,the Company is required to per-form a second step wherein areporting unit’s assets and liabilitiesare fair valued. To the extent that areporting unit’s book value of good-will exceeds its implied fair value ofgoodwill, impairment exists andmust be recognized. The impliedfair value of goodwill is calculated asthe fair value of a reporting unit inexcess of the fair value of all non-goodwill assets in the reportingunit. Net book values of the record-ed assets and liabilities have beencalculated for each of theCompany’s reporting units. TheCompany is in the process of valu-ing these reporting units based pri-marily upon the present value ofexpected future cash flows.
In accordance with SFAS No. 142,the intangible assets which contin-ue to be subject to amortization arebeing reviewed for impairment bythe Company under SFAS No. 144“Accounting for the impairment orDisposal of Long-Lived Assets”.Intangible assets which are nolonger subject to amortization arebeing reviewed by the Company inaccordance with SFAS No. 142 in aone-step process. Impairment ismeasured as the amount an intan-gible asset’s carrying value exceedsits fair value. The Company intendsto complete its evaluation of intan-gible assets in accordance with SFAS
No. 142 no later than June 30, 2002.
The Company’s previous businesscombinations were accounted forusing the purchase method ofaccounting. As of December 31,2001, the net carrying amount ofgoodwill was $2,159 million.Goodwill amortization expense forthe year ended December 31, 2001was $64 million. The Companyintends to complete its evaluationof goodwill in accordance withSFAS No. 142 no later than June 30,2002 and expects to recognize animpairment loss. The Companycontinues to finalize its estimate ofthe impairment loss. Any impair-ment loss will be recognized as acumulative effect of a change inaccounting principle in theCompany’s consolidated statementof operations.
• Asset Retirement ObligationsIn June 2001, the FinancialAccounting Standards Board(FASB) issued SFAS No. 143,“Accounting for Asset RetirementObligations”, which requires recog-nition of the fair value of liabilitiesassociated with the retirement oflong-lived assets when a legal obliga-tion to incur such costs arises as aresult of the acquisition, construc-tion, development and/or the nor-mal operation of a long-lived asset.SFAS No. 143 requires that the fairvalue of a liability for an asset retire-ment obligation be recognized inthe period in which it is incurred if areasonable estimate of fair value canbe made. The associated asset retire-ment costs are capitalized as part ofthe carrying amount of the long-lived asset and subsequently allocat-ed to expense over the asset’s usefullife. SFAS No.143 is effective for fis-cal years beginning after December15, 2002. Management is currentlyassessing the impact of the new stan-dard on its financial statements.

29
• Impairment or Disposal of Long-lived AssetsOn January 1, 2002 the Companyadopted SFAS No. 144. TheStatement provides new guidanceon the recognition of impairmentlosses on long-lived assets to be heldand used or to be disposed of andalso broadens the definition of whatconstitutes a discontinued opera-tion and how the results of a dis-continued operation are to bemeasured and presented. Manage-ment has assessed the impact of thenew standard and determinedthere to be no material impact tothe financial statements.
Cautionary Statements
Any statements made by the Companyin its filings with the Securities andExchange Commission or other com-munications (including press releasesand analyst meetings and calls) thatare not statements of historical fact areforward-looking statements. Thesestatements include, without limitation,those relating to anticipated productplans, litigation and environmentalmatters, currency effects, profitability,and other commitments or goals.Forward-looking statements are sub-ject to a number of risks and uncer-tainties that could cause actual resultsto differ materially from the state-ments made. These risks and uncer-tainties include, but are not limited to,the following:
• Currencies and EconomicConditions Approximately half of theCompany's revenues are from out-side the United States, a significantportion of which are denominatedin foreign currencies. Also, signifi-cant production facilities are locat-ed outside the United States. TheCompany's financial results there-fore can be affected by changes inforeign currency rates. Though the
Company uses certain financialinstruments to mitigate theseeffects, it does not hedge its foreigncurrency exposure in a manner thatwould entirely eliminate the effectsof changes in foreign exchangerates on the Company's earnings,cash flows and fair values of assetsand liabilities. Accordingly, report-ed revenue, net income, cash flowsand fair values have been and in thefuture may be affected by changesin foreign exchange rates. In addi-tion, because of the extensivenature of the Company's foreignbusiness activities, financial resultscould be adversely affected bychanges in worldwide economicconditions, changes in trade poli-cies or tariffs, changes in interestrates, and political unrest.
• Competition and DemandThe Company's products are sold ina competitive, global economy.Competitors include many largemultinational chemical firms basedin Europe, Asia and the UnitedStates. In addition, financial resultsare subject to fluctuations indemand and the seasonal activity ofcertain of the Company's business-es. The Company also manufac-tures and sells its products to cus-tomers in industries and countriesthat are experiencing periods ofrapid change, most notably coun-tries in Eastern Europe and in theAsia-Pacific region. Also, weatherconditions have historically had,and will likely continue to have inthe future, a significant impact onrevenues and earnings in theCompany's Salt segment. Thesefactors can adversely affect demandfor the Company's products andtherefore may have a significantimpact on financial results.
• Supply and Capacity From time to time certain rawmaterials the Company requires
become limited. It is likely this willoccur again in the future. Shouldsuch limitations arise, disruptionsof the Company's supply chainmay lead to higher prices and/orshortages. Also, from time totime, the Company is subject toincreases in raw material pricesand, from time to time, experi-ences significant capacity limita-tions in its own manufacturingoperations. These limitations, dis-ruptions in supply, price increasesand capacity constraints couldadversely affect financial results.
• Technology The Company has invested signifi-cant resources in intellectual prop-erties such as patents, trademarks,copyrights, and trade secrets. TheCompany relies on the protectionthese intellectual property rightsprovide since it depends on theseintellectual resources for its finan-cial stability and its future growth.The development and successfulimplementation of new, competingtechnologies in the market placecould significantly impact futurefinancial results.
• Joint Ventures, Acquisitions andAlliances The Company has entered, and inthe future may enter, into arrange-ments with other companies toexpand product offerings and toenhance its own capabilities. It willlikely also continue to make strate-gic acquisitions and divestitures.The success of acquisitions of newtechnologies, companies and prod-ucts, or arrangements with thirdparties, is not predictable and therecan be no assurance that theCompany will be successful in real-izing its objectives, or that realiza-tion may not take longer than antic-ipated, or that there will not beunintended adverse consequencesfrom these actions.

financials
30
• Environmental Risks and uncertainties related toenvironmental matters are dis-cussed on pages 22 through 24 ofthis Form 10-K.
Item 7a. Market
Risk Discussion
The Company is exposed to marketrisk from changes in foreign currencyexchange rates, interest rates andcommodity prices since it denomi-nates its business transactions in a vari-ety of foreign currencies, finances itsoperations through long- and short-term borrowings, and purchases rawmaterials at market prices. As a result,future earnings, cash flows and fair val-ues of assets and liabilities are subjectto uncertainty. The Company's oper-ating and financing plans includeactions to reduce this uncertaintyincluding, but not limited to, the useof derivative instruments.
The Company has established poli-cies governing its use of derivativeinstruments. The Company does notuse derivative instruments for trad-ing or speculative purposes, nor is ita party to any leveraged derivativeinstruments or any instruments ofwhich the values are not availablefrom independent third parties. TheCompany manages counter-party riskby entering derivative contracts withmajor financial institutions of invest-ment grade credit rating and by lim-iting amount of exposure to eachfinancial institution. The terms ofcertain derivative instruments con-tain a credit clause where each partyhas a right to settle at market if theother party is downgraded belowinvestment grade. As of December31, 2001, the fair market value of allsuch contracts was $24 million, all ofwhich were held by investment gradefinancial institutions.
The Company enters into derivativecontracts based on economic analysis
of underlying exposures, anticipatingthat adverse impacts on future earn-ings, cash flows and fair values due tofluctuations in foreign currencyexchange rates, interest rates andcommodity prices will be offset by theproceeds from and changes in fairvalue of the derivative instruments.The Company does not hedge itsexposure to market risk in a mannerthat completely eliminates the effectsof changing market conditions onearnings, cash flows and fair values.
In evaluating the effects of changes inforeign currency exchange rates,interest rates and commodity priceson the Company's business opera-tions, the risk management systemuses sensitivity analysis. The analysisassumes simultaneous shifts in thoserates and quantifies the impact of suchshifts on the Company's earnings, cashflows, and fair values of assets and lia-bilities during a one-year period. Therange of changes used for the purposeof this analysis reflects the Company'sview of changes that are reasonablypossible over a one-year period. Fairvalues are the present value of project-ed future cash flows based on marketrates and prices chosen.
Foreign Exchange Rate Risk Short-term exposures to changing for-eign exchange rates are primarily dueto operating cash flows denominatedin foreign currencies and transactionsdenominated in non-functional cur-rencies. The Company covers knownand anticipated external transactionsand operating exposures by using for-eign exchange option, forward andswap contracts. The Company's mostsignificant foreign currency exposuresrelate to Western European countries(primarily Germany, France, Italy,Netherlands, the United Kingdom,Sweden, and Switzerland), as well asBrazil, Mexico, Canada, Japan,Taiwan, China and Australia. TheCompany conducted a sensitivityanalysis on the fair value of its foreign
currency hedge portfolio assuming aninstantaneous 10% change in foreigncurrency exchange rates from theirlevels as of December 31, 2001, with allother variables held constant. A 10%appreciation and depreciation of theU.S. dollar against foreign currencieswould reduce and increase by $79 mil-lion, the fair value of foreign currencyhedging contracts held at December31, 2001. The sensitivity in fair valueof the foreign currency hedge portfo-lio represents changes in fair valuesestimated based on market conditionsas of December 31, 2001, withoutreflecting the effects of underlyinganticipated transactions. When thoseanticipated transactions are realized,actual effects of changing foreign cur-rency exchange rates could have amaterial impact on earnings and cashflows in future periods.
Long-term exposures to foreign cur-rency exchange rate risk are managedprimarily through operational activi-ties. The Company manufactures itsproducts in a number of locationsaround the world; hence, has a costbase in a variety of European, Asianand Latin American currencies.Additionally, the Company finances inlocal currencies its operations outsidethe United States. Such diverse baseof local currency costs and financingsserves to partially counterbalance theimpact of changing foreign currencyexchange rates on earnings, cash flowsand fair values of assets and liabilities.
Interest Rate Risk The Company is exposed to changesin interest rates primarily due to itsfinancing, investing and cash manage-ment activities, which include long-and short-term debt to maintain liq-uidity and fund its business opera-tions. The Company's current strate-gic policy is to maintain from 20% to40% of floating rate debt. A 65 basispoint increase in interest rates wouldreduce by $107 million, the fair valueof liabilities under its floating and

31
fixed rate instruments, includingshort- and long-term debt and deriva-tive contracts outstanding as ofDecember 31, 2001. A 65 basis pointdecrease in interest rates will increasethe fair value by $119 million.However, such changes in fair valueswould not have a material impact onearnings per share or cash flows as themajority of the Company’s debt port-folio consisted of fixed rate instru-ments. A 65 basis point movement isequivalent to approximately 10% ofthe Company's weighted average rateon its worldwide debt.
Commodity Price RiskThe Company purchases certain rawmaterials such as natural gas, propy-lene, acetone, butanol and styreneunder short- and long-term supplycontracts. The purchase prices aregenerally determined based on pre-vailing market conditions. Changingraw material prices have historicallyhad material impacts on theCompany's earnings and cash flows,and will likely continue to have sig-nificant impacts on earnings andcash flows in future periods. TheCompany uses commodity derivativeinstruments to modify some of thecommodity price risks. Assuming a25% change in the underlying com-modity price, the potential change in
the fair value of commodity deriva-tive contracts held at December 31,2001 approximates $9 million, whichwould not be material when com-pared with the Company's earningsand financial position.
Forward-Looking Statements This market risk discussion and theestimated amounts presented are for-ward-looking statements that assumecertain market conditions known at
December 31, 2001. Actual results inthe future may differ materially fromthese projected results due tochanges in business climate, eco-nomic and competitive uncertainties,future acquisitions activities and anyunforeseen developments in relevantfinancial markets, including Asia andLatin America. The methods usedabove to assess risk should not beconsidered projections of expectedfuture events or results.
Item 8. Financial Statements and
Supplementary Data
Page
Report of Independent Accountants 36
Consolidated Financial Statements:
Statements of Consolidated Earnings for the years ended December 31, 2001, 2000 and 1999 37
Statements of Consolidated Cash Flows for the years ended December 31, 2001, 2000 and 1999 38
Consolidated Balance Sheets as of December 31, 2001 and 2000 39
Statements of Consolidated Stockholders’ Equity for the years ended December 31, 2001, 2000 and 1999 40
Notes to Consolidated Financial Statements 41

financials
32
Quarterly Results of Operations (Unaudited)
2001 Quarterly Results
1st 2nd 3rd 4th Year(Millions of dollars) Quarter Quarter Quarter Quarter 2001
Net sales $ 1,572 $1,408 $ 1,346 $ 1,340 $ 5,666Gross profit 452 401 414 391 1,658Earnings (losses) from continuing
operations before extraordinary item and cumulative effect of accounting change 48 (208 ) 53 37 (70)
Net earnings 63 242 53 37 395Basic and diluted earnings per common share,
in dollars:Continuing operations $ .22 $ (.94 ) $ .24 $ .17 $ (.31)Net earnings .29 1.09 .24 .17 1.79
Cash dividends per common share, in dollars $ .20 $ .20 $ .20 $ .20 $ .80
2000 Quarterly Results
1st 2nd 3rd 4th Year(Millions of dollars) Quarter Quarter Quarter Quarter 2000
Net sales $ 1,622 $1,628 $ 1,583 $ 1,516 $ 6,349Gross profit 535 508 508 456 2,007Earnings from continuing operations before
extraordinary item and cumulative effect of accounting change 101 58 77 60 296
Net earnings 123 77 84 70 354Basic and diluted earnings per common share,
in dollars:Continuing operations $ .46 $ .26 $ .35 $ .27 $ 1.34Net earnings .56 .35 .38 .32 1.61
Cash dividends per common share, in dollars $ .19 $ .19 $ .20 $ .20 $ .78
Item 9.
Disagreements on
Accounting and
Financial Disclosure
No reports on Form 8-K were filedduring 2001 or 2000 relating to anydisagreements with accountants onaccounting and financial disclosure.
PART III
Item 10. Directors
and Executive
Officers of the
Registrant
William J. Avery, Chairman andDirector, Crown, Cork & SealCompany, Inc.; Previously ChiefExecutive Officer, Crown, Cork &Seal Company, Inc. Mr. Avery, 61,has been a director since 1997.(Committees: 3, 4 (chair), 6)
James R. Cantalupo, President andVice Chairman, Emeritus, McDonaldsCorporation, Mr. Cantalupo, 58, hasbeen a director since 1999.(Committees: 1 (chair), 5, 6)
J. Michael Fitzpatrick, President andChief Operating Officer, Rohm andHaas Company, Dr. Fitzpatrick, 55,has been a director since 1999.(Committees: 2, 3, 5)
Earl G. Graves, Sr., Chairman andChief Executive Officer, Earl G.Graves, Ltd.; Retired Chairman andChief Executive Officer, Pepsi-Colaof Washington D.C., L.P. ; Publisherand Editor, Black EnterpriseMagazine; Managing Director, Blackenterprise/Greenwich StreetCorporate Growth Partners, L.P., Mr.Graves, 67, has been a director since1984. (Committees: 2, 5 (chair), 6)
Raj L. Gupta, Chairman and ChiefExecutive Officer, Rohm and HaasCompany, Mr. Gupta, 56, has been adirector since 1999. (Committees: 3(chair))
David W. Haas, Board Chairman andDirector, William Penn Foundation,Mr. Haas, 46, has been a directorsince 1999. (Committees: 2, 6)
Thomas W. Haas, Director andCorporate Officer, William PennFoundation; Pilot and Flight Instruc-tor, Mr. Haas, 46, has been a directorsince 1999. (Committees: 4, 6)
James A. Henderson, RetiredChairman and Chief ExecutiveOfficer and Director, CumminsEngine Company, Inc. Mr.Henderson, 67, has been a directorsince 1989. (Committees: 4, 6)

33
Richard L. Keyser, Chairman of theBoard and Chief Executive Officer,W.W. Grainger, Inc., Mr. Keyser, 59,has been a director since 1999.(Committees: 4, 6)
John H. McArthur, Senior Advisor tothe President, World Bank Group,Mr. McArthur, 67, has been a direc-tor since 1977. (Committees: 2, 6)
Jorge P. Montoya, President, GlobalFood & Beverage, The Procter andGamble Company; President,Procter and Gamble Latin America,Mr. Montoya, 55, has been a directorsince 1996. (Committees: 4, 6)
Sandra O. Moose, Senior VicePresident and Director, The BostonConsulting Group, Inc., Dr. Moose,60, has been a director since 1981.(Committees: 1, 3, 5, 6 (chair))
Gilbert S. Omenn, Executive VicePresident for Medical Affairs, TheUniversity of Michigan; CEO, TheUniversity of Michigan HealthSystem, Professor of InternalMedicine, Human Genetics, PublicHealth, The Cancer Center, TheUniversity of Michigan, Dr. Omenn,60, has been a director since 1987.(Committees: 2 (chair), 6)
Ronaldo H. Schmitz, Advisor toDeutsche Bank AG; Retired Member ofthe Executive Board, Deutsche BankAG, Dr. Schmitz, 63, has been a di-rector since 1992. (Committees: 1, 5, 6)
Marna C. Whittington, President,Nicholas-Applegate CapitalManagement; Chief Operating Officer,Allianz Dresdner Asset Management;Retired Chief Operating Officer,Morgan Stanley InstitutionalInvestment Management, Dr.Whittington, 54, has been a directorsince 1989. (Committees: 1, 3, 5, 6)
Committees:1. Audit2. Corporate Responsibility,
Environment, Safety and Health3. Executive
4. Executive Compensation5. Finance6. Nominating
Item 11.ExecutiveCompensation
The information called for by Items10 and 11 of this Form 10-K report forthe fiscal year ended December 31,2001, has been omitted, except forthe information presented below,since the Company will file with theSecurities and Exchange Commissiona definitive Proxy Statement pursuantto regulation 14(a) under theSecurities Exchange Act of 1934.
Executive Officers
The Company's executive officersalong with their present position,offices held and activities during thepast five years are presented below.All officers normally are electedannually and serve at the pleasure ofthe Board of Directors. TheCompany's non-employee directorsand their business experience duringthe past five years are listed in theCompany's Proxy Statement.
Alan E. Barton, 46, vice presidentsince 1999; director of the Coatingsbusiness group since 2001; businessunit director of Coatings from 1997 to2001; Polymers and Resins businessmanager and business director ofindustrial Coatings from 1996 to 1997.
Bradley J. Bell, 49, senior vice presi-dent and chief financial officer since1999; vice president, chief financialofficer and treasurer from 1997 to1998; previously vice president andtreasurer of Whirlpool Corporationfrom 1987 to 1997.
Pierre R. Brondeau, 44, vice presidentand director of the ElectronicMaterials business group since 1999;president and chief executive officerof Shipley Company, LLC since 1999;president and chief operating officer
of Shipley Company, LLC since 1998;vice president and chief operating offi-cer of Shipley Company, LLC from1997 to 1998; director of research,sales and marketing of ShipleyCompany, LLC from 1995 to 1997.
J. Michael Fitzpatrick, 55, president,chief operating officer and directorsince 1999; vice president since 1993;chief technology officer from 1996 to1998.
Joseph J. Forish, 49, vice presidentand director of human resourcessince 1999; previously vice presidentof human resources for a unit ofBristol-Myers Squibb Corporationfrom 1989 to 1999.
Raj L. Gupta, 56, chairman, chiefexecutive officer and director since1999; vice chairman since 1999; vicepresident and regional director ofAsia-Pacific from 1993 to 1998.
Robert A. Lonergan, 56, vice presi-dent and general counsel since 1999;previously senior vice president, gen-eral counsel and secretary ofPegasusGold, Inc. from 1995 to 1999.
Item 12. Security
Ownership of
Certain Beneficial
Owners and
Management
The security ownership of certain ben-eficial owners and management isincorporated in this Form 10-K by ref-erence to the definitive ProxyStatement to be filed with theSecurities and Exchange Commission.
Item 13. Certain
Relationships and
Related Transactions
The information called for by Item 13is incorporated in this Form 10-K byreference to the definitive ProxyStatement to be filed with theSecurities and Exchange Commission.
financials
34
Item 14. Exhibits, Financial Statement Schedules and Reports on
Form 8-K
(a) Documents filed as part of this report:1. Financial Statements
The financial statements as set forth under Item 8 of this report on Form 10-K are incorporated herein2. Financial Statement Schedule
The following supplementary financial information is filed in this Form 10-K :Page
Financial Statement ScheduleII - Valuation and qualifying accounts for the years 2001, 2000 and 1999 69
The schedules not included herein are omitted because they are not applicable or the required information is pre-sented in the financial statements or related notes.
(b) Reports on 8-KNone
(c) Exhibit listingExhibit (3)(i), Restated Certificate of Incorporation and Bylaws*Exhibit (12), Computation of Ratio of Earnings to Fixed Charges for the
Company and subsidiaries Exhibit (21), Subsidiaries of the registrantExhibit (23), Consent of Independent Accountants
* Incorporated by Reference
Shareholder Information
Stock Exchange ListingRohm and Haas stock trades on the New York Stock Exchange (NYSE) under the trading symbol ROH.
Transfer Agent and RegistrarEquiServe L.P.P.O. Box 8218Boston, MA 02266-8218
Annual Meeting of ShareholdersRohm and Haas Company’s Annual Meeting of Shareholders will be held on May 6, 2002 at IndependenceVisitors Center, One North Independence Mall West, Philadelphia, PA 19106. Formal notice of the meeting,the proxy statement and form of proxy will be mailed to current shareholders on April 2, 2002.
Independent AccountantsPricewaterhouseCoopers LLPTwo Commerce Square2001 Market StreetSuite 1700Philadelphia, PA USA 19103(267) 330-3000
10-K filing with the SECYou can obtain a copy of Rohm and Haas’s annual report to the U.S. Securities and Exchange Commission(SEC) through:
The SEC EDGAR database at: www.sec.govThe Rohm and Haas website: www.rohmhaas.comThe Rohm and Haas Investors Line at: 1-800-ROH-0466
Or by writing to:Rohm and Haas CompanyPublic Relations Department100 Independence Mall WestPhiladelphia, PA USA 19106-2399

35
SIGNATURES
Pursuant to the requirements of Section 13 of the Securities Exchange Act of 1934, Rohm and Haas Company hasduly caused this report to be signed on its behalf by the undersigned, thereunto duly authorized.
/s/ Bradley J. Bell Bradley J. Bell
Senior Vice President and Chief Financial Officer
March 25, 2002
Pursuant to the requirements of the Securities Exchange Act of 1934, this report has been signed on March 25,2002 by the following persons on behalf of the registrant and in the capacities indicated.
Signature and Title Signature and Title
/s/ Raj L. Gupta /s/ James A. HendersonRaj L. Gupta James A. Henderson
Director, Chairman of the Board and DirectorChief Executive Officer
/s/ Bradley J. Bell /s/ Richard L. KeyserBradley J. Bell Richard L. Keyser
Senior Vice President and Chief Financial Officer Director
/s/ William J. Avery /s/ John H. McArthurWilliam J. Avery John H. McArthur
Director Director
/s/ James R. Cantalupo /s/ Jorge P. MontoyaJames R. Cantalupo Jorge P. Montoya
Director Director
/s/ J. Michael Fitzpatrick /s/ Sandra O. MooseJ. Michael Fitzpatrick Sandra O. Moose
Director Director
/s/ Earl G. Graves /s/ Gilbert S. OmennEarl G. Graves Gilbert S. Omenn
Director Director
/s/ David W. Haas /s/ Ronaldo H. SchmitzDavid W. Haas Ronaldo H. Schmitz
Director Director
/s/ Thomas W. Haas /s/ Marna C. WhittingtonThomas W. Haas Marna C. Whittington
Director Director

financials
36
Report on Financial Statements
The financial statements of Rohm and Haas Company and subsidiaries were prepared by the Company in accordance withgenerally accepted accounting principles. The financial statements necessarily include some amounts that are based on thebest estimates and judgments of the Company. The financial information in this annual report is consistent with that in thefinancial statements.
The Company maintains accounting systems and internal accounting controls designed to provide reasonable assurance thatassets are safeguarded, transactions are executed in accordance with the Company's authorization and transactions are prop-erly recorded. The accounting systems and internal accounting controls are supported by written policies and procedures, bythe selection and training of qualified personnel and by an internal audit program. In addition, the Company's code of busi-ness conduct requires employees to discharge their responsibilities in conformity with the law and with a high standard ofbusiness conduct.
The Company's financial statements have been audited by PricewaterhouseCoopers LLP, independent accountants, as statedin their report below. Their audit was conducted in accordance with generally accepted auditing standards and included areview of internal accounting controls to the extent considered necessary to determine the audit procedures required to sup-port their opinion.
The audit committee of the board of directors, composed entirely of non-employee directors, recommends to the board ofdirectors the selection of the Company's independent accountants, approves their fees and considers the scope of their audits,audit results, the adequacy of the Company's internal accounting control systems and compliance with the Company's codeof business conduct.
Raj L. Gupta Bradley J. BellChairman of the Board and Chief Executive Officer Senior Vice President and Chief Financial Officer
Report of Independent Accountants
The Board of Directors and Shareholdersof Rohm and Haas Company:
In our opinion, the consolidated financial statements listed in the index appearing under Item 8 present fairly, in allmaterial respects, the financial position of Rohm and Haas Company and its subsidiaries at December 31, 2001 andDecember 31, 2000 and the results of their operations and their cash flows for each of the three years in the periodended December 31, 2001, in conformity with accounting principles generally accepted in the United States of America.In addition, in our opinion, the financial statement schedule listed in the index under Item 14(a)(2) presents fairly, inall material respects, the information set forth therein when read in conjunction with the related consolidated financialstatements. These financial statements and financial statement schedule are the responsibility of the Company’smanagement; our responsibility is to express an opinion on the financial statements and financial statement schedulebased on our audits. We conducted our audits of these statements in accordance with auditing standards generallyaccepted in the United States of America, which require that we plan and perform the audit to obtain reasonableassurance about whether the financial statements are free of material misstatement. An audit includes examining, on atest basis, evidence supporting the amounts and disclosures in the financial statements, assessing the accountingprinciples used and significant estimates made by management, and evaluating the overall financial statementpresentation. We believe that our audits provide a reasonable basis for our opinion.
As discussed in Note 7, on January 1, 2001, the Company adopted Statement of Financial Accounting Standards No.133 “Accounting for Derivative Instruments and Hedging Activities.”
PricewaterhouseCoopers LLPPhiladelphia, Pennsylvania
March 21, 2002

37
Rohm and Haas Company and Subsidiaries
Statements of Consolidated Earnings
Years ended December 31, 2001, 2000 and 1999
(Millions of dollars, except per-share amounts) 2001 2000 1999Current EarningsNet sales $ 5,666 $ 6,349 $ 4,840 Cost of goods sold 4,008 4,342 3,139
Gross profit 1,658 2,007 1,701 Selling and administrative expense 861 933 768 Research and development expense 230 224 174 Interest expense 182 241 158 Amortization of goodwill and other intangibles 156 159 83 Purchased in-process research and development - 13 105 Provision for restructuring and asset impairment 320 13 36 Loss on disposition of joint ventures - - (22)Share of affiliate net earnings 12 18 6
Note 6 Other income, net 15 46 14
Earnings (losses) from continuing operations before income taxes,extraordinary item and cumulative effect of accounting change (64) 488 375
Note 8 Income taxes 6 192 182 Earnings (losses) from continuing operations beforeextraordinary item and cumulative effect of accounting change $ (70) $ 296 $ 193
Discontinued operations:Income from discontinued line of business, net of $25 million,$35 million and $33 million of income taxes in 2001, 2000 and 1999, respectively 40 58 56 Gain on disposal of discontinued line of business, net of $251 million of income taxes 428 - - Earnings before extraordinary item and cumulative effect of accounting change $ 398 $ 354 $ 249
Note 19 Extraordinary loss on early extinguishment of debt, net of $1 million income taxes in 2001 (1) - - Cumulative effect of accounting change, net of $1 million income taxes in 2001 (2) - - Net earnings $ 395 $ 354 $ 249
Note 22 Less preferred stock dividends - - 2 Net earnings applicable to common shareholders $ 395 $ 354 $ 247
Basic earnings (loss) per common share (in dollars):Continuing operations $ (0.31) $ 1.34 $ 0.99 Income from discontinued line of business 0.18 0.27 0.29 Gain on disposal of discontinued line of business 1.94 - - Extraordinary loss on early extinguishment of debt (0.01) - - Cumulative effect of accounting change (0.01) - -
$ 1.79 $ 1.61 $ 1.28
Diluted earnings (loss) per common share (in dollars):Continuing operations $ (0.31) $ 1.34 $ 0.98 Income from discontinued line of business 0.18 0.27 0.29 Gain on disposal of discontinued line of business 1.94 - - Extraordinary loss on early extinguishment of debt (0.01) - - Cumulative effect of accounting change (0.01) - -
$ 1.79 $ 1.61 $ 1.27
Weighted average common shares outstanding (in millions)- Basic 220.2 219.5 192.6- Diluted 220.2 220.5 195.7
See notes to consolidated financial statements (pages 41 through 69).

financials
38
Rohm and Haas Company and Subsidiaries
Statements of Consolidated Cash Flows
Years ended December 31, 2001, 2000 and 1999
(Millions of dollars) 2001 2000 1999
Cash Flows from Operating Activities
Net earnings $ 395 $ 354 $ 249 Adjustments to reconcile net earnings to net cash
provided by operating activities:Gain on disposal of discontinued line of business (679) - - Provision for restructuring and asset impairments 320 13 36 Discontinued operations (65) (93) (89)Purchased in-process research and development 13 105 Depreciation 406 446 360 Amortization of goodwill and other intangibles 156 159 83 Loss, as adjusted, on sale of facilities and investments - - 22 Extraordinary loss on early extinguishment of debt, net of tax (1) - - Cumulative effect of accounting change, net of tax (2) - -
Changes in assets and liabilities, net of acquisitions and divestitures:Deferred income taxes (87) (37) (70)Accounts receivable 122 (169) (104)Inventories 141 (100) (41)Accounts payable, accrued interest and other accrued liabilities (249) 78 128 Federal, foreign and other income taxes payable 213 82 25 Other, net (40) (71) 15
Net cash provided by continuing operations 630 675 719 Net cash provided by discontinued operations 69 101 97 Net cash provided by operating activities 699 776 816
Cash Flows from Investing ActivitiesAcquisitions of businesses and affiliates, net of cash acquired (144) (390) (3,394)Proceeds from the disposal of discontinued line of business, net of cash sold 834 - - Proceeds from the sale of businesses, net of cash sold 5 433 - Additions to land, buildings and equipment (401) (391) (323)Proceeds from hedge of net investment in foreign subsidiaries 18 21 -
Net cash provided (used) by investing activities 312 (327) (3,717)
Cash Flows from Financing ActivitiesProceeds from issuance of long-term debt - 447 2,564 Repayments of long-term debt (159) (204) (23)Net change in short-term borrowings (680) (489) 608 Purchases/retirement of treasury shares (1) (1) (65)Payment of dividends (171) (167) (141)Other, net - - (1)
Net cash provided (used) by financing activities (1,011) (414) 2,942 Net increase in cash and cash equivalents - 35 41 Cash and cash equivalents at the beginning of the year 92 57 16 Cash and cash equivalents at the end of the year $ 92 $ 92 $ 57
Supplemental Cash Flow InformationCash paid during the year for:
Interest, net of amounts capitalized $ 194 $ 239 $ 72 Income taxes, net of refunds received 239 247 202
Detail of acquisitions of businesses and affiliates:Fair value of assets acquired $ 144 $ 537 $ 6,312 Liabilities assumed - (147) (1,216)Common stock issued - - (1,702)
Net cash paid for acquisitions $ 144 $ 390 $ 3,394
See notes to consolidated financial statements (pages 41 through 69).

39
Rohm and Haas Company and Subsidiaries
Consolidated Balance Sheets
Years ended December 31, 2001 and 2000
(Millions of dollars) 2001 2000
AssetsCurrent assetsCash and cash equivalents $ 92 $ 92
Note 12 Receivables, net 1,220 1,479 Note 13 Inventories 712 967 Note 14 Prepaid expenses and other assets 397 243
Total current assets 2,421 2,781 Note 15 Land, buildings and equipment, net 2,916 3,294 Note 3 Investments in and advances to unconsolidated subsidiaries and affiliates 152 126 Note 16 Goodwill and other intangible assets, net of accumulated amortization 4,416 4,586 Note 17 Other assets 445 465
Total assets $ 10,350 $ 11,252
Liabilities and Stockholders' EquityCurrent liabilities
Note 18 Notes payable $ 178 $ 556 Trade and other payables 520 662
Note 20 Accrued liabilities 586 731 Federal, foreign and other income taxes payable 340 237 Total current liabilities 1,624 2,186
Note 19 Long-term debt 2,720 3,218 Note 11 Employee benefits 613 619 Note 8 Deferred income taxes 1,278 1,287 Note 21 Other liabilities 282 266
Minority interest 18 23 Note 25 Commitments and contingenciesNote 22 Stockholders' equity
Common stock; par value--$2.50; authorized-- 400,000,000 shares;issued--2001 and 2000: 242,078,367 shares 605 605 Additional paid-in capital 1,961 1,956 Retained earnings 1,742 1,518
4,308 4,079 Less: Treasury stock (2001--21,651,545 shares; 2000--22,141,494 shares) 208 214 Less: ESOP shares (2001--11,631,000; 2000--12,264,000) 113 119 Accumulated other comprehensive loss (172) (93)Total stockholders' equity 3,815 3,653 Total liabilities and stockholders' equity $ 10,350 $ 11,252
See notes to consolidated financial statements (pages 41 through 69).

financials
40
Rohm and Haas Company and Subsidiaries
Statements of Consolidated Stockholders’ Equity
Years ended December 31, 2001, 2000 and 1999
Accumulated Additional Other Total Total
(Millions of dollars, Preferred Common Paid-in Retained Treasury Comprehensive Stockholders' Comprehensive except per share amounts) Stock Stock Capital Earnings Stock ESOP Income (Loss) Equity Income (Loss)
1999
Balance January 1, 1999 $ 73 $ 492 $ 139 $1,284 $ 286 $ 132 $ (9) $ 1,561
Net earnings 249 $ 249 Cumulative translation adjustment (47) (47)Minimum pension liability 2 2 Total comprehensive income $ 204 Common dividends ($.74 per share) (139)Preferred dividends ($2.75 per share) (2)Redemptions and conversionof shares to common stock (73)Common stock issued:Acquisitions 113 1,740
Conversion of preferred stock (34)Under bonus plan, net ofpreferred conversions 63 (31)
From ESOP (7 )Treasury stock:
Purchases 3 Retirements (61)
Balance December 31, 1999 $ - $605 $1,942 $1,331 $ 224 $ 125 $ (54) $ 3,475
2000Net earnings 354 $ 354 Cumulative translation adjustment (37) (37)Minimum pension liability (2) (2)Total comprehensive income $ 315 Common dividends ($.78 per share) (167)
Common stock issued:Under bonus plan 14 (10)From ESOP (6 )
Balance December 31, 2000 $ - $605 $ 1,956 $ 1,518 $ 214 $ 119 $ (93) $ 3,653
2001Net earnings 395 $ 395 Transition adjustment as of January 1, 2001 (*) (6) (6)Current period changes in fair value (*) (27) (27)Reclassification of earnings, net (*) 5 5 Cumulative translation adjustment (45) (45)Minimum pension liability (6) (6)Total comprehensive income $ 316 Common dividends ($.80 per share) (171)
Common stock issued:Under bonus plan 5 (6)From ESOP (6 )
Balance December 31, 2001 $ - $ 605 $ 1,961 $ 1,742 $ 208 $ 113 $ (172) $ 3,815
See Notes to Consolidated Financial Statements for additional information.* See Note 7 in the Notes to Consolidated Financial Statements for changes within accumulated other comprehensive income, due to the use of derivative and non-derivative instruments qualifying as hedges in accordance with SFAS No. 133, "Accounting for Derivative Instruments and Hedging Activities."

41
NOTES TO
CONSOLIDATED
FINANCIAL STATEMENTS
Note 1: Summary of
Significant Accounting
Policies
Use of Estimates The preparation offinancial statements in conformitywith generally accepted accountingprinciples requires management tomake estimates and assumptions thataffect the reported amounts of assetsand liabilities and disclosure of con-tingent assets and liabilities at thedate of the financial statements andthe reported amounts of revenuesand expenses during the reportingperiod. Actual results could differfrom those estimates.
Reclassifications Certain reclassifica-tions have been made to prior yearamounts to conform with currentyear presentation.
Principles of Consolidation Theconsolidated financial statementsinclude the accounts of Rohm andHaas Company and its subsidiaries(the Company). Investments in affil-iates (20-50%-owned) are recordedat cost plus equity in their undistrib-uted earnings, less dividends.Intercompany accounts, transactionsand unrealized profits and losses ontransactions within the consolidatedgroup and with significant affiliatesare eliminated in consolidation, asappropriate.
Unconsolidated Entities The Company has no controllingownership in significant entitieswhich are not consolidated. Thereare no significant contractualrequirements to fund losses ofunconsolidated entities. Materialcontingent liabilities, guarantees andcommitments not included in theconsolidated balance sheet are dis-closed in the “Notes to Consolidated
Financial Statements” under Note25: “Contingent Liabilities,Guarantees and Commitments.”
Translation Procedures Foreign cur-rency accounts are translated intoU.S. dollars under the provisions ofStatement of Financial AccountingStandards (SFAS) No. 52, “ForeignCurrency Translation.” ThroughDecember 31, 2000, the U.S. dollarwas the functional currency forapproximately half of internationaloperations. Following the Mortonand LeaRonal acquisitions in 1999,the Company completed legal entityrestructuring and business integra-tion of its foreign operations, primari-ly in Europe. Based on these signifi-cant operational changes, theCompany determined that the func-tional currency of most of its foreignentities is the respective local curren-cy. Consequently, the Companychanged the functional currency forthose international operations affect-ed by the restructuring and businessintegration. Based on exchange ratesas of January 1, 2001, the Companyrecognized a one-time write-down offixed assets and inventories of approx-imately $50 million in the first quarterof 2001, which was recorded with acorresponding charge to other com-prehensive income.
Several foreign subsidiaries, primari-ly those in hyper-inflationary emerg-ing market economies, continue touse the U.S. dollar as their function-al currency.
Foreign subsidiaries using their localcurrency as the functional currencytranslate their assets and liabilitiesinto U.S. dollars using exchangerates at year-end. Revenue andexpense accounts are translatedusing the average exchange rates forthe reporting period. Translationadjustments are recorded in accumu-lated other comprehensive incomeor loss, a separate component of
shareholder’s equity.
Under the provisions of SFAS No. 52,foreign entities that continue to usethe U.S. dollar as the functional cur-rency translate: (1) land, buildingsand equipment along with relatedaccumulated depreciation, invento-ries, goodwill and intangibles alongwith related accumulated amortiza-tion, and minority interest at histori-cal rates of exchange; (2) all otherassets and liabilities using exchangerates at end of period, and (3) rev-enues, cost of goods sold, and oper-ating expenses other than deprecia-tion, amortization of goodwill andintangibles using the average rates ofexchange for the reporting period.Foreign exchange adjustments,including recognition of open for-eign exchange contracts, are chargedor credited to income.
Revenue Recognition Revenuesfrom product sales, net of applicableallowances, are recognized uponshipment of product. Exceptionsfrom this practice include shipmentsof supplier-owned and managedinventory ("SOMI") arrangements.Revenue is recognized under SOMIarrangements when usage of finishedgoods is reported by the customer,generally on a weekly or monthlybasis. Payments received in advanceof revenue recognition are recordedas deferred revenue.
Earnings Per Share Basic earningsper share is calculated by dividingnet earnings applicable to commonshareholders by the average numberof shares outstanding for the period.Diluted earnings per share is calcu-lated by adding the earnings impactof the conversion of preferred stockto net earnings applicable to com-mon shareholders and dividing thisamount by the average number ofshares outstanding for the periodadjusted for the assumed preferredstock conversion, and for the dilutive

financials
42
effect of an assumed exercise of all“in the money” options outstandingat the end of the period.
Cash and Cash Equivalents Cash andcash equivalents include cash, timedeposits and readily marketable secu-rities with original maturities of threemonths or less.
Inventories Inventories are stated atthe lower of cost or market. Cost ofdomestic inventory is primarily deter-mined under the last-in, first-out(LIFO) method.
Land, Buildings and Equipment andRelated Depreciation Land, build-ings and equipment are carried atcost. Assets are depreciated overtheir estimated useful lives on thestraight-line and accelerated meth-ods. Maintenance and repairs arecharged to earnings; replacementsand betterments are capitalized. Thecost and related accumulated depre-ciation of buildings and equipmentare removed from the accounts uponretirement or other disposition; anyresulting gain or loss is reflected inearnings.
Intangible Assets The Companyamortizes identifiable intangibleassets such as patents and trademarkson the straight-line basis over theirestimated useful lives. Goodwill isamortized on the straight-line basisover periods not greater than 40years. The Company evaluates therecoverability of goodwill and otherintangible assets on an annual basis,or when events or circumstancesindicate a possible inability to recov-er carrying amounts. Such evalua-tion is based on various analyses,including cash flow and profitabilityprojections. These analyses necessar-ily involve significant managementjudgment. See Note 26 for addition-al information regarding newaccounting pronouncements.
Impairment of Long-Lived AssetsThe Company assesses the recover-
ability of its long-lived assets based oncurrent and anticipated future undis-counted cash flows. In addition, theCompany's policy for the recognitionand measurement of any impairmentof such assets is to assess the currentand anticipated cash flows associatedwith the impaired asset. An impair-ment occurs when the cash flows(excluding interest) do not exceedthe carrying amount of the asset.The amount of impairment loss isthe difference between the carryingamount of the asset and its estimatedfair value. See Note 26 for addition-al information regarding newaccounting pronouncements.
Income Taxes The Company usesthe asset and liability method ofaccounting for income taxes. Underthis method, deferred tax assets andliabilities are recognized for the esti-mated future consequences of tem-porary differences between thefinancial statement carrying value ofassets and liabilities and their valuesas measured by tax laws.
Stock Compensation The Companyapplies the intrinsic value method inaccordance with Accounting PrinciplesBoard (APB) Opinion No. 25 andrelated Interpretations in accountingfor stock compensation plans. Underthis method, no compensationexpense is recognized for fixed stockoption plans.
Note 2: Acquisitions
and Dispositions of
Assets
The Company completed the follow-ing acquisitions and divestitures in2001:
In November 2001, the Companyacquired the flexible packagingadhesives business of TechnicalCoatings Co., a subsidiary ofBenjamin Moore & Company. Theacquisition includes the develop-ment, production and distribution ofa full line of cold seal adhesives
marked under the COSEAL® trade-mark. The primary application ofsuch adhesives is in flexible packag-ing, used mainly in the food andmedical industries.
In September 2001, the Companyacquired the Megum™ rubber-to-metal bonding business fromChemetall GmbH (Chemetall) ofFrankfurt Germany. The acquisitionincludes the corresponding activitiesof Chemetall subsidiaries in Italy andBrazil, and includes the acquiredtechnology used for the production ofvibration absorption modules, usedprimarily in the automotive industry.
In 2001, the Company increased itsownership in Rodel from 90% to99% for an additional cost of approx-imately $80 million. Rodel was a pri-vately-held, Delaware-based leader inprecision polishing technology serv-ing the semiconductor, memory diskand glass polishing industries. In thesecond quarter of 2000 the Companyincreased its ownership from 48% toapproximately 90% for a cost ofapproximately $200 million. Thefinancial statements reflect alloca-tions of the purchase price amountsbased on estimated fair values, andresulted in acquired goodwill of $110million, which was amortized on astraight-line basis over 30 years,through December 31, 2001. Priorto March 31, 2000 the investmenthad been accounted for under theequity method with the Company'sshare of earnings reported as equityin affiliates. Since the second quar-ter of 2000, Rodel was accounted forusing the purchase method withresults of operations fully consolidat-ed. Approximately $13 million of thepurchase price was allocated toIPR&D related to chemical mechani-cal planarization and surface prepa-ration technologies under develop-ment and was recognized as a chargein the second quarter of 2000.
On June 1, 2001, the Company com-

43
pleted the sale of its AgriculturalChemicals business (Ag) to DowAgroSciences LLC (DAS), a whollyowned subsidiary of the DowChemical Company, for approximate-ly $1 billion, subject to working capitaladjustments not yet finalized atDecember 31, 2001. The Companyrecorded a gain on the sale in theamount of $679 million pre-tax ($428million or $1.94 per share, after-tax.)Under the terms of the agreement,the divestiture included fungicides,insecticides, herbicides, trademarks,and license to all agricultural uses ofthe Rohm and Haas biotechnologyassets, as well as the agricultural busi-ness-related manufacturing sites locat-ed in Brazil, Colombia, France andItaly, the Company’s share of theNantong, China joint venture and theCompany’s assets in Muscatine, Iowa.The Company recorded the sale of Ag
as discontinued operations in accor-dance with APB 30 “Reporting theResults of Operations - Reporting theEffects of Disposal of a Segment of aBusiness and Extraordinary, Unusualand Infrequently Occurring Eventsand Transactions.” The AgriculturalChemicals business had been a sepa-rate major line of business previouslyreported as part of the ChemicalSpecialties segment and representedthe Company’s entire line of agricul-tural chemical products.
The operating results of Ag havebeen reported separately as discon-tinued operations in the Statementsof Consolidated Earnings for eachyear presented.
Net sales and income from discontin-ued operations are as follows:
accounted for using the purchasemethod.
In the second quarter of 2000, theCompany acquired the photoresistbusiness of Mitsubishi ChemicalCorporation. Mitsubishi Chemical isa leading producer of G-line, I-lineand deep UV photoresist chemistryused to make semiconductor chips.The transaction was accounted forusing the purchase method.
In conjunction with the acquisitionsof Acima, SVC and Mitsubishi pho-toresist, the Company recordedgoodwill of $36 million which wasamortized over a range of 20 to 40years, through December 31, 2001.
The Company completed the follow-ing divestitures in 2000:In the first quarter of 2000, theCompany sold its Industrial Coatingsbusiness to BASF Corporation forapproximately $169 million, net ofworking capital adjustments.
In the third quarter of 2000, theCompany sold its Thermoplastic Poly-urethane business to Huntsman Cor-poration for approximately $117 mil-lion, net of working capital adjustments.
In the fourth quarter of 2000, theCompany sold its European Salt busi-ness, Salins-Europe, to a consortium,which includes management, led byUnion d'Etudes et d'InvestissementsSA, a wholly-owned subsidiary ofCredit Agricole, for approximately$270 million.
These three businesses wereacquired by the Company in June1999 as part of the acquisition ofMorton and were recorded at fairvalue. Accordingly, no gain or losswas recorded on these transactions.
In the fourth quarter of 2000, theCompany sold its 50% interest inTosoHaas to its joint venture partner,Tosoh Corporation.
Pro forma information is not pre-sented, as the 2001 and 2000 acquisi-
(in millions) Year ended December 31,
2001 2000 1999
Net sales $ 230 $ 530 $ 534
Operating income 65 93 89
Income tax expense 25 35 33
Income from discontinued operations 40 58 56
The Company completed the follow-ing acquisition and joint ventureactivities in 2000:
In the first quarter of 2000, theCompany entered into a joint venturewith Stockhausen GmbH & Co. KG(Stockhausen) of Germany to form aglobal partnership (StoHaas) for themanufacture of reliable, low cost sup-ply of acrylic acid in North Americaand Europe. Under the terms of thejoint venture both partners purchaseacrylic acid from StoHaas for use asraw materials. Since StoHaas is notcontrolled by the Company its opera-tions are not consolidated, instead,the Company's investment in StoHaasis accounted and reported as aninvestment under the equity method.
The earnings impact in 2001, the firstyear of operations, was minimal. TheCompany expects minimal earningsimpact from operations of the jointventure in future years as well. In con-junction with the joint venture, theCompany acquired Stockhausen'smerchant monomer business inEurope.
Acquired 95% of Acima A.G.(Acima), a Swiss company specializ-ing in biocidal formulations,polyurethane catalysts and other spe-cialty chemicals and also acquired an80% interest in Silicon ValleyChemical Laboratories, Inc. (SVC), aprivately-held supplier of high tech-nology products for the semiconduc-tor industry. These transactions were

financials
44
tions and divestitures were not mate-rial to the Company's results of oper-ations or consolidated financial posi-tion. The results of operations ofacquired businesses are included inthe Company's consolidated finan-cial statements from the respectivedates of acquisition. The operatingresults of Ag have been reported sep-arately as discontinued operations inthe Statements of ConsolidatedEarnings for each year presented.
Note 3: Investments
The Company's investments in itsaffiliates (20-50%-owned) totaled$109 million at December 31, 2001and 2000.
Note 4: Purchased In-
process Research and
Development
In acquisitions accounted for by thepurchase method, IPR&D representsthe value assigned to research anddevelopment projects of an acquiredcompany where technological feasibil-ity had not yet been established at thedate of the acquisition, and which, ifunsuccessful, have no alternativefuture use. Amounts assigned toIPR&D are charged to expense at thedate of acquisition. Accordingly, theCompany has charged $13 millionand $105 million to expense in 2000and 1999, respectively, related to theRodel and Morton acquisition. The$13 million IPR&D charge in 2000resulted from the allocation of pur-chase price in the Rodel acquisition toprojects under development relatedto chemical mechanical planarization(CMP) and surface preparation (SP)
technologies which are expected tobe commercialized in 2002.
In 1999, eight IPR&D projects wereidentified based upon discussionswith Morton personnel, analyses ofthe acquisition agreements, andanalyses of data provided by Morton.The two most significant researchand development projects were pas-sive materials and Lamineer coatingwhich together represented morethan 90% of the overall in-processresearch and development value.The remaining value was assigned tosix other in-process projects.
The passive materials project is beingdeveloped by the Electronic Materialsproduct group, which principallymanufactures dry film photoresistssold to printed circuit board manufac-turers. Passive materials is a new formof film materials which has been indevelopment since July 1996. Theproduct demonstrated technologicalfeasibility in the laboratory and is cur-rently in evaluations with customers.
Lamineer coating is a new and inno-vative product for Morton's PowderCoatings business which was success-fully developed subsequent to theMorton Acquisition. Lamineer is a
new family of powder coatings usedfor a variety of wood applications.The technology provides manufac-turers with an alternative method forapplying coatings to wood atincreased operating and manufactur-ing efficiencies. Lamineer coatinghad been in development since early1996. Through June 1999, a materi-al portion of the Lamineer technolo-gy, the base resins, was completelydeveloped. This portion of technol-ogy was identified as having an alter-native future use and, therefore, wasnot classified as IPR&D at the date ofthe Morton acquisition. The curingtechnologies, however, were identi-fied as IPR&D. Related products arein the testing and trial stage of devel-opment. The efforts required tocomplete the Lamineer coating proj-ect were focused on developing thenecessary curing technologies andmeeting customer specifications.During 2000, Lamineer productswere commercially introduced andmarketed through the Company’sSurface Finishes business.
The fair values of the in-process com-pleted portion of these research anddevelopment projects at the date ofacquisition, were as follows:
(in millions) Fair Value
2001 2000 1999
Passive Materials $ - $ - $ 50
Lamineer Coating - - 48
CMP and SP technologies - 13 -
All Others - - 7
Total $ - $ 13 $ 105
45
The valuation analyses of these projectswere performed just prior to the dateof acquisition and were based oninformation available at that time.The projects identified in the analysiswere analyzed based primarily on anevaluation of their status in the prod-uct development process, the expect-ed release dates, and the percentagecompleted.
The technique used in valuing eachpurchased research and develop-ment project was the incomeapproach, which included an analysisof the markets, cash flows, and risksassociated with achieving these cashflows. Significant appraisal assump-tions include: The period in whichmaterial net cash inflows from signif-icant projects were expected to com-mence; material anticipated changesfrom historical pricing, margins andexpense levels; and the risk adjusteddiscount rate applied to the project'scash flows.
Net cash inflows that are attributableto the completed IPR&D began in2001 and are expected to lastthrough 2015 for Lamineer coating.The forecast for both of these in-process projects relied on sales esti-mates derived from targeted marketshare, pricing estimates and expect-ed product life cycles. Both passivematerials and Lamineer coating areexpected to generate higher profitmargins, two to three times the mar-gins of historical products in theirrespective product groups. This isdue to their new and innovative char-acteristics, which allow pricing com-mensurate with their performance.The discount rate used for theacquired in-process technologies wasestimated at 20% for passive materi-als and 25% for Lamineer coatingbased upon Morton's weighted aver-age cost of capital of 12%. The dis-
count rate used for the in-processtechnology was determined to behigher than Morton's weighted aver-age cost of capital because the tech-nology had not yet reached techno-logical feasibility as of the date of val-uation. In using a discount rategreater than Morton's weighted aver-age cost of capital, management hasreflected the risk premium associat-ed with achieving the forecasted cashflows associated with these projects,and because the in-process technolo-gy had not yet reached technologicalfeasibility as of the date of valuation.
The nature of the efforts required todevelop the acquired in-process tech-nology into technologically feasibleand commercially viable productsprincipally relate to the completionof all planning, designing and testingactivities that are necessary to estab-lish a product or service that can beproduced to meet its design require-ments, including functions, featuresand technical performance require-ments. The Company currentlyexpects that the acquired in-processtechnology will be successfully devel-oped, but there can be no assurancethat the technological feasibility orcommercial viability of these prod-ucts will be achieved.
Note 5: Provision for
Restructuring and
Asset Impairments
In June 2001, the Company launcheda repositioning initiative to enableseveral of its businesses to respond tostructural changes in the global mar-ketplace. In connection with itsrepositioning initiatives, theCompany recognized a $330 millionone-time restructuring and assetimpairment charge in the secondquarter of 2001. The largest compo-nent of the charge relates to the par-
tial closure of certain manufacturingand research facilities across all busi-ness groups and includes exit costsrelated to the Liquid PolysulfideSealants business in PerformancePolymers and part of the dyes busi-ness in Chemical Specialties.Approximately 75% of the assetwrite-downs were in the NorthAmerican region.
Management estimates that less than10% of the overall charge willrequire the outlay of cash which isprimarily limited to severanceexpense. Most severance costs arepaid from the respective pensionplans and as a result, pension-relatedgains are recorded as a reduction tothe original restructuring charge andan increase to the pension assets.Management expects to completethe majority of its restructuringefforts by June 30, 2002.
The respective asset accounts werewritten down by $245 million. Thewrite-down of assets consisted ofmachinery and equipment of $105million (book value prior to write-down of $111 million), buildings of$76 million (book value prior towrite-down of $88 million), land of$13 million, investments of $6 mil-lion and goodwill and other intangi-bles of $45 million. The remainingrestructuring reserves of $43 millionare included in accrued liabilities onthe Consolidated Balance Sheet.Approximately $11 million of the $35million severance and other employ-ee costs during the year endedDecember 31, 2001, was paid toemployees through the Company’spayroll. The remaining balance wasfunded through the Company’sdomestic pension plans as detailed inthe following table:

financials
46
Offsetting the original charge of$330 million recorded in June 2001,is a pre-tax charge of $1 million fromchanges in estimates of restructuringliabilities and a pre-tax gain of $5 mil-lion primarily related to the recogni-tion of settlement gains recorded inthe fourth quarter of 2001. It is theCompany’s policy to recognize settle-
ment gains at the time an employee’spension liability is settled. Thechange to the restructuring liabilitywas required as a result of changes tooriginal estimates.
The one-time charge includes sever-ance benefits for 1,860 employees;the employees receiving severance
benefits include those affected byplant closings or capacity reductions,as well as various personnel in corpo-rate, administrative and shared serv-ice functions. As of December 31,2001, the number of employees andsites affected by the 2001 reposition-ing efforts are as follows:
(in millions)
2001 Repositioning June 2001 Changes to Balanceaccruals estimates Payments Dec. 31, 2001
Severance and employee benefit costs $ 71 $ 1 $ (35) $ 37
Contract, lease termination and other 11 - (5) 6
$ 82 $ 1 $ (40) $ 43
Affected Positions Remaining to be Positions eliminated eliminated
Number of employees 1,860 997 863
Sites affected Sites closed at Sites remaining to December 31, 2001 be closed
Full shutdowns 9 4 5
Partial shutdowns 9 3 6
A provision for restructing of $13million before-tax was recorded inthe first half of 2000 in the IonExchange Resins Business for thewrite-down of plant assets and sever-ance costs for approximately 100people. These charges were net ofcertain pension settlement and cur-tailment gains. Also in 2000, an addi-tional $45 million related largely tolease terminations was recorded inthe allocation of the Morton pur-chase price. Actions under this planare expected to be completed byDecember 31, 2002.
A restructuring reserve was estab-lished in 1999 for costs related bothto the integration of Morton and theCompany’s redesign of its selling andadministrative infrastructure. A por-tion of these costs resulted in a pre-tax charge of $60 million in 1999,largely for severance costs forapproximately 700 employees ofRohm and Haas, the acquiring com-pany. This charge was reduced by$24 million in pension related gainsrecognized as severance was paidfrom the Company’s pension plan.
An additional $68 million, largelyseverance related reserve associatedwith staff reductions of approximate-ly 500 employees of the acquiredcompany was recorded in the alloca-tion of the Morton purchase price.In December 2001, $6 million wasreversed against the results of opera-tions, and $11 million was offsetagainst the original purchase price asestimates changed. A summary ofthe reserves for the year endedDecember 31, 2001 is as follows:

47
Utilization
Reserve ReserveDecember 31, Cash Other Change in December 31,
(in millions) 2000 payments charges estimate 2001
Severance/ other employee costs $ 13 $ (3) $ - $ (10) $ -Contract and lease terminations and other 20 (6) (7) (7 ) -
Total $ 33 $ (9) $ (7) $ (17 ) $ -
(in millions) 2001 2000 1999
Royalty income, net $ 13 $ 15 $ 9Foreign exchange gains, net 10 26 4Interest income 8 7 12Voluntary early retirement incentives, severance, litigation settlements and certain waste disposal site cleanup costs - (2) (9)Environmental insurance recoveries - - 28Integration costs (1) (8) (28)Minority interest 2 5 (1)Casualty loss in joint venture (4) - -Other, net (13) 3 (1)
Total $ 15 $ 46 $ 14
Note 6: Other Income (Expense), Net
Note 7: Financial
Instruments
The Company uses derivative finan-cial instruments to reduce the impactof changes in foreign exchange rates,interest rates and commodity rawmaterial prices on its earnings, cashflows and fair values of assets and lia-bilities. The Company enters intoderivative financial contracts basedon analyses of specific and knowneconomic exposures. The Companydoes not use derivative instrumentsfor trading or speculative purposes,nor is it a party to any leveragedderivative instruments or any instru-ments of which the values are notavailable from independent thirdparties. The Company managescounterparty risk associated withnon-performance of counterpartiesby entering into derivative contractswith major financial institutions ofinvestment grade credit rating andby limiting the amount of exposurewith each financial institution.
In 2001, the Company adopted SFASNo. 133 "Accounting for DerivativeInstruments and Hedging Activities," as
amended by SFAS No. 137 and No.138. Additionally, in July 2001 theCompany adopted DIG Issue G-20,“Assessing and Measuring the Effective-ness of a Purchased Option Used in aCash Flow Hedge”. Using market valu-ations for derivatives held as ofDecember 31, 2000, the Company, as ofJanuary 1, 2001, recorded a $6 millionafter-tax cumulative income effect toaccumulated other comprehensiveincome and a charge to net income of$2 million, to recognize at fair value allderivative instruments. With the adop-tion of SFAS No. 133, changes in theCompany's derivative instrumentportfolio or changes in the marketvalues of this portfolio could have amaterial effect on accumulated othercomprehensive income. The adop-tion has not materially changed man-agement's risk policies and practices,nor has compliance with the stan-dard materially impacted the report-ed results of operations.
All derivative instruments are reportedon the balance sheet at fair value. Forinstruments designated as cash flowhedges, the effective portion of the
hedge is reported in other compre-hensive income until it is reclassified toearnings in the same period in whichthe hedged item has had an impact onearnings. For instruments designatedas fair value hedges, changes in fairvalue of the instruments are offset inthe Statements of ConsolidatedEarnings by changes in the fair value ofthe hedged item. For instruments des-ignated as hedges of net investments inforeign operating units not using theU.S. dollar as their functional currency,changes in fair value of the instru-ments are offset in other comprehen-sive income to the extent that they areeffective as economic hedges.Changes in the fair value of derivativeinstruments, including embeddedderivatives that are not designated as ahedge, are recorded each period incurrent earnings along with any inef-fective portion of the hedges.
Current period changes, net of appli-cable income taxes, within accumu-lated other comprehensive income,due to the use of derivative and non-derivative instruments qualifying ashedges, are reconciled as follows:
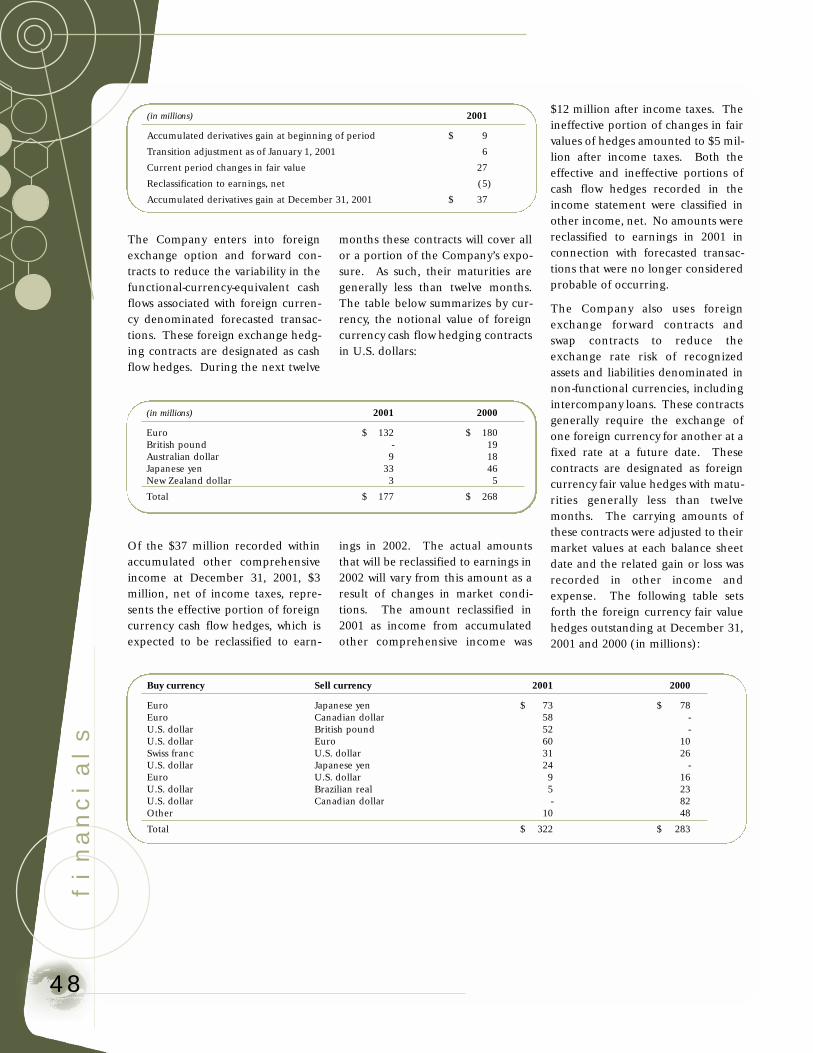
financials
48
(in millions) 2001
Accumulated derivatives gain at beginning of period $ 9
Transition adjustment as of January 1, 2001 6
Current period changes in fair value 27
Reclassification to earnings, net (5)
Accumulated derivatives gain at December 31, 2001 $ 37
(in millions) 2001 2000
Euro $ 132 $ 180British pound - 19Australian dollar 9 18Japanese yen 33 46New Zealand dollar 3 5
Total $ 177 $ 268
Buy currency Sell currency 2001 2000
Euro Japanese yen $ 73 $ 78Euro Canadian dollar 58 -U.S. dollar British pound 52 -U.S. dollar Euro 60 10Swiss franc U.S. dollar 31 26U.S. dollar Japanese yen 24 -Euro U.S. dollar 9 16U.S. dollar Brazilian real 5 23U.S. dollar Canadian dollar - 82Other 10 48
Total $ 322 $ 283
The Company enters into foreignexchange option and forward con-tracts to reduce the variability in thefunctional-currency-equivalent cashflows associated with foreign curren-cy denominated forecasted transac-tions. These foreign exchange hedg-ing contracts are designated as cashflow hedges. During the next twelve
months these contracts will cover allor a portion of the Company’s expo-sure. As such, their maturities aregenerally less than twelve months.The table below summarizes by cur-rency, the notional value of foreigncurrency cash flow hedging contractsin U.S. dollars:
Of the $37 million recorded withinaccumulated other comprehensiveincome at December 31, 2001, $3million, net of income taxes, repre-sents the effective portion of foreigncurrency cash flow hedges, which isexpected to be reclassified to earn-
ings in 2002. The actual amountsthat will be reclassified to earnings in2002 will vary from this amount as aresult of changes in market condi-tions. The amount reclassified in2001 as income from accumulatedother comprehensive income was
$12 million after income taxes. Theineffective portion of changes in fairvalues of hedges amounted to $5 mil-lion after income taxes. Both theeffective and ineffective portions ofcash flow hedges recorded in theincome statement were classified inother income, net. No amounts werereclassified to earnings in 2001 inconnection with forecasted transac-tions that were no longer consideredprobable of occurring.
The Company also uses foreignexchange forward contracts andswap contracts to reduce theexchange rate risk of recognizedassets and liabilities denominated innon-functional currencies, includingintercompany loans. These contractsgenerally require the exchange ofone foreign currency for another at afixed rate at a future date. Thesecontracts are designated as foreigncurrency fair value hedges with matu-rities generally less than twelvemonths. The carrying amounts ofthese contracts were adjusted to theirmarket values at each balance sheetdate and the related gain or loss wasrecorded in other income andexpense. The following table setsforth the foreign currency fair valuehedges outstanding at December 31,2001 and 2000 (in millions):

49
(in millions) 2001 2000
Euro $ 401 $ 203 Japanese yen 194 242
Total $ 595 $ 445
The Company uses cross-currencyinterest rate swaps, foreign exchangeforward and non-derivative instru-ments to hedge the foreign currencyexposures of the Company's netinvestments in foreign operatingunits. These transactions are desig-nated as hedges of net investment.The effective portion of changes infair values of hedges, recorded asincome within accumulated othercomprehensive income, was $38 mil-lion after income taxes at December31, 2001. The amount excludedfrom the measurement of effective-ness on these net investment hedgeswas $8 million before income taxesfor 2001, which was recorded as a
reduction to interest expense. Priorto the adoption of SFAS No. 133, theCompany used cross currency inter-est rate swap contracts to hedge theforeign currency exposures of theCompany’s net investment in foreignsubsidiaries. While the currencyeffects of these hedges were reflectedin the foreign currency translationadjustments within accumulatedother comprehensive income, netinterest settlements reduced interestexpense by $22 million before taxesin 2000. The following table setsforth open cross currency interestrate swap or foreign exchange for-ward contracts at December 31, 2001and 2000:
The Company uses interest swapagreements to optimize the worldwidefinancing costs by maintaining adesired level of floating rate debt. In2001, the Company entered into inter-est swap agreements with a notionalvalue of $950 million, which convertedthe fixed rate components of the $450million notes due July 15, 2004 andthe $500 million due July 15, 2009 to afloating rate based on 3 monthLIBOR. Of these swap agreements,the $500 million notional value con-tracts maturing in 2009 and $75 mil-lion maturing in 2004 contain a creditclause where each counterparty has aright to settle at market price if theother party is downgraded belowinvestment grade. These interest swapagreements are designated andaccounted for as fair value hedges.The changes in fair values are markedto market through income along withthe offsetting changes in fair value ofunderlying notes using the short cutmethod. The net credits reducedinterest expense by $13 million beforeincome taxes in 2001. No interestswap agreements were outstanding atDecember 31, 2000.
The Company uses natural gas andpropylene swap agreements for hedg-ing purposes to reduce the effects ofchanging raw material prices. Theseswap contracts are designated andaccounted for as cash flow hedges. Ofthe $37 million recorded within accu-mulated other comprehensive incomeat December 31, 2001, a loss of $4 mil-lion, net of income taxes, representsthe effective portion of cash flowhedges, which is expected to be reclas-sified to earnings in 2002. The actualamounts that will be reclassified toearnings in 2002 will differ from thisamount as a result of changes in mar-ket conditions. The amount reclassi-fied in 2001 as a loss from accumulat-ed other comprehensive income was$7 million after income taxes, whichwas recorded as a component ofunderlying inventory costs. Noamounts were reclassified to earningsin 2001 in connection with forecastedtransactions that were no longer con-sidered probable of occurring. Priorto the adoption of SFAS No. 133, gainsand losses on the swap agreementswere deferred until settlement andrecorded as a component of underly-
ing inventory costs when settled,which amounted to an after-tax gain of$1 million in 2000. The notional valueof natural gas and propylene swapagreements totaled $41 million and $3million at December 31, 2001 and2000, respectively.
As of December 31, 2001, theCompany maintains hedge positionsof immaterial amounts that are effec-tive as hedges from an economic per-spective but do not qualify for hedgeaccounting under SFAS No. 133, asamended. Such hedges consist pri-marily of emerging market foreigncurrency option and forward con-tracts, and have been marked to mar-ket through income with an immate-rial impact on earnings.
The fair value of financial instru-ments was estimated based on the fol-lowing methods and assumptions:
Cash and cash equivalents,accounts receivable, accountspayable and notes payable -- the car-rying amount approximates fairvalue due to the short maturity ofthese instruments.
Short and long-term debt -- quotedmarket prices for the same or similarissues or the current rates offered tothe Company or its subsidiaries fordebt with the same or similar remain-ing maturities and terms.
Interest rate swap agreements --quoted market prices of the sameor similar issues available.
Foreign currency option contracts --the market prices the Companywould receive or pay to terminatethe contracts.
Foreign currency forward and swapagreements -- the carrying valueapproximates fair value because thesecontracts are adjusted to their marketvalue at the balance sheet date.
Natural gas and propylene swapagreements -- the fair value is esti-mated based on the amount theCompany would receive or pay toterminate the contracts.
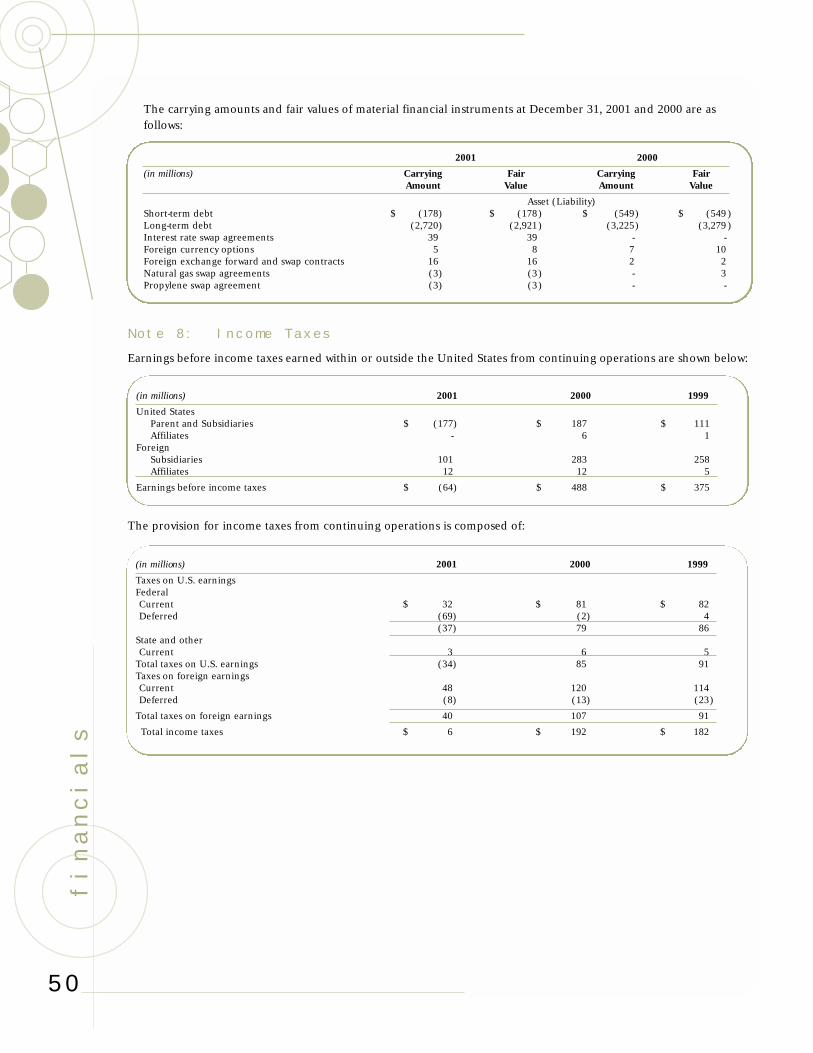
Note 8: Income Taxes
Earnings before income taxes earned within or outside the United States from continuing operations are shown below:
The provision for income taxes from continuing operations is composed of:
financials
50
The carrying amounts and fair values of material financial instruments at December 31, 2001 and 2000 are as follows:
2001 2000
(in millions) Carrying Fair Carrying FairAmount Value Amount Value
Asset (Liability)Short-term debt $ (178) $ (178) $ (549) $ (549 )Long-term debt (2,720) (2,921) (3,225) (3,279 )Interest rate swap agreements 39 39 - -Foreign currency options 5 8 7 10Foreign exchange forward and swap contracts 16 16 2 2Natural gas swap agreements (3) (3) - 3Propylene swap agreement (3) (3) - -
(in millions) 2001 2000 1999
United StatesParent and Subsidiaries $ (177) $ 187 $ 111Affiliates - 6 1
ForeignSubsidiaries 101 283 258Affiliates 12 12 5
Earnings before income taxes $ (64) $ 488 $ 375
(in millions) 2001 2000 1999
Taxes on U.S. earningsFederalCurrent $ 32 $ 81 $ 82Deferred (69) (2) 4
(37) 79 86State and otherCurrent 3 6 5
Total taxes on U.S. earnings (34) 85 91Taxes on foreign earningsCurrent 48 120 114Deferred (8) (13) (23)
Total taxes on foreign earnings 40 107 91
Total income taxes $ 6 $ 192 $ 182
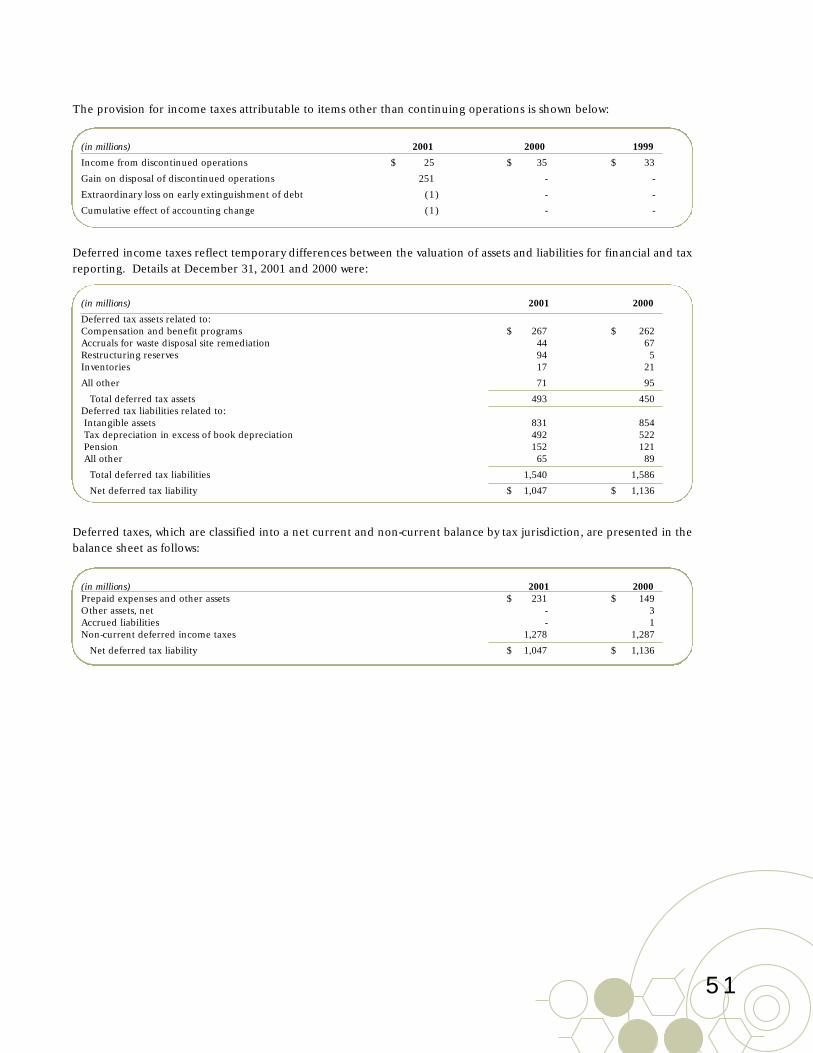
The provision for income taxes attributable to items other than continuing operations is shown below:
Deferred income taxes reflect temporary differences between the valuation of assets and liabilities for financial and taxreporting. Details at December 31, 2001 and 2000 were:
Deferred taxes, which are classified into a net current and non-current balance by tax jurisdiction, are presented in thebalance sheet as follows:
51
(in millions) 2001 2000 1999
Income from discontinued operations $ 25 $ 35 $ 33
Gain on disposal of discontinued operations 251 - -
Extraordinary loss on early extinguishment of debt (1) - -
Cumulative effect of accounting change (1) - -
(in millions) 2001 2000
Deferred tax assets related to:Compensation and benefit programs $ 267 $ 262Accruals for waste disposal site remediation 44 67Restructuring reserves 94 5Inventories 17 21
All other 71 95
Total deferred tax assets 493 450Deferred tax liabilities related to:Intangible assets 831 854Tax depreciation in excess of book depreciation 492 522Pension 152 121All other 65 89
Total deferred tax liabilities 1,540 1,586
Net deferred tax liability $ 1,047 $ 1,136
(in millions) 2001 2000Prepaid expenses and other assets $ 231 $ 149Other assets, net - 3Accrued liabilities - 1Non-current deferred income taxes 1,278 1,287
Net deferred tax liability $ 1,047 $ 1,136

financials
52
The effective tax rate on pre-tax income differs from the U.S. statutory tax rate due to the following:
(in millions) 2001 2000 1999
Statutory tax rate (35.0)% 35.0% 35.0%U.S. tax credits (14.7) (2.6 ) (3.1)Charge for IPR&D - .9 9.8Depletion (9.8) (1.1 ) (0.8)Amortization of non-deductible goodwill 35.0 4.2 3.0Non-deductible restructuring charge 33.0 - -Other, net 0.9 2.9 4.6
Effective tax rate 9.4% 39.3% 48.5%
At December 31, 2001 and 2000, theCompany provided deferred incometaxes for the assumed repatriation ofall unremitted foreign earnings.Total unremitted earnings, after pro-vision for applicable foreign incometaxes, were approximately $565 mil-lion and $361 million at December31, 2001, and 2000, respectively. TheCompany had a foreign tax creditcarry-forward at December 31, 2000of $76 million that was fully utilizedas of December 31, 2001.
Note 9: Segment
Information
SFAS No. 131, “Disclosures aboutSegments of an Enterprise and
Related Information” designates theinternal management accountabilitystructure as the source of theCompany’s reportable segments.The statement also requires disclo-sures about products and services,geographic areas and major cus-tomers. The Company’s businesssegment reporting under SFAS No.131 at December 31, 2001 was consis-tent with the changes in its financialreporting structure incorporated inthe Company's reporting since thefirst quarter of 1998 as revised, subse-quent to the Morton and LeaRonalacquisitions in 1999. Corporateincludes non-operating items such asinterest income and expense, corpo-
rate governance costs, corporateexploratory research and, in 2000and 1999, $13 million and $105 mil-lion of purchased in-process researchand development, respectively.
The Company changed its businesssegment format effective January 1,2002, in accordance with SFAS No.131, based on realignment of man-agement. The Company continuesto report the December 31, 2001results in the format of the thenexisting business segments. Goingforward, the segments of theCompany will be reported as follows:

53
Business Segments at December 31, 2001 Business Segments as of January 1, 2002
Performance Polymers CoatingsCoatings Architectural and Functional CoatingsAdhesives and Sealants Automotive CoatingsPlastic Additives Powder CoatingsMonomersSurface Finishes Adhesives and Sealants
Automotive CoatingsPowder Coatings Electronic Materials
Printed Wiring BoardElectronic and Industrial Finishes
Chemical Specialties MicroelectronicsConsumer and Industrial SpecialtiesInorganic and Specialty Solutions Performance ChemicalsIon Exchange Resins Monomers
Plastic AdditivesElectronic Materials Inorganic and Specialty Solutions
Shipley Ronal Consumer and Industrial SpecialtiesMicroelectronics Ion Exchange Resins
Salt Salt
The table below presents Sales by business segment, as restated to follow the new business segments for 2001 and 2000.Segment eliminations are presented to adjust for the gross up of intercompany sales between segments.
Net Earnings, excludingSales non-recurring items
(in millions) 2001 2000 2001 2000
Coatings $ 1,753 $ 1,870 $ 153 $ 168Adhesives and Sealants 661 704 20 25Electronic Materials 942 1,210 27 112Performance Chemicals 2,150 2,310 119 155Salt 749 876 24 24Elimination of Intersegment Sales (589) (621) (154) (160)
Total Company $ 5,666 $ 6,349 $ 189 $ 324

financials
54
The table below presents summarized financial information concerning the Company’s reportable segments as of and forthe periods ended December 31 and excludes the Agricultural Chemicals business which was disposed of in June 2001.
(in millions)2001 Performance Chemical Electronic
Polymers Specialties Materials Salt Corporate Consolidated
Sales to external customers $ 3,170 $ 805 $ 942 $ 749 $ - $ 5,666Earnings (losses) from continuing operations before extraordinary item and cumulative effect of accounting change 85 7 1 13 (176 ) (70)Share of affiliate earnings 8 - 4 - - 12Depreciation 228 57 27 79 15 406Segment assets 4,116 1,302 1,886 1,956 1,090 10,350Capital additions 139 35 70 29 128 401
2000 Performance Chemical ElectronicPolymers Specialties Materials Salt Corporate Consolidated
Sales to external customers $ 3,397 $ 866 $ 1,210 $ 876 $ - $ 6,349Earnings (losses) from continuing operations before extraordinary item and cumulative effect of accounting change 282 55 110 24 (175 ) 296Share of affiliate earnings 10 - 8 - - 18Depreciation 249 64 31 85 17 446Segment assets 4,474 1,951 1,919 2,052 856 11,252Capital additions 180 33 67 38 73 391
1999 Performance Chemical ElectronicPolymers Specialties Materials Salt Corporate Consolidated
Sales to external customers $ 2,939 $ 707 $ 755 $ 439 $ - $ 4,840Earnings (losses) from continuing operations before extraordinary item and cumulative effect of accounting change 350 59 57 10 (283 ) 193Share of affiliate earnings 6 - 2 - (2 ) 6Depreciation 215 53 23 25 44 360Segment assets 4,413 2,012 1,520 2,708 603 11,256Capital additions 195 65 22 33 8 323

55
The tables below present sales and long-lived asset information by geographic area as of and for the periods endingDecember 31, reflective of the disposal of the Agricultural Chemicals business. Sales are attributed to the United Statesand to all foreign countries combined based on customer location and not on the geographic location from which goodswere shipped.
2001 (in millions) United States Foreign Consolidated
Sales to external customers $ 2,661 $ 3,005 $ 5,666Long-lived assets 4,824 2,660 7,484
2000 (in millions)
Sales to external customers $ 2,825 $ 3,524 $ 6,349Long-lived assets 5,896 2,110 8,006
1999 (in millions)
Sales to external customers $ 2,337 $ 2,503 $ 4,840Long-lived assets 5,138 3,122 8,260
Note 10: Pension Plans
The Company has noncontributory pension plans which provide defined benefits to domestic and non-U.S. employeesmeeting age and length of service requirements. The following disclosures include amounts for both the U.S. and sig-nificant foreign pension plans.
(in millions) 2001 2000 1999
Components of net periodic pension income
Service cost $ (54) $ (58 ) $ (52)
Interest cost (107) (103 ) (83)
Expected return on plan assets 192 191 148
Amortization of net gain existing at adoption of SFAS No. 87 8 8 9
Other amortization, net 11 11 7
Net periodic pension income $ 50 $ 49 $ 29
Pension income primarily reflectsrecognition of favorable investmentexperience as stipulated by SFAS No.87. The pension benefit payments inall three years included paymentsrelated to voluntary early retirementincentives and a severance benefitprogram.
The early retirement and severancebenefit programs resulted in a pre-tax gain of $3 million, $7 million and$1 million in 2001, 2000 and 1999respectively, as settlement gains fromretirees electing lump-sum distribu-tions exceeded the cost of the specialtermination benefits. Most of the2000 gains, shown here net of termi-
nation costs, were reported in theProvision for Restructuring (seeNote 5). It is the Company’s policyto recognize settlement gains at thetime of settlement. Special termina-tion benefits are recognized whenthe termination is probable and theamount of the benefit is calculable.
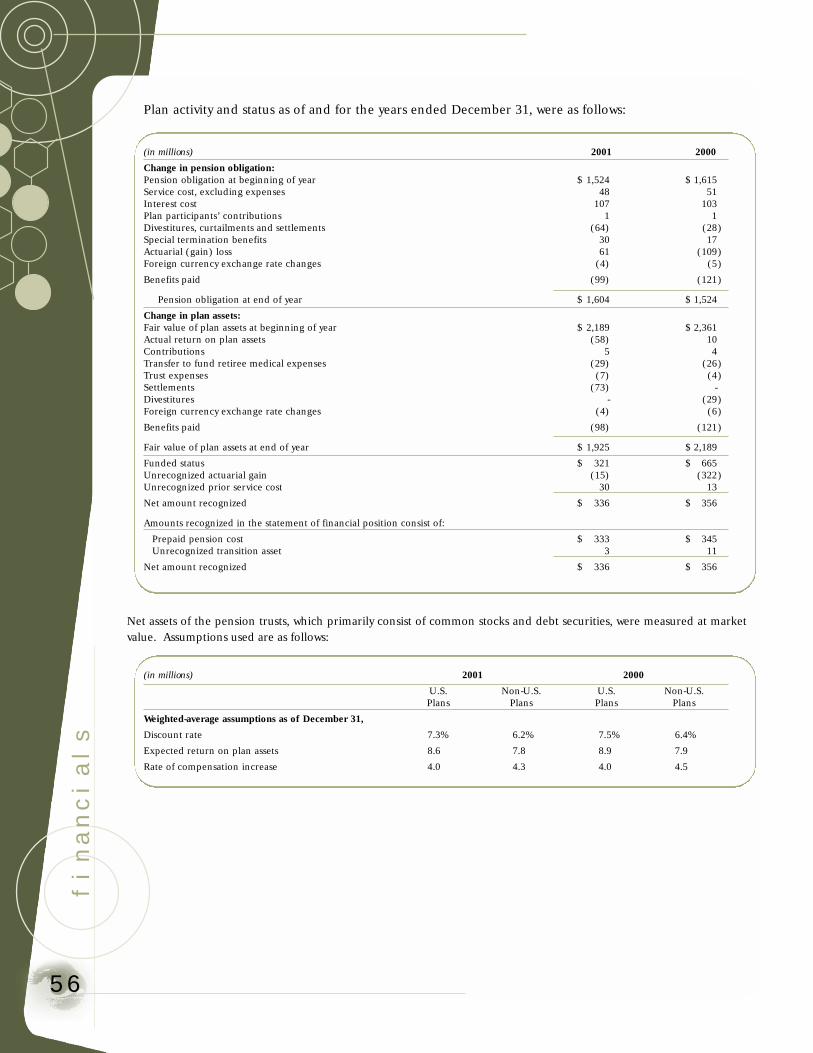
financials
56
(in millions) 2001 2000
Change in pension obligation:Pension obligation at beginning of year $ 1,524 $ 1,615Service cost, excluding expenses 48 51Interest cost 107 103Plan participants’ contributions 1 1Divestitures, curtailments and settlements (64) (28)Special termination benefits 30 17Actuarial (gain) loss 61 (109)Foreign currency exchange rate changes (4) (5)
Benefits paid (99) (121)
Pension obligation at end of year $ 1,604 $ 1,524
Change in plan assets:Fair value of plan assets at beginning of year $ 2,189 $ 2,361Actual return on plan assets (58) 10Contributions 5 4Transfer to fund retiree medical expenses (29) (26)Trust expenses (7) (4)Settlements (73) -Divestitures - (29)Foreign currency exchange rate changes (4) (6)
Benefits paid (98) (121)
Fair value of plan assets at end of year $ 1,925 $ 2,189
Funded status $ 321 $ 665Unrecognized actuarial gain (15) (322)Unrecognized prior service cost 30 13
Net amount recognized $ 336 $ 356
Amounts recognized in the statement of financial position consist of:
Prepaid pension cost $ 333 $ 345Unrecognized transition asset 3 11
Net amount recognized $ 336 $ 356
Net assets of the pension trusts, which primarily consist of common stocks and debt securities, were measured at marketvalue. Assumptions used are as follows:
(in millions) 2001 2000
U.S. Non-U.S. U.S. Non-U.S.Plans Plans Plans Plans
Weighted-average assumptions as of December 31,
Discount rate 7.3% 6.2% 7.5% 6.4%
Expected return on plan assets 8.6 7.8 8.9 7.9
Rate of compensation increase 4.0 4.3 4.0 4.5
Plan activity and status as of and for the years ended December 31, were as follows:

57
The Company transferred excess pen-sion plan assets of $29 million and $26million in 2001 and 2000, respectivelyto fund retiree medical expenses asallowed by U.S. tax regulations.
The Company has a noncontributory,unfunded pension plan which pro-vides supplemental defined benefits toU.S. employees whose benefits underthe qualified pension plan are limitedby the Employee Retirement SecurityAct of 1974 and the Internal RevenueCode. These employees must meetage and length of service require-ments. Pension cost determined inaccordance with plan provisions was$17 million in 2001, $15 million in2000 and $14 million in 1999. Pension
benefit payments for this plan were$12 million in 2001, $10 million in2000 and $11 million in 1999.
The Company has a nonqualified trust,referred to as a “rabbi” trust, to fundbenefit payments under this pensionplan. Rabbi trust assets are subject tocreditor claims under certain condi-tions and are not the property ofemployees. Therefore, they areaccounted for as corporate assets andare classified as other non-currentassets. Assets held in trust at December31, 2001 and 2000 totaled $56 millionand $64 million, respectively.
The status of this plan at year end wasas follows:
(in millions) 2001 2000
Change in pension obligation:Pension obligation at beginning of year $ 132 $ 124Service cost 2 2Interest cost 10 9Actuarial gains 13 7Benefits paid (12) (10)
Pension obligation at end of year $ 145 $ 132
(in millions) 2001 2000
Postretirement health care and life insurance benefits $ 441 $ 447Unfunded supplemental pension plan (see Note 10) 123 84Post-employment benefits 28 28Unfunded foreign pension liabilities 18 24Other 3 36
Total $ 613 $ 619
Pension benefit obligations for thisplan were determined from actuarialvaluations using an assumed dis-count rate of 7.25% and 7.5% atDecember 31, 2001 and 2000, respec-tively, and an assumed long-term rateof compensation increase of 4% and5% in 2001 and 2000, respectively.
In 1997, the Company instituted anon-qualified savings plan for eligi-ble employees in the United States.The purpose of the plan is to provideadditional retirement savings bene-fits beyond the otherwise determinedsavings benefits provided by theRohm and Haas Company EmployeeStock Ownership and Savings Plan(the “Savings Plan”). Each partici-pant’s contributions will be notional-ly invested in the same investmentfunds as the participant has electedfor investment in his or her SavingsPlan account. For most participants,the Company will contribute anotional amount equal to 60% of thefirst 6% of the amount contributedby the participant. The Company’smatching contributions will be allo-cated to deferred stock units. At thetime of distribution, each deferredstock unit will be distributed as oneshare of Rohm and Haas companycommon stock. Contributions to thisplan were $2 million in each of 2001and 2000.
Note 11: Employee Benefits
The Company provides health careand life insurance benefits undernumerous plans for substantially allof its domestic retired employees, forwhich the Company is self-insured.In general, employees who have at
least 15 years of service and are 60years of age are eligible for continu-ing health and life insurance cover-age. Retirees contribute toward thecost of such coverage.

financials
58
The status of the plans at year end was as follows:
The accrued postretirement benefit obligation is recorded in “accrued liabilities” (current) and “employee benefits”(non-current).
Net periodic postretirement benefit cost includes the following components:
The weighted average discount rate used to estimate the accumulated postretirement benefit obligation was 7.25% atDecember 31, 2001 and 7.50% at December 31, 2000.
(in millions) 2001 2000
Change in benefit obligation:Benefit obligation at beginning of year $ 394 $ 429Service cost 7 7Interest cost 32 27Contributions 2 -Divestitures, curtailments and settlements - (6)Amendments 3 (1)Special termination benefits - 1Actuarial (gain) loss 64 (25)Benefits paid (40) (38)
Benefit obligation at end of year 462 394Unrecognized prior service cost 7 8Unrecognized actuarial loss 5 66
Total accrued postretirement benefit obligation $ 474 $ 468
(in millions) 2001 2000 1999
Components of net periodic postretirement costService cost $ 7 $ 7 $ 7Interest cost 32 27 23Net amortization (2) (3) (3)
Net periodic postretirement cost $ 37 $ 31 $ 27
The calculation of the accumulatedpostretirement benefit obligationassumes 9% and 5% annual rates ofincrease in the health care cost trendrate for 2001 and 2000, respectively.The Company’s plan limits its costfor health care coverage to an
increase of 10% or less each year,subject ultimately to a maximum costequal to double the 1992 cost level.Increases in retiree health care costsin excess of these limits will beassumed by retirees.
Assumed health care cost trend rateshave a significant effect on theamounts reported for the health careplans. A one-percentage-point changein assumed health care cost trend rateswould have approximately the follow-ing effects:
1-Percentage 1-PercentagePoint Increase Point Decrease
(in millions) 2001 2000 2001 2000
Effect on total of service and interest cost components $ 1 $ 1 $ (1) $ (1)
Effect on post retirement benefit obligation 11 12 (11) (13)
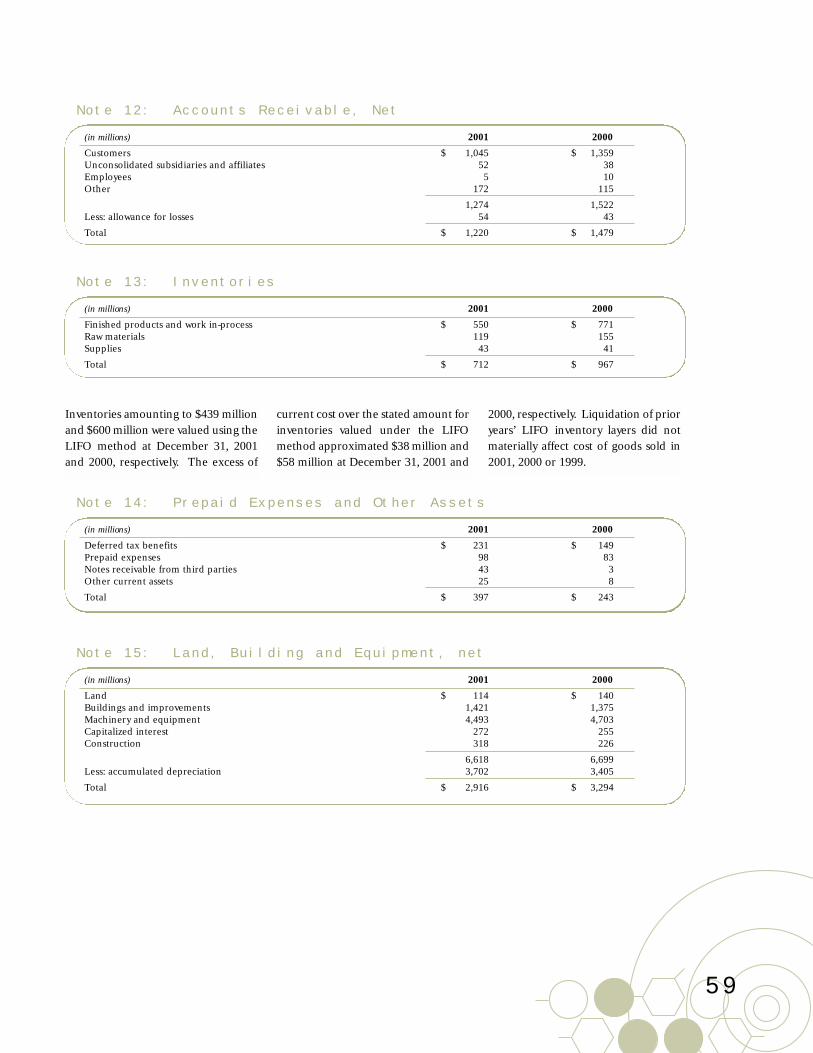
59
Note 12: Accounts Receivable, Net
(in millions) 2001 2000
Customers $ 1,045 $ 1,359Unconsolidated subsidiaries and affiliates 52 38Employees 5 10Other 172 115
1,274 1,522Less: allowance for losses 54 43
Total $ 1,220 $ 1,479
Note 13: Inventories
(in millions) 2001 2000
Finished products and work in-process $ 550 $ 771Raw materials 119 155Supplies 43 41
Total $ 712 $ 967
Inventories amounting to $439 millionand $600 million were valued using theLIFO method at December 31, 2001and 2000, respectively. The excess of
current cost over the stated amount forinventories valued under the LIFOmethod approximated $38 million and$58 million at December 31, 2001 and
2000, respectively. Liquidation of prioryears’ LIFO inventory layers did notmaterially affect cost of goods sold in2001, 2000 or 1999.
Note 14: Prepaid Expenses and Other Assets
(in millions) 2001 2000
Deferred tax benefits $ 231 $ 149Prepaid expenses 98 83Notes receivable from third parties 43 3Other current assets 25 8
Total $ 397 $ 243
Note 15: Land, Building and Equipment, net
(in millions) 2001 2000
Land $ 114 $ 140Buildings and improvements 1,421 1,375Machinery and equipment 4,493 4,703Capitalized interest 272 255Construction 318 226
6,618 6,699Less: accumulated depreciation 3,702 3,405
Total $ 2,916 $ 3,294

financials
60
The principal lives (in years) used indetermining depreciation rates ofvarious assets are: buildings andimprovements (10-50); machineryand equipment (5-20); automobiles,trucks and tank cars (3-10); furnitureand fixtures, laboratory equipmentand other assets (5-10).
Gross book values of assets depreciatedby accelerated methods totaled $708million and $854 million at December31, 2001 and 2000, respectively. Assetsdepreciated by the straight-linemethod totaled $5,478 million and$5,479 million at December 31, 2001and 2000, respectively.
In 2001, 2000 and 1999 respectively,interest costs of $17 million, $14 mil-lion and $12 million were capitalizedand added to the gross book value ofland, buildings and equipment.Amortization of such capitalizedcosts included in depreciationexpense was $15 million in 2001,2000 and 1999.
Long-lived assets are reviewed forimpairment whenever events orchanges in circumstances indicatethat the carrying amount of an assetmay not be recoverable. Recover-ability of assets to be held and used ismeasured by a comparison of the car-
rying amount of an asset to futurenet cash flows expected to be gener-ated by the asset. If such assets areconsidered to be impaired, theimpairment to be recognized ismeasured by the amount by whichthe carrying amount of the assetsexceeds the fair value of the assets.Assets to be disposed of are reportedat the lower of the carrying amountor fair value less cost to sell.
During 2001, the Company com-menced a restructuring of its opera-tions. Certain buildings and equip-ment were considered impaired andwere written down to their net realiz-able value (see Note 5).
Note 16: Goodwill and Other Intangible Assets, Net
(in millions) Life (years) 2001 2000
Goodwill 40 $ 2,339 $ 2,333Customer lists 40 1,158 1,152Tradename 40 649 649Developed technology 13 to 18 451 451Workforce 11 to 16.5 148 148Patents, license agreements and other 101 127
4,846 4,860Less: accumulated amortization 430 274
Total $ 4,416 $ 4,586
Amortization expense for goodwilland other intangibles was $156 mil-
lion, $159 million and $83 millionfor 2001, 2000 and 1999, respectively.
All intangibles are amortized on astraight line basis.
Note 17: Other Assets
(in millions) 2001 2000
Prepaid pension cost (see Note 10) $ 333 $ 345Rabbi trust assets (see Note 10) 56 64Other non-current assets 56 56
Total $ 445 $ 465
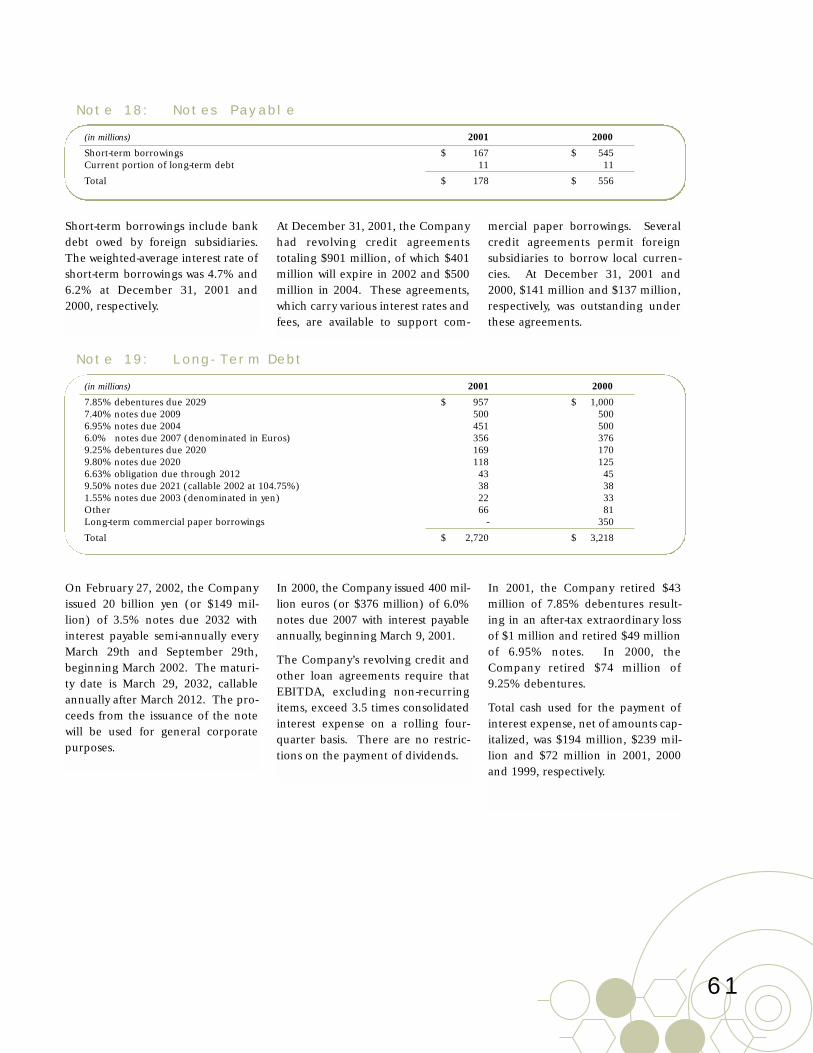
61
Note 18: Notes Payable
(in millions) 2001 2000
Short-term borrowings $ 167 $ 545Current portion of long-term debt 11 11
Total $ 178 $ 556
Short-term borrowings include bankdebt owed by foreign subsidiaries.The weighted-average interest rate ofshort-term borrowings was 4.7% and6.2% at December 31, 2001 and2000, respectively.
At December 31, 2001, the Companyhad revolving credit agreementstotaling $901 million, of which $401million will expire in 2002 and $500million in 2004. These agreements,which carry various interest rates andfees, are available to support com-
mercial paper borrowings. Severalcredit agreements permit foreignsubsidiaries to borrow local curren-cies. At December 31, 2001 and2000, $141 million and $137 million,respectively, was outstanding underthese agreements.
Note 19: Long-Term Debt
(in millions) 2001 2000
7.85% debentures due 2029 $ 957 $ 1,0007.40% notes due 2009 500 5006.95% notes due 2004 451 5006.0% notes due 2007 (denominated in Euros) 356 3769.25% debentures due 2020 169 1709.80% notes due 2020 118 1256.63% obligation due through 2012 43 459.50% notes due 2021 (callable 2002 at 104.75%) 38 381.55% notes due 2003 (denominated in yen) 22 33Other 66 81Long-term commercial paper borrowings - 350
Total $ 2,720 $ 3,218
On February 27, 2002, the Companyissued 20 billion yen (or $149 mil-lion) of 3.5% notes due 2032 withinterest payable semi-annually everyMarch 29th and September 29th,beginning March 2002. The maturi-ty date is March 29, 2032, callableannually after March 2012. The pro-ceeds from the issuance of the notewill be used for general corporatepurposes.
In 2000, the Company issued 400 mil-lion euros (or $376 million) of 6.0%notes due 2007 with interest payableannually, beginning March 9, 2001.
The Company’s revolving credit andother loan agreements require thatEBITDA, excluding non-recurringitems, exceed 3.5 times consolidatedinterest expense on a rolling four-quarter basis. There are no restric-tions on the payment of dividends.
In 2001, the Company retired $43million of 7.85% debentures result-ing in an after-tax extraordinary lossof $1 million and retired $49 millionof 6.95% notes. In 2000, theCompany retired $74 million of9.25% debentures.
Total cash used for the payment ofinterest expense, net of amounts cap-italized, was $194 million, $239 mil-lion and $72 million in 2001, 2000and 1999, respectively.

financials
62
Long-term debt maturing in the next five years is:
(in millions)
2002 $ 11 2005 $ 11
2003 $ 38 2006 $ 11
2004 $ 467
Note 20: Accrued Liabilities
(in millions) 2001 2000
Salaries and wages $ 99 $ 173Interest 94 106Sale incentive programs and other selling accruals 73 94Taxes, other than income taxes 65 60Employee benefits 46 45Reserve for restructuring (see Note 5) 43 33Insurance and legal 36 42Reserve for environmentalremediation (see Note 25) 20 40
Other 110 138
Total $ 586 $ 731
Note 21: Other Liabilities
(in millions) 2001 2000
Reserves for environmental remediation (Note 25) $ 136 $ 145Deferred revenue on supply contracts 49 42Other 97 79
Total $ 282 $ 266
Note 22:
Stockholders' Equity
Dividends paid on ESOP shares, usedas a source of funds for meeting theESOP financing obligation, were $13.8million in 2001 and $13.2 million in2000. These dividends were recordednet of the related U.S. tax benefits.The number of ESOP shares not allo-cated to plan members at December31, 2001 and 2000 were 11.6 millionand 12.3 million, respectively.
The Company recorded compensa-tion expense of $6 million in 2001,2000 and 1999 for ESOP shares allo-cated to plan members. TheCompany expects to record annualcompensation expense at approxi-mately this level over the next 19years as the remaining $113 millionof ESOP shares are allocated. Theallocation of shares from the ESOP isexpected to fund a substantial por-tion of the Company's future obliga-tion to match employees savings plancontributions as the market price ofRohm and Haas stock appreciates.
The Company repurchased aninsignificant number of shares in2001, 2000 and 1999.
In 1999, the Company redeemed its$2.75 million cumulative convertiblepreferred stock under the terms ofthe issue.

63
(In millions, except per share amounts) Earnings Shares Per-Share(Numerator) (Denominator) Amount
2001Net earnings available to common shareholders $ 395 220.2 $ 1.79Dilutive effect of options(a) - -Diluted earnings per share $ 395 220.2 $ 1.79
2000Net earnings available to common shareholders $ 354 219.5 $ 1.61Dilutive effect of options(a) - 1Diluted earnings per share $ 354 220.5 $ 1.61
1999Net earnings available to common shareholders $ 247 192.6 $ 1.28Effect of convertible preferred stock 2 -Effect of accelerated stock repurchase program - 1.3Dilutive effect of options(a) - 1.8Diluted earnings per share $ 249 195.7 $ 1.27
(a) For the year ended December 31, 2001, the Company had .6 million, anti-dilutive stock options; the exercise price of the stock optionswas greater than the average market price for the year ended December 31, 2001. There were no anti-dilutive stock options for theyears ended December 31, 2000 and 1999.
The reconciliation from basic to diluted earnings per share is as follows:
Shareholders’ Rights PlanIn 2000 the Company adopted ashareholders’ rights plan under-which the Board of Directorsdeclared a dividend of one preferredstock purchase right (“right”) foreach outstanding share of theCompany’s common stock held ofrecord as of the close of business onNovember 3, 2000. The rights ini-tially are deemed to be attached tothe common shares and detach andbecome exercisable only if (with cer-tain exceptions and limitations) aperson or group has obtained orattempts to obtain beneficial owner-ship of 15% or more of the outstand-ing shares of the Company’s com-mon stock or is otherwise deter-mined to be an “acquiring person” bythe Board of Directors. Each right, ifand when it becomes exercisable, ini-tially will entitle holders of the rightsto purchase one one-thousandth(subject to adjustment) of a share ofSeries A Junior ParticipatingPreferred Stock for $150 per oneone-thousandth of a Preferred Share,subject to adjustment. Each holderof a right (other than the acquiringperson) is entitled to receive a num-ber of shares of the Company’s com-mon stock with a market value equal
to two times the exercise price, or$300. The rights expire, unless earli-er exercised or redeemed, onDecember 31, 2010.
Note 23: Stock
Compensation Plans
As permitted under SFAS No. 123,"Accounting for Stock-BasedCompensation," the Company con-tinues to apply the provisions of APBOpinion No. 25. Accordingly, nocompensation expense has been rec-ognized for the fixed stock optionplans. For restricted stock awards,compensation expense equal to thefair value of the stock on the date ofthe grant is recognized over the five-year vesting period. Total compensa-tion expense for restricted stock was$3 million, $2 million and $1 millionin 2001, 2000 and 1999, respectively.Had compensation expense for theCompany's fixed stock option plansbeen determined in accordance withSFAS No. 123, the Company's netearnings would have been reducedto $375 million in 2001, $345 millionin 2000, and $146 million in 1999.Basic earnings per common sharewould have been reduced to $1.70,$1.57, and $.75 in 2001, 2000 and1999, respectively. Diluted earnings
per common share would have beenreduced to $1.70, $1.57, and $.75 in2001, 2000 and 1999, respectively.
1999 Stock PlanUnder this plan, as amended in 2001,the Company may grant as options orrestricted stock up to 19 millionshares of common stock with nomore than 3 million of these sharesgranted to any employee as optionsover a five-year period. No morethan 50% of shares in this plan canbe issued as restricted stock. Awardsunder this plan may be granted onlyto employees of the Company.Options granted under this plan in2001 and 2000 were granted at thefair market value on the date of grantand generally vest over three yearsexpiring within 10 years of the grantdate. Shares of restricted stockissued in 2001 totaled 98,069 at aweighted average grant-date fairvalue of $36.26 per share.
Non-Employee Directors' Stock Plan of 1997Under the 1997 Non-EmployeeDirectors Stock Plan, directorsreceive half of their annual retainerin deferred stock. Each share ofdeferred stock represents the right toreceive one share of company com-

financials
64
mon stock upon leaving the board.Directors may also elect to defer allor part of their cash compensationinto deferred stock. Annual com-pensation expense is recorded equalto the number of deferred stockshares awarded multiplied by themarket value of the Company's com-mon stock on the date of award.Additionally, directors receive divi-dend equivalents on each share ofdeferred stock, payable in deferredstock, equal to the dividend paid ona share of common stock.
Restricted Stock Plan of 1992Under this plan, executives were paidsome or all of their bonuses in sharesof restricted stock instead of cash.Most shares vest after five years. Theplan covers an aggregate 450,000shares of common stock. In 1999,73,105 shares of restricted stock weregranted at weighted-average grant-date fair values of $31 per share.
Fixed Stock Option PlansThe Company has granted stockoptions to key employees under its
Stock Option Plans of 1984 and 1992.Options granted pursuant to theplans are priced at the fair marketvalue of the common stock on thedate of the grant. Options vest afterone year and most expire 10 yearsfrom the date of grant. No furthergrants can be made under either plan.
The status of the Company's stockoptions as of December 31 is present-ed below:
2001 2000 1999
Weighted- Weighted- Weighted-Average Average Average
Shares Exercise Shares Exercise Shares Exercise(000s) Price (000s) Price (000s) Price
Outstanding at beginning of year 5,696 $ 28.56 5,419 $ 25.26 2,417 $ 23.58
Granted 2,910 33.19 1,061 40.64 6,545 22.26
Canceled (117) 35.44 (51) 34.65 (709) 18.26
Exercised (454) 20.37 (733) 20.39 (2,834) 18.65
Outstanding at end of year 8,035 30.60 5,696 28.56 5,419 25.26
Options exercisable at year end 4,612 27.75 4,655 25.86 4,993 25.14
Weighted-average fair value of options granted during the year $ 10.74 $ 12.62 $ 24.38
The Black-Scholes option pricingmodel was used to estimate the fairvalue for each grant made under the
Rohm and Haas plan during the year.The following are the weighted-aver-
age assumptions used for all sharesgranted in the years indicated:
2001 2000
Dividend yield 2.42% 1.89%Volatility 33.82 28.85Risk-free interest rate 4.95 6.59
Time to exercise 6 years 6 years

65
The following table summarizes information about stock options outstanding and exercisable at December 31, 2001:
Options Outstanding Options Exercisable
Weighted- Weighted- Weighted-Range Number Average Average Number AverageOf Outstanding Remaining Exercise Exercisable Exercise
Exercise Price (000s) Life Price (000s) Price
$11 to 16 97 7.4 years $13.67 97 $13.67$18 to 25 1,663 6.0 $21.69 1,663 $21.69$26 to 35 4,775 8.0 $31.28 2,232 $29.46$36 to 45 1,500 8.2 $39.40 620 $40.06
8,035 4,612
Note 24: Leases
The Company leases certain proper-ties and equipment used in its opera-tions, primarily under operating leas-es. Most lease agreements requireminimum lease payments plus a con-
tingent rental based on equipmentusage and escalation factors. Totalnet rental expense incurred underoperating leases amounted to $73million in 2001, $80 million in 2000and $79 million in 1999.
Total future minimum lease pay-ments under the terms of non-cance-lable operating leases are as follows:
(in millions)
2002 $ 50 2005 $ 18
2003 43 2006 16
2004 29 Thereafter 72
Note 25: Contingent
Liabilities,
Guarantees and
Commitments
Environmental There is a risk of environmentalimpact in chemical manufacturingoperations. The Company's environ-mental policies and practices aredesigned to ensure compliance withexisting laws and regulations and tominimize the possibility of significantenvironmental impact.
The laws and regulations underwhich the Company operates requiresignificant expenditures for capitalimprovements, the operation of envi-ronmental protection equipmentand remediation. Future develop-ments and even more stringent envi-ronmental regulations may requirethe Company to make additionalunforeseen environmental expendi-tures. The Company's major com-petitors are confronted by substan-
tially similar environmental risks andregulations.
The Company is a party in various gov-ernment enforcement and privateactions associated with former wastedisposal sites, many of which are onthe U.S. Environmental ProtectionAgency's (EPA) National Priority Listand has been named a potentiallyresponsible party at approximately 140inactive waste sites where remediationcosts have been or may be incurredunder the Federal ComprehensiveEnvironmental Response, Compen-sation and Liability Act and similarstate statutes. In some of these casesthe Company may also be held respon-sible for alleged property damage.The Company has provided for futurecosts at certain of these sites. TheCompany is also involved in correctiveactions at some of its manufacturingfacilities.
The Company considers a broadrange of information when determin-
ing the amount of its remediationaccruals, including available factsabout the waste site, existing and pro-posed remediation technology andthe range of costs of applying thosetechnologies, prior experience, gov-ernment proposals for this or similarsites, the liability of other parties, theability of other principally responsibleparties to pay costs apportioned tothem and current laws and regula-tions. These accruals are assessedquarterly and updated as additionaltechnical and legal informationbecomes available. However, at cer-tain sites, the Company is unable, dueto a variety of factors, to assess andquantify the ultimate extent of itsresponsibility for study and remedia-tion costs. Major sites for whichreserves have been provided are thenon-company-owned Lipari,Woodland and Kramer sites in NewJersey, Whitmoyer in Pennsylvaniaand company-owned sites in Bristoland Philadelphia, Pennsylvania and

financials
66
Houston, Texas. The Morton acquisi-tion introduced two major sites: MossPoint, Mississippi and Wood-Ridge,New Jersey.
In Wood-Ridge, New Jersey, Mortonand Velsicol Chemical Corporation("Velsicol") have been held jointlyand severally liable for the cost ofremediation necessary to correctmercury-related environmentalproblems associated with a mercuryprocessing plant on the site prior toits acquisition by Morton. At the dateof acquisition, Morton had disclosedand accrued for certain ongoingstudies, which are expected to becompleted during 2002, with regula-tory decisions expected by the end of2002. In its allocation of the pur-chase price of Morton, the Companyaccrued for additional study costs atDecember 31, 1999 and additionalremediation costs in 2000 based onthe progress of the technical studies.A separate study of probable contam-ination in Berry's Creek, which runsnear the plant site, and of the sur-rounding wetlands is on a timetableyet to be determined. Therefore, theestimated costs of this separate studyand any resulting remediationrequirements have not been consid-ered in the allocation of the Mortonpurchase price. There is muchuncertainty as to what will berequired to address Berry’s Creek butcleanup costs could be very high andthe Company’s share of these costscould be material. The Company'sexposure will also depend upon thecontinued ability of Velsicol and itsindemnitor, Fruit of the Loom, Inc.,which has filed for protection underthe bankruptcy laws, to contribute tothe cost of remediation. In 2001,these parties have stopped payingtheir share of expenses. Ultimately,the Company’s exposure will alsodepend on the results of attempts toobtain contributions from others
believed to share responsibility. Acost recovery action against theseresponsible parties is pending in fed-eral court. This action has beenstayed pending future regulatorydevelopments and the appeal of asummary judgment ruling in favor ofone of the defendants. Settlementshave been reached with some defen-dants for claims considered de min-imis associated with the Wood-Ridgeplant site.
During 1996, the EPA notifiedMorton of possible irregularities inwater discharge monitoring reportsfiled by its Moss Point, Mississippiplant in early 1995. Morton investi-gated and identified other environ-mental issues at the plant. Though atthe date of acquisition Morton hadaccrued for some remediation andlegal costs, the Company revisedthese accruals as part of the alloca-tion of the purchase price of Mortonbased on its discussions with theauthorities and on the informationavailable as of June 30, 2000. In2000, the Company reached agree-ment with the EPA, the Departmentof Justice and the State of Mississippi,resolving these historical environ-mental issues. The agreementreceived court approval in early2001. The final settlement includespayment of $20 million in civil penal-ties, which were paid in the first quar-ter of 2001, $2 million in criminalpenalties, which were paid in thefourth quarter of 2000 and $16 mil-lion in various SupplementalEnvironmental Projects. The accru-als established for this matter weresufficient to cover these and otherrelated costs of the settlement. InDecember 2001, the Company closedthe chemicals portion of the MossPoint facility.
The amount charged to earningsbefore-tax for environmental remedi-ation was $28 million and $4 million
for the years ended December 31,2001 and 1999, respectively, and theamount for 2000 was immaterial.The reserves for remediation were$156 million and $185 million atDecember 31, 2001 and 2000, respec-tively, and are recorded as “other lia-bilities” (current and long-term).These reserves include amountsresulting from the allocation of thepurchase price of Morton. TheCompany is pursuing lawsuits overinsurance coverage for environmen-tal liabilities. It is the Company'spractice to reflect environmentalinsurance recoveries in results ofoperations for the quarter in whichthe litigation is resolved through set-tlement or other appropriate legalprocesses. Resolutions typicallyresolve coverage for both past andfuture environmental spending. TheCompany settled with several of itsinsurance carriers and recordedincome before-tax of approximately$13 million, $1 million and $17 mil-lion for the years ended December31, 2001, 2000 and 1999, respectively.
In addition to accrued environmen-tal liabilities, the Company had rea-sonably possible loss contingenciesrelated to environmental matters ofapproximately $73 million and $73million at December 31, 2001 and2000, respectively. Further, theCompany has identified other sites,including its larger manufacturingfacilities, where additional futureenvironmental remediation may berequired, but these loss contingen-cies cannot reasonably be estimatedat this time. These matters involvesignificant unresolved issues, includ-ing the number of parties foundliable at each site and their ability topay, the outcome of negotiationswith regulatory authorities, the alter-native methods of remediation andthe range of costs associated withthose alternatives. The Company
67
believes that these matters, when ulti-mately resolved, which may be overan extended period of time, will nothave a material adverse effect on theconsolidated financial position orconsolidated cash flows of theCompany, but could have a materialadverse effect on consolidated resultsof operations or cash flows in anygiven period.
Capital spending for new environ-mental protection equipment was$26 million in 2001 versus $27 mil-lion in 2000 and $30 million on 1999.Spending for 2002 and 2003 isexpected to be $26 million and $21million, respectively. Capital expen-ditures in this category include proj-ects whose primary purposes are pol-lution control and safety, as well asenvironmental aspects of projects inother categories that are intendedprimarily to improve operations orincrease plant efficiency. TheCompany expects future capitalspending for environmental protec-tion equipment to be consistent withprior-year spending patterns. Capitalspending does not include the cost ofenvironmental remediation of wastedisposal sites.
Cash expenditures for waste disposalsite remediation were $51 million in2001, $33 million in 2000 and $27million in 1999. The expendituresfor remediation are charged againstaccrued remediation reserves. Thecost of operating and maintainingenvironmental facilities was $129 mil-lion, $114 million and $107 millionin 2001, 2000 and 1999 respectively,and was charged against current-yearearnings.
Other LitigationThere has been increased publicityabout asbestos liabilities faced by man-ufacturing companies. As a result of
the bankruptcy of most major asbestosproducers, plaintiffs’ attorneys areincreasing their focus on peripheraldefendants. The Company believes ithas adequate reserves and insuranceand does not believe its asbestos expo-sure is material.
There are pending lawsuits filedagainst Morton related to employeeexposure to asbestos at a manufac-turing facility in Weeks Island,Louisiana with additional lawsuitsexpected. The Company expectsthat most of these cases will be dis-missed because they are barredunder worker’s compensation laws;however, cases involving asbestos-caused malignancies may not bebarred under Louisiana law.Subsequent to the Morton acquisi-tion, the Company commissionedmedical studies to estimate possiblefuture claims and recorded accrualsbased on the results. Morton has alsobeen sued in connection with the for-mer Friction Division of the formerThiokol Corporation which mergedwith Morton in 1982. Settlements todate total $350 thousand and manycases have closed with no payment.These cases are fully insured. Inaddition, like most manufacturingcompanies, Rohm and Haas hasbeen sued, generally as one of manydefendants, by non-employees whoallege exposure to asbestos on theCompany premises.
The Company and its subsidiaries arealso parties to litigation arising out ofthe ordinary conduct of its business.Recognizing the amounts reserved forsuch items and the uncertainty of theultimate outcomes, it is theCompany’s opinion that the resolu-tion of all these pending lawsuits,investigations and claims will not havea material adverse effect, individuallyor in the aggregate, upon the results
of operations and the consolidatedfinancial position of the Company.
Note 26: New
Accounting
Pronouncements
Accounting for DerivativeInstruments and Other HedgingActivitiesOn January 1, 2001, the Companyadopted SFAS No.133, "Accountingfor Derivative Instruments andHedging Activities," which establish-es a new model for the accountingand reporting of derivative and hedg-ing transactions. Additionally, in July2001 the Company adopted DIGIssue G20, “Assessing and Measuringthe Effectiveness of a PurchasedOption Used in a Cash Flow Hedge.”
This standard requires that all deriva-tive instruments be reported on thebalance sheet at fair value. For instru-ments designated as fair value hedges,changes in the fair value of the instru-ment will largely be offset on theincome statement by changes in thefair value of the hedged item. Forinstruments designated as cash flowhedges, the effective portion of thehedge is reported in other compre-hensive income until it is assigned toearnings in the same period in whichthe hedged item has an impact onearnings. For instruments designatedas a hedge of net investment in for-eign operating units not using theU.S. Dollar as its functional currency,changes in the fair value of the instru-ment will be offset in other compre-hensive income to the extent that theyare effective as economic hedges.Changes in the fair value of derivativeinstruments, including embeddedderivatives, that are not designated asa hedge will be recorded each periodin current earnings along with anyineffective portion of hedges.
financials
68
Using market valuations for deriva-tives held as of December 31, 2000,the Company recorded a $6 millionafter-tax cumulative income effect toaccumulated other comprehensiveincome, and a charge to net incomeof $2 million, to recognize at fairvalue all derivative instruments onJanuary 1, 2001. Changes in theCompany's derivative instrumentportfolio or changes in the marketvalues of this portfolio could have amaterial effect on accumulated othercomprehensive income.
The Company has concluded thatthe adoption of SFAS No. 133 will notmaterially change management’s riskpolicies and practices nor will com-pliance with the standard materiallyimpact the reported results fromoperations.
Business CombinationsSFAS No. 141, “Business Combi-nations,” which is effective for allbusiness combinations completedafter June 30, 2001, mandates that allbusiness combinations be accountedfor by only the purchase method(thereby eliminating the option forpooling of interests); segregation ofother intangible assets from goodwillif they meet the contractual legal cri-terion or the separability criterion;and expanded disclosure require-ments on the primary reasons for abusiness combination and the alloca-tion of the purchase price to theassets and liabilities assumed bymajor balance sheet caption.
Goodwill and Other IntangibleAssetsSFAS No. 142, “Goodwill and OtherIntangible Assets,” is effective for fis-cal years beginning after December15, 2001. SFAS No. 142, which theCompany adopted on January 1,2002, requires the Company to ceaseamortization of goodwill and certain
indefinite-lived intangible assets andevaluate goodwill and intangibleassets for impairment. In accor-dance with the Statement, theCompany reviewed its intangibleassets in order to identify intangibleassets with indefinite lives which willno longer be amortized and intangi-ble assets which may be reclassified asgoodwill and thus no longer beamortized. In addition the Companyis in the process of assessing theremaining useful lives of intangibleassets which will continue to be sub-ject to amortization. As of January 1,2002, the Company ceased amortiza-tion of goodwill and intangiblesdeemed to have indefinite lives andreclassed certain intangibles inaccordance with the provisions ofthis statement.
The evaluation of the Company’sgoodwill is performed at the report-ing unit level and is a two-stepprocess. When evaluating goodwillfor impairment, the Statementrequires the Company to first com-pare a reporting unit’s book value toits fair value. To the extent that thebook value exceeds fair value, theCompany is required to perform asecond step wherein a reportingunit’s assets and liabilities are fair val-ued. To the extent that a reportingunit’s book value of goodwill exceedsits implied fair value of goodwill,impairment exists and must be rec-ognized. The implied fair value ofgoodwill is calculated as the fair valueof a reporting unit in excess of thefair value of all non-goodwill assets inthe reporting unit. Net book valuesof the recorded assets and liabilitieshave been calculated for each of theCompany’s reporting units. TheCompany is in the process of valuingthese reporting units based primarilyupon the present value of expectedfuture cash flows.
In accordance with SFAS No. 142,the intangible assets which continueto be subject to amortization arebeing reviewed for impairment bythe Company under SFAS No. 144.Intangible assets which are no longersubject to amortization are beingreviewed by the Company in accor-dance with SFAS No. 142 in a one-step process. Impairment is meas-ured as the amount an intangibleasset’s carrying value exceeds its fairvalue. The Company intends to com-plete its evaluation of intangibleassets in accordance with SFAS No.142 no later than June 30, 2002.
The Company’s previous businesscombinations were accounted forusing the purchase method ofaccounting. As of December 31,2001, the net carrying amount ofgoodwill was $2,159 million.Goodwill amortization expense forthe year ended December 31, 2001was $64 million. The Companyintends to complete its evaluation ofgoodwill in accordance with SFASNo. 142 no later than June 30, 2002and expects to recognize an impair-ment loss. The Company continuesto finalize its estimate of the impair-ment loss. Any impairment loss willbe recognized as a cumulative effectof a change in accounting principlein the Company’s consolidated state-ment of operations.
Asset Retirement ObligationsIn June 2001, the Financial AccountingStandards Board (FASB) issued SFASNo. 143, “Accounting for AssetRetirement Obligations”, whichrequires recognition of the fair value ofliabilities associated with the retirementof long-lived assets when a legal obliga-tion to incur such costs arises as a resultof the acquisition, construction, devel-opment and/or the normal operationof a long-lived asset. SFAS No. 143requires that the fair value of a liability

69
for an asset retirement obligation berecognized in the period in which it isincurred if a reasonable estimate of fairvalue can be made. The associatedasset retirement costs are capitalized aspart of the carrying amount of the long-lived asset and subsequently allocatedto expense over the asset’s useful life.SFAS No.143 is effective for fiscal yearsbeginning after December 15, 2002.Management is currently assessing theimpact of the new standard on its finan-cial statements.
Impairment or Disposal of Long-lived AssetsOn January 1, 2002 the Companyadopted SFAS No. 144 “Accounting
for the impairment or Disposal ofLong-Lived Assets.” The Statementprovides new guidance on the recog-nition of impairment losses on long-lived assets to be held and used or tobe disposed of and also broadens thedefinition of what constitutes a dis-continued operation and how theresults of a discontinued operationare to be measured and presented.Management has assessed the impactof the new standard and determinedthere to be no material impact to thefinancial statements.
Note 27: Subsequent
Events
As of March 21, 2002, the Companyrepurchased approximately $76 mil-lion of the 7.85% debentures due onJuly 15, 2029. On February 27, 2002,the Company exercised the calloption on the 9.50% notes due 2021.All of the outstanding notes havebeen called for redemption on April1, 2002 at a redemption price equal to104.75% of the principal amounttogether with interest accrued to thedate of redemption. The repurchasesand redemption will result in an after-tax charge of approximately $6 mil-lion in 2002.
Year Ended December 31, 2001 2000 1999
(millions of dollars)
Deducted from Accounts Receivable -Allowances for losses:Balance at beginning of year $ 43 $ 37 $ 12 Additions charged to earnings 25 14 6 Acquisitions/(Divestitures) 1 2 22 Charge-offs, net of recoveries (15) (10 ) (3 )
Balance at end of year $ 54 $ 43 $ 37
SCHEDULE II
ROHM AND HAAS COMPANY AND SUBSIDIARIES
Valuation and Qualifying Accounts

financials
70
Notes

Notes

V701268
March 2002
Printed in USA
www.rohmhaas com
©Rohm andHaasCompany, 2002