imagej basics - biop -homepage basics.pdf · imagej basics - open source public domain java image...
TRANSCRIPT

Biology Imaging
ImageJ Basics
- open source public domain Java image processing and analysis program inspired by NIH Image for the Macintosh.
- can be used everywhere with Java (Linux, Mac OS 9, Mac OS X and Windows),
-handles several data types and file formats, has an IP toolkit to develop new applets and applications, among other features.
-handles Java plugins and macro language (for more details, see presentation about Image J plugins)
Advantage: Growing numbers of users participate in writing plug-ins for ImageJ and Fiji.
Biology Imaging
Index-Installing ImageJ (windows) and plugins p. 3 - 4
-Memory settings p. 5
-Menu and Tools overview p. 6
-File menu: Opening, importing, saving files p. 7 - 8
-Image menu and Image types p. 9 - 11
-Image visualisation/information p. 12
RGB channel splitting/merging/overlays p. 13
Stacks p. 14 – 15
-Image Adjustments
Brightness/Contrast p. 16
Threshold p. 17
Image Crop/Transform/Rotate/Revert p. 18
-Image quantification
Calibrating image size/ Scale bars p. 19
Histogram and line profile p. 20
ImageJ Region measurements p. 21-22
Biology Imaging
Installation
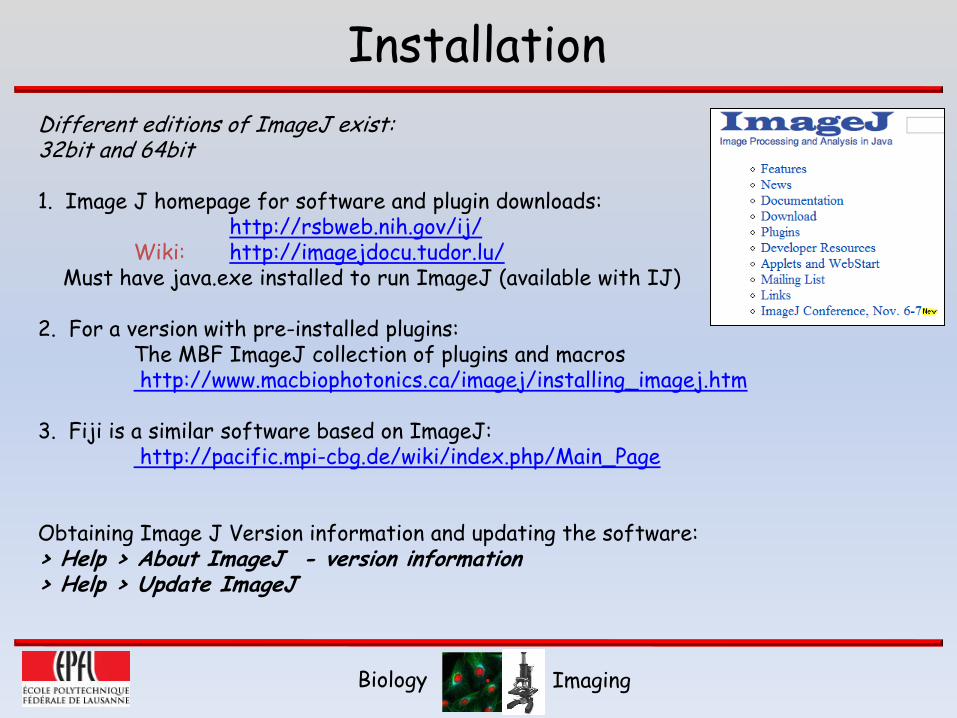
Different editions of ImageJ exist:32bit and 64bit
1. Image J homepage for software and plugin downloads: http://rsbweb.nih.gov/ij/
Wiki: http://imagejdocu.tudor.lu/Must have java.exe installed to run ImageJ (available with IJ)
2. For a version with pre-installed plugins:The MBF ImageJ collection of plugins and macroshttp://www.macbiophotonics.ca/imagej/installing_imagej.htm
3. Fiji is a similar software based on ImageJ:http://pacific.mpi-cbg.de/wiki/index.php/Main_Page
Obtaining Image J Version information and updating the software: > Help > About ImageJ - version information> Help > Update ImageJ
Biology Imaging
Plugins & Macros
Plugins are additional software modules or code which provide the ability to perform specific tasks. Writing macros using the ImageJ macro language allows you tostring a series of commands together to perform batch operations. These can also beconverted to plugins.
Install plugins if required:Download plugins and Save them in ImageJ Plugin folder (program files)Restart ImageJ: Plugins automatically get placed in the Plugins menu
> There is a list of available plugins here: http://rsb.info.nih.gov/ij/plugins/index.html
> There is a plugins collection preorganised in folders available at: http://rsb.info.nih.gov/ij/plugins/collection.html
> Many more are available on the website and from other users. Some people have developed their own collections of plugins and bundled them together. McMaster Biophotonics Institute has a great collection for microscopy:http://rsb.info.nih.gov/ij/plugins/mbf-collection.html
Biology Imaging
ImageJ memory
Set high memory for optimal use
no more than 70% of max Ram
Edit > Options > Memory
Biology Imaging
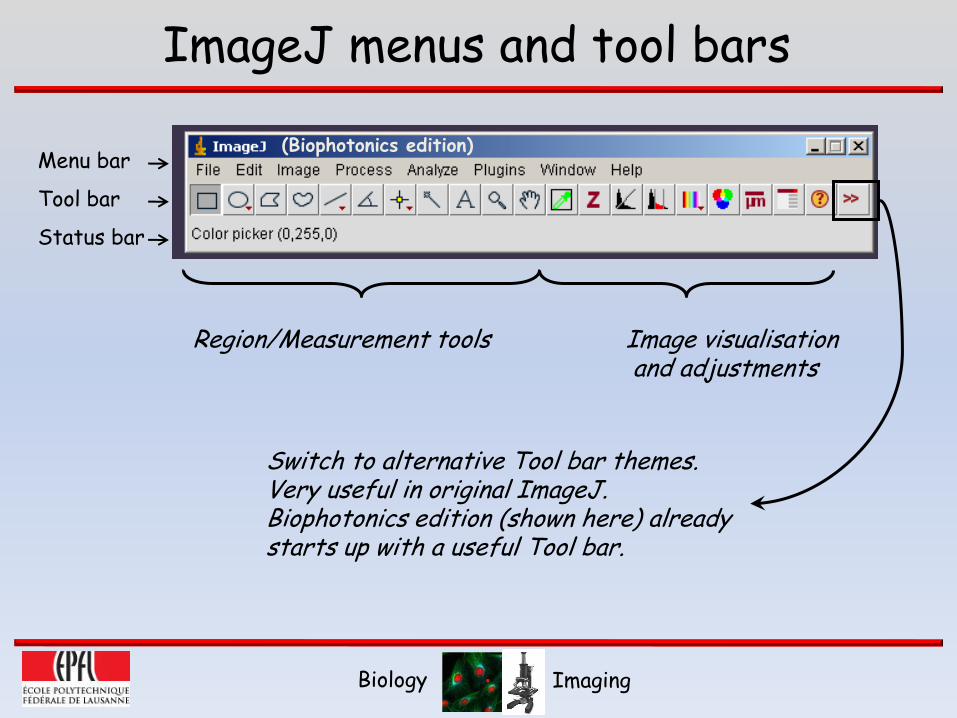
ImageJ menus and tool bars
Menu bar
Tool bar
Status bar
Switch to alternative Tool bar themes.Very useful in original ImageJ.Biophotonics edition (shown here) alreadystarts up with a useful Tool bar.
Region/Measurement tools Image visualisationand adjustments
(Biophotonics edition)

Biology Imaging
File menu: Opening, importing, saving files
Drag and drop file to ImageJ menubar to open file
Openmicroscope image formats: .lei .lsmmany image and video formats: .avi .tif
Import -image sequence…Open and manage stacks/movies
-many file types and text files/results
Save movies as .avi as compressed jpegDrastically reduces file size withoutquality loss (for presentations for ex.)
Save images as .tifA JPEG image degrades each time itis opened, edited and resaved.
Biology Imaging
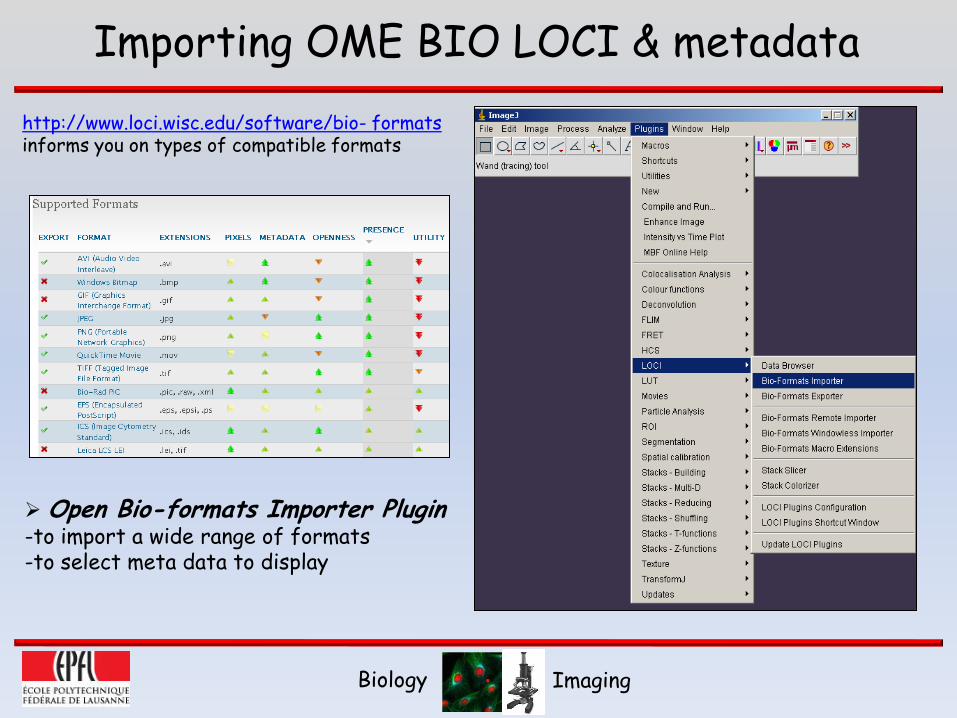
Importing OME BIO LOCI & metadata
http://www.loci.wisc.edu/software/bio- formatsinforms you on types of compatible formats
Open Bio-formats Importer Plugin-to import a wide range of formats-to select meta data to display
Biology Imaging
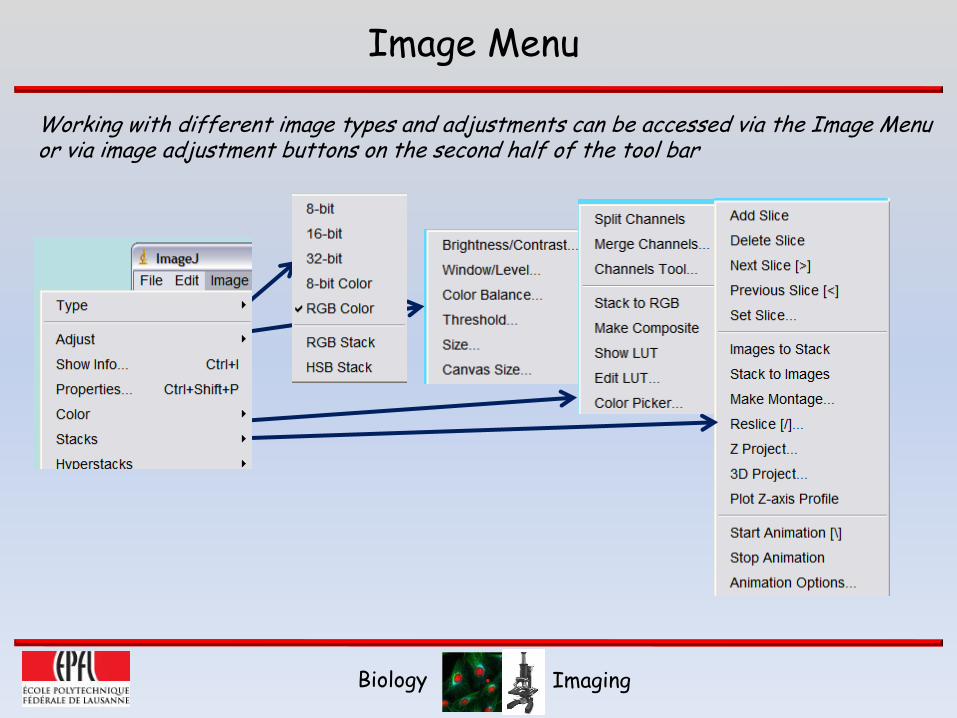
Image Menu
Working with different image types and adjustments can be accessed via the Image Menu or via image adjustment buttons on the second half of the tool bar
Biology Imaging
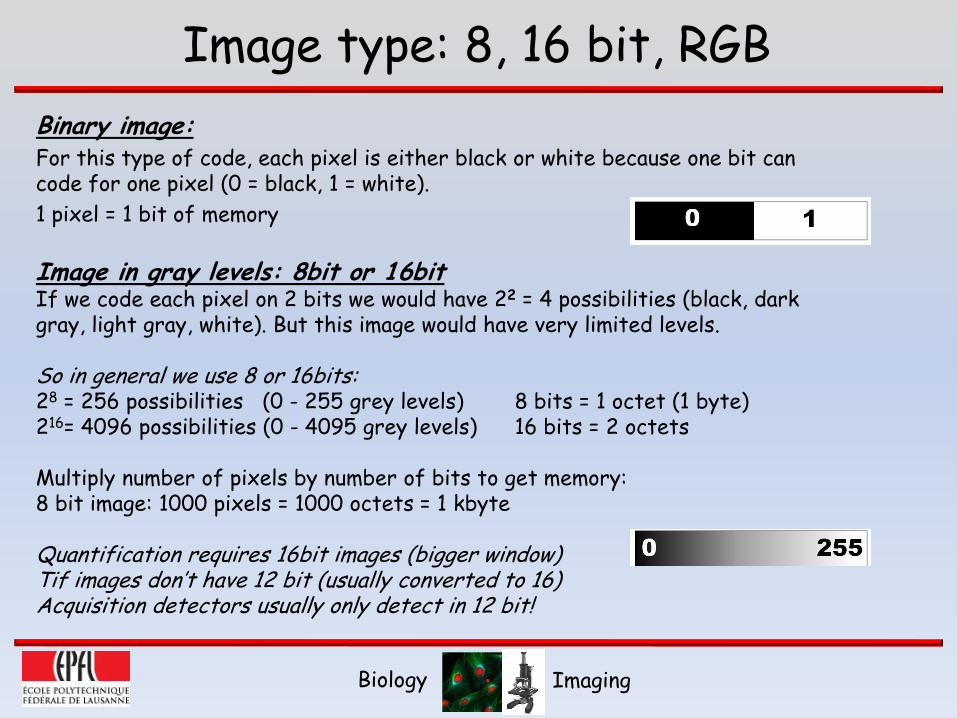
Image type: 8, 16 bit, RGB
Binary image:For this type of code, each pixel is either black or white because one bit cancode for one pixel (0 = black, 1 = white).
1 pixel = 1 bit of memory
Image in gray levels: 8bit or 16bitIf we code each pixel on 2 bits we would have 22 = 4 possibilities (black, darkgray, light gray, white). But this image would have very limited levels.
So in general we use 8 or 16bits:28 = 256 possibilities (0 - 255 grey levels) 8 bits = 1 octet (1 byte)216= 4096 possibilities (0 - 4095 grey levels) 16 bits = 2 octets
Multiply number of pixels by number of bits to get memory:8 bit image: 1000 pixels = 1000 octets = 1 kbyte
Quantification requires 16bit images (bigger window)Tif images don’t have 12 bit (usually converted to 16)Acquisition detectors usually only detect in 12 bit!
Biology Imaging
Image type: greyscale LUTs, RGB
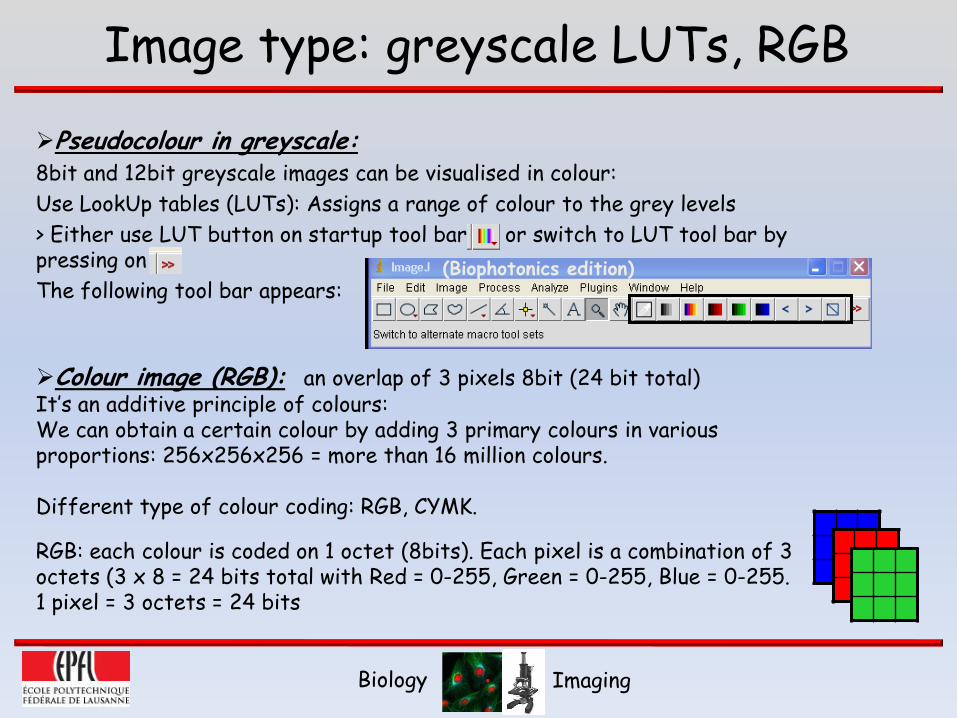
Pseudocolour in greyscale:8bit and 12bit greyscale images can be visualised in colour:
Use LookUp tables (LUTs): Assigns a range of colour to the grey levels
> Either use LUT button on startup tool bar or switch to LUT tool bar by pressing on
The following tool bar appears:
Colour image (RGB): an overlap of 3 pixels 8bit (24 bit total)It’s an additive principle of colours: We can obtain a certain colour by adding 3 primary colours in variousproportions: 256x256x256 = more than 16 million colours.
Different type of colour coding: RGB, CYMK.
RGB: each colour is coded on 1 octet (8bits). Each pixel is a combination of 3 octets (3 x 8 = 24 bits total with Red = 0-255, Green = 0-255, Blue = 0-255.1 pixel = 3 octets = 24 bits
(Biophotonics edition)
Biology Imaging
Image information & Visualisation
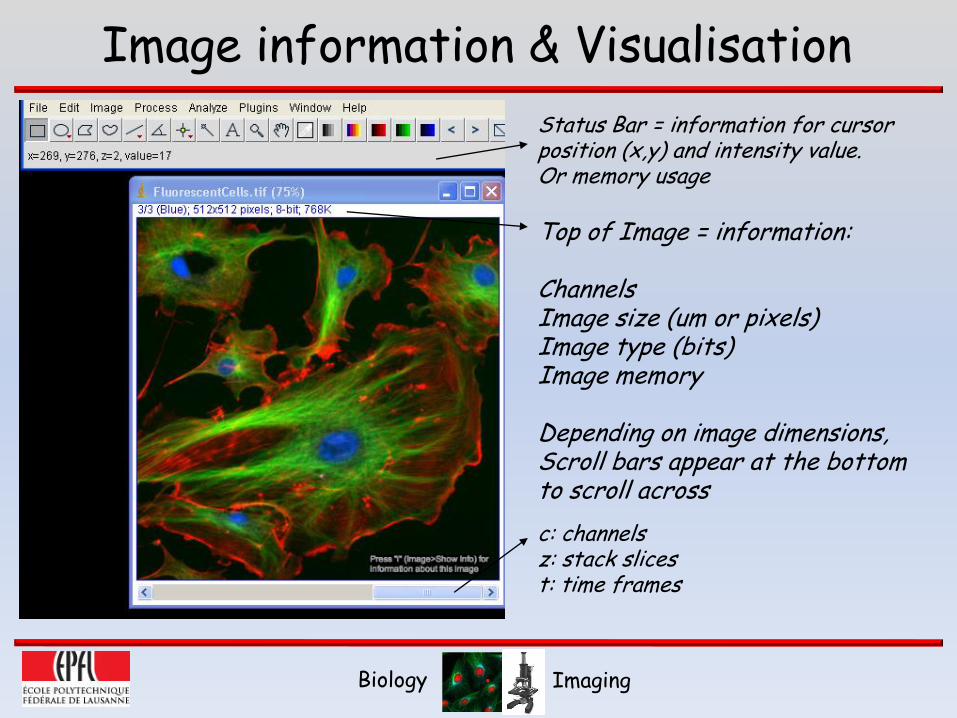
Status Bar = information for cursor position (x,y) and intensity value. Or memory usage
Top of Image = information:
ChannelsImage size (um or pixels)Image type (bits)Image memory
Depending on image dimensions, Scroll bars appear at the bottom to scroll across
c: channelsz: stack slicest: time frames
Biology Imaging
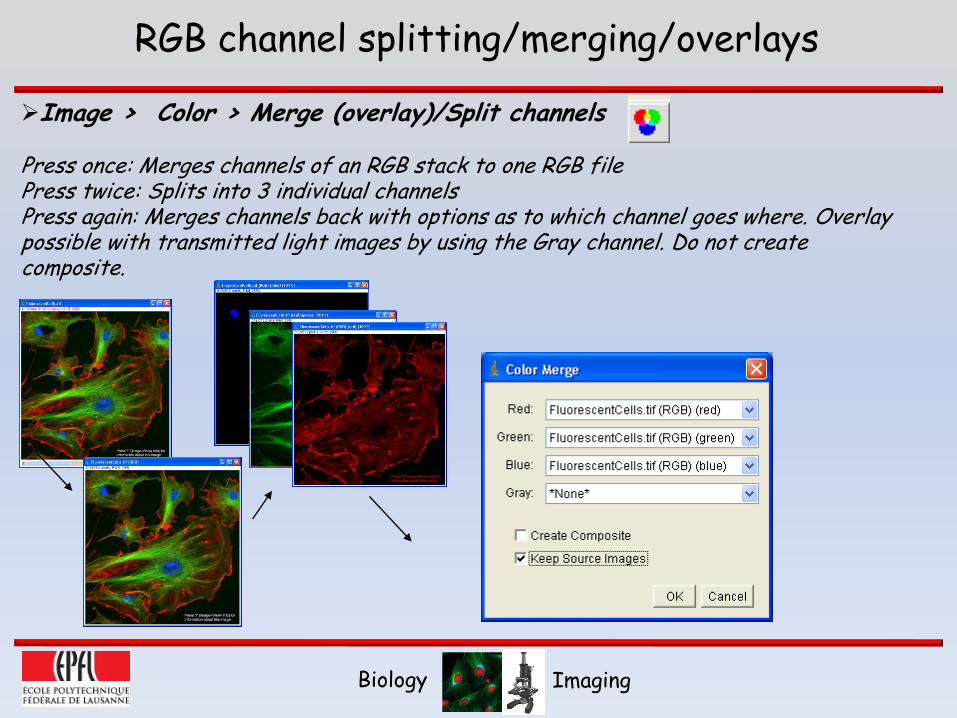
Image > Color > Merge (overlay)/Split channels
Press once: Merges channels of an RGB stack to one RGB file Press twice: Splits into 3 individual channelsPress again: Merges channels back with options as to which channel goes where. Overlay possible with transmitted light images by using the Gray channel. Do not create composite.
RGB channel splitting/merging/overlays
Biology Imaging
Image > StacksYou need to have a series (time, z, x-y) of images which can be built into a stack. Opeiningimages as a numbered sequence will automatically create a stack. Compatible with Metamorph stacks.Measuring and analysis tools can be often used to apply to all images in a stack
Convert Images to Stack: converts a set of 2D images that you have opened into a stack.Animate: animates the images in a stack at a rate up to 100 frames per second.
Convert Stack to Images: splits the stack into individual images.
Next Slice/Previous Slice: browsing images can be done using the > and < keys. The number of the current slice and the total number of slices are displayed in the title bar. You can also use the slider bar in the stack window.
Z Project: simple projection algorithms designed to render 3D images into 2D projections, allows volume rendering, useful for visualizing the internal structures of 3D images.
Stacks…
Biology Imaging
For immediate maximum intensity projection (MIP) use this button on the tool bar:
Image > Stack > 3D Project: Allows you to project the stack and then rotate it.
Orthogonal view: provides an orthogonal (or section) view.
Image > Duplicate allows you to save the slice you are viewing as an individual file
Image > Stacks > Movies
Time stamper: allows you to add the time information onto your movie.Zoomify: allows you to make a movie where you zoom in on a particular region.
…Stacks
Biology Imaging
Image Adjustments: Brightness/Contrast
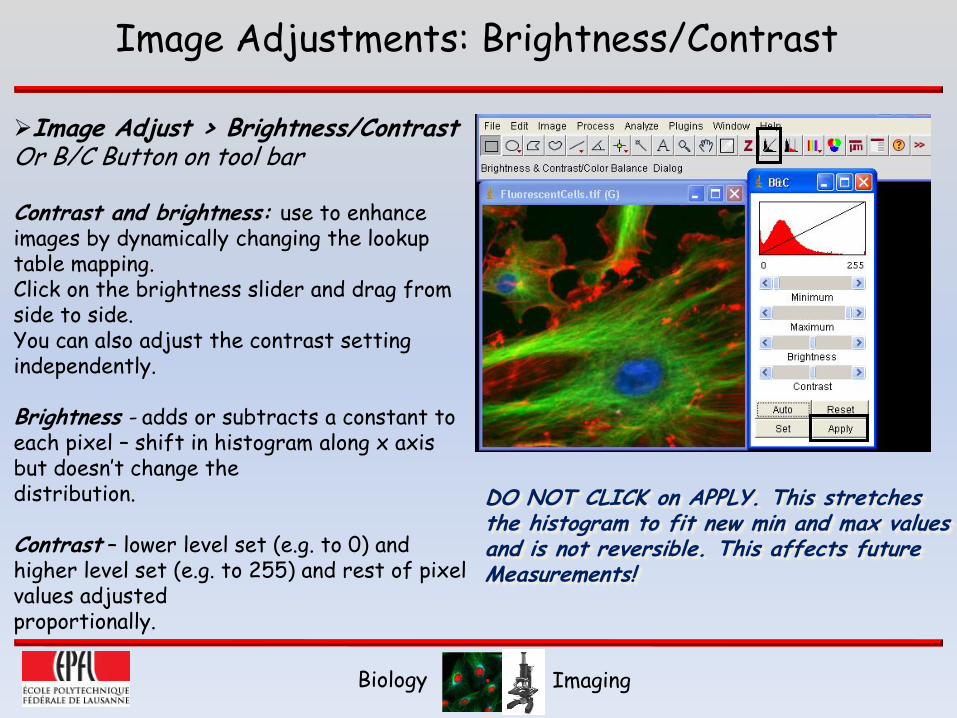
Image Adjust > Brightness/ContrastOr B/C Button on tool bar
Contrast and brightness: use to enhanceimages by dynamically changing the lookuptable mapping. Click on the brightness slider and drag fromside to side. You can also adjust the contrast setting independently.
Brightness - adds or subtracts a constant to each pixel – shift in histogram along x axis but doesn’t change thedistribution.
Contrast – lower level set (e.g. to 0) and higher level set (e.g. to 255) and rest of pixel values adjustedproportionally.
DO NOT CLICK on APPLY. This stretchesthe histogram to fit new min and max valuesand is not reversible. This affects future Measurements!
Biology Imaging
Image Adjustments: Threshold
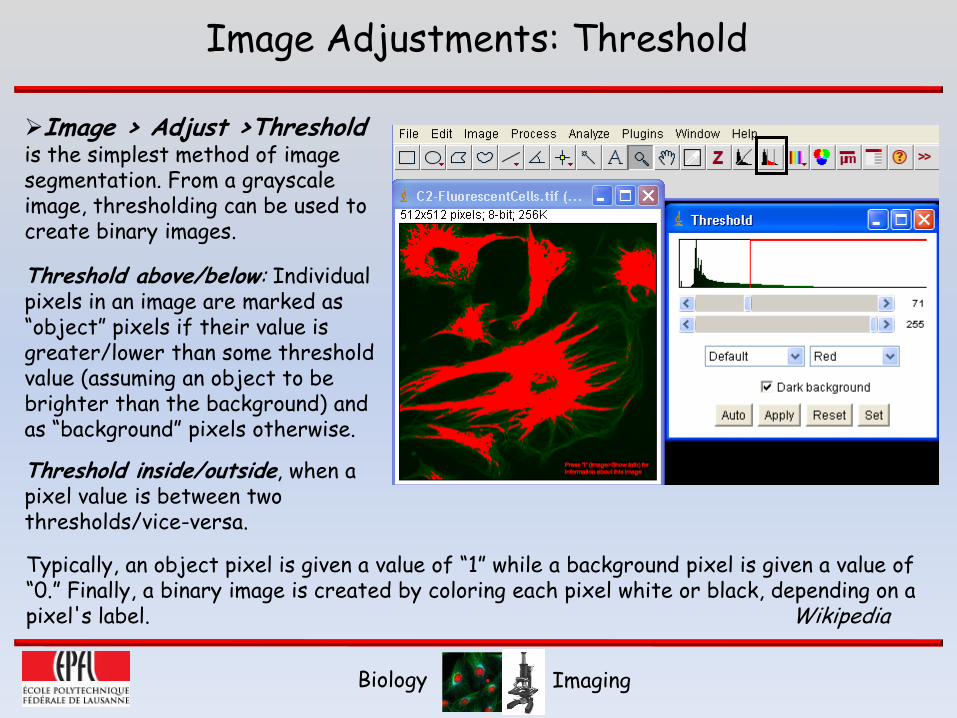
Image > Adjust >Thresholdis the simplest method of image segmentation. From a grayscale image, thresholding can be used to create binary images.
Threshold above/below: Individual pixels in an image are marked as “object” pixels if their value isgreater/lower than some thresholdvalue (assuming an object to bebrighter than the background) and as “background” pixels otherwise.
Threshold inside/outside, when a pixel value is between twothresholds/vice-versa.
Typically, an object pixel is given a value of “1” while a background pixel is given a value of “0.” Finally, a binary image is created by coloring each pixel white or black, depending on a pixel's label. Wikipedia
Biology Imaging
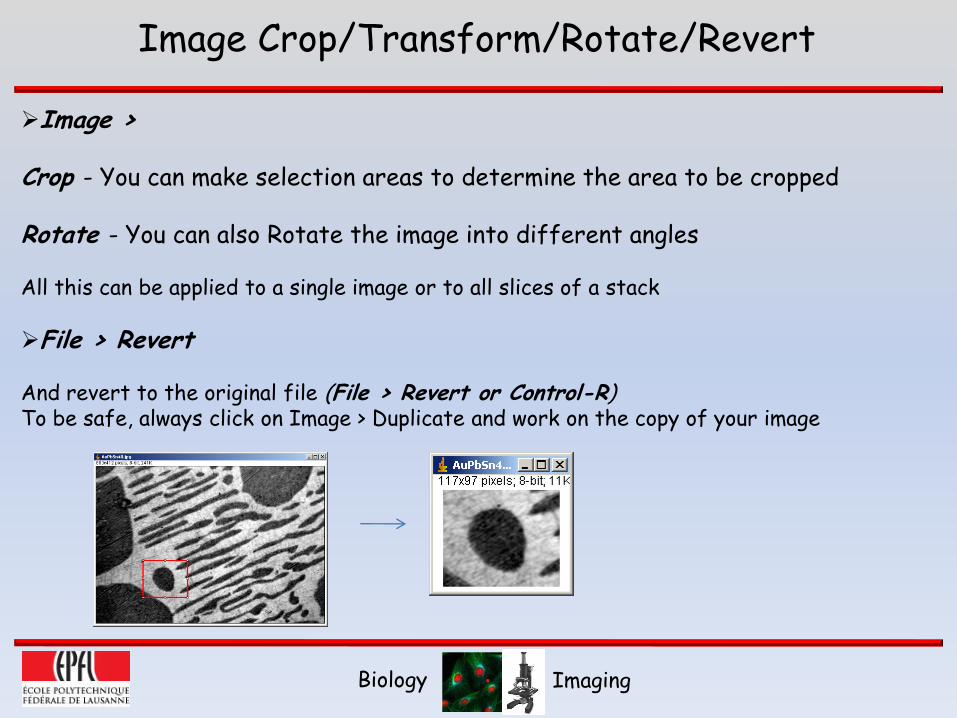
Image >
Crop - You can make selection areas to determine the area to be cropped
Rotate - You can also Rotate the image into different angles
All this can be applied to a single image or to all slices of a stack
File > Revert
And revert to the original file (File > Revert or Control-R)To be safe, always click on Image > Duplicate and work on the copy of your image
Image Crop/Transform/Rotate/Revert
Biology Imaging
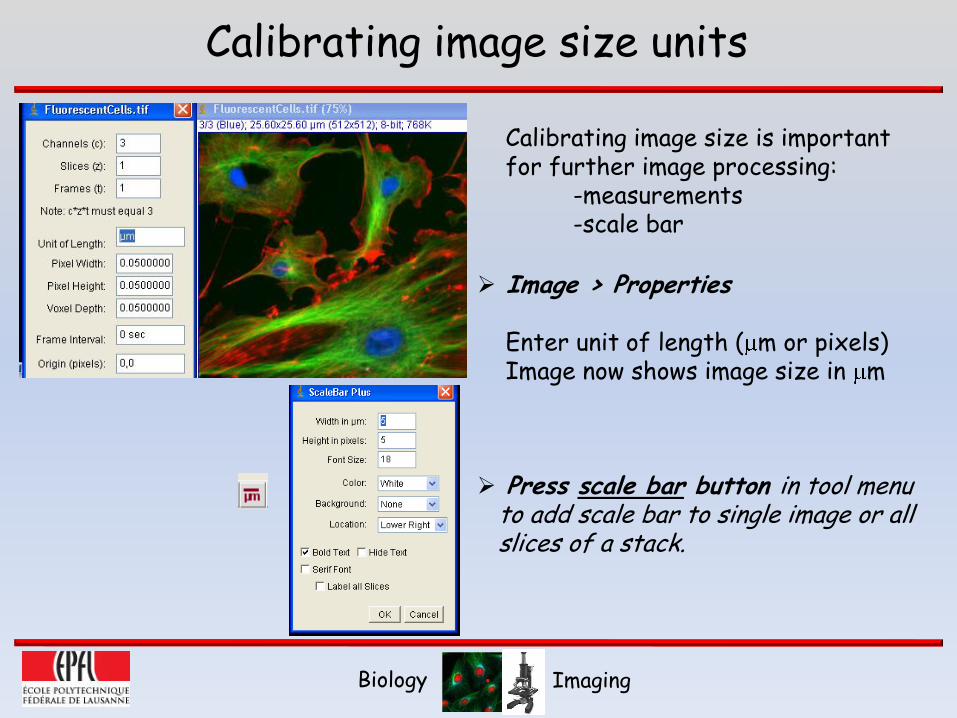
Calibrating image size units
Calibrating image size is importantfor further image processing:
-measurements-scale bar
Image > Properties
Enter unit of length ( m or pixels)Image now shows image size in m
Press scale bar button in tool menu to add scale bar to single image or all slices of a stack.
Biology Imaging
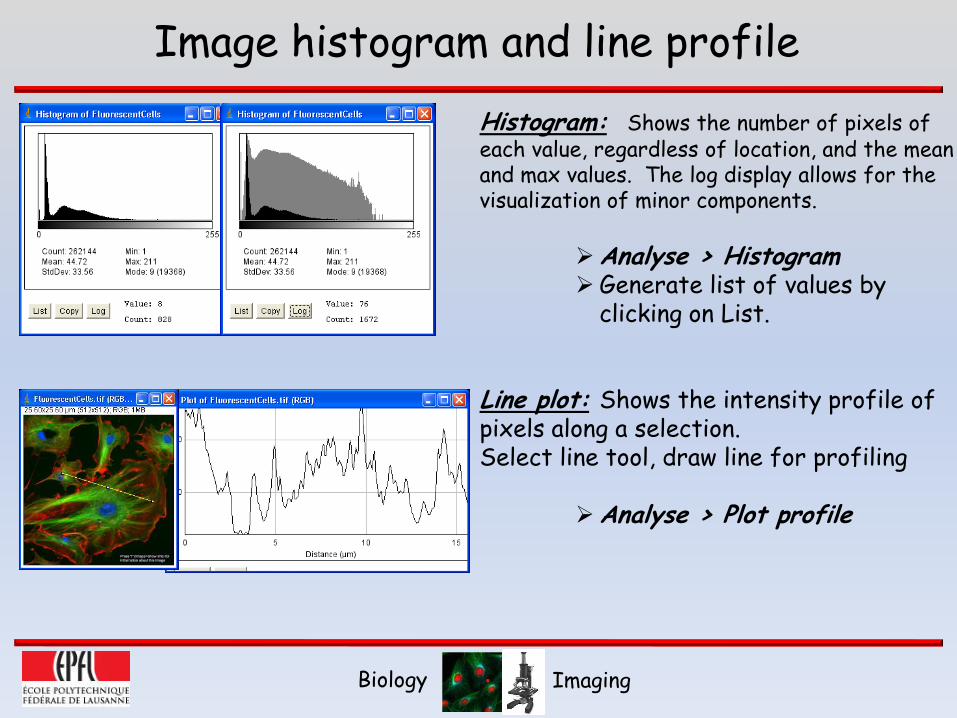
Image histogram and line profile
Histogram: Shows the number of pixels of each value, regardless of location, and the mean and max values. The log display allows for the visualization of minor components.
Analyse > Histogram Generate list of values by
clicking on List.
Line plot: Shows the intensity profile of pixels along a selection.Select line tool, draw line for profiling
Analyse > Plot profile
Biology Imaging
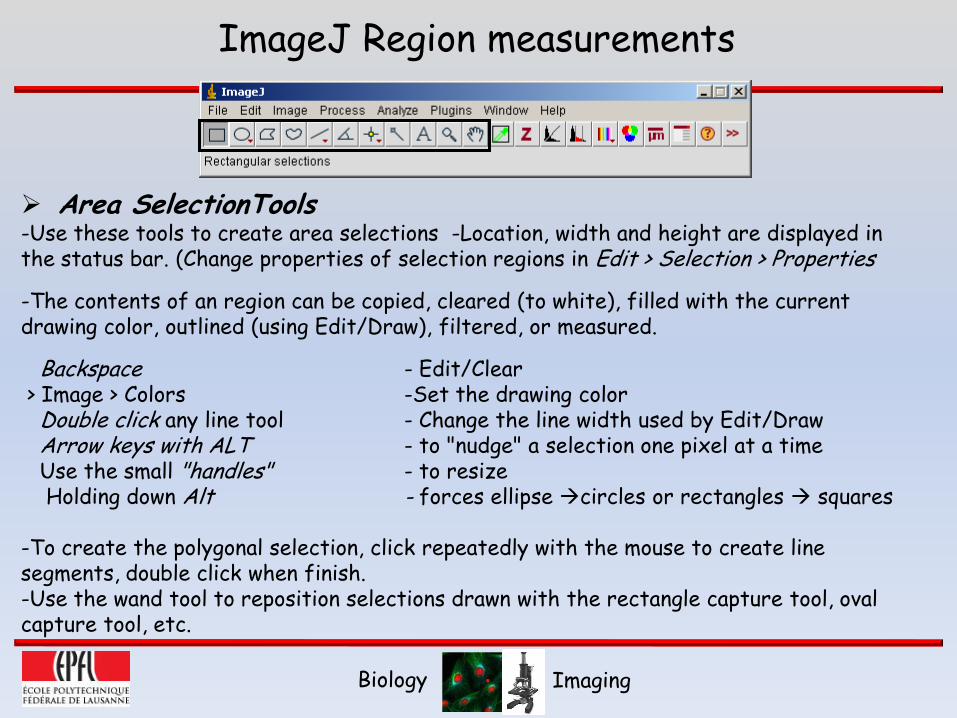
Area SelectionTools-Use these tools to create area selections -Location, width and height are displayed in the status bar. (Change properties of selection regions in Edit > Selection > Properties
-The contents of an region can be copied, cleared (to white), filled with the current drawing color, outlined (using Edit/Draw), filtered, or measured.
Backspace - Edit/Clear> Image > Colors -Set the drawing colorDouble click any line tool - Change the line width used by Edit/DrawArrow keys with ALT - to "nudge" a selection one pixel at a timeUse the small "handles" - to resizeHolding down Alt - forces ellipse circles or rectangles squares
-To create the polygonal selection, click repeatedly with the mouse to create line segments, double click when finish. -Use the wand tool to reposition selections drawn with the rectangle capture tool, oval capture tool, etc.
ImageJ Region measurements
Biology Imaging
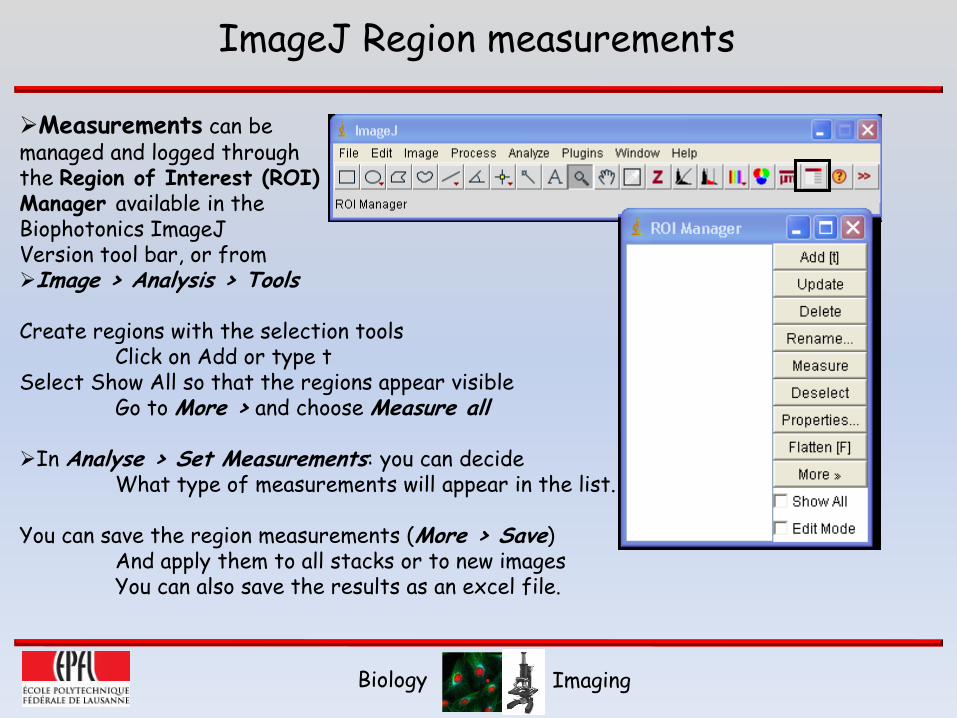
Measurements can bemanaged and logged through the Region of Interest (ROI) Manager available in the Biophotonics ImageJVersion tool bar, or fromImage > Analysis > Tools
Create regions with the selection toolsClick on Add or type t
Select Show All so that the regions appear visibleGo to More > and choose Measure all
In Analyse > Set Measurements: you can decideWhat type of measurements will appear in the list.
You can save the region measurements (More > Save)And apply them to all stacks or to new imagesYou can also save the results as an excel file.
ImageJ Region measurements