image quality assessment of pléiades-1a triplet bundle and ... · karsten jacobsen et al., image...
TRANSCRIPT
PFG 2016 / 3, 141 – 152 ArticleStuttgart, xxx 2016
© 2016 E. Schweizerbart'sche Verlagsbuchhandlung, Stuttgart, Germany www.schweizerbart.deDOI: 10.1127/pfg/2016/0291 1432-8364/16/0291 $ 3.25
Image Quality Assessment of Pléiades-1A Triplet Bundle and Pan-sharpened Images
Karsten JaCobsen, Hannover, hüseYin topan, aLi Cam, mustaFa Özendi & murat oruC, Zonguldak, Turkey
Keywords: image quality, edge analysis, signal-to-noise ratio, blur coefficient, Pléiades, pan-sharpening
Summary: The image quality of Pléiades-1A pan-chromatic and multispectral as well as pan-sharp-ened images has been analyzed. The original im-ages are available with 12 bit radiometric resolu-tion, but for mapping purposes often this is reduced to 8 bit, corresponding to the grey value resolution of the computer screens. Therefore, original images as well as the 8 bit images were investigated. Pléi-ades images are distributed with 50 cm ground sampling distance (GSD) in spite of the original resolution with 70 cm GSD. For this the effective image quality was determined by edge analysis. The edge analysis can be influenced by image sharpening. An image sharpening usually enlarges the image noise, which however can be reduced by filtering. This can influence the presentation of small image details, so in addition to edge and noise analysis image details in the Pléiades images were compared with the details visible in satellite images taken by other sensors having similar ground resolution. A blur analysis did not improve the information about image quality. In the Zongul-dak test site (Turkey) Pléiades images are compared with WorldView-1-, QuickBird- and IKONOS-im-ages. The zooming from 70 cm to 50 cm GSD could not be identified by the investigation of the Pléiades image quality. It leads to an even better quality than of the WorldView-1- and QuickBird images with an originally higher resolution.
Zusammenfassung: Bildqualität von Triplet Bund-le und Pan-sharpened Bildern des Systems Pléia-des-1A. Die Bildqualität von panchromatischen, multispektralen und pan-geschärften Pléiades-1A Bildern wurde untersucht. Die Originalbilder ha-ben eine radiometrische Auflösung von 12 bit, für die Kartenerstellung werden sie jedoch häufig auf 8 bit reduziert, weswegen sowohl die Originalbil-der als auch 8-bit-Bilder analysiert wurden. Pléia-des-Bilder werden mit 50 cm Objektpixelgröße aus-geliefert, obwohl die geometrische Auflösung nur 70 cm beträgt. Aus diesem Grund war eine Unter-suchung der Bildqualität mittels Kantenanalyse er-forderlich. Die Kantenanalyse kann durch Bild-schärfung beeinflusst werden. Dieses erhöht norma-lerweise das Bildrauschen. Das Bildrauschen lässt sich durch Filterung reduzieren, was wiederum die Erkennbarkeit kleiner Bilddetails verschlechtern kann. Aus diesem Grund wurde auch das Bildrau-schen untersucht. Eine blur-Untersuchung verbes-serte die Information über die Bildqualität nicht. Von dem Testgebiet Zonguldak, Türkei, sind auch WorldView-1-, QuickBird- und IKONOS-Bilder vorhanden, die einen Vergleich von Bilddetails er-möglichen. Die Vergrößerung der Pléiades-Bilder von 70 cm auf 50 cm Objektpixelgröße konnte nicht durch eine reduzierte Bildqualität nachgewiesen werden. Vielmehr waren die Pléiades-Bilder sogar qualitativ besser als die WorldView-1- und die QuickBird-Bilder, die eine höhere geometrische Auflösung besitzen.
1 Introduction
Optical satellite images are commonly used for photogrammetric application. Based on experience with images from some optical satellites it is necessary to analyze the image quality because it may not correspond to the
image specification as it is the case especial-ly for systems equipped with staggered CCD-lines for example OrbView-3 images (topan et al. 2009). Pléiades images are distributed with 50 cm ground sampling distance (GSD) in spite of the geometric resolution with 70 cm GSD in nadir images. Such a zooming effect
142 Photogrammetrie • Fernerkundung • Geoinformation 3/2016
termined visually by image analysts, which is not very accurate and by the given rules not usable outside the United States, but as an al-ternative it can be based on a general image quality equation. The formula as a function of the GSD, an edge analysis and the signal-to-noise ratio have a clear background. Neverthe-less, the NIIRS values are an artificial qual-ity scale. Furthermore, they are mixing the re-sults of the edge analysis with the noise and the nominal GSD.
Kim & Kim (2011) are using the Ground Resolvable Distance (GRD) for the descrip-tion of the image quality. GRD is the mini-mal distance between two objects to be iden-tified as separate, corresponding to the clas-sical bar code targets used for analog imag-es. They started with the analysis of bar code targets, but they adapted it to edges using the same definition of the effective ground reso-lution described below. Nevertheless, there is a discrepancy between the original definition of the GRD and the GRD based on the line spread function.
Based on the investigation of KoeLbL (2005), JaCobSen (2008) and paSSini & JaCob-Sen (2008) introduced for digital images the standard deviation of edge spread functions of clear image edges is a factor for effective resolution. Such edges are visible in the im-ages e.g. at building roofs, parking places or straight streets. The factor for effective resolu-tion multiplied with the nominal GSD leads to the effective GSD describing the image qual-ity in a simple manner having a real meaning. The effective resolution is determined by edg-es with a satisfying length of approximately 20 to 100 pixels. The average grey value pro-file of all profiles perpendicular to the edge in every pixel distance is used for the analysis for reducing the influence of noise and the influ-ence of the sampling step width. The Gaussian curve is adjusted into a differentiated grey val-ue profile for the determination of the stand-ard deviation of the Gaussian function being the factor for effective resolution (Fig. 3). The factor for effective resolution multiplied with the GSD is the effective GSD. The factor for effective GSD is invariant against orientation of the edges. Under usual condition the factor for effective resolution should be close to 1.0. This is not the case for images from staggered
should be seen by edge analysis, but edges can be influenced by image sharpening. The image sharpening should enlarge the image noise, but this again can be influenced by fil-tering. Airbus DS announces that Pléiades im-ages are enhanced by de-convolution and de-noised, so the effective image resolution as well as the signal-to-noise ratio (SNR) may be influenced. This procedure may reduce the imaging of small details, requiring a compari-son with satellite images of similar resolution.
Topographic mapping, today realized by data acquisition for GIS (Geographic Informa-tion Systems), is usually based on digitizing colour images. Very high resolution satellite colour images use the fusion of lower resolu-tion multispectral with higher resolution pan-chromatic images by pan-sharpening. This complicates the image quality, so also pan-sharpened images were investigated.
This publication contributes to the investi-gation of effective image quality, being impor-tant for mapping. The influence of the Pléiades image enlargement from 70 cm geometric res-olution to the distributed 50 cm GSD is ana-lysed. Therefore, edge and blur analysis sup-ported by noise analysis and a comparison of satellite images with similar ground resolution is conducted. Such complete investigation of Pléiades image products is missing up to now.
2 Related Investigations
The modulation transfer function (MTF) is frequently used to estimate the spatial qual-ity of imaging systems. It can be based on ar-tificial targets or clear edges. First operation-al investigations of image quality have been done by KoeLbL (KoeLbL & HaWaWini 1986, KoeLbL 2005). The Federation of American Scientists (FAS) developed the National Im-age Interpretability Rating Scales (NIIRS), at first for military reconnaissance, but with the Civil NIIRS Reference Guide (NIIRS 1996) also for civilian applications. The NIIRS val-ues can be determined by interpretation of im-age analysts to quantify images into 10 steps from NIIRS 0 (over 9.0 m GSD) up to NIIRS 9 (less than 0.10 m GSD) (LeaCHtenauer 1996). The level NIIRS 6 corresponds to 0.40 m up to 0.75 m GSD. The NIIRS values can be de-
Karsten Jacobsen et al., Image Quality Assessment 143
sensors. Staggered sensors have two CCD-lines shifted half a pixel against each other and thus improving the nominal ground reso-lution with factor two by mixing the images of the two CCD-lines. topan et al. (2009) and JaCobSen (2011) determined the factor for ef-fective resolution for staggered sensors in the range of approximately 1.1 up to 1.25, what is still better as the factor 2.0 for the original size of the individual pixels, but clearly above 1.0 for images with a pixel size of half the stag-gered width.
In computer vision another method of ra-diometric quality assessment is proposed by Crété-roFFet et al. (2007). They compared the original image with the image smoothed by an average filter separately applied in hori-zontal and in vertical direction. By compar-ison of the normalized grey value differenc-es of neighboured pixels a blur coefficient is computed. For example aLSadiK et al. (2015) used it for the identification of images with satisfying quality.
3 Dataset
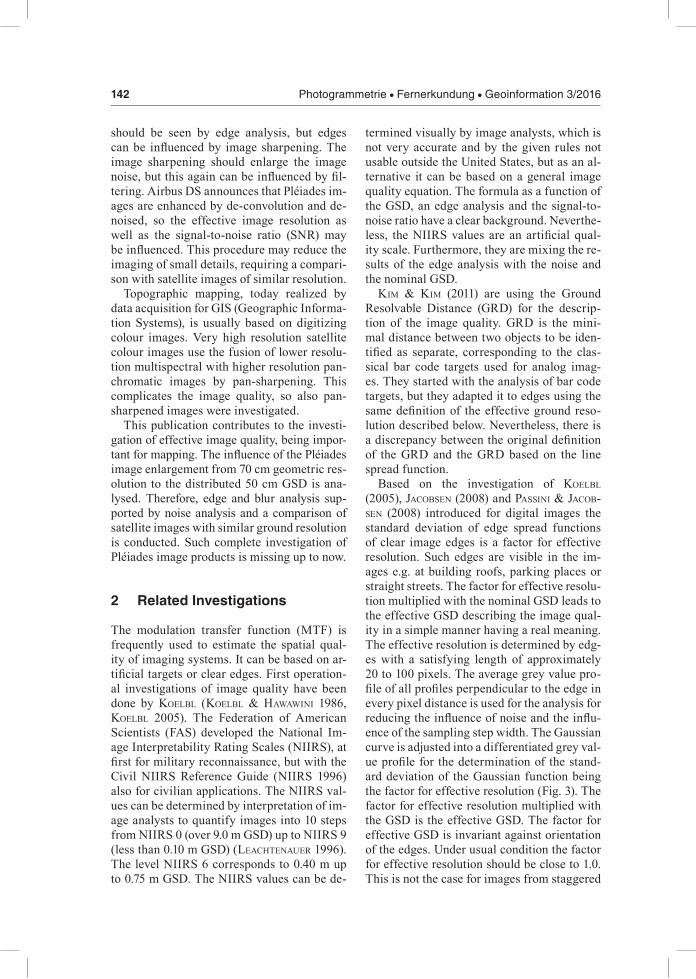
A triplet of Pléiades images has been taken from the same orbit at April 24th, 2013 over the area around the city of Zonguldak, Turkey (Tab. 1). The test area includes the city which is situated partly in a mountainous location and its surrounding area with mountainous forest and a small percentage of agriculture.
Distributed Pléiades images are resampled from 70 cm to 50 cm for panchromatic band, and from 2.8 m to 2 m for multispectral bands. The original radiometric resolution is 12 bit. The images are de-convoluted for enhancing the image sharpness and de-noised. As men-tioned above, the effects of this process should be visible by edge and noise analysis.
According to the pLéiadeS imagerY uSer guide (2012) Pléiades images are improved by “inter-detector equalization: with correction of differences in sensitivity between the de-tectors (on board correction), aberrant detec-tors correction (if any), panchromatic band is restored and de-noised, and improved by pixel sampling at Shannon optimizing image qual-ity for downstream value-added processing with spline kernel resampling into the primary
geometry, zoomed to the factor 7/5 (equivalent resolution of 0.5 m respectively 2 m in nadir condition)”.
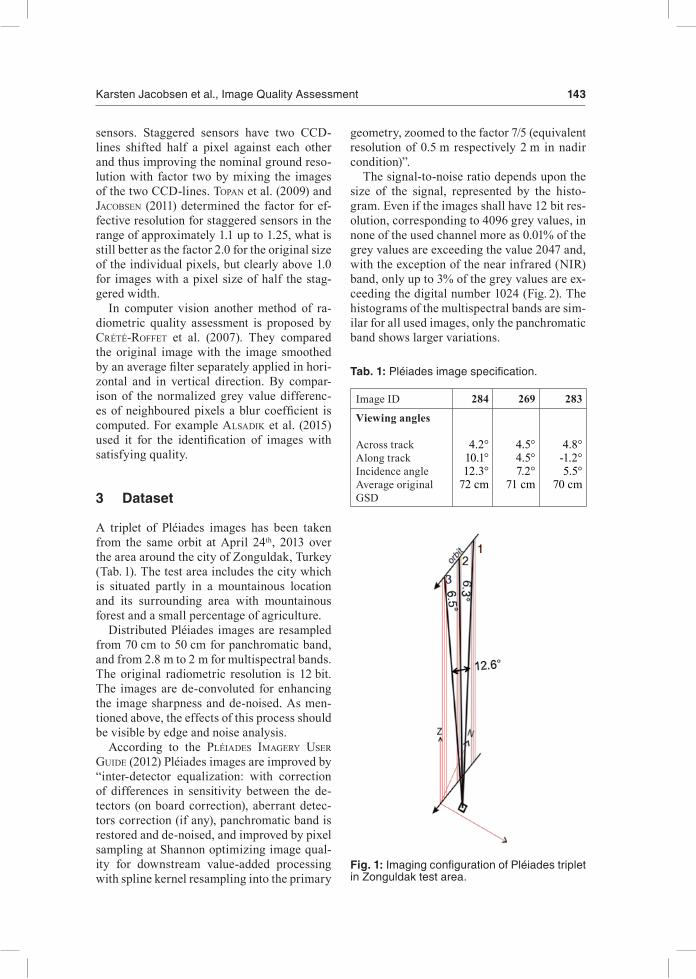
The signal-to-noise ratio depends upon the size of the signal, represented by the histo-gram. Even if the images shall have 12 bit res-olution, corresponding to 4096 grey values, in none of the used channel more as 0.01% of the grey values are exceeding the value 2047 and, with the exception of the near infrared (NIR) band, only up to 3% of the grey values are ex-ceeding the digital number 1024 (Fig. 2). The histograms of the multispectral bands are sim-ilar for all used images, only the panchromatic band shows larger variations.
Tab. 1: Pléiades image specification.
Image ID 284 269 283
Viewing angles
Across trackAlong trackIncidence angleAverage original GSD
4.2°10.1°12.3°
72 cm
4.5°4.5°7.2°
71 cm
4.8°-1.2°5.5°
70 cm
Fig. 1: Imaging configuration of Pléiades triplet in Zonguldak test area.
144 Photogrammetrie • Fernerkundung • Geoinformation 3/2016
4 Radiometric Quality Assessment
4.1 Edge Analysis
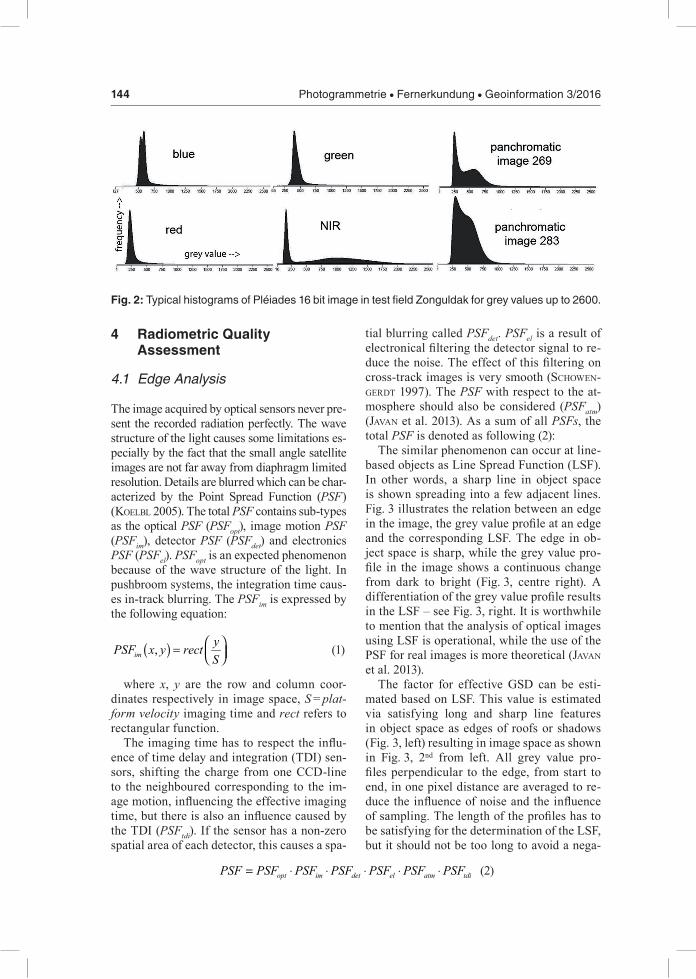
The image acquired by optical sensors never pre-sent the recorded radiation perfectly. The wave structure of the light causes some limitations es-pecially by the fact that the small angle satellite images are not far away from diaphragm limited resolution. Details are blurred which can be char-acterized by the Point Spread Function (PSF) (KoeLbL 2005). The total PSF contains sub-types as the optical PSF (PSFopt), image motion PSF (PSFim), detector PSF (PSFdet) and electronics PSF (PSFel). PSFopt is an expected phenomenon because of the wave structure of the light. In pushbroom systems, the integration time caus-es in-track blurring. The PSFim is expressed by the following equation:
( ),imyPSF x y rectS
= (1)
where x, y are the row and column coor-dinates respectively in image space, S = plat-form velocity imaging time and rect refers to rectangular function.
The imaging time has to respect the influ-ence of time delay and integration (TDI) sen-sors, shifting the charge from one CCD-line to the neighboured corresponding to the im-age motion, influencing the effective imaging time, but there is also an influence caused by the TDI (PSFtdi). If the sensor has a non-zero spatial area of each detector, this causes a spa-
tial blurring called PSFdet. PSFel is a result of electronical filtering the detector signal to re-duce the noise. The effect of this filtering on cross-track images is very smooth (SCHoWen-gerdt 1997). The PSF with respect to the at-mosphere should also be considered (PSFatm) (JaVan et al. 2013). As a sum of all PSFs, the total PSF is denoted as following (2):
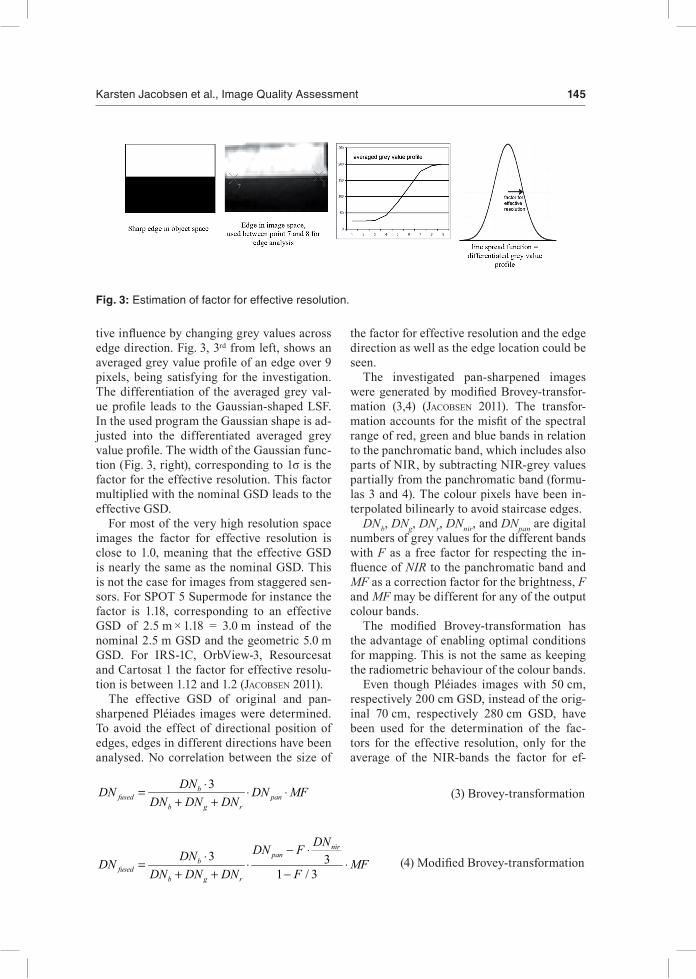
The similar phenomenon can occur at line-based objects as Line Spread Function (LSF). In other words, a sharp line in object space is shown spreading into a few adjacent lines. Fig. 3 illustrates the relation between an edge in the image, the grey value profile at an edge and the corresponding LSF. The edge in ob-ject space is sharp, while the grey value pro-file in the image shows a continuous change from dark to bright (Fig. 3, centre right). A differentiation of the grey value profile results in the LSF – see Fig. 3, right. It is worthwhile to mention that the analysis of optical images using LSF is operational, while the use of the PSF for real images is more theoretical (JaVan et al. 2013).
The factor for effective GSD can be esti-mated based on LSF. This value is estimated via satisfying long and sharp line features in object space as edges of roofs or shadows (Fig. 3, left) resulting in image space as shown in Fig. 3, 2nd from left. All grey value pro-files perpendicular to the edge, from start to end, in one pixel distance are averaged to re-duce the influence of noise and the influence of sampling. The length of the profiles has to be satisfying for the determination of the LSF, but it should not be too long to avoid a nega-
Fig. 2: Typical histograms of Pléiades 16 bit image in test field Zonguldak for grey values up to 2600.
opt im det el atm tdiPSF PSF PSF PSF PSF PSF PSF= ⋅ ⋅ ⋅ ⋅ ⋅ (2)
Karsten Jacobsen et al., Image Quality Assessment 145
tive influence by changing grey values across edge direction. Fig. 3, 3rd from left, shows an averaged grey value profile of an edge over 9 pixels, being satisfying for the investigation. The differentiation of the averaged grey val-ue profile leads to the Gaussian-shaped LSF. In the used program the Gaussian shape is ad-justed into the differentiated averaged grey value profile. The width of the Gaussian func-tion (Fig. 3, right), corresponding to 1σ is the factor for the effective resolution. This factor multiplied with the nominal GSD leads to the effective GSD.
For most of the very high resolution space images the factor for effective resolution is close to 1.0, meaning that the effective GSD is nearly the same as the nominal GSD. This is not the case for images from staggered sen-sors. For SPOT 5 Supermode for instance the factor is 1.18, corresponding to an effective GSD of 2.5 m × 1.18 = 3.0 m instead of the nominal 2.5 m GSD and the geometric 5.0 m GSD. For IRS-1C, OrbView-3, Resourcesat and Cartosat 1 the factor for effective resolu-tion is between 1.12 and 1.2 (JaCobSen 2011).
The effective GSD of original and pan-sharpened Pléiades images were determined. To avoid the effect of directional position of edges, edges in different directions have been analysed. No correlation between the size of
the factor for effective resolution and the edge direction as well as the edge location could be seen.
The investigated pan-sharpened images were generated by modified Brovey-transfor-mation (3,4) (JaCobSen 2011). The transfor-mation accounts for the misfit of the spectral range of red, green and blue bands in relation to the panchromatic band, which includes also parts of NIR, by subtracting NIR-grey values partially from the panchromatic band (formu-las 3 and 4). The colour pixels have been in-terpolated bilinearly to avoid staircase edges.
DNb, DNg, DNr, DNnir, and DNpan are digital numbers of grey values for the different bands with F as a free factor for respecting the in-fluence of NIR to the panchromatic band and MF as a correction factor for the brightness, F and MF may be different for any of the output colour bands.
The modified Brovey-transformation has the advantage of enabling optimal conditions for mapping. This is not the same as keeping the radiometric behaviour of the colour bands.
Even though Pléiades images with 50 cm, respectively 200 cm GSD, instead of the orig-inal 70 cm, respectively 280 cm GSD, have been used for the determination of the fac-tors for the effective resolution, only for the average of the NIR-bands the factor for ef-
Fig. 3: Estimation of factor for effective resolution.
3bfused pan
b g r
DNDN DN MFDN DN DN
⋅= ⋅ ⋅+ +
(3) Brovey-transformation
3 31 / 3
nirpan
bfused
b g r
DNDN FDNDN MFDN DN DN F
− ⋅⋅= ⋅ ⋅
+ + −
(4) Modified Brovey-transformation
146 Photogrammetrie • Fernerkundung • Geoinformation 3/2016
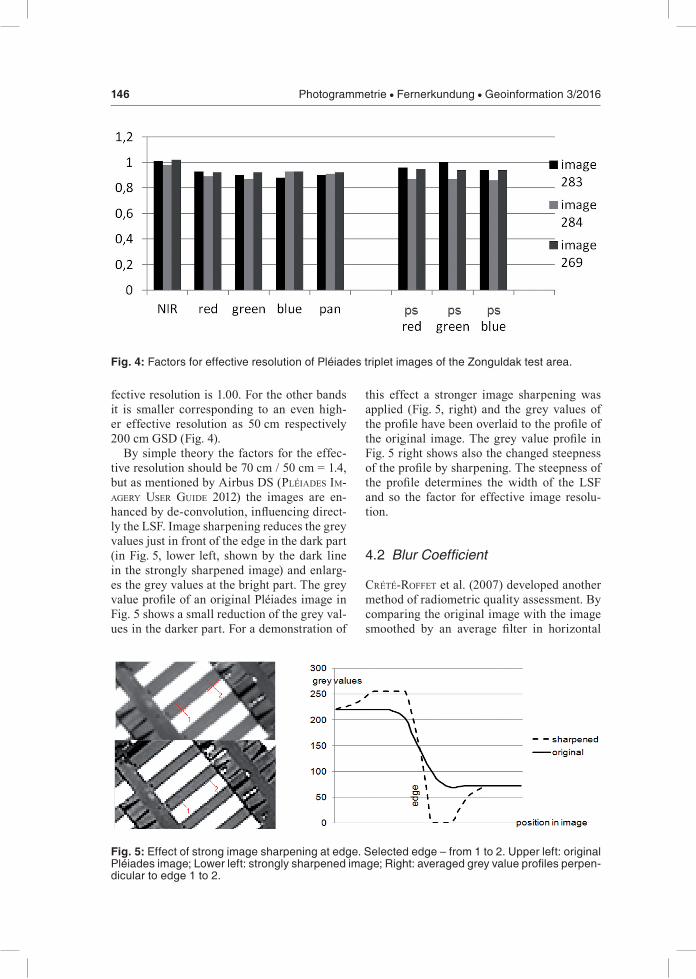
fective resolution is 1.00. For the other bands it is smaller corresponding to an even high-er effective resolution as 50 cm respectively 200 cm GSD (Fig. 4).
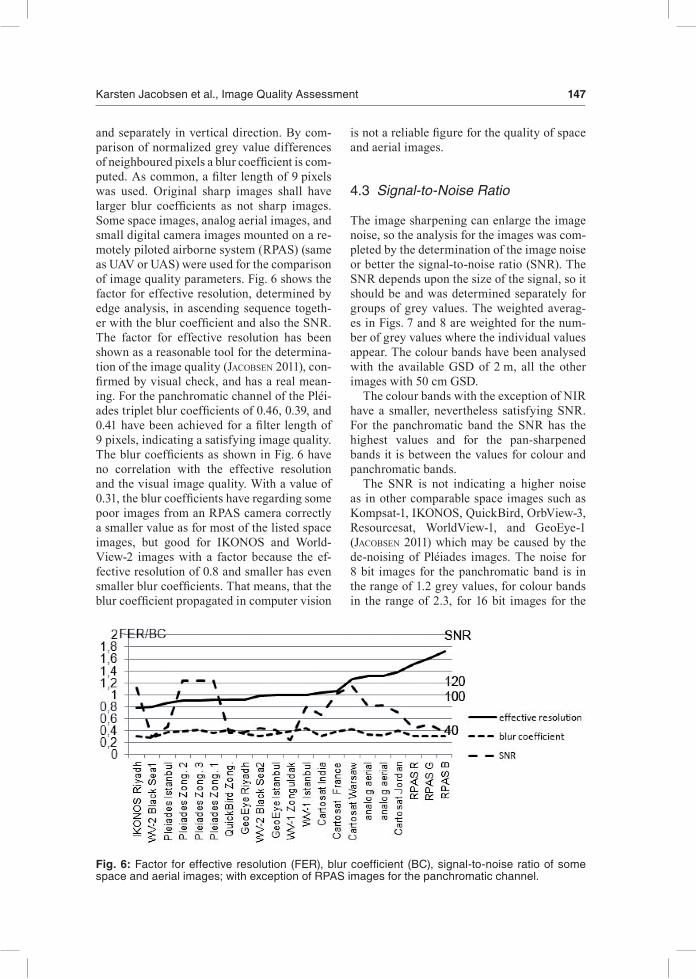
By simple theory the factors for the effec-tive resolution should be 70 cm / 50 cm = 1.4, but as mentioned by Airbus DS (pLéiadeS im-agerY uSer guide 2012) the images are en-hanced by de-convolution, influencing direct-ly the LSF. Image sharpening reduces the grey values just in front of the edge in the dark part (in Fig. 5, lower left, shown by the dark line in the strongly sharpened image) and enlarg-es the grey values at the bright part. The grey value profile of an original Pléiades image in Fig. 5 shows a small reduction of the grey val-ues in the darker part. For a demonstration of
this effect a stronger image sharpening was applied (Fig. 5, right) and the grey values of the profile have been overlaid to the profile of the original image. The grey value profile in Fig. 5 right shows also the changed steepness of the profile by sharpening. The steepness of the profile determines the width of the LSF and so the factor for effective image resolu-tion.
4.2 Blur Coefficient
Crété-roFFet et al. (2007) developed another method of radiometric quality assessment. By comparing the original image with the image smoothed by an average filter in horizontal
Fig. 5: Effect of strong image sharpening at edge. Selected edge – from 1 to 2. Upper left: original Pléiades image; Lower left: strongly sharpened image; Right: averaged grey value profiles perpen-dicular to edge 1 to 2.
Fig. 4: Factors for effective resolution of Pléiades triplet images of the Zonguldak test area.
Karsten Jacobsen et al., Image Quality Assessment 147
is not a reliable figure for the quality of space and aerial images.
4.3 Signal-to-Noise Ratio
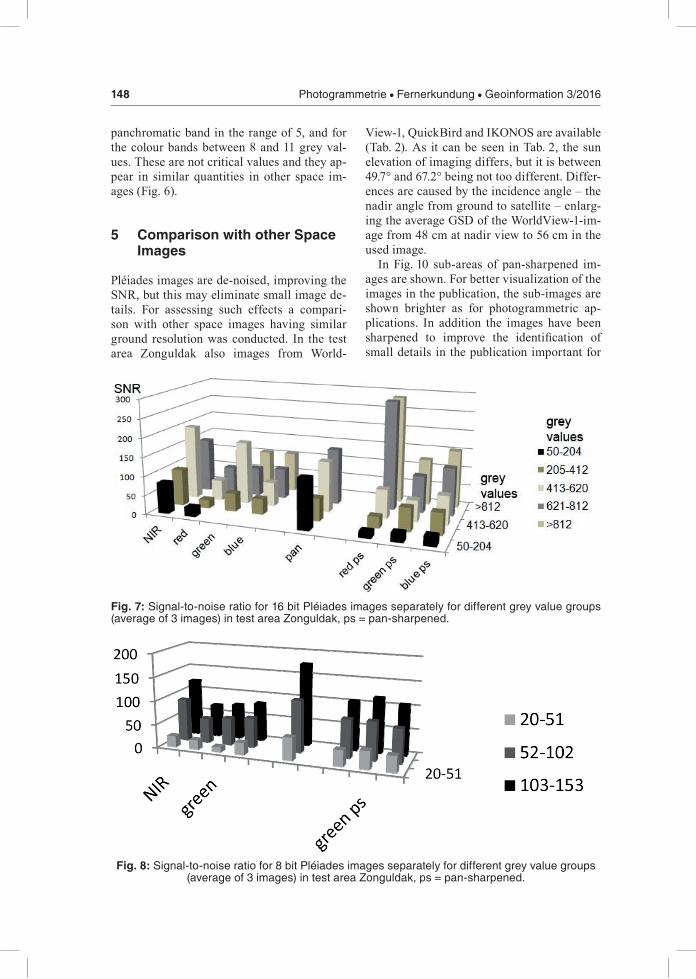
The image sharpening can enlarge the image noise, so the analysis for the images was com-pleted by the determination of the image noise or better the signal-to-noise ratio (SNR). The SNR depends upon the size of the signal, so it should be and was determined separately for groups of grey values. The weighted averag-es in Figs. 7 and 8 are weighted for the num-ber of grey values where the individual values appear. The colour bands have been analysed with the available GSD of 2 m, all the other images with 50 cm GSD.
The colour bands with the exception of NIR have a smaller, nevertheless satisfying SNR. For the panchromatic band the SNR has the highest values and for the pan-sharpened bands it is between the values for colour and panchromatic bands.
The SNR is not indicating a higher noise as in other comparable space images such as Kompsat-1, IKONOS, QuickBird, OrbView-3, Resourcesat, WorldView-1, and GeoEye-1 (JaCobSen 2011) which may be caused by the de-noising of Pléiades images. The noise for 8 bit images for the panchromatic band is in the range of 1.2 grey values, for colour bands in the range of 2.3, for 16 bit images for the
and separately in vertical direction. By com-parison of normalized grey value differences of neighboured pixels a blur coefficient is com-puted. As common, a filter length of 9 pixels was used. Original sharp images shall have larger blur coefficients as not sharp images. Some space images, analog aerial images, and small digital camera images mounted on a re-motely piloted airborne system (RPAS) (same as UAV or UAS) were used for the comparison of image quality parameters. Fig. 6 shows the factor for effective resolution, determined by edge analysis, in ascending sequence togeth-er with the blur coefficient and also the SNR. The factor for effective resolution has been shown as a reasonable tool for the determina-tion of the image quality (JaCobSen 2011), con-firmed by visual check, and has a real mean-ing. For the panchromatic channel of the Pléi-ades triplet blur coefficients of 0.46, 0.39, and 0.41 have been achieved for a filter length of 9 pixels, indicating a satisfying image quality. The blur coefficients as shown in Fig. 6 have no correlation with the effective resolution and the visual image quality. With a value of 0.31, the blur coefficients have regarding some poor images from an RPAS camera correctly a smaller value as for most of the listed space images, but good for IKONOS and World-View-2 images with a factor because the ef-fective resolution of 0.8 and smaller has even smaller blur coefficients. That means, that the blur coefficient propagated in computer vision
Fig. 6: Factor for effective resolution (FER), blur coefficient (BC), signal-to-noise ratio of some space and aerial images; with exception of RPAS images for the panchromatic channel.
148 Photogrammetrie • Fernerkundung • Geoinformation 3/2016
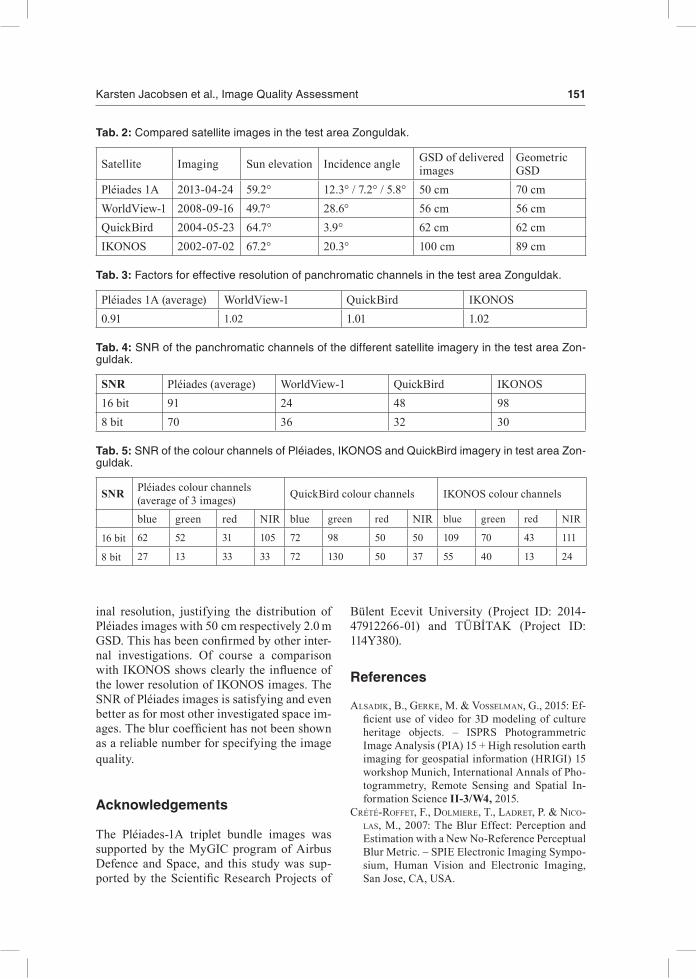
View-1, QuickBird and IKONOS are available (Tab. 2). As it can be seen in Tab. 2, the sun elevation of imaging differs, but it is between 49.7° and 67.2° being not too different. Differ-ences are caused by the incidence angle – the nadir angle from ground to satellite – enlarg-ing the average GSD of the WorldView-1-im-age from 48 cm at nadir view to 56 cm in the used image.
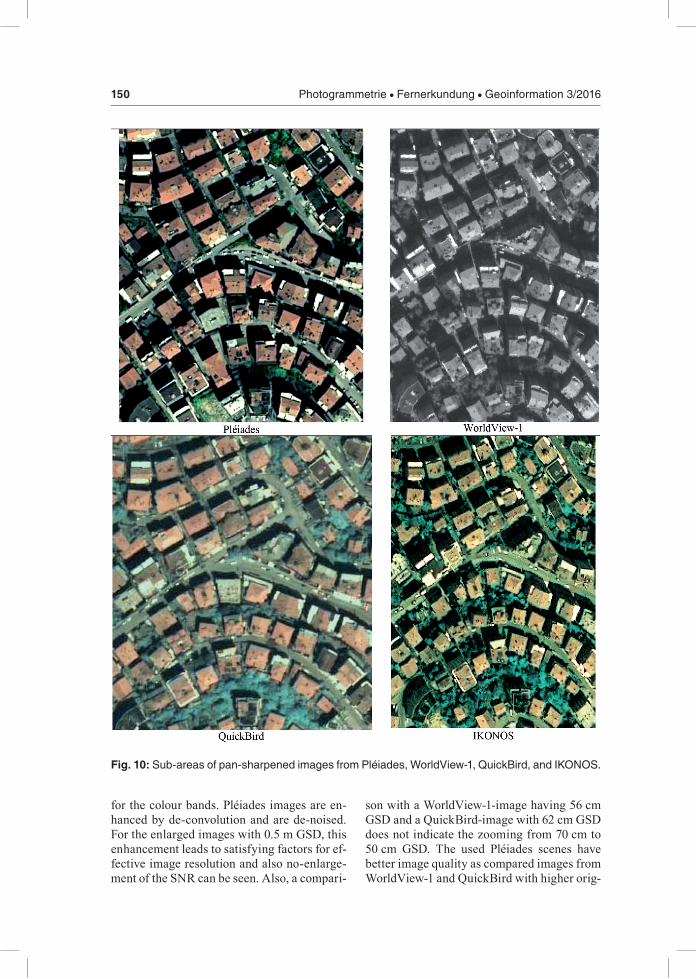
In Fig. 10 sub-areas of pan-sharpened im-ages are shown. For better visualization of the images in the publication, the sub-images are shown brighter as for photogrammetric ap-plications. In addition the images have been sharpened to improve the identification of small details in the publication important for
panchromatic band in the range of 5, and for the colour bands between 8 and 11 grey val-ues. These are not critical values and they ap-pear in similar quantities in other space im-ages (Fig. 6).
5 Comparison with other Space Images
Pléiades images are de-noised, improving the SNR, but this may eliminate small image de-tails. For assessing such effects a compari-son with other space images having similar ground resolution was conducted. In the test area Zonguldak also images from World-
Fig. 8: Signal-to-noise ratio for 8 bit Pléiades images separately for different grey value groups (average of 3 images) in test area Zonguldak, ps = pan-sharpened.
Fig. 7: Signal-to-noise ratio for 16 bit Pléiades images separately for different grey value groups (average of 3 images) in test area Zonguldak, ps = pan-sharpened.

Karsten Jacobsen et al., Image Quality Assessment 149
not as important. Finally, no disadvantages of the Pléiades images caused by image sharp-ening through Airbus DS can be seen. This may be caused by the de-noising of the Pléi-ades images. Thus, the last step has to be the comparison of image details since de-noising may cause a low-pass filtering leading to a loss of details.
Especially, the identification of small de-tails was checked by a comparison of the im-ages in the test area Zonguldak (Fig. 10). The comparison of Pléiades with WorldView-1 images has to respect the missing colour in-formation of WorldView-1. Nevertheless, the details can be better identified in the Pléiades images even if it is based on the original 70 cm GSD. Also, the QuickBird image has disad-vantages against Pléiades. IKONOS has also a very good radiometric quality as Pléiades, but with 100 cm GSD the resolution is clearly be-low Pléiades, and this can be seen. The visual image quality of the images shown in Fig. 10 agrees with the same image types used in oth-er investigations (topan et al. 2009) and addi-tional internal tests by the authors.
6 Conclusion
Pléiades-1A triplet bundle images over Zon-guldak test area have been investigated with respect to the image quality. Pléiades images are distributed with 0.5 m respectively 2.0 m GSD even if the original resolution is only 0.7 m GSD for panchromatic images and 2.8 m
a better comparison by the reader. All images have been improved in same manner. Never-theless, the sharpening was not required for the Pléiades image.
As usual, all investigated images have few blooming effects caused by direct reflection of sun light e.g. by glass roofs, but this typical ef-fect of all digital images is not disturbing too much.
With the exception of Pléiades, the fac-tors for the effective resolution (Tab. 3) are nearly 1.0, meaning that the effective reso-lution is identical to the nominal resolution. For Pléiades, however, the lower factor corre-sponds to an effective GSD of 50 cm x 0.91 = 46 cm, clearly below the geometric resolution of 70 cm. As mentioned before, Pléiades im-ages have been enhanced by de-convolution and de-noised by Airbus DS. These results achieved in the test area Zonguldak are typi-cal for the used space images. They agree with the factors for effective resolution published in JaCobSen (2011) and are also an average of sev-eral images, and, in addition, unpublished in-vestigations of the author. Also for other satel-lite image types the root-mean-square varia-tion of the factors is in the range of 0.05.
The SNR for the important panchromatic band (Tab. 4) for Pléiades and IKONOS is on a similar level, whilst WorldView-1 and Quick-Bird have a slightly lower quality. For the col-our bands (Tab. 5) it is a little mixed – in gen-eral, the red band is not as good, while the oth-er bands for all three colour images are not too diverse. But the noise in the colour bands is
Fig. 9: Weighted average of SNR for 16 bit- and 8 bit-Pléiades images in test area Zonguldak, ps = pan-sharpened.
150 Photogrammetrie • Fernerkundung • Geoinformation 3/2016
son with a WorldView-1-image having 56 cm GSD and a QuickBird-image with 62 cm GSD does not indicate the zooming from 70 cm to 50 cm GSD. The used Pléiades scenes have better image quality as compared images from WorldView-1 and QuickBird with higher orig-
for the colour bands. Pléiades images are en-hanced by de-convolution and are de-noised. For the enlarged images with 0.5 m GSD, this enhancement leads to satisfying factors for ef-fective image resolution and also no-enlarge-ment of the SNR can be seen. Also, a compari-
Fig. 10: Sub-areas of pan-sharpened images from Pléiades, WorldView-1, QuickBird, and IKONOS.
Karsten Jacobsen et al., Image Quality Assessment 151
inal resolution, justifying the distribution of Pléiades images with 50 cm respectively 2.0 m GSD. This has been confirmed by other inter-nal investigations. Of course a comparison with IKONOS shows clearly the influence of the lower resolution of IKONOS images. The SNR of Pléiades images is satisfying and even better as for most other investigated space im-ages. The blur coefficient has not been shown as a reliable number for specifying the image quality.
Acknowledgements
The Pléiades-1A triplet bundle images was supported by the MyGIC program of Airbus Defence and Space, and this study was sup-ported by the Scientific Research Projects of
Bülent Ecevit University (Project ID: 2014-47912266-01) and TÜBİTAK (Project ID: 114Y380).
References
aLSadiK, b., gerKe, m. & VoSSeLman, g., 2015: Ef-ficient use of video for 3D modeling of culture heritage objects. – ISPRS Photogrammetric Image Analysis (PIA) 15 + High resolution earth imaging for geospatial information (HRIGI) 15 workshop Munich, International Annals of Pho-togrammetry, Remote Sensing and Spatial In-formation Science II-3/W4, 2015.
Crété-roFFet, F., doLmiere, T., Ladret, P. & niCo-LaS, m., 2007: The Blur Effect: Perception and Estimation with a New No-Reference Perceptual Blur Metric. – SPIE Electronic Imaging Sympo-sium, Human Vision and Electronic Imaging, San Jose, CA, USA.
Tab. 2: Compared satellite images in the test area Zonguldak.
Satellite Imaging Sun elevation Incidence angle GSD of delivered images
Geometric GSD
Pléiades 1A 2013-04-24 59.2° 12.3° / 7.2° / 5.8° 50 cm 70 cmWorldView-1 2008-09-16 49.7° 28.6° 56 cm 56 cmQuickBird 2004-05-23 64.7° 3.9° 62 cm 62 cmIKONOS 2002-07-02 67.2° 20.3° 100 cm 89 cm
Tab. 3: Factors for effective resolution of panchromatic channels in the test area Zonguldak.
Pléiades 1A (average) WorldView-1 QuickBird IKONOS0.91 1.02 1.01 1.02
Tab. 4: SNR of the panchromatic channels of the different satellite imagery in the test area Zon-guldak.
SNR Pléiades (average) WorldView-1 QuickBird IKONOS16 bit 91 24 48 988 bit 70 36 32 30
Tab. 5: SNR of the colour channels of Pléiades, IKONOS and QuickBird imagery in test area Zon-guldak.
SNR Pléiades colour channels (average of 3 images) QuickBird colour channels IKONOS colour channels
blue green red NIR blue green red NIR blue green red NIR
16 bit 62 52 31 105 72 98 50 50 109 70 43 111
8 bit 27 13 33 33 72 130 50 37 55 40 13 24

152 Photogrammetrie • Fernerkundung • Geoinformation 3/2016
JaCobSen, K., 2008: Sagt die Anzahl der Pixel im Bild alles? – DGPF annual meeting 2008, Olden-burg.
JaCobSen, K., 2011: Characteristics of very High Resolution Optical Satellites for Topographic Mapping. – ISPRS Hannover Workshop 2011, International Archives of Photogrammetry, Re-mote Sensing and Spatial Information Science XXXVIII-4/W19: 6 p.
JaVan, F., Samadzadegan, F. & reinartz, p., 2013: Spatial Quality Assessment of Pan-Sharpened High Resolution Satellite Imagery Based on an Automatically Estimated Edge Based Metric. – Remote Sensing 5: 6539–6559.
Kim, t. & Kim, J., 2011: Automated assessment of NIIRS and GRD of high resolution satellite ima-ges through edge profile analysis of natural ta-gets. – JACIE 2011 Commercial Imagery Work-shop.
KoeLbL, o. & HaWaWini, J., 1986: Determination of the Modulation Transfer Function for Aerial Ca-meras under Flight Conditions. – International Symposium of ISPRS Commission I “Progress in Imaging Sensors”, 565–572, Stuttgart.
KoeLbL, o., 2005: Transfer Functions in Image Data Collection. – Photogrammetric Week 2005.
LeaCHtenauer, J.C., 1996: National Imagery Inter-pretability Rating Scales Overview and Product Description ASPRS/ACSM Annual Convention, 262–272.
paSSini, r. & JaCobSen, K., 2008: Geometric and radiometric property of large size digital aerial frame cameras. – Civil Commercial Imagery Evaluation Workshop JACIE 2008, Fairfax, VA, USA.
pLéiadeS imagerY uSer guide, 2012: V 2.0 ed., http://www.geo-airbusds.com/en/4572-Pléiades-technical-documents (18.3.2016).
SCHoWengerdt, r.a., 1997. Remote Sensing, Mo-dels and Methods for Image Processing. – Se-cond edition, Academic Press, PA, USA.
topan, H., maKtaV, d., JaCobSen, K. & buYuKSaLiH, g., 2009: Information content of optical satellite images for topographic mapping. – International Journal of Remote Sensing 30: 1819–1827.
Addresses of the Authors:
Dr.-Ing. KarSten JaCobSen, Leibniz Universität Han-nover, Institut für Photogrammetrie und Geoinfor-mation, D-30167 Hannover, Nienburger Str. 1, Tel.: +49-511-762-2485, Fax: +49-511-62-2483, e-mail: [email protected]
Prof. Dr. HüSeYin topan, aLi Cam, muStaFa Özendi & murat oruC, Department of Geomatics Engineering, Engineering Faculty, Bülent Ecevit University, 67100 Zonguldak, Turkey, email: [email protected], [email protected], [email protected], [email protected]
Manuskript eingereicht: Juli 2015Angenommen: Februar 2016