image enhancement for multilayer information retrieval by using full-field optical coherence...
TRANSCRIPT

Image enhancement for multilayer information retrievalby using full-field optical coherence tomography
Shoude Chang, Xianyang Cai, and Costel Flueraru
When a full-field optical coherence tomography (OCT) system is used to extract tomographic images froma multilayer information carrier, the resulting images may suffer from interlayer modulations andparasitic patterns derived from interference fringes. We describe and analyze these negative influencesthat degrade the quality of extracted tomographic images and propose practical algorithms and methodsto minimize them. The emphasis of the discussion will be the removal of the parasitic fringes producedby the imperfection of a CCD camera. The simulative and experimental results of image enhancement formultilayer tomography extraction using full-field OCT are provided. © 2006 Optical Society of America
OCIS codes: 110.4500, 100.2000, 100.2980, 100.6950.
1. Introduction
Optical coherence tomography (OCT) is an imag-ing technique that permits high-resolution cross-sectional imaging of an object.1 During the pastdecade, OCT technology has been attracting atten-tion from researchers around the world. New OCTimaging theories and applications have been contin-uously developed and reported.2–4
Most existing OCT systems use fiber-optic-basedinterferometers. Scanning along three axes makesthe system slow and cumbersome. In working di-rectly with imaging 2D tomography in parallel, i.e.,working with a full-field OCT, a major problem isthe poor signal-to-noise ratio due to the weak en-ergy density of the probing beam and the lateralinterference fringes appearing on the X–Y plane. Toovercome these problems, Bourquin et al.5,6 pro-posed methods for a full-field OCT using a 2D smartpixel detector array. To detect the weak signal, re-searchers have used lock-in technologies. Beaure-paire et al.7 and Dubois et al.8 presented opticalcoherence microscopes (OCMs), which comprisephotoelastic modulators for phase modulation, and2D CCD cameras. Schmitt et al.9 proposed another
OCM that employs multiple sources and detectorsas well as high-numerical-aperture optics to sup-press speckle fluctuations and enhance resolution.Vabre et al.10 use phase modulation and a synchro-nization apparatus for their thermal-light full-fieldOCT.
In the past decade, OCT systems have been devel-oped mainly for medical and biomedical applications,especially for the diagnostics of ophthalmology, derma-tology, dentistry, and cardiology.11,12 A few works havebeen reported for industrial applications; a method formultilayer optical storage by low-coherence reflectom-etry is described in Ref. 13. To explore the OCT’s ca-pability in probing the internal features of an object,we began research into applying full-field OCT tech-nology to 2D information encoding and retrieval with amultilayer information chip.14 Because OCT has mi-crometer resolution and the ability to peel cross-sectional images from inside an object, this technologyhas potential applications in document security andobject identification. For 2D data such as texts, imagescan be stored in a multilayer information carrier. Be-cause this information carrier can be produced by alow-scattering transparent material, the signal-to-noise ratio will be improved dramatically. Conse-quently, the specific hardware, such as a smart pixeldevice, a lock-in detection apparatus, and complicatedsoftware designed to deal with the scattering effects,can also be greatly simplified. Because it does not scanalong the X–Y axis, the full-field OCT could be thesimplest and most economic imaging system for ex-tracting information from such a multilayer informa-tion carrier.
The authors are with the Optics Group, Institute for NationalMicrostructural Sciences, National Research Council Canada,Building M-36, Montreal Road Campus, Ottawa, Ontario K1A0R6, Canada. S. Chang’s e-mail address is [email protected].
Received 1 December 2005; revised 31 January 2006; accepted24 February 2006; posted 6 March 2006 (Doc. ID 66279).
0003-6935/06/235967-09$15.00/0© 2006 Optical Society of America
10 August 2006 � Vol. 45, No. 23 � APPLIED OPTICS 5967

2. Theoretical Aspects of Multilayer InformationRetrieval
A. Interlayer Modulations
The multilayer information carrier can be con-structed with a top layer, several information layers,and a base, as shown in Fig. 1. The top layer has beencovered with a bandpass coating, which allows onlythe probing beam to pass through. All the informa-tion layers are of planar and transparent surfaces, onwhich the information, e.g., text, image, or other 2Ddata, are encoded by applying a thin transparentcoating whose index of refraction is different fromthat of the substrate. This difference makes the in-formation observable. The base could be made of asolid blackened material to absorb all the incidentlight and prevent reflection.
Figure 1 also schematically illustrates the imagingof a multilayer information carrier by a camera, inwhich Ri is the reflectance function and Ti is thetransmittance function of the ith layer. Assumingthere is no absorption in each layer, i.e., Ri
2 � Ti2
� 1, the complex amplitude R received by the camerawould be given by
R � R1 � T1R2T1 � T1T2R3T2T1
� T1T2T3R4T3T2T1 � · · · � M
� � Ri �j�1
i�1
Tj2 � M, (1)
where M represents the stray lights resulting fromthe multireflection among the layers. Consideringthat Ri is the cross-sectional image of the ith layer, aweighting factor of its intensity �j�1
i�1 Tj2 represents
the intensity modulations of the previous layers.Besides the intensity modulation among layers, the
phase modulation may also happen when the sub-strate and information pattern of the layer have dif-ferent optical paths. Figure 2 shows this phenomenon.Figure 2(a) illustrates the structure of a sample con-sisting of five layers, T1–T5, each having a specificthickness. The patterns of layers T2 and T4 containsome empty areas, meaning air gaps between layersT1 and T3 and between T3 and T4. Figure 2(b) shows
the images grabbed by a full-field OCT system atdifferent depths, where S0 is the noninterfering back-ground image, and S1–S7 are interference images forsome selected surfaces of the layers, as shown in Fig.3(a). Figure 2(c) provides seven cross-sectional im-ages C1–C7, in which the background is subtractedfrom S1 to S7. The shape of layer T4 cannot be com-pletely retrieved by any of the individual imagesC5, C6, or C7. This is due to the existence of the emptyareas in layers T2 and T4. The different refractiveindex in the air and glass produces different opticalpath lengths and produces the phase variation acrossthe surfaces of the sample. Because the optical pathsfor the information pattern and substrate are differ-ent, the cross-phase variation caused by these layers,
Fig. 1. Imaging of a multilayer information carrier by a cam-era.
Fig. 2. Phase modulation phenomenon. (a) Structure of a sampleconsisting of five layers, T1–T5. (b) Images grabbed by a full-fieldOCT system at different depths. (c) Cross-sectional images withthe background subtracted.
5968 APPLIED OPTICS � Vol. 45, No. 23 � 10 August 2006
referred to as the phase modulation, may eventuallycause a segmented tomographic image. To reduce theeffect of the phase modulation, the information carriermust be properly designed and fabricated, for example,by encoding the information as negative or positiveimages alternatively. The basic requirement for thedesign is that the overall optical path difference acrossthe surfaces of all the layers should be less than thedepth resolution of the OCT system. Meanwhile, thephase modulation effect might be compensated by soft-ware, if prior knowledge of the materials used in theinformation patterns and substrates is known.
B. Interference Fringes and Parasitic Fringes
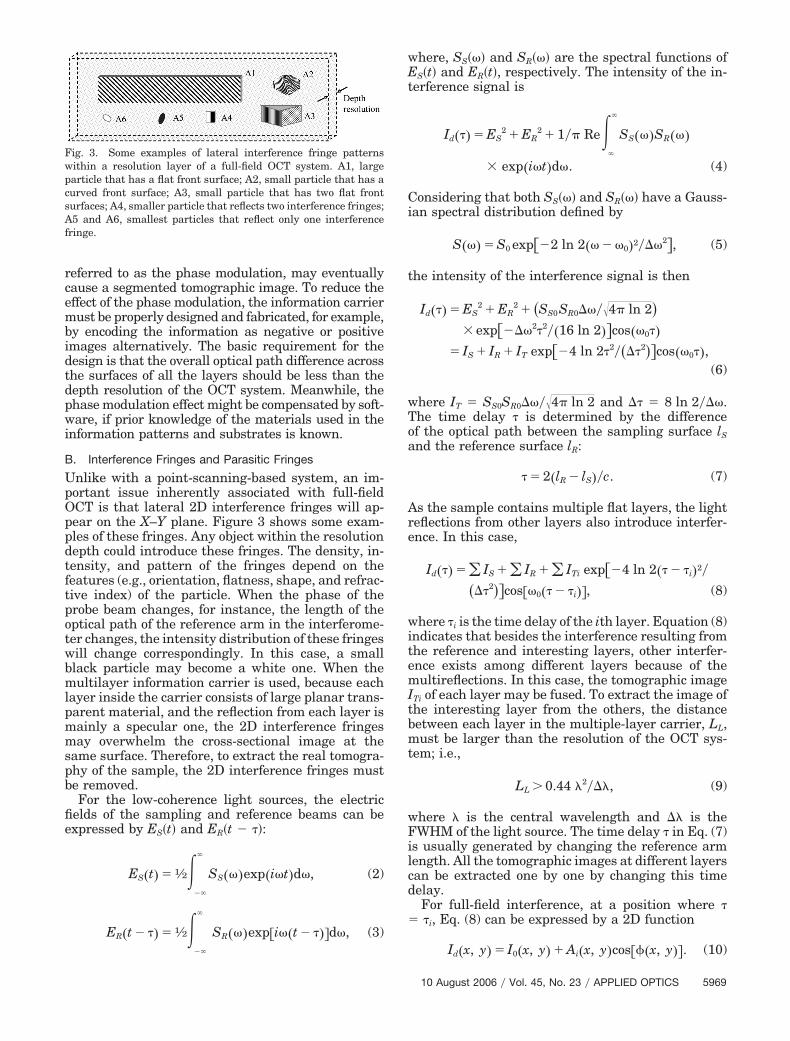
Unlike with a point-scanning-based system, an im-portant issue inherently associated with full-fieldOCT is that lateral 2D interference fringes will ap-pear on the X–Y plane. Figure 3 shows some exam-ples of these fringes. Any object within the resolutiondepth could introduce these fringes. The density, in-tensity, and pattern of the fringes depend on thefeatures (e.g., orientation, flatness, shape, and refrac-tive index) of the particle. When the phase of theprobe beam changes, for instance, the length of theoptical path of the reference arm in the interferome-ter changes, the intensity distribution of these fringeswill change correspondingly. In this case, a smallblack particle may become a white one. When themultilayer information carrier is used, because eachlayer inside the carrier consists of large planar trans-parent material, and the reflection from each layer ismainly a specular one, the 2D interference fringesmay overwhelm the cross-sectional image at thesame surface. Therefore, to extract the real tomogra-phy of the sample, the 2D interference fringes mustbe removed.
For the low-coherence light sources, the electricfields of the sampling and reference beams can beexpressed by ES�t� and ER�t � ��:
ES�t� � 1⁄2���
�
SS���exp�i�t�d�, (2)
ER�t � �� � 1⁄2���
�
SR���exp�i��t � ���d�, (3)
where, SS��� and SR��� are the spectral functions ofES�t� and ER�t�, respectively. The intensity of the in-terference signal is
Id��� � ES2 � ER
2 � 1�� Re��
�
SS���SR���
� exp�i�t�d�. (4)
Considering that both SS��� and SR��� have a Gauss-ian spectral distribution defined by
S��� � S0 exp��2 ln 2�� � �0�2��2�, (5)
the intensity of the interference signal is then
Id��� � ES2 � ER
2 � �SS0SR0��4� ln 2�� exp���2�2��16 ln 2��cos��0��
� IS � IR � IT exp��4 ln 2�2���2��cos��0��,(6)
where IT � SS0SR0��4� ln 2 and � � 8 ln 2��.The time delay � is determined by the differenceof the optical path between the sampling surface lS
and the reference surface lR:
� � 2�lR � lS��c. (7)
As the sample contains multiple flat layers, the lightreflections from other layers also introduce interfer-ence. In this case,
Id��� � � IS � � IR � � ITi exp��4 ln 2�� � �i�2�
��2��cos��0�� � �i��, (8)
where �i is the time delay of the ith layer. Equation (8)indicates that besides the interference resulting fromthe reference and interesting layers, other interfer-ence exists among different layers because of themultireflections. In this case, the tomographic imageITi of each layer may be fused. To extract the image ofthe interesting layer from the others, the distancebetween each layer in the multiple-layer carrier, LL,must be larger than the resolution of the OCT sys-tem; i.e.,
LL 0.44 �2��, (9)
where � is the central wavelength and � is theFWHM of the light source. The time delay � in Eq. (7)is usually generated by changing the reference armlength. All the tomographic images at different layerscan be extracted one by one by changing this timedelay.
For full-field interference, at a position where �� �i, Eq. (8) can be expressed by a 2D function
Id�x, y� � I0�x, y� � Ai�x, y�cos���x, y��. (10)
Fig. 3. Some examples of lateral interference fringe patternswithin a resolution layer of a full-field OCT system. A1, largeparticle that has a flat front surface; A2, small particle that has acurved front surface; A3, small particle that has two flat frontsurfaces; A4, smaller particle that reflects two interference fringes;A5 and A6, smallest particles that reflect only one interferencefringe.
10 August 2006 � Vol. 45, No. 23 � APPLIED OPTICS 5969

Combining this with Eq. (1),
I0�x, y� � IS�x, y� � IR�x, y�, (11)
Ai�x, y� � 2Ri�x, y� �j�1
i�1
Tj�x, y�2Re�x, y�. (12)
I0�x, y� is the background image, which is the inten-sity summation of all layer images; Ri�x, y� is thereflectance function of the ith layer; Ai�x, y� is themodulated-reflectance function of the ith layer inwhich Ri�x, y� is modulated by Ti�x, y� of the previouslayers; and cos(·) represents the interference, a func-tion of variables x and y. The reflectance functionRi�x, y� represents the tomographic image of the ithlayer.
To retrieve the information hidden in the interfer-ence images, the interference fringes, represented bycos���x, y��, have to be removed through some pro-cessing. In Ref. 14, a method of removing fringes byusing two ��2 phase-shifted images I1�x, y� andI2�x, y�, and a background image I0�x, y� is described.The tomography can be resolved by
Ai�x, y� � �S1�x, y�2�x, y� � S2�x, y�2�1�2, (13)
where S1�x, y� � I1�x, y� � I0�x, y� and S2�x, y�� I2�x, y� � I0�x, y�.
By grabbing three or more phase-shifted interfer-ence images, one can solve Ai�x, y� without the back-ground image I0�x, y�. For three sequentially grabbedimages, the value of the phase shift must be knownbeforehand, whereas, for four or more images, thevalue can be solved from the series-shifted images.For example, the equations for five phase-shift im-ages are expressed by
Id1�x, y� � I0�x, y� � Ai�x, y�cos���x, y� � 2 �,
Id2�x, y� � I0�x, y� � Ai�x, y�cos���x, y� � �,
Id3�x, y� � I0�x, y� � Ai�x, y�cos���x, y��,
Id4�x, y� � I0�x, y� � Ai�x, y�cos���x, y� � �,
Id5�x, y� � I0�x, y� � Ai�x, y�cos���x, y� � 2 �.
The tomography image can be solved by
Ai�x, y� ��Id2�x, y� � Id4�x, y�2 sin �2
� �2Id3�x, y� � Id5�x, y� � Id1�x, y�4 sin2 �2 1�2
,
(14)
where
cos � Id5�x, y� � Id1�x, y�2Id4�x, y� � Id2�x, y�
1�2
. (15)
Angle � is produced by shifting by a length zin depth. The five images are grabbed at z1 � z,z2 � 2z, z3 � 3z, z4 � 4z, and z5 � 5z; therelative angle shifts can be expressed as �2 ,� , 0, , and 2�, respectively.
It is found that the interference fringes may not beremoved totally through the processing since somesort of parasitic patterns or ghost fringes appear withthe full-field OCT system. For point-scanning-basedOCT systems, such a phenomenon is barely observ-able. When the sample is a multilayer informationcarrier, the surface of each layer has a specular re-flection, which produces full-field interference fringeseven in the blank area. The algorithms describedabove are capable of removing the fringes with aperfect interference pattern. However, in practice,the fringe pattern recorded by a CCD camera may notbe described perfectly by Eq. (10), which leads to newparasitic fringes after using these algorithms. Figure4(a) shows the image with interference fringes, andFig. 4(b) shows the image after removing the inter-ference fringes by Eq. (13). Some new fringes show upafter the main interference fringe is removed. In our
Fig. 4. Images with (a) interference fringes and (b) parasitic fringes.
5970 APPLIED OPTICS � Vol. 45, No. 23 � 10 August 2006

judgment, the phenomenon is mainly due to the non-linear intensity response of the camera so that thegrabbed interference images do not have the exactcos�·� distribution described by Eqs. (6) and (10). TheCCD camera normally becomes saturated at thehighlight area and insensitive at the dark area. Fig-ure 5 illustrates this phenomenon. Two sinusoidcurves are provided in the figure. One is derived froma standard 2D interference pattern captured by acamera, and the other is a standard sin�·� curve cre-ated mathematically. The difference is observable;the camera introduces distortions both in amplitudeand in phase. Due to these distortions, the new par-asitic fringes will be introduced into the tomographicimages retrieved. In addition, the series of imageswith a different phase shift are grabbed at differenttimes and the working environment may vary foreach image, for example, vibration, temperature,camera noise, and focal depth of the imaging lens.The images I0�x, y� and Ai�x, y� may be slightly differ-ent for each frame grabbed. Among the factors affect-ing the images, the setting of the camera isimportant. The shutter time and particularly the au-togain control affect the response attribute of thecamera and cause the generation of the parasiticfringes. Mechanically, the phase shift between se-quential images may not be strictly equal, and asmall angle error may also be introduced.
Given the error sources mentioned above, the im-age grabbed by the CCD camera could be modeled by
fn � d � kF�f �, (16)
where d is the dc bias added, k is the amplitudescaling coefficient, and F�f � is a nonlinear transformfunction of the original input image f. Equation (16)models different factors that may give rise to theparasitic fringes. Figure 6 shows simulations of a setof parasitic patterns after the use of Eq. (13), whereAi�x, y� is a constant 1, and Eq. (16) is applied only forS2�x, y�. In these simulations, the nonlinear trans-form is defined by
F�f � � sgn�f ��f �cos�� � �, � ����, (17)
where sgn(·) is a sign function, � is the frequencyshift, is the phase error, and � represents theindex of nonlinear distortion. In these figures, thesolid thick curves represent the patterns of the par-asitic fringes. The solid and dashed thin curves aresin(·) and cos�·� functions, respectively. Figure 6(a)shows the parasitic fringe pattern generated by thecamera nonlinear response, which yields a spatialfrequency four times that of the intrinsic interferencefringes [sin(·) pattern in the figures]. Figure 6(b) isproduced by adding a dc bias, d � 5%. It has the samespatial frequency as that of the intrinsic interferencefringes. Figures 6(c) and 6(d) in the second row showthe parasitic fringes caused by the amplitude scalechange �k � 0.9� and the phase-shift error � �5°�. Both patterns have the same spatial frequency,which is twice that of the interference fringes. Dis-tortion of the camera lens could be another source oferror, which makes the spatial frequency at the cen-ter area of the camera different from those at thecircumference. This difference is represented by �in Eq. (17). Figure 6(e) shows the parasitic patternintroduced by this effect where � � 0.02. Actually,the parameters in Eqs. (16) and (17) may affect out-put images simultaneously, and the overall effect ofthe parasitic pattern becomes more complicated. Fig-ure 6(f) shows a pattern where two parameters, d and� are invoked. Figure 7 demonstrates two computer-simulated pictures, showing the effect of the parasiticfringes. The left one is the original image, and theright one has parasitic fringes that are introduced bysetting the camera nonlinear intensity response with� � 1.4 and d � 0.1. The degradation of the imagequality by these parasitic fringes is obvious from theimages.
3. Methods Proposed for Image Enhancement
The goal of image enhancement for full-field OCTapplied to multilayer information retrieval is to re-duce the interlayer modulations and mitigate theparasitic fringes described above. Because the mate-rials for layer substrate and information coating canbe carefully selected so that the optical path differ-ence across the sample is less than the depth resolu-tion of the OCT system, the effect of the phasemodulation is very small and will not be considered inour discussion.
A. Intensity Demodulation of the Interlayer
If the information patterns and substrates of all thelayers are made of clear and flat materials, the illu-mination on an interesting layer has been modulatedfrom previous layers, which is expressed by Eq. (1).When the information carrier is illuminated by a uni-form partial coherent light, and a reference Re is in-troduced, the intensity image captured by the camerais given by
Id � �R � Re�2 � R2 � Re2 � ReR* � RRe*. (18)
Fig. 5. Sinusoid curves captured by a camera (solid curve) andcreated by mathematics (dashed curve).
10 August 2006 � Vol. 45, No. 23 � APPLIED OPTICS 5971

Then the interference part in Eq. (18) becomes
ReR* � RRe* � Re�Ri �j�1
i�1
Tj2�*
� Ri �j�1
i�1
Tj2Re*. (19)
Provided that the coherent length of the illuminationis shorter than the spacing between two layers, theinterference images resulting from the multireflec-tion effect are negligible. Hence Eq. (19) can be writ-ten as
Id�x, y� � I0�x, y� � Ai�x, y�cos ��x, y�, (20)
where
I0�x, y� � R2�x, y� � Re2�x, y�, (21)
Ai�x, y� � 2Ri�x, y� �j�1
i�1
Tj�x, y�2Re�x, y�. (22)
A peeling algorithm can be obtained by using a re-
Fig. 6. Parasitic patterns.
5972 APPLIED OPTICS � Vol. 45, No. 23 � 10 August 2006

cursive method to reduce the previous modulationlayer by layer.14 Hence the demodulation algorithmfor intensity is derived as
Ri�x, y� � Ai�x, y��Kr �j�1
i�1
�1 � Rj�x, y��2 , (23)
where Kr � 2Re�x, y� is a constant. However, thispeeling algorithm defined by Eq. (23) may not beeffective if the information pattern on a layer is notperfectly planar and has some scattering effect on theprobe beam. In this case, a practical algorithm isproposed to replace Eq. (27):
Ri�x, y� � Ai�x, y� � wRi�1�x, y�, (24)
where w is a weighting factor. Equation (24) consid-ers only the intensity modulation of the previouslayer because the farther layers have little modula-tion effect due to the scattering. The weighting factorw is determined by experiment.
B. Compensation of Phase-Shifting Error
During the scanning, because the phase shifts be-tween sequential images are not strictly equal, theangle error will be introduced. Computer simula-tions show that when � 1°, the parasitic fringescan be ignored. For a light source whose wavelengthis 830 nm, the movement of the reference mirror cor-responding to 1° is approximately z � 1 nm. Thismeans that the scanning accuracy must be controlledwithin 1 nm to make the parasitic fringe ignorable.Such a high accuracy linear translation stage would
be very expensive and impractical to include in theOCT system. To reduce the parasitic fringes to a rel-atively low level, the multi-image averaging ap-proach was used. In our OCT system, the minimumstep of our linear translation stage (LTS) is about40 nm. At each layer position, 15 images are grabbedwith an even step, and the final tomography is ob-tained by averaging these images.
C. Camera Calibration
As described in Subsection 2.B, the major image deg-radation introduced by the camera is its nonlinearintensity response. To compensate for the distortion,the image grabbed by the camera must be calibrated.The calibration has to be finished before tomographyextraction can be done. The calibration procedure isdescribed in Appendix A. Figure 8 shows a pair ofimages with and without the camera calibration.After the calibration, the parasitic fringes are re-duced, and the image quality is enhanced.
4. Experiments and Results
The full-field OCT system used in the experiments isshown in Fig. 9, which is a Michelson interferometerwith a vision and motion controller. The superlumi-nescent diode is a low-coherence light source whosecentral wavelength is 830 nm and whose coherencelength is 20 �m. A neutral filter is used to adjust thelight intensity. The beam splitter divides the inputbeam into a reference mirror and a multilayer sam-
Fig. 8. Tomographic images (a) with and (b) without cameracalibration.
Fig. 9. Full-field OCT system. SLD, superluminescent diode; NF,neutral filter.
Fig. 10. (a) Four-layer sample and (b) its directly reflected image.
Fig. 7. Image and its degraded version (d � 0.1, � � 1.4).
10 August 2006 � Vol. 45, No. 23 � APPLIED OPTICS 5973

ple. The area camera used in the experiment is aPULNiX model TM-7CN. It has 768 � 494 pixels witha sensing area of 6.41 mm � 4.89 mm. Each pixel has256 (8 bit) gray levels. The lateral resolution of theOCT system is basically determined by the magnifi-cation of the image lens and the resolution of thecamera. Because the pixel width of the CCD sensor is8.3 �m and the magnification of the imaging lens is2�, the system lateral resolution is 4.15 �m. Thenumerical aperture of the imaging system is approx-imately 0.1. A computer is used to control the grab-bing time of the camera and the scanning step of theLTS, which has a minimum moving step of 38 nm. Afour-layer information carrier is used as the samplethat contains two layers of text patterns and two
layers of fingerprints, as shown in Fig. 10(a). Fourslide glasses are used as the substrates, whose re-fractive index is n � 1.58. Letters are coated on theglass with HFO2 �n � 1.85�. The thickness of thecoating is about one-quarter of a wavelength, approx-imately 200 nm. The view area of the sample is ap-proximately 10 mm � 10 mm. The information of thepatterns is retrieved according to the following pro-cedure:
1. Adjust the system so that a noninterference imageof the sample can be properly viewed by the camera.
2. Start searching for the position of an interest-ing layer until the strongest interference fringes ofthis layer are found.
3. Grab 15 interference images. Between each im-age, the translation stage moves a minimal distance.
4. Extract the tomographic images by using Eq.(18), where the 15 images are grouped into 11 batchesin this way: 1–5, 2–6, 3–7, . . . , 11–15. The final to-mographic image of the layer is obtained by averag-ing these 11 images.
5. Repeat steps 2–4 until all the tomographic im-ages of each layer are processed.
6. Start removing the interlayer modulations andparasitic fringes. Because the stamps of the fingerprintshave some scattering of the probe beam, the practicalalgorithm of Eq. (24) was applied to reduce the intensitymodulation of the previous layer, where w is set to 0.3.
Figures 10–12 show some intermediate and finalresults of the full-field OCT system. Figure 10(b)shows the image of the sample directly viewed by thecamera. All four images are fused together and thefingerprint patterns are hard to recognize. Figure 11provides four sets of images derived from layers 1–4,respectively. The left-hand parts of these images arethe extracted interference images and the right-handparts are the tomographic images after removing theinterference fringes. Figure 12 shows the tomo-graphic image of the last layer, which has been pro-cessed with the interlayer demodulation procedure.
5. Conclusion and Discussion
Full-field OCT can be used for information extractionin an artificial multilayer information carrier. Unlike
Fig. 11. (a) Tomographic images of the first layer before and afterremoving the fringes. (b) Tomographic images of the second layerbefore and after removing the fringes. (c) Tomographic images of thethird layer before and after removing the fringes. (d) Tomographicimages of the fourth layer before and after removing the fringes.
Fig. 12. Tomographic image of the fourth layer processed withthe interlayer demodulation procedure.
5974 APPLIED OPTICS � Vol. 45, No. 23 � 10 August 2006

OCT working with point-scanning devices, the full-field OCT system for multilayer information retrievalsuffers from interlayer phase and�or intensity mod-ulation effects and parasitic fringe patterns. Theseissues are more important than the signal-to-noiseratio for biology-related applications. We have ana-lyzed the main causes and effects of these interlayermodulations and some of the parasitic patterns.Methods to reduce these effects have been proposedand demonstrated in the experiments. However,there are still some other noise sources that have notbeen identified clearly yet. For example, in Figs. 4and 11(c), some fringe patterns of low spatial fre-quency show up in the extracted tomography image.Those noisy fringes are the result of interference, butthe sources they come from are not clear and furtherwork is needed to identify them. The informationcarriers used in our experiment contain four layers ofimage patterns, but this is not a limitation of thesystem. For applications to more layers, particularlymore scattering layers, the actual interference pat-tern will become more complex and the signal-to-noise ratio will be an important issue for retrievingthe information patterns in depth.
Appendix A: Camera Calibration
The calibration is performed by the following steps:
1. Produce a standard 2D sinusoid pattern by us-ing two planar mirrors in both interference and sam-ple arms. Adjust the mirror to make the interferencefringes vertically (horizontally) distributed as a gray-level grid.
2. Grab several sinusoid patterns by the camerato be calibrated, and transfer the data to a computer.
3. Average these images into one image. Then av-erage a given (for example, center) area to become one1D sinusoid curve.
4. Fit this curve by a standard sin(·) functionmathematically.
5. Create a calibrating table, Tcall a gray-levellookup table, by comparing the difference betweenthe averaged input sinusoid curve, sinin and the fittedsin function, sinfit: Tcal � sinfit�sinin.
The camera calibration can be performed by mul-tiplying the gray level of all the pixels of the inputimage by the corresponding value in the calibratingtable.
References1. D. Huang, E. A. Swanson, C. P. Lin, J. S. Schman, W. G.
Stinson, W. Chang, M. R. Hee, T. Flotte, K. Gregory, C. A.Pullafito, and J. G. Fujimoto, “Optical coherence tomography,”Science 254, 1178–1181 (1991).
2. A. F. Fercherl, W. Drexler, C. K. Hitzenberger, and T. Lasser,“Optical coherence tomography—principles and applications,”Rep. Prog. Phys. 66, 239–303 (2003).
3. A. F. Fercher and C. K. Hitzenberger, “Optical coherence to-mography,” E. Wolf, ed., Progress in Optics (Elsevier ScienceB. V., 2002), Chap. 4.
4. B. E. Bouma and G. J. Tearney, Handbook of Optical Coher-ence Tomography (Dekker, 2002).
5. S. Bourquin, V. Monterosso, P. Seitz, and R. P. Salathe, “Video-rate optical low-coherence reflectometry based on a linearsmart detector array,” Opt. Lett. 25, 102–104 (2000).
6. S. Bourquin, P. Seitz, and R. P. Salathe, “Optical coherencetopography based on a two-dimensional smart detector array,”Opt. Lett. 26, 512–514 (2001).
7. E. Beaurepaire, A. C. Boccara, M. Lebec, L. Blanchot, and H.Saint-Jalmes, “Full-field optical coherence microscopy,” Opt.Lett. 23, 244–246 (1998).
8. A. Dubois, L. Vabre, A. C. Boccara, and E. Beaurepaire, “High-resolution full-field optical coherence tomography with aLinnik microscope,” Appl. Opt. 41, 805–812 (2002).
9. J. M. Schmitt, S. L. Lee, and K. M. Yung, “An optical coherencemicroscope with enhanced resolving power in thick tissue,”Opt. Commun. 142, 203–207 (1997).
10. L. Vabre, A. Dubois, and A. C. Boccara, “Thermal-light full-field optical coherence tomography,” Opt. Lett. 27, 530–532(2002).
11. B. E. Bouma and G. J. Tearney, “Applications,” in Handbook ofOptical Coherence Tomography (Dekker, 2002), Chap. 4.
12. G. M. Dobre and A. Gh. Podoleanu, “Simultaneous opticalcoherence tomography-indocyyanine green dye fluorescenceimaging system for investigation of the eye’s fundus,” Opt.Lett. 30, 58–60 (2005).
13. S. R. Chinn and E. A. Swanson, “Multilayer optical storage bylow-coherence reflectometry,” Opt. Lett. 21, 899–901 (1996).
14. S. Chang, X. Liu, X. Cai, and C. P. Grover, “Full-field opticalcoherence tomography and its application to multiple-layer 2Dinformation retrieving,” Opt. Commun. 246, 579–585 (2005).
10 August 2006 � Vol. 45, No. 23 � APPLIED OPTICS 5975