image detection techniques on daimler pedestrian monocular...
TRANSCRIPT

Image Detection Techniques on Daimler Pedestrian Monocular Data
Christopher [email protected]
Abstract
The project aims to look at images from a camera at-tached to a car that drives around for a while and developsa model that finds pedestrians on the image by drawing abounding box around the pedestrian. The paper employsa R-CNN to detect the pedestrians and the process can bebroken down into two sections. First, critical regions areproposed on the image itself. Secondly, these critical regionproposals are run through a CNN that classifies whetherthose regions are pedestrians or not.
1. IntroductionWith the increased development of self-driving vehicles
and other similar technologies, it needs to be able to sensewhere the obstacles are so that the vehicle will be able tosafely navigate. This is incredibly critical when the obsta-cles are human lives, so the image detection model needs tobe able to provide the vehicle information where the pedes-trian is, and the first step is to detect the location of thepedestrian on the 2d image. Given the importance of safety,the pedestrian detection model must be very accurate.
The project uses the Daimler Monocular Pedestrian De-tection Benchmark data, which is comprised of a several-minute car camera recording of the street as the vehicledrives. The frames have instances where pedestrians existor not. The benchmark data also notes whether a pedestrian,vehicle, bicyclist, and motorcyclist exists in the image andwhere in the image the target is, defined by a bounding box.For simplicity, we will only look at pedestrians.
To classify the existence of a pedestrian will requires theuse a simple CNN network with only two classes, containspedestrians and no pedestrians. It network will only take asmall region of the image as input. Since the input spacedoesn’t need to be that large, the CNN itself doesn’t need tobe very complicated.
However, to determine where the pedestrian exists willbe slightly trickier. The idea is that we need to test the clas-sifier on several bounding boxes various sizes and locations.However, there is the challenge of how to determine theproperties of that bounding box. The project experiments
Figure 1. Example of a full 640x480 image from the Daimlerdataset
with different kinds of region extraction methods, primarilyexhaustive (try out all of the regions), selective search, andedge boxes.
2. Theory
A discussion on how to go about solving this problemneeds to include the theoretical approach towards imageclassification and detection as well as a quick understand-ing of literature on what has been attempted and done.
The overall architecture that I will use it to first selectregions in the image that will most likely have crucial sec-tions that should be detected, then for each region performa classification if a pedestrian truly exists in that region. Inthe end, we have the coordinates for the pedestrian locationso the final loss function will account for the euclidean dis-tances between the coordinates. Figure 2 shows the overalldesign of the detector.
2.1. Pedestrian Classification
The first problem is to create a classification of what apedestrian is. The first thing is that we need to acquire im-ages of pedestrians and non-pedestrians, which we use fromour data from Daimler. Because this classifier should ratherquick and simple, many similar papers use a linear SVM ora CNN to classify images [5, 6].
1

Figure 2. Overall architecture of the pedestrian detection model
There are also several methods of feature extraction thatother papers have found useful, which include HOG, 1Dand 2D Haar Transforms [2, 4]. These feature extractionsmethods have been useful for image detection, but I don’temploy these methods in this project.
Furthermore, Daimler also provides image segments allof the same pixel size of just pedestrians and frames thatdon’t contain any pedestrians. The model can use the modelto train on the pedestrians as well as random segments ofimages with no pedestrians. When given a segment, it willoutput a score for the segment being a pedestrians, and ascore that it is not.
Moreover, these segments need to be properly scaled sothat they can be properly compared to the segments that themodel was trained with. This will involve the dropping pix-els if the bounding box is too large or the duplication ofpixels if the bounding box is too small.
The layer architecture I use to classify the regions isa [Conv-Relu]x2 - [Conv-Relu-Pool] - [Affine]X2 - SVM.Convolution layers are used in the classifier layers. Therearen’t that many pooling layers because the input dimensionspace is small. The scoring used is SVM, which defined as
Li =∑
j 6=yimax(0, si − syi
+ ∆) (1)
where si refers to the final scoring of the ith index in theCNN before the SVM layer.
2.2. Region Proposal
The first thing we need to do is to determine on whichsection of the image do we perform the classification on.The easiest method would be to try out multiple detectionwindows of various sizes and locations at different set incre-ments [5]. Furthermore, the detection window that classifiesa pedestrian with a large enough will be the bounding box.If the pedestrian classifier is fast enough, this method mightbe sufficient, but classifying so many regions for simply oneimage can take a very long time.
If the classification ends up being very time-consuming,there must be a way to intelligently determine regions in the
Figure 3. How Selective Search assigns regions according to howthey’ve clustered together pixels
image that are most interesting to the model and then clas-sify on those regions. There are several methods researchedand outlined in literature [2].
The first attempt will do the brute force method to getmany detection windows exhaustively, but to improve theprediction time, other region selection methods such as Se-lectiveSearch [3] and EdgeBoxes [7] would be useful in cut-ting down classification time. This project attempts to pro-pose regions exhaustively and then experiments with twoother more intelligent regional proposal methods.
2.2.1 Selective Search
This region proposal method is outlined by Felzenszwalband Huttenlocher [1] and was implemented further by apython library that was developed by AlpacaDB.
The basic premise of the this proposal system is that itgroups together pixels of similar colors and draw boundingboxes around those regions. The similarity metric betweenpixels/regions of certain properties can be adjusted such thatthe regions can be grouped together or certain combina-tions. Even if regions have vastly different colors, they canstill be a part of the same object that we wish to detect.
Figure 3 shows an example of how the selective searchregion proposal divides the regions of similar pixels, butthe final resulting bounding boxes also take into groupingtogether the proposed regions. The one that is most inter-esting is the pedestrian that got captured by the proposalmethod.
2.2.2 Edgeboxes
This region proposal method is outlined by Zitnick and Dol-lar [7] and was implemented by them as well. They have aMatlab library that allowed them to output bounding boxesusing the EdgeBox method, but I had to rewrite the code sothat it was usable for python.
2
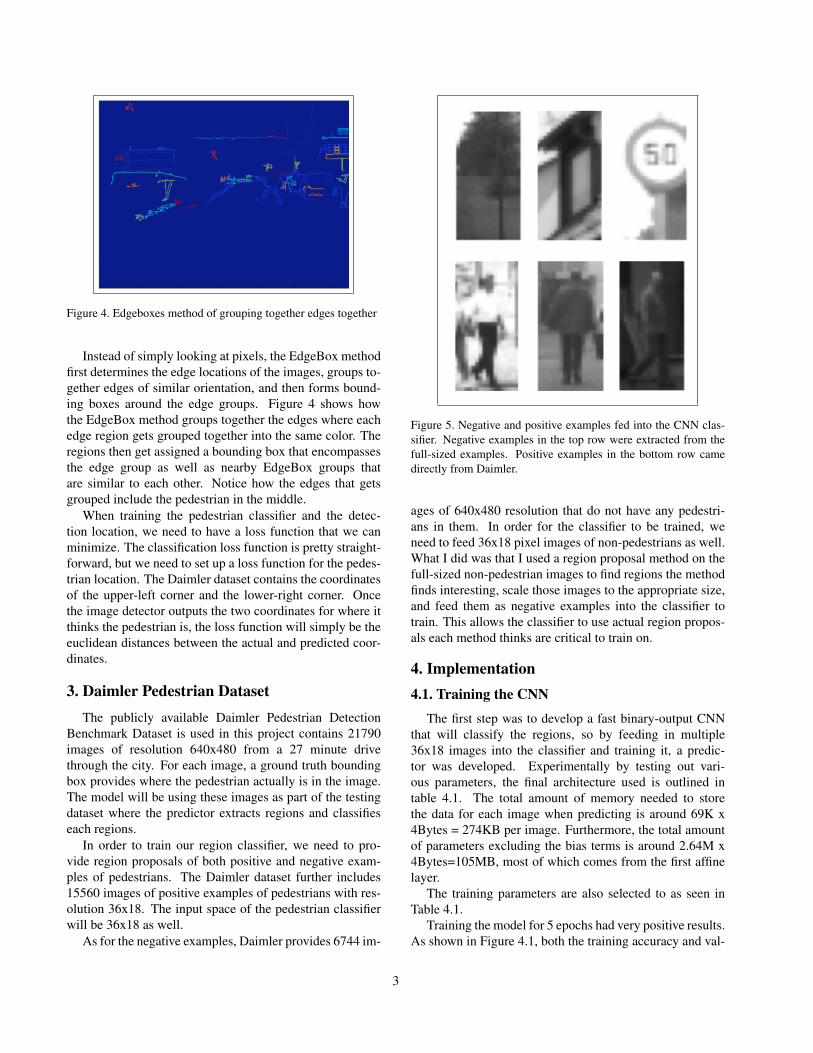
Figure 4. Edgeboxes method of grouping together edges together
Instead of simply looking at pixels, the EdgeBox methodfirst determines the edge locations of the images, groups to-gether edges of similar orientation, and then forms bound-ing boxes around the edge groups. Figure 4 shows howthe EdgeBox method groups together the edges where eachedge region gets grouped together into the same color. Theregions then get assigned a bounding box that encompassesthe edge group as well as nearby EdgeBox groups thatare similar to each other. Notice how the edges that getsgrouped include the pedestrian in the middle.
When training the pedestrian classifier and the detec-tion location, we need to have a loss function that we canminimize. The classification loss function is pretty straight-forward, but we need to set up a loss function for the pedes-trian location. The Daimler dataset contains the coordinatesof the upper-left corner and the lower-right corner. Oncethe image detector outputs the two coordinates for where itthinks the pedestrian is, the loss function will simply be theeuclidean distances between the actual and predicted coor-dinates.
3. Daimler Pedestrian DatasetThe publicly available Daimler Pedestrian Detection
Benchmark Dataset is used in this project contains 21790images of resolution 640x480 from a 27 minute drivethrough the city. For each image, a ground truth boundingbox provides where the pedestrian actually is in the image.The model will be using these images as part of the testingdataset where the predictor extracts regions and classifieseach regions.
In order to train our region classifier, we need to pro-vide region proposals of both positive and negative exam-ples of pedestrians. The Daimler dataset further includes15560 images of positive examples of pedestrians with res-olution 36x18. The input space of the pedestrian classifierwill be 36x18 as well.
As for the negative examples, Daimler provides 6744 im-
Figure 5. Negative and positive examples fed into the CNN clas-sifier. Negative examples in the top row were extracted from thefull-sized examples. Positive examples in the bottom row camedirectly from Daimler.
ages of 640x480 resolution that do not have any pedestri-ans in them. In order for the classifier to be trained, weneed to feed 36x18 pixel images of non-pedestrians as well.What I did was that I used a region proposal method on thefull-sized non-pedestrian images to find regions the methodfinds interesting, scale those images to the appropriate size,and feed them as negative examples into the classifier totrain. This allows the classifier to use actual region propos-als each method thinks are critical to train on.
4. Implementation4.1. Training the CNN
The first step was to develop a fast binary-output CNNthat will classify the regions, so by feeding in multiple36x18 images into the classifier and training it, a predic-tor was developed. Experimentally by testing out vari-ous parameters, the final architecture used is outlined intable 4.1. The total amount of memory needed to storethe data for each image when predicting is around 69K x4Bytes = 274KB per image. Furthermore, the total amountof parameters excluding the bias terms is around 2.64M x4Bytes=105MB, most of which comes from the first affinelayer.
The training parameters are also selected to as seen inTable 4.1.
Training the model for 5 epochs had very positive results.As shown in Figure 4.1, both the training accuracy and val-
3

Layer Number of Filters Size of Filters Memory Number of Parameters (excluding biases)INPUT - - [36x18]=648 -
CONV-RELU 32 [3x3] [36x18x32]=20,736 [32x3x3]=288CONV-RELU 32 [3x3] [36x18x32]=20,736 [32x3x3]=288CONV-RELU 32 [3x3] [36x18x32]=20,736 [32x3x3]=288
POOL 2 - - [18x9x32]=5,184 -AFFINE - - [500] [5184x500]=2,592,000AFFINE - - [2] [500x2]=1,000
SVM - - [2] -
Table 1. Layers of the Region Convolutional Neural Network Classifier
Figure 6. Training and Validation Accuracy of CNN on 36x18 images
Parameter ValueLearning Rate 8 x 10⁻⁴Weight Scale 1 x 10⁻³
Number of Batches 50Epochs Trained 10Training Time Approx 7 hours
Table 2. Training Parameters Convolutional Neural Network Clas-sifier
idation accuracy were very close to each other, showing nosigns of over-fitting on the training data. Furthermore, theaccuracies of both datasets are very high, both above 90 per-cent accurate. The runtime of the classifier itself is quite fastas well, which makes this model perfect for quickly classi-fying regions.
I further tested the three different region proposal meth-ods: Exhaustive, Selective Search, and EdgeBox. Thesemethods are open-loop, meaning they don’t really takeinto account the error of detection of the image. They dohave some parameters that can be adjusted, such as the
stride/sweep of the bounding box as well as the size ofthe bounding box. Not a lot of time was spent on settingthose parameters, mostly the default recommended valuesthat were given in the paper were used.
5. ResultsOverall, what was most interesting was that both Selec-
tive Search and EdgeBoxes were able to capture the pedes-trian on the image with some relatively success, but whatended up happening was that there were a lot of false posi-tives in the output of the model.
As a case study, let’s look at the same image that I’vebeen using as the example. Figure 7 depicts the actual loca-tion of the pedestrian, and as you can see, there is only onepedestrian.
Figure 8, 9, and 10 shows all the bounding boxes that themodel interprets as a pedestrian, and while all methods endup producing a box that does indeed surround a pedestrian,it doesn’t do a good job with rejecting the boxes that are notpedestrians.
When measuring the error of the bounding box, we take
4

Figure 7. Actual Bounding Box of Pedestrian given by Daimler.
Figure 8. Detected Pedestrians on Image using the Exhaustive Re-gion Proposal Method.
the euclidean distance between the the top-left corners andthe bottom-right corners of the actual bounding box shownin figure 7 and the output bounding box from the predictor.In the case of multiple bounding boxes returned by the pre-dictor, Table 5 depicts the smallest euclidean error, in orderwords the bounding box that’s closest to the actual bound-ing box.
In Figure 8, the bounding boxes seem to detect the re-gions with interesting features, most notably the buildings,cars, tree, and fence posts. This method seems really bulkybecause the predictor have to sort through so many regionswhich increased the runtime of the predictor and decreasedthe accuracy of the region classifier since there were somany regions to process through.
When using either Selective Search or EdgeBoxes, theruntime of predictor goes down dramatically as shown inTable 5 because the number of region proposals decreasesradically. It is possible to reduce the runtime of exhaustivelyproposing regions by reducing the step size, but this wouldsacrifice bounding box frequency, which in this instance,Exhaustive search has the best specification on.
In Figure 9, there are fewer false positives and the
Figure 9. Detected Pedestrians on Image using the SelectiveSearch Region Proposal Method
Figure 10. Detected Pedestrians on Image using the EdgeBox Re-gion Proposal Method
method was able to find the pedestrian. The bounding boxthat was proposed is slightly off because it does not includethe feet of the pedestrian. This was a common issue withthe Selective Search method: it oftens cuts off portions ofthe pedestrian whether it is the legs or the upper body. Thisis probably due to the colors of the upper and lower body ofpedestrians tend to be different and get separated into tworegions. This causes the resulting bounding boxes to onlycapture the halves of the pedestrian. There would need tobe some adjustment of the parameters to allow the combi-nation of nearby regions so that both halves of the persongets combined.
In Figure 10, the runtime is even faster, but the error ofthe bounding box is larger. This time, the bounding box isslightly larger than the pedestrian. What probably happenedwas that the region proposed saw the edge from the street asa critical edge group that should be combined with the edgefrom the pedestrian and the classifier ended up detectingthat region as the pedestrian.
What seems to be a common mistake between all meth-ods is that the classifier seemed to predict the trees and
5

Region Proposal Method Time Smallest Euclidean Error Proposed Regions False PositivesExhaustive 602.6s 20.85 96114 8134
Selective Search 29.46s 33.67 46 13EdgeBoxes 22.59s 99.5 100 20
Table 3. Results of R-CNN model on image set
buildings as pedestrians.
6. Conclusions and Future DevelopmentWe managed to improve the runtime and reduce the por-
tion of false positives in the image by using more intelligentregion proposal methods to detect pedestrians in the image;however, the accuracy of the bounding box falls slight. Inthe instance of selective search, the box encompasses toosmall of a region while EdgeBox encompasses too large ofa region.
Overall, the process detected pedestrians too easily. Thechallenge with the classifier is that more than half of thetraining example fed to the classifier are pedestrians but thenumber of times the classifier detects a pedestrian shouldideally be very very low. For example, for a given im-age, there should only really be a handful of pedestrians butthe number of region proposals is going to be significantlylarger than the number of actual pedestrians.
One thing that can be done is to only report boundingboxes that have a much larger score of being a pedestrianthan a score of not being a pedestrian. Furthermore, I wouldlike to try out using pedestrian images of a higher resolutionso that we have better images to train on.
References[1] P. F. Felzenszwalb and D. P. Huttenlocher. Efficient graph-
based image segmentation. International Journal of ComputerVision, 59(2), 167181, 200.
[2] P. D. B. S. J. Hosang, R. Benenson. What makes for effectivedetection proposals? PAMI, 2015.
[3] T. G. J. R. R. Uijlings, K. E. A. van de Sande and A. W. M.Smeulders. Selective search for object recognition. Interna-tional Journal of Computer Vision, 104(2):154171, 2013.
[4] A. D. K. Piniarski, P. Pawowski. Video processing algorithmsfor detection of pedestrians. CMST, 21(3):141–150, 2015.
[5] D. M. G. M. Enzweiler. Monocular pedestrian detec-tion:survey and experiments. IEEE TRANSACTIONS ONPATTERN ANALYSIS AND MACHINE INTELLIGENCE,31(12):2179–2195, 2009.
[6] M. N. V. E. Neagoe, C. T. Tudoran. A neural network ap-proach to pedestrian detection. Proc. of ICCOMP09, pages374–379, 2009.
[7] C. L. Zitnick and P. Dollar. Edge boxes: Locating object pro-posals from edges. ECCV, 2004.
CNN code was adopted from Python code developedfrom Stanford University’s CS231N modules. Python li-
braries selectivesearch and opencv2 were heavily used.edgebox libraries from Dollar [7] repurposed for use inPython.
Much acknowledgement to the entire CS231N teachingstaff for a phenomenal quarter.
6